Embed Size (px)
Citation preview

THE INFLUENCE OF STRATEGIC PLANNING ON
PERFORMANCE OF RUGBY CLUBS IN KENYA
BY
BRIAN OLIMBA
UNITED STATES INTERNATIONAL UNIVERSITY-AFRICA
SUMMER 2017

THE INFLUENCE OF STRATEGIC PLANNING ON
PERFORMANCE OF RUGBY CLUBS IN KENYA
BY
BRIAN OLIMBA
A Research Project Report Submitted to the Chandaria School
of Business in Partial Fulfilment of the Requirement for the
Degree of Masters in Business Administration (MBA)
UNITED STATES INTERNATIONAL UNIVERSITY-AFRICA
SUMMER 2017

ii
STUDENT’S DECLARATION
I, the undersigned, declare that this project report is my original work and has not been
submitted to any other college, institution or university other than the United States
International University-Africa for academic credit.
Signed:……………………………………………….Date:………………………………..
Brian Olimba (I.D No. 645461)
This project has been presented for examination with my approval as the appointed
supervisor.
Signed:……………………………………………….Date:………………………………..
Fred Newa
Signed:……………………………………………….Date:………………………………..
Dean, Chandaria School of Business

iii
COPYRIGHT
All rights reserved. No part of this report may be reproduced or copied in any form or by
any means electronic, printing or photocopying without the prior written consent of the
author and/or USIU.
Copyright © 2017 Brian Olimba
iv
ABSTRACT
The purpose of study was to establish the influence of strategic planning by rugby clubs
on their performance. The study was guided by the following questions: How does having
a create vision and goals influence performance of rugby clubs in Kenya? How does
strategic formulation influence the performance of rugby clubs in Kenya? How
implementation of strategic plan influence performance of rugby clubs in Kenya?
Descriptive research was used for this studyto investigate facts., the target population
were officials, technical team and players in the Rugby teams in the Kenyan league.
According to the Kenyan rugby union data there are currently 8 teams in the Kenya Cup
that are based in Nairobi as at June 2017. The respondents included the Chairman,
(Leaders) Head of the line, Head of pack, Flyhalf, Scramhalf, Hooker, Coach and
Assistant coach in each of the eight teams resulting into 64 respondents.The researcher
distributed 64 questionnaires and only 52 were filled and returned, this represented a
response rate of 81 %. The descriptive records which include mean and standard
deviation was measured. Both Pearson correlation and multiple Regression analysis was
used to test for the relationship among the independent and dependent variables.
The study established that 33% strongly agreed that their clubs have a well stated vision
(M=3.79) and 39% strongly agreed that they have clear goals before Kenya cup season
starts, 39% agreed (M=4.06). The results also show that 40% believed the goals are
realistic (M=3.92), while 48% agreed that goals are measurable (M=3.83). It was also
established that 35% agreed that performance of a sports team is quantified by the amount
of competitions it wins (M=3.78). The findings revealed that there was a positive
relationship between having a great vision and goals and performance of rugby clubs in
Kenya (R=.050, P=0.726).
The findings show that 54% noted that strategy formulation was done yearly, while 21%
noted it was done after 3-4 years. It was established that 46% disagreed that the
organization regularly undertake strategy formulation (3.46), it was also noted that 29%
strongly agreed that the clubs strategic plan clearly communicated to all (M=3.63). The
findings revealed that there was a positive relationship between strategic formulation and
performance of rugby clubs in Kenya (R=.093, P=0.513).

v
The findings show that 60% reviewed their strategic plan yearly during implementation
and 25% after 2-3 years. The analysis also show that 48% agreed that resource allocation
influence strategic planning (M=3.50). On the other hand, 46% agreed that resource
allocation influence strategic planning (M=3.87). The findings revealed that there was a
positive relationship between strategic plan and performance of rugby clubs in Kenya
(R=.046, P=0.743).
The study recommends that clubs should at all-time maintain a well stated vision and
have clear goals for the seasons. The plans need to be well outlined and proper
communication done by the technical team to all stake holders. Clubs should undertake
regulator strategy formulation and the plan clearly communicated to all, The clubs also
need to minimize internal politics as it has an effect on the attainment of higher levels of
organizational performance. The leadership need to show ample commitment towards the
attainment of this results.Strategic plans ought to be reviewed regularly, and enough
resource should be allocated for the process and monitored to ensure the attainment of
results. Although sponsorship is the main source of revenue for the clubs, they should
diversify and look into other sources of revenue.

vi
ACKNOWLEDGEMENT
I would like to express my sincere appreciation to the rugby team players for taking the
time to fill in my questionnaires, also special thanks to my supervisor Fred Newa for his
patience and support towards the writing of this report.

vii
DEDICATION
This report is dedicated to all my friends and family, thank you for the support.

viii
TABLE OF CONTENT
STUDENT’S DECLARATION ........................................................................................ ii
COPYRIGHT ................................................................................................................... iii
ABSTRACT ....................................................................................................................... iv
ACKNOWLEDGEMENT ................................................................................................ vi
DEDICATION.................................................................................................................. vii
LIST OF TABLES ............................................................................................................. x
LIST OF FIGURES .......................................................................................................... xi
ABBREVIATION AND ACRONYMS .......................................................................... xii
CHAPTER ONE ................................................................................................................ 1
1.0 INTRODUCTION........................................................................................................ 1
1.1 Background of The Study .............................................................................................. 1
1.2 Problem Statement ......................................................................................................... 5
1.3 Purpose of Study ............................................................................................................ 6
1.4 Research Questions ........................................................................................................ 6
1.5 Significance of Study ..................................................................................................... 6
1.6 Scope of the Study ......................................................................................................... 7
1.7 Chapter Summary .......................................................................................................... 7
CHAPTER TWO ............................................................................................................... 8
2.1 Introduction .................................................................................................................. 8
2.2 Influence of Vision and Goals on Performance of Rugby Clubs ................................... 8
2.3 Influence of Strategic Formulation on the Performance of Rugby Clubs ................... 13
2.4 Influence of Strategic Plan on Performance ................................................................ 19
2.5 Chapter Summary ........................................................................................................ 24
CHAPTER THREE ......................................................................................................... 25
3.0 RESEARCH METHODOLOGY ............................................................................. 25
3.1 Introduction .................................................................................................................. 25
3.2 Research Design........................................................................................................... 25
3.3 Population and Sampling Design ................................................................................. 26
3.4 Data Collection Methods ............................................................................................. 27

ix
3.5 Research Procedures .................................................................................................... 28
3.6 Data Analysis Methods ................................................................................................ 29
3.7 Chapter Summary ........................................................................................................ 29
CHAPTER FOUR ............................................................................................................ 31
4.0 RESULTS AND FINDINGS ..................................................................................... 31
4.1 Introduction .................................................................................................................. 31
4.3 Performance of Rugby Clubs in Kenya ....................................................................... 34
4.4 Effects of Vision and Goals on Performance ............................................................... 37
4.5 Strategy Formulation and Performance ....................................................................... 39
4.6 Strategy Plan Implementation ...................................................................................... 40
4.7 Correlation of Vision and Goals, Strategic Formulation and Implementation Of
Strategic Plan On Performance .......................................................................................... 42
4.8 Regression Analysis Vision and Goals, Strategic Formulation and Implementation Of
Strategic Plan On Performance .......................................................................................... 43
4.9 Chapter Summary ........................................................................................................ 44
CHAPTER FIVE ............................................................................................................. 45
5.0 DISCUSSION, CONCLUSIONS AND RECOMMENDATIONS ........................ 45
5.1 Introduction .................................................................................................................. 45
5.2 Summary of Findings ................................................................................................... 46
5.3 Discussion .................................................................................................................... 47
5.4 Conclusion ................................................................................................................... 52
5.5 Recommendation ......................................................................................................... 53
REFERENCES ................................................................................................................. 54
APPENDIX 1: QUESTIONNAIRE................................................................................ 62

x
LIST OF TABLES
Table 1.1: Kenya Cup Titles per Club ................................................................................. 4
Table 4.1: Response Rate ................................................................................................... 31
Table 4.2: Number of Staff ................................................................................................ 33
Table 4.3: Gross Income .................................................................................................... 34
Table 4.4: Total Number of Kenya Cups Won ................................................................. 35
Table 4.5: Wins in the Group Stages 2016/2017 ............................................................... 35
Table 4.6: Finish in Top Four ............................................................................................ 36
Table 4.7: Revenue Source ................................................................................................ 36
Table 4.8: Revenue Generation .......................................................................................... 37
Table 4.9: Descriptive Statistics on Effects of Vision and Goals on Performance ............ 38
Table 4.10: Frequency of strategy Formulation ................................................................. 39
Table 4.11: Descriptive of Strategy Formulation and Performance .................................. 40
Table 4.12: Frequency of Strategic Plan Review............................................................... 40
Table 4.13: Descriptive of Strategy Plan Implementation ................................................. 42
Table 4.14: Correlation of Vision and Goals, Strategic Formulation and Implementation
Of Strategic Plan On Performance ..................................................................................... 43
Table 4.15:Regression Analysis Vision and Goals, Strategic Formulation and
Implementation Of Strategic Plan On Performance .......................................................... 43
Table 4.16: ANOVAa of Vision and Goals, Strategic Formulation and Implementation Of
Strategic Plan On Performance .......................................................................................... 44

xi
LIST OF FIGURES
Figure 2.1: Figure 2.1: Number of employees in Manchester United ............................... 21
Figure 4.1: Age of Respondents......................................................................................... 32
Figure 4.2: Role Played at the Club ................................................................................... 33
Figure 4.3: Duration in the Team ....................................................................................... 34

xii
ABBREVIATION AND ACRONYMS
CEO : Chief Executive Officer
EPPP : Elite Player Performance Plan
FIFA : Fédération Internationale De Football Association
HIV : Human Immunodeficiency Virus
IRB : International Rugby Board
NCAA : National Collegiate Athletic Association
NFL : National Football League
RFC : Rugby Football Club
SPSS : Statistical Package For Social Sciences
USA : United States Of America

1
CHAPTER ONE
1.0 INTRODUCTION
1.1 Background of The Study
The NFL (National Football League), the biggest sports league in the United States of
America. It‘s also the richest sports league in the world, generating an annual revenue of
$13.3 billion in 2016 (Forbes). This is a 50% increase in revenue from 2010 to 2016. In
2010, the Commssioner of the NFL Mr. Roger Goodell set out a financial vision for the
NFL to generate revenue amounting to $25 billion in 2027. This highlights that strategic
thinking is playing a larger part to the leagues financial success. Superbowl 51 which is
the final game of the 2016 – 2017 season had a viewership of 111.3 million
viewers[Forbes]. This is the 4th
most watched sporting event in the world. The FIFA
world cup final, Olympics and Cricket world cup final are the only sporting events that
generated more viewership. This is very impressive since the NFL is a sport that is
predominantly consumed by audience from the USA.
The sport does not have a global reach. The NFL comprises of 32 teams that play a total
of 16 team games before the playoffs start. A total of 12 teams make it to the playoff (6
from both conferences). The winner of the conference playoffs meet in the grand final
that is called the Superbowl. The NFL has a clear structure and strategic plan
(Forbes,2016).
In the 2013/2014 season the English Premier League according to Ernest and Young had
the following statistics based highlighting it great performance: 95.8% Stadium
Utilization, An average attendance of 36,691 per game, broadcasted in 185 countries,
televised games reached 730 million homes, generated £722 million in broadcast revenue,
544 artificial grass pitches built to date and over 546,000 young people engaged on
community projects (Ernest and Young, 2015)
One of the key aspects to the competitiveness and entertainment value of the English
premier league is that the broadcast revenue (which is the biggest contributor) is more
evenly distributed than the other big four soccer leagues in Europe (Bundesliga, La Liga
and Serie A). Equal distribution of revenue leads to clubs being able to be more
competitive because they can afford good players and good facilities. This is also one of

2
the key success factors of the NFL where the teams distribute the Broadcasting revenue
equally. (Ernest and Young, 2015).One of the key strategies to the English Premier
League success was the Premier League‘s Elite Player Performance Plan (EPPP) where
within a four year period, £ 340 million will be committed to develop more home grown
players. (Ernest and Young, 2015)
Clubs investing in the upgrade of their facilities is another vital strategy that English
Premier League Clubs have done. In the 2012/13 season Stoke City (an English premier
league club) opened a new £ 7 million training facility called Clayton Wood. In the
2013/14 season, Arsenal invested £390million on their Emirates Stadium, Southampton
invested £ 32million in the upgrade of their St. Mary‘s Stadium and Stoke City spent £15
million on the upgrade of their Britannia Stadium. Manchester United spent £ 42 million
on the expansion of the tier 2 sits in Old Trafford and Liverpool invested £260 million in
the upgrade of the main stand at their Anfield Stadium. (Ernest and Young, 2015)
Due to the development of the English Premier League, the British Government was able
to generate £ 2.4 billion in annual tax in the 2013/2014 season. Out the £ 4.2 billion
annual tax, £941 million was PAYE tax from the salaries of the stakeholders involved in
the league (mostly players salaries). There were 800,000 tourists that attended an English
Premier League game in the 2014/15 season and £285 million we bet per month during
the 2014/2015 season. This would generate additional revenue for the Government
(Ernest and Young, 2015)
The English Premier League in 2013/14 season employed 6,239 in the clubs and 65,623
people in the Premier League supply chain (Ernest and Young, 2015). One of the other
strategies is providing financing to partner clubs that are not in the English premier league
that can be a source of talented players that can join the premier league clubs. In the
2013/14 season the English premier league clubs spent £225 million in their
feeder/partner clubs. (Ernest and Young, 2015).
In South African Rugby, access to the game is one of the key performance indicators.
Their plan is to increase participants at primary school rugby players to 150,000 by 2019
and the number of secondary school rugby players to 50,000 by 2019. The key activities
to achieve those goals are create a structure of 52 rugby communities in the districts in
South Africa. In 2015 the union has to increase participation in rugby in primary school
by 20,000 students and in high school by 5,000 student. It will be support by an

3
investment from the Government (South Africa Rugby Union, 2014). Skills, one of the
key performance indicators is 10,000 newly accredited coaches by 2019, 5,000 newly
accredited referees by 2019 and 1,500 newly accredited administrators by 2019. The key
activites to achieve those goals are to conduct coaching and referee courses level 1 and 2
in all union and municipal districts and rugby communities. To accredit 700 referees and
2,000 coaches by 2015. The Rugby Union will also provide mobile coaching units and
online coaching support and tools (South Africa Rugby Union, 2014).
Performance, winning medals and being among the top three in the IRB rankings. This is
the goal that every South Africa national team strives for. In 2015, South Africa finished
third in the rugby world cup and still fired their head coach Mr. Heyneke Meyer because
they did not win the world cup and they were ranked number 5 in the IRB world rankings
(South Africa Rugby Union, 2014). Community Development and Social Responsibility,
One of the key performance indicators is implementation programmes that outreach the
community and they should focus on the major social issues in South Africa as HIV and
AIDS, sports against crime, sport for social cohesion and peace. In South Africa, the
Motsepe in 2016 had invested 117.5 million rand (approximately 9 million dollars) in 10
years promoting youth sports in rural areas in south Africa. Part of the funds were used to
make and maintain fields that can be used for rugby (South Africa Rugby Union, 2014).
Corporate Governance, one of the key performance indicators is performance
management systems implemented for executives, boards and CEOs. The key activities in
this are implementing a performance system that evaluates the work that has been done
by the board and CEO of South Africa Rugby Union (South Africa Rugby Union,
2014).Western Province Rugby Club, which is also the Stormers Franchise in the super
rugby tournament has a 5 year strategic plan from 2016 – 2020 called ‗Towards 2020‘. It
is not available to the public or formally published (Western Province Rugby, 2015).1909
was the year when the first recorded rugby game in Kenya took place and it was only
restricted to whites. In 1923 two major events took part in the history of rugby in Kenya.
The Union of Rugby in Kenya was founded and also the Nairobi District team was split
into two teams that still exist in Kenya today; Kenya Harlequins and Nondescript RFC. In
1925, the Nariobi District Championship was the first formal rugby competition in
Kenya. In 1930 old boys from Prince of Wales School (currently Nairobi School) formed
a rugby club called Old Cambrians, is club was later renamed to the current club that we
know called Impala RFC in 1956.

4
The main rugby clubs in the 1950s were Nairobi Railway Club, Kenya Civil Service
RFC, Kenya Police RFC, Nairobi Garisson RFC, Royal Air Force RFC, Impala RFC,
Nondescript RFC and Kenya Harlequins RFC. In 1954 Kenya had its first international
rugby match against Tanganyika. In 1961, the South Africa Springboks toured Kenya for
the first time and won Kenya 39-0. In 1962, the British Lions Rugby team toured Kenya
and they won 50-0. In 1964 Wales was the first country to tour Kenya after independence
and they won 26-8 (Internewskenya, n.d).
In 1970 the Kenya Rugby Football Union was established and Kenya Cup for formed as
the premier club competition. It has a playoff format where the highest ranked teams go
to the knockout round and eventually the Kenya Cup winner is determined from there.
The following is a list of the winning club starting from the most to the list.
Table 1.1: Kenya Cup Titles per clubs
Team Titles Years The Won Kenya Cup
Nondescript RFC 17 1975,1976,1978,1979,1980,1981,1982,1983,1984,
1986,1988,1991,1992,1993,1994,1997,1998
Impala RFC 10 1970,1971,1972,1973,1974,2000,2002,2004,2009
Kenya Harlequin FC 8 1995,1996,1999,2003,2008,2010,2011,2012
KCB RFC 4 2005,2006,2007,2015
Mean Machine RFC 3 1977,1989,1990
Nakuru RFC 2 2013,2014
Mwamba RFC 1 1985
Barclays Bank RFC (no longer exists) 1 1987
Kabras Sugar 1 2016
Source (Kenya Rugby, 2017)
Nondescript RFC has won the most titles and they had a very dominant stretch from the
1975 – 1998 where in 24 years they won a total of 17 titles. Impala had a dominant
stretch at beginning of the tournament, winning the first five and winning four more in the
early 2000s. Kenya Harlequins had a successful run from the mid 1990s to the 2000s
winning a total of 8 Kenya Cups. Based on a desktop research, the Kenya Rugby Union
has a strategic plan that has a five year duration from 2015 – 2019 but unfortunately the
plan is not accessible to the public (KRU, n.d)This study is meant to find out if Kenyan
clubs have strategic plans and if they are in line with the Kenya Rugby Unions strategic
plan.

5
1.2 Problem Statement
Poku (2012) study to assess the effect of strategic planning on the performance of banks
in Ghana with reference to the operations of the Agricultural Development Bank (ADB)
and the results of the administered questionnaires indicated that despite the respondents
having a high level of agreement for the features of the various dimensions of an
effectively managed bank. However, the findings indicated that that structures put in
place for bottom-up information flow were unknown to all employees, this indicated that
they were either ignorant about program evaluation or they clearly disregarded program
evaluation at ADB.
When you go to the Kenya Rugby Union website does not have a formula strategic plan
but based on accounts from media outlets in Kenya, there are strategic plan from 2016 –
2021.
Mukokho (2012) study to determine the influence of strategic planning onperformance of
public universities in Kenya: the case of university of Nairobi, and the study concluded
that strategic planning (SP) had an effect on the performance of the university, this led to
overall improvement in various areas which included compliance with set budgetary
levels, events within the UoN being open to public, work environment, implementation of
service delivery charter, research innovation and technology and outreach and extension
activities/programmes. The study concluded that University of Nairobi was faced with
various challenges of SP.
Akinyelen and Fasogbon (2007) study to identify the impact of strategic planning on
organizational performance and survival. The main objective of the study was to re-
evaluate the planning-performance relationship in organization and determine the extent
to which strategic planning affected performance in an organization, of which First Bank
of Nigeria, Plc (FBN). The implication of the study was that Strategic planning led to a
better organizational performance, which in the long run led to the survival and strategic
planning intensity as determined by managerial, environmental and organizational
factors.
From the studies mentioned it is apparent that within the private and public sector
strategic planning plays a big role in an organizational performance, however, looking at
sport clubs. All the clubs in Kenya Cup have the large majority of their players being
6
amateurs. They do not earn enough revenue to have professional players and there is very
little knowledge on the financial state of Rugby Clubs in Kenya. Combined with the fact
that there are very little studies that have been done on the sport of rugby globally,
especially in Kenya. All the clubs in Kenya Cup do not have a strategic plan for revenue
generation. Their merchandise is very hard to find, they do not have a plan of increasing
revenue from gate collections and they do not have a great TV rights and intellectual
property strategy. This study sought to establish the influence of strategic planning by
rugby clubs on their performance.
1.3 Purpose of Study
The purpose of study was to establish the influence of strategic planning by rugby clubs
on their performance.
1.4 Research Questions
1.4.1 How does having avision and goals influence performance of rugby clubs in Kenya?
1.4.3 How does strategic formulation influence the performance of rugby clubs in Kenya?
1.4.2 How implementation of strategic plan influence performance of rugby clubs in
Kenya?
1.5 Significance of Study
1.5.1 Rugby Clubs Top Management
This study will help rugby club managers and owners to understand the importance of
strategic planning and how, when done well can increase their performance and also
increase the amount of revenue they generate.
1.5.2 Kenya Sports Industry
The Kenya sports industry has been struggling for many years. For most sports, majority
of the athletes are amateurs and have to look for alternative means income to sustain
themselves. Its only track and field athletes who are professionals and earn enough to
sustain them. This study intends to help the industry increase its performance through
strategic planning and eventually increase the number of professional in the industry.

7
1.5.3 Policy Makers
(Eurostat, 2014) Sports directly employed roughly 1.6 million people in the European
union. The executive and legislature of the country can create a lot of employment
especially for the youth who are the majority of the population in Kenya. Other
complementary entrepreneurial opportunities can arise from the development and
investment of the Government in sports like selling merchandise, selling food and drinks
at a sporting event etc. Large revenue generated from the industry can be taxed and
increase revenue for the government.
1.5.4 Players
Rugby in Kenya is still amateur sport where the players have to look for alternative
means of income to make their basic ends meet. This research would help provide insight
in the strategic challenges being experienced by their employers who are the rugby clubs
in Kenya and recommend solutions that would increase their revenue and performance in
competitons.
1.5.5 Academicians and Researchers
Sports in general and especially in Africa has had very little research done on it. This
study intends to increase the knowledge gap in sports research and hopefully interest
more academia to research in this field. Looking at how strategic planning influences the
performance of rugby clubs in the Kenya Cup will help further understand.
1.6 Scope of the Study
The study has been limited to all Nairobi based rugby clubs that are participating in the
Kenya Cup. According to the Kenyan rugby union data there are currently 8 teams in the
league as at June 2017. The respondents included the Chairman, (Leaders) Head of the
line, Head of pack, Flyhalf, Scramhalf, Hooker, Coach and Assistant coach in each of the
eight teams resulting into 64 respondents. The study took place between May and August
2017.
1.7 Chapter Summary
This chapter summaries the purpose of the study, problem statement, came up with three
research questions that helped provide guidance on how to carry out the research on how

8
the strategic planning influences the performance of rugby clubs. The scope has been
defined limiting the study to rugby clubs taking part in the Kenya Cup
CHAPTER TWO
2.0 LITERATURE REVIEW
2.1 Introduction
Strategy implementation is the process of allocating resources to support the chosen
strategies. This process includes the various management activities that are
necessary to put strategy in motion, institute strategic controls that monitor
progress, and ultimately achieve organizational goals. This chapter offers literature that
gives more insight into the research questions under study by incorporating findings from
past studies.
2.2 Influence ofVision and Goals on Performance of Rugby Clubs
2.2.1 Vision and Goals
A goal is a broad primary outcome, it is what a person or an organization would like to
accomplish (Mikal, 2013). Some of the key characteristics of a great goal are realistic,
measurable and timebound. Goals are meant to be a tool that pushes an organization to
attain its full potential. They are used as a means to measure the performance and
progress an organization makes (Erica Olsen, 2013). Some enterprises do not have vision
or mission statements; for some they mean the same or they are quite unclear in how both
statements may be defined. If we study the various companies in terms of their vision and
mission, we will find a lot of different approaches and styles. Similarly, there are varying
theoretical views on vision and mission development. Many experts in this field admit
that there is not one precise or ideal way to develop mission and vision in the
organization. But the issue is not only about the creation and development but also about
seeking the value, meaning, and significance of vision and mission for management of
organizations and about their implementation. As the environment is constantly changing,
the theory of strategic management is developing as well.

9
The development of vision and mission is a part of strategy formulation. This step not
only includes the vision and mission development but also specification of strategic
objectives and strategy development. If the task of the strategy is to lead into the desired
strategic position, defined as the strategic goal of the desired direction at a certain time,
the vision and the mission should say more about the future and about future direction.
Vision and mission should explain an organization chose the specific strategy.
In 2010, the Commssioner of the NFL Mr. Roger Goodell set out a financial vision for the
NFL to generate revenue amounting to $25 billion in 2027. The NFL (National Football
League), the biggest sports league in the United States of America and the richest sports
league in the world made had an annual revenue of $13.3 billion in 2016. This is a 50%
increase in revenue from 2010 to 2016 (Forbes). This consistent revenue increase has
been achieved due to the NFL‘s vision and mission
University of North Carolina has a strong academic and sports tradition. Their school‘s
nickname is the ‗Tarheels‘ and their vision is to lead in all that they do (goheels,2017). In
the 2013 strategic plan that the University of North Carolina formulated, their goal was to
be in the top three in the Atlantic Coast Conference, which is the most competitive in
college basketball in the USA and also a top 10 national university in academics and
athletics (chapelboro,2013). This was proven in 2017, when their male basketball team
won the NCAA March Madness tournament which is the elite national university
basketball tournament. They are one of only three teams that have won 6 national
championships or more. The university has also produced great sports stars like Michael
Jordan, Vince Carter, Larry Brown, Rasheed Wallace, Kenny Smith, James Worthy and
Lawrence Taylor(chapehillrecorder,2012).
England Golf is the governing body of golf in England. In 2013, they formed a four year
strategic plan that was meant to last till 2017. In it their vision is England Golf being at
the heart of a network of partners, empowering and supporting a thriving community of
golf facilities and golfers and widely recognised as being a forward thinking and
successful organization. One of their key goals was to increase the number of people
playing golf at least once a week from 750,000 in 2014 to 910,000 by March 2017. Due
to following the strategic plan that they came up with a clear vision and goals, in 2016
golf had contributed £3.4billion to the English economy and it became the 5th
largest
participation sport in the country (englandgolf,2017). This has also lead to English

10
professional players being competitive and winning the golf major tournaments. Danny
Willett won the master in 2016 and in the 2017 masters Justin Rose from England lost to
Sergio Garcia in a sudden death playoff.
2.2.2 Key Performance Indicators in Rugby clubs
Performance of a sports team is quantified by either the amount of competitions it wins
and the amount of revenue a team generates.From my analysis of the forbes list of the
richest sports teams in 2016, out of the top 50 richest sports teams in the world, the NFL
has 27 teams. Only NFL 5 teams did not make it to the top 50 richest list, making it by far
the most commercially successful sports league in the world. (Forbes,2016). The
Superbowl came up when the NFL merged with a rival American Football League called
the AFL (American Football) in 1966. In the 51 year history of the Superbowl, only four
teams have been able to win five or more titles, The Pittsburgh Steelers (6), San Francisco
49ers (5), New England Patriots (5) and the Dallas Cowboys (5). Below is a table from
the NFL breaking down the teams that have won superbowls since the inception of the
tournament (NFL, 2017)
Manchester United has been by far the most successful team in English Premier League
era, winning an unprecedented 13 titles, which is more than the summation of all the
other titles the other teams have won during the Premier League era Since which is 11
titles in total. (English Premier League, 2017).
Jones et al. (2004) considered the winning and losing performances of a single team and
found a number of statistically and practically significant differences. For example, in
rugby, while ‗lineout success on the opposition throw‘ differed significantly between
winning and losing performances, large observable (but nonsignificant) differences were
apparent for a number of performance indicators (Hughes & Bartlett, 2002) such as
‗turnovers won‘. A similar study was undertaken by Ortega (2009), where analysis was
undertaken on indicators such as line breaks, possessions kicked and turnovers. These
indicators were then correlated to winning or losing performances in the Six Nations
tournament and significant differences were identified for winning performance. Vaz et
al. (2010) tried to link game related statistics that discriminated between winning and
losing teams in International Rugby Board and Super 12 games. However, as with the
previously cited research, the distinction between winning and losing was used as the sole
independent variable. Thus, potential confounding variables that may affect performance

11
such as match venue, weather conditions and the strength of the opposition (James et al.,
2002) were not considered in this profile of a rugby team.
Performance analysts have focused on general match, tactical and technical indicators and
have contributed to our understanding of the physiological, psychological, technical and
tactical demands of team sports. For example, in tennis, the performance of a player may
be assessed by the distribution of winners and errors around the court. In soccer, one
aspect of a team‘s performance may be appraised by the ratio of goals scored to shots
attempted by the team. These indicators can be categorised as either scoring indicators, or
indicators of the quality of the performance (Hughes & Bartlett, 2002). Examples of
scoring indicators are goals, baskets, winners, errors, the ratios of winners to errors and
goals to shots, and dismissal rates. Examples of quality indicators are turnovers, tackles,
passes/possession, shots per rally, and strike rate. Both types of indicator have been used
as positive or negative measures in the analysis of particular performances. If presented in
isolation, a single set of data (indicators for a performance of an individual or a team) can
give a distorted impression of a performance, because of other, more or less important
variables.
In 2015 the South African Rugby Union made a profit of 16,745,193million rand after
taxation. The total revenue that was generated was 967,112,958 rand in 2015. This makes
it the richest southern hemisphere Rugby Union, even over Australia and New Zealand,
where their rugby unions recorded losses of $500,000 in New Zealand and AU$9.8
million (SANZAR). In 1970 the Kenya Rugby Football Union was established and Kenya
cup for formed as the premier club competition. It has a playoff format where the the
highest ranked teams go to the knockout round and eventually the Kenya Cup winner is
determined from there. Below is a list of the winning club starting from the most to the
list.
Nondescript RFC has won the most titles and they had a very dominant stretch from the
1975 – 1998 where in 24 years they won a total of 17 titles. Impala had a dominant
stretch at beginning of the tournament, winning the first five and winning four more in the
early 2000s. Kenya Harlequins had a successful run from the mid 1990s to the 2000s
winning a total of 8 Kenya Cups.

12
2.2.3 Organization Maturity
It was noted from the literature that the relationship between strategic planning and
organization age has various components. For example, Loderer, Claudio and Urs
Waelchli (2009) looked at the effect of age on an organization‘s ability to change as well
as the effect of age on growth. Skrt and Antoncic (2004) investigated planning and
growth. Others such as Yusuf and Saffu (2009) directly assessed planning intensity with
age and benefits expected from planning for young firms compared to old ones. Another
interesting area was the relation between the planning horizon and organization age. Next
is a presentation of what was noted in the literature. In the management literature,
Leonard-Barton (1992) has pointed out that, when firms focus on core capabilities, they
bring on core rigidities that make it difficult to adapt to changes in their environment.
Barton also added that age could affect performance by inducing organizational inertia.
Moreover, old age may make knowledge, abilities, and skills obsolete and induce
organizational decay (Agarwal, Rajshree and Michael, 2002).
Therefore, older firms are consequently less flexible and are less likely to react to the
profitable innovation signals they receive from the market. The relation between age and
growth has been given careful attention in the industrial organization literature. Evans
(1987), for example, finds that firm growth decreases with firm age. Cooley, Thomas and
Quadrini (2001) offer a model that explains this observation. The intuition is that, as
capital increases over time, its marginal product declines. On the other hand, Skrt and
Antoncic (2004), as well as Miller and Cardinal (1994), found a positive relationship
between strategic planning and firm profitability and growth. Successful young firms
tend, to a large extent, to use advanced planning and activity analysis. Moreover, strategic
planning is a process that helps organizations to identify strategic issues and so to forecast
and prepare for the future, which will help organizations to grow (Zimmerer and
Scarborough, 1996).
All the English Premier League teams that will take part in the 2017/2018 season are all
over 100 years, thus being very mature organizations (Premierleague, 2017). This
maturity of the teams has helped establish a culture and clear structures in each of the
clubs. The maturity of the clubs has lead to a centralized structure where the owners and
team managers make the most of the decisions on the personel. Change is very slow to
come by in this clubs that is why most of them have been in the same stadium and city for

13
many years. It took most club over 80 years from inception to adapt the change of putting
players names on their shirts and make it compulsory to have seats only stadiums without
fans standing in the stands(A Whole New Ballgame, 2012).
1909 was the year when the first recorded rugby game in Kenya took place and it was
only restricted to whites. In 1923 two major events took part in the history of rugby in
Kenya. The Union of Rugby in Kenya was founded and also the Nairobi District team
was split into two teams that still exist in Kenya today; Kenya Harlequins and
Nondescript RFC. In 1925, the Nairobi District Championship was the first formal rugby
competition in Kenya. In 1930 old boys from Prince of Wales School (currently Nairobi
School) formed a rugby club called Old Cambrians, is club was later renamed to the
current club that we know called Impala RFC in 1956. The main rugby clubs in the 1950s
were Nairobi Railway Club, Kenya Civil Service RFC, Kenya Police RFC, Nairobi
Garisson RFC, Royal Air Force RFC, Impala RFC, Nondescript RFC and Kenya
Harlequins RFC. In Kenya Cup club rugby the three most mature teams are Kenya
Harlequins, Nondescript RFC and Impala (Internewskenya, n.d).
2.3 Influence of Strategic Formulation on the Performance of Rugby Clubs
2.3.1 Strategy Formulation
Strategy formulation is the process by which an organization chooses the most
appropriate courses of action to achieve its defined goals. This process is essential to an
organization‘s success, because it provides a framework for the actions that will lead to
the anticipated results. Strategic plans should be communicated to all employees so that
they are aware of the organization‘s objectives, mission, and purpose. Strategy
formulation forces an organization to carefully look at the changing environment and to
be prepared for the possible changes that may occur.
A strategic plan also enables an organization to evaluate its resources, allocate budgets,
and determine the most effective plan for maximizing ROI (return on investment). A
company that has not taken the time to develop a strategic plan will not be able to provide
its employees with direction or focus. Rather than being proactive in the face of business
conditions, an organization that does not have a set strategy will find that it is being
reactive; the organization will be addressing unanticipated pressures as they arise; and the
organization will be at a competitive disadvantage.

14
Rational planning and logical incrementalism are the two main models of strategy
formulation in the management literature (Elbanna 2006). Where neither of these
approaches is present, organizations are likely to lack clearly discernable processes,
thereby exhibiting ‗strategy absence‘ (Inkpen and Choudhury 1995). Rational planning is
characterized by analytical, formal, and logical processes through which organizations
scan the internal and external environment, and develop policy options which differ from
the status quo. The options that are generated by this process are evaluated prior to the
setting of organizational targets, which are then regularly reviewed and monitored
(Mintzberg, 1994). Planning thus operates within a framework of bounded rationality
because of the cognitive limits of decision-makers and the iterative way in which they
move between the various planning phases (Elbanna 2006).
Evidence on the consequences of rational planning for organizational performance is,
however, mixed (Elbanna 2006). While the balance of the international research results
from the public, private and non-profit sectors leans towards a positive relationship
between planning and performance (Boyne and Gould-Williams 2003), ‗planning is
neither a necessary nor a sufficient condition for performance improvement‘ (Boyne et
al.,2004). Logical incrementalism, or ‗incrementalism with a purpose‘ emphasizes the
importance of setting broad organizational goals (Boyne et al. 2004). It suggests that
strategy formulation is a political process – actors within organizations may have
conflicting views on the most appropriate ways to meet organizational goals. How these
are reconciled is reflected in the strategy-making process. Political conflicts may be over
resource allocation, policy goals or organizational power, inside or outside the
organization (Elbanna 2006). Internal politics may therefore be counterproductive for the
attainment of higher levels of organizational performance, as conflict can result in
inopportune decision making, drift in seeking goal attainment, a lack of transparency by
decision-makers and a poor interpretation of the external organizational environment
(Elbanna, 2006). All of this suggests that logical incrementalism will have adverse effects
on organizational performance.
Access to the game, one of the key performance indicators is to increase participants at
primary school rugby players to 150,000 by 2019 and the number of secondary school
rugby players to 50,000 by 2019. The key activities to achieve those goals are create a
structure of 52 rugby communities in the districts in South Africa. In 2015 the union has
to increase participation in rugby in primary school by 20,000 students and in high school

15
by 5,000 student. It will be support by an investment from the Government (South Africa
Rugby Union, 2014). Skills, one of the key performance indicators is 10,000 newly
accredited coaches by 2019, 5,000 newly accredited referees by 2019 and 1,500 newly
accredited administrators by 2019. The key activites to achieve those goals are to conduct
coaching and referee courses level 1 and 2 in all union and municipal districts and rugby
communities. To accredit 700 referees and 2,000 coaches by 2015. The Rugby Union will
also provide mobile coaching units and online coaching support and tools (South Africa
Rugby Union, 2014).
Performance, winning medals and being among the top three in the IRB rankings. This is
the goal that every South Africa national team strives for. In 2015, South Africa finished
third in the rugby world cup and still fired their head coach Mr. Heyneke Meyer because
they did not win the world cup and they were ranked number 5 in the IRB world rankings
(South Africa Rugby Union, 2014).
Community Development and Social Responsibility, One of the key performance
indicators is implementation programmes that outreach the community and they should
focus on the major social issues in South Africa as HIV and AIDS, sports against crime,
sport for social cohesion and peace. In South Africa, the Motsepe in 2016 had invested
117.5 million rand (approximately 9 million dollars) in 10 years promoting youth sports
in rural areas in south Africa. Part of the funds were used to make and maintain fields that
can be used for rugby (South Africa Rugby Union, 2014). Corporate Governance, one of
the key performance indicators is performance management systems implemented for
executives, boards and CEOs. The key activities in this are implementing a performance
system that evaluates the work that has been done by the board and CEO of South Africa
Rugby Union (South Africa Rugby Union, 2014).
2.3.2 Organization Size
Organization size has gained considerable attention in strategic literature. The size of the
organization is frequently defined by the number of full-time employees. Research into
organization size and Formulation has been tackled from different aspects. Where some
scholars have looked at the influence of organization size on strategic formulation
practice, others investigate potential benefits of formulation in large firms compared to
small ones; some scholars went even further to assess the influence of organization size
on the formulation horizon, the influence of uncertainty on formulation in small and large

16
firms, and even the relation between strategic flexibility and firm size was looked at. Next
is presentation of what has been noted in the literature.
Mintzberg (1994) argues that formulation may be more important in large firms due to its
ability to improve coordination and control. Robbins (1990) added that size has its
strongest effect on organization structure up to a level of approximately 1500 employees.
Behaviour formalization as well as organization complexity increases according to size
up to this level. After that, size becomes a less important determinant of structure as the
organization has already become highly formalized. Plans can be used to aid coordination
either by making individual behaviours more organized or through forecasting events
where increased coordination will be necessary to give organizational members time to
prepare for that event.
However, because behaviour patterns are institutionalized by other means, the potential
for exploiting the benefits of strategic formulation is likely to be reduced in large firms.
Risseeuw and Masurel (1994) note that larger firms have greater formulation incidences
than smaller firms due to the ability of large organizations to access more resources
(Barney, 1991). In the public and non-profit organizations it was found by a number of
scholars that large organizations were more likely to plan than smaller ones. Numerous
organizational researchers have recognised environmental scanning as central to the
strategy-making however, research on how perceived environmental uncertainty impacts
strategic formulation did not take into account organization size and was developed
extensively for large firms only.
Matthews and Scott (1995) found a negative relationship between perceived
environmental uncertainty and sophistication of formulation in small firms. This is
because small firms typically have less management expertise to draw on than large
firms; therefore, they are likely to be less sure of their possible responses to uncertainty.
Moreover, large size creates opportunities for a firm to enhance the level of specialization
and it is through specialization that firms are able to realize the benefits of experiential
learning and economies of scale (Dobrev and Carroll, 2003). Firms owe such scale and
efficiency advantages to a complex system of repetitive and specialised routines. The
literature also reveals that size has conflicting effects on strategic flexibility. The firm‘s
strategic flexibility refers to the ability to develop and deploy capabilities that enable the
firm to reconfigure its resource base quickly and effectively (Eisenhardt and Martin,
17
2000) or dismantle its current strategies. Effective strategic flexibility requires a
responsive organization and also requires extensive information processing capabilities
(Ansoff, 1965).
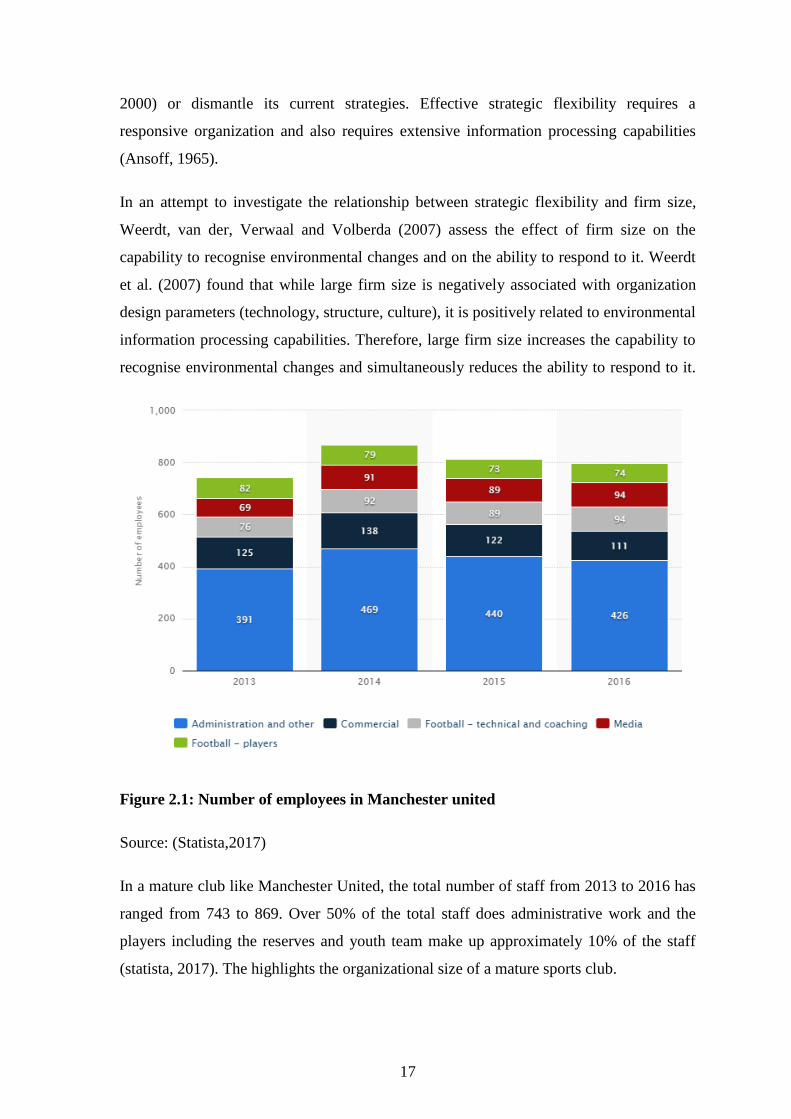
In an attempt to investigate the relationship between strategic flexibility and firm size,
Weerdt, van der, Verwaal and Volberda (2007) assess the effect of firm size on the
capability to recognise environmental changes and on the ability to respond to it. Weerdt
et al. (2007) found that while large firm size is negatively associated with organization
design parameters (technology, structure, culture), it is positively related to environmental
information processing capabilities. Therefore, large firm size increases the capability to
recognise environmental changes and simultaneously reduces the ability to respond to it.
Figure 2.1: Number of employees in Manchester united
Source: (Statista,2017)
In a mature club like Manchester United, the total number of staff from 2013 to 2016 has
ranged from 743 to 869. Over 50% of the total staff does administrative work and the
players including the reserves and youth team make up approximately 10% of the staff
(statista, 2017). The highlights the organizational size of a mature sports club.
18
2.3.3 Strategy Formulation and Performance
The strategy-performance relationship has been examined in numerous works, both
empirically and theoretically. The focus of this study is on empirical studies. In empirical
studies, the linkage between strategy and performance is typically operationalized by
using various measures and explicit ideas of causality fuelled by Miles and Snow‘s
(1978) idea of strategic types and Porter‘s (1980) generic strategies. These studies offer
workable frameworks for distinguishing strategic types and for evaluating their impact on
various measures of performance (Luoma, 2015). Development and application of
strategic typologies have emerged as an important research area in strategic management.
In this context, the leading contributions include: Miles and Snow‘s (1978) strategic types
(Prospectors, Analyzers, Defenders and Reactors); Porter‘s (1980) set of ―generic
strategies‖ (Cost Leadership, Differentiation and Focus); Miller‘s (1990) high-
performance ―gestalts‖ (Craftsman, Builder, Pioneer and Salesman); and Treacy and
Wiersema‘s (1995) three strategic types (Operational Excellence, Product Leadership and
Customer Intimacy).
The theoretical insights of these typologies stimulate a stream of subsequent research.
The typology of Miles and Snow (1978) has been one of the most enduring, scrutinized,
and applied frameworks (Hambrick, 2003; Lin et al., 2014). This strategic typology
represents four strategic types as prospectors, analyzers, defenders, and reactors. It is
argued that these strategic types may exist simultaneously within industries and the viable
strategies (prospectors, analyzers and defenders) if properly implemented, would yield
similar results and outperform Reactors — a non-viable strategy.
The English Premier League is a league format championship that was established in
1991. The strategy to form it, was done in the 1980s when the ‗Big 5‘ clubs in England
(Liverpool, Manchester United, Arsenal, Tottenham, Everton) changed their strategy by
breaking away from the English Football League, which administered all the soccer
leagues in England and they decided to form their own new league. The main reasons
why the ‗Big 5‘ clubs wanted to break away from the English Football League is because
they had very little power on influencing how the First Division League was run because
when passing rules each team had one equal vote. For example, the ‗Big 5‘ clubs fought
with the English Football League on the Television revenue sharing agreement, where the
lower division teams were entitled to the same amount of television revenue as the big

19
teams when yet it was the ‗Big 5‘ teams that generated the most amount of television
viewers around the world (A Whole New Ballgame, 2012). Now the English Premier
League is the biggest soccer league in the world.
Sir Alex Ferguson, the former Manchester United manager always found it important to
have a long term strategy of for the club from a players perspective. He would look at the
current squad and try to visualize his team 3 years later and come up with a strategy on
how to make the team as competitive as possible. An integral part of the strategy he
formulated was invest in the Youth Academy in Manchester United and coming up with a
clear plan and strategy for his staff on what he expected. This has lead to Sir Alex
Ferguson winning 13 Premier League titles in 27 years (Ferguson, 2015).
2.4 Influence of Strategic Plan Implementation on Performance
2.4.1Resource Allocation and Strategy Planning
The position of resources in strategy can be seen inside the definition of method. The
determination of the essential lengthy-time period aims and targets of the company,
with implementation of methods of activities and assigning of the critical assets to
execute those aims, can be also considered as a definition of method (Chandler, 1995).
Katz (1970) stated that there are two functions of strategy: strategic role and structure
plan. according to Katz, the strategic position is the actual association or the actual
connection between the organization and its environment at an precise moment of
time. Newman et al. (1981) introduced that obtaining resources in advance, mainly
―tangible or intangible‖ assets on the way to situate the employer in a useful role in
the future, is taken into consideration as a ―strategic position‖. however, the shape plan is
the proposed relation in the destiny, which includes a number of company desires
as nicely as activities that are important to gain those dreams (Katz, 1970).
It identifies the commercial enterprise in which the firm fights via focusing at the sources
that will help to translate the ―one-of-a-kind competence‖ to ―competitive benefit‖.
in addition, Andrews emphasised that the valuable strategic selection is the choice
that focuses on a giant element of the firm‘s resources. subsequently, corporate
strategy is forming an efficient organization of commercial enterprise-devices through
an accurate ―investment (allocation) of sources‖ and adding price to corporations
via these resources (Newman et al., 1981).

20
Many researchers have highlighted the importance of specializing in inner strengths and
weaknesses as a source of competitive gain, resulting in a better and more favorable
scenario. For instance, Barney (1986) mentioned that strategic alternatives must be
driven from an analysis of the special abilities and capabilities of the firm as opposed to
the company‘s external surroundings; further ―studying a company's talents and
talents can be a source of greater correct expectations‖. provide (1991)
diagnosed how changes in the external surroundings can justify the resources and
capabilities required as the regular base from which the company can determine its
identity. Grant additionally emphasized that a business should be defined based totally
on its skills to offer more potent method, instead being described according to the
requirements it goals to fulfill. Therefore, its important for strategists and managers to
keep in mind that investigating a company‘s internal belongings provides a greater
affordable analysis for formulating techniques than concentrating on what the company
must do to fulfill demand (Lopez, 2005).
The idea of the useful resource-based View (RBV) of a firm illustrates this courting.
Truly, RBV considers a company as a collection of assets and abilities (Montealegre,
2002; Coates and McDermott, 2002). To be extra precise, RBV is the manner of
maximizing the earnings thru highlighting strategic alternatives and assigning the
essential challenge of defining, enhancing, and implementing the principal
organizational assets to management or the decision makers (Fahy, 2003). Finney et
al. (2005) said that RBV implies that assets are the bottom of achievement for
corporations. in addition, for Coates and McDermott (2002), RBV well-known shows
that the success of a agency‘s approach depends on its series of assets. Certainly,
RBV assumes that a sustainable competitive benefit results from the desired
outputs of the control activities of the organization (Fahy, 2003).
Clubs investing in the upgrade of their facilities is another vital strategy that English
Premier League Clubs have done. In the 2012/13 season Stoke City (an English premier
league club) opened a new £ 7 million training facility called Clayton Wood. In the
2013/14 season, Arsenal invested £390million on their Emirates Stadium, Southampton
invested £ 32million in the upgrade of their St. Mary‘s Stadium and Stoke City spent £15
million on the upgrade of their Britannia Stadium. Manchester United spent £ 42 million
on the expansion of the tier 2 sits in Old Trafford and Liverpool invested £260 million in
the upgrade of the main stand at their Anfield Stadium. (Ernest and Young, 2015).One of

21
the key strategies to the English Premier League success was the Premier League‘s Elite
Player Performance Plan (EPPP) where within a four year period, £ 340 million will be
committed to develop more home grown players. (Ernest and Young, 2015)In 2015, the
London wasps became the richest rugby club in the world after the launched a £35million
bond in the London Stock Exchange.
2.4.2 Strategic Leadership
Groups are via definition composed of human beings concerned in dynamic social
relationships. It is thru those relationships among leaders and fans, superiors and
subordinates, managers and employees, that the paintings and accordingly the essential
functions of groups are done. The effectiveness of these relationships undoubtedly
influences the effectiveness of businesses. But, the effectiveness of these relationships
depends largely at the effectiveness of the behavioral inputs provided by means of the
participants in those relationships relative to organizational dreams. Subsequently chief
effectiveness must be an input to and determinant of organizational effectiveness and
management effectiveness is likewise a function of organizational effectiveness (Sanders
& Davey, 2011).
Ireland and Hitt (1999) outline strategic management as someone‘s capability to assume,
envision, preserve flexibility, assume strategically, and paintings with others to provoke
adjustments with a view to create a viable future for the enterprise. In step with Wheeler
et al. (2007), brilliant management practices are not replicable in a recipe style, however
businesses can increase a design for strategic leadership. This is an included organization
of practices that builds an organization‘s capacity for alternate. with a view to increase
and hold this capacity, those authors outline four essential elements that want to be
included: (1) commitment to the employer‘s cause; (2) the makeup of the top
management crew; (3) the abilities and motivation of humans at some stage in the
organization; and (4) a series of focused, properly-selected strategic tasks which can take
the enterprise ahead.
In current years, the eye of management pupils has shifted to top executives who are in a
position to exert a sturdy affect at the strategy and performance of firms (Sosik, Jung,
Berson, Dionne & Jaussi, 2005). Strategic management is the chief‘s ability to assume,
envision and keep flexibility and empower others to create strategic exchange as vital
(Hitt et al., 2001; Serfontein, 2009; Jooste & Fourie, 2009). The word ―strategic

22
management‖ emerged from paintings on strategic management and entails the following:
(1) determining strategic direction; (2) exploring and maintaining unique middle
competencies; (3) growing human capital; (4) sustaining a powerful organizational way
of life; (5) emphasizing moral practices; and (6) organizing balanced organizational
controls (Jooste & Fourie, 2009).
A synthesis of the leadership theories indicates at the least 3 elements which are crucial to
the construct of leadership effectiveness, namely assignment awareness, people
awareness and improvement cognizance (Sanders & Davey, 2011). Mission focus entails
those tactics that are geared toward the accomplishment of the simple purpose of the
organization (e.g. goals, objectives, and consequences). leadership inputs which might be
humans targeted include the following: consideration; participative selection making;
subject for fans' wishes; matching personal and group desires; fairness; appreciate; agree
with; and equitable rewards. Improvement awareness includes the periodic want to
establish new styles that take focus of altered conditions in which the employer operates.
Organizational effectiveness is viewed because the primary manner of linking
management theories to the strategic management assemble, and management
effectiveness needs to be defined in phrases of organizational effectiveness if it's miles to
be considered strategic.
Football teams are a representation of the personality and mentality of the leader. Arsene
Wenger, the manager of Arsenal football club, ensures that his teams play attacking
football and like having possession. Based on that observation, Ancelotti and other
managers on that have had success against Arsenal have come up with a tactic to be more
physical than them and attack them with counter attacks and set pieces like corners. Jose
Mourinho, the current manager of Manchester United and former Chelsea manager,
ensures that his teams do not concede. He has a defensive mindset and gets his teams to
maximise their chances when they attack. This was the foundation of Chelsea‘s success
when he was the manager. Pep Guardiola, the current manager of Manchester City and
former Barcelona, gets his teams to focus on keeping possession of the ball. Sir Alex
Ferguson, the former Manchester United manager, ensure his teams had a rhythm of
power, speed and intensity (Ancelotti, 2016).

23
2.4.3 Organizational Culture
Culture gives the context inside which strategies are formulated and applied.
Organizational culture concerns decisions, movements, verbal exchange styles, and
communique networks. Fashioned over the lifestyles of an agency, tradition reflects what
the business enterprise has learned across time through its responses to the non-stop
challenges of survival and boom. Subculture is rooted in records and held collectively and
is of enough complexity to withstand many tries at direct manipulation, due to the fact
it affects the manner the corporation conducts its commercial enterprise, as nicely as
the techniques used to alter and manage the behavior of human beings within the
enterprise. because the manner the employer conducts its business relies upon largely
on the alignment of business manner with its approach, and needs to be correctly
controlled, subculture can be an aggressive benefit (Serfontein, 2009).
Without the right cultural nurturing, organizations will be not able to produce
sustainable effects and a lasting aggressive benefit. The transformation of a lifestyle
requires relentless dedication from pinnacle control a function that can't be delegated or
outsourced. it's miles pinnacle control that drive the tradition of an company, and
while many leaders will admit that culture is a powerful have an effect on that is capable
of create and sustain organizational overall performance, it is not constantly given the
cognizance that will acquire the transformation (Panico, 2004).
The identity and culture of a football team in Europe is based on the style of play. Real
Madrid‘s identity since the 1950‘s is attacking football played by star players. From 1956,
they won the European Cup five times in a row in an attacking football style, with stars
like Di Stefano and Puskas. In the 2000s Real Madrid has won 5 champions league with
the same identity of attacking football with stars like Zidane and Christiano Ronaldo. The
have been previous managers of Real Madrid who had won trophies but were still fired
because their style of football was not in line with their identity, for example Fabio
Capello and Jose Mourinho despite winning La Liga got fired because their teams did not
win with the historic identity that they have (Ancelotti, 2016).
Even as many leaders concede that lifestyle is an effective impact that can create and
sustain organizational performance, few manage to pay for it the time and attention
it merits. The reasons lie in complexity and length. Remodeling a subculture calls for
24
relentless dedication from pinnacle management, a dedication that cannot be delegated or
outsourced (Panico, 2004). The transformation of culture is a long term procedure and
cannot be done overnight. However, the recognition and subculture of a
corporation can be destroyed in a second of indiscretion. A management team whose
behavior and behavior have generated distrust cannot probable power fantastic
cultural change, because trust is the one factor this is the maximum vital for efficiently
remodeling a lifestyle. Consider is a function of two matters: individual and competence.
Character consists of integrity, reason, and rationale with humans. Competence
includes abilities, skills, effects, and song document and both are important (Panico,
2004; Covey & Merrill, 2006). This study therefore seeks to establish the role of
organizational culture and how it affects strategy planning in rugby teams.
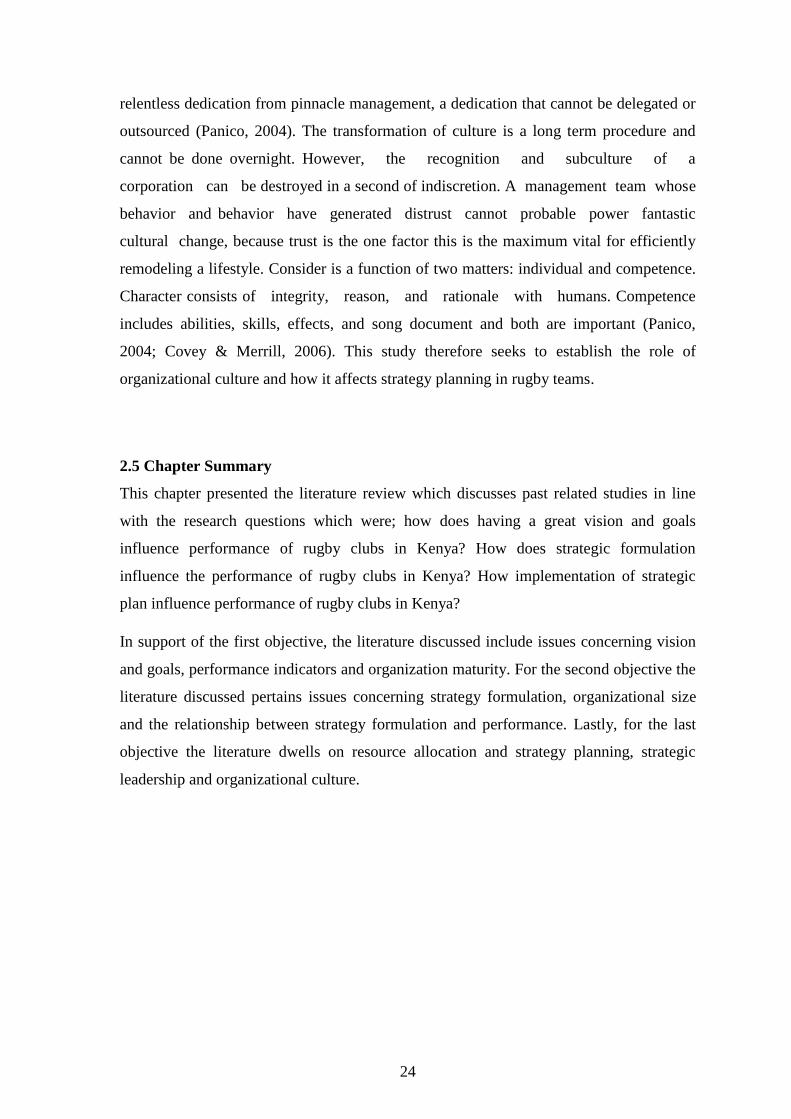
2.5 Chapter Summary
This chapter presented the literature review which discusses past related studies in line
with the research questions which were; how does having a great vision and goals
influence performance of rugby clubs in Kenya? How does strategic formulation
influence the performance of rugby clubs in Kenya? How implementation of strategic
plan influence performance of rugby clubs in Kenya?
In support of the first objective, the literature discussed include issues concerning vision
and goals, performance indicators and organization maturity. For the second objective the
literature discussed pertains issues concerning strategy formulation, organizational size
and the relationship between strategy formulation and performance. Lastly, for the last
objective the literature dwells on resource allocation and strategy planning, strategic
leadership and organizational culture.

25
CHAPTER THREE
3.0 RESEARCH METHODOLOGY
3.1 Introduction
This chapter looks at the methodology to be applied in the actual study. It starts by
introducing the procedure for data collection, analysis and processing in order to
accomplish the research objectives. It also presents the research design, target population,
and sampling techniques. This section also puts forward the data collection methods,
tactics and tools applied while noting down the validity and reliability tests to be applied
for the data analysis used.
3.2 Research Design
Research design refers to a strategy for pickingout subjects, or data collection procedures
done with the intent of answering particular research questions (Blumberg, Cooper, and
Schindler, 2008). The design shows which individuals form the study as well as when,
where and why they are to be studied, to obtain the answers to the research questions
(Cohen, 2003). The research design utilized was a descriptive one and this was condusive
for acquiring data on the influence of strategic planning on the performance of rugby
clubs in the Kenya cup.
Descriptive design requires researchers to gather, present, and interpret data for functions
of clarification. Descriptive studies involve accumulating facts so as to check hypotheses
or solution questions regarding the individuals under study. Descriptive design was
undertaken to ascertain, give an explanation for and describe characteristics of variables
26
related to a topic population. It sought to answer questions which include who, what,
when, wherein and the way of any provided topic in its wake (Blumberg et al, 2008). This
layout was selected as it was considered powerful in investigating the effect of company
restructuring on the overall performance of the corporation. The dependent variable was
performance of rugby clubs while the independent variable was influence of strategic
planning.
3.3 Population and Sampling Design
3.3.1 Population
Mugenda and Mugenda (1999), defined a population as a whole set of individuals, cases,
or substancessharing a common observable features. A target population is therefore the
population by which a researcher intends to generalize the findings of a study. For this
study, the target population wereofficials in the Rugby teams in the Kenyan league.
According to the Kenyan rugby union data there are currently 8 teams in the league as at
June 2017.
3.3.2 Sampling Design
This represents is option of who and how many respondents to interview, what and how
many events to look at, or what and how many information to investigate. A pattern is a
group of instances, respondents, or information constituted of part of the target
population, carefully decided on to symbolize the populace (Cooper & Schindler, 2011)
3.3.2.1 Sampling Frame
According to Cooper and Schindler (2011) a sampling frame is the sign up of all the
population elements from which the sample could be drawn and which need to carefully
associated with the populace. in step with Blumberg et al (2008) a sampling body is a
listing of elements from which the sample is certainly drawn and closely associated with
the population. The sampling body of the study came from the diverse teams in the Kenya
Rugby. this is aimed at making sure that the sampling body is current, whole and relevant
for the attainment of the observed objectives.
3.3.2.2 Sampling Technique
A sampling method refers to the technique that is used to choose the participants of a
pattern. The members of the sample are decided on the usage of both possibility and non-
probability processes. Sampling techniques are extensively categorized into possibility

27
and non-opportunity sampling (Mugenda &Mugenda 2003). The main benefit of chance
sampling is that it guarantees equal opportunity for all of the components in a study target
populace (Kothari 2011). The sampling approach used for this study was stratified
random sampling.
The intent for the usage of the stratified random sampling was to allow the researcher to
collect samples from all the classes of respondents, hence minimizing bias (Kothari,
2011). This guarantees the researcher obtains the proper sample size (Albright et al.,
2011).
3.3.2.3 Sample Size
Ligthelm and Van (2005) describes the sample size as a smaller set of the larger
population. A sample size is a smaller grouping of the entire population under
considerationand which should characteristically resemble or reflect the entire population
so as to aid in making generalizable conclusions. The choice of a sample size is affected
by several factors such as: the variance in the population, the desired precision of the
estimate, required level of confidence, the range of error allowed, the number of
subgroups of interest within a sample and the cost of research (De Vaus, 1991).
For this study the respondents were Chairman, (Leaders) Head of the line, Head of pack,
Flyhalf, Scramhalf, Hooker, Coach and Assistant coach in each of the eight teams
resulting into 64 respondents.
3.4 Data Collection Methods
The study made use of primary and secondary statistics. The primary data was considered
convenient for this research because it guaranteed accuracy and presents the researcher
with the possibility to make interpretations (Mugenda and Mugenda, 2003). This could be
achieved using a questionnaire. A questionnaire is a tool of statistics series that consists
of a listing of questions, which are associated with the goal of the research, they are
commonly utilized in gathering statistics about respondents, and their attitudes about a
circumstance. They're also used in the in-depth exploration of complex issues (Saunders
et al., 2007). A number of the benefits of questionnaires is that they saved time and
facilitated the collection of facts from massive samples. In using questionnaires the
respondents also can be capable of upholding the confidentiality of the members (Kombo

28
and Tromp 2012). The secondary facts, alternatively was accrued from applicable
literature, addressing the specific variables investigated in this take a look at.
The questions were structured and the questionnaire is deemed the maximum appropriate
research instrument since it enabled the collection of independent statistics from a small
and various pattern. it is also desired since it allowed the researcher to accumulate both
qualitative and quantitative information on the identical time. This look at makes use of a
5-factor Likert's measurement scale. Likert gadgets are used to measure respondents‘
attitudes to a selected query or announcement wherein the least value was 1 =Strongly
disagree, whilst the very best might be five=Strongly agree.
The questionnaire was structured into five sections with section one aimed at collecting
demographics data, section two contained data on how having a great vision and goals
influence performance of rugby clubs, Section three sought to ascertain how strategic
formulation influence the performance of rugby clubs in Kenya. Section four on the other
hand ascertained the impact of how implementation of strategic plan influence
performance of rugby clubs in Kenya. Section five looked at the performance of rugby
teams in Kenya.
3.5 Research Procedures
Saunders et al., (2007) stipulates that the questionnaire pretesting involves engaging in an
initial take a look at in data series to crosscheck the gear and techniques. To guarantee
that the tactics set up in the questionnaires have been appropriate, the research tools were
tested for validity and reliability via pilot testing. To check the validity of the research
questions used, after preparation of the questionnaire experts opinion could be sought to
assess the reliance of the content material. This permits the identity and revisions at the
questionnaire to ensure that the accumulated information was dependable and legitimate.
In this research the researcher pretested five questionnaires with five respondents
consequently assisting in ascertaining the accuracy and reliability of the instrument.
Therefore, successful outcome of the piloting test was useful to the researcher to decrease
questionnaire non-response. The questionnaire was administered via e mail, and physical
mail. An introduction letter from United States international university was issued to
respondent to inform them of the motive of the study, anonymity warranty, and
commitment to share the very last record.

29
3.6 Data Analysis Methods
Records analysis involves inspecting the facts that the researcher has accumulated and
making inferences or deductions out of it. It additionally entails reveling the underlying
structures of facts; checking out of the underlying assumptions and identifying
relationships and/or anomalies among variables (Kombo & Tromp, 2012). Quantitative
records evaluation includes measuring the numerical values of records, out of which
descriptions including general deviations and method are derived. This quantitative
records was analyzed by the use of the Statistical Package for Social Sciences (SPSS).
That is because SPSS had the capability of managing a large amount of records, and
given its huge spectrum of statistical procedures purposefully designed for social
sciences, it is also quite efficient (Martin and Kothari 2011).
The researcher used descriptive evaluation techniques to investigate facts. The descriptive
records which included mean and standard deviation was measured. To enable smooth
analysis, the questionnaires was first coded as per the variable in each question of the
observed. Coding involved assigning a numerical cost to a non-numerical variable to limit
the margin of error and assure accuracy throughout the statistics entry (Collis and Hussey,
2013). Both Pearson correlation and Multi linear Regression analyses was used to test for
the relationship among the independent variables and the structured variable.
Regression Model
Y = α + β1 VG + β2 (SF) + β3 (SP) + ε
Where the variables are defined as: Y -Peformance of rugby teams, VG–Visions and
Goals, SF–Strategy Formulation,SP- Strategy Planning, ε - Error termwhile β1, β2, and
β3 are coefficients of determination and ε is the error term. This generated quantitative
reports through tabulations, percentages, and measures of central tendency was displayed
in tables.
3.7 Chapter Summary
This chapter mentioned the method that guided the gathering and analysis of statistics in
this research. The research utilized the descriptive research design because it seeks to
examine the influence of strategic planning at the performance of rugby clubs in the
Kenya Cup. The research considered the studies populace of this research as 64 officers

30
of rugby clubs in Kenya arrived at via stratified random sampling. The study used the
questionnaire as the information series tool in this study; and elaborated on the way it
shall be constructed, pretested, and then used in collecting the data from the respondents.
The quantitative records accrued was analyzed by the use of the Statistical bundle for
Social Sciences (SPSS).
The following chapter (chapter four) analyzes, gives and interprets the findings of the
study in a scientific way as guided via the research questions. The analysis makes use of
only data gathered from the study.

31
CHAPTER FOUR
4.0 RESULTS AND FINDINGS
4.1 Introduction
This chapter presents the findings arrived at from the study. The chapter also shows the
results on respondent‘s demography by team played for, gender, role played, number of
staff, duration in the team and gross income.
4.1.1 Response Rate
The researcher distributed 64 questionnaires and only 52 were filled and returned. This
represents a response rate of 81 % as shown in table 4.1
Table 4.1: Response Rate
Questionnaires Number Percentage
Filled and collected 52 81
Non-Responded 12 19
Total 64 100
4.2 Demographic Information
This section presents results on demographic factors of the respondents who participated
in this research study.
4.2.1 Team Played
According to table 4.2, to analyse the respondents by team played for the data revealed
that Home Boyz, Impala, Harlequins, KCB and Mwamba had a high response rate at
13%, while Mean Machine and Nonde Script recorded 12%, Strathmore had the least
response at 10%. This is considered high compared to the fact that the sample required
per team was only 8 members.

32
Variable Frequency Percent
Nonde Script 6 12
Impala 7 13
Harlequins 7 13
KCB 7 13
Mwamba 7 13
Mean Machine 6 12
Home Boyz 7 13
Strathmore 5 10
Total 52 100.0
4.2.2 Age of Respondents
As indicated in figure 4.1, most of the players were aged between 18-25 years and this
represented 58% of the total respondents, those aged between 26-35 years represented
21%, and those who were under 18 years were 13%. The least respondents were from
those of 35-50 years and this represented 8%.
Figure 4.1: Age of Respondents
7
30
11
4
13
58
21
8
0
10
20
30
40
50
60
70
under 18 18-25yrs 26-35 yrs 36-50 yrs
frequency
percentage
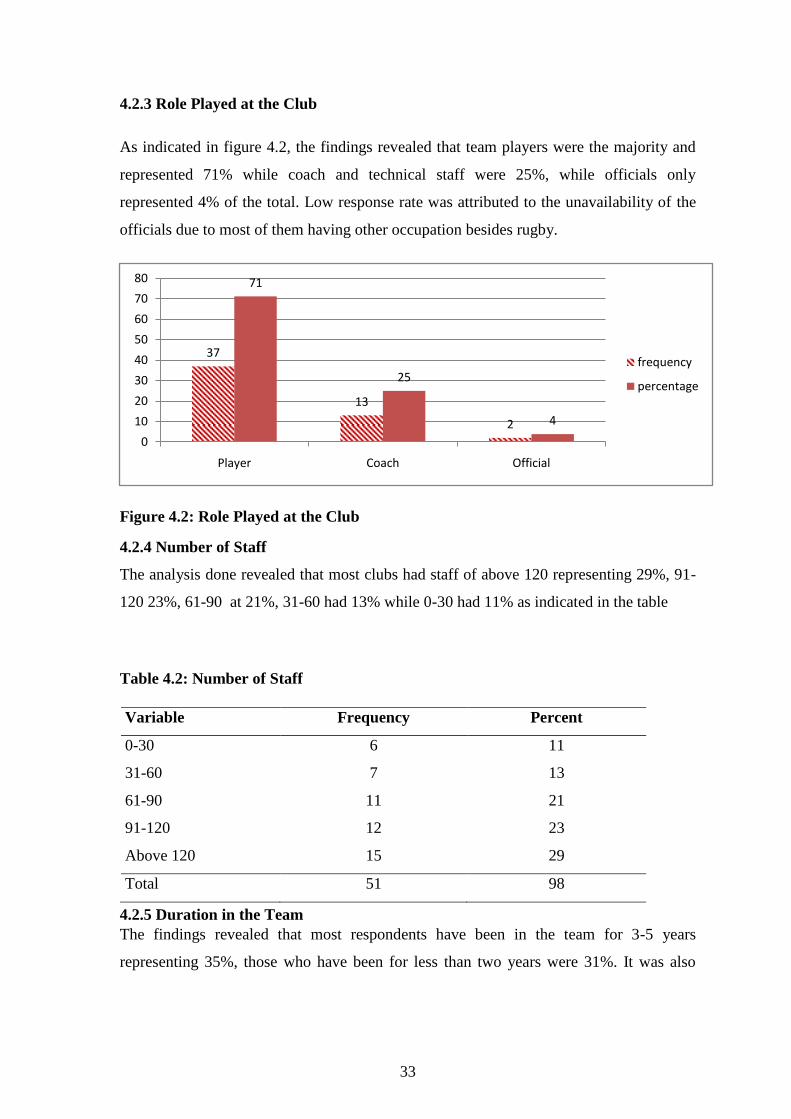
33
4.2.3 Role Played at the Club
As indicated in figure 4.2, the findings revealed that team players were the majority and
represented 71% while coach and technical staff were 25%, while officials only
represented 4% of the total. Low response rate was attributed to the unavailability of the
officials due to most of them having other occupation besides rugby.
Figure 4.2: Role Played at the Club
4.2.4 Number of Staff
The analysis done revealed that most clubs had staff of above 120 representing 29%, 91-
120 23%, 61-90 at 21%, 31-60 had 13% while 0-30 had 11% as indicated in the table
Table 4.2: Number of Staff
Variable Frequency Percent
0-30 6 11
31-60 7 13
61-90 11 21
91-120 12 23
Above 120 15 29
Total 51 98
4.2.5 Duration in the Team
The findings revealed that most respondents have been in the team for 3-5 years
representing 35%, those who have been for less than two years were 31%. It was also
37
13
2
71
25
4
0
10
20
30
40
50
60
70
80
Player Coach Official
frequency
percentage

34
established that 17% have been in the team for 11-14 years and those who have been in
the team for 6-10 years were 11% and those above 15 years represented 6% as indicated
Figure 4.3: Duration in the Team
4.2.6 Gross Income
As shown in table 4.3, the findings revealed that 61% of respondents earn between 0-
30,000. While 25% were in the income bracket 50,001-100,000 and 8% were in the above
100,000 scale. It was revealed that 6% earned a gross salary of Ksh 30,001-50,000.
Table 4.3: Gross Income
Variable Frequency Percent
0-30000 32 61
30001-50000 3 6
50001-100000 13 25
Above 100000 4 8
Total 52 100
4.3 Performance of Rugby Clubs in Kenya
31
35
11
17
6
less than 2
3-5
6-10
11-14
Above 15

35
The study sought to analyse the performance of rugby clubs in Kenya and to do so
respondents were asked a set of questions which they were to rate according to their
opinion.
4.3.1 Kenya Cups a club has won
Only three out of the twelve teams in the Kenya Cup have won more than 4 titles.
Table 4.4: Total Number of Kenya Cups Won
Variable Frequency Percent
0-4 9 75
5-8 1 8.3
9-12 1 8.3
17-20 1 8.3
Total 51 98
4.3.2 Wins in the Group Stages
The study revealed that 77% had worn the group stages 9-12 times, 11% had worn it 5-8
times while 6% had done so 13-17 times, with only 4% winning it 0-4 times and only 2%
winning it 17-20 times as indicated in table 4.5
Table 4.5: Wins in the Group Stages 2016/2017
Variable Frequency Percent
0-4 2 4
5-8 6 11
9-12 40 77
13-17 3 6
17-20 1 2
Total 52 100
4.3.3 Finish in Top Four
The study revealed that 65% had worn the group finished in the top four 2 times, 15% had
done so once and 10% had finished in that position thrice while 8% had never finished in
the top four, and 2% had finished in that position four times.
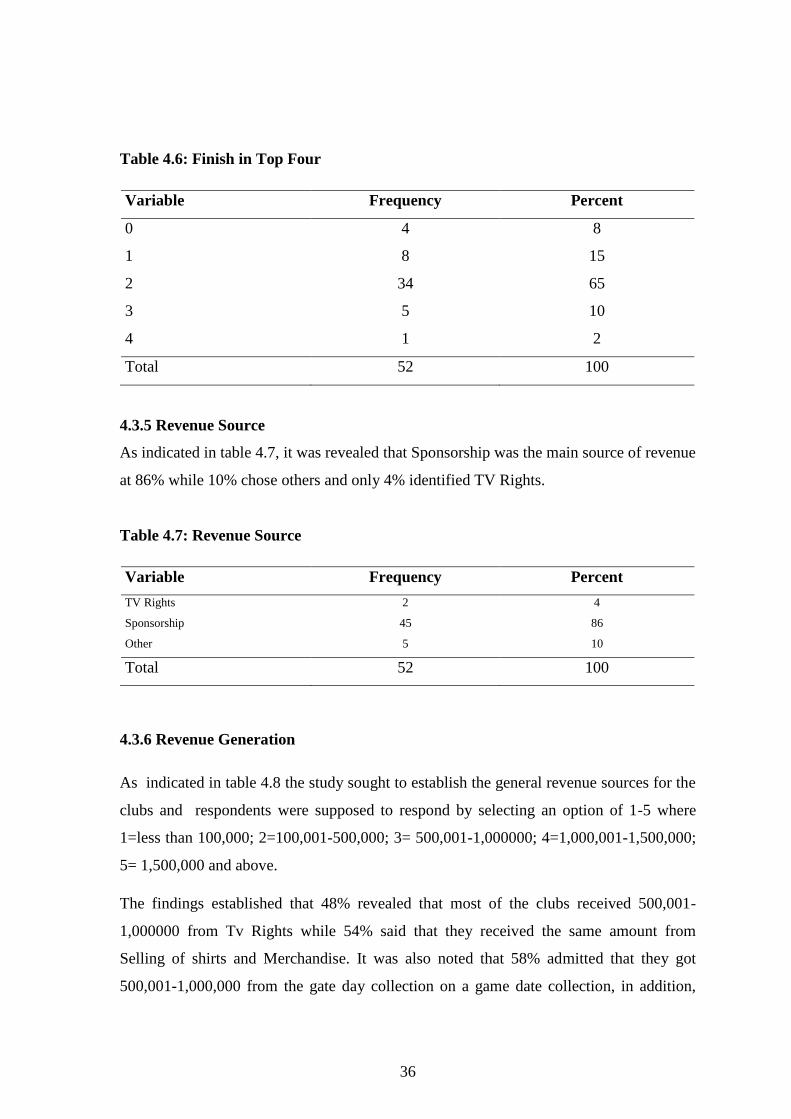
36
Table 4.6: Finish in Top Four
Variable Frequency Percent
0 4 8
1 8 15
2 34 65
3 5 10
4 1 2
Total 52 100
4.3.5 Revenue Source
As indicated in table 4.7, it was revealed that Sponsorship was the main source of revenue
at 86% while 10% chose others and only 4% identified TV Rights.
Table 4.7: Revenue Source
Variable Frequency Percent
TV Rights 2 4
Sponsorship 45 86
Other 5 10
Total 52 100
4.3.6 Revenue Generation
As indicated in table 4.8 the study sought to establish the general revenue sources for the
clubs and respondents were supposed to respond by selecting an option of 1-5 where
1=less than 100,000; 2=100,001-500,000; 3= 500,001-1,000000; 4=1,000,001-1,500,000;
5= 1,500,000 and above.
The findings established that 48% revealed that most of the clubs received 500,001-
1,000000 from Tv Rights while 54% said that they received the same amount from
Selling of shirts and Merchandise. It was also noted that 58% admitted that they got
500,001-1,000,000 from the gate day collection on a game date collection, in addition,

37
60% acknowledged that they received the same range of money from Participation in
2017cup.
Table 4.8: Revenue Generation
Variable 1 2 3 4 5
TV rights 36 10 48 0 2
Selling of shirts and Merchandise 31 13 54 2 0
Sponsorship 4 2 58 6 31
Gate collection 31 15 54 0 0
Participation in 2017 Cup 15 15 60 8 0
4.4 Effects of Vision and Goals on Performance
The study sought to analyse the Effects of Vision and Goals on Performance and to do so
respondents were asked a set of questions which they were to rate according to their
opinion. On a scale of 1-5 where; 1-Strongly Disagree; 2-Disgaree; 3-Neutral; 4-Agree;
and 5-Strongly Agree.
4.4.1 Descriptive Statistics on Effects of Vision and Goals on Performance
The finding revealed that 56% were uncertain about the clubs having multiple outlets to
sell shirts and other merchandise, 19% disagreed (M=2.71). It was also revealed that 54%
were uncertain that they invest in entertainment facilities like bars and restaurants to
increase revenue, 17% strongly disagreed while 13% strongly agreed (M=3.08).
The findings also show that 52% neither agreed nor disagreed that the club plan to invest
in its own stadium to control and increase revenue collection, 13% disagreed (M=3.02).
On the other hand, 40% were unaware if the club makes a lot of effort to promote the
team so as to increase the revenue generated by the gate collection, merchandise sold and
sponsorship, 6% strongly disagreed while 33% agreed (M=3.52).
The study also established that 33% strongly agreed that their clubs have a well stated
vision (M=3.79) and 39% strongly agreed that they have clear goals before Kenya cup
season starts, 39% agreed (M=4.06).

38
The results also show that 40% believed the goals are realistic (M=3.92), while 48%
agreed that goals are measurable (M=3.83). It was also established that 35% agreed and
23% strongly agreed that performance of a sports team is quantified by the amount of
competitions it wins (M=3.78). On the other hand, 33% strongly agreed that teams
performance is measured by the revenue generated (M=3.60), and 35% disagreed that the
team has been able to have a well outlined strategic plan due to its long duration of
existence, 10% strongly disagreed (M=2.75).
It was also revealed that 42% agreed that the technical team clearly communicates the
club goals at the beginning of the season while 21% strongly agreed (M=3.77), in
addition, 40% were uncertain if the officials are the ones who make the goals of the club,
21% agreed and 10% strongly agreed (M=4.15).
Table 4.9: Descriptive Statistics on Effects of Vision and Goals on Performance
Statement 1 2 3 4 5 M
Multiple outlets to sell shirts and other merchandise 11 19 56 10 2 2.71
Invest in entertainment facilities like bars and restaurants
to increase revenue
17 0 54 15 13 3.08
The club has a clear youth structure and academy to
develop talent
8 0 53 19 21 3.46
The club plan to invest in its own stadium to control and
increase revenue collection
13 10 52 11 13 3.02
The club makes a lot of effort to promote the team so as
to increase the revenue generated by the gate collection,
merchandise sold and sponsorship
6 4 40 33 17 3.52
Well stated vision 2 15 17 33 33 3.79
Clear goals before Kenya cup season starts 4 4 13 40 39 4.06
Goals are realistic 0 6 24 40 29 3.92
Goals are measurable 0 8 23 48 21 3.83
Performance of a sports team is quantified by the amount
of competitions it wins.
0 4
36 35 23 3.78
Teams performance is measured by the revenue
generated
6 4 36 33 21 3.60
The team has been able to have a well outlined strategic
plan due to its long duration of existence
10 35 35 13 8 2.75
The technical team clearly communicates the club goals
at the beginning of the season.
0 8 29 42 21 3.77
The officials are the ones who make the goals of the club 4 25 40 21 10 4.15
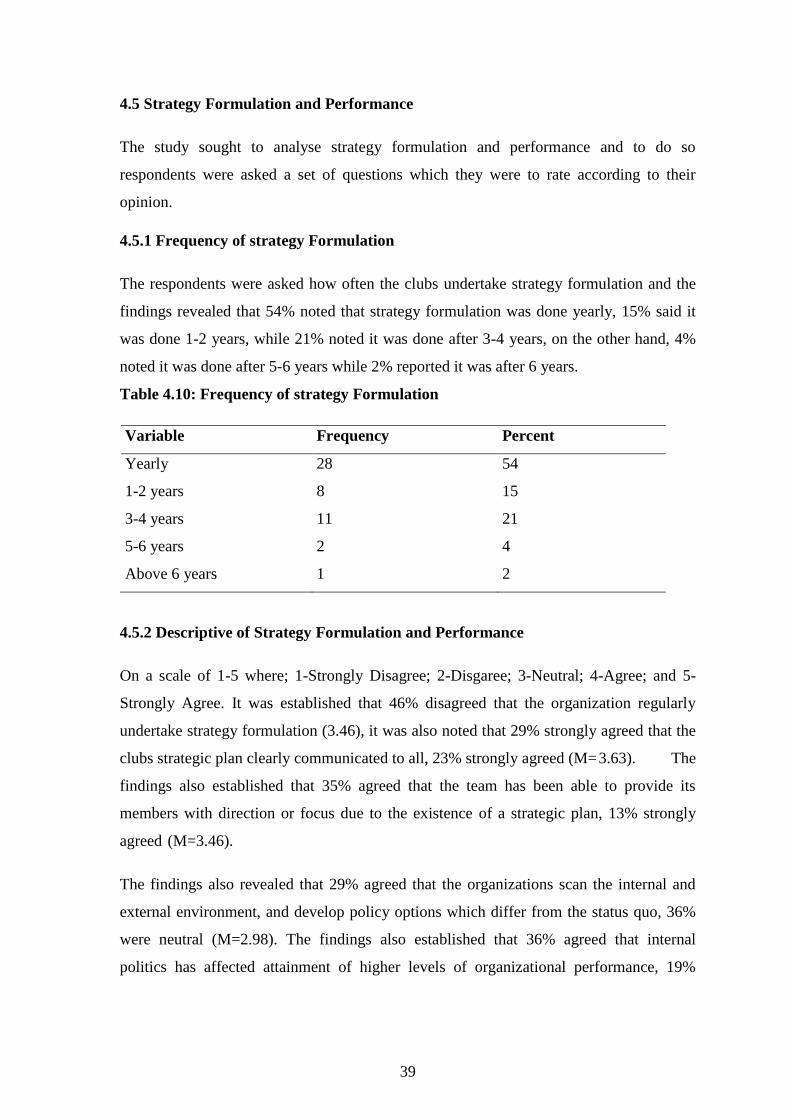
39
4.5 Strategy Formulation and Performance
The study sought to analyse strategy formulation and performance and to do so
respondents were asked a set of questions which they were to rate according to their
opinion.
4.5.1 Frequency of strategy Formulation
The respondents were asked how often the clubs undertake strategy formulation and the
findings revealed that 54% noted that strategy formulation was done yearly, 15% said it
was done 1-2 years, while 21% noted it was done after 3-4 years, on the other hand, 4%
noted it was done after 5-6 years while 2% reported it was after 6 years.
Table 4.10: Frequency of strategy Formulation
Variable Frequency Percent
Yearly 28 54
1-2 years 8 15
3-4 years 11 21
5-6 years 2 4
Above 6 years 1 2
4.5.2 Descriptive of Strategy Formulation and Performance
On a scale of 1-5 where; 1-Strongly Disagree; 2-Disgaree; 3-Neutral; 4-Agree; and 5-
Strongly Agree. It was established that 46% disagreed that the organization regularly
undertake strategy formulation (3.46), it was also noted that 29% strongly agreed that the
clubs strategic plan clearly communicated to all, 23% strongly agreed (M= 3.63). The
findings also established that 35% agreed that the team has been able to provide its
members with direction or focus due to the existence of a strategic plan, 13% strongly
agreed (M=3.46).
The findings also revealed that 29% agreed that the organizations scan the internal and
external environment, and develop policy options which differ from the status quo, 36%
were neutral (M=2.98). The findings also established that 36% agreed that internal
politics has affected attainment of higher levels of organizational performance, 19%

40
strongly agreed (M=3.52). Lastly, 19% strongly disagreed that the organization size has
influenced formulation in large firms compared to small ones, 27% disagreed (M=2.54).
Table 4.11: Descriptive of Strategy Formulation and Performance
Statement 1 2 3 4 5
Does the organization regularly undertake strategy
formulation?
0 10 46 33 11 3.46
Is the clubs strategic plan clearly communicated to all 0 11 36 29 23 3.63
The team has been able to provide its members with
direction or focus due to the existence of a strategic
plan
2 11 38 35 13 3.46
organizations scan the internal and external
environment, and develop policy options which differ
from the status quo.
2 31 36 29 2 2.98
Internal politics has affected attainment of higher levels
of organizational performance
10 4 31 36 19 3.52
organization size has influenced formulation in large
firms compared to small ones
19 27 38 11 4 2.54
4.6 Strategy Plan Implementation
The study also sought to analyse strategy plan Implementation and how it affected the
performance of rugby clubs, and to do so respondents were asked a set of questions which
they were to rate according to their opinion.
4.6.1 Frequency of Strategic Plan Review
The respondents were asked how often the clubs reviewed their strategic plan during
implementation, and the findings show that 60% did yearly review, 25% after 2-3 years,
11% Never review their plans, while 2% did reviews in 4-5 years
Table 4.12: Frequency of Strategic Plan Review
Variable Frequency Percent
Never 6 11

41
Yearly 31 60
2-3 Years 13 25
4-5 Years 1 2
4.6.2 Descriptive of Strategy Plan Implementation
The analysis show that 48% agreed that resource allocation influence strategic planning
(M=3.50), 42% were not certain of whether monitoring resources influences attainment of
results, 29% agreed (M=2.96). On the other hand, 46% agreed that resource allocation
influence strategic planning, 25% strongly agreed (M=3.87).
It was noted that monitoring resources influences attainment of results 42% agreed while
27% strongly agreed (M=3.87). The findings also revealed that 35% agreed that
leadership commitment influences attainment of results, 33% strongly agreed (3.88). The
officials leadership has a positive influence on the performance of the club 35% agreed
while 29% strongly agreed (M=3.83). To analyse if technical team (Coaches) leadership
has a positive influence on performance of the club, 29% agreed to the statement while
35% strongly agreed (M=3.83).
The study also established that the current team captains leadership has a positive
influence on performance of the club, 40% agreed while 33% strongly agreed (M=4.04).
The finding also revealed that 25% agreed while club has a distinct culture and tradition,
40% strongly agreed (M=3.98). The current culture in the club has a positive influence
on performance of the club while 19% agreed while 35% strongly agreed (M=3.77).
The findings also show that 40% agreed that the club has a traditional lifestyle of playing
rugby, 27% strongly agreed (M=3.83), and 19% agreed that people have invested in the
upgrade of facilities to facilitate strategy planning, while 17% strongly agreed (M=3.15).

42
Table 4.13: Descriptive of Strategy Plan Implementation
Statement 1 2 3 4 5 M
Resource allocation influence strategic planning 0 10 36 48 6 3.50
Monitoring resources influences attainment of
results
10 17 42 29 2 2.96
Resource allocation influence strategic planning 0 10 19 46 25 3.87
Monitoring resources influences attainment of
results
2 6 23 42 27 3.87
Leadership commitment influences attainment of
results
2 8 23 35 33 3.88
The officials leadership has a positive influence
on the performance of the club
0 10 27 35 29 3.83
The technical team (Coaches) leadership has a
positive influence on performance of the club.
0 15 21 29 35 3.83
Current team captain‘s leadership has a positive
influence on performance of the club.
0 2 25 40 33 4.04
The club has a distinct culture and tradition 0 10 23 25 40 3.98
The current culture in the club has a positive
influence on performance of the club.
2 8 36 19 35 3.77
The club has a traditional lifestyle of playing
rugby
4 4 25 40 27 3.83
We have invested in the upgrade of facilities to
facilitate strategy planning
10 19 35 19 17 3.15
4.7 Correlation of Vision and Goals, Strategic Formulation and Implementation Of
Strategic Plan On Performance
To determine the relationship a correlation was done between of vision and goals,
strategic formulation and implementation of strategic plan against performance of rugby
clubs in Kenya.The findings revealed that there was a positive relationship between
having a great vision and goals and performance of rugby clubs in Kenya (R=.050,
P=0.726); strategic formulation and performance of rugby clubs in Kenya (R=.093,
P=0.513);strategic plan and performance of rugby clubs in Kenya (R=.046, P=0.743),
however no variable was significant as indicated in table 4.14. This implies that with

43
every increase in vision and goals, strategic formulation and strategic plan, the
performance of rugby clubs in Kenya increases.
Table 4.14: Correlation of Vision and Goals, Strategic Formulation and
Implementation Of Strategic Plan On Performance
Variable Performance Vision and goals Formulation Plan
Implementation
performance
Pearson Correlation 1
Sig. (2-tailed)
visionand goals
Pearson Correlation .050 1
Sig. (2-tailed) .726
formulation
Pearson Correlation .093 .125 1
Sig. (2-tailed) .513 .378
plan
implementation
Pearson Correlation .046 .498** .440** 1
Sig. (2-tailed) .743 .000 .001
N 52 52 52 52
4.8 Regression Analysis Vision and Goals, Strategic Formulation and
Implementation Of Strategic Plan On Performance
The model summary as presented in Table 4.15 shows that strategy plan implementation,
strategy formulation, vision and goals explained 15.9% of the variability of performance
of rugby teams (R2 =0.159, F(3,48)=3.031, p<.05).
Table 4.15: Regression Analysis Vision and Goals, Strategic Formulation and
Implementation Of Strategic Plan On Performance
Model R R Square Adjusted
R Square
Std. Error
of the
Estimate
Change Statistics
R Square
Change
F Change df1 df2 Sig. F
Change
1 .399a .159 .107 .63199 .159 3.031 3 48 .038
a. Predictors: (Constant), Strategy Plan Implementation, Strategy Formulation, vision and goals
As shown in Table 4.16, the linear regression ANOVA showedthat strategy plan
implementation, strategy formulation, vision and goals statistically significantly predicted
the variability of performance of rugby teams F(3,48)=3.031, p=0.038

44
Table 4.16: ANOVAa of Vision and Goals, Strategic Formulation and Implementation
Of Strategic Plan On Performance
Model Sum of Squares df Mean Square F Sig.
1
Regression 3.632 3 1.211 3.031 .038b
Residual 19.172 48 .399
Total 22.803 51
a. Dependent Variable: performance
b. Predictors: (Constant), Strategy Formulation, vision and goals, Strategy Plan Implementation
The regression coefficient findings as indicated in Table 4.17 revealed that strategy plan
implementation (β=.048, p=0.766), vision and goals (β=.359, p=0.021), strategy
formulation (β=.055, p=0.702).
Table 4.17: Coefficient
Model Unstandardized Coefficients Standardized
Coefficients
t Sig.
B Std. Error Beta
1
(Constant) 1.143 .851 1.342 .186
Strategy Plan
Implementation .051 .170 .048 .300 .766
vision and goals .424 .178 .359 2.383 .021
Strategy Formulation .096 .251 .055 .384 .702
Based on the coefficients results, the general form of model equation established is as
follows: Y = 1.143+ 0.424VG + 0.096(SF) + 0.051(SP) + 0.63199
Where the variables are defined as: Y - Performance of rugby teams, VG – Visions and
Goals, SF – Strategy Formulation, SP- Strategy Planning. However only the variable
visions and goals was significant in explaining the variation in performance of the rugby
teams.
4.9 Chapter Summary
This chapter has presented the findings from the data analysed, based on the research
objectives of the study. Chapter five presents the discussions, recommendations from the
study.

45
CHAPTER FIVE
5.0 DISCUSSION, CONCLUSIONS AND RECOMMENDATIONS
5.1 Introduction
This chapter discusses results achieved in the study, this is done in line with previous
studies as discussed in the literature review. The chapter therefore discusses the findings,
and is able to draw conclusions, as well as make the necessary recommendations for
improvement and further studies.

46
5.2 Summary of Findings
The purpose of study was to establish the influence of strategic planning by rugby clubs
on their performance. The study was guided by the following questions: How does having
vision and goals influence performance of rugby clubs in Kenya? How does strategic
formulation influence the performance of rugby clubs in Kenya? How implementation of
strategic plan influence performance of rugby clubs in Kenya?
Descriptive research was used for this studyto investigate facts., the target population
were officials in the Rugby teams in the Kenyan league. According to the Kenyan rugby
union data there are currently 8 teams in the league as at June 2017. The respondents
included the Chairman, (Leaders) Head of the line, Head of pack, Flyhalf, Scramhalf,
Hooker, Coach and Assistant coach in each of the eight teams resulting into 64
respondents.The researcher distributed 64 questionnaires and only 52 were filled and
returned. This represents a response rate of 81 %.
The questions were structured and the questionnaire was deemed the most appropriate
research instrument since it enabled the collection of independent statistics from a small
and various pattern. The descriptive records which include mean and standard deviation
was measured. Both Pearson correlation and multiple Regression analysis was used to test
for the relationship among the independent and dependent variables.
The study established that 33% strongly agreed that their clubs have a well stated vision
(M=3.79) and 39% strongly agreed that they have clear goals before Kenya cup season
starts, 39% agreed (M=4.06).The results also show that 40% believed the goals are
realistic (M=3.92), while 48% agreed that goals are measurable (M=3.83). It was also
established that 35% agreed that performance of a sports team is quantified by the amount
of competitions it wins (M=3.78). On the other hand, 33% strongly agreed that teams
performance is measured by the revenue generated (M=3.60), and 35% disagreed that the
team has been able to have a well outlined strategic plan due to its long duration of
existence (M=2.75). It was also revealed that 42% agreed that the technical team clearly
communicates the club goals at the beginning of the season while 21% strongly agreed
(M=3.77).The findings revealed that there was a positive relationship between having a
great vision and goals and performance of rugby clubs in Kenya (R=.050, P=0.726).
The findings show that 54% noted that strategy formulation was done yearly, while 21%
noted it was done after 3-4 years. It was established that 46% disagreed that the
organization regularly undertake strategy formulation (3.46), it was also noted that 29%

47
strongly agreed that the clubs strategic plan clearly communicated to all (M=3.63). The
findings also established that 35% agreed that the team has been able to provide its
members with direction or focus due to the existence of a strategic plan (M=3.46). The
findings also revealed that 29% agreed that the organizations scan the internal and
external environment, and develop policy options which differ from the status quo
(M=2.98). The findings also established that 36% agreed that internal politics has affected
attainment of higher levels of organizational performance (M=3.52) and 27% disagreed
that the organization size has influenced formulation in large firms compared to small
ones (M=2.54).The findings revealed that there was a positive relationship between
strategic formulation and performance of rugby clubs in Kenya (R=.093, P=0.513).
The findings show that 60% reviewed their strategic plan yearly during implementation
and 25% after 2-3 years. The analysis also show that 48% agreed that resource allocation
influence strategic planning (M=3.50). On the other hand, 46% agreed that resource
allocation influence strategic planning (M=3.87). It was noted that monitoring resources
influences attainment of results and 42% agreed (M=3.87). The findings also revealed
that 35% agreed that leadership commitment influences attainment of results (3.88). The
officials leadership has a positive influence on the performance of the club 35% agreed
(M=3.83). To analyze if technical team (Coaches) leadership has a positive influence on
performance of the club, 35% strongly agreed (M=3.83). The study also established that
the current team captains leadership has a positive influence on performance of the club,
40% agreed (M=4.04). In addition, 40% strongly agreed that club has a distinct culture
and tradition (M=3.98), and 35% strongly agreed that the current culture in the club has a
positive influence on performance of the club (M=3.77). While 19% agreed that people
have invested in the upgrade of facilities to facilitate strategy planning, while 17%
strongly agreed (M=3.15). The findings revealed that there was a positive relationship
between strategic plan and performance of rugby clubs in Kenya (R=.046, P=0.743).
5.3 Discussion
5.3.1 Impact of Creation of Vision and Goals on Performance
The study established that 33% strongly agreed that their clubs have a well stated vision
(M=3.79). But the issue is not only about the creation and development but also about
seeking the value, meaning, and significance of vision and mission for management of

48
organizations and about their implementation. As the environment is constantly changing,
the theory of strategic management is developing as well.
The results also show that 40% believed the goals are realistic (M=3.92),while 48%
agreed that goals are measurable (M=3.83). A goal is a broad primary outcome, it is what
a person or an organization would like to accomplish (Mikal, 2013). Some of the key
characteristics of a great goal are realistic, measurable and timebound. Goals are meant to
be a tool that pushes an organization to attain its full potential. They are used as a means
to measure the performance and progress an organization makes (Erica Olsen, 2013).
It was also established that 35% agreed that performance of a sports team is quantified by
the amount of competitions it wins (M=3.78). On the other hand, 33% strongly agreed
that teams performance is measured by the revenue generated (M=3.60. Jones et al.
(2004) considered the winning and losing performances of a single team and found a
number of statistically and practically significant differences. For example, while ‗lineout
success on the opposition throw‘ differed significantly between winning and losing
performances, large observable (but nonsignificant) differences were apparent for a
number of performance indicators (Hughes & Bartlett, 2002) such as ‗turnovers won‘. A
similar study was undertaken by Ortega (2009), where analysis was undertaken on
indicators such as line breaks, possessions kicked and turnovers. These indicators were
then correlated to winning or losing performances in the Six Nations tournament and
significant differences were identified for winning performance.
The findings revealed that 35% disagreed that the team has been able to have a well
outlined strategic plan due to its long duration of existence (M=2.75). It was noted from
the literature that the relationship between strategic planning and organization age has
various components. For example, Loderer, Claudio and Urs Waelchli (2009) looked at
the effect of age on an organization‘s ability to change as well as the effect of age on
growth. Skrt and Antoncic (2004) investigated planning and growth. Others such as
Yusuf and Saffu (2009) directly assessed planning intensity with age and benefits
expected from planning for young firms compared to old ones. Another interesting area
was the relation between the planning horizon and organization age. Next is a
presentation of what was noted in the literature. In the management literature, Leonard-
Barton (1992) has pointed out that, when firms focus on core capabilities, they bring on
core rigidities that make it difficult to adapt to changes in their environment. Barton also

49
added that age could affect performance by inducing organizational inertia. Moreover, old
age may make knowledge, abilities, and skills obsolete and induce organizational decay
(Agarwal, Rajshree and Michael, 2002).
The findings revealed that there was a positive relationship between having a great vision
and goals and performance of rugby clubs in Kenya (R=.050, P=0.726). Thomas and
Quadrini (2001) offer a model that explains this observation. The intuition is that, as
capital increases over time, its marginal product declines. On the other hand, Skrt and
Antoncic (2004), as well as Miller and Cardinal (1994), found a positive relationship
between strategic planning and firm profitability and growth. Successful young firms
tend, to a large extent, to use advanced planning and activity analysis. Moreover, strategic
planning is a process that helps organizations to identify strategic issues and so to forecast
and prepare for the future, which will help organizations to grow (Zimmerer and
Scarborough, 1996).
5.3.2 Effect of Strategic Formulation on Performance
The findings show that 54% noted that strategy formulation was done yearly. Strategy
formulation is the process by which an organization chooses the most appropriate courses
of action to achieve its defined goals. This process is essential to an organization‘s
success, because it provides a framework for the actions that will lead to the anticipated
results. Strategic plans should be communicated to all employees so that they are aware
of the organization‘s objectives, mission, and purpose. Strategy formulation forces an
organization to carefully look at the changing environment and to be prepared for the
possible changes that may occur.
It was established that 46% disagreed that the organization regularly undertake strategy
formulation (3.46). Rational planning and logical incrementalism are the two main
models of strategy formulation in the management literature (Elbanna 2006). Where
neither of these approaches is present, organizations are likely to lack clearly discernable
processes, thereby exhibiting ‗strategy absence‘ (Inkpen and Choudhury 1995).
The findings also revealed that 29% agreed that the organizations scan the internal and
external environment, and develop policy options which differ from the status quo
(M=2.98). Prior large-scale experiments in rational planning in the public sector have not
been successful. For example, during the 1970s UK local government conducted a failed
50
experiment with widespread corporate planning (Boyne 2001). This and other failures to
implement rational planning are usually attributed to technical and political problems.
Recent evidence on planning among local authorities in Wales, suggests that technical
problems are more difficult to overcome than political factors (Boyne et al. 2004).
Despite these challenges, rational planning processes can provide a valuable framework
for the formulation of objectives and actions.
Evidence on the consequences of rational planning for organizational performance is,
however, mixed (Elbanna 2006). While the balance of the international research results
from the public, private and non-profit sectors leans towards a positive relationship
between planning and performance (Boyne and Gould-Williams 2003), ‗planning is
neither a necessary nor a sufficient condition for performance improvement‘ (Boyne et
al.,2004). The findings show that 27% disagreed that the organization size has influenced
formulation in large firms compared to small ones (M=2.54). Mintzberg (1994) argues
that formulation may be more important in large firms due to its ability to improve
coordination and control. Robbins (1990) added that size has its strongest effect on
organization structure up to a level of approximately 1500 employees. Behaviour
formalisation as well as organization complexity increases according to size up to this
level. After that, size becomes a less important determinant of structure as the
organization has already become highly formalised.
The findings revealed that there was a positive relationship between strategic formulation
and performance of rugby clubs in Kenya (R=.093, P=0.513). In empirical studies, the
linkage between strategy and performance is typically operationalized by using various
measures and explicit ideas of causality fuelled by Miles and Snow‘s (1978) idea of
strategic types and Porter‘s (1980) generic strategies. These studies offer workable
frameworks for distinguishing strategic types and for evaluating their impact on various
measures of performance (Luoma, 2015).
5.3.3 Influence of Implementation of Strategic Plan Influence Performance
The analysis also show that 48% agreed that resource allocation influence strategic
planning (M=3.50). The idea of the useful resource-based View (RBV) of a firm
illustrates this courting. truly, RBV considers a company as a collection of assets and
abilities (Montealegre, 2002; Coates and McDermott, 2002). To be extra precise, RBV
is the manner of maximizing the earnings thru highlighting strategic alternatives

51
and assigning the essential challenge of defining, enhancing, and implementing the
principal organizational assets to management or the decision makers (Fahy, 2003).
Finney et al. (2005) said that RBV implies that assets are the bottom of achievement for
corporations. in addition, for Coates and McDermott (2002), RBV well-known shows
that the success of a agency‘s approach depends on its series of assets. Certainly,
RBV assumes that a sustainable competitive benefit results from the desired
outputs of the control activities of the organization (Fahy, 2003).
On the other hand, 46% agreed that resource allocation influence strategic planning
(M=3.87). Many researchers have highlighted the importance of specializing in inner
strengths and weaknesses as a source of competitive gain, resulting in a better and more
favorable scenario. For instance, Barney (1986) mentioned that strategic alternatives
must be driven from an analysis of the special abilities and capabilities of the firm as
opposed to the company‘s external surroundings; further ―studying a company's talents
and talents can be a source of greater correct expectations‖. provide (1991)
diagnosed how changes in the external surroundings can justify the resources and
capabilities required as the regular base from which the company can determine its
identity. Grant additionally emphasized that a business should be defined based totally
on its skills to offer more potent method, instead being described according to the
requirements it goals to fulfill. Therefore, it is important for strategists and managers to
keep in mind that investigating a company‘s internal belongings provides a greater
affordable analysis for formulating techniques than concentrating on what the company
must do to fulfill demand (Lopez, 2005).
The findings also revealed that 35% agreed that leadership commitment influences
attainment of results (3.88). At strategic degree, leadership is the important thing trouble
dealing with businesses in the 21stcentury (eire & Hitt, 1999). Without powerful strategic
management, a company‘s capacity to attain or preserve a competitive advantage is
substantially limited. The conceptualization of management at strategic degree should be
based at the notion that the relational additives of management constitute the core of
strategic management. Moreover, the members of TMTs need to be taken into
consideration the important thing contributors within the strategic management system,
which conceivably should impact innovation methods at organizational level (Elenkov,
2008).
52
In addition, 40% strongly agreed that club has a distinct culture and tradition (M=3.98),
and 35% strongly agreed that the current culture in the club has a positive influence on
performance of the club (M=3.77). A main motive for the hobby in culture in the
business enterprise arises from the idea that certain organizational cultures lead to
high-quality organizational performance. Fantastic organizational overall performance is
dependent on the values of the organizational tradition being extensively
communicated and shared in the business enterprise. Firms with robust cultures
outperform people with weak cultures (Bipath, 2007). A good deal of the literature on
organizational culture and the performance of the agency indicates that tradition could
have giant high-quality monetary cost for an company (Barney, 1986). Consistency
between rules and movements as a robust determinant of culture is stimulated
through the ethics of the organization and without the right cultural nurturing,
organizations will be not able to produce sustainable effects and a lasting aggressive
benefit (Mendonca, 2001). For example, when Carlo Ancelotti went to Real Madrid to
manage the club, he learn Spanish so that he could communicate easily with they the
players, owners, media and fans. He also discovered that in Spanish culture, people have
lunch at 3pm unlike other countries where it is at 12pm or 1pm. Had to adapt to that
culture and no training took place at 3pm (Ancelotti, 2016)
5.4 Conclusion
5.4.1 Impact of Creation of Vision and Goals on Performance
The clubs need to maintain well stated vision and have clear goals before Kenya cup
season starts so as ensure all stake holders are aware of the expectation. The results
should be attainable and this can only be done by ensuring the goals remain realistic and
are measurable. While performance is measured by the amount of competitions won and
revenue generated teams should have a well outlined strategic plan to achieve these
objectives.
5.4.2 Effect of Strategic Formulation on Performance
Strategy formulation should be done regularly and the plan clearly communicated to all to
ensurethe team has a proper direction or focus. The clubs should scan the internal and
external environment in order to establish and mitigate any unforeseen challenges. In
addition, internal politics also affect attainment of higher levels of organizational
performance.
53
5.4.3 Influence of Implementation of Strategic Plan Influence on Performance
Strategic plan ought to be reviewed regularly, and enough resource allocated for the
process and monitored to ensure the attainment of results. The leadership in the clubs
have also shown commitment towards the attainment of results and such actions involves
the investment in the upgrade of facilities to facilitate strategy planning.
5.5 Recommendation
5.5.1 Recommendation for Improvement
5.5.1.1Impact of Creation of Vision and Goals on Performance
Clubs should at at all-time maintain a well stated vision and have clear goals for the
seasons. The plans need to be well outlined and proper communication done by the
technical team to all stake holders. The clubs also need to seek for ways to generate
revenues in order to facilitate attainment of the set goals.
5.5.1.2 Effect of Strategic Formulation onPerformance
Clubs should undertake regulator strategy formulation and the plan clearly communicated
to all, The clubs also need to minimize internal politics as it has an effect on the
attainment of higher levels of organizational performance.
5.5.1.3 Influence of Implementation of Strategic Planon Performance
Clubs need to do a regular review of the strategic plan and the necessary resource
allocated for strategic planning. In addition, the leadership need to show ample
commitment towards the attainment of this results. The clubs also need to do away with
culture and tradition that have a negative influence on their performance.
5.5.2 Recommendation for Further Studies
The aim of this study was to establish the influence of strategic planning by rugby clubs
on their performance. The findings show that resource plays a huge role in facilitation of
the process although for these clubs sponsorship is still the main revenue source. There is
therefore a need to undertake further research to establish the elements sponsors look for
before committing to a team. Similar studies also need to be done in other sports so as to
be able to generalize the findings.

54
REFERENCES
Agarwal, R & Gort M (2002). Firm product life cycles and firm survival, American
Economic Review, vol. 92, no. 2, pp. 184–190
Andrews, K. R. (1980). Directors' responsibility for corporate strategy'. Harvard Business
Review, 30.
Ansoff, H. I (1967). The evolution of corporate planning working paper, Graduate School
of Industrial Administration, Carnegie-Mellon University
Appell, A., & Baack, J. (1998). Using quality management for cultural transformation of
Chinese state enterprises: a case study. Journal of Quality Management, 3(2), 193-
210.

55
Banfield, E (1975) „Corruption as a feature of governmental organization‟, Journal of
Law and Economics, vol. 20, pp. 587–605.
Bantel, KA (1993) „Top team, environment, and performance effects on strategic
planning formality‟, Group & Organizational Management, vol. 18, no. 4, pp.
436–58.
Barnat, R. (2005). The Nature of Strategy Implementation. Fort Worth: Dryden Press.
Barney, J (1986). Firm resources and sustained competitive advantage, Journal of
Management, vol. 17, pp. 99–120.
Barney, J (1991). Firm resources and sustained competitive advantage, Journal of
Management, vol. 17, pp. 99–120.
Barney, J. (1991). Firm resources and sustained competitive advantage. Journal of
management, 17(1), 99-120.
Barney, J. B. (1995). Looking inside for competitive advantage. The Academy of
Management Executive, 9(4), 49-61.
Bartol, K, Martin, D, Tein, M and Matthews, G (2001) Management: A Pacific Rim
Focus, Sydney: McGraw-Hill.
Basic Overview of Various Strategic Planning Models (Carter McNamara,2006)
http://www.lebcounty.org/LCCJAB/Documents/Basic_Overview_of_Various_Str
ategic_Planning_Models.pdf
Bedeian, AG (1993) Management, Fort Worth: Dryden Press.
Bipath, M. (2007). The dynamic effects of leader emotional intelligence and
organizational culture on organizational performance (Doctoral dissertation,
University of South Africa).
Boulton, WR, Lindsay, WM, Franklin, SG and Rue, LW (1982) „How are companies
planning now? – a survey‟, Long Range Planning, vol. 15, no. 1, pp. 82–6.
Boyne, GA (2003) „Sources of Public Service Improvement: A Critical Review and
Research Agenda‟, Journal of Public Administration Research and Theory, vol.
13, no. 2, pp. 367–94.
Bresser, RK and Bishop, RC (1983) „Dysfunctional effects of formal planning: two
theoretical explanations‟, Academy of Management Review, vol. 8, pp. 588–99.
Coates, T. T., & McDermott, C. M. (2002). An exploratory analysis of new
competencies: a resource based view perspective. Journal of Operations
Management, 20(5), 435-450.

56
Collins, J.C. (2001) Built to Last: Successful Habits of Visionary Companies, New York:
Harper Business.
Collis, D. J., Montgomery, C. A., & Montgomery, C. A. (2004). Corporate strategy: A
resource-based approach. Boston, MA: Irwin/McGraw-Hill.
Cooley, TF & Quadrini, V (2001). Financial markets and firm dynamics, American
Economic Review, vol. 91, no. 5, pp. 1286–1310.
Davey (2011)
Delmar, F & Shane, S (2003) „Does Business Planning Facilitate the Development of
New Ventures? Strategic Management Journal, vol. 24, pp. 1165–1185.
Difference between goals and strategies (Differencebetween, 2017)
http://www.differencebetween.net/business/difference-between-goals-and-
strategies/
Dionne, S. D., & Jaussi, K. S., (2005). Diversity and demography in organizations: A
levels of analysis review of the literature. In Multi-level issues in organizational
behavior and processes (pp. 181-229). Emerald Group Publishing Limited.
Dobrev, SD and Carroll, GR (2003) „Size (and competition) among organizations:
modeling scale based selection among automobile producers in four major
countries 1885–1981, StrategicManagement Journal, vol. 24, no. 6, pp. 541–558.
Drago, W (1996) „Strategic Plan Intensity: Effectiveness in Different Contexts‟,
Management Research News, vol. 19, no. 1/2.
Eisenhardt, K. M. & Martin, J.A. (2000). Dynamic capabilities: what are they? Strategic
Management Journal, vol. 21, no. 10/11, pp. 1105–1121
England Golf Strategic Plan (Englandgolf,2017)
http://www.englandgolf.org/page.aspx?sitesectionid=353&sitesectiontitle=Strateg
ic+Vision+and+Goals&preview=1
Ernest & Young, 2015 ―The Economic Impact of the Premier League‖
Fahy, L. (2003). Evaluating the Research on Strategy Content. Journal of Management,
vol. 12, no. 2, pp. 167–173.
Finney, R. Z., Campbell, N. D., & Powell, C. M. (2005). Strategies and resources:
Pathways to success?. Journal of Business Research, 58(12), 1721-1729.
Ford, M.W. (2009). Size, structure and change implementation - An empirical
comparison of small and large organizations, Management Research News, vol.
32, no. 4, pp. 303-320.

57
Frederickson, HG (1984). Public administration and social equity, Public Administration
Review, vol. 50, no. 2, pp. 228–237.
Fredrickson, J.W & Mitchell, T.R. (1984) „Strategic decision processes:
comprehensiveness and performance in an industry with an unstable
environment‟, Academy of Management Journal, vol. 27, no. 2, pp. 399–423
Gibney, J., Copeland, S., & Murie, A. (2009). Toward a new'strategic leadership of place
for the knowledge-based economy. Leadership, 5(1), 5-23.
Goal Setting as an art form (Erica Olsen, 2013) https://onstrategyhq.com/resources/goal-
setting-as-an-art-form/
Grant, RM (1991) „Analysing Resources and Capabilities‟, Australian Strategic
Management: Concepts, Context and Cases, G Lewis, A Morkel and G Hubbard
(eds), Prentice Hall, New York, pp. 153–179.
Higgins, R.B (1985). Long Range Planning in the Mature Corporation, Strategic
Management Journal, vol. 2, no. 3, pp. 235–250.
Hill, C. W.,& Jones, G. R. (2004). Strategic management: theory: an integrated approach.
Cengage Learning.
History of Rugby in Kenya (Internewskenya, n.d)
http://www.internewskenya.org/multimediaweb/
Hitt, M. A., Ireland, R. D., Camp, S. M., & Sexton, D. L. (2001). Strategic
entrepreneurship: Entrepreneurial strategies for wealth creation. Strategic
management journal, 22(6‐7), 479-491.
https://www.youtube.com/watch?v=tQmo8dkNwbU&index=31&list=PLiuF9gP3C3AitO
DPPgniw9Wti5nrrxu8p
Hurd, W. L (1992). Quality in the Asia-Pacific region, International Journal of Quality &
Reliability Management, vol. 9, no. 3, pp. 14–20.
Ireland, R. D., & Hitt, M. A. (1999). Achieving and maintaining strategic competitiveness
in the 21st century: The role of strategic leadership. The Academy of Management
Executive, 13(1), 43-57.
Jooste, C., & Fourie, B. (2009). The role of strategic leadership in effective strategy
implementation: Perceptions of South African strategic leaders. Southern African
Business Review, 13(3), 51-68.
Katz, R. L. (1970). Cases and concepts in corporate strategy. Prentice Hall.

58
Keim, GD and Baysinger, BD (1988). The Efficacy of Business Political Activity:
Competitive Considerations in a Principal-Agent Context‟, Journal of
Management, vol. 14, no. 2, pp. 163–180.
Kemp, R (1990). The Need for Strategic Planning in the Public and Non-Profit Sector,
Management Research News, vol. 13, pp. 10–12.
Kenya Rugby Football Union, 2012 ―Kenya Rugby Historical Highlights" . History of
Rugby in Kenya
Kettle, D (2002) The Transformation of Governance: Public Administration for the
Twenty-first Century, MD: Johns Hopkins University Press.
Kukalis, S (1991) „Determinants of strategic planning systems in large organizations: a
contingency approach, Journal of Management Studies, vol. 28, no. 2, pp. 143–60.
Lawton, A, McKevitt, D and Millar, M (2000) „Coping with ambiguity: reconciling
external legitimacy and organizational implementation in performance
measurement, Public Money & Management, vol. 20, no. 3, pp. 13–19.
Leonard-Barton, D (1992) „Core capabilities and core rigidities: A paradox in managing
new product development, Strategic Management Journal, vol. 13, pp. 111–125.
Lindsay, W. M & Rue, L.W. (1980). Impact of the business environment on the long
range planning process: a contingency view, Academy of Management Journal,
vol. 23, pp. 385–4
Loderer, Claudio & Waelchli, U. (2009). Firm Age and Performance, Retrieved May 22
2017 from <http://ssrn.com/abstract=1342248>.
López, S. (2005). Competitive advantage and strategy formulation: The key role of
dynamic capabilities. Management decision, 43(5), 661-669.
Mahon, JE, Bigelow, B & Fahey, L (1994). Political Strategy: Managing the Social and
Political Environment, in L Fahey and RM Randall (eds), The Portable MBA in
Strategy, New York, Wiley.
Managing Technological and Innovation Project (Dr. K‘aol, 2016) page 31
Matthews, C. H & Scott, S.G. (1995) „Uncertainty and planning in small and
entrepreneurial firms: An empirical assessment, Journal of Small Business
Management, vol. 33, no. 4, pp. 34–52.
Merisalo-Rantanen, H., Nurmi, A., Bragge, J., & Tanner, L. (2007). A repeatable e-
collaboration process based on thinklets for multi-organization strategy
development. Group Decision and Negotiation, 16(4), 363.

59
Metta¨nen, P (2005). Design and implementation of a performance measurement system
for a research organization, Production Planning and Control, vol. 16, no. 2, pp.
178–88.
Mintzberg, H (1994). Rounding Out the Managers Job, Sloan Management Review, vol.
36, no.1, pp. 11–26.
Montealegre, R. (2002). A process model of capability development: Lessons from the
electronic commerce strategy at Bolsa de Valores de Guayaquil. Organization
Science, 13(5), 514-531.
Newman, WH and Wallender HW (1981). Managing not for profit enterprise, Academy
of Management Review, vol. 3, no. 1, pp. 24-31.
NFL Stadium Comparisons (Stadiumofprofootball,2017)
http://www.stadiumsofprofootball.com/comparisons/
Nichol, RL (1992). Get middle managers involved in the planning process, Journal of
Business Strategy, vol. 13, no. 3, pp. 26–32.
Notable UNC Alumni (chapehillrecorder,2012)
http://www.chapelhillrecorder.com/uncalumni/
Panico, S. (2004). Strategic incentives to human capital. Strategic Management Journal,
36(1), 37-52.Penrose, E. T. (1995). The Theory of the Growth of the Firm. Oxford
University Press, USA.
Pearce, J. A., Robinson, R. B., & Subramanian, R. (1996). Strategic management:
Formulation, implementation, and control. Chicago, Illinois: Irwin.
Pondy, L. R., & Mitroff, I. I. (1979). Beyond open system models of
organization. Research in organizational behavior, 1(1), 3-39.
Prasad, S & Tata, J (2003). The role of socio-cultural, political-legal, economic, and
educational dimensions in quality management, International Journal of
Operations and Production Management, vol. 23, no. 5, pp. 487–521.
Raiders Leaving Oakland Again, This time for Las Vegas
(nytimes,2017)https://www.nytimes.com/2017/03/27/sports/football/nfl-oakland-
raiders-las-fnvegas.html
Risseeuw, P. & Masurel, E. (1994). The role of planning and small firms: empirical
evidence from a service industry, Small Business Economics, vol. 6, pp. 313–22.
Robbins, S (1990) Organization Theory: Structure, Design, and Applications, 3rd edition,
Englewood Cliffs, New Jersey: Prentice Hall.

60
Robbins, S (1990) Organizational Behavior 9th ed., Pearson Education, Harlow.
Sanders, T. J., & Davey, K. S. (2011, January). Out of the leadership theory jungle: A
proposed meta-model of strategic leadership. In Allied Academies International
Conference. Academy of Strategic Management. Proceedings (Vol. 10, No. 1, p.
41). Jordan Whitney Enterprises, Inc.
Schendel, D & Hofer, CW (1978). Strategic Management: A New View of Business
Policy and Planning, Little Brown: Boston, MA
Serfontein, S., Basson, J. S., & Burden, J. (2009). Mapping a transformation from a
traditional to an entrepreneurial organization: a South African case: original
research. SA Journal of Human Resource Management, 7(1), 1-14.
Skrt, B. & Antoncic, B. (2004) ‗Strategic planning and small firm growth: An empirical
examination, Managing Global Transitions, 2(2), pp. 107–122.
Sosik, J. J. (2005). The role of personal values in the charismatic leadership of corporate
managers: A model and preliminary field study. The Leadership Quarterly, 16(2),
221-244.
Sosik, Jung, Berson, Thanassoulis, Boussofiane and Dyson, 1994
South Africa Rugby Union, 2014 ―Delivering Rugby‘s Future, Strategic Transformation
Plan‘‘
Sport Money: 2016 NFL Valuations (Forbes,2017) https://www.forbes.com/nfl-
valuations/list/#header:revenue_sortreverse:true
Steiner, G.A. (1979) Strategic Planning: What Every Manager Must Know, New York,
NY: Free Press.
Strategic Planning and SMART goal setting (BCSD,2010)
http://www.bcsd.org/m/content.cfm?subpage=54659
Strategy Implementation Process (Jeroen De Flander, 2016) https://jeroen-de-
flander.com/strategy-implementation-process/
Super Rugby Winners (Greg Stutchbury, 2016)
http://economictimes.indiatimes.com/news/sports/factbox-rugby-list-of-super-
rugby-winners/articleshow/57248750.cms
Tar Heels Announce Strategic Plan (Goheels,2013)
http://www.goheels.com/ViewArticle.dbml?ATCLID=205865095

61
The NFL brought in enough money last year to pay for 10 Pluto missions (SB Nation,
2015) http://www.sbnation.com/nfl/2015/7/20/9006401/nfl-teams-revenue-tv-
deal-7-billion
The NFL Split $7.2 Billion in Revenue sharing Last Year (Deadspin, 2015)
http://deadspin.com/the-nfl-split-7-2-billion-in-revenue-sharing-last-year-
1719217695
The World‘s Most Most Valuable Sports Teams 2016 (Forbes, 2016),
https://www.forbes.com/pictures/mli45fgemg/1-dallas-cowboys/#15e415e117b5
Theories of Strategic Planning (Jurgen Schmidt and Martyn Laycock,2009)
https://www.healthknowledge.org.uk/public-health-textbook/organization-
management/5d-theory-process-strategy-development/strategic-planning
Thompson, A.A & Strickland, AJ (1999) Strategic Management: Concepts and Cases,
11th edition, Irwin McGraw-Hill, Boston, MA.
Thompson, A.A. &, Quadrini .A. J (2001) Strategic Management: Concepts and Cases,
11th
edition, Irwin McGraw-Hill, Boston, MA.
UNC Athletics sets vision for next four years with strategic plan (chapelboro,2013)
http://chapelboro.com/news/unc-athletics-sets-vision-for-next-four-years-with-
strategic-plan
Understanding Goals, Strategy , Objectives and Tactics in the age of Social (Mikal
Belicove, 2013)
https://www.forbes.com/sites/mikalbelicove/2013/09/27/understanding-goals-
strategies-objectives-and-tactics-in-the-age-of-social/#67810fbb4c79
University of Wisconsin – Extension (UW,1998)
http://uwcc.wisc.edu/coopcare/docs/vision.pdf
Vision Statement (Ovidijus Jurevicius, 2013)
https://www.strategicmanagementinsight.com/tools/vision-statement.html
Weick, KE (1995) Sensemaking in Organizations, Thousand Oaks: Sage Publications.
What is a vision statement, (Paula Fernandes, 2017)
http://www.businessnewsdaily.com/3882-vision-statement.html
What is Ansoff Matrix ? (Ansoffmatrix,2013) http://www.ansoffmatrix.com/
Yusuf, A and Saffu, K (2009) „Planning practices, strategy types and firm performance in
the Arabian Gulf region‟, Education, Business and Society: Contemporary Middle
Eastern Issues, vol.2, no. 3, pp. 203–217.

62
Zimmerer, T.W. & Scarborough, N.N. (1996) Entrepreneurship And New Venture
Formation, Upper Saddle River, NJ: Prentice-Hall.
Poku, D. K. (2012). The Effect Of Strategic Planning On The Performance And
Operations Of The Agricultural Development Bank. Kwame Nkrumah University
of Science and Technology
Mukokho, A.A. (2012). The influence of strategic planning on performance of public
universities in Kenya: the case of university of Nairobi, Nairobi, KE: MBA Thesis
Akinyele S. T. & Fasogbon, O. I., (2007). Impact of Strategic Planning on Organizational
Performance and Survival. Research Journal of Business Management, 1: 62-71.
APPENDIX 1: QUESTIONNAIRE
SECTION A: GENERAL INFORMATION
1. What team do you play or work for?
Nondescripts Impala Harlequins KCBMwamba
Mean Machine Homeboys Strathmore
2. What is your age?
Under 18 yrs 18 – 25 yrs 26 – 35yrs 35 – 50yrs Above 50yrs
3. What role do you play at the club?
Player Coach/Technical Staff Official Administration Team Media
Commercial Revenue Generation
4. Please indicate the total number of staff at the club including the reserve players and

63
officials
0-30 31-60 61 - 90 91 - 120 above 120
5. Number of years in the team
Less than 2 3 – 5 6-10 11-14 above 15
6. Monthly Gross Salary for taking part in Kenya Cup (excluding bonuses and benefits)
0 – 30,000Ksh 30,001 – 50,000Ksh 50,000 – 100,000Ksh
above 100,000Ksh
SECTION B: PERFORMANCE OF RUGBY CLUBS IN KENYA (OFFICIALS
ONLY)
7. How many Kenya Cup titles has your team won
0-4 5-8 9-12 13-16 17-20
8. How many games did you win in the group stage of the Kenya Cup in 2017?
0-4 5-8 9-12 13-16
9. How many times has your team finished in the top 4 of the Kenya Cup league
standings in the past five years?
0 1 2 3 4 5
10. What is the Teams Main Source of Revenue?
Television Rights… Commercial Revenue (Selling Shirts & other Merchandise) .
Sponsorship Gameday Gate Collection Other
11. How much Revenue does the Team Generate from Television Rights in the 2017 Kenya Cup?
Less than 100,000Ksh … 100,001Ksh – 500,000Ksh __ 500,001Ksh – 1,000,000Ksh -
1,000,001Ksh – 1,500,000Ksh _ Above 1,500,000Ksh -
12. How much Revenue does the Team Generate from Commercial Revenue (selling shirts &
other merchandise) in the 2017 Kenya Cup?
Less than 100,000Ksh … 100,001Ksh–500,000Ksh +500,001Ksh – 1,000,000Ksh
1,000,001Ksh – 1,500,000Ksh Above 1,500,000Ksh
13. How much Revenue does the Team Generate from Sponsorship in the 2017 Kenya Cup?
Less than 100,000Ksh … 100,001Ksh –500,000Ksh __ 500,001Ksh – 1,000,000Ksh
1,000,001Ksh – 1,500,000Ksh +Above 1,500,000Ksh
14. How much Revenue does the Team Generate from Gameday Gate Collections in the 2017
Kenya Cup?
Less than 100,000Ksh … 100,001Ksh– 500,000Ksh __ 500,001Ksh -1,000,000Ksh
1,000,001Ksh-1,500,000Ksh Above 1,500,000Ksh
15. What is the Total Revenue the Team Generated from participating in the 2017 Kenya Cup?
Less than 1,000,000Ksh … 1,000,001Ksh – 5,000,000Ksh + 5,000,001Ksh-10,000,000Ksh
10,000,001Ksh – 15,000,000Ksh +Above 15,00,000Ksh

64
What is your level of agreement with the following statements on the effects ofvision and goals
influence performance of rugby clubs (5- Strongly agree, 4- Agree, 3-Neutral, 2-Disagree, 1-
Strongly Disagree)
Statement
Str
on
gly
Dis
ag
ree
Dis
ag
ree
Neu
tra
l
Ag
ree
Str
on
gly
Ag
ree
4 The club has multiple outlets to sell shirts and other
merchandise 1 2 3 4 5
5 The club invests in entertainment facilities like a bar
and restaurant to increase revenue 1 2 3 4 5
6 The club has a clear youth structure and academy to
develop talent 1 2 3 4 5
7 The club plans to invest in its own stadium to control
and increase its revenue collection 1 2 3 4 5
8 The club makes a lot of effort to promote the team so
as to increase the revenue generated by the Gate
Collections, Merchandise sold and Sponsorship
1 2 3 4 5
What other factor affect the team performance on pitch and revenue the club generates
____________________________________________________________________________
____________________________________________________________________________
_____________________________________________________________
SECTION C: How Vision and Goals influence performance of rugby clubs in
Kenya?
1.The organization has a well stated vision (where they expect the club to be in 5 years)? Strongly Disagree Disagree Neutral Agree Strongly Agree
1 2 3 4 5
2 The does the organization have clear goals before the Kenya Cup season starts? Strongly Disagree Disagree Neutral Agree Strongly Agree
1 2 3 4 5
What is your level of agreement with the following statements on the effects ofvision and
goals influence performance of rugby clubs (5- Strongly agree, 4- Agree, 3-Neutral, 2-
Disagree, 1- Strongly Disagree)
Statement
Str
on
gly
Dis
ag
ree
Dis
ag
ree
Neu
tra
l
Ag
ree
Str
on
gly
Ag
ree
4 The organizational goals are realistic, measurable and
timebound 1 2 3 4 5
5 The organizational goals are measurable 1 2 3 4 5 6 The organizational goals are timebound 1 2 3 4 5

65
7 Performance of a sports team is quantified by the amount
of competitions it wins. 1 2 3 4 5
8 Teams performance is measured by the revenue generated 1 2 3 4 5 9 The team has been able to have a well outlined strategic
plan due to its long duration of existence 1 2 3 4 5
10 The technical team clearly communicates the club goals at
the beginning of the season 1 2 3 4 5
11 The officials are the ones who make the goals of the club 1 2 3 4 5
What other factor of vision and goals affect performance of rugby team
________________________________________________________________________
________________________________________________________________________
_____________________________________________________________________
SECTION D: Strategic Formulation and Performance of Rugby Clubs
1. Does the organization regularly undertake strategy formulation?
Strongly Disagree Disagree Neutral Agree Strongly Agree
1 2 3 4 5
2. How often is it done?
Yearly 1-2 years 3-4 years 5-6 years above 6
3. Is the club‘s strategic plan clearly communicated to all members
Strongly Disagree Disagree Neutral Agree Strongly Agree
1 2 3 4 5
On a scale of 1-5 where; 1-Strongly Disagree; 2-Disgaree; 3-Neutral; 4-Agree; and 5-
Strongly Agree, indicate your level of agreement in relation to strategic formulation and
performance
Statement
Str
on
gly
Dis
ag
ree
Dis
ag
ree
Neu
tra
l
Ag
ree
Str
on
gly
Ag
ree
5 The team has been able to provide its members with
direction or focus due to the existence of a strategic
plan
1 2 3 4 5
6 organizations scan the internal and external
environment, and develop policy options which differ
from the status quo.
1 2 3 4 5
7 Internal politics has affected attainment of higher
levels of organizational performance 1 2 3 4 5
8 organization size has influenced formulation in a
negative way 1 2 3 4 5

66
What other staff competence factor affect strategy implementation in your organization
________________________________________________________________________
______________________________________________________________________
SECTION E: Strategic Plan Implementation and Performance of Rugby Clubs
1. Does the organization implement its strategy plan?
Strongly Disagree Disagree Neutral Agree Strongly Agree
1 2 3 4 5
2. How often is it reviewed during implementation?
Never Yearly 2-3 years 4-5 years above 5 years
3. How would you rate the resource allocation towards strategy planning?
Need improvement Not satisfied Not sure Satisfied Extremely satisfied
1 2 3 4 5
What is your level of agreement with the following statements in relation to the effect of
strategic planning on the performance? (5- Strongly agree, 4- Agree, 3-Neutral, 2-
Disagree, 1- Strongly Disagree)
Statement
Str
on
gly
Dis
ag
ree
Dis
ag
ree
Neu
tra
l
Ag
ree
Str
on
gly
Ag
ree
4 Resource allocation influence strategic planning 1 2 3 4 5 5.. Monitoring resources influences attainment of results 1 2 3 4 5 6. Leadership commitment influences attainment of
results 1 2 3 4 5
7. The official‘s leadership has a positively influence on
the performance of the club 1 2 3 4 5
8 The Technical team (coaches) leadership has a positive
influence on the performance of the club 1 2 3 4 5
9. Current team captain‘s leadership has a positive
influence on the performance of the club 1 2 3 4 5
10. The club has a distinct culture and tradition 1 2 3 4 5 11. The current culture in the club has a positive influence
on the performance of the club 1 2 3 4 5
12. The club has traditional style of playing rugby 1 2 3 4 5 13. We have invested in the upgrade of facilities to
facilitate strategy planning 1 2 3 4 5

67
What other strategy planning factors affect performance in your organization?
________________________________________________________________________
______________________________________________________________________