Embed Size (px)
Citation preview
26 Surface Science 138 (1984) 26-30
North-Holland, Amsterdam
THE INFLUENCE OF SILICON ON THE NON-EQUILIBRIUM SURFACE SEGREGATION OF CARBON IN AN Fe-Si 6.3 at% SINGLE CRYSTAL
J. DU PLESSIS, P.E. VILJOEN and F. BEZU~DENHOUT
~epartmenf of Physics, Un~vers~t~l of the Orange Free State, ~l~em~onfein 9300, Rep. of South Afn’cu
Received 30 September 1983; accepted for publication 1 December 1983
The non-equilibrium surface segregation of carbon to the (110) plane of an Fe-Si single crystal
was investigated as a function of temperature using Auger electron spectroscopy. It was found that
the segregation rates at high temperatures were lower than expected from an extrapolation of low
temperature segregation rates. This discrepancy is explained in terms of an interaction between the
carbon and silicon atoms on the surface.
I. In~odu~tion
The Fe-Si-C system received close attention from as early as 1949 when Darken 11-1 showed the influence of the addition of Si on the diffusion of carbon. With the advent of surface techniques for the investigation of materials properties, such as temper emb~ttlement of steels [21, the principles underlying the segregation of impurities could be well studied. Especially in the work of Lea and Seah [3], Guttman and McLean [4] and ~c~ahon IS], the various segregation properties were closely investigated. Guttman explained the effect of interaction between various alloying elements in a ternary system. In order to be able to disregard important parameters such as multiple interactions between the alloying elements and other factors like grain size and grain orientation, a simple Fe-Si 6.3 at% single crystal was chosen to study the segregation properties of the system. This investigation was reported previously 161. However, during the experimental procedure, carbon was noted on the surface. The non-equilibrium segregation of this impurity was determined especially to determine the influence of the silicon on the segregation of carbon.
2. Ex~rimental
The experimental setup was fully described previously 161. In short, it consisted of a sample mounted on a resistance heater inside a Physical
0039-6~28/84/$03.0~ 0 Elsevier Science Publishers B.V. ~North-Holland Physics Publishing Division)
J. du Plessis et al. / Si and non-equilibrium surface segregation of C 27
Electronics Auger/ESCA 548 ultrahigh vacuum system. Temperatures were measured by means of a chromel-alumel thermocouple spot-welded to the crystal. The Fe-% 6.3 at% single crystal was spark erosion cut and orientated to within 1” of the (110) plane. It was then mechanically and electrochemically polished. The carbon bulk concentration was 200 wt ppm.
The sample was heated in front of the cylindrical mirror analyzer. As in ref. [6], the temperature was stabilized at an elevated value for more than one hour. This was done to allow the bulk to replenish the depleted lavers (see Lea and Seah [7]). The sample was then Ar+ sputter cleaned and the increase of the carbon concentration monitored as soon as the argon ion gun had been switched off. The carbon Auger peak was repeatedly scanned by means of a multiplexing unit and the Auger peak-to-peak heights (APPH) were recorded against time. Using a scan rate of 10 eV/s, a high number of data points were accumulated thereby limiting the noise and smoothing the profile. Complete Auger spectra were taken before and after each segregation run to quantify the
multiplexer readings. The surface concentration is expressed as the C(272)/Fe(703) peak-to-peak ratios to eliminate all amplification differences.
3. Results and discussion
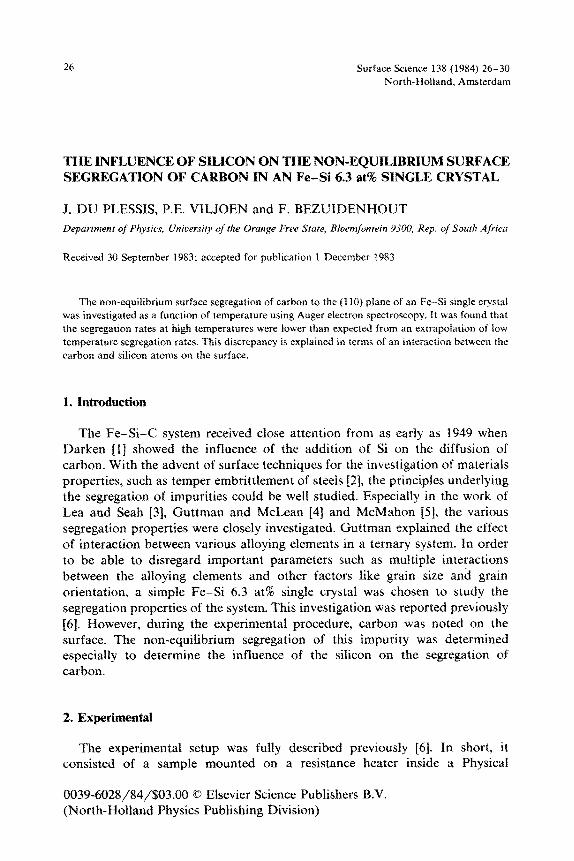
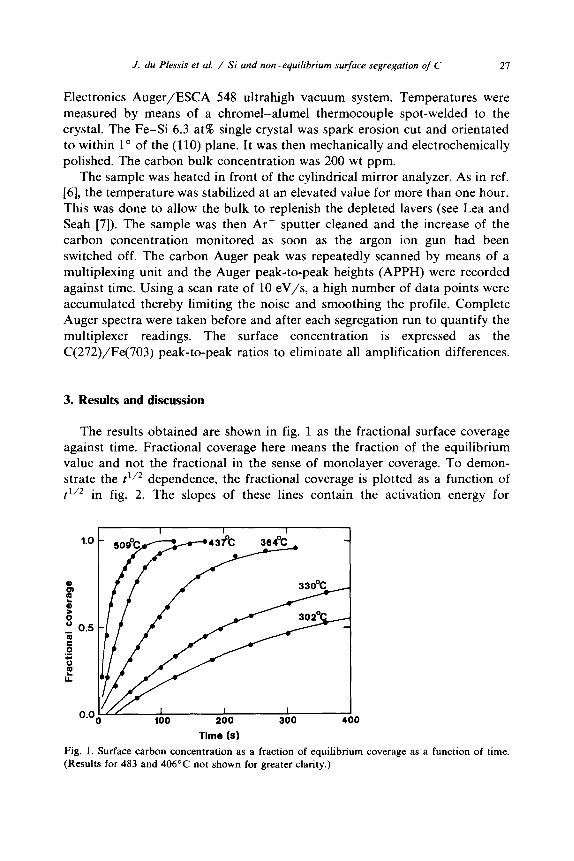
The results obtained are shown in fig. 1 as the fractional surface coverage against time. Fractional coverage here means the fraction of the equilibrium value and not the fractional in the sense of monolayer coverage. To demon- strate the t l/2 dependence, the fractional coverage is plotted as a function of
t”’ in fig. 2. The slopes of these lines contain the activation energy for
I I I
1.0 - 500”c 437% 364%
a8 e
330%
5 8 302O
0.5 z
s ‘Z c) c
IL II::----::;
o.oo go0 200 300 400
Time (8)
Fig. 1. Surface carbon concentration as a fraction of equilibrium (Results for 483 and 406°C not shown for greater clarity.)
coverage as a function of time.
J. du Plessis et al. / SI and non - equilibnum surface segregation of C
0.0: I I I
5 10 15 20
Tim& (s% )
Fig. 2. Surface carbon concentration as a fraction of equilibrium coverage plotted against t’j2 to
show this dependence.
diffusion, but since the equilibrium segregation values slowly diminished for higher temperatures, a correction factor must be taken into account to account for the differences in the equilibrium segregation values. If this is not done, the slope of the lines in fig. 2 will not correctly reflect the amount of carbon
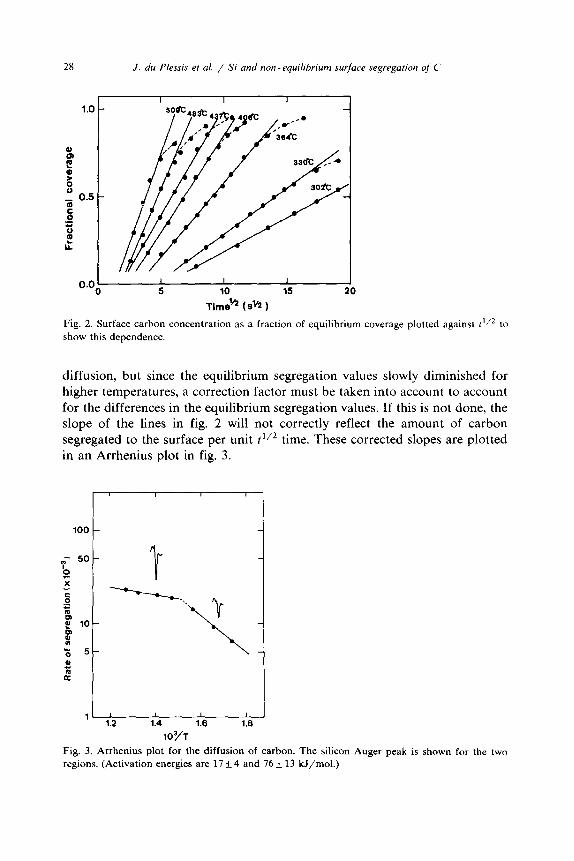
segregated to the surface per unit r ‘I2 time. These corrected slopes are plotted in an Arrhenius plot in fig. 3.
100 -
1 ’ 1 I 1 1.2 1.4 1.6 1.6
103/T
Fig. 3. Arrhenius plot for the diffusion of carbon. The silicon Auger peak is shown for the two regions. (Activation energies are 17 + 4 and 76 + 13 kJ/mol.)
J. du Plessis et al. / Si and non -equilibrium surface segregation of C 29
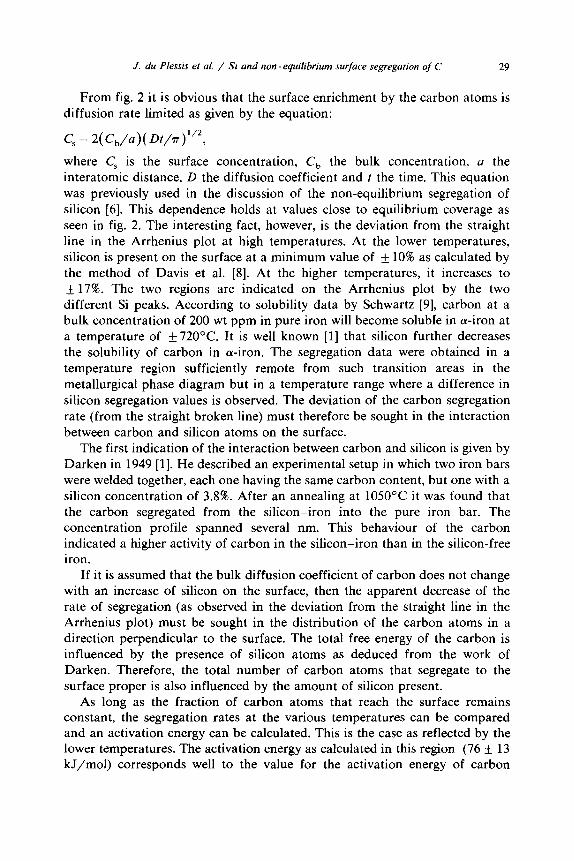
From fig. 2 it is obvious that the surface enrichment by the carbon atoms is diffusion rate limited as given by the equation:
c, = 2( C,/fJ)( Dt/7r)1’2,
where C, is the surface concentration, C, the bulk concentration, a the interatomic distance, D the diffusion coefficient and t the time. This equation
was previously used in the discussion of the non-equilibrium segregation of silicon [6]. This dependence holds at values close to equilibrium coverage as seen in fig. 2. The interesting fact, however, is the deviation from the straight line in the Arrhenius plot at high temperatures. At the lower temperatures, silicon is present on the surface at a minimum value of + 10% as calculated by the method of Davis et al. [8]. At the higher temperatures, it increases to L- 17%. The two regions are indicated on the Arrhenius plot by the two different Si peaks. According to solubility data by Schwartz [9], carbon at a bulk concentration of 200 wt ppm in pure iron will become soluble in a-iron at a temperature of +720°C. It is well known [l] that silicon further decreases the solubility of carbon in a-iron. The segregation data were obtained in a temperature region sufficiently remote from such transition areas in the metallurgical phase diagram but in a temperature range where a difference in
silicon segregation values is observed. The deviation of the carbon segregation rate (from the straight broken line) must therefore be sought in the interaction between carbon and silicon atoms on the surface.
The first indication of the interaction between carbon and silicon is given by Darken in 1949 [l]. He described an experimental setup in which two iron bars were welded together, each one having the same carbon content, but one with a silicon concentration of 3.8%. After an annealing at 105O’C it was found that the carbon segregated from the silicon-iron into the pure iron bar. The concentration profile spanned several nm. This behaviour of the carbon indicated a higher activity of carbon in the silicon-iron than in the silicon-free iron.
If it is assumed that the bulk diffusion coefficient of carbon does not change with an increase of silicon on the surface, then the apparent decrease of the rate of segregation (as observed in the deviation from the straight line in the Arrhenius plot) must be sought in the distribution of the carbon atoms in a direction perpendicular to the surface. The total free energy of the carbon is influenced by the presence of silicon atoms as deduced from the work of Darken. Therefore, the total number of carbon atoms that segregate to the surface proper is also influenced by the amount of silicon present.
As long as the fraction of carbon atoms that reach the surface remains constant, the segregation rates at the various temperatures can be compared and an activation energy can be calculated. This is the case as reflected by the lower temperatures. The activation energy as calculated in this region (76 + 13 kJ/mol) corresponds well to the value for the activation energy of carbon
30 J. du Plessis et al. / Si and non -equilibrium surface segregation of C
diffusion in pure a-iron as given by Guy [lo], i.e. 76 kJ/mol. At higher temperatures, the higher silicon concentration further reduces the total number of carbon atoms in the surface itself. It is believed that in a manner similar to the Darken experiment, carbon atoms segregate to the surface region, but are dispersed over several atomic layers in the near surface region not detectable by Auger electron spectroscopy. The rate of segregation (as limited by the
diffusion in the bulk) thus remains the same, but fewer carbon atoms are detected in the surface region, thus lowering the apparent bulk to surface segregation rate as reflected in the Arrhenius plot. This assumption is sup- ported by the work of Hofmann and Erlewein [ll] who showed, using a fundamental approach, that the surface free energy value does not change the initial rate of segregation.
4. Conclusion
The rate of segregation of carbon in an Fe-Si single crystal was shown to be bulk diffusion limited for low temperatures. At higher temperatures, the
apparent low rate of segregation was explained in terms of an interaction between silicon and carbon atoms analogous to the Darken experiment which
leads to too low surface concentration values as measured by AES. In the low temperature limit, the activation energy of diffusion of carbon in the Fe-Si 6.3 at% single crystal was determined as 76 + 13 kJ/mol, which corresponds well to an accepted value.
References
[l] L.S. Darken, Trans. AIME 180 (1949) 430. [2] M. Guttman, Metal Sci. 10 (1976) 337.
[3] C. Lea and M.P. Seah, Scripta Met. 9 (1975) 583.
[4] M. Guttman and D. McLean, in: Interfacial Segregation, Eds. W.C. Johnson and J.M. Blakely
(American Society for Metals, Metals Park, OH, 1979).
[5] C.J. McMahon, Jr., J. Vacuum Sci. Technol. 15 (1978).
[6] J. du Plessis and P.E. Viljoen, Surface Sci. 131 (1983) 321.
[7] C. Lea and M.P. Seah, Phil. Mag. 35 (1977) 213.
[8] L.E. Davis, N.C. McDonald, P.W. Palmberg, G.E. Riach and R.E. Weber, Eds., Handbook of Auger Electron Spectroscopy, 2nd ed. (Physical Electronics Division, Perkin-Elmer Corp.,
Eden Prairie, MN, 1978).
[9] J.C. Schwartz, Trans. Met. Sot. 245 (1969) 1083.
[lo] A.G. Guy, Elements of Physical Metallurgy (Addison-Wesley, 1960).
[ll] S. Hofmann and J. Erlewein, Surface Sci. 77 (1978) 591.