Embed Size (px)
Citation preview
lable at ScienceDirect
Estuarine, Coastal and Shelf Science 90 (2010) 55e60
Contents lists avai
Estuarine, Coastal and Shelf Science
journal homepage: www.elsevier .com/locate/ecss
The influence of shrimp farms organic waste management on chemical waterquality
Carlos Augusto Ramos e Silva a,*, Pablo Bezerra Dávalos a, Leonel da Silveira Lobo Sternberg b,Flavo Elano Soares de Souza c, Maria Helena Constantino Spyrides d, Paulo Sérgio Lucio d
aDepartamento de Oceanografia e Limnologia (Laboratório de Biogeoquímica Ambiental), Universidade Federal do Rio Grande do Norte, Natal/RN, CEP 59075-970, BrazilbDepartment of Biology, University of Miami, Coral Gables, FL 33124, USAcDepartamento de História e Geografia, Universidade Federal do Rio Grande do Norte, Caicó/RN, CEP 59300-000, BrazildDepartamento de Estatística, Universidade Federal do Rio Grande do Norte, Natal/RN, CEP 59078-970, Brazil
a r t i c l e i n f o
Article history:Received 15 June 2010Accepted 27 August 2010Available online 9 September 2010
Keywords:shrimp farmingenvironmental impactorganic pondsemi-intensive pondintensive pond
* Corresponding author. Present Address: DepartaUniversidade Federal Fluminense, Caixa Postal 10064Brazil.
E-mail address: [email protected] (C.A. Ram
0272-7714/$ e see front matter � 2010 Elsevier Ltd.doi:10.1016/j.ecss.2010.08.014
a b s t r a c t
We evaluated the physicalechemical properties and nutrient concentrations in two shrimp ponds underconventional management, intensive (I-P) and semi-intensive (SI-P), and one under organic management(O-P), three days after loading and before stoking. The mean’s total alkalinity concentrations were2.26 � 0.04 mM, 2.28 � 0.01 mM and 2.59 � 0.01 mM, respectively for I-P, SI-P and O-P. Bicarbonate andcarbonate accounted for 62% and 37% in I-P, 64% and 36% in SI-P and 83e17% in O-P, respectively.Aragonite and calcite were oversaturated around U ¼ 5. Mean total phosphate (TP) concentrations were441.37 � 92.06 mg/L, 449 � 48 mg/L and 473.64 � 84.17 mg/L, under I-P SI-P and O-P managementrespectively. Following this sequence, NO3
� concentration was 2.98 � 0.7 mg/L, 1.16 � 0.16 mg/L and0.32 � 0.12 mg/L, under I-P, SI-P and O-P management respectively. Thus, the data suggest that differentmanagement of farm organic waste leads to different chemical water quality.
� 2010 Elsevier Ltd. All rights reserved.
1. Introduction
From 1999 to 2004, Brazilian shrimp exports showed a 24-foldincrease (from 1941 ton to 48,302 ton) (ABCC, 2004). The state ofRio Grande do Norte (RN) exhibits vast potential for shrimp cultureand accounted for approximately 41% of total shrimp exports in2004. The conventional intensive (I-P) and semi-intensive (SI-P)shrimp farming industry in RN started in 1970, while the organic(O-P) shrimp farming industry initiated activities in 2002. Thedifferences between conventional (intensive or semi-intensive) andorganic shrimp farming are well known (Rönnbäck, 2003; Cohenet al., 2005; Cuoco, 2005).
In any aquatic system, nutrients, total alkalinity (TA), pH anddissolvedoxygen (DO) are critical towater quality. Factors such as TAand pH are closely linked with the inorganic carbon cycle (Millero,2001; Ramos e Silva et al., 2004). The pH affects the speciation ofchemical elements (Millero, 1996) and dissolved oxygen reflectsbiological production and biological respiration in aquatic systems(Chester, 1990). All of these parameters are potentially affected byintensive, semi-intensive and organic shrimp farmingmanagement
mento de Biologia Marinha,4, CEP 24020-970, Niterói/RJ,
os e Silva).
All rights reserved.
practices since theydiffer in their useof chemical agents (Clay,1996).Therefore, some know how on chemical and physicalechemicalbehavior on shrimp farms is very important for determiningmanagement practices that will make the shrimp industry moresustainable by lowering its environmental impact.
Shrimp farming can affect the environment in two major ways:the discharge of harmful waste, such as fertilizers and otherchemicals (Lacerda et al., 2006), and mangrove deforestation. Theconsequences of these impacts are exemplified by the eutrophi-cation phenomenon (changes in nutrient cycle and oxygen deple-tion and by the degradation of estuarine water quality available foreither human use or aquaculture activities).
In this work, a number of nutrients and physicalechemicalfactors in brackish water shrimp ponds were measured ina conventional (intensive and semi-intensive) and organic systemin order to understand the effects of these different managementpractices on pond water quality.
2. Material and methods
2.1. Study site
The Guaraira lagoon complex (GUR) lies about 90 km south ofNatal, Brazil (06�050S and 06�150S; 35�000W and 35�150W) (Fig. 1).
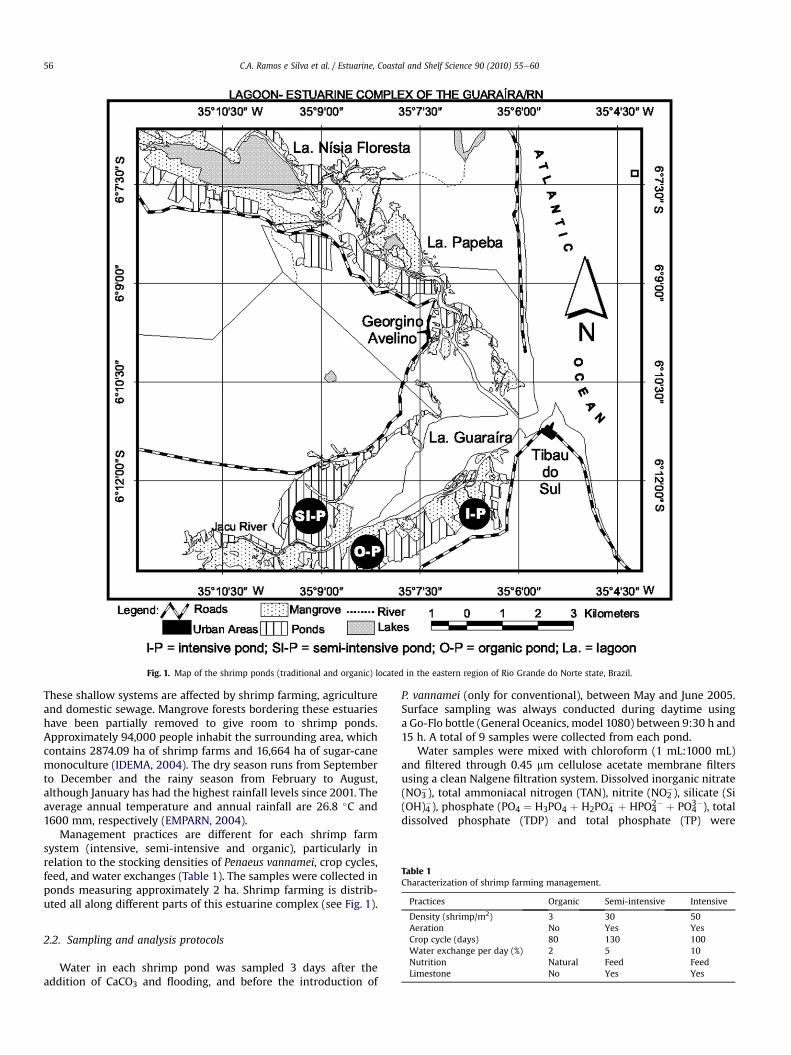
Fig. 1. Map of the shrimp ponds (traditional and organic) located in the eastern region of Rio Grande do Norte state, Brazil.
Table 1Characterization of shrimp farming management.
Practices Organic Semi-intensive Intensive
C.A. Ramos e Silva et al. / Estuarine, Coastal and Shelf Science 90 (2010) 55e6056
These shallow systems are affected by shrimp farming, agricultureand domestic sewage. Mangrove forests bordering these estuarieshave been partially removed to give room to shrimp ponds.Approximately 94,000 people inhabit the surrounding area, whichcontains 2874.09 ha of shrimp farms and 16,664 ha of sugar-canemonoculture (IDEMA, 2004). The dry season runs from Septemberto December and the rainy season from February to August,although January has had the highest rainfall levels since 2001. Theaverage annual temperature and annual rainfall are 26.8 �C and1600 mm, respectively (EMPARN, 2004).
Management practices are different for each shrimp farmsystem (intensive, semi-intensive and organic), particularly inrelation to the stocking densities of Penaeus vannamei, crop cycles,feed, and water exchanges (Table 1). The samples were collected inponds measuring approximately 2 ha. Shrimp farming is distrib-uted all along different parts of this estuarine complex (see Fig. 1).
Density (shrimp/m2) 3 30 50Aeration No Yes YesCrop cycle (days) 80 130 100Water exchange per day (%) 2 5 10Nutrition Natural Feed FeedLimestone No Yes Yes
2.2. Sampling and analysis protocols
Water in each shrimp pond was sampled 3 days after theaddition of CaCO3 and flooding, and before the introduction of
P. vannamei (only for conventional), between May and June 2005.Surface sampling was always conducted during daytime usinga Go-Flo bottle (General Oceanics, model 1080) between 9:30 h and15 h. A total of 9 samples were collected from each pond.
Water samples were mixed with chloroform (1 mL:1000 mL)and filtered through 0.45 mm cellulose acetate membrane filtersusing a clean Nalgene filtration system. Dissolved inorganic nitrate(NO3
�), total ammoniacal nitrogen (TAN), nitrite (NO2�), silicate (Si
(OH)4�), phosphate (PO4 ¼ H3PO4 þ H2PO4� þ HPO4
2� þ PO43�), total
dissolved phosphate (TDP) and total phosphate (TP) were
C.A. Ramos e Silva et al. / Estuarine, Coastal and Shelf Science 90 (2010) 55e60 57
determined by spectrophotometry using a Varian Cary 100 UVevisSpectrophotometer (Ramos e Silva, 2004). Total dissolved phos-phate and total phosphate were previously treated using a potas-sium persulfate (K2S2O8) digestion solution, according to Grasshoffet al. (1983). Un-ionized ammonia (NH3) was calculated frommeasurements of temperature, salinity, pH and TAN (Millero, 1996;Ramos e Silva, 2004) using AQM software (Análises QuímicasMarinhas). Standards for all analysis were made in deionized waterand the accuracy of repeated analysis (n ¼ 10) showed goodagreement. All analyses were considered satisfactory given a rela-tive error lower than 10% for nutrient determinations.
Oxygen concentrations were determined in water collected in300 mL BOD reagent bottles (Kimble), according to a modifiedWinkler method (Grasshoff et al., 1983).
Samples for chlorophyll-a (Chl-a) determination were filteredon board throughWhatman 45 mm diameter glass-fiber GF/C filterpapers, and the filters were stored in the cool and dark for less than24 h before analysis. Chlorophyll-a was determined in the labora-tory by spectrophotometry, according to the methods described inStrickland and Parsons (1972).
The pH was determined in water collected as above, accordingto the methodology proposed by Millero et al. (1993) and Millero(1996) for estuarine waters, where Tris buffer was signed in thelab with the m-cresol purple indicator (Clayton and Byrne, 1993;DOE, 1994; Melissa et al., 1999) through a Varian Cary 100UVevis spectrophotometer and AQM software. The batch of bufferwas stored according to Nemzer and Dickson (2005). All pH valuesrefer to 25 �C to avoid the temperature effect of pH (Pérez andFraga, 1987) and the pH values were later corrected to ambienttemperature.
Total alkalinity was determined in water collected in 300 mLBOD reagent bottles (Kimble), mixed with mercuric chloride, HgCl2,(DOE., 1994), using the open cell titration system software. Thesaturation state of aragonite and calcite was obtained using AQMsoftware (Análises Químicas Marinhas).
Salinity was determined by the salinityechlorinity relationship(S ¼ 1.80655 � Cl) using IAPSO Standard Seawater (P 137) forcalibration and the results were calculated according to Millero(1997) by AQM software.
One way ANOVA was used for each response variable to finddifferences among shrimp ponds. For cases where ANOVAassumptions were not met, Kruskal Wallis non-parametric testswere performed. A graphical tool known as Chernoff (1973) Faceswas used to identify similarities among the shrimp ponds.
3. Results and discussion
3.1. Physicalechemical variations
Table 2 summarizes the physicalechemical variations found ineach pond studied. The temperatures of I-P, SI-P and organic O-Pponds showed no significant differences (p > 0.05). This tempera-ture uniformity is due to the similar depth (z80 cm), area (z2 ha)and geographical location of the ponds, providing the same heat
Table 2Physical and physico-chemical parameters of this work and from literature data.
MGT Source Temp Salinity
O-P This work (29.4e36.7) (13.9e16.5)33.0 � 3.0 15.0 � 0.7
SI-P This work (29.7e35.7) (18.5e19.7)31.7 � 2.0 18.7 � 0.4
I-P This work (29.0e35.4) (21.4e22.7)32.0 � 2.4 22.3 � 0.6
capacity (Cp ¼ dH/dT) to each (Millero, 2001; Ramos e Silva, 2004).This temperature range was higher than that found at the GUR(26.4e27.1 �C), whose water supplies the ponds (Ramos e Silva,unpublished data).
The average salinity of the three ponds remained below 23.0 g/kg and was strongly influenced by the rainfall (1310 mm) duringthe sampling months (May and June of 2005). The individual pondaverage salinity varied significantly, as follows: I-P ¼ 22.3 � 0.2 g/kg, SI-P¼ 18.7� 0.1 g/kg and O-P¼ 15.0� 0.2 g/kg (p< 0.05). Thesevariations may be a result of the slight difference in depth and pondlocation in relation to the estuary mouth. These values are in thesame range as that found for the GUR (0.7e35.7 g/kg) for the rainyand dry seasons respectively (Ramos e Silva, unpublished).
Average pH values varied slightly among ponds: I-P ¼ 8.76 � 0.03, SI-P ¼ 8.80 � 0.03 and O-P ¼ 8.39 � 0.04. It is wellknown that the relationship between the amount of bicarbonateand carbonate to pH is well defined if the system is at equilibriumwith the atmosphere. The first and second dissociation constants(k1 and k2), which describe the dissociation of H2CO3 to HCO3
� andthe dissociation of HCO3
� to CO32�, show a positive correlation with
salinity (Pankow, 1991; Gómez-Parra and Forja, 1994; Millero,1996). The correlations between salinity and constants k1 and k2were not determined since salinity varied little within each pond.At any rate, we believe that themanagement practices in each pondare responsible for the values of constants k1 and k2. For example,the addition of CaCO3, ranging from 1000 kg/ha to 2000 kg/ha(Egna and Boyd, 1997), may affect constants and causes pH valuesto rise mainly because much of the carbonate combines with Hþ toform bicarbonate.
Hþ þ CO32�(added) / HCO3
�
A rise in pH may also be caused by other reactions in the ponds,when CaCO3 dissolves in water, such as:
CaCO3(s) (added) 4 Ca2þ þ CO32�
CO32� þ H2O 4 HCO3
� þ OH�
The amount of CaCO3 added to the pond floor raised soil pH tobetween 7.5 and 8.5 (Egna and Boyd, 1997), close to the valuesobtained in our study. The high alkalinity may be a result of the lowimpact of rainfall on pH stability during sampling. On the otherhand, it does not explain the high pH values found for O-P, whichdid not use any substance.
The shrimp ponds in our study tended to be autotrophicecosystems (considered at time of sampling) where the oxygensaturation values (95e172%) showed that they are oxygenated(Table 2). The difference in oxygen saturation between ponds is notlikely to be temperature-related, since the pond’s systems exhibi-ted slight variations among them (Table 2). Since organismsconsume oxygen (respiration) in order to decompose organicmatter, they may be responsible for decreasing oxygen saturation,
pH SDO (%) DO (mg/L)
(8.28e8.49) (91e101) (5.79e6.69)8.39 � 0.06 95 � 4 6.32 � 0.29(8.72e8.92) (157-183) (10.72e12.10)8.80 � 0.05 172 � 10 11.45 � 0.48(8.69e8.85) (83-187) (5.47e12.00)8.76 � 0.05 134 � 36 8.63 � 2.16
C.A. Ramos e Silva et al. / Estuarine, Coastal and Shelf Science 90 (2010) 55e6058
particularly in O-P (95 � 4%) (Table 2). The oxygen saturation ineach pond showed no significant correlation with pH and Chl-a (p > 0.05). This is not surprising, given that these ponds arestrongly affected by management practices (paddlewheel aeration,fertilization using sugar-cane molasses, dischargers and others)(Egna and Boyd, 1997) currently in use (I-P and SI-P) and by thoseemployed some years ago (O-P).
In this study total alkalinity (TA) is defined as the amount ofhydrogen ions (Hþ) in millimoles necessary to neutralize weakbases in 1 L of seawater (Van den Berg and Rogers, 1987). Thesimplest definition for TA in seawater was used by Millero (1996);however, we assumed an operational definition, as follows:
TA ¼ [HCO3�] þ 2[CO3
2�] þ [B(OH)4�] þ [OH�] � [Hþ]þ [SiO(OH)3�] þ [HPO4
2�] þ 2[PO43�]
Many natural physical (i.e., salinity) and biological (i.e., miner-alization of organic matter) processes may influence the TA ofshrimp farms. The average TA values in this study were very similaramong the ponds, with the highest average value found in the O-P(2.59 � 0.01 mM). The average I-P and SI-P values were2.26� 0.04mM and 2.28� 0.01mM, respectively. The ponds valuesare higher than those from GUR during the rainy season(1.29e1.56 mM), (unpublished, Ramos e Silva). The lower salinityvalues (0.3e1.8 g/kg) of GUR during water sampling may beresponsible for the low TA values in this system, given that bicar-bonate is one of the most important components of TA in seawater(Millero, 2001; Ramos e Silva, 2004). The proportion of bicarbonateand carbonate in the shrimp ponds of the 3 farms studied was: I-Pe 62% (978 mmol/kg-H2O) and 37% (584 mmol/kg-H2O), SI-P e64%(1022 mmol/kg-H2O) and 36% (574 mmol/kg-H2O) and O-P e83%(1828 mmol/kg) and 17% (369 mmol/kg-H2O), respectively. Thepercentage of TIC differs significantly from the values found inseawater (HCO3
�w89.8%; CO32�w6.7% e Zeeb and Wolf-Gladrow,
2005; Millero, 2006), in which characteristics such as shrimpponds altered the system. The closest values to seawater found forthe O-P may reflect the less intensive type of management. Weused the following equations for carbonate system dissociationconstants:
�lnk*B ¼�� 8966:90� 2890:51S0:5 � 77:942Sþ 1:726S1:5 � 0:0993S2
�T
þ�148:0248 þ 137:194S0:5 þ 1:62247S
�
þ�� 24:4344� 25:085S0:5 � 0:2474S
�lnT þ 0:053105S0:5T ð1Þ
T ¼ Kelvin; (mol/kg-H2O); I ¼ Ionic strength; S ¼ Salinity. (Dickson,1990).
�lnk*Si ¼ 117:40� 8904:2T
� 19:334lnT
þ�3:5913� 458:79
T
�I0:5 þ
��1:5998þ 188:74
T
�I
þ�0:07871� 12:1652
T
�I2 ð2Þ
T ¼ Kelvin; (mol/kg-H2O); I ¼ Ionic strength. (Millero, 2001).
�lnk*1ðH3PO4Þ ¼ 115:54� 4576:752T
� 18:453lnT
þ�0:069171� 106:736
T
�S0:5
þ��0:01844� 0:65643
T
�S ð3Þ
T ¼ Kelvin; (mol/kg-sol); S ¼ Salinity (Yao and Millero, 1994).
�lnk*2�H2PO
�4
�¼ 172:1033� 8814:71
T� 27:927lnT
þ�1:3566� 160:340
T
�S0:5
þ��0:05778þ 0:37335
T
�S ð4Þ
T ¼ Kelvin; (mol/kg-sol); S ¼ Salinity (Yao and Millero, 1994).
�lnk*3�HPO2�
4
�¼ �18:126� 3070:75
T
þ�2:81197þ 17:27039
T
�S0:5
þ��0:09984� 44:99486
T
�S ð5Þ
T ¼ Kelvin; (mol/kg-sol); S ¼ Salinity (Yao and Millero, 1994).
�lnk*2�CO2�
3
�¼ �9:226508� 3351:6106
T� 0:2005743lnT
þ��0:106901773� 23:9722
T
�S0:5
þ 0:1130822S� 0:00846934S1:5
(6)
T ¼ Kelvin; (mol/kg-H2O); S ¼ Salinity (Roy et al., 1993).We assumed that the carbonate chemistry of the shrimp ponds
studied is largely controlled by the constraint of atmospheric pCO2and pond carbonate-ion concentration, just like in the ocean.
Because shrimp pond water is in contact with carbonate-richbottom sediment, the water is saturated with respect to carbonatecalcium. Under this assumption, we determined calcite (Calc) andaragonite (Arag) precipitation by calculating saturation state forseawater (U ¼ [Ca2þ][CO3
2�]/Ksp*), (Millero, 1996; AQM software)where all surface values of U were close to 5.0, showing that thewater is oversaturated with both of these minerals, as follows: I-P:2.10 � 0.04 (Calc) and 9.86 � 0.40 (Arag), SI-P: 2.12 � 0.01 (Calc)and 9.75 � 0.40 (Arag) and O-P: 2.50 � 0.01 (Calc) and 6.43 � 0.38(Arag). The formation of solid CaCO3 in the surface waters of theseponds increases the influence of the carbonate system on thedynamics of a number of chemical elements (i.e., P and Fe) in
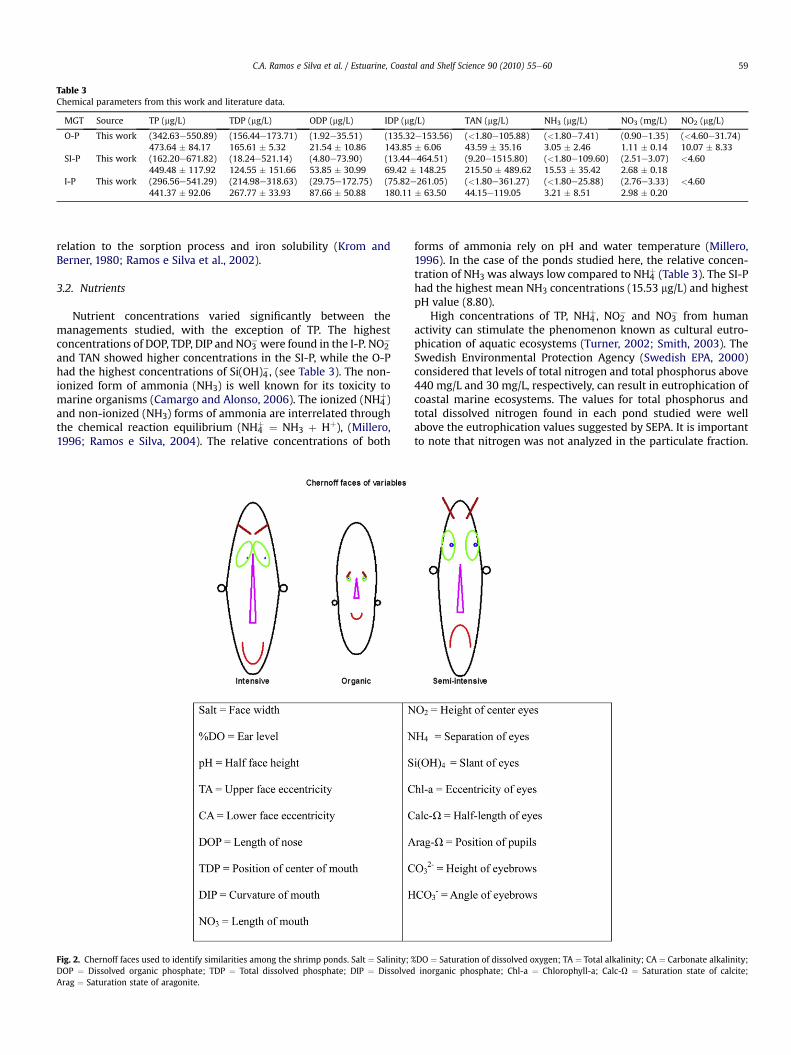
Table 3Chemical parameters from this work and literature data.
MGT Source TP (mg/L) TDP (mg/L) ODP (mg/L) IDP (mg/L) TAN (mg/L) NH3 (mg/L) NO3 (mg/L) NO2 (mg/L)
O-P This work (342.63e550.89) (156.44e173.71) (1.92e35.51) (135.32e153.56) (<1.80e105.88) (<1.80e7.41) (0.90e1.35) (<4.60e31.74)473.64 � 84.17 165.61 � 5.32 21.54 � 10.86 143.85 � 6.06 43.59 � 35.16 3.05 � 2.46 1.11 � 0.14 10.07 � 8.33
SI-P This work (162.20e671.82) (18.24e521.14) (4.80e73.90) (13.44e464.51) (9.20e1515.80) (<1.80e109.60) (2.51e3.07) <4.60449.48 � 117.92 124.55 � 151.66 53.85 � 30.99 69.42 � 148.25 215.50 � 489.62 15.53 � 35.42 2.68 � 0.18
I-P This work (296.56e541.29) (214.98e318.63) (29.75e172.75) (75.82e261.05) (<1.80e361.27) (<1.80e25.88) (2.76e3.33) <4.60441.37 � 92.06 267.77 � 33.93 87.66 � 50.88 180.11 � 63.50 44.15e119.05 3.21 � 8.51 2.98 � 0.20
C.A. Ramos e Silva et al. / Estuarine, Coastal and Shelf Science 90 (2010) 55e60 59
relation to the sorption process and iron solubility (Krom andBerner, 1980; Ramos e Silva et al., 2002).
3.2. Nutrients
Nutrient concentrations varied significantly between themanagements studied, with the exception of TP. The highestconcentrations of DOP, TDP, DIP and NO3
�were found in the I-P. NO2�
and TAN showed higher concentrations in the SI-P, while the O-Phad the highest concentrations of Si(OH)4�, (see Table 3). The non-ionized form of ammonia (NH3) is well known for its toxicity tomarine organisms (Camargo and Alonso, 2006). The ionized (NH4
þ)and non-ionized (NH3) forms of ammonia are interrelated throughthe chemical reaction equilibrium (NH4
þ ¼ NH3 þ Hþ), (Millero,1996; Ramos e Silva, 2004). The relative concentrations of both
Fig. 2. Chernoff faces used to identify similarities among the shrimp ponds. Salt ¼ Salinity; %DOP ¼ Dissolved organic phosphate; TDP ¼ Total dissolved phosphate; DIP ¼ DissolvedArag ¼ Saturation state of aragonite.
forms of ammonia rely on pH and water temperature (Millero,1996). In the case of the ponds studied here, the relative concen-tration of NH3 was always low compared to NH4
þ (Table 3). The SI-Phad the highest mean NH3 concentrations (15.53 mg/L) and highestpH value (8.80).
High concentrations of TP, NH4þ, NO2
� and NO3� from human
activity can stimulate the phenomenon known as cultural eutro-phication of aquatic ecosystems (Turner, 2002; Smith, 2003). TheSwedish Environmental Protection Agency (Swedish EPA, 2000)considered that levels of total nitrogen and total phosphorus above440 mg/L and 30 mg/L, respectively, can result in eutrophication ofcoastal marine ecosystems. The values for total phosphorus andtotal dissolved nitrogen found in each pond studied were wellabove the eutrophication values suggested by SEPA. It is importantto note that nitrogen was not analyzed in the particulate fraction.
DO ¼ Saturation of dissolved oxygen; TA ¼ Total alkalinity; CA ¼ Carbonate alkalinity;inorganic phosphate; Chl-a ¼ Chlorophyll-a; Calc-U ¼ Saturation state of calcite;
C.A. Ramos e Silva et al. / Estuarine, Coastal and Shelf Science 90 (2010) 55e6060
The enrichment factor for the TP and TDN based on SEPAvalues wasfairly high in three shrimp ponds O-P: PT ¼ 16 and TDN ¼ 3; SI-P:TP ¼ 15 and TDN ¼ 7; I-P: TP ¼ 15 and TDN ¼ 7. The TP and TDNconcentrations found in shrimp ponds were 3 times higher thanthose obtained in the GUR (Ramos e Silva, unpublished). Consid-ering that farms in the GUR encompass an area of 1547 ha (IDEMA,2004) with amean volume of 7,735,000m3, we estimate an averageyearly flow of 56 kg for TDN and 12 kg for PT. These values are lowcompared with other emissions in the studied region such as:waste waters (N: 64e129 ton/year, P: 9e45 ton/year) and agricul-ture (N: 864 ton/year and P: 147 ton/year) (Lacerda et al., 2006).
Although the pond waters are eutrophic, discharges into theGUR do not seem to influence nutrient concentrations, which are 3times smaller than those of the ponds studied. This finding may bedue to water renewal time in the GUR and the high dilutioncapacity (area/volume ¼ 2).
All farms studied showed spatial variations in nutrientconcentrations. This may be a result of the bathymetric irregulari-ties found in every pond as well as particle size and chemicalvariability.
Fig. 2 illustrates the differences and similarities among theponds studied in relation to the physico-chemical and chemicalvariables. The greatest similarities were observed between thetraditional ponds. This observation highlights that organicmanagement can result in different chemical water quality fromother management systems, despite the state of eutrophication.Further studies are needed to address the entire management cycle(up to harvest) in each nursery to confirm the trend found in thisstudy.
In summary, the data presented here show that the waters ofponds studied are eutrophic for phosphorus and nitrogen and thatthe physicalechemical variables are within the range found in theGUR, considering the sampling approach used. Although a singlesample was used in this study, the data show that the water fromthe organic pond has a different chemical composition from theother ponds, which appears to reflect a response to the practicesused in organic pond. The data from the CO2 inorganic system alsoshow that the studied ponds have been largely manipulated andare far from being considered natural systems. This is because,perhaps, the organic pond has been built in an area where therewere traditional farms in the past. Despite the shrimp farms showa framework of eutrophic systems, they do not seem to affect thewater quality of the GUR.
Acknowledgements
The first author would like to thank several students fromFederal University of Rio Grande do Norte for their assistanceduring sample collection and laboratory analysis. The authors wishto acknowledge the Conselho Nacional de Desenvolvimento Cien-tífico e Tecnológico (CNPq e Process number 485043/2006-8) forthe financial support.
References
ABCC, 2004. Revista da associação brasileira dos criadores de camarão, ano 6(4).AQM Software (Análises Químicas Marinhas). [email protected].
Camargo, J.A., Alonso, A., 2006. Ecological and toxicological effects of inorganicnitrogen pollution in aquatic ecosystems: a global assessment. EnvironmentInternational 32, 831e849.
Chernoff, H., 1973. The use of faces to represent points in K-dimensional spacegraphically. Journal of the American Statistical Association 68 (342), 361e368.
Chester, R., 1990. Marine Biochemistry. Unwin Hyman, London.Clay, J.W., 1996. Market Potentials for Redressing the Environmental Impact of
Wild Captured and Pond Produced Shrimp. World Wildlife Fund (WWF), pp.1e188.
Clayton, T., Byrne, R.H., 1993. Spectrophotometric seawater pH measurements: totalhydrogen ion concentration scale calibration of m-cresol purple and at-searesults. Deep-Sea Research 40, 2115e2129.
Cohen, J., Samocha, T., Fox, J., Gandy, R., Lawrence, A., 2005. Characterization ofwater quality factors during intensive raceway production of juvenile usinglimited discharge and biosecure management tools. Aquacultural Engineering32 (3e4), 425e442.
Cuoco, L., 2005. Organic aquaculture in Ecuador: a more sustainable solution?Tropical Resources Bulletin 24, 59e65.
Dickson, A.G., 1990. Thermodynamics of the dissociation of boric acid in syntheticseawater from 273.15 to 318.15 K. Deep-Sea Research 37, 755e766.
DOE, 1994. In: Dickson, A.G., Goyet, C. (Eds.), Handbook of Methods for the Analysisof the Various Parameters of the Carbon Dioxide System in Sea Water Version 2.ORNL/CDIAC-74.
Egna, H.S., Boyd, C.E., 1997. Dynamics of Pond Aquaculture. CRC PRESS.EMPARN(EmpresadePesquisaAgropecuáriadoRN), 2004. Boletins deprecipitaçãoe
estação canguaretama. Séries 1911 a 2003.Gómez-Parra, A., Forja, J.M., 1994. An operative definition of alkalinity in intertidal
waters. Marine Chemistry 5, 53e65.Grasshoff, K., Ehrhardt, M., Kremling, K., 1983. Methods of Seawater Analysis. Verlag
Chemie, Nurnberg.IDEMA (Instituto de Desenvolvimento Econômico e do Meio Ambiente do Rio
Grande do Norte), 2004. Mapeamento Geoambiental Do Sistema Lagunar-Estuarino Nísia Floresta-Papeba-Guaraíras Em Escala 1:10.000e Com Base EmImagens Ikonos II, Natal/RN, 36 pp. [Relatório].
Krom, M.D., Berner, R.A., 1980. The diffusion coefficients of sulfate, ammonium, andphosphate ions in anoxic marine sediments. Limnology Oceanography 25 (2),327e337.
Lacerda, L.D., Vaisman, A.G., Maia, L.P., Ramos e Silva, C.A., Cunha, E.M.S., 2006.Relative importance of nitrogen and phosphorus emissions from shrimpfarming and other anthropogenic sources for six estuaries along the NE Bra-zilian coast. Aquaculture 253, 433e446.
Melissa, C., Fransson, A., Anderson, L.G., 1999. Influence of m-cresol purple indicatoradditions on the pH of seawater samples: correction factors evaluated froma chemical speciation model. Marine Chemistry 65, 281e290.
Millero, F.J., 1996. In: Kennishi, Michael J., Lutz, Peter L. (Eds.), Chemical Oceano-graphic, second ed Florida/USA.
Millero, F.J., 1997. Laboratory for Chemical Oceanographic. Rosenstiel School ofMarine and Atmospheric Science, University of Miami.
Millero, F.J., 2001. Phisycal Chemistry of Natural Waters. Wiley-Interscience.Millero, F.J., 2006. Chemical Oceanography, third ed. CRC Press, Boca Raton.Millero, F.J., Zhang, J.-Z., Fiol, S., Sotolongo, S., Roy, R.N., Lee, K., Mane, S., 1993. The
use of buffers to measure the pH of seawater. Marine Chemistry 44, 143e152.Nemzer, B.V., Dickson, A.G., 2005. The stability and reproducibility of tris buffers in
synthetic seawater. Marine Chemistry 96 (3e4), 237e242.Pankow, J.F., 1991. Aquatic Chemistry Concepts. Titan Press, Portland, OR.Pérez, F.F., Fraga, F., 1987. The pH measurements in seawater on NBS scale. Marine
Chemistry 21, 315e327.Ramos e Silva, C.A., 2004. Análises Físico-químicas de Sistemas Marginais Marinhos.
Interciência, Rio de Janeiro.Ramos e Silva, C.A., Liu, X., Millero, F.J., 2002. Solubility of siderite (FeCO3) in NaCl
solutions. Journal of Solution Chemistry 31 (2), 97e108.Rönnbäck, P., 2003. Critical Analysis of Certified Organic Shrimp Aquaculture in
Sidoarjo, Indonesia. Swedish Society for Nature Conservation (SSNC), pp. 1e5.Roy, R.N., Roy, L.N., Vogel, K.M., Moore, C.P., Pearson, T., Good, C.E., Millero, F.J.,
Campbell, D.M., 1993. Determination of the ionization constants of carbonicacid in seawater. Marine Chemistry 44, 249e268.
Smith, V.H., 2003. Eutrophication of freshwater and coastal marine ecosystems:a global problem. Environmental Science and Pollution Research 10, 126e139.
Strickland, J.D.H., Parsons, T.R., 1972. A Practical Handbook of Seawater Analysis,second ed. Bulletin of the Fisheries Research Board of Canada, 167, 310 pp.
Swedish EPA (Environmental Protection Agency), 2000. Environmental QualityCriteria: Coasts and Seas, vol. 5052 Stockholm, Sweden.
Turner, R.E., 2002. Element ratios and aquatic food webs. Estuaries 25, 694e703.Van den Berg, C.M.G., Rogers, H., 1987. Determination of alkalinities of estuarine
waters by a two-point potentiometric titration. Marine Chemistry 20,219e226.
Yao, W., Millero, F.J., 1994. The chemistry of the anoxic waters in the FramvarenFjord, Norway. Aquatic Geochemistry 1, 53e88.
Zeeb, R.E., Wolf-Gladrow, D., 2005. CO2 in Seawater: Equilibrium, Kinetics, Isotopes.In: Elsevier Oceanography Series, vol. 65 (Third impression).