Embed Size (px)
Citation preview
The influence of riparian vegetation on near-bank turbulence: a flume experiment 2019
Copyright © 2007 John Wiley & Sons, Ltd. Earth Surf. Process. Landforms 32, 2019–2037 (2007)DOI: 10.1002/esp
Earth Surface Processes and LandformsEarth Surf. Process. Landforms 32, 2019–2037 (2007)Published online 17 April 2007 in Wiley InterScience(www.interscience.wiley.com) DOI: 10.1002/esp.1513
The influence of riparian vegetation on near-bankturbulence: a flume experimentMaeve McBride,1* W. Cully Hession,2 Donna M. Rizzo1 and Douglas M. Thompson3
1 Civil and Environmental Engineering, University of Vermont, Burlington, VT, USA2 Biological Systems Engineering, Virginia Tech, Blacksburg, VA, USA3 Department of Physics, Astronomy, and Geophysics, Connecticut College, New London, CT, USA
AbstractMeasurements from a fixed-bed, Froude-scaled hydraulic model of a stream in northeasternVermont demonstrate the importance of forested riparian vegetation effects on near-bankturbulence during overbank flows. Sections of the prototype stream, a tributary to SleepersRiver, have increased in channel width within the last 40 years in response to passive refor-estation of its riparian zone. Previous research found that reaches of small streams withforested riparian zones are commonly wider than adjacent reaches with non-forested, orgrassy, vegetation; however, driving mechanisms for this morphologic difference are notfully explained. Flume experiments were performed with a 1:5 scale, simplified model of halfa channel and its floodplain, mimicking the typical non-forested channel size. Two types ofriparian vegetation were placed on the constructed floodplain: non-forested, with syntheticgrass carpeting; and forested, where rigid, randomly distributed, wooden dowels were added.Three-dimensional velocities were measured with an acoustic Doppler velocimeter at 41locations within the channel and floodplain at near-bed and 0·6-depth elevations. Observa-tions of velocity components and calculations of turbulent kinetic energy (TKE), Reynoldsshear stress and boundary shear stress showed significant differences between forested andnon-forested runs. Generally, forested runs exhibited a narrow band of high turbulencebetween the floodplain and main channel, where TKE was roughly two times greater thanTKE in non-forested runs. Compared to non-forested runs, the hydraulic characteristics offorested runs appear to create an environment with higher erosion potential. Given thatsediment entrainment and transport can be amplified in flows with high turbulence intensityand given that mature forested stream reaches are wider than comparable non-forestedreaches, our results demonstrated a possible driving mechanism for channel wideningduring overbank flow events in stream reaches with recently reforested riparian zones.Copyright © 2007 John Wiley & Sons, Ltd.
Keywords: bank erosion; channel morphology; riparian vegetation; turbulent kineticenergy; shear stress
Introduction
Reforestation of riparian areas is a common phenomenon due both to restoration efforts and passive reforestation.Stream restoration programs typically include riparian reforestation to benefit stream ecosystems by filtering pollut-ants, regulating light and temperature regimes, and providing physical habitat and a food/energy base (Gregory et al.,1991; Sweeney, 1992; Sweeney et al., 2004). Some riparian areas have passively reforested in response to changes inland use, especially in areas where agricultural uses are in decline. For example, late nineteenth-century Vermont wasroughly 30 per cent forested; however, about 70 per cent of Vermont is currently forested (Albers, 2000). In this study,we used a scaled flume experiment to explore the effects of reforestation on the hydraulic characteristics of overbankflows, a potential driver for morphologic change.
Received 11 March 2006;Revised 25 January 2007;Accepted 12 February 2007
*Correspondence to: MaeveMcBride, Civil and EnvironmentalEngineering, University ofVermont, 213 Votey Building,Burlington, VT 05405, USA.E-mail: [email protected]
2020 M. McBride et al.
Copyright © 2007 John Wiley & Sons, Ltd. Earth Surf. Process. Landforms 32, 2019–2037 (2007)DOI: 10.1002/esp
Riparian vegetation exerts a strong influence on stream-channel morphology. Studies from different geographiclocations indicate that stream reaches with riparian forests are wider than those with adjacent grassy vegetation(Zimmerman et al., 1967; Murgatroyd and Ternan, 1983; Sweeney, 1992; Davies-Colley, 1997; Trimble, 1997; Hessionet al., 2000, 2003; Sweeney et al., 2004; Allmendinger et al., 2005). Conversely, other studies suggest that widths ofstreams through grassland are generally greater than those through forest (Charlton et al., 1978; Hey and Thorne,1986; Gregory and Gurnell, 1988; Rosgen, 1996). It should be noted that previous studies have categorized riparianvegetation in a multitude of ways, so it can be difficult to compare findings or make generalized conclusions. Theseapparently contrary findings may also be partially explained by a scale-dependent effect of riparian vegetation, suchthat in catchments greater than 10–100 km2 widths are narrower when thick woody vegetation is present and insmaller catchments the opposite effect is observed (Anderson et al., 2004). The driving mechanisms for these widthadjustments are not well described or understood at either scale. If the channel processes associated with reforestingriparian zones were better understood, these conflicting findings might be resolved. An understanding of channelprocesses is also essential to properly guide stream-restoration activities (Hession, 2001).
The driving mechanisms that create these differences in channel size likely operate on a timescale greater than thelength of a typical research study; therefore, field-based research opportunities are limited. Long-term channel changein response to riparian vegetation change has been documented in a couple of cases (Parkyn et al., 2003; McBrideet al., 2005). The study in New Zealand evaluated channel response in small streams restored with forest buffersplanted 2–24 years prior to the study (Parkyn et al., 2003). Researchers did not find a significant difference in channelwidth between reforested and control reaches, and they suggest the plantings were too young to initiate widening(Parkyn et al., 2003). A study comparing historic data from Zimmerman et al. (1967) and data collected nearly 40years later in 2004 in the same stream reaches investigated differences in channel width over time (McBride et al.,2005). The Zimmerman et al. (1967) study was one of the earliest on this subject and found that channel bed widthswere larger in reaches with forested riparian vegetation than in reaches with ‘sod’ or grassy riparian vegetation forseveral small tributaries in the Sleepers River catchment. In the 1960s, this area had a diverse patchwork of forestedand non-forested riparian vegetation, but since then approximately 1 km of these tributaries has passively reforested.These reforested stream reaches were significantly wider in 2004 than as measured in the 1960s (McBride et al.,2005).
Several theories on the mechanisms driving channel widening have been postulated in the literature. The process ofchannel widening that presumably occurs following the reforestation of a riparian zone has been attributed to twomain effects: (1) the suppression of grassy and understory vegetation on the banks and within channels with a closedcanopy (Murgatroyd and Ternan, 1983; Davies-Colley, 1997) and (2) local scouring from large woody debris (LWD;Zimmerman et al., 1967; Murgatroyd and Ternan, 1983; Trimble, 1997, 2004). Although Allmendinger et al. (2005)discussed differences in channel equilibrium widths of forested and non-forested streams related to different ratiosbetween rates of cutbank erosion and deposition on active floodplains, the process of channel widening that presum-ably accompanies reforestation is not explained. Another possible mechanism for channel widening not yet explored isthe hydraulic effect of forested vegetation during overbank flows. When flows overtop channel banks in reaches withforested floodplains, flows must circumvent tree trunks, resulting in more roughness than found on a non-forestedfloodplain. The hydraulic characteristics of overbank flows with forested versus non-forested floodplains are likelydifferent, and the impact to channel morphology may be significant. Given the difficulties of monitoring and collectingdata during infrequent overbank flow events on small streams with flashy flow regimes, a physical model provides anexperimental surrogate for investigating the possible driving hydraulic conditions.
Flume studies offer the advantage of a controlled experimental environment where the hydraulic forces and channelresponse can be isolated, thereby avoiding some of the complications involved in field-based research (Thompson andWohl, 1998). Several flume studies have investigated the hydraulic and geomorphic effects of vegetation, includingstudies of drag coefficients with submerged vegetation (Garcia et al., 2004), changes in channel planform and dimen-sions (Gran and Paola, 2001; Bennett and Alonso, 2003) and hydrodynamic behavior and flow resistance (Pasche andRouve, 1985; Naot et al., 1996; Darby, 1999; Nezu and Onitsuka, 2001). To our knowledge, no physical model studyhas explored the hydraulic characteristics of overbank flows as a driving mechanism for channel widening in responseto riparian reforestation using a scaled-model approach.
One key hydraulic behavior that may be driving channel widening is a shear-layer effect. A shear layer can establishitself at the interface between a main channel and a floodplain due to the velocity differential between the floodplainflow and the main channel flow (Shiono and Knight, 1991; Wormleaton, 1996). This type of shear layer is composedof periodic, whirlpool-like flow elements called vortices or coherent structures (Tritton, 1988; Smith, 1996). Thesezones of high shear have been identified in pools (Thompson, 2007) and at stream confluences (Biron et al., 1993;McClelland et al., 1996) and have been shown to significantly influence channel morphology. Studies of shear zonesabove submerged vegetation have shown intermittent organized vortices and maximum values of turbulence intensity
The influence of riparian vegetation on near-bank turbulence: a flume experiment 2021
Copyright © 2007 John Wiley & Sons, Ltd. Earth Surf. Process. Landforms 32, 2019–2037 (2007)DOI: 10.1002/esp
and Reynolds shear stress near the top of the vegetation canopy (Ikeda and Kanazawa, 1996; Garcia et al., 2004). Theintroduction of vegetation results in additional drag forces, turbulent energy and anisotropy of turbulence (Naot et al.,1996). Consequently, many researchers have numerically described the channel–floodplain interface as an imaginaryvertical wall to facilitate modeling techniques (Pasche and Rouve, 1985; Naot et al., 1996). Visualization techniquesshow that intensive vortex shedding occurs at the channel–floodplain interface due to an intensive momentumexchange between two distinct regions of varying velocity (Pasche and Rouve, 1985).
We hypothesize that, during overbank flows, turbulence generated from riparian trees locally broadens streamreaches from a narrow, non-forested equilibrium size to a wider forested size. Flow separation around tree trunksalong forested stream reaches will generate localized turbulence and scour that may increase channel width throughbank erosion. Because trees are stable features that can fix the location of vortex shedding for years, turbulent scouralong the bank may gradually increase channel width. In contrast, non-forested stream reaches typically contain fewerpersistent obstructions that could generate turbulent scour. Our objective was to conduct a controlled flume experimentusing a scaled model of a non-forested reach of an unnamed tributary to Sleepers River in northeastern Vermont. Thistributary, stream W12, is significant because it was the site of an early investigation by Zimmerman et al. (1967) andhas subsequently experienced reforestation of some riparian areas (McBride et al., 2005). Overbank flows weresimulated to investigate near-bank turbulence and flow dynamics that might be responsible for channel widening inresponse to a change in riparian vegetation.
Methods
Experimental specifications and procedureExperiments were performed in a recirculating flume 1·0 m wide, 0·3 m deep and 6·0 m long at the University ofVermont’s Hydraulics Laboratory. Discharge was measured using a calibrated Venturi meter installed in the flume’spiping system. An adjustable tailgate at the downstream end of the flume controlled the water depth. Instruments weremounted from above on an aluminum plate carriage that traveled the length of the flume on stainless steel rails.
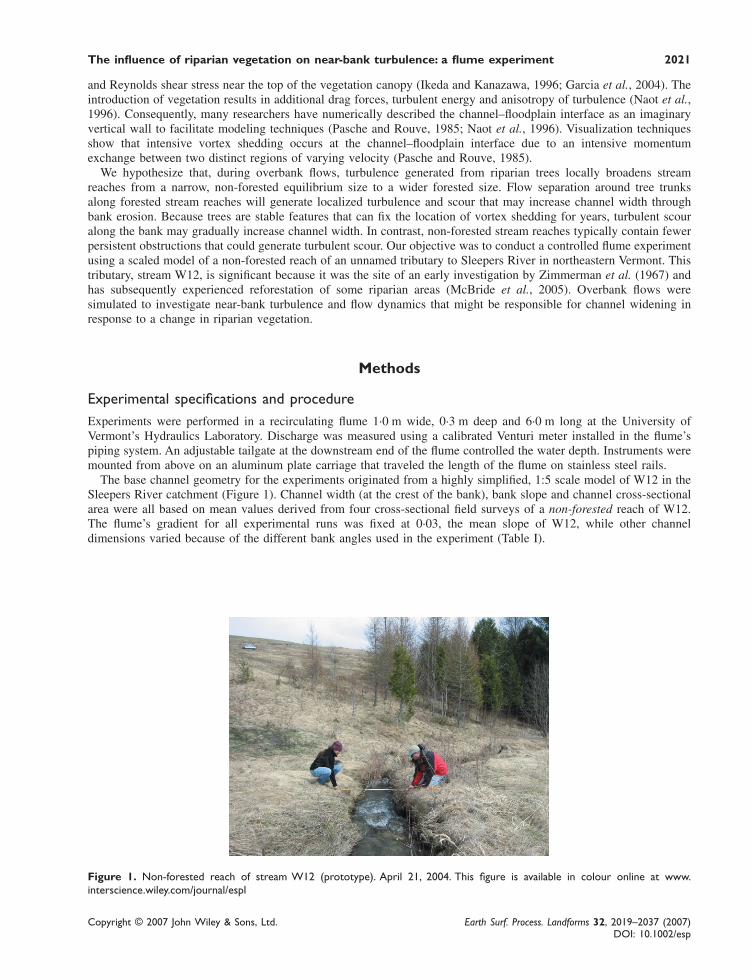
The base channel geometry for the experiments originated from a highly simplified, 1:5 scale model of W12 in theSleepers River catchment (Figure 1). Channel width (at the crest of the bank), bank slope and channel cross-sectionalarea were all based on mean values derived from four cross-sectional field surveys of a non-forested reach of W12.The flume’s gradient for all experimental runs was fixed at 0·03, the mean slope of W12, while other channeldimensions varied because of the different bank angles used in the experiment (Table I).
Figure 1. Non-forested reach of stream W12 (prototype). April 21, 2004. This figure is available in colour online at www.interscience.wiley.com/journal/espl
2022 M. McBride et al.
Copyright © 2007 John Wiley & Sons, Ltd. Earth Surf. Process. Landforms 32, 2019–2037 (2007)DOI: 10.1002/esp
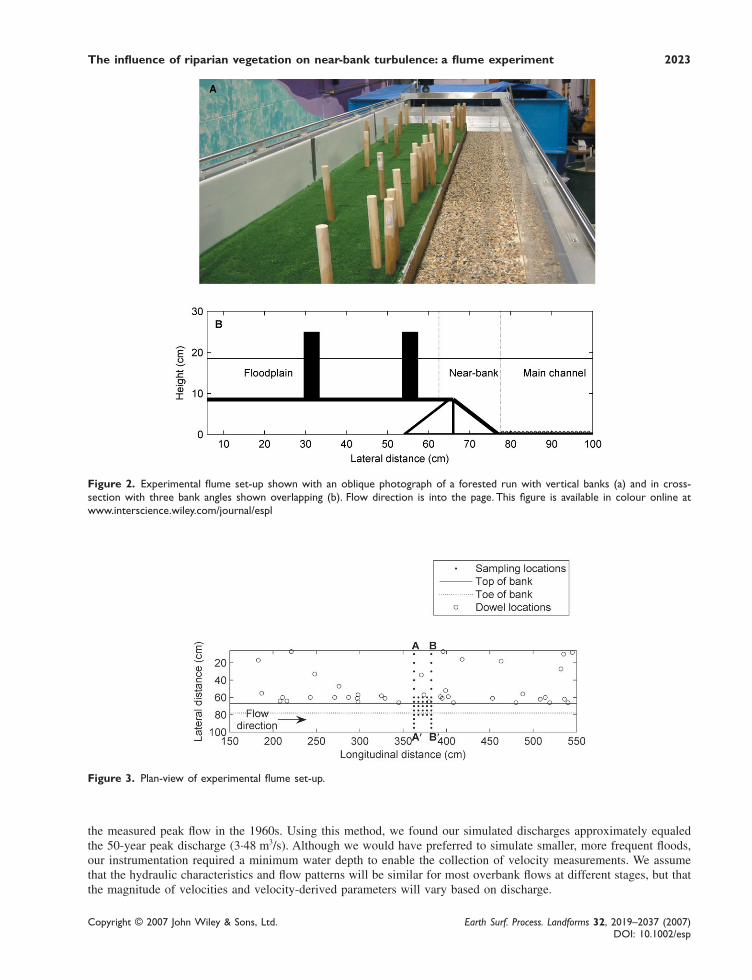
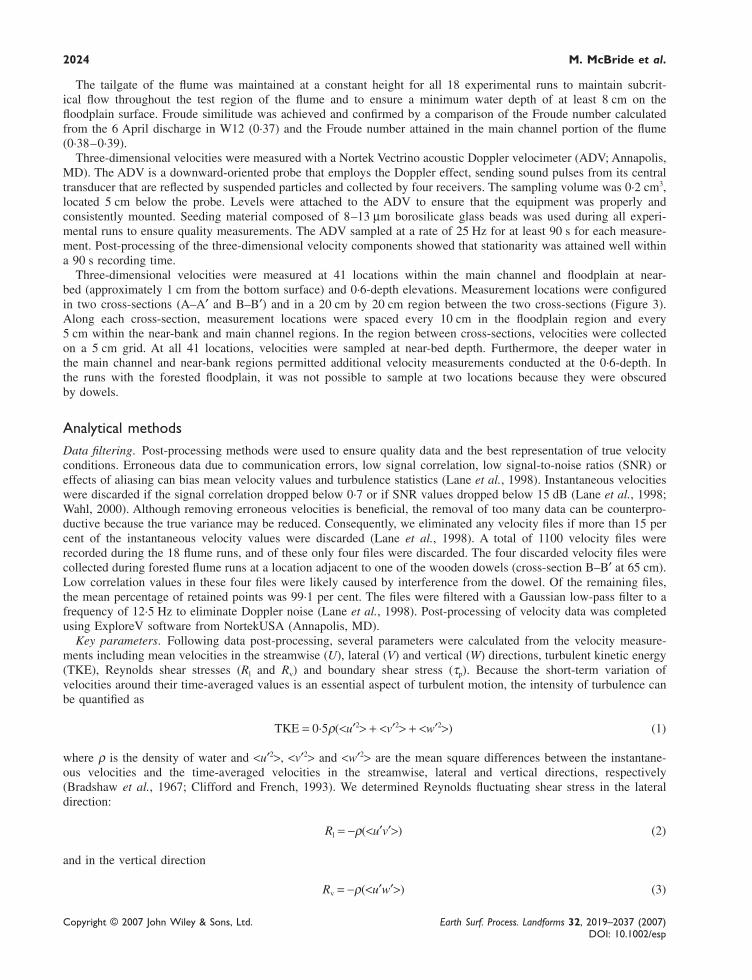
Six experimental stream morphologies were created in a test region of the flume measuring 367 cm long by 94 cmwide. Each experimental morphology was designed to represent half of a straight, uniform channel with an adjacent,flat floodplain (Figure 2). The width of the floodplain, 61 cm, was approximately double the channel width in theflume. One of the flume’s vertical walls comprised the channel centerline. Although we would have preferred to modelthe entire channel with both sides of the floodplain, we were limited by the size of our flume and the minimumchannel dimensions needed to collect data with our instrumentation. Two types of riparian vegetation were simulatedon the floodplain surface: non-forested, with synthetic grass carpeting; and forested, where rigid, randomly distributed,wooden dowels were added (Figure 3). Because both the forested and non-forested experimental morphologies werethe same size, we assumed the forested experimental morphologies were essentially under-fit, which permitted us toinvestigate hydraulic conditions during the crucial widening period. Three bank angles were simulated: angled (36°),vertical (90°) and undercut (144°).
The experimental channels and floodplains were constructed out of rigid, high-density polyethylene plastic sheets tocreate fixed boundaries. Channel bottom sections were roughened by attaching a single layer of 6 mm sorted peagravel with construction adhesive. The pea gravel was sorted to achieve the 1:5 ratio with the median sediment size(30 mm) of W12. Channel banks were similarly glued with a layer of fine sand (approximately 0·125 to 0·25 mm),roughly one-fifth the size of the course sand found in the prototype’s stream banks. The floodplain surface was affixedwith 1 cm thick synthetic grass carpet for all experimental runs. Dowels had been successfully used in several flumeexperiments to simulate trees or other vegetation (Pasche and Rouve, 1985; Tsujimoto, 1996; Nezu and Onitsuka,2001; Garcia et al., 2004). Therefore, for runs with forested riparian vegetation, rigid wooden dowels 2·5 cm indiameter were attached from the underside of the floodplain surface in a random configuration. Dowel diameter andspacing, both along the bank and throughout the floodplain, were scaled from measurements of a 10 m2 plot ofriparian forest at W12. The spacing of dowels was denser along the bank to mimic our field observations of aclustering of water-tolerant tree species along the bank crest.
A total of 18 flume runs were conducted with all combinations of riparian vegetation, bank angle and discharge(Table I). Experiments were run at three different discharges: 30, 33 and 36 L/s. These discharges corresponded tooverbank flows in W12 with discharges of 3·35, 3·69 and 4·02 m3/s, based on dynamic, Froude similitude (Chanson,1999). Limited hydrologic data are available for W12; however, a maximum peak discharge of 0·59 m3/s was recordedbetween 1963 and 1966 (Zimmerman et al., 1967). We measured a spring-melt peak discharge of 0·21 m3/s at W12 on6 April 2005, but this flow event was contained within the channel. To roughly estimate the return interval of themodeled discharges, we used a United States Geologic Survey (USGS) area-based regression method for ungagedstreams (Johnson and Laraway, 1971). Several area-based methods are applicable for Vermont (VTAOT, 1998);however, the USGS method provided an estimate of the 2-year peak discharge (0·79 m3/s) that most closely matched
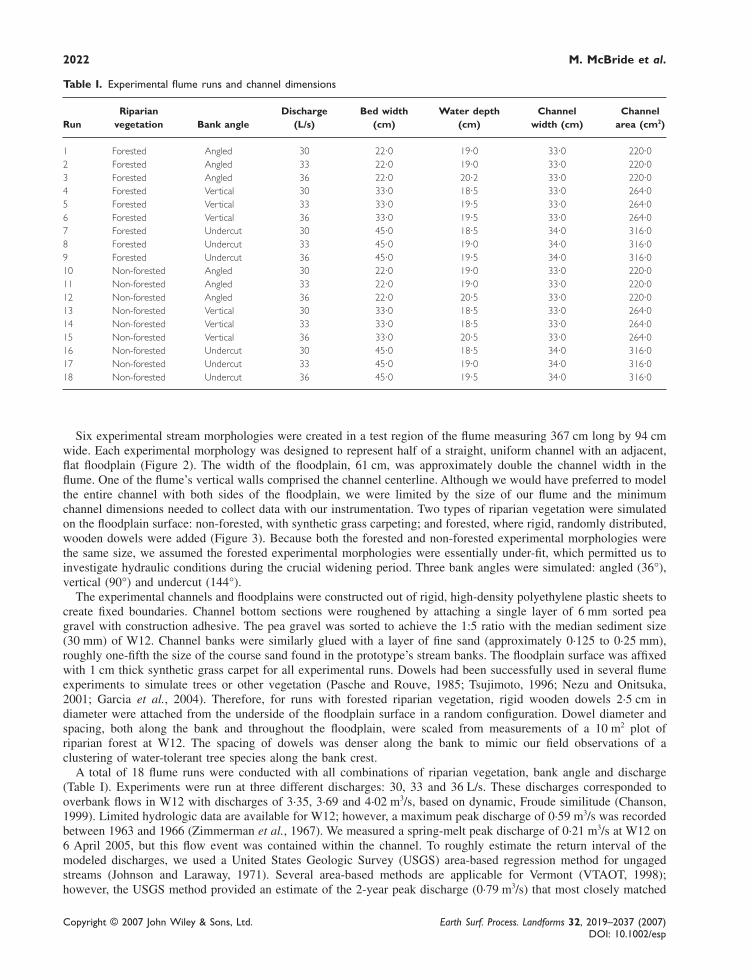
Table I. Experimental flume runs and channel dimensions
Riparian Discharge Bed width Water depth Channel ChannelRun vegetation Bank angle (L/s) (cm) (cm) width (cm) area (cm2)
1 Forested Angled 30 22·0 19·0 33·0 220·02 Forested Angled 33 22·0 19·0 33·0 220·03 Forested Angled 36 22·0 20·2 33·0 220·04 Forested Vertical 30 33·0 18·5 33·0 264·05 Forested Vertical 33 33·0 19·5 33·0 264·06 Forested Vertical 36 33·0 19·5 33·0 264·07 Forested Undercut 30 45·0 18·5 34·0 316·08 Forested Undercut 33 45·0 19·0 34·0 316·09 Forested Undercut 36 45·0 19·5 34·0 316·010 Non-forested Angled 30 22·0 19·0 33·0 220·011 Non-forested Angled 33 22·0 19·0 33·0 220·012 Non-forested Angled 36 22·0 20·5 33·0 220·013 Non-forested Vertical 30 33·0 18·5 33·0 264·014 Non-forested Vertical 33 33·0 18·5 33·0 264·015 Non-forested Vertical 36 33·0 20·5 33·0 264·016 Non-forested Undercut 30 45·0 18·5 34·0 316·017 Non-forested Undercut 33 45·0 19·0 34·0 316·018 Non-forested Undercut 36 45·0 19·5 34·0 316·0
The influence of riparian vegetation on near-bank turbulence: a flume experiment 2023
Copyright © 2007 John Wiley & Sons, Ltd. Earth Surf. Process. Landforms 32, 2019–2037 (2007)DOI: 10.1002/esp
Figure 2. Experimental flume set-up shown with an oblique photograph of a forested run with vertical banks (a) and in cross-section with three bank angles shown overlapping (b). Flow direction is into the page. This figure is available in colour online atwww.interscience.wiley.com/journal/espl
Figure 3. Plan-view of experimental flume set-up.
the measured peak flow in the 1960s. Using this method, we found our simulated discharges approximately equaledthe 50-year peak discharge (3·48 m3/s). Although we would have preferred to simulate smaller, more frequent floods,our instrumentation required a minimum water depth to enable the collection of velocity measurements. We assumethat the hydraulic characteristics and flow patterns will be similar for most overbank flows at different stages, but thatthe magnitude of velocities and velocity-derived parameters will vary based on discharge.
2024 M. McBride et al.
Copyright © 2007 John Wiley & Sons, Ltd. Earth Surf. Process. Landforms 32, 2019–2037 (2007)DOI: 10.1002/esp
The tailgate of the flume was maintained at a constant height for all 18 experimental runs to maintain subcrit-ical flow throughout the test region of the flume and to ensure a minimum water depth of at least 8 cm on thefloodplain surface. Froude similitude was achieved and confirmed by a comparison of the Froude number calculatedfrom the 6 April discharge in W12 (0·37) and the Froude number attained in the main channel portion of the flume(0·38–0·39).
Three-dimensional velocities were measured with a Nortek Vectrino acoustic Doppler velocimeter (ADV; Annapolis,MD). The ADV is a downward-oriented probe that employs the Doppler effect, sending sound pulses from its centraltransducer that are reflected by suspended particles and collected by four receivers. The sampling volume was 0·2 cm3,located 5 cm below the probe. Levels were attached to the ADV to ensure that the equipment was properly andconsistently mounted. Seeding material composed of 8–13 μm borosilicate glass beads was used during all experi-mental runs to ensure quality measurements. The ADV sampled at a rate of 25 Hz for at least 90 s for each measure-ment. Post-processing of the three-dimensional velocity components showed that stationarity was attained well withina 90 s recording time.
Three-dimensional velocities were measured at 41 locations within the main channel and floodplain at near-bed (approximately 1 cm from the bottom surface) and 0·6-depth elevations. Measurement locations were configuredin two cross-sections (A–A′ and B–B′) and in a 20 cm by 20 cm region between the two cross-sections (Figure 3).Along each cross-section, measurement locations were spaced every 10 cm in the floodplain region and every5 cm within the near-bank and main channel regions. In the region between cross-sections, velocities were collectedon a 5 cm grid. At all 41 locations, velocities were sampled at near-bed depth. Furthermore, the deeper water inthe main channel and near-bank regions permitted additional velocity measurements conducted at the 0·6-depth. Inthe runs with the forested floodplain, it was not possible to sample at two locations because they were obscuredby dowels.
Analytical methodsData filtering. Post-processing methods were used to ensure quality data and the best representation of true velocityconditions. Erroneous data due to communication errors, low signal correlation, low signal-to-noise ratios (SNR) oreffects of aliasing can bias mean velocity values and turbulence statistics (Lane et al., 1998). Instantaneous velocitieswere discarded if the signal correlation dropped below 0·7 or if SNR values dropped below 15 dB (Lane et al., 1998;Wahl, 2000). Although removing erroneous velocities is beneficial, the removal of too many data can be counterpro-ductive because the true variance may be reduced. Consequently, we eliminated any velocity files if more than 15 percent of the instantaneous velocity values were discarded (Lane et al., 1998). A total of 1100 velocity files wererecorded during the 18 flume runs, and of these only four files were discarded. The four discarded velocity files werecollected during forested flume runs at a location adjacent to one of the wooden dowels (cross-section B–B′ at 65 cm).Low correlation values in these four files were likely caused by interference from the dowel. Of the remaining files,the mean percentage of retained points was 99·1 per cent. The files were filtered with a Gaussian low-pass filter to afrequency of 12·5 Hz to eliminate Doppler noise (Lane et al., 1998). Post-processing of velocity data was completedusing ExploreV software from NortekUSA (Annapolis, MD).
Key parameters. Following data post-processing, several parameters were calculated from the velocity measure-ments including mean velocities in the streamwise (U), lateral (V) and vertical (W) directions, turbulent kinetic energy(TKE), Reynolds shear stresses (Rl and Rv) and boundary shear stress (τp). Because the short-term variation ofvelocities around their time-averaged values is an essential aspect of turbulent motion, the intensity of turbulence canbe quantified as
TKE = 0·5ρ(<u′2> + <v′2> + <w′2>) (1)
where ρ is the density of water and <u′2>, <v′2> and <w′2> are the mean square differences between the instantane-ous velocities and the time-averaged velocities in the streamwise, lateral and vertical directions, respectively(Bradshaw et al., 1967; Clifford and French, 1993). We determined Reynolds fluctuating shear stress in the lateraldirection:
Rl = −ρ(<u′v′>) (2)
and in the vertical direction
Rv = −ρ(<u′w′>) (3)
The influence of riparian vegetation on near-bank turbulence: a flume experiment 2025
Copyright © 2007 John Wiley & Sons, Ltd. Earth Surf. Process. Landforms 32, 2019–2037 (2007)DOI: 10.1002/esp
where <u′v′> is the mean of the product of the fluctuations of streamwise and lateral velocities and <u′w′> is the meanof the product of the fluctuations of streamwise and vertical velocities (Clifford and French, 1993). Reynolds shearstresses were calculated to investigate the character of the turbulence in the near-bank region, and a quadrant analysisof those stresses was used to dissect the velocity signal based on the relative signs of u′, v′ and w′ (Lu and Willmarth,1973). To explore potential impacts of turbulence on the channel morphology of the prototype stream, values ofboundary shear stress were calculated such that
τρρp
p
mr
mTKE
=
−( )⎡
⎣
⎢⎢⎢
⎤
⎦
⎥⎥⎥
Lc
s1 12
12
(4)
where subscripts ‘p’ and ‘m’ correspond to prototype (stream) and model values, respectively. Lr is the length ratio ofthe prototype channel to the model, c is a proportionality constant assumed to be 0·21 (Daniels and Rhoads, 2004) ands is the side slope (1:s, vertical:horizontal). The side slope, s, in the denominator adjusts for the increased length of thebank surface with angled banks (runs 1–3 and 10–12). The simple linear relationship between boundary shear stress(τp) and TKE was successfully demonstrated in tidal currents, stream channels and flume applications (Kim et al.,2000; Biron et al., 2004; Daniels and Rhoads, 2004). Water temperatures in the flume ranged from 23 to 26 °C and thecorresponding ρ values (0·9975–0·9967 g/cm3) were used in the calculation of TKE, Reynolds shear stress andboundary shear stress. Water temperature in W12 was assumed to be 5 °C with ρ equal to 1·0000 g/cm3.
Statistical methods. Parametric statistical techniques were used to test for differences in mean values of the meas-ured parameters. Separate analyses were performed in each of three distinct regions of the flume: floodplain (6–62·5 cm); near bank (62·5–77·5 cm) and main channel (77·5–100 cm; Figure 2). All parameters were found to beapproximately normally distributed by the inspection of normal quantile plots and the Shapiro–Wilk test (JMP, 2002).A randomized complete block approach was used to test for differences in velocity components, TKE and Reynoldsshear stress. Each measurement location (Figure 3) was treated as a block with riparian vegetation, bank angle anddischarge level as fixed factors. Results were examined for interaction effects, where the effect of one factor might notbe independent of the particular level of another factor (Zar, 1999). Blocks with missing data were excluded from theanalysis. This approach was preferred over a simpler factorial analysis of variance because replicates were notindependent due to strong spatial correlation between adjacent measurement locations. Statistical testing was com-pleted using JMP software v.5.0.1.2 (SAS Institute, Cary, NC).
Results
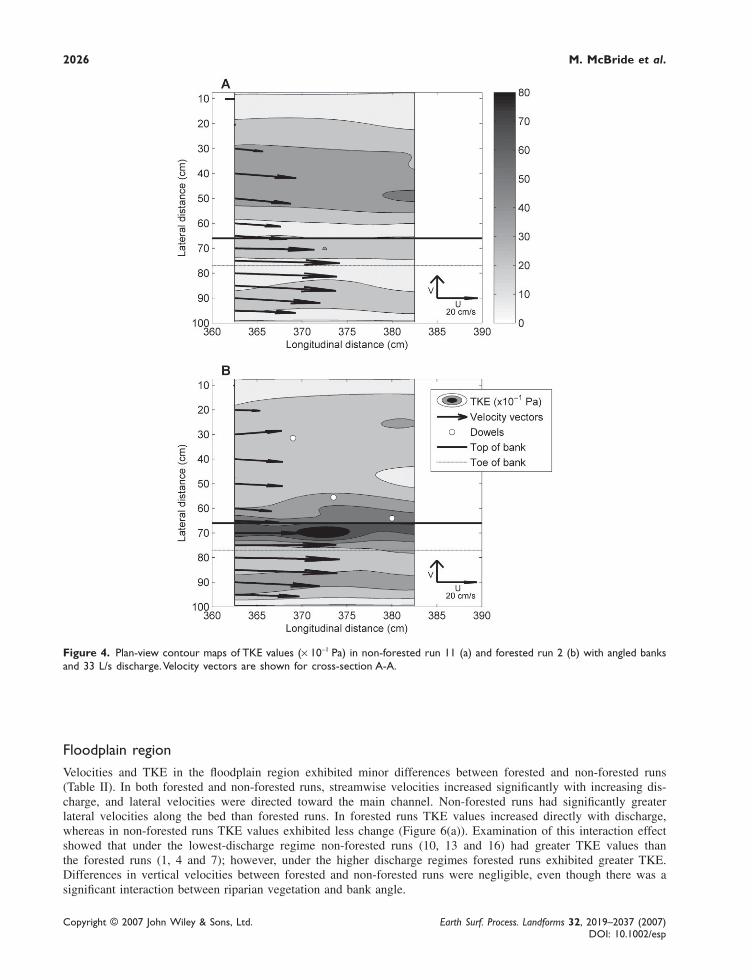
Values of velocities and TKE throughout the sampled cross-section of the flume varied depending on location, riparianvegetation type, discharge and bank angle. Plan-view plots of the sampled area display near-bed velocities withvectors and near-bed TKE in shaded contours for runs 2 and 11 (Figure 4). Trends in these figures are generallyrepresentative of results from all runs. In the forested scenario, a narrow band of high TKE values was apparent atapproximately 70 cm in the cross-section, occurring at the interface between the floodplain and the main channel, withvalues more than double those observed in the corresponding non-forested run. In the non-forested scenario, thehighest TKE values occur on the floodplain with additional bands of elevated TKE at 70 and 90 cm. Both figuresdemonstrated the dominant streamwise velocities, and substantially higher velocities in the main channel versus thefloodplain.
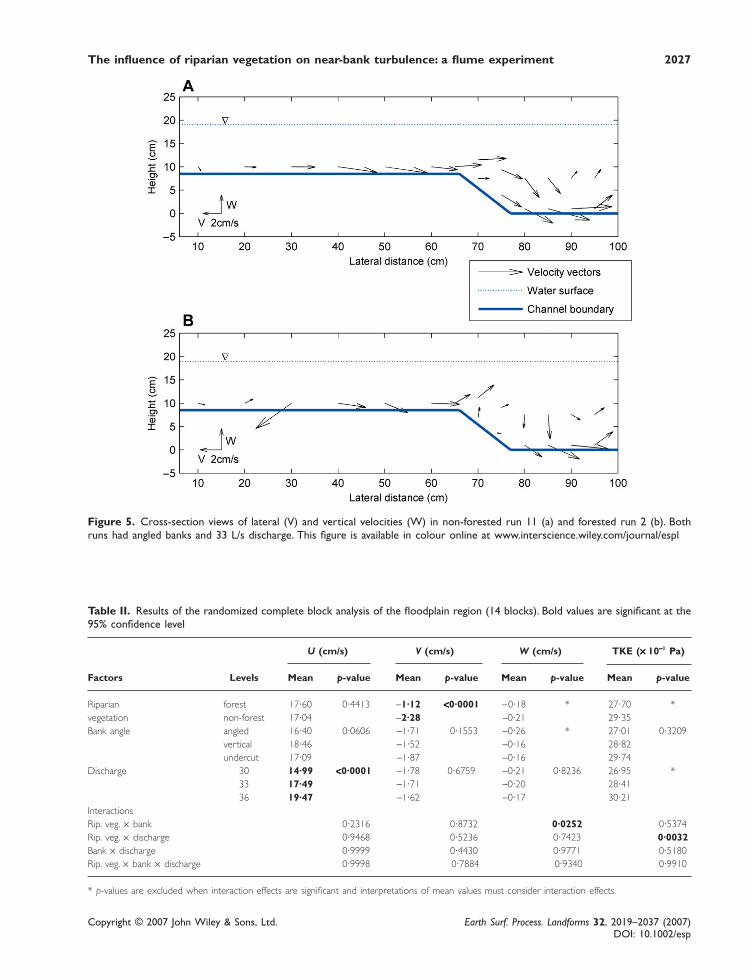
Lateral and vertical velocity vectors are shown in cross-section plots (Figure 5(a) and (b)), and are generally similarfor both forested and non-forested runs. Velocity vectors in the non-forested run display small lateral currents smoothlyflowing from the floodplain to the main channel; however, velocity vectors in the forested run are more complicated,especially in the near-bank region. Although it was not possible to measure velocities near the water surface due tolimitations of the downward-facing probe, secondary circulation is presumed, such that surface velocities would bedirected back to the floodplain in both forested and non-forested runs. Compound channels commonly exhibit multipleregions of secondary circulation (Wormleaton, 1996; Nezu, 2005). Deviations from these general trends and detailedfindings including interactions between factors for subsequent flume runs are described below by region (floodplain,near-bank and main channel). Due to the experimental design with three fixed factors (riparian vegetation, bank angleand discharge), results were multifaceted and, commonly, the response of the system to one factor was dependent onthe levels of the other factors.
2026 M. McBride et al.
Copyright © 2007 John Wiley & Sons, Ltd. Earth Surf. Process. Landforms 32, 2019–2037 (2007)DOI: 10.1002/esp
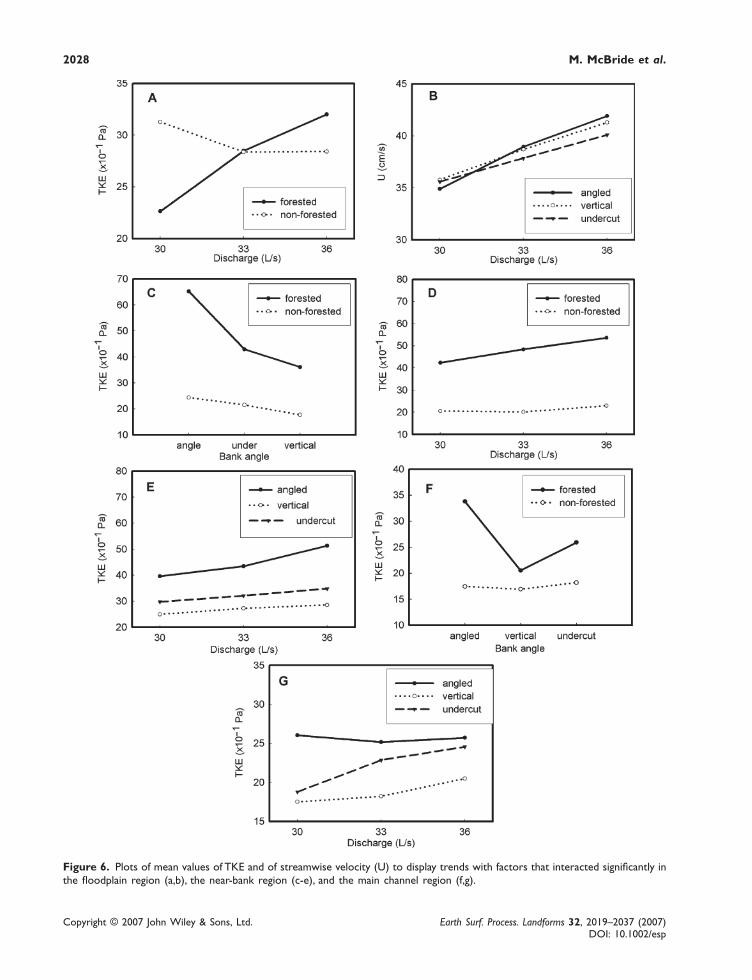
Floodplain regionVelocities and TKE in the floodplain region exhibited minor differences between forested and non-forested runs(Table II). In both forested and non-forested runs, streamwise velocities increased significantly with increasing dis-charge, and lateral velocities were directed toward the main channel. Non-forested runs had significantly greaterlateral velocities along the bed than forested runs. In forested runs TKE values increased directly with discharge,whereas in non-forested runs TKE values exhibited less change (Figure 6(a)). Examination of this interaction effectshowed that under the lowest-discharge regime non-forested runs (10, 13 and 16) had greater TKE values thanthe forested runs (1, 4 and 7); however, under the higher discharge regimes forested runs exhibited greater TKE.Differences in vertical velocities between forested and non-forested runs were negligible, even though there was asignificant interaction between riparian vegetation and bank angle.
Figure 4. Plan-view contour maps of TKE values (× 10−1 Pa) in non-forested run 11 (a) and forested run 2 (b) with angled banksand 33 L/s discharge. Velocity vectors are shown for cross-section A-A.
The influence of riparian vegetation on near-bank turbulence: a flume experiment 2027
Copyright © 2007 John Wiley & Sons, Ltd. Earth Surf. Process. Landforms 32, 2019–2037 (2007)DOI: 10.1002/esp
Table II. Results of the randomized complete block analysis of the floodplain region (14 blocks). Bold values are significant at the95% confidence level
U (cm/s) V (cm/s) W (cm/s) TKE (××××× 10−−−−−1 Pa)
Factors Levels Mean p-value Mean p-value Mean p-value Mean p-value
Riparian forest 17·60 0·4413 −1·12 <<<<<0·0001 −0·18 * 27·70 *vegetation non-forest 17·04 −2·28 −0·21 29·35Bank angle angled 16·40 0·0606 −1·71 0·1553 −0·26 * 27·01 0·3209
vertical 18·46 −1·52 −0·16 28·82undercut 17·09 −1·87 −0·16 29·74
Discharge 30 14·99 <<<<<0·0001 −1·78 0·6759 −0·21 0·8236 26·95 *33 17·49 −1·71 −0·20 28·4136 19·47 −1·62 −0·17 30·21
InteractionsRip. veg. × bank 0·2316 0·8732 0·0252 0·5374Rip. veg. × discharge 0·9468 0·5236 0·7423 0·0032Bank × discharge 0·9999 0·4430 0·9771 0·5180Rip. veg. × bank × discharge 0·9998 0·7884 0·9340 0·9910
* p-values are excluded when interaction effects are significant and interpretations of mean values must consider interaction effects.
Figure 5. Cross-section views of lateral (V) and vertical velocities (W) in non-forested run 11 (a) and forested run 2 (b). Bothruns had angled banks and 33 L/s discharge. This figure is available in colour online at www.interscience.wiley.com/journal/espl
2028 M. McBride et al.
Copyright © 2007 John Wiley & Sons, Ltd. Earth Surf. Process. Landforms 32, 2019–2037 (2007)DOI: 10.1002/esp
Figure 6. Plots of mean values of TKE and of streamwise velocity (U) to display trends with factors that interacted significantly inthe floodplain region (a,b), the near-bank region (c-e), and the main channel region (f,g).
The influence of riparian vegetation on near-bank turbulence: a flume experiment 2029
Copyright © 2007 John Wiley & Sons, Ltd. Earth Surf. Process. Landforms 32, 2019–2037 (2007)DOI: 10.1002/esp
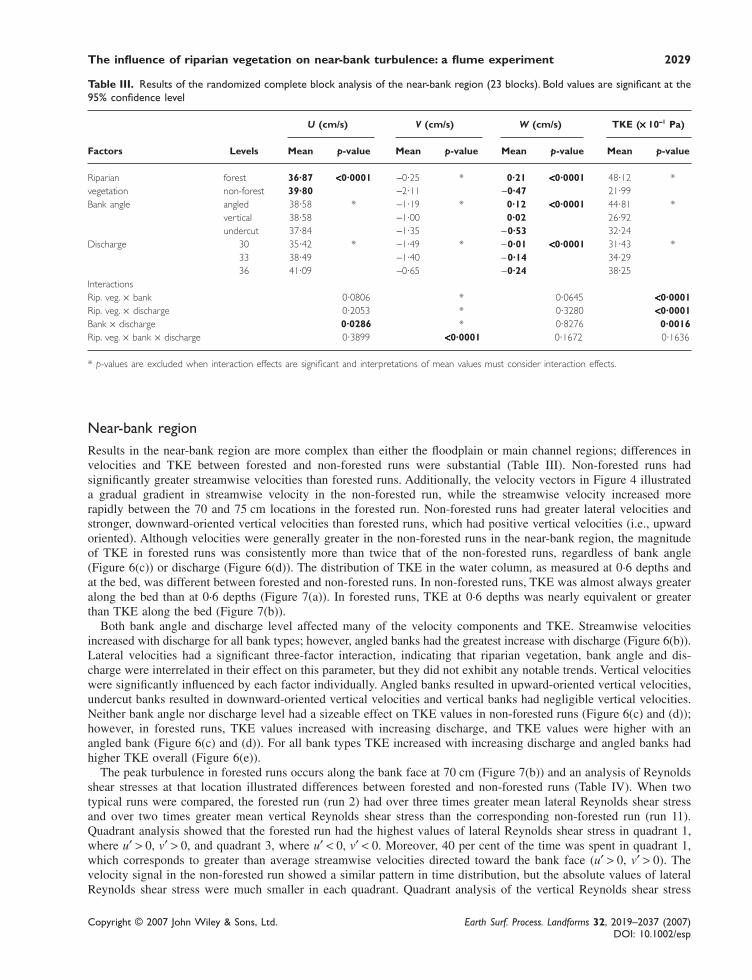
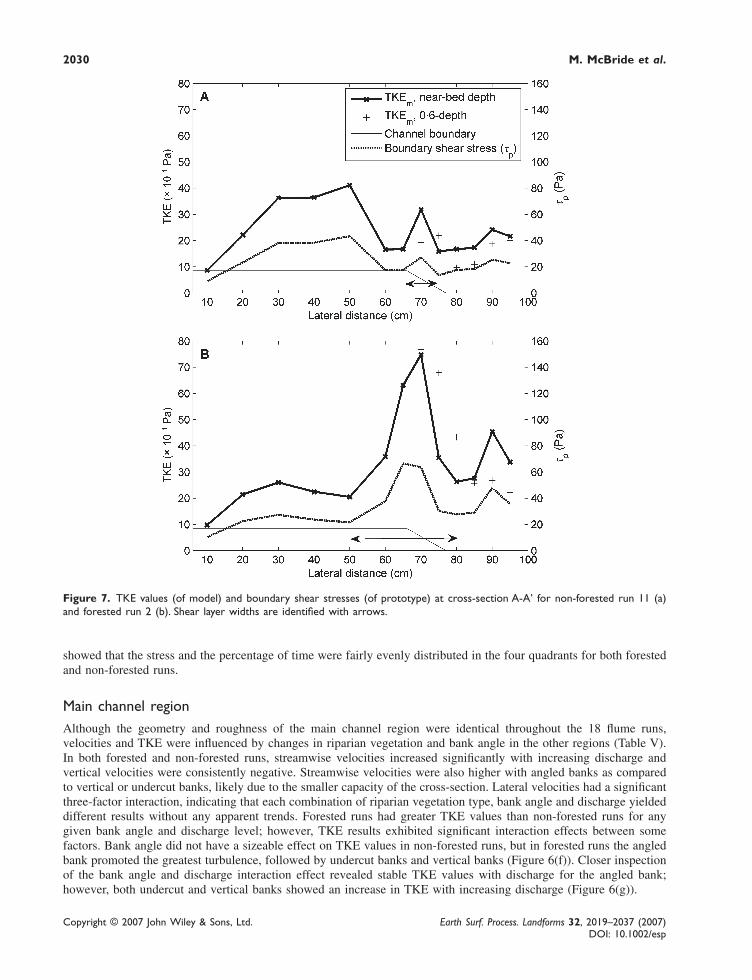
Near-bank regionResults in the near-bank region are more complex than either the floodplain or main channel regions; differences invelocities and TKE between forested and non-forested runs were substantial (Table III). Non-forested runs hadsignificantly greater streamwise velocities than forested runs. Additionally, the velocity vectors in Figure 4 illustrateda gradual gradient in streamwise velocity in the non-forested run, while the streamwise velocity increased morerapidly between the 70 and 75 cm locations in the forested run. Non-forested runs had greater lateral velocities andstronger, downward-oriented vertical velocities than forested runs, which had positive vertical velocities (i.e., upwardoriented). Although velocities were generally greater in the non-forested runs in the near-bank region, the magnitudeof TKE in forested runs was consistently more than twice that of the non-forested runs, regardless of bank angle(Figure 6(c)) or discharge (Figure 6(d)). The distribution of TKE in the water column, as measured at 0·6 depths andat the bed, was different between forested and non-forested runs. In non-forested runs, TKE was almost always greateralong the bed than at 0·6 depths (Figure 7(a)). In forested runs, TKE at 0·6 depths was nearly equivalent or greaterthan TKE along the bed (Figure 7(b)).
Both bank angle and discharge level affected many of the velocity components and TKE. Streamwise velocitiesincreased with discharge for all bank types; however, angled banks had the greatest increase with discharge (Figure 6(b)).Lateral velocities had a significant three-factor interaction, indicating that riparian vegetation, bank angle and dis-charge were interrelated in their effect on this parameter, but they did not exhibit any notable trends. Vertical velocitieswere significantly influenced by each factor individually. Angled banks resulted in upward-oriented vertical velocities,undercut banks resulted in downward-oriented vertical velocities and vertical banks had negligible vertical velocities.Neither bank angle nor discharge level had a sizeable effect on TKE values in non-forested runs (Figure 6(c) and (d));however, in forested runs, TKE values increased with increasing discharge, and TKE values were higher with anangled bank (Figure 6(c) and (d)). For all bank types TKE increased with increasing discharge and angled banks hadhigher TKE overall (Figure 6(e)).
The peak turbulence in forested runs occurs along the bank face at 70 cm (Figure 7(b)) and an analysis of Reynoldsshear stresses at that location illustrated differences between forested and non-forested runs (Table IV). When twotypical runs were compared, the forested run (run 2) had over three times greater mean lateral Reynolds shear stressand over two times greater mean vertical Reynolds shear stress than the corresponding non-forested run (run 11).Quadrant analysis showed that the forested run had the highest values of lateral Reynolds shear stress in quadrant 1,where u′ > 0, v′ > 0, and quadrant 3, where u′ < 0, v′ < 0. Moreover, 40 per cent of the time was spent in quadrant 1,which corresponds to greater than average streamwise velocities directed toward the bank face (u′ > 0, v′ > 0). Thevelocity signal in the non-forested run showed a similar pattern in time distribution, but the absolute values of lateralReynolds shear stress were much smaller in each quadrant. Quadrant analysis of the vertical Reynolds shear stress
Table III. Results of the randomized complete block analysis of the near-bank region (23 blocks). Bold values are significant at the95% confidence level
U (cm/s) V (cm/s) W (cm/s) TKE (××××× 10−−−−−1 Pa)
Factors Levels Mean p-value Mean p-value Mean p-value Mean p-value
Riparian forest 36·87 <<<<<0·0001 −0·25 * 0·21 <<<<<0·0001 48·12 *vegetation non-forest 39·80 −2·11 −0·47 21·99Bank angle angled 38·58 * −1·19 * 0·12 <<<<<0·0001 44·81 *
vertical 38·58 −1·00 0·02 26·92undercut 37·84 −1·35 −0·53 32·24
Discharge 30 35·42 * −1·49 * −0·01 <<<<<0·0001 31·43 *33 38·49 −1·40 −0·14 34·2936 41·09 −0·65 −0·24 38·25
InteractionsRip. veg. × bank 0·0806 * 0·0645 <<<<<0·0001Rip. veg. × discharge 0·2053 * 0·3280 <<<<<0·0001Bank × discharge 0·0286 * 0·8276 0·0016Rip. veg. × bank × discharge 0·3899 <<<<<0·0001 0·1672 0·1636
* p-values are excluded when interaction effects are significant and interpretations of mean values must consider interaction effects.
2030 M. McBride et al.
Copyright © 2007 John Wiley & Sons, Ltd. Earth Surf. Process. Landforms 32, 2019–2037 (2007)DOI: 10.1002/esp
Figure 7. TKE values (of model) and boundary shear stresses (of prototype) at cross-section A-A’ for non-forested run 11 (a)and forested run 2 (b). Shear layer widths are identified with arrows.
showed that the stress and the percentage of time were fairly evenly distributed in the four quadrants for both forestedand non-forested runs.
Main channel regionAlthough the geometry and roughness of the main channel region were identical throughout the 18 flume runs,velocities and TKE were influenced by changes in riparian vegetation and bank angle in the other regions (Table V).In both forested and non-forested runs, streamwise velocities increased significantly with increasing discharge andvertical velocities were consistently negative. Streamwise velocities were also higher with angled banks as comparedto vertical or undercut banks, likely due to the smaller capacity of the cross-section. Lateral velocities had a significantthree-factor interaction, indicating that each combination of riparian vegetation type, bank angle and discharge yieldeddifferent results without any apparent trends. Forested runs had greater TKE values than non-forested runs for anygiven bank angle and discharge level; however, TKE results exhibited significant interaction effects between somefactors. Bank angle did not have a sizeable effect on TKE values in non-forested runs, but in forested runs the angledbank promoted the greatest turbulence, followed by undercut banks and vertical banks (Figure 6(f)). Closer inspectionof the bank angle and discharge interaction effect revealed stable TKE values with discharge for the angled bank;however, both undercut and vertical banks showed an increase in TKE with increasing discharge (Figure 6(g)).

The influence of riparian vegetation on near-bank turbulence: a flume experiment 2031
Copyright © 2007 John Wiley & Sons, Ltd. Earth Surf. Process. Landforms 32, 2019–2037 (2007)DOI: 10.1002/esp
Table IV. Distribution of Reynolds shear stresses and percentage of time (inparentheses) by quadrant for two runs from measurements at location 70 cm alongcross-section A–A′
Forested Non-forested(run 2) (run 11)
Mean velocitiesU 34·5 39·4V −0·1 −1·2W 0·9 0·0
Quadrants1 u′ > 0, v′ > 0 −51·3 (40%) −17·5 (37%)2 u′ < 0, v′ > 0 17·6 (13%) 7·1 (15%)3 u′ < 0, v′ < 0 −72·6 (36%) −26·6 (34%)4 u′ > 0, v′ < 0 14·8 (11%) 6·9 (14%)Total mean −42·8 −13·3
Quadrants1 u′ > 0, w′ > 0 −27·1 (31%) −13·2 (33%)2 u′ < 0, w′ > 0 19·3 (20%) 8·0 (18%)3 u′ < 0, w′ < 0 −34·0 (29%) −15·6 (31%)4 u′ > 0, w′ < 0 16·2 (20%) 6·7 (18%)Total mean −10·9 −6·5
Late
ral R
eyno
lds
shea
r st
ress
Vert
ical
Rey
nold
ssh
ear
stre
ss
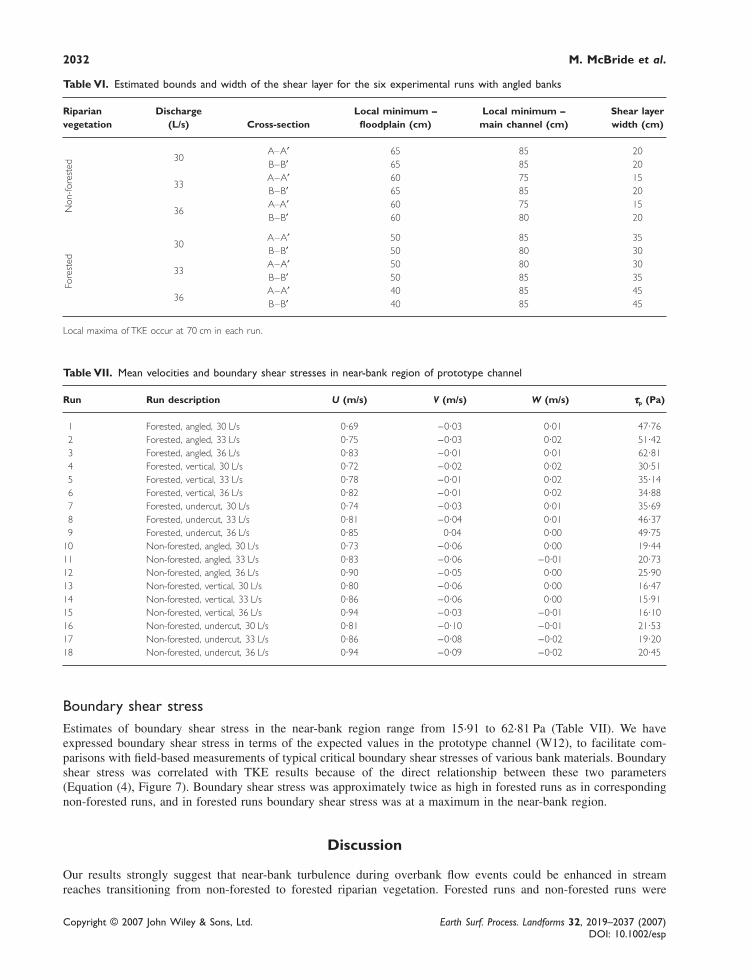
Shear layer widthEstimations of the shear layer width were slightly limited by the 5 cm measurement spacing in the near-bank region.However, approximations of shear layer widths, as measured from the local minima on either side of the maximumTKE value in the near-bank region, were much greater in forested than in non-forested runs with angled banks(Table VI, Figure 7). The mean shear layer width approximation in forested, angled-bank runs was 36·7 cm, doublethe mean value for similar non-forested runs (18·3 cm). In non-forested runs with vertical or undercut banks, therewere no local maxima at the interface of the floodplain and the main channel.
Table V. Results of the randomized complete block analysis of the main channel region (22 blocks). Bold values are significant atthe 95% confidence level
U (cm/s) V (cm/s) W (cm/s) TKE (××××× 10−−−−−1 Pa)
Factors Levels Mean p-value Mean p-value Mean p-value Mean p-value
Riparian forest 44·74 * −0·61 * −0·69 0·1487 26·75 *vegetation non-forest 44·25 −2·15 −0·62 17·54Bank angle angled 48·31 * −1·32 * −0·72 0·1337 25·64 *
vertical 42·95 −1·16 −0·64 18·73undercut 42·21 −1·66 −0·60 22·06
Discharge 30 42·64 <<<<<0·0001 −1·57 * −0·65 0·6347 20·77 *33 44·84 −1·64 −0·70 22·0736 46·00 −0·94 −0·62 23·58
InteractionsRip. veg. × bank <<<<<0·0001 * 0·5446 <<<<<0·0001Rip. veg. × discharge 0·2188 * 0·9961 0·4398Bank × discharge 0·2522 * 0·8869 0·0020Rip. veg. × bank × discharge 0·1545 <<<<<0·0001 0·9947 0·0873
* p-values are excluded when interaction effects are significant and interpretations of mean values must consider interaction effects.
2032 M. McBride et al.
Copyright © 2007 John Wiley & Sons, Ltd. Earth Surf. Process. Landforms 32, 2019–2037 (2007)DOI: 10.1002/esp
Table VI. Estimated bounds and width of the shear layer for the six experimental runs with angled banks
Riparian Discharge Local minimum – Local minimum – Shear layervegetation (L/s) Cross-section floodplain (cm) main channel (cm) width (cm)
30A–A′ 65 85 20B–B′ 65 85 20
33A–A′ 60 75 15B–B′ 65 85 20
36A–A′ 60 75 15B–B′ 60 80 20
30A–A′ 50 85 35B–B′ 50 80 30
33A–A′ 50 80 30B–B′ 50 85 35
36A–A′ 40 85 45B–B′ 40 85 45
Local maxima of TKE occur at 70 cm in each run.
Non
-fore
sted
Fore
sted
Table VII. Mean velocities and boundary shear stresses in near-bank region of prototype channel
Run Run description U (m/s) V (m/s) W (m/s) τττττp (Pa)
1 Forested, angled, 30 L/s 0·69 −0·03 0·01 47·762 Forested, angled, 33 L/s 0·75 −0·03 0·02 51·423 Forested, angled, 36 L/s 0·83 −0·01 0·01 62·814 Forested, vertical, 30 L/s 0·72 −0·02 0·02 30·515 Forested, vertical, 33 L/s 0·78 −0·01 0·02 35·146 Forested, vertical, 36 L/s 0·82 −0·01 0·02 34·887 Forested, undercut, 30 L/s 0·74 −0·03 0·01 35·698 Forested, undercut, 33 L/s 0·81 −0·04 0·01 46·379 Forested, undercut, 36 L/s 0·85 0·04 0·00 49·75
10 Non-forested, angled, 30 L/s 0·73 −0·06 0·00 19·4411 Non-forested, angled, 33 L/s 0·83 −0·06 −0·01 20·7312 Non-forested, angled, 36 L/s 0·90 −0·05 0·00 25·9013 Non-forested, vertical, 30 L/s 0·80 −0·06 0·00 16·4714 Non-forested, vertical, 33 L/s 0·86 −0·06 0·00 15·9115 Non-forested, vertical, 36 L/s 0·94 −0·03 −0·01 16·1016 Non-forested, undercut, 30 L/s 0·81 −0·10 −0·01 21·5317 Non-forested, undercut, 33 L/s 0·86 −0·08 −0·02 19·2018 Non-forested, undercut, 36 L/s 0·94 −0·09 −0·02 20·45
Boundary shear stressEstimates of boundary shear stress in the near-bank region range from 15·91 to 62·81 Pa (Table VII). We haveexpressed boundary shear stress in terms of the expected values in the prototype channel (W12), to facilitate com-parisons with field-based measurements of typical critical boundary shear stresses of various bank materials. Boundaryshear stress was correlated with TKE results because of the direct relationship between these two parameters(Equation (4), Figure 7). Boundary shear stress was approximately twice as high in forested runs as in correspondingnon-forested runs, and in forested runs boundary shear stress was at a maximum in the near-bank region.
Discussion
Our results strongly suggest that near-bank turbulence during overbank flow events could be enhanced in streamreaches transitioning from non-forested to forested riparian vegetation. Forested runs and non-forested runs were

The influence of riparian vegetation on near-bank turbulence: a flume experiment 2033
Copyright © 2007 John Wiley & Sons, Ltd. Earth Surf. Process. Landforms 32, 2019–2037 (2007)DOI: 10.1002/esp
differentiated by the magnitude and patterns of TKE. In forested runs, a narrow band of high TKE values formedlongitudinally in the flow above the bank surface (Figure 4(b)), which corresponded well to previous findings on thedistribution of TKE throughout a cross-section with a vegetated floodplain (Pasche and Rouve, 1985; Naot et al.,1996). Nezu and Onitsuka (2001) found that turbulence intensity of the streamwise velocity component and lateralReynolds shear stresses were at a maximum at the interface of a vegetated and a non-vegetated zone in a flat-bottomchannel. The orientation of the high-TKE band running parallel to the bank indicated that a highly turbulent shearlayer established at the interface of the floodplain and main channel. In non-forested runs, a similar peak of TKEoccurred along the bank surface, but it was much smaller than the TKE values measured in forested runs. High TKEvalues were found on the floodplain surface in non-forested runs likely due to bed shear (Table II; Figure 4(a)).Similarly, patterns in TKE at 0·6 depth versus near-bed depth suggested that TKE was driven primarily by bedroughness in the non-forested runs, whereas in forested runs TKE was elevated throughout the water column, probablydue to larger vortices forming along the shear layer (Figure 7). Horizontal vortices at the interface of a vegetated anda non-vegetated zone have been observed and mapped using high-resolution velocity data in flume experiments (Nezuand Onitsuka, 2001). Additionally, in forested runs, flow separation caused by the dowels likely redirects high-momentum fluid from the upper portion of the water column down toward the bed.
High turbulence in the near-bank region should be a direct function of the velocity difference (Tinkler, 1997) andthe magnitude of the resulting shear (Tennekes and Lumley, 1994) between the floodplain flow and the main channelflow. From similar research results, we expected reduced velocities in the forested floodplain and, consequently, alarger velocity differential as compared with the non-forested runs (Tsujimoto, 1996; Nezu and Onitsuka, 2001).Contrarily, streamwise velocities were not significantly reduced in the forested runs in the floodplain region whenmeasured at near-bed depths (Table II). The added resistance of the dowels in forested runs may have reducedfloodplain velocities in the upper portion of the water column, but we were unable to collect a velocity profile with ourdownward-facing probe. There was a greater velocity differential for forested runs than non-forested runs between thenear-bank and main channel regions; for forested runs the difference in mean streamwise velocities was nearly 8 cm/s,while for non-forested runs the difference was approximately 4 cm/s (Tables III and V).
Forested and non-forested runs exhibited differences in the spatial extent of the shear layer. Estimated shear layerwidth was substantially larger in forested runs than in non-forested runs (Table VI), extending from mid-floodplaininto the main channel (Figure 7(b)). Our observations of a pronounced peak of TKE values at approximately 70 cmlaterally (Figures 4(b) and 7(b)), coupled with a wider shear layer in the forested runs, is likely a result of the energycascade, where large vortices decay into progressively smaller vortices (Tritton, 1988). One of the interaction effectsalso indicates the effect of greater momentum transfer; in forested runs, bank angle strongly influenced TKE values inthe main channel region, but had no such effect in non-forested runs (Figure 6(f)). This correlation of TKE values inthe near-bank and main channel regions in forested runs is likely due to the mixing caused by the energy cascade.
Effects of dischargeThe key result of the variable discharge runs was that, although the magnitudes of turbulence and velocities changedwith discharge level, the pattern and distribution of these parameters did not change. Therefore, we might expect thesame hydraulic effects, given more frequent, smaller overbank flow events but smaller magnitudes overall. In mostcases, an increase in discharge corresponded to an increase in streamwise velocities and TKE. A notable exceptionwas observed with TKE in the floodplain region. In non-forested runs, TKE decreased slightly with increasingdischarge, suggesting that the turbulence caused by the synthetic grass layer was reduced with increasing water level.Conversely, in forested runs, where dowels were persistent obstructions, TKE increased with increasing discharge,suggesting that vortex shedding was apparently augmented with increased discharge.
Effects of bank angleThree bank angles were included in the experimental design to simulate a progression of bank erosion that mightcoincide with channel widening (i.e. from angled to vertical to undercut). Although some researchers found that bankangle was not of great importance in experiments with a vegetated floodplain (Pasche and Rouve, 1985), bank anglewas a significant factor in our results. With an angled bank, streamwise velocities and TKE were maximized withinthe channel (Figure 6(c) and (f)), likely due to the small cross-sectional area. TKE was greater for undercut thanvertical banks (Figure 6(f )), because undercut banks likely promoted additional turbulence from complex flow patternsaround the overhanging obstruction. Given that TKE in forested runs decreased significantly when the cross-sectionalarea was increased (with vertical and undercut banks) and given that our experimental channels were under-fit for atypical forested stream reach, we suspect that turbulence will become less exaggerated as a forested stream reach

2034 M. McBride et al.
Copyright © 2007 John Wiley & Sons, Ltd. Earth Surf. Process. Landforms 32, 2019–2037 (2007)DOI: 10.1002/esp
widens to its equilibrium size. A wider channel will decrease main channel flows due to its greater conveyance, whichwill, in turn, decrease the velocity differential and associated shear with floodplain flows.
Implications for channel wideningExaggerated turbulence generated from a forested floodplain during overbank flows may be a key driving mechanismresponsible for differences in channel width in stream reaches with different riparian vegetation. Because turbulencecreates instantaneous forces much greater than time-averaged values, sediment transport can occur at flows wherethe time-averaged conditions are below the critical entrainment threshold for sediments (Nelson et al., 1993; McLeanet al., 1994; Roy et al., 1999). When increased turbulence is coupled with high downstream velocities, entrainmentand transport of bank sediments are likely amplified (Thompson, 2004). Our experiment illustrated that when forestedvegetation is added to the floodplain of a small, previously non-forested stream, turbulence is strongly amplified alonga wide area between the floodplain and the main channel, including the entire bank face (Figure 7(b)). This addsanother feasible mechanism to the two predominant ideas that channel widening in reforested reaches is a result ofscour around LWD and bank weakness due to the suppression of grassy and understory vegetation (Zimmerman et al.,1967; Murgatroyd and Ternan, 1983; Davies-Colley, 1997; Trimble, 1997, 2004).
Researchers have attempted to quantify the role of turbulence in stream channel erosion by incorporating measuresof turbulence into estimations of boundary shear stress (Kim et al., 2000; Biron et al., 2004; Daniels and Rhoads,2004). Reach-averaged boundary shear stress, although commonplace, does not account for the role of turbulence,and methods that incorporate turbulence parameters may be more appropriate in some applications (Hilldale andPapanicolaou, 2001; Biron et al., 2004; Daniels and Rhoads, 2004). Hilldale and Papanicolaou (2001) assert thatconditions for bank erosion are under-predicted by the commonplace critical boundary shear stress method. In ourstudy, water depths were nearly equivalent in all runs (Table I), indicating that reach-averaged boundary shear stresswould have been nearly equivalent, as it is a function of the hydraulic radius and energy slope. Various methods ofestimating boundary shear stress were tested by Biron et al. (2004), and they found that boundary shear stressestimated using TKE produced the best estimate in a complex flow field around deflectors. In the Biron et al. (2004)study, patterns of bed scour around deflectors most closely paralleled the distribution of boundary shear stress pre-dicted by a relationship with TKE similar to Equation (4). Daniels and Rhoads (2004) used a similar method to showcorrelation between boundary shear stress and both the pattern of local bed scour around an LWD obstruction and thewidening of a small channel downstream from LWD.
Our estimates of boundary shear stress in W12 indicated that modeled overbank flows would exceed the criticalboundary shear stress of some stream bank materials. Although in situ measurements of critical boundary shearstresses along the banks of W12 were not available, measured values of critical boundary shear stresses have beenpublished for bank materials in southwestern Virginia and range from 0 Pa to 21·9 Pa (Wynn and Mostaghimi, 2006).Even the most resistant banks measured in the Wynn and Mostaghimi (2006) study would not be able to withstand theboundary shear stresses of the forested runs projected from our results. Inquiry into expected bank erosion is beyondthe scope of this study; however, estimates of boundary shear stress indicate a conducive environment for bankerosion and for the initiation of channel widening.
Results from the quadrant analysis may begin to describe how the flow dynamics could promote erosion of the banksurface. The flow dynamics attributed to scour or sediment entrainment along a stream bed have been more widelyinvestigated, and, commonly, the initiation of sediment movement is attributed to sweeps of fluid (Best, 1993; Bironet al., 1993; Buffin-Belanger and Roy, 1998; Papanicolaou et al., 2001). Sweeps occur when higher than averagestreamwise velocities are coupled with vertical velocities directed toward the bed (u′ > 0, w′ < 0; Best, 1993), and theyhave been associated with bed scour at channel confluences (Biron et al., 1993) and pebble clusters (Buffin-Belangerand Roy, 1998). We suspect that bank scour might be similarly associated with higher than average streamwisevelocities coupled with lateral velocities directed into the bank (u′ > 0, v′ > 0; quadrant 1 in Table IV). Our quadrantanalysis showed that along the bank face quadrant 1 events were predominant in percentage of time and had a greatermean Reynolds shear stress than quadrants 2 (u′ < 0, v′ > 0) or 4 (u′ > 0, v′ < 0). Experiments with erodible beds andbanks would be needed to demonstrate whether this particular flow characteristic might initiate stream bank erosion.
Finally, our investigation of near-bank turbulence suggests that stream banks might become more susceptible toerosion with the introduction of forested vegetation; however, we cannot make direct conclusions about bank stabilityas this study did not investigate the resistive forces. Although bank stability depends on many different factors, forestvegetation in small streams is often recognized for strengthening banks and slowing channel migration (Stott, 1997;Parkyn et al., 2003; Allmendinger et al., 2005). Given the results of previous studies, we suspect that the high-turbulence shear layer phenomenon observed in this study is a process that would operate only during overbank floodsand only for a finite time period. Intermittent overbank flows in streams where forested riparian vegetation is being
The influence of riparian vegetation on near-bank turbulence: a flume experiment 2035
Copyright © 2007 John Wiley & Sons, Ltd. Earth Surf. Process. Landforms 32, 2019–2037 (2007)DOI: 10.1002/esp
recolonized or replanted could promote a shift in channel size from the narrow, non-forested equilibrium to a new,wider equilibrium. Over time, we suspect that the widened stream with mature forested riparian vegetation will reacha dynamic equilibrium because velocities and shear stresses will become reduced with the stream’s larger capacity.Other processes may function to maintain mature forested reaches in a wider equilibrium and non-forested reaches ina narrower equilibrium, such as described in the model of Allmendinger et al. (2005). Allmendinger et al. (2005)found rates of deposition and lateral migration to be higher in non-forested reaches than in forested reaches, and theysuggest that equilibrium widths develop to equalize rates of cutbank erosion and vegetation-mediated rates of deposi-tion on active floodplains.
Future workOur results put forth an unacknowledged potential mechanism for channel widening in response to reforestation ofriparian areas; however, many aspects of the channel widening phenomenon remain unresolved. Of all the theorizeddriving mechanisms, we do not know which are significant or how they might interact. Next steps for experimentalwork might include testing with erodible beds and banks to investigate whether boundary shear stress based on TKEis an appropriate estimation, to explore how bank morphology might respond and interact with the turbulent flow fieldand to examine whether forested channels might reach an equilibrium size. Moreover, field-based studies are neededto confirm whether experimental results are valid in real streams and to further explore the complexities that cannot beduplicated in a flume experiment, such as seasonal effects, unsteady flow regimes and other natural conditions.
Conclusion
Results of a series of flume experiments simulating stream reaches in transition from non-forested to forested riparianvegetation showed that turbulence generation during overbank flow events may be exacerbated when forested riparianvegetation is introduced. Our flume experiment was a first step to identify the turbulence patterns in overbank flows,with the marked simplification of a fixed bed. Because enhanced turbulence along the bank interface creates instanta-neous forces much greater than time-averaged values, boundary shear stresses capable of entraining and transportingsediment are likely amplified. Estimations of boundary shear stress based on TKE illustrated that modeled flowswould likely exceed the critical boundary shear stress of some bank materials. Other results such as the location ofhigh turbulence, the spatial extent of the turbulence and patterns in Reynolds shear stresses in forested runs illustratedadditional facets of the hydraulic conditions that could initiate bank erosion. Results confirm that this potential drivingmechanism for channel widening should be added to the set of plausible theories concerning the morphologic differ-ences between forested and non-forested reaches of small streams, while recognizing that further testing of thismechanism and the aforementioned theories is necessary.
AcknowledgementsResearch was supported in part by the National Science Foundation Graduate Fellowship Program, a graduate research assistantshipfrom the Vermont Experimental Program to Stimulate Competitive Research (VT EPSCoR, EPS0236976) and a student equipmentgrant from NortekUSA. We thank Tracy Owen, Andrea Pearce, Floyd Vilmont and Jeff Buzas for their essential help with flumeconstruction, data collection and data analysis. This paper improved substantially thanks to the helpful reviews of Jim Pizzuto andan anonymous reviewer.
References
Albers J. 2000. Hands on the Land: A History of the Vermont Landscape. MIT Press: Cambridge, MA.Allmendinger NE, Pizzuto JE, Potter N, Johnson TE, Hession WC. 2005. Riparian vegetation and width adjustment in laterally migrating
rivers of eastern Pennsylvania, U.S.A. Geological Society of America Bulletin 117: 229–243.Anderson RJ, Bledsoe BP, Hession WC. 2004. Stream and river channel width response to riparian vegetation, bank material texture, and
other factors. Journal of the American Water Resources Association 40: 1159–1172.Bennett SJ, Alonso CV. 2003. Physically modeling stream channel adjustment to woody riparian vegetation. EOS Transactions AGU 84:
Abstract H52A-1171.Best JL. 1993. On the interactions between turbulent flow structure, sediment transport and bedform development: some considerations from
recent experimental research. In Turbulence: Perspectives on Flow and Sediment Transport, Clifford NJ, French JR, Hardisty J (eds).Wiley: Chichester; 61–92.
2036 M. McBride et al.
Copyright © 2007 John Wiley & Sons, Ltd. Earth Surf. Process. Landforms 32, 2019–2037 (2007)DOI: 10.1002/esp
Biron PM, De Serres B, Roy AG, Best JL. 1993. Shear layer turbulence at an unequal depth channel confluence. In Turbulence: Perspectiveson Flow and Sediment Transport, Clifford NJ, French JR, Hardisty J (eds). Wiley: Chichester; 197–214.
Biron PM, Robson C, Lapointe MF, Gaskin SJ. 2004. Comparing different methods of bed shear stress estimates in simple and complex flowfields. Earth Surface Processes and Landforms 29: 1403–1415.
Bradshaw P, Ferris DH, Atwell NP. 1967. Calculation of boundary-layer development using the turbulent energy equation. Journal of FluidMechanics 28: 593–616.
Buffin-Belanger T, Roy AG. 1998. Effects of a pebble cluster on the turbulent structure of a depth-limited flow in a gravel-bed river.Geomorphology 25: 249–267.
Chanson H. 1999. The Hydraulics of Open Channel Flow. Arnold: London.Charlton FG, Brown PM, Benson RW. 1978. The Hydraulic Geometry of Some Gravel Rivers in Britain: Wallingford, England. Hydraulics
Research Station: Wallingford, UK.Clifford NJ, French JR. 1993. Monitoring and modelling turbulent flows: historical and contemporary perspectives. In Turbulence: Perspec-
tives on Flow and Sediment Transport, Clifford NJ, French JR, Hardisty J (eds). Wiley: Chichester; 1–34.Daniels MD, Rhoads BL. 2004. Spatial pattern of turbulence kinetic energy and shear stress in a meander bend with large woody debris. In
Riparian Vegetation and Fluvial Geomorphology, Bennett SJ, Simon A (eds). American Geophysical Union: Washington, DC; 87–98.Darby SE. 1999. Effect of riparian vegetation on flow resistance and flood potential. Journal of Hydraulic Engineering – ASCE 125: 443–
454.Davies-Colley RJ. 1997. Stream channels are narrower in pasture than in forest. New Zealand Journal of Marine and Freshwater Research
31: 599–608.Garcia MH, Lopez F, Dunn C, Alonso CV. 2004. Flow, turbulence, and resistance in a flume with simulated vegetation. In Riparian
Vegetation and Fluvial Geomorphology, Bennett SJ, Simon A (eds). American Geophysical Union: Washington, DC; 11–28.Gran K, Paola C. 2001. Riparian vegetation controls on braided stream dynamics. Water Resources Research 37: 3275–3283.Gregory KJ, Gurnell AM. 1988. Vegetation and river channel form and process. In Biogeomorphology, Viles HA (ed.). Blackwell: Oxford;
11–42.Gregory SV, Swanson FJ, McKee WA, Cummins KW. 1991. An ecosystem perspective of riparian zones: focus on links between land and
water. Bioscience 41: 540–551.Hession WC. 2001. Riparian forest and urban hydrology influences on stream channel morphology: implications for restoration. In World
Water and Environmental Resources Congress, Phelps D, Sehlke G (eds). American Society of Civil Engineers: Reston, VA.Hession WC, Johnson TE, Charles DF, Hart DD, Horwitz RJ, Kreeger DA, Pizzuto JE, Velinsky DJ, Newbold JD, Cianfrani C, Clason T,
Compton AM, Coulter N, Fuselier L, Marshall BD, Reed J. 2000. Ecological benefits of riparian reforestation in urban watersheds: studydesign and preliminary results. Environmental Monitoring and Assessment 63: 211–222.
Hession WC, Pizzuto JE, Johnson TE, Horwitz RJ. 2003. Influence of bank vegetation on channel morphology in rural and urban water-sheds. Geology 31: 147–150.
Hey RD, Thorne CR. 1986. Stable channels with mobile gravel beds. Journal of Hydraulic Engineering 112: 671–689.Hilldale R, Papanicolaou A. 2001. Characteristics of flow and erosion in a natural stream with loess-type banks. In Proceedings of the
Federal Interagency Sedimentation Conferences, 1947 to 2001. US Subcommittee on Sedimentation: Reno, NV; I-176–I-183.Ikeda S, Kanazawa M. 1996. Three-dimensional organized vortices above flexible water plants. Journal of Hydraulic Engineering 122: 634–
640.JMP. 2002. JMP Statistics and Graphics Guide. SAS Institute: Cary, NC.Johnson CG, Laraway GA. 1971. Flood Magnitude and Frequency of Small Massachusetts Streams. USGS: Washington, DC.Kim SC, Friedrichs CT, Maa JPY, Wright LD. 2000. Estimating bottom stress in tidal boundary layer from acoustic Doppler velocimeter
data. Journal of Hydraulic Engineering – ASCE 126: 399–406.Lane SN, Biron PM, Bradbrook KF, Butler JB, Chandler JH, Crowell MD, McLelland SJ, Richards KS, Roy AG. 1998. Three-dimensional
measurement of river channel flow processes using acoustic Doppler velocimetry. Earth Surface Processes and Landforms 23: 1247–1267.
Lu SS, Willmarth WW. 1973. Measurement of the structure of the Reynolds stress in a turbulent boundary layer. Journal of Fluid Mechanics60: 481–511.
McBride M, Hession WC, Thompson DM. 2005. Riparian vegetation influence on channel widths of small streams: revisiting SleepersRiver. In Managing Watersheds for Human and Natural Impacts, Moglen GE (ed.). American Society of Civil Engineers: Williamsburg,VA.
McClelland SJ, Ashworth PJ, Best JL. 1996. The origin and downstream development of coherent flow structures at channel junctions. InCoherent Flow Structures in Open Channels, Ashworth PJ, Bennett SJ, Best JL, McClelland SJ (eds). Wiley: Chichester; 459–489.
McLean SR, Nelson JM, Wolfe SR. 1994. Turbulence structure over 2-dimensional bed forms – implications for sediment transport. Journalof Geophysical Research – Oceans 99: 12 729–12 747.
Murgatroyd AL, Ternan JL. 1983. The impact of afforestation on stream bank erosion and channel form. Earth Surface Processes andLandforms 8: 357–369.
Naot D, Nezu I, Nakagawa H. 1996. Hydrodynamic behavior of partly vegetated open channels. Journal of Hydraulic Engineering – ASCE122: 625–633.
Nelson JM, McLean SR, Wolfe SR. 1993. Mean flow and turbulence fields over 2-dimensional bed forms. Water Resources Research 29:3935–3953.
Nezu I. 2005. Open-channel flow turbulence and its research prospect in the 21st century. Journal of Hydraulic Engineering – ASCE 131:229–246.

The influence of riparian vegetation on near-bank turbulence: a flume experiment 2037
Copyright © 2007 John Wiley & Sons, Ltd. Earth Surf. Process. Landforms 32, 2019–2037 (2007)DOI: 10.1002/esp
Nezu I, Onitsuka K. 2001. Turbulent structures in partly vegetated open-channel flows with LDA and PIV measurements. Journal ofHydraulic Research 39: 629–642.
Papanicolaou AN, Diplas P, Dancey CL, Balakrishnan M. 2001. Surface roughness effects in near-bed turbulence: implications to sedimententrainment. Journal of Engineering Mechanics 127: 211–218.
Parkyn SM, Davies-Colley RJ, Halliday NJ, Costley KJ, Croker GF. 2003. Planted riparian buffer zones in New Zealand: do they live up toexpectations? Restoration Ecology 11: 436–447.
Pasche E, Rouve G. 1985. Overbank flow with vegetatively roughened flood plains. Journal of Hydraulic Engineering – ASCE 111: 1262–1278.
Rosgen D. 1996. Applied River Morphology. Wildland Hydrology: Pagosa Springs, CO.Roy AG, Biron PM, Buffin-Belanger T, Levasseur M. 1999. Combined visual and quantitative techniques in the study of natural turbulent
flows. Water Resources Research 35: 871–877.Shiono K, Knight DW. 1991. Turbulent open-channel flows with variable depth across the channel. Journal of Fluid Mechanics 222: 617–
646.Smith CR. 1996. Coherent flow structures in smooth-wall turbulent boundary layers: facts, mechanisms, and speculation. In Coherent Flow
Structures in Open Channels, Ashworth PJ, Bennett SJ, Best JL, McClelland SJ (eds). Wiley: Chichester; 1–39.Stott T. 1997. A comparison of stream bank erosion processes on forested and moorland streams in the Balquhidder Catchments, Central
Scotland. Earth Surface Processes and Landforms 22: 383–399.Sweeney BW. 1992. Streamside forests and the physical, chemical, and trophic characteristics of piedmont streams in eastern North
America. Water Science and Technology 26: 2653–2673.Sweeney BW, Bott TL, Jackson JK, Kaplan LA, Newbold JD, Stanley LJ, Hession WC, Horwitz RJ. 2004. Riparian deforestation, stream
narrowing, and loss of stream ecosystem services. Proceeding of the National Academy of Sciences 101: 14132–14137.Tennekes H, Lumley JL. 1994. A First Course in Turbulence. MIT Press: Cambridge, MA.Thompson DM. 2004. The influence of pool length on local turbulence production and energy slope: a flume experiment. Earth Surface
Processes and Landforms 29: 1341–1358.Thompson DM. 2007. Turbulence characteristics in a shear zone downstream of a channel constriction in a coarse-grained pool. Geomorphology
83: 199–214.Thompson D, Wohl E. 1998. Flume experimentation and simulation of bedrock channel processes. In Rivers over Rock: Fluvial Processes in
Bedrock Channels, Tinkler KJ, Wohl EE (eds). American Geophysical Union: Washington, DC; 279–296.Tinkler KJ. 1997. Critical flow in rockbed streams with estimated values for Manning’s n. Geomorphology 20: 147–164.Trimble SW. 1997. Stream channel erosion and change resulting from riparian forests. Geology 25: 467–469.Trimble SW. 2004. Effects of riparian vegetation on stream channel stability and sediment budgets. In Riparian Vegetation and Fluvial
Geomorphology, Bennett SJ, Simon A (eds). American Geophysical Union: Washington, DC; 153–170.Tritton DJ. 1988. Physical Fluid Dynamics. Clarendon: Oxford.Tsujimoto T. 1996. Coherent fluctuations in a vegetated zone of open-channel flow: causes of bedload lateral transport and sorting. In
Coherent Flow Structures in Open Channels, Ashworth PJ, Bennett SJ, Best JL, McClelland SJ (eds). Wiley: Chichester; 375–396.Vermont Agency of Transportation (VTAOT). 1998. Hydraulics Manual. Vermont Agency of Transportation: Montpelier, VT.Wahl TL. 2000. Analyzing ADV data using WinADV. In Proceedings of the 2000 Joint Conference on Water Resources Engineering and
Water Resources Planning and Management, Hotchkiss RH, Glade M (eds). American Society of Civil Engineers: Minneapolis, MN.Wormleaton PR. 1996. Floodplain secondary circulation as a mechanism for flow and shear stress redistribution in straight compound
channels. In Coherent Flow Structures in Open Channels, Ashworth PJ, Bennett SJ, Best JL, McClelland SJ (eds). Wiley: Chichester;581–608.
Wynn T, Mostaghimi S. 2006. The effects of vegetation and soil type on streambank erosion, southwestern Virginia, USA. Journal of theAmerican Water Resources Association 42: 69–82.
Zar JH. 1999. Biostatistical Analysis. Prentice-Hall: Upper Saddle River, NJ.Zimmerman RC, Goodlett JC, Comer GH. 1967. The influence of vegetation on channel form of small streams. In Symposium on River
Morphology. International Association of Scientific Hydrology: Bern; 255–275.