Embed Size (px)
Citation preview
Pure Appl. Chem., Vol. 71, No. 12, pp. 2317±2332, 1999.Printed in Great Britain.q 1999 IUPAC
2317
INTERNATIONAL UNION OF PURE AND APPLIED CHEMISTRY
MACROMOLECULAR DIVISION
COMMISSION ON POLYMER CHARACTERIZATION AND PROPERTIES
WORKING PARTY ON STRUCTURE AND PROPERTIES OF COMMERCIAL POLYMERS*
THE INFLUENCE OF REPROCESSING ON THESTRUCTURE±PROPERTY CHARACTERISTICS OF A
PLASTICIZED POLY(VINYL CHLORIDE) (PVC-p)COMPOUND
(Technical Report)
Prepared for publication by
C. DEHENNAU1 AND D. R. MOORE2²1Solvay Central Laboratory, B-1120 Brussels, Belgium
2ICI plc, Wilton, Middlesbrough, Cleveland, UK
*Contributing Members of the Working Party for this report were as follows:
D. R. Moore (UK); R. S. Bailey (UK); C. Dehennau (Belgium); F. Maurer (Sweden); P. Szewczyk (Poland); J. A. Covas
(Portugal); L. Glas (Belgium); M. Lecomte (Belgium); B. Pukansky (Hungary); V. Altstadt (Germany); J. Lyngaae-Jorgensen
(Denmark).
²Author for correspondence.
Republication or reproduction of this report or its storage and/or dissemination by electronic means is permitted
without the need for formal IUPAC permission on condition that an acknowledgement, with full reference to the
source along with use of the copyright symbol q, the name IUPAC and the year of publication are prominently
visible. Publication of a translation into another language is subject to the additional condition of prior approval
from the relevant IUPAC National Adhering Organization.

The in¯uence of reprocessing on thestructure±property characteristics of aplasticized poly(vinyl chloride) (PVC-p)compound (Technical Report)
Abstract: We have conducted a detailed investigation of the change in deformational
structural, molecular and rheological characteristics that are attendant on a plasticized
poly(vinyl chloride) (PVC-p) compound experiencing higher processing temperatures. Our
study re¯ects an experience that occurs in the PVC industry where a loss of processing
performance accompanies excursions to higher temperatures. It is apparent that, as this process
continues, the material will eventually become unprocessable, unless changes are made.
The change that accompanies the material as it passes from an experience of low processing
temperatures to high processing temperatures has been thoroughly mapped. However, it has
been dif®cult to make a precise observation of the molecular and structural changes occurring.
This has not been without application of a number of likely candidate methodologies, including
differential scanning calorimetry (DSC), thermogravimetric analysis (TGA), wide angle X-ray
scattering (WAXS), gel permeation chromatography (GPC) and ¯uorescence spectroscopy. It
would seem that some additional crystallization is accompanying the increase in gelation that
occurs at higher processing temperatures. At the same time, the observations on the in¯uence
of annealing indicate that this is not the only consideration and that diffusion of the plasticizer
into the PVC particles might also be playing a role, or even residual stresses in the materials
might be important.
This study has not only been concerned with an in-depth materials characterization; it has
also explored ways of alleviating the loss of processability. Two particular lines of study
involving pre-shear history and blending with higher plasticized compounds have provided
interesting, albeit inconclusive, results. On the other hand, there are strong implications from
the DSC study that reversibility of the `process aging' is not likely.
In conclusion, it is interesting to observe that, by conducting this study through an IUPAC
Working Party, it has been helpful to pool the resources and experience of an international
community of scientists which has probably given us an opportunity of conducting this study at
much lower costs than might have otherwise been the case.
INTRODUCTION
Plasticized poly(vinyl chloride) (PVC-p) compounds are used in numerous large tonnage applications, such
as sheathing, electrical insulation, industrial pro®les, etc. Such compounds are thermoplastic in origin and
therefore products made from these materials can be reclaimed and made available for recycling.
The original compound is prepared by an extrusion compounding technique where it receives
suf®cient thermal and shear history so as to disperse the various ingredients of the compound and to be
con®gured into a shape (e.g. granules) suitable for subsequent processing (often by extrusion) into a
product. Each stage of processing would seem to in¯uence the properties of the compound. These changes
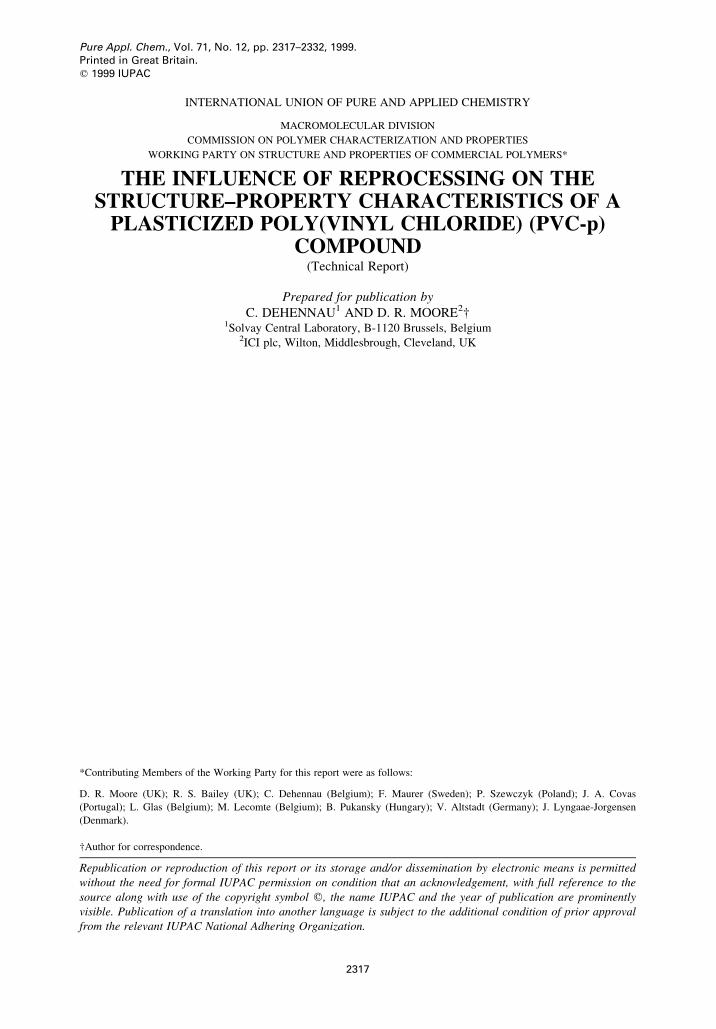
can be monitored by pressure through a `zero' length die (P0) as a function of processing temperature (T)
[1]. A typical P0 versus T plot is shown in Fig. 1, and this enables us to de®ne certain stages of material
development. For example, Material A is the lightly compounded PVC-p; Material B might be some version
of a reprocessed (at some higher temperature) form of the material and available as a regrind of the
compound. As can be seen from Fig. 1, Material B will be dif®cult to de®ne in terms of a speci®c location on
the plot of P0 versus T. Material C represents material at the extreme of this process. It has undergone
either severe processing or multiprocessing. Material C would be easier to de®ne and prepare.
2318 COMMISSION ON POLYMER CHARACTERIZATION AND PROPERTIES
q 1999 IUPAC, Pure Appl. Chem. 71, 2317±2332
If PVC-p is to be recycled through a reprocessing route, it will be necessary eventually to cope with the
properties of Material C. In a general sense, Material C is dif®cult to process. Therefore, the aim of this
project is to determine what makes Material C a dif®cult material to process. In particular, we wish to
describe how it differs from Material A. If this can be achieved, then it will be easier to explore whether
Material C can be modi®ed in any way so as to make its reprocessing easier. With the immense worldwide
usage of PVC-p, this would provide signi®cant energy, cost and ef®ciency savings.
This research project has been conducted by an international team of scientists participating through
one of the International Union of Pure and Applied Chemistry (IUPAC) Working Parties, namely
Working Party IV.2.1 concerned with the Structure and Properties of Commercial Plastics. The list of
participating laboratories is summarized in Table 1.
MATERIALS AND SAMPLE PREPARATION
Laboratories 1 and 2 prepared the samples for the study. An experimental formulation was selected that
would minimize the material complications which are often attendant on PVC formulations. The
formulation was based on ISO K70 suspension homopolymer of poly(vinyl chloride) (PVC) (see Table 2).
A dry blend was ®rst prepared from this formulation and then a compound, designated Compound A,
was prepared to be equivalent to Material A of Fig. 1 by compounding in a Buss Kneader PR 100 machine
to a measured processing temperature of 126 8C. Compound A was then available in granule form.
Compound A was then reprocessed in a single screw 45 mm Bandera extruder to achieve a processing
temperature of 185 8C. The extrudate was then granulated to provide Compound C in order to be
Structure±property characteristics of a PVC-p compound 2319
q 1999 IUPAC, Pure Appl. Chem. 71, 2317±2332
Fig. 1 Pressure through a zero length die versus processing temperature for de®ning material state.
Table 1 Participants in the research study
Laboratory number Laboratory institution Laboratory participants
1 ICI plc, UK D. M. Stocks, R. S. Bailey, D. R. Moore,
R. C. Stephenson (for European Vinyl
Corporation)
2 Solvay SA, Belgium E. Gandin, C. Dehennau
3 Chalmers University, Sweden F. Maurer
4 Instytut Przemyslu Tworzyw i. Farb, Poland P. Szewczyk
5 University of Minho, Portugal J. A. Covas, A. V. Machado, M. J. Oliveira
6 Shell Research SA, Belgium L. Glas, M. Lecomte, K. Neelen, K. Vaes,
M. Weverbergh
7 Technical University of Budapest, Hungary B. Pukanszky
8 Technical University Hamburg-Harburg, V. Altstadt
Germany
9 Danmarks Tekniske Universitet, Denmark P. F. Pind, J. Lyngaae-Jorgensen
representative of Material C of Fig. 1. As shown later, the effective melt temperature attained upon
preparing these samples can be different from the set values, due to a balance between heat transfer and
viscous dissipation. Using a differential scanning calorimetry (DSC) technique on traces of samples A
and C, Laboratory 5 suggested that sample A reached about 150 8C, whereas sample C was prepared at
184 8C. This is corroborated by the well `melted' appearance of both types of pellets.
Many of the rheological measurements were made on granules of Compounds A and C, but the
mechanical property and structural measurements required ¯at sheets of the materials. Therefore, we
attempted to convert Compounds A and C from granular to sheet form. This required further processing,
and both compression moulding and sheet extrusion techniques were employed. The aim was to conduct
this processing with minimum change to the structure and morphology of the materials.
Compression moulded plaques were made by a two-stage process; mixing on a two-roll mill, followed
by consolidation on the hydraulic press. This produced samples of nominal thickness 1.8 mm. Sheet
samples were prepared by extrusion on a Troester UP 30 single screw machine with an accompanying
three-roll calender stack. This produced sheet of nominal thickness 3.2 mm. Table 3 summarizes the
processing histories for the four samples, namely compression moulded plaques of Compounds A and C
and extruded sheet samples of Compounds A and C. It is noticeable that the barrel temperature for the
preparation of the extruded sheet for compound C was 180 8C which is lower than the compounding
temperature.
All the laboratories in the programme therefore had granules and two types of sheet for Compounds A
and C available for their measurements. It was not assumed that the structural and morphological states
for the compounds remained the same, and so their characterization formed part of the experimental
study.
EXPERIMENTAL STUDY AND DISCUSSION OF RESULTS
Characterization of moulded and extruded sheet and comparison with granularsamples
Laboratory 2 conducted tensile deformational tests at 23 8C on an Instron model 4302 at a test speed of
50 mm/min using ISO 2 type specimens. The results are shown in Table 4.
Laboratory 4 also conducted a similar set of tensile experiments, albeit with slightly different
conditioning of the samples. Their results are similar to those summarized in Table 4, which show that
2320 COMMISSION ON POLYMER CHARACTERIZATION AND PROPERTIES
q 1999 IUPAC, Pure Appl. Chem. 71, 2317±2332
Table 2 PVC formulation
Ingredient Mass fraction
of resin
K70 suspension homopolymer 100%
Dioctyl phthalate (DOP) plasticizer 50%
Tribasic lead sulfate (TBLS) stabilizer 4%
Calcium stearate lubricant 1%
Table 3 Summary of processing temperatures for the two types of sheet
Compound A: Compound C: Compound A: Compound C:
compression compression extruded sheet extruded sheet
moulded plaques moulded plaques strips strips
Designated sample name Compound A plaque Compound C plaque Compound A sheet Compound C sheet
Processing temperature (8C) 140 175 Barrel 148 Barrel 180
Die 144 Die 155

there are no signi®cant differences between the two forms of sheet for either Compound A or C. However,
there are signi®cant differences between the properties for Compound A and C. Compound C exhibits a
much higher energy to fracture than Compound A because it is stronger and more ductile. This provides
evidence that the difference between A and C is not simply a loss of plasticizer.
Rheological characterization was conducted in the temperature range 126±200 8C on an Instron
capillary rheometer on a die of length to radius (l/r) ratio of 1 and an entry angle of 908. Although
measurements were taken over a shear rate range of 1.8±600/s, Table 5 shows results for a mid-range
value of 60/s. A similar trend would be observed at the other shear rates.
With reference to Table 5 it is clear that no rheological difference can be detected between the plaque
or sheet properties for either Compound A or C. However, the pressure drops are higher for Compound C
than for Compound A for all temperatures between 126 and 184 8C. However, these differences
disappear at temperatures of 200 8C where the pressure drops can be taken to be the same within
experimental signi®cance.
These results suggest that there are only limited differences between the samples in the form of sheet
and plaques.
Laboratory 2 also made this comparison in rheological behaviour between granules, plaque and sheet
for both compounds using the same capillary rheometer conditions mentioned above. Table 6 shows the
results, again at the mid-range shear rate of 60/s at a test temperature of 126 8C, where differences will be
maximized.
It is apparent from the data in Table 6 that, whilst there are only small differences in the rheological
characteristics of Compound C in any of the three forms, the original granules of Compound A are
different from the plaque and sheet. We expected such results because higher processing temperatures
Structure±property characteristics of a PVC-p compound 2321
q 1999 IUPAC, Pure Appl. Chem. 71, 2317±2332
Table 4 Tensile properties at 23 8C for the two types of sheet sample
Compound A plaque Compound A sheet Compound C plaque Compound C sheet
Fracture stress (MPa) 15.9 16.2 20.8 21.2
[0.6] [0.3] [0.5] [0.5]
Fracture strain (%) 207 214 304 310
[12] [6] [12] [4]
Values in square brackets are the standard deviations from ®ve specimens.
Table 5 Total pressure drop (kPa) through an l/r die of 1 at a shear rate of 60/s
Temperature
for test (8C) Compound A plaque Compound A sheet Compound C plaque Compound C sheet
126 580 680 1150 1040
146 290 300 490 470
166 210 200 240 240
185 140 150 110 120
200 39 35 35 36
Table 6 Total pressure (kPa) through a die of l/r of 1 at 126 8C and a shear rate of 60/s
Granules Plaque Sheet
Compound A 270 580 680
Compound C 1010 1150 1050

needed to be used over the original compounding temperature in preparing sheet samples from
Compound A.
Mechanical and structural comparisons between Compounds A and C
The results shown in Table 4 from Laboratory 2 and others from Laboratory 4 have introduced the
differences between Compounds A and C in a tensile deformational test at 23 8C where considerably
higher fracture toughness (as the integral of the stress versus strain curve) is associated with Compound C.
Laboratory 2 accounts for this difference in terms of the higher levels of gelation expected with this
sample. We shall quantify this effect in due course. Laboratory 2 also conducted dynamical mechanical
analysis (DMA) on Compounds A and C from the plaque samples using a DuPont 983 analyser operating
at 1 Hz with a displacement amplitude of 0.5 mm. Although they detected little difference in the storage
modulus in the temperature range ÿ100 8C to �100 8C, it was noticeable that the modulus for Compound
C was larger than that for Compound A. In addition, they observed a small but signi®cant difference in the
glass transition temperatures (Tg). Compound A showed a Tg at ÿ15.1 8C, whilst Compound C showed a
Tg at ÿ12.9 8C and, although this is a small difference, it is believed to be real.
Laboratory 4 conducted DMA measurements on a Polymer Laboratories instrument operating at 1 Hz
with a heating rate of 3 8C/min. They observed a higher storage modulus for Compound C in the
temperature range ÿ30 8C to �100 8C and a lower Tg for Compound C by about 4 8C. They also measured
the Shore A hardness on the plaque samples (according to ISO 868) and recorded plaque A at 85.5 and
plaque C at 87.5. They showed that this was due to lower volatiles in plaque C, probably associated with
its lower content of plasticizer, as a consequence of further processing.
Laboratory 8 also conducted DMA measurements in shear on a Rheometrics RDA II analyser at 1 Hz
and a heating rate of 4 K/min, and in tension on a Rheometrics RSA-SL solid analyser at a frequency of
6.28 rad/s with a strain of 0.1% and the same heating rate as for the shear measurements. They prepared
test specimens from the sheet for the shear measurements and from the plaques for the tensile
measurements. In addition to testing as-received samples, they also annealed their specimens for 10 h and
60 h at 70 8C.
In general, their results agreed with those from Laboratory 2 and 4 and they made a number of
observations.
(i) The storage modulus for Compound C was higher over the entire temperature range compared with
that for Compound A, although the differences were quite small.
(ii) The Tg of Compound C was lower than that for Compound A by about 1 8C.
(iii) The onset of `melting', as seen by a drop in modulus well above 100 8C, was about 10 8C higher for
Compound C than that for Compound A.
(iv) Annealing in¯uences the DMA curves, as shown in Fig. 2 for Compound A and Fig. 3 for
Compound C, for the shear experiments. In both cases, as expected, annealing increases the storage
modulus, although to a larger extent for Compound A compared with the relative change for
Compound C.
Laboratory 8 also conducted some cyclic fatigue experiments on a computer-controlled servo-
hydraulic fatigue testing machine (Schenck model S56) at a frequency of 2 Hz with a sinusoidal applied
waveform. The signal was controlled by ensuring that, during the loading phase, the displacement was
kept constant at 10 mm and, during the unloading phase, the minimum load did not become smaller than
4 MPa. The specimens were of a dog-bone type S1 according to DIN 53504. The hysteresis loop of stress
versus strain during fatigue was monitored as a function of the number of fatigue cycles up to 100 000
cycles. The area of the hysteresis curve is the lost energy during the test [2], and this was recorded as a
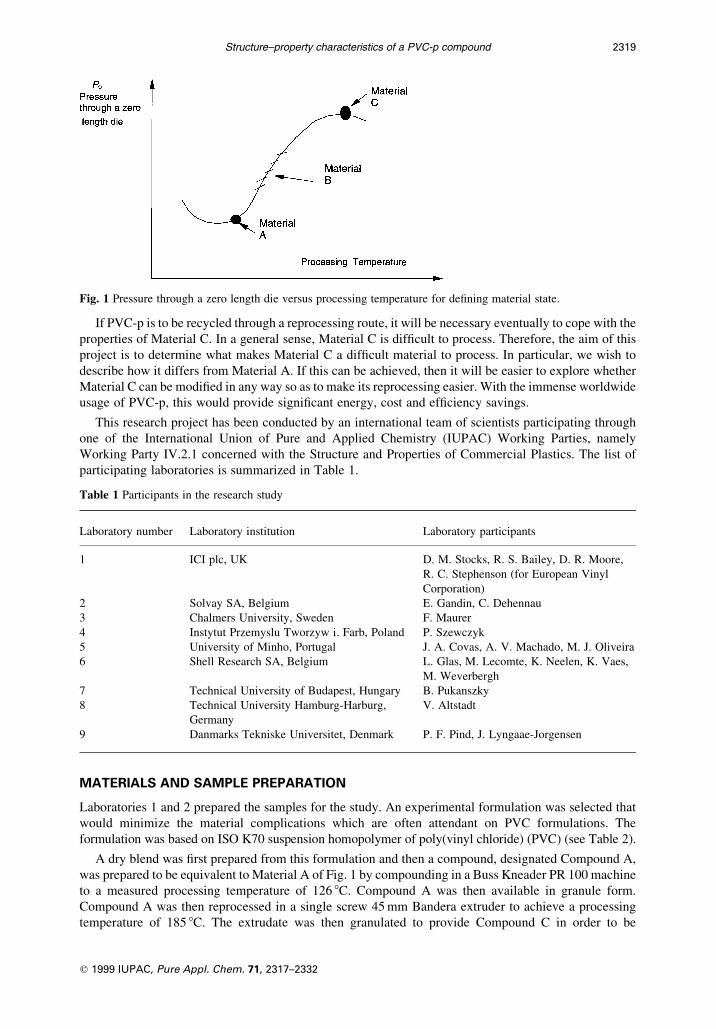
function of the number of cycles for as-received and annealed plaque samples. Figure 4 shows the lost
energy versus the number of cycles for both as-received compounds, where it is clear that more energy is
lost for Compound C, although the change with the number of cycles is not too dissimilar for either.
Annealing the samples reduces the lost energy for both compounds; the more severe the annealing, the
less the lost energy.
Laboratory 7 reviewed the possible importance of processing history on behaviour, in particular, the
2322 COMMISSION ON POLYMER CHARACTERIZATION AND PROPERTIES
q 1999 IUPAC, Pure Appl. Chem. 71, 2317±2332

Structure±property characteristics of a PVC-p compound 2323
q 1999 IUPAC, Pure Appl. Chem. 71, 2317±2332
Fig. 2 DMA measurements under shear loading for Compound A sheet before and after annealing for 60 h at
70 8C.
Fig. 3 DMA measurements under shear loading for Compound C sheet before and after annealing for 60 h at
70 8C.
balancing effects of diffusion of the additives (particularly plasticizer in this work) and the in¯uence of
gelation. The process of mixing the additives with the PVC and establishing a state of gelation during
processing will likely be incomplete. This implies that the process of annealing of the samples can
in¯uence the mixing or diffusion of the additives. Consequently, the in¯uence of annealing on the DMA
and fatigue results implies that the state of mixing (and certainly gelation) is different for Compounds A
and C.
On the other hand, we have observed that the annealing effect is more important for sample A than for
sample C (as presented by Laboratory 8 on the DMA curve). Also, the Tg values of the two compounds are
practically the same after annealing (Figs. 2 and 3). Therefore, there is an implication that the state of
internal stress for the two samples might be different, bearing in mind that sample A is prepared at a lower
temperature than that for sample C. These possible differences in internal stress can also in¯uence the
fatigue behaviour.
Such considerations will in¯uence the morphology of the samples. Therefore, Laboratory 8 attempted
to distinguish between the levels of crystallinity and crystal perfection of the samples by conducting some
wide angle X-ray scattering (WAXS) measurements. Although they were able to estimate a level of
crystallinity at about 10%, they observed no differences in crystallinity between the two compounds.
Rheological, structural and molecular comparisons between Compounds A and C
Laboratory 2 conducted an extensive capillary rheometry investigation. A number of their results are
summarized in the data given in Tables 5 and 6 where, in general terms, it is clear that the viscosity of
Compound C is larger than that for Compound A. Their measurements also incorporated the in¯uence of
the die total entry angle, which they altered from 20 8 to 180 8. In addition, they conducted a qualitative
investigation of melt fracture behaviour by observing the quality of the rod extrudate in their capillary
rheometer tests. In all, four conclusions emerged from their studies.
(i) The biggest differences in rheological behaviour between Compounds A and C are observed at the
lowest test temperatures (126 8C in their experiments).
(ii) The in¯uence of the total entry angle on the pressure drop data seems to be a function of the
gelation level and the temperature.
(iii) The extrudates from Compound A always have a good appearance (low melt fracture), except at
185 8C where the same level of poor quality as with Compound C is found.
(iv) The extrudates from Compound C show a very poor appearance at the lowest temperatures used.
For example, at 126 8C, a powder type extrudate was obtained. Laboratory 6 used both rheological and
DSC methods in order to quantify the level of gelation in the samples. A Rosand twin bore capillary
rheometer was used to measure entrance pressure losses at a temperature of 125 8C with a die with l/r� 2
and an entry angle of 180 8C. A Perkin Elmer DSC 7 instrument was used to conduct the thermal analysis
using specimens of 10 mg which were heated from 23 8C to 215 8C at a rate of 20 8C/min.
They started with Compounds A and C in granule form, but created other samples by additional
2324 COMMISSION ON POLYMER CHARACTERIZATION AND PROPERTIES
q 1999 IUPAC, Pure Appl. Chem. 71, 2317±2332
Fig. 4 Effect of reprocessing on the hysteresis parameter lost energy as plotted against the number of fatigue
cycles.
processing of both materials on a Collin roll mill at temperatures of 146 8C and 166 8C. Therefore six
samples were available for the study: Compound A as-received (i.e. processed at 126 8C) and Compound
A processed at 146 8C and 166 8C, as well as Compound C as-received (i.e. processed at 185 8C) and
Compound C processed at 146 8C and 166 8C. These six samples are designated: A[126], A[146], A[166],
C[146], C[166] and C[185].
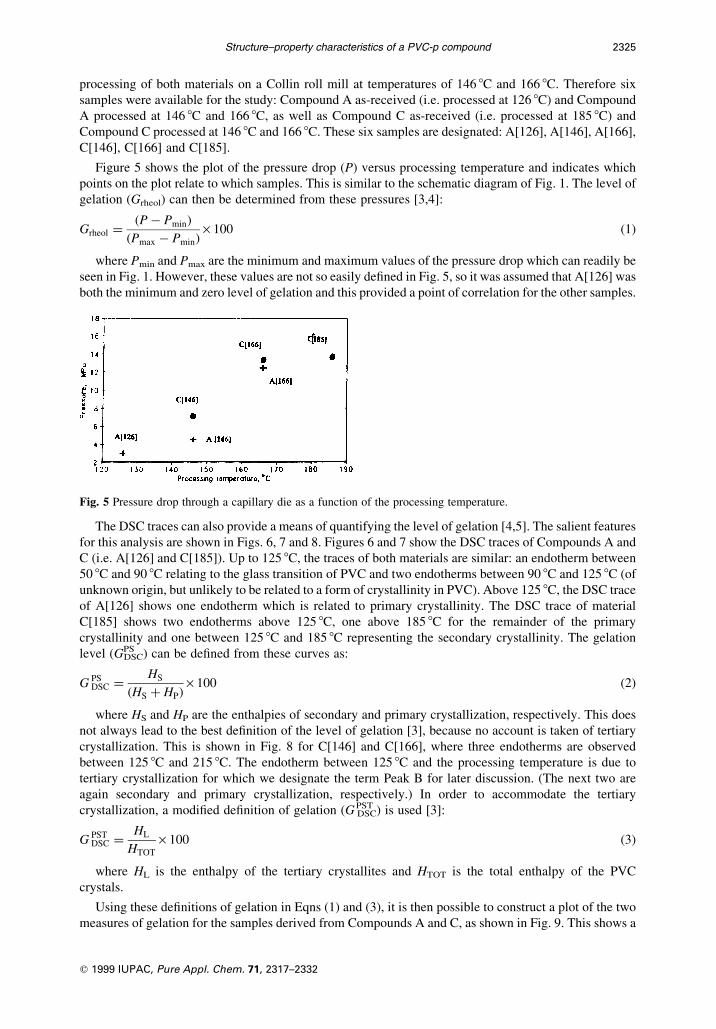
Figure 5 shows the plot of the pressure drop (P) versus processing temperature and indicates which
points on the plot relate to which samples. This is similar to the schematic diagram of Fig. 1. The level of
gelation (Grheol) can then be determined from these pressures [3,4]:
Grheol ��P ÿ Pmin�
�Pmax ÿ Pmin�´ 100 �1�
where Pmin and Pmax are the minimum and maximum values of the pressure drop which can readily be
seen in Fig. 1. However, these values are not so easily de®ned in Fig. 5, so it was assumed that A[126] was
both the minimum and zero level of gelation and this provided a point of correlation for the other samples.
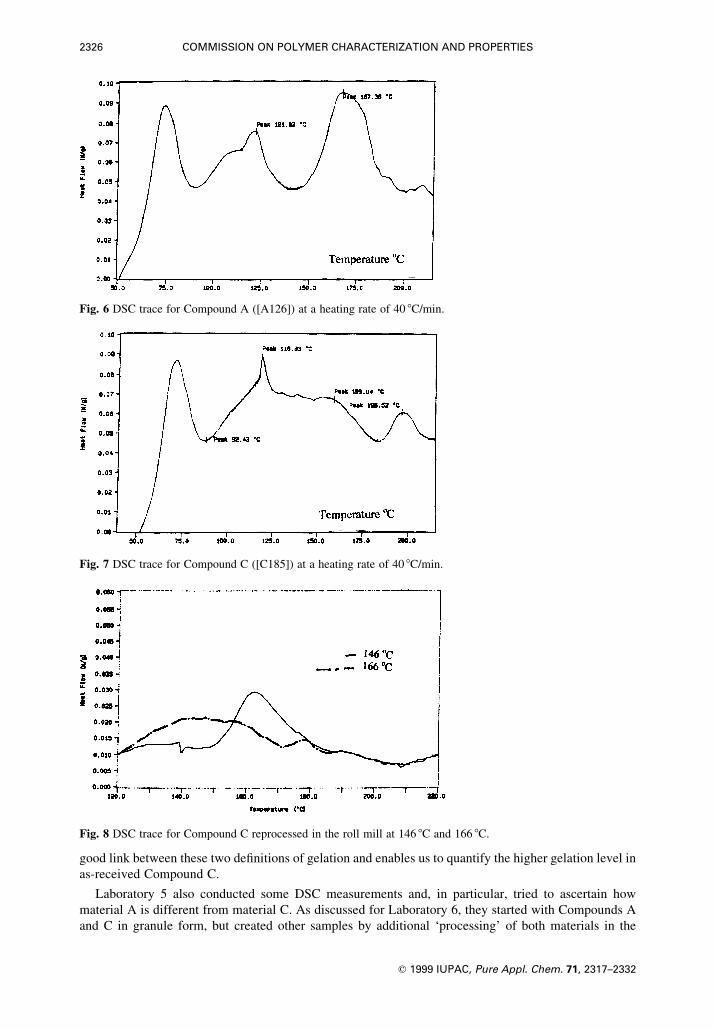
The DSC traces can also provide a means of quantifying the level of gelation [4,5]. The salient features
for this analysis are shown in Figs. 6, 7 and 8. Figures 6 and 7 show the DSC traces of Compounds A and
C (i.e. A[126] and C[185]). Up to 125 8C, the traces of both materials are similar: an endotherm between
50 8C and 90 8C relating to the glass transition of PVC and two endotherms between 90 8C and 125 8C (of
unknown origin, but unlikely to be related to a form of crystallinity in PVC). Above 125 8C, the DSC trace
of A[126] shows one endotherm which is related to primary crystallinity. The DSC trace of material
C[185] shows two endotherms above 125 8C, one above 185 8C for the remainder of the primary
crystallinity and one between 125 8C and 185 8C representing the secondary crystallinity. The gelation
level (GPSDSC) can be de®ned from these curves as:
G PSDSC �
HS
�HS � HP�´ 100 �2�
where HS and HP are the enthalpies of secondary and primary crystallization, respectively. This does
not always lead to the best de®nition of the level of gelation [3], because no account is taken of tertiary
crystallization. This is shown in Fig. 8 for C[146] and C[166], where three endotherms are observed
between 125 8C and 215 8C. The endotherm between 125 8C and the processing temperature is due to
tertiary crystallization for which we designate the term Peak B for later discussion. (The next two are
again secondary and primary crystallization, respectively.) In order to accommodate the tertiary
crystallization, a modi®ed de®nition of gelation (GPSTDSC) is used [3]:
G PSTDSC �
HL
HTOT
´ 100 �3�
where HL is the enthalpy of the tertiary crystallites and HTOT is the total enthalpy of the PVC
crystals.
Using these de®nitions of gelation in Eqns (1) and (3), it is then possible to construct a plot of the two
measures of gelation for the samples derived from Compounds A and C, as shown in Fig. 9. This shows a
Structure±property characteristics of a PVC-p compound 2325
q 1999 IUPAC, Pure Appl. Chem. 71, 2317±2332
Fig. 5 Pressure drop through a capillary die as a function of the processing temperature.
good link between these two de®nitions of gelation and enables us to quantify the higher gelation level in
as-received Compound C.
Laboratory 5 also conducted some DSC measurements and, in particular, tried to ascertain how
material A is different from material C. As discussed for Laboratory 6, they started with Compounds A
and C in granule form, but created other samples by additional `processing' of both materials in the
2326 COMMISSION ON POLYMER CHARACTERIZATION AND PROPERTIES
q 1999 IUPAC, Pure Appl. Chem. 71, 2317±2332
Fig. 6 DSC trace for Compound A ([A126]) at a heating rate of 40 8C/min.
Fig. 7 DSC trace for Compound C ([C185]) at a heating rate of 40 8C/min.
Fig. 8 DSC trace for Compound C reprocessed in the roll mill at 146 8C and 166 8C.

furnace of the DSC, under well-controlled heating histories. Hence, pellets A were heated to 150 8C,
160 8C, 170 8C, 180 8C, 190 8C, 200 8C and 210 8C, thus creating seven samples. Identically, pellets of
material C were subjected to lower and higher temperatures than that attained upon processing, thus
producing a further seven samples. Figure 10 represents the onset of tertiary (Peak B) crystallization, as
de®ned earlier, plotted against the process temperature attained in the DSC. There is a good correlation
between the results obtained by processing in a `production' type machine and the DSC. Therefore, by
observing the Peak B onset temperature of the DSC traces of samples A and C, one can estimate that they
were produced at processing temperatures that approximate to 152 8C and 184 8C, respectively.
The gelation level of all the samples can be de®ned as in Eqn (2), which would produce a curve similar
to that shown in Fig. 9. This means that heating sample A at progressively higher temperatures produces
characteristics (primary and secondary crystallinities) closer to those of sample C. As shown in Fig. 5, at
constant processing temperatures, the gelation of samples produced from C is higher than that of samples
obtained from A, given the original role of shear upon their preparation. The features of the various DSC
traces observed when reprocessing samples are depicted in Fig. 11. Figure 11 shows DSC traces of
sample A heated to 184 8C (similar to the temperature reached when preparing sample C) and
subsequently heated to 150 8C, 160 8C, 170 8C and 180 8C (i.e. A/184/160 designates a sample heated to
Structure±property characteristics of a PVC-p compound 2327
q 1999 IUPAC, Pure Appl. Chem. 71, 2317±2332
Fig. 9 Gelation from DSC plotted against gelation from capillary data.
Fig. 10 DSC results for the onset temperature for `process B' versus processing temperature.

184 8C and then subsequently reheated to 160 8C). The appearance of peaks corresponding to primary,
secondary and tertiary crystallinity are easily perceived [5]. This seems to demonstrate that, at the
structural level, gelation is not reversible, i.e. sample A can be transformed into sample C with adequate
heat and shear, but sample C cannot be converted into sample A, since it retains some `memory' of
previous processing cycles. Nevertheless, one should bear in mind that differences in the macroscopic
behaviour (rheology and mechanical properties) between samples A and C are not only explicable in
structural terms, but also in morphological features (e.g. destruction of grains, primary particles, etc).
Laboratory 8 also conducted some DSC measurements and, in particular, explored the in¯uence of
annealing on the DSC traces. They employed the same annealing conditions as already discussed and, of
particular note, they observed for material A that the Tg of the compound was reduced from ÿ14 8C to
18 8C after 10 h at 70 8C and then to ÿ24 8C after 60 h at 70 8C. This is more dramatic a change in Tg than
that reported earlier for the in¯uence of reprocessing, i.e. when comparing the Tg values of Compounds A
and C.
Laboratories 3, 5 and 9 conducted some molecular characterization of the two compounds. Laboratory
3 used a gel permeation chromatography (GPC) technique (Waters 150CV on-line with a Wyatt dawn
F[LS]), and concluded that there were no observable differences between Compounds A and C in terms of
their molecular weight distribution and no long chain branching was observed. Laboratories 5 and 9
con®rmed this conclusion with their size exclusion chromatographic (SEC) technique, again based on an
apparatus from Waters Associates, model 200.
Laboratory 1 attempted the measurement of the entanglement densities of Compounds A and C in the
form of plaque and sheet mouldings in order to explore subtle differences in molecular structure.
According to the procedures of Wu [6,7], it is possible to determine entanglement densities from a
measurement of `plateau modulus' (GN0), which is obtained by oscillatory shear on a torsional rheometer.
In practice, a plateau modulus is not observed but, instead, by careful measurement, it was possible to
determine a point of in¯exion at a critical test frequency. The `plateau modulus' is then used to determine
the molecular weight of entanglement (Me):
Me � rRT =G 0N �4�
where R is the gas constant and r is the melt density, which was taken to be 1200 kg/m3. The
entanglement density (ne) was then derived from the relationship:
ne � ra=Me �5�
where the amorphous density (ra) is taken as 1300 kg/m3.
Results are summarized in Table 7 which indicate more entanglement in Compound C, although the
2328 COMMISSION ON POLYMER CHARACTERIZATION AND PROPERTIES
q 1999 IUPAC, Pure Appl. Chem. 71, 2317±2332
Fig. 11 DSC results for sample A heated to 184 8C and subsequently reheated to other temperatures in the range
150±180 8C.

differences are so small that the likely conclusion is that these samples show a negligible difference in
entanglement density.
Laboratory 5 also used thermogravimetric analysis (TGA) and ¯uorescence measurements to estimate
whether the observed changes in the behaviour of the samples were due to changes in gelation, or whether
degradation could play a role. Samples A and C were exposed to 150 8C, 160 8C and 184 8C during
increasing periods of time and their weight loss was compared. The choice of the temperatures is related
to the values attained upon preparing the pellets. Figure 12 compares the relative rates of degradation of
samples A and C when heated to 150 8C. Despite the higher temperatures attained upon preparing sample
C, it seems to be less degraded than sample A. This could be explained by the fact that higher levels of
gelation promote the progressive destruction of the PVC granular morphology, hence allowing a more
effective action of the stabilizer. Figure 12 also shows the rate of degradation of sample C when subjected
to increasing temperatures. As expected, the higher the temperature, the higher the rate of degradation.
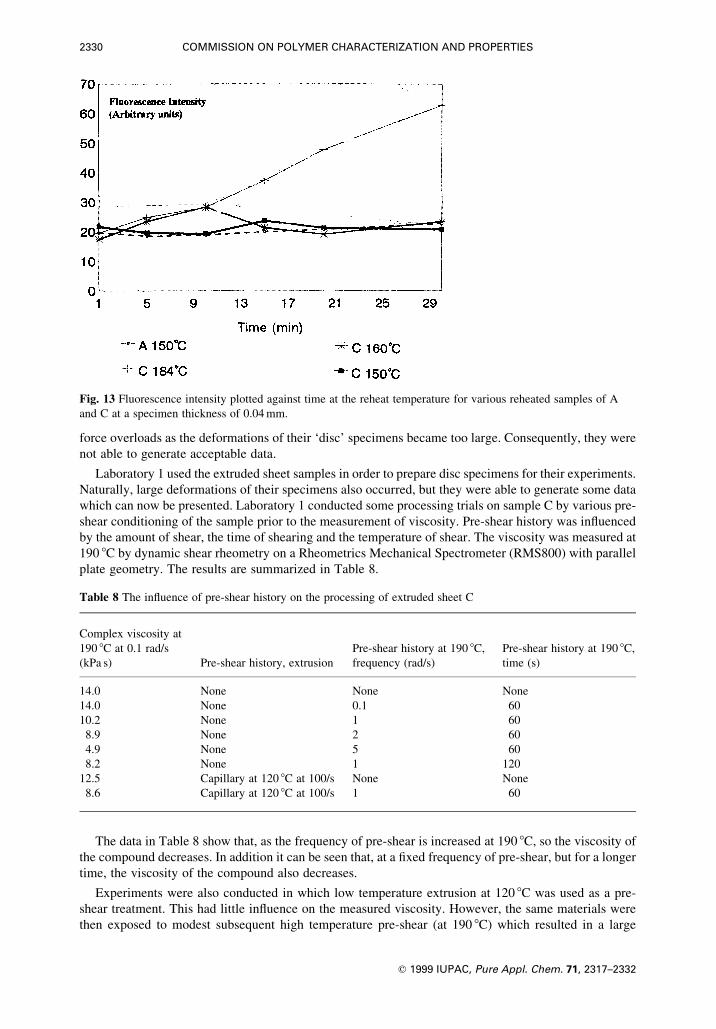
Figure 13 shows measurements of the ¯uorescence intensity at the same temperatures as above. It is
well known that degraded PVC ¯uoresces in the visible region of the spectrum, where the amount of
¯uorescence is proportional to the degree of degradation. The measurements shown in Fig. 13 were
conducted by attaching a photometer to an optical microscope in re¯ection mode. As the area of
measurement was kept constant, the amount of light corresponds to a `¯uorescence index'. The results
agree with those obtained with TGA, although the technique cannot discriminate between samples A and
C exposed to 150 8C.
Processing comparisons between samples A and C
Two laboratories attempted to impose a well-described strain history on the samples in order to explore
the in¯uence of shear dynamics on the rheological properties. Laboratory 6 attempted their experiments
by using the granular feedstock to form a disc specimen, but experienced torque overloads and normal
Structure±property characteristics of a PVC-p compound 2329
q 1999 IUPAC, Pure Appl. Chem. 71, 2317±2332
Table 7 Summary of data for the determination of entanglement density
Compound A Compound A Compound C Compound C
plaque sheet plaque sheet
Entanglement density (mmol/cm3) 0.25 0.28 0.28 0.28
GN0 (Pa) 6.8 ´ 105 7.7 ´ 105 7.6 ´ 105 7.7 ´ 105
Fig. 12 TGA results for various reheated versions of samples A and C showing weight loss versus time at the
reheat temperature.
force overloads as the deformations of their `disc' specimens became too large. Consequently, they were
not able to generate acceptable data.
Laboratory 1 used the extruded sheet samples in order to prepare disc specimens for their experiments.
Naturally, large deformations of their specimens also occurred, but they were able to generate some data
which can now be presented. Laboratory 1 conducted some processing trials on sample C by various pre-
shear conditioning of the sample prior to the measurement of viscosity. Pre-shear history was in¯uenced
by the amount of shear, the time of shearing and the temperature of shear. The viscosity was measured at
190 8C by dynamic shear rheometry on a Rheometrics Mechanical Spectrometer (RMS800) with parallel
plate geometry. The results are summarized in Table 8.
The data in Table 8 show that, as the frequency of pre-shear is increased at 190 8C, so the viscosity of
the compound decreases. In addition it can be seen that, at a ®xed frequency of pre-shear, but for a longer
time, the viscosity of the compound also decreases.
Experiments were also conducted in which low temperature extrusion at 120 8C was used as a pre-
shear treatment. This had little in¯uence on the measured viscosity. However, the same materials were
then exposed to modest subsequent high temperature pre-shear (at 190 8C) which resulted in a large
2330 COMMISSION ON POLYMER CHARACTERIZATION AND PROPERTIES
q 1999 IUPAC, Pure Appl. Chem. 71, 2317±2332
Fig. 13 Fluorescence intensity plotted against time at the reheat temperature for various reheated samples of A
and C at a specimen thickness of 0.04 mm.
Table 8 The in¯uence of pre-shear history on the processing of extruded sheet C
Complex viscosity at
190 8C at 0.1 rad/s Pre-shear history at 190 8C, Pre-shear history at 190 8C,
(kPa s) Pre-shear history, extrusion frequency (rad/s) time (s)
14.0 None None None
14.0 None 0.1 60
10.2 None 1 60
8.9 None 2 60
4.9 None 5 60
8.2 None 1 120
12.5 Capillary at 120 8C at 100/s None None
8.6 Capillary at 120 8C at 100/s 1 60
reduction in the measured viscosity. It would seem that the higher temperature pre-shearing is either
removing the tertiary crystallization discussed earlier and/or reducing the size of some `supramolecular'
¯ow units.
To some extent, these pre-shear results are quite surprising because other rheological results have
shown that only small differences are found at relatively high temperatures in the viscoelastic response of
samples A and C (which have had very different mixing and shear history). However, we have no
evidence to suggest that these results from Laboratory 1 lack credibility in terms of excessive
deformations during the shear experiments.
Laboratory 4 conducted some processing experiments on a single crew Goettfert extrusion machine
using a rod die with an l/r ratio of 15 and a screw with a compression ratio of 1:4. They established
extrusion conditions at a range of melt temperatures at various screw speeds. Their mass rate output
results are summarized in Table 9.
These results show that, over a range of processing temperatures, Compound C provides less mass
output under the same conditions as Compound A. The densities of the two samples were measured to be
the same, at 1267 kg/m3, and therefore these output results also re¯ect volume as well as mass output
performance.
There is an expectation that a material that has a higher level of gelation could provide a lower extruder
output because it will tend to `melt' later in the extruder barrel and therefore modify the transportation
and pumping balance. In effect, the fully ®lled length in the extruder will become shorter and the ability to
pump material through the die will be impaired. However, there are other complicating factors.
Laboratory 4 reports that Compound A has a regular cylindrical shape, whilst Compound C (after its
further processing) is of irregular and different shape. It is therefore possible that the regularity and shape
of the feedstock is in¯uencing the observed differences in output, as the feed section in the extrusion
process, particularly for small diameter extruders, is in¯uenced by the shape of the granule.
Laboratory 4 also experimented with ways of restoring the performance of Compound A from
Compound C. They used a commercial insulation compound of PVC-p which had a Shore A hardness of
80, i.e. a more highly plasticized compound than the formulation of our study. As it was a commercial
compound, the precise formulation details are not known. They added 10% by weight of this compound to
Compound C and then conducted a similar extrusion experiment with processing temperatures of 127 8Cand 166 8C. The mass output rates were restored in both cases to within experimental error. At ®rst sight,
it might seem that the restoration of an apparent loss of plasticizer experienced by Compound C can
rejuvenate its performance. However, other more credible explanations are also available. It is likely that
the regularity and shape of the feedstock has been changed again, in the preparation of the new
compound. The characteristics in the feed section of the extruder with this new compound might be
in¯uential in restoring mass output. In any case, there is no corroborating evidence for loss of plasticizer
since the DMA results after annealing and the viscometry curve at high temperature provide no
interpretation in terms of different plasticizer levels. We are therefore left with an interesting but
inconclusive position. This can only be resolved by a further set of experiments where much more control
over the shape and size of the feedstock is made, together with appropriate control over the levels of
gelation. However, an expectation of being able to control all the variables necessary to prove a particular
point can often become elusive.
Structure±property characteristics of a PVC-p compound 2331
q 1999 IUPAC, Pure Appl. Chem. 71, 2317±2332
Table 9 Mass output data for single screw extrusion experiments
Output (g/min) Screw speed (rpm) Processing temperature (8C)
Compound A 51.9 20 166
Compound C 38.3 20 166
Compound A 50.0 20 143
Compound C 32.0 20 143
Compound A 35.2 15 127
Compound C 26.1 15 127
CONCLUDING COMMENTS
We have conducted a detailed investigation of the change in deformational, structural, molecular and
rheological characteristics that are attendant on a PVC-p compound experiencing higher processing
temperatures. Our study re¯ects an experience that occurs in the PVC industry where a loss of processing
performance accompanies excursions to higher temperatures. It is apparent that as this process continues
the material will eventually become unprocessable, unless changes are made.
The change that accompanies the material as it passes from an experience of low processing
temperatures to high processing temperatures has been thoroughly mapped. However, it has been dif®cult
to make a precise observation of the molecular and structural changes occurring. This has not been
without application of a number of likely candidate methodologies, including DSC, TGA, WAXS, GPC
and ¯uorescence spectroscopy. It would seem that some additional crystallization is accompanying the
increase in gelation that occurs at higher processing temperatures. At the same time, the observations on
the in¯uence of annealing indicate that this is not the only consideration and that diffusion of the
plasticizer into the PVC particles might also be playing a role, or even residual stresses in the materials
might be important.
This study has not only been concerned with an in-depth materials characterization; it has also
explored ways of alleviating the loss of processability. Two particular lines of study involving pre-shear
history and blending with higher plasticized compounds have provided interesting, albeit inconclusive,
results. On the other hand, there are strong implications from the DSC study that reversibility of the
`process aging' is not likely.
In conclusion, it is interesting to observe that, by conducting this study through an IUPAC Working
Party, it has been helpful to pool the resources and experience of an international community of scientists
which has probably given us an opportunity of conducting this study at much lower costs than might have
otherwise been the case.
APPENDIX
De®nitions
DMA dynamical mechanical analysis/analyser
DOP dioctyl phthalate
DSC differential scanning calorimetry/calorimeter
GPC gel permeation chromatography
l/r ratio ratio of length to diameter for an extrusion die in capillary rheometry
PVC-p plasticized poly(vinyl chloride)
SEC size exclusion chromatography
TBLS tribasic lead sulfate
TGA thermogravimetric analysis
Tg glass±rubber transition temperature
WAXS wide angle X-ray scattering
REFERENCES
1 D. R. Moore. Plastics Rubber: Processing Applications Nov, 175 (1979).
2 D. R. Moore. In Thermoplastic Composites (L. Carlsson, ed.), Chap. 10. Elsevier Science, Amsterdam (1991).
3 M. Lamberty. Plast Mod. Elastomers 26 (10), 82 (1974).
4 M. Gilbert, J. C. Vyvoda. Polymer 22, 1134±1136 (1981).
5 J. A. Covas. Polymer 34, 3204 (1993).
6 S. Wu. Polym. Int. 29, 229±247 (1992).
7 S. Wu. J. Polym. Sci. B Polym. Phys. 27, 723 (1989).
2332 COMMISSION ON POLYMER CHARACTERIZATION AND PROPERTIES
q 1999 IUPAC, Pure Appl. Chem. 71, 2317±2332