Embed Size (px)
Citation preview
The Influence of Non-Verbal Behaviour on
Meeting Effectiveness and Pro-Active
Behaviour: A Video Observational Study
Author: Tim Greven
University of Twente P.O. Box 217, 7500AE Enschede
The Netherlands
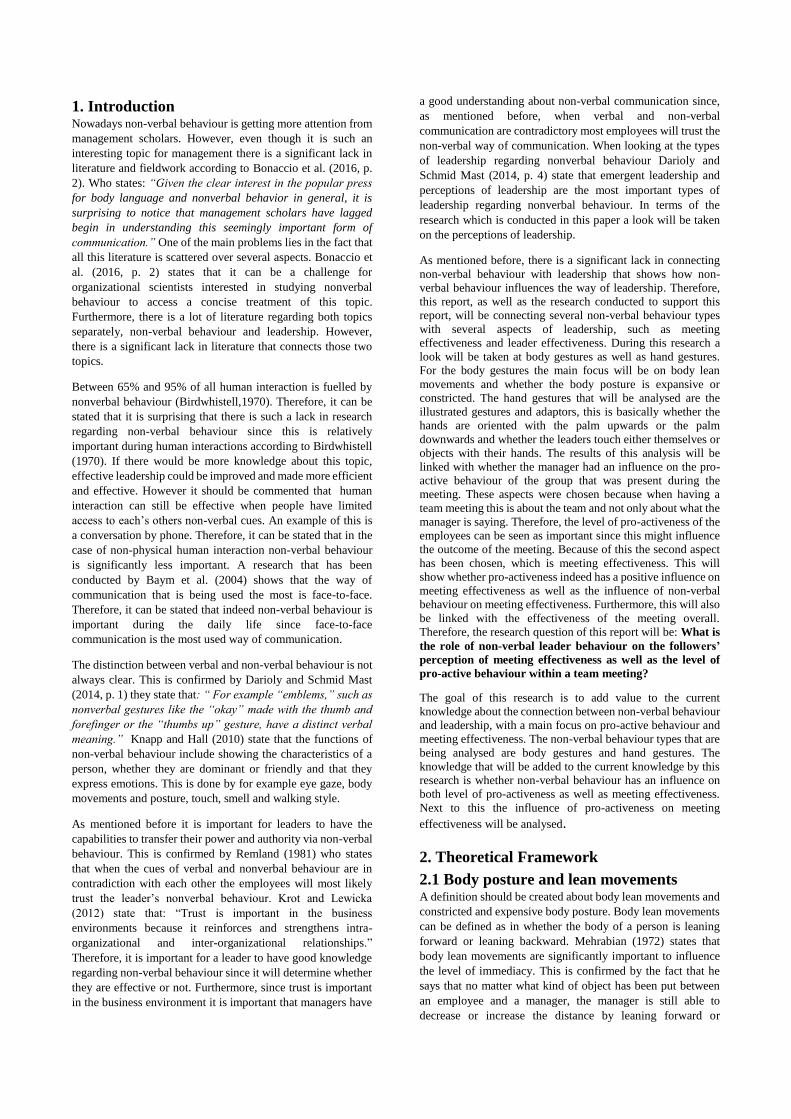
ABSTRACT,
Based on the nonverbal leadership literature, it has been hypothesized that hand
gestures and body gestures have an influence on both perceived meeting
effectiveness and pro-active behaviour of their followers. The research is focused
on video-observations of team meetings, consisting of fine-grained codings of non-
verbal behaviour displayed during the meetings, as well as several surveys that
have been filled-out by team-members within the teams that have been recorded.
The data consisted of 20 leaders and 192 followers which are employed in a large
public organization. As a result, one correlation has been found, this correlation
implies that upward palms gestures have a negative influence on the level of pro-
activity of the followers. In the discussion section the outcomes of the analysis
were discussed and suggestions will be given for future research.
Graduation Committee members:
Prof. Dr. C.P.M. Wilderom
J.G.W.L. Smits, MSc
Keywords Non-verbal Behaviour, Pro-Active Behaviour, Hand Gestures, Body Gestures, Meeting
Effectiveness, Leadership Behaviour and Video-Method Research

Permission to make digital or hard copies of all or part of this work for personal or classroom use is granted without fee provided that copies are
not made or distributed for profit or commercial advantage and that copies bear this notice and the full citation on the first page. To copy otherwise, or republish, to post on servers or to redistribute to lists, requires prior specific permission and/or a fee.
9th IBA Bachelor Thesis Conference, July 5th, 2017, Enschede, The Netherlands.
Copyright 2017, University of Twente, The Faculty of Behavioural, Management and Social sciences.
1. Introduction Nowadays non-verbal behaviour is getting more attention from
management scholars. However, even though it is such an
interesting topic for management there is a significant lack in
literature and fieldwork according to Bonaccio et al. (2016, p.
2). Who states: “Given the clear interest in the popular press
for body language and nonverbal behavior in general, it is
surprising to notice that management scholars have lagged
begin in understanding this seemingly important form of
communication.” One of the main problems lies in the fact that
all this literature is scattered over several aspects. Bonaccio et
al. (2016, p. 2) states that it can be a challenge for
organizational scientists interested in studying nonverbal
behaviour to access a concise treatment of this topic.
Furthermore, there is a lot of literature regarding both topics
separately, non-verbal behaviour and leadership. However,
there is a significant lack in literature that connects those two
topics.
Between 65% and 95% of all human interaction is fuelled by
nonverbal behaviour (Birdwhistell,1970). Therefore, it can be
stated that it is surprising that there is such a lack in research
regarding non-verbal behaviour since this is relatively
important during human interactions according to Birdwhistell
(1970). If there would be more knowledge about this topic,
effective leadership could be improved and made more efficient
and effective. However it should be commented that human
interaction can still be effective when people have limited
access to each’s others non-verbal cues. An example of this is
a conversation by phone. Therefore, it can be stated that in the
case of non-physical human interaction non-verbal behaviour
is significantly less important. A research that has been
conducted by Baym et al. (2004) shows that the way of
communication that is being used the most is face-to-face.
Therefore, it can be stated that indeed non-verbal behaviour is
important during the daily life since face-to-face
communication is the most used way of communication.
The distinction between verbal and non-verbal behaviour is not
always clear. This is confirmed by Darioly and Schmid Mast
(2014, p. 1) they state that: “ For example “emblems,” such as
nonverbal gestures like the “okay” made with the thumb and
forefinger or the “thumbs up” gesture, have a distinct verbal
meaning.” Knapp and Hall (2010) state that the functions of
non-verbal behaviour include showing the characteristics of a
person, whether they are dominant or friendly and that they
express emotions. This is done by for example eye gaze, body
movements and posture, touch, smell and walking style.
As mentioned before it is important for leaders to have the
capabilities to transfer their power and authority via non-verbal
behaviour. This is confirmed by Remland (1981) who states
that when the cues of verbal and nonverbal behaviour are in
contradiction with each other the employees will most likely
trust the leader’s nonverbal behaviour. Krot and Lewicka
(2012) state that: “Trust is important in the business
environments because it reinforces and strengthens intra-
organizational and inter-organizational relationships.”
Therefore, it is important for a leader to have good knowledge
regarding non-verbal behaviour since it will determine whether
they are effective or not. Furthermore, since trust is important
in the business environment it is important that managers have
a good understanding about non-verbal communication since,
as mentioned before, when verbal and non-verbal
communication are contradictory most employees will trust the
non-verbal way of communication. When looking at the types
of leadership regarding nonverbal behaviour Darioly and
Schmid Mast (2014, p. 4) state that emergent leadership and
perceptions of leadership are the most important types of
leadership regarding nonverbal behaviour. In terms of the
research which is conducted in this paper a look will be taken
on the perceptions of leadership.
As mentioned before, there is a significant lack in connecting
non-verbal behaviour with leadership that shows how non-
verbal behaviour influences the way of leadership. Therefore,
this report, as well as the research conducted to support this
report, will be connecting several non-verbal behaviour types
with several aspects of leadership, such as meeting
effectiveness and leader effectiveness. During this research a
look will be taken at body gestures as well as hand gestures.
For the body gestures the main focus will be on body lean
movements and whether the body posture is expansive or
constricted. The hand gestures that will be analysed are the
illustrated gestures and adaptors, this is basically whether the
hands are oriented with the palm upwards or the palm
downwards and whether the leaders touch either themselves or
objects with their hands. The results of this analysis will be
linked with whether the manager had an influence on the pro-
active behaviour of the group that was present during the
meeting. These aspects were chosen because when having a
team meeting this is about the team and not only about what the
manager is saying. Therefore, the level of pro-activeness of the
employees can be seen as important since this might influence
the outcome of the meeting. Because of this the second aspect
has been chosen, which is meeting effectiveness. This will
show whether pro-activeness indeed has a positive influence on
meeting effectiveness as well as the influence of non-verbal
behaviour on meeting effectiveness. Furthermore, this will also
be linked with the effectiveness of the meeting overall.
Therefore, the research question of this report will be: What is
the role of non-verbal leader behaviour on the followers’
perception of meeting effectiveness as well as the level of
pro-active behaviour within a team meeting?
The goal of this research is to add value to the current
knowledge about the connection between non-verbal behaviour
and leadership, with a main focus on pro-active behaviour and
meeting effectiveness. The non-verbal behaviour types that are
being analysed are body gestures and hand gestures. The
knowledge that will be added to the current knowledge by this
research is whether non-verbal behaviour has an influence on
both level of pro-activeness as well as meeting effectiveness.
Next to this the influence of pro-activeness on meeting
effectiveness will be analysed.
2. Theoretical Framework
2.1 Body posture and lean movements A definition should be created about body lean movements and
constricted and expensive body posture. Body lean movements
can be defined as in whether the body of a person is leaning
forward or leaning backward. Mehrabian (1972) states that
body lean movements are significantly important to influence
the level of immediacy. This is confirmed by the fact that he
says that no matter what kind of object has been put between
an employee and a manager, the manager is still able to
decrease or increase the distance by leaning forward or
backward. Furthermore, it can be perceived that leaning
forward is showing that the person is interested in what the
other person is saying. Leaning backwards could have two
effects, either the person wants to be as far away as possible
from the other person since he does not like what he is saying
or he is not interested by it, or the person is relaxed and that is
why he leans back.
The next type of body gesture that is important to answer the
main research question is the overall body posture. Two types
can be distinguished when looking into the literature: An
expressive posture is when a person makes himself big like
leaning forward or spreading his arms. A constricted posture
implies the complete opposite this is about when a person tries
to make himself small for example crossing his arms over each
other. Which of these two contain which effect is defined by
Carney et al. (2010). They state: “Humans and other animals
express power through open, expansive postures, and they
express powerlessness through closed, contractive postures.” In
this sentence a contractive posture is equal to a constricted
posture. Therefore, it can be concluded that when someone’s
body posture is very open and very expansive this person is
expressing power. When someone is very closed and
constricted they are expressing powerlessness. According to
Cashden (1998), the body posture of people that have a more
dominant position are often more open than the body posture
of their subordinates.
2.2 Hand gestures In this research the focus will lie on the illustrated hand gestures
as well as adaptors. Illustrated hand gestures are about the
positioning of the hand palms of a certain person. They can be
oriented downwards, upwards or a mix of them with one palm
downwards and one palm upwards.
According to Kendon (2004), having the palms downwards
means that the person wants to interrupt a conversation or that
a person wants to stop the conversation because it either makes
no sense or that this person does not agree with what the other
person is saying. He also states: “Gestures of the Open Hand
Prone or ‘palm down’ family are used in contexts where
something is being denied, negated, interrupted or stopped,
whether explicitly or by implication.” Kendon (2004) also
writes about the palms upwards situation. He states that this
means that the speaker is offering, giving or showing
something. It also implies that the speaker is requesting the
reception of something. When the hands start moving apart
from each other but also keep palms up this means that the
speaker is aiming at a withdrawal of action or of non-
intervention. Furthermore, a message is more persuasive with
an eager (palms up) gesture style (Cesario and Higgins, 2007).
Matsumoto and Hwang (2013) mention that when a person has
his hands facing down with the palms this can be indicated as a
stopping sign or that something is not understood or missing.
Furthermore, they imply that having the palms faced down
might imply signing someone to go away. Furthermore, an
additional type of illustrative hand gestures has been added to
the coding scheme. This type is clasped hands, which can be
divided into two different types which are power gestures and
the actual holding of both hands by a leader. Power gestures are
hand gestures that are used to make the leader appeal more
powerful as well as making the leader feel more powerful. One
of the most classic examples is the power triangle that is often
used by Angela Merkel. This gesture basically implies that all
finger tips are touching each other and therefore make a
triangle.
As mentioned before, the second aspect regarding hand
gestures are the adaptors. Adaptors are usually divided into
self-adaptors, gestures in which individuals touch themselves
and object-adaptors, meaning that an individual touches an
object. (Engel, 2016) According to Mandal (2014) self-
adaptors are a sign of worried and fearful people. He also
mentions that when people are touching themselves and are
running their hand through their hair implies that they are
worried. Whereas, people that are feared hide their faces in both
hands or clasp their hands together. Hall, Carter and Horgan
(2001) state that according to their research it can be established
that superiors use significantly less self-touch than their
followers. As an result of this it can be stated that self-adaptors
can be seen as an gesture that is used by people that express less
power and dominance and that these people have a submissive
type as behaviour. (Engel, 2016)
2.2 Meetings
2.2.1 Meeting effectiveness When talking about meeting effectiveness during this research
it is meant that the leaders feel that the information that they
wanted to process has successfully reached their employees.
Furthermore, it also means that the employees felt that the
meeting was useful and effective. Romano and Nunamaker
(2001) state: “Studies reveal that meetings are indeed costly
and unproductive, yet essential and increasing in number and
duration underscore the need for meeting productivity
research.” Therefore, it can be said that a research regarding
the influence of nonverbal-behaviour and pro-activeness might
be valuable for the community to learn more about meeting
effectiveness. Kayser (1990) states in different words that
meetings nowadays are not efficient nor effective. He states: “A
meeting is a gathering where people speak up, say nothing, and
then all disagree.” This confirms the point that has been
mentioned before, which states that the research regarding
meeting effectiveness is needed and that this research might
have a contribution to the knowledge about meeting
effectiveness.
But why is meeting effectiveness important? Rogelberg et al.
(2006) state that meetings are the used to integrate and
coordinate the work of people within an organization. This
implies that to reach the goals that are set by a company their
employees not to work effective and the guidance in this is done
during meetings. Therefore, meetings are important to make
sure that the organizations is running according to plan or even
better.
2.2.2 Antecedents of meeting effectiveness According to Kocsis et al. (2015), it is important to have a
systematic process in place. If this is not the case executing the
meeting plan as well as achieving the meeting goals will be in
jeopardy. Another factor that influences the meeting
effectiveness is that the objectives have to be clear, there might
be a lack of focus on the meeting and the value added by the
followers might be not of a significant value (Kocsis et al.
2015). Furthermore, they mention that an important assistant
in making a meeting more effective are facilitators. They can
establish a clear task-oriented meeting and apply appropriate
collaboration technologies (Clawson, Bostrom & Anson,
1993). Kocsis et al. (2015) states: “Facilitators are similar to
meeting chairpersons, but unlike a chair, they do not have a
personal stake in the outcome nor do they typically have a
superior-subordinate relationship with the team members.”
However, non-verbal behaviour of leaders might also have an
influence on meeting effectiveness. Since there is a lack in
literature linking meeting effectiveness with non-verbal
behaviour this will be researched in this report. Therefore, the
following hypothesis have been defined.
H1: The leaning forward of a leader has a positive influence
on the effectiveness of a team meeting, whereas leaning
backwards has a negative influence.
H2: An expansive body posture of a leader has a positive
influence on the effectiveness of a team meeting, whereas a
constricted body posture has a negative influence.
H3: The usage of illustrative hand gestures of a leader has a
positive influence on the level of effectiveness of team
meetings.
H4: The usage of adaptors by a leader has a negative
influence on the level of effectiveness of team meetings.
2.3 Pro-active behaviour
2.3.1 Pro-active behaviour in meetings According to Aragon-Correa (1998), proactive and self-
directed behaviour has become increasingly more important
within organizations. This is caused by the frequent changes in
the demands that organizations give to their employees as well
as the uncertainty in the work environment. In the case of this
research pro-activeness is perceived of whether the employees
that were present at the meeting were actively participating in
the meeting. This implies that they said what was either
bothering them or that they came up with something that could add value to the meeting.
When looking at why proactive behaviour is that important
Fritz and Sonnentag (2009) state that an employee might
developed ways to fulfil tasks more efficiently when they are
motivated to have pro-active behaviour. Crant (2000) defines
pro-active behaviour as follows: “Taking initiative in
improving current circumstances or creating new ones; it
involves challenging the status quo rather than passive adapting to present conditions.”
Regarding the ‘pro-activeness’ of followers three kind of
followers were defined by Carsten et al. (2010). The first type
of follower is the passive follower who does not have any input
into the organization and simply just take orders from their
leaders and conduct it in however the leader wants it done.
Secondly, there is the active follower which are having their
own opinion but still commit their loyalty to their leader. The
last type of follower is the pro-active follower. This follower
takes initiative and try to use every opportunity to express their
concern or opinion about a certain topic. It is considered that
effective followers are those who are passive simply because to
adapt to the leader and do everything from the leader’s point of
view. However in order to achieve effective followership
requires followers which are not afraid to show their opinion
and their concerns. Therefore, pro-activity is important within
an organization.
Therefore, this research will consist of an analysis about how
non-verbal leader behaviour can help motivating their
employees to become more pro-active since it gives a
refreshing look into topics in which a leader might have a tunnel view.
2.3.2 Influences on pro-active behaviour According to Bateman and Crant (1999) it is possible to have
an influence on the level of pro-active behaviour of people.
They state that Pro-action is like most other work behaviour: It
is a function of both individual dispositions and the work
environment. Thus, it can be harvested, grown, and sustained
via appropriate approaches to selecting, training, liberating ,
and inspiring.
In the case of this research the two most outstanding influences
on pro-active behaviour according to Bateman and Crant
(1999) are liberating and inspiring. These two ways of
influencing pro-active behaviour are linked with managers, so
managers indeed could have an influence on pro-active
behaviour. With liberating is meant that the employees or
followers should be devoted more freedom by the manager.
This will result in more pro-active behaviour since they feel
more free to speak about something that they would not say
normally. Inspiring implies that the manager in somehow way
does something that makes his or her employees more pro-active.
2.3.3. Link between leader behaviour and follower
pro-active behaviour Even though pro-active behaviour appears important for an
organization it also faces a negative side (Fuller et al. (2015).
Because, even though pro-active behaviour has an positive
influence on the wellbeing of the organization, leaders might
not acknowledge and reward this behaviour (Grant et al. 2009).
Therefore, it is important how leaders react to the amount of
pro-activeness which is expressed by his/her followers, this is
important for the innovation within an organization (Bolino et al., 2010).
H5: The leaning forward of a leader has a positive influence
on the level of-proactive behaviour of the followers in a team
meeting, whereas leaning backwards has a negative influence.
H6: An expansive body posture of a leader has a positive
influence on the level of-proactive behaviour of the followers
in a team meeting, whereas a constricted body posture has a
negative influence.
H7: The usage of illustrative hand gestures of a leader has a
positive influence on the level of pro-activeness of followers in
a team meeting.
H8: The usage of adaptors by a leader has a negative
influence on the level of pro-activeness of followers in a team
meeting.
H9: There is a positive influence of the level of pro-active
behaviour of meeting members on the level of meeting effectiveness
All the hypotheses that have been introduced in this chapter will
be used to analyse the influence of non-verbal behaviour on
both perceived meeting effectiveness as well as pro-active follower behaviour.
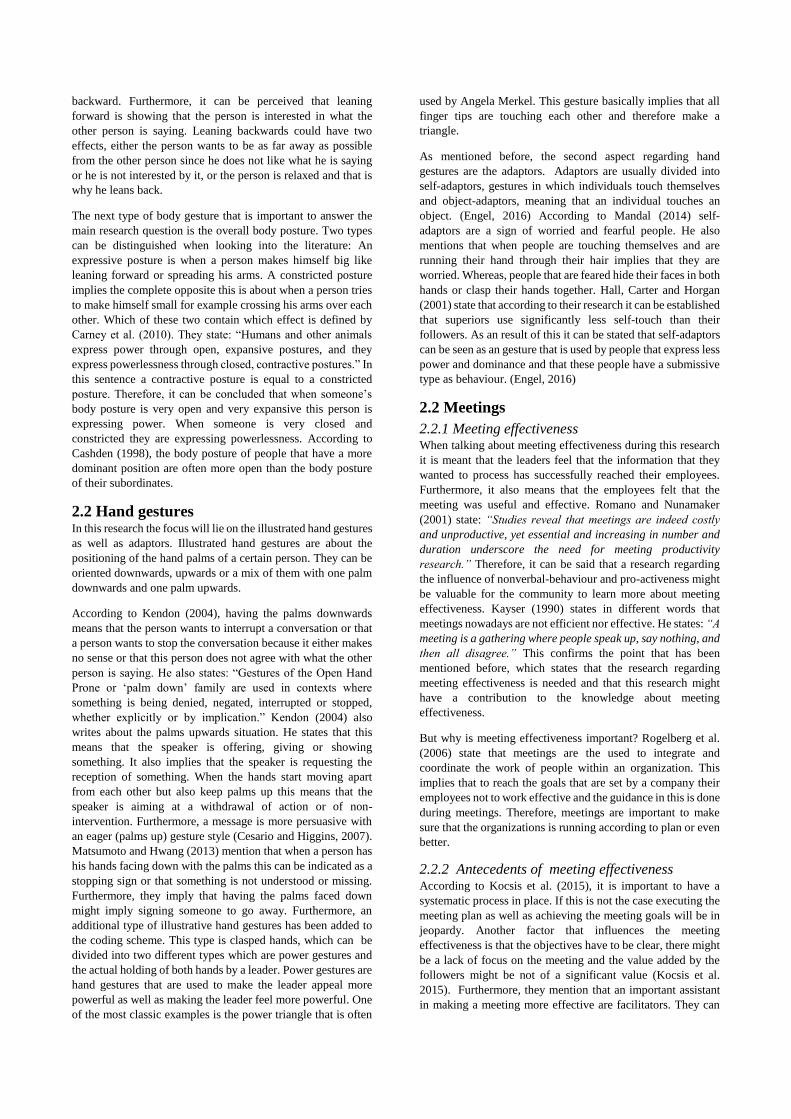
Figure 1 Conceptual model
Figure 1 shows a visualisation of the afore mentioned
hypotheses. This displays a clear overview of how the variables are linked with each other
3. Methodology
3.1 Research Design This study is based on a cross-sectional design which includes
three different data sources. The first data source is an expert
that is rating the leader according to his/her leadership
capabilities. Secondly, the followers of the leaders fill out a
survey in which they grade their perception of the leader of
their meeting. The final data source is a video which has been
systematically coded by several researchers. This coding is
about the non-verbal behaviour of the leaders during their
regular staff meetings. Because there is a diversity in ways to
generate data common source bias has been reduced and
excluded in this report.
3.2 Sample The sample that has been analysed consisted of 20 team
meetings within a large public-service organization. These
meetings consisted of in total 20 leaders and 192 followers who
answered the survey. Followers that did not answer the survey
for at least 50%, were not officially part of the team or showed
no variety in answering the questions are not included in the
sample. The total amount of followers that were present during
the meetings was 210 followers. There were 17 male leaders
and 3 female leaders with a mean age of 51.55 years old and a
minimum age of 34 and a maximum age of 64. The standard
deviation for age is 8.54. The mean of the job tenure of those
20 leaders is 23.38 years with a minimum of half a year and a
maximum of 46 year with a standard deviation of 17.47. The
followers consisted of 138 male followers and 60 female
followers, 12 followers did not answer this question during the
survey. The followers were 49.43 years old on average with a
minimum of 25 years old and a maximum of 64 years old and
a standard deviation of 10.02, however 22 followers did not
answer this question. The job tenure of the followers has a mean
of 24.88 years with a minimum of 0.2 year and a maximum of
48 years and a standard deviation of 13.65, however 17
followers did not answer this question.
3.3 Coding Procedure The coding of the videos that were recorded during the 40
meetings were analysed by two researchers. McHugh (2012)
states that: “The importance of rater reliability lies in that fact
that it represents the extent to which the data collected in the
study are correct representation of the variables measured.”
This implies that the inter-rater reliability is high when both
researchers agree on the same result. The inter-rater reliability
that resulted from the research was for body gestures 92.03%
whereas hand gestures scored an inter-rater reliability of
94.46%. The kappa that both gestures scored were respectively
0.91 and 0.93. The coding took place in one room where all
researchers will do their coding. The coding has been
conducted by the usage of certain equipment (i.e. Noldus
Observer XT, Noldus, et al., 2000; Zimmerman et al., 2009)
which has been designed for video coding, which has been
provided by the University of Twente. The length of the videos
differ from between 1 hour and 2 hours. However, for the
purpose of standardization the first 30 minutes has been coded.
The actual coding has been started from the start of the actual
meeting. The coding has been done via a coding scheme which
identifies when a certain non-verbal behaviour occurs and when
this behaviour has to be coded. When all videos were coded
each researcher picks the data he/she needs and starts
conducting the actual research with the collected data.
3.4 Measures Pro-active behaviour. Pro-active behaviour has been
analysed by using five questions regarding the pro-active
behaviour within the meeting that has been observed. These
five questions have been based on analysis of Watson, Clarke
& Tellegen (1988) as well as Morrison & Phelps (1999). The
scale that has been used for the questions ranged from one to
seven where one meant “I strongly disagree” and seven meant
“I strongly agree”. The Cronbach alpha of this variable was
0.884.
Meeting effectiveness Meeting effectiveness has been
analysed by using three questions that had to be answered by
the followers. These questions are based on research by Nixon
& Littlepage (1992), Engleberg & Wynn (2007) and Baran et
al. (2012). The scale that has been used for those questions
ranged from one to seven where one meant “I strongly
disagree” and seven meant “I strongly agree”. The Cronbach
alpha of this variable was 0.916.
Non-verbal Behaviour
The measurement of the non-verbal behaviour of a leader has
been done via the Observer XT, as mentioned before. The
coding has been done by two different coders which after they
coded a video compared their results to make sure that there is
no bias present in the research. The coding also took place in a
neutral place namely the video lab of the University of
Twente.
Furthermore, the coding has been done by using a pre-
established coding scheme which has been described in more
detail in Dethmers (2017). In this coding scheme all of the
non-verbal behaviour types have been explained and when
something should be coded and when it should not. By using
this coding scheme the coders have already established a
mind-set which is relatively similar since they use the same
coding scheme. Each type of behaviour has been visualized by
using several illustrations, this helps in understanding what is
meant in the coding scheme.
4. Results
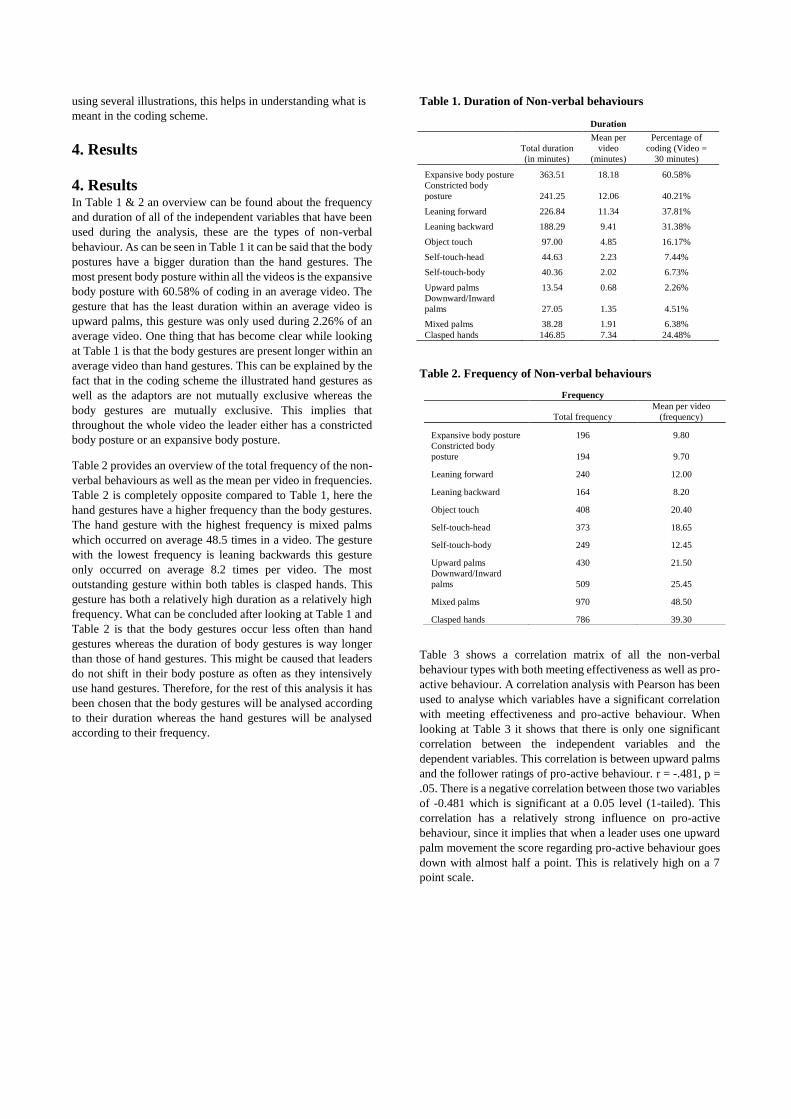
4. Results In Table 1 & 2 an overview can be found about the frequency
and duration of all of the independent variables that have been
used during the analysis, these are the types of non-verbal
behaviour. As can be seen in Table 1 it can be said that the body
postures have a bigger duration than the hand gestures. The
most present body posture within all the videos is the expansive
body posture with 60.58% of coding in an average video. The
gesture that has the least duration within an average video is
upward palms, this gesture was only used during 2.26% of an
average video. One thing that has become clear while looking
at Table 1 is that the body gestures are present longer within an
average video than hand gestures. This can be explained by the
fact that in the coding scheme the illustrated hand gestures as
well as the adaptors are not mutually exclusive whereas the
body gestures are mutually exclusive. This implies that
throughout the whole video the leader either has a constricted
body posture or an expansive body posture.
Table 2 provides an overview of the total frequency of the non-
verbal behaviours as well as the mean per video in frequencies.
Table 2 is completely opposite compared to Table 1, here the
hand gestures have a higher frequency than the body gestures.
The hand gesture with the highest frequency is mixed palms
which occurred on average 48.5 times in a video. The gesture
with the lowest frequency is leaning backwards this gesture
only occurred on average 8.2 times per video. The most
outstanding gesture within both tables is clasped hands. This
gesture has both a relatively high duration as a relatively high
frequency. What can be concluded after looking at Table 1 and
Table 2 is that the body gestures occur less often than hand
gestures whereas the duration of body gestures is way longer
than those of hand gestures. This might be caused that leaders
do not shift in their body posture as often as they intensively
use hand gestures. Therefore, for the rest of this analysis it has
been chosen that the body gestures will be analysed according
to their duration whereas the hand gestures will be analysed
according to their frequency.
Table 1. Duration of Non-verbal behaviours
Table 2. Frequency of Non-verbal behaviours
Table 3 shows a correlation matrix of all the non-verbal
behaviour types with both meeting effectiveness as well as pro-
active behaviour. A correlation analysis with Pearson has been
used to analyse which variables have a significant correlation
with meeting effectiveness and pro-active behaviour. When
looking at Table 3 it shows that there is only one significant
correlation between the independent variables and the
dependent variables. This correlation is between upward palms
and the follower ratings of pro-active behaviour. r = -.481, p =
.05. There is a negative correlation between those two variables
of -0.481 which is significant at a 0.05 level (1-tailed). This
correlation has a relatively strong influence on pro-active
behaviour, since it implies that when a leader uses one upward
palm movement the score regarding pro-active behaviour goes
down with almost half a point. This is relatively high on a 7
point scale.
Duration
Total duration
(in minutes)
Mean per
video
(minutes)
Percentage of
coding (Video =
30 minutes)
Expansive body posture 363.51 18.18 60.58%
Constricted body
posture 241.25 12.06 40.21%
Leaning forward 226.84 11.34 37.81%
Leaning backward 188.29 9.41 31.38%
Object touch 97.00 4.85 16.17%
Self-touch-head 44.63 2.23 7.44%
Self-touch-body 40.36 2.02 6.73%
Upward palms 13.54 0.68 2.26%
Downward/Inward
palms 27.05 1.35 4.51%
Mixed palms 38.28 1.91 6.38%
Clasped hands 146.85 7.34 24.48%
Frequency
Total frequency
Mean per video
(frequency)
Expansive body posture 196 9.80
Constricted body
posture 194 9.70
Leaning forward 240 12.00
Leaning backward 164 8.20
Object touch 408 20.40
Self-touch-head 373 18.65
Self-touch-body 249 12.45
Upward palms 430 21.50
Downward/Inward
palms 509 25.45
Mixed palms 970 48.50
Clasped hands 786 39.30
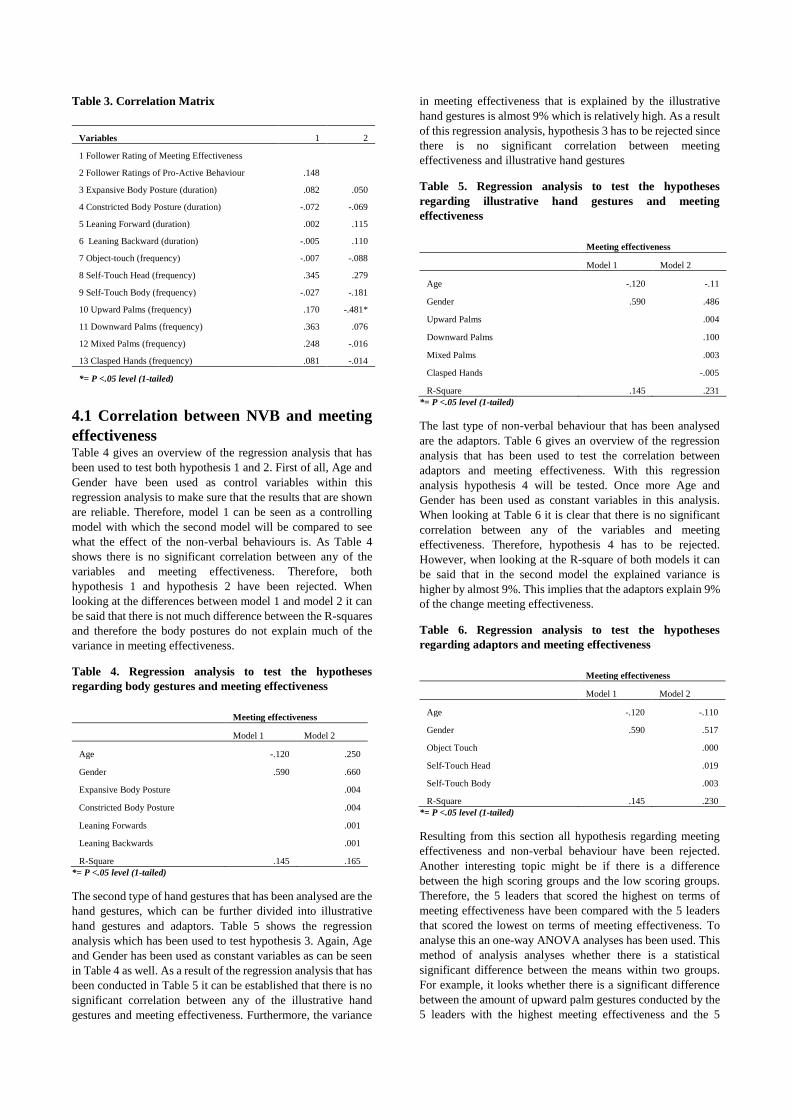
Table 3. Correlation Matrix
4.1 Correlation between NVB and meeting
effectiveness Table 4 gives an overview of the regression analysis that has
been used to test both hypothesis 1 and 2. First of all, Age and
Gender have been used as control variables within this
regression analysis to make sure that the results that are shown
are reliable. Therefore, model 1 can be seen as a controlling
model with which the second model will be compared to see
what the effect of the non-verbal behaviours is. As Table 4
shows there is no significant correlation between any of the
variables and meeting effectiveness. Therefore, both
hypothesis 1 and hypothesis 2 have been rejected. When
looking at the differences between model 1 and model 2 it can
be said that there is not much difference between the R-squares
and therefore the body postures do not explain much of the
variance in meeting effectiveness.
Table 4. Regression analysis to test the hypotheses
regarding body gestures and meeting effectiveness
Meeting effectiveness
Model 1 Model 2
Age -.120 .250
Gender .590 .660
Expansive Body Posture .004
Constricted Body Posture .004
Leaning Forwards .001
Leaning Backwards .001
R-Square .145 .165
*= P <.05 level (1-tailed)
The second type of hand gestures that has been analysed are the
hand gestures, which can be further divided into illustrative
hand gestures and adaptors. Table 5 shows the regression
analysis which has been used to test hypothesis 3. Again, Age
and Gender has been used as constant variables as can be seen
in Table 4 as well. As a result of the regression analysis that has
been conducted in Table 5 it can be established that there is no
significant correlation between any of the illustrative hand
gestures and meeting effectiveness. Furthermore, the variance
in meeting effectiveness that is explained by the illustrative
hand gestures is almost 9% which is relatively high. As a result
of this regression analysis, hypothesis 3 has to be rejected since
there is no significant correlation between meeting
effectiveness and illustrative hand gestures
Table 5. Regression analysis to test the hypotheses
regarding illustrative hand gestures and meeting
effectiveness
Meeting effectiveness
Model 1 Model 2
Age -.120 -.11
Gender .590 .486
Upward Palms .004
Downward Palms .100
Mixed Palms .003
Clasped Hands -.005
R-Square .145 .231
*= P <.05 level (1-tailed)
The last type of non-verbal behaviour that has been analysed
are the adaptors. Table 6 gives an overview of the regression
analysis that has been used to test the correlation between
adaptors and meeting effectiveness. With this regression
analysis hypothesis 4 will be tested. Once more Age and
Gender has been used as constant variables in this analysis.
When looking at Table 6 it is clear that there is no significant
correlation between any of the variables and meeting
effectiveness. Therefore, hypothesis 4 has to be rejected.
However, when looking at the R-square of both models it can
be said that in the second model the explained variance is
higher by almost 9%. This implies that the adaptors explain 9%
of the change meeting effectiveness.
Table 6. Regression analysis to test the hypotheses
regarding adaptors and meeting effectiveness
Meeting effectiveness
Model 1 Model 2
Age -.120 -.110
Gender .590 .517
Object Touch .000
Self-Touch Head .019
Self-Touch Body .003
R-Square .145 .230
*= P <.05 level (1-tailed)
Resulting from this section all hypothesis regarding meeting
effectiveness and non-verbal behaviour have been rejected.
Another interesting topic might be if there is a difference
between the high scoring groups and the low scoring groups.
Therefore, the 5 leaders that scored the highest on terms of
meeting effectiveness have been compared with the 5 leaders
that scored the lowest on terms of meeting effectiveness. To
analyse this an one-way ANOVA analyses has been used. This
method of analysis analyses whether there is a statistical
significant difference between the means within two groups.
For example, it looks whether there is a significant difference
between the amount of upward palm gestures conducted by the
5 leaders with the highest meeting effectiveness and the 5
Variables 1 2
1 Follower Rating of Meeting Effectiveness
2 Follower Ratings of Pro-Active Behaviour .148
3 Expansive Body Posture (duration) .082 .050
4 Constricted Body Posture (duration) -.072 -.069
5 Leaning Forward (duration) .002 .115
6 Leaning Backward (duration) -.005 .110
7 Object-touch (frequency) -.007 -.088
8 Self-Touch Head (frequency) .345 .279
9 Self-Touch Body (frequency) -.027 -.181
10 Upward Palms (frequency) .170 -.481*
11 Downward Palms (frequency) .363 .076
12 Mixed Palms (frequency) .248 -.016
13 Clasped Hands (frequency) .081 -.014
*= P <.05 level (1-tailed)
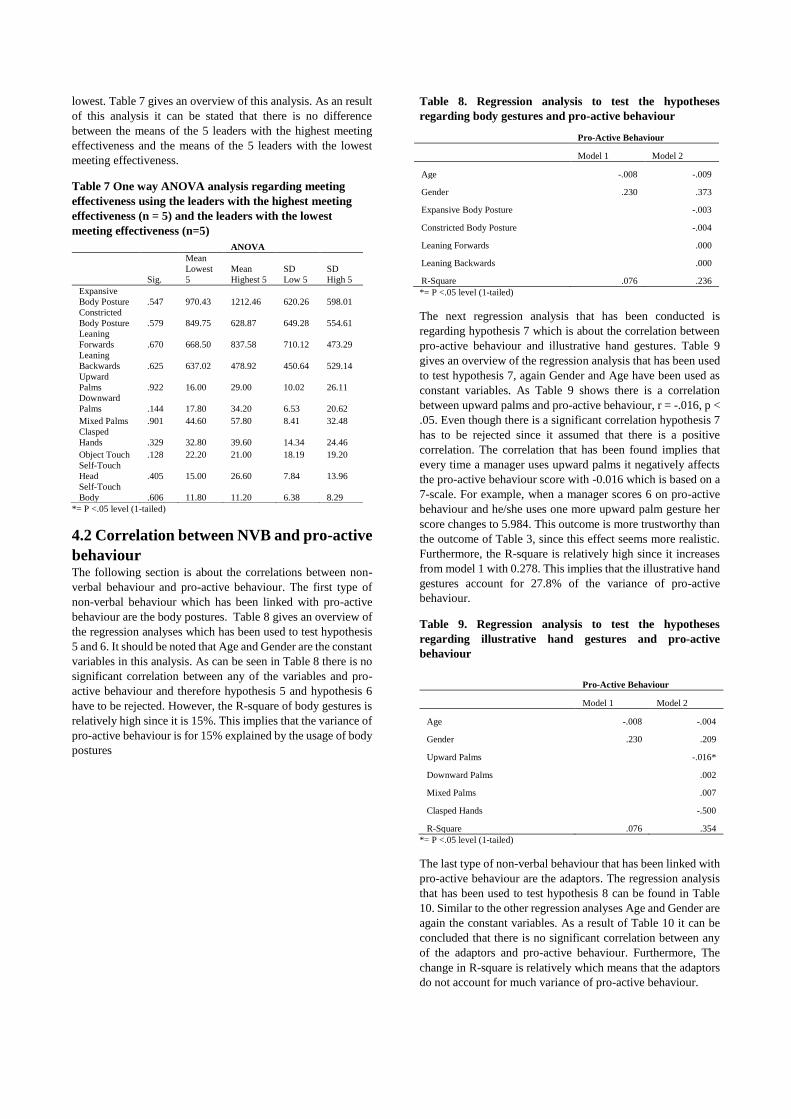
lowest. Table 7 gives an overview of this analysis. As an result
of this analysis it can be stated that there is no difference
between the means of the 5 leaders with the highest meeting
effectiveness and the means of the 5 leaders with the lowest
meeting effectiveness.
Table 7 One way ANOVA analysis regarding meeting
effectiveness using the leaders with the highest meeting
effectiveness (n = 5) and the leaders with the lowest
meeting effectiveness (n=5)
*= P <.05 level (1-tailed)
4.2 Correlation between NVB and pro-active
behaviour The following section is about the correlations between non-
verbal behaviour and pro-active behaviour. The first type of
non-verbal behaviour which has been linked with pro-active
behaviour are the body postures. Table 8 gives an overview of
the regression analyses which has been used to test hypothesis
5 and 6. It should be noted that Age and Gender are the constant
variables in this analysis. As can be seen in Table 8 there is no
significant correlation between any of the variables and pro-
active behaviour and therefore hypothesis 5 and hypothesis 6
have to be rejected. However, the R-square of body gestures is
relatively high since it is 15%. This implies that the variance of
pro-active behaviour is for 15% explained by the usage of body
postures
Table 8. Regression analysis to test the hypotheses
regarding body gestures and pro-active behaviour
*= P <.05 level (1-tailed)
The next regression analysis that has been conducted is
regarding hypothesis 7 which is about the correlation between
pro-active behaviour and illustrative hand gestures. Table 9
gives an overview of the regression analysis that has been used
to test hypothesis 7, again Gender and Age have been used as
constant variables. As Table 9 shows there is a correlation
between upward palms and pro-active behaviour, r = -.016, p <
.05. Even though there is a significant correlation hypothesis 7
has to be rejected since it assumed that there is a positive
correlation. The correlation that has been found implies that
every time a manager uses upward palms it negatively affects
the pro-active behaviour score with -0.016 which is based on a
7-scale. For example, when a manager scores 6 on pro-active
behaviour and he/she uses one more upward palm gesture her
score changes to 5.984. This outcome is more trustworthy than
the outcome of Table 3, since this effect seems more realistic.
Furthermore, the R-square is relatively high since it increases
from model 1 with 0.278. This implies that the illustrative hand
gestures account for 27.8% of the variance of pro-active
behaviour.
Table 9. Regression analysis to test the hypotheses
regarding illustrative hand gestures and pro-active
behaviour
Pro-Active Behaviour
Model 1 Model 2
Age -.008 -.004
Gender .230 .209
Upward Palms -.016*
Downward Palms .002
Mixed Palms .007
Clasped Hands -.500
R-Square .076 .354
*= P <.05 level (1-tailed)
The last type of non-verbal behaviour that has been linked with
pro-active behaviour are the adaptors. The regression analysis
that has been used to test hypothesis 8 can be found in Table
10. Similar to the other regression analyses Age and Gender are
again the constant variables. As a result of Table 10 it can be
concluded that there is no significant correlation between any
of the adaptors and pro-active behaviour. Furthermore, The
change in R-square is relatively which means that the adaptors
do not account for much variance of pro-active behaviour.
ANOVA
Sig.
Mean
Lowest
5
Mean
Highest 5
SD
Low 5
SD
High 5
Expansive
Body Posture .547 970.43 1212.46 620.26 598.01
Constricted
Body Posture .579 849.75 628.87 649.28 554.61
Leaning
Forwards .670 668.50 837.58 710.12 473.29
Leaning
Backwards .625 637.02 478.92 450.64 529.14
Upward
Palms .922 16.00 29.00 10.02 26.11
Downward
Palms .144 17.80 34.20 6.53 20.62
Mixed Palms .901 44.60 57.80 8.41 32.48
Clasped
Hands .329 32.80 39.60 14.34 24.46
Object Touch .128 22.20 21.00 18.19 19.20
Self-Touch
Head .405 15.00 26.60 7.84 13.96
Self-Touch
Body .606 11.80 11.20 6.38 8.29
Pro-Active Behaviour
Model 1 Model 2
Age -.008 -.009
Gender .230 .373
Expansive Body Posture -.003
Constricted Body Posture -.004
Leaning Forwards .000
Leaning Backwards .000
R-Square .076 .236
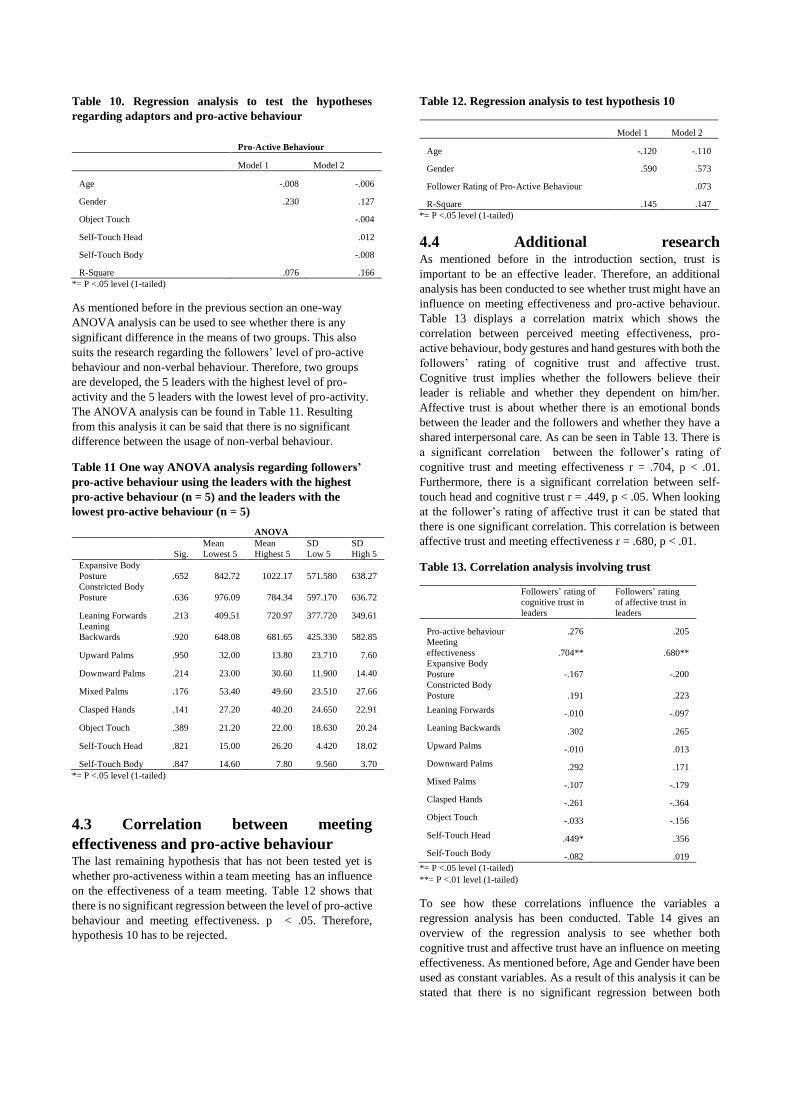
Table 10. Regression analysis to test the hypotheses
regarding adaptors and pro-active behaviour
Pro-Active Behaviour
Model 1 Model 2
Age -.008 -.006
Gender .230 .127
Object Touch -.004
Self-Touch Head .012
Self-Touch Body -.008
R-Square .076 .166
*= P <.05 level (1-tailed)
As mentioned before in the previous section an one-way
ANOVA analysis can be used to see whether there is any
significant difference in the means of two groups. This also
suits the research regarding the followers’ level of pro-active
behaviour and non-verbal behaviour. Therefore, two groups
are developed, the 5 leaders with the highest level of pro-
activity and the 5 leaders with the lowest level of pro-activity.
The ANOVA analysis can be found in Table 11. Resulting
from this analysis it can be said that there is no significant
difference between the usage of non-verbal behaviour.
Table 11 One way ANOVA analysis regarding followers’
pro-active behaviour using the leaders with the highest
pro-active behaviour (n = 5) and the leaders with the
lowest pro-active behaviour (n = 5)
*= P <.05 level (1-tailed)
4.3 Correlation between meeting
effectiveness and pro-active behaviour The last remaining hypothesis that has not been tested yet is
whether pro-activeness within a team meeting has an influence
on the effectiveness of a team meeting. Table 12 shows that
there is no significant regression between the level of pro-active
behaviour and meeting effectiveness. p < .05. Therefore,
hypothesis 10 has to be rejected.
Table 12. Regression analysis to test hypothesis 10
Model 1 Model 2
Age -.120 -.110
Gender .590 .573
Follower Rating of Pro-Active Behaviour .073
R-Square .145 .147
*= P <.05 level (1-tailed)
4.4 Additional research As mentioned before in the introduction section, trust is
important to be an effective leader. Therefore, an additional
analysis has been conducted to see whether trust might have an
influence on meeting effectiveness and pro-active behaviour.
Table 13 displays a correlation matrix which shows the
correlation between perceived meeting effectiveness, pro-
active behaviour, body gestures and hand gestures with both the
followers’ rating of cognitive trust and affective trust.
Cognitive trust implies whether the followers believe their
leader is reliable and whether they dependent on him/her.
Affective trust is about whether there is an emotional bonds
between the leader and the followers and whether they have a
shared interpersonal care. As can be seen in Table 13. There is
a significant correlation between the follower’s rating of
cognitive trust and meeting effectiveness r = .704, p < .01.
Furthermore, there is a significant correlation between self-
touch head and cognitive trust r = .449, p < .05. When looking
at the follower’s rating of affective trust it can be stated that
there is one significant correlation. This correlation is between
affective trust and meeting effectiveness r = .680, p < .01.
Table 13. Correlation analysis involving trust
Followers’ rating of
cognitive trust in
leaders
Followers’ rating
of affective trust in
leaders
Pro-active behaviour .276 .205
Meeting
effectiveness .704** .680**
Expansive Body
Posture -.167 -.200
Constricted Body
Posture .191 .223
Leaning Forwards -.010 -.097
Leaning Backwards .302 .265
Upward Palms -.010 .013
Downward Palms .292 .171
Mixed Palms -.107 -.179
Clasped Hands -.261 -.364
Object Touch -.033 -.156
Self-Touch Head .449* .356
Self-Touch Body -.082 .019
*= P <.05 level (1-tailed)
**= P <.01 level (1-tailed)
To see how these correlations influence the variables a
regression analysis has been conducted. Table 14 gives an
overview of the regression analysis to see whether both
cognitive trust and affective trust have an influence on meeting
effectiveness. As mentioned before, Age and Gender have been
used as constant variables. As a result of this analysis it can be
stated that there is no significant regression between both
ANOVA
Sig.
Mean
Lowest 5
Mean
Highest 5
SD
Low 5
SD
High 5
Expansive Body
Posture .652 842.72 1022.17 571.580 638.27
Constricted Body
Posture .636 976.09 784.34 597.170 636.72
Leaning Forwards .213 409.51 720.97 377.720 349.61
Leaning
Backwards .920 648.08 681.65 425.330 582.85
Upward Palms .950 32.00 13.80 23.710 7.60
Downward Palms .214 23.00 30.60 11.900 14.40
Mixed Palms .176 53.40 49.60 23.510 27.66
Clasped Hands .141 27.20 40.20 24.650 22.91
Object Touch .389 21.20 22.00 18.630 20.24
Self-Touch Head .821 15.00 26.20 4.420 18.02
Self-Touch Body .847 14.60 7.80 9.560 3.70
affective trust and cognitive trust regarding their influence on
meeting effectiveness.
Table 14. Regression analysis meeting effectiveness with
both cognitive trust and affective trust
Meeting
effectiveness
Model 1 Model 2
Age -.012 -.019
Gender .590 -.277
Followers' rating of cognitive
trust in leaders .491
Followers' rating of affective
trust in leaders .519
R-Square .145 .540
*= P <.05 level (1-tailed)
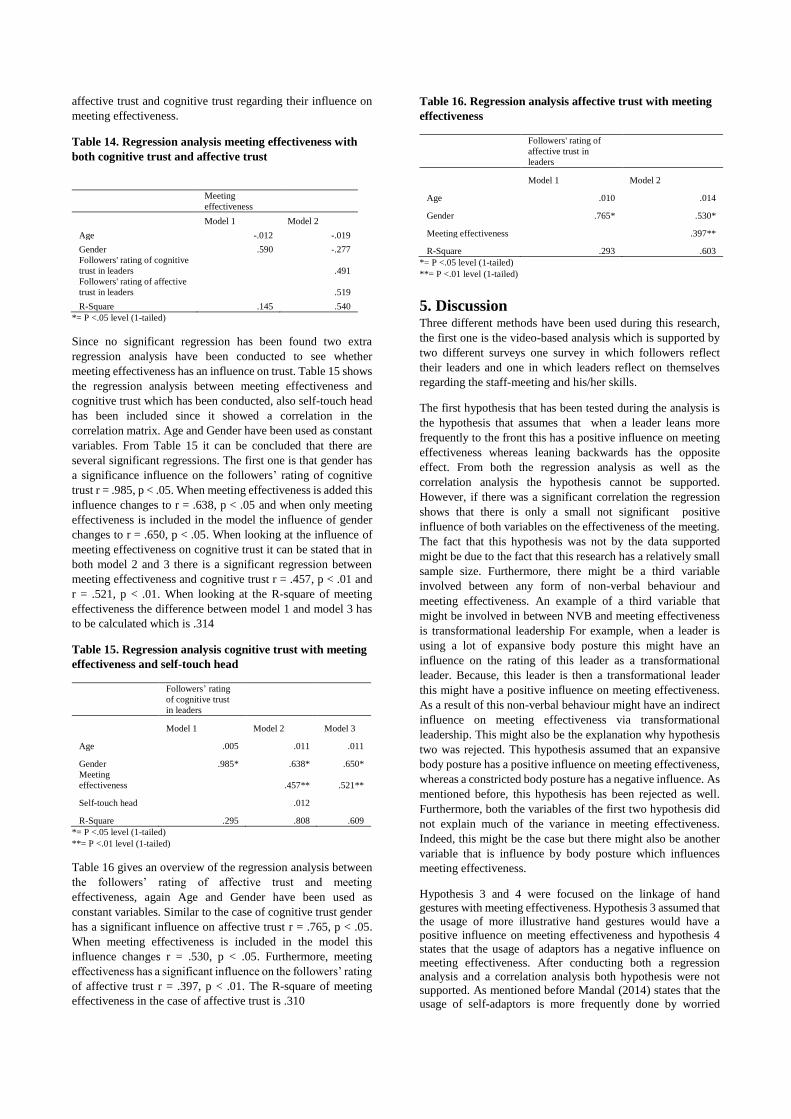
Since no significant regression has been found two extra
regression analysis have been conducted to see whether
meeting effectiveness has an influence on trust. Table 15 shows
the regression analysis between meeting effectiveness and
cognitive trust which has been conducted, also self-touch head
has been included since it showed a correlation in the
correlation matrix. Age and Gender have been used as constant
variables. From Table 15 it can be concluded that there are
several significant regressions. The first one is that gender has
a significance influence on the followers’ rating of cognitive
trust r = .985, p < .05. When meeting effectiveness is added this
influence changes to r = .638, p < .05 and when only meeting
effectiveness is included in the model the influence of gender
changes to r = .650, p < .05. When looking at the influence of
meeting effectiveness on cognitive trust it can be stated that in
both model 2 and 3 there is a significant regression between
meeting effectiveness and cognitive trust r = .457, p < .01 and
r = .521, p < .01. When looking at the R-square of meeting
effectiveness the difference between model 1 and model 3 has
to be calculated which is .314
Table 15. Regression analysis cognitive trust with meeting
effectiveness and self-touch head
Followers’ rating
of cognitive trust
in leaders
Model 1 Model 2 Model 3
Age .005 .011 .011
Gender .985* .638* .650*
Meeting
effectiveness .457** .521**
Self-touch head .012
R-Square .295 .808 .609
*= P <.05 level (1-tailed)
**= P <.01 level (1-tailed)
Table 16 gives an overview of the regression analysis between
the followers’ rating of affective trust and meeting
effectiveness, again Age and Gender have been used as
constant variables. Similar to the case of cognitive trust gender
has a significant influence on affective trust r = .765, p < .05.
When meeting effectiveness is included in the model this
influence changes r = .530, p < .05. Furthermore, meeting
effectiveness has a significant influence on the followers’ rating
of affective trust r = .397, p < .01. The R-square of meeting
effectiveness in the case of affective trust is .310
Table 16. Regression analysis affective trust with meeting
effectiveness
Followers' rating of
affective trust in
leaders
Model 1 Model 2
Age .010 .014
Gender .765* .530*
Meeting effectiveness .397**
R-Square .293 .603
*= P <.05 level (1-tailed)
**= P <.01 level (1-tailed)
5. Discussion Three different methods have been used during this research,
the first one is the video-based analysis which is supported by
two different surveys one survey in which followers reflect
their leaders and one in which leaders reflect on themselves
regarding the staff-meeting and his/her skills.
The first hypothesis that has been tested during the analysis is
the hypothesis that assumes that when a leader leans more
frequently to the front this has a positive influence on meeting
effectiveness whereas leaning backwards has the opposite
effect. From both the regression analysis as well as the
correlation analysis the hypothesis cannot be supported.
However, if there was a significant correlation the regression
shows that there is only a small not significant positive
influence of both variables on the effectiveness of the meeting.
The fact that this hypothesis was not by the data supported
might be due to the fact that this research has a relatively small
sample size. Furthermore, there might be a third variable
involved between any form of non-verbal behaviour and
meeting effectiveness. An example of a third variable that
might be involved in between NVB and meeting effectiveness
is transformational leadership For example, when a leader is
using a lot of expansive body posture this might have an
influence on the rating of this leader as a transformational
leader. Because, this leader is then a transformational leader
this might have a positive influence on meeting effectiveness.
As a result of this non-verbal behaviour might have an indirect
influence on meeting effectiveness via transformational
leadership. This might also be the explanation why hypothesis
two was rejected. This hypothesis assumed that an expansive
body posture has a positive influence on meeting effectiveness,
whereas a constricted body posture has a negative influence. As
mentioned before, this hypothesis has been rejected as well.
Furthermore, both the variables of the first two hypothesis did
not explain much of the variance in meeting effectiveness.
Indeed, this might be the case but there might also be another
variable that is influence by body posture which influences
meeting effectiveness.
Hypothesis 3 and 4 were focused on the linkage of hand
gestures with meeting effectiveness. Hypothesis 3 assumed that
the usage of more illustrative hand gestures would have a
positive influence on meeting effectiveness and hypothesis 4
states that the usage of adaptors has a negative influence on
meeting effectiveness. After conducting both a regression
analysis and a correlation analysis both hypothesis were not
supported. As mentioned before Mandal (2014) states that the
usage of self-adaptors is more frequently done by worried
people than by confident people. As a result of this it could be
assumed that it has a negative influence on meeting
effectiveness. However, the main issue might be that there is a
variable missing in this analysis that links hand gestures with meeting effectiveness.
However, when looking at the ANOVA analysis it can be stated
that even though there is no significant difference between the
means of the 5 leaders that scored the highest on meeting
effectiveness and the 5 leaders that scored the lowest. It still
shows an insignificant difference in means, this difference
supports the hypothesis except for hypothesis 4. An example of
this is that thee leaders that scored the highest on meeting
effectiveness more frequently had an expansive body posture
and were leaning more forward than the 5 leaders which scored
the lowest on meeting effectiveness. However this has no effect in whether the hypotheses are rejected or accepted.
What can be concluded after looking at the hypothesis
regarding meeting effectiveness is that even though there were
no significant correlations found during the research. There is still this missing link.
When looking at the hypotheses regarding pro-active behaviour
(H5,H6,H7, and H8) it becomes clear that after conducting the
regression analysis and correlation analysis regarding these
hypotheses all hypotheses are rejected. However, one
significant correlation and regression has been found. This
regression has been found between upward palms and pro-
active behaviour. The influence that upward palms has on pro-
active behaviour is negative, r = -.016, p < .05. This is
surprising since the literature states that upward palms normally
is connected with asking for input by the other people (Kendon
2004, Cesario and Higgins, 2007). This contradictory finding
might be explained by the fact that the sample size that has been
used is relatively small. Next to this, as mentioned before
regarding meeting effectiveness, there might be a third variable
involved between non-verbal behaviour and pro-active behaviour.
Like in the case of meeting effectiveness, the ANOVA analysis
shows that there is no significant difference between the means
of the 5 leaders that scored the highest on the level of the
followers’ pro-active behaviour and the 5 leaders that scored
the lowest regarding pro-active behaviour. However, when
looking at the difference in means it can be stated that this
supports the hypotheses except for hypothesis 8. An example
of the insignificant difference in means is that the 5 leaders
which scored the highest on the level of the followers’ pro-
active behaviour had a more expansive body posture and were
leaning forward more than the 5 leaders with the lowest score.
However, this does not support the hypotheses and therefore they need to be rejected.
The final hypothesis that has been tested is the hypothesis that
linked pro-active behaviour with meeting effectiveness. The
hypothesis assumes there is a positive influence of the level of
pro-active behaviour on meeting effectiveness. The analysis
however, shows that there is no significant correlation between
pro-active behaviour and meeting effectiveness. This might be
caused by the small sample size or the fact that there is a third variable involved.
As can be concluded from the additional research section.
There is a significant influence of meeting effectiveness on
both the followers’ rating of cognitive trust and affective trust.
The influence on both variables is relatively high since the R-
square is relatively .314 and .310. This implies that meeting
effectiveness explains 31% of the variance in both cognitive trust and affective trust.
5.1 Strengths, limitations and future
research directions The main strength of this analysis is that several sources has
been used to conduct this research. This contains the video
method research and the several surveys that have been
conducted. By using several sources this research has made
sure to exclude same method bias. This is important since
according to Cote & Buckley (1987) 26.3% of the variance in
a research might be due to same method bias.
Even though, there is a strength there are also some limitations
regarding this research. The first limitation is the sample size
since the sample size that has been used consists of just 20
leader which might result in a less reliable research. However,
it has been chosen to analyse a smaller sample more extensive
than a bigger sample less extensive. This gives a better and
more reliable result of the non-verbal behaviour. Furthermore,
the video was recorded in one single organization so this
research might not give a valid view regarding the whole
population.
Furthermore, the leaders that have been analysed were only
recorded one time. This might result in the fact that maybe a
leader had a bad day and used therefore less hand gestures than
he would normally use.
Another limitation is that this research is not an experiment but
an observation. Therefore, a correlation and regression analysis
normally cannot be used. However an observation was chosen
because there was a higher potential for strong generalizability
and external validity of the results.
Further research should mainly concentrate on expanding the
sample by analysing more leaders. Next to this, each leader
should be analysed more than only one time to see if his non-
verbal behaviour throughout the observations is really
representative. To make it even more reliable the same
observation should be conducted in several different
organizations. Furthermore, a close look should be taken on
whether there is a third variable present between non-verbal
behaviour and both pro-active behaviour and meeting
effectiveness. As can be concluded from the additional research
section meeting effectiveness has an influence on trust, as a
further research more in-depth research regarding this topic can be conducted.
6 Acknowledgements First of all, I would like to thank my supervisor J.G.W.L. Smits
for his support during the period of working on this report.
Furthermore, I would like to thank all the other researchers that
worked on the same sample of leaders as me. Because without
them, we would not have the data we have now and the data
would be less reliable.
References
Aragón-Correa, J. (1998). Strategic proactivity and firm
approach to the natural environment. Academy Of
Management Journal, 41(5).
Baran, B., Shanock, L., Rogelberg, S., & Scott, C. (2012).
Leading Group Meetings: Supervisors’ Actions,
Employee Behaviors, and Upward Perceptions. Small
Group Research, 43(3), 330-355.
Bateman, T., & Crant, J. (1999). Proactive behavior:
Meanings, impact, and recommendations. Business Horizons, May-June, 63-70.
Baym, N., Zhang, Y., & Lin, M. (2004). Social
interactions across media: Interpersonal communication
on the internet, telephone and face-to-face. New Media & Society, 6(3), 299-318.
Birdwhistell, R. (1970). Kinesics and context (1st ed.). Philadelphia: Pennsylvania University Press.
Bolino, M., Valcea, S., & Harvey, J. (2010). Employee,
manage thyself: The potentially negative implications of
expecting employees to behave proactively. Journal Of
Occupational And Organizational Psychology, 83(2), 325-345.
Bonaccio, S., O'Reilly, J., O'Sullivan, S., & Chiocchio, F.
(2016). Nonverbal Behavior and Communication in the
Workplace: A Review and an Agenda for Research. Journal Of Management, XX(1-31), 1-4.
Carney, D., Cuddy, A., & Yap, A. (2010). Power Posing:
Brief Nonverbal Displays Affect Neuroendocrine Levels
and Risk Tolerance. Association For Psychological Science, XX(X)(1-6).
Carsten, M., Uhl-Bien, M., West, B., Patera, J., &
McGregor, R. (2010). Exploring social constructions of
followership: A qualitative study. Leadership Quarterly,
21, 543-562.
Cashdan, E. (1998). Smiles, speech, and body posture:
How women and men display sociometric status and power. Journal Of Nonverbal Behavior, 22(4), 209-228.
Cesario, J., & Higgins, E. (2008). Making message
recipients "feel right" How nonverbal cues can increase persuasion. Physchological Science, 19(5), 415-420.
Clawson, M., Bostrom, R., & Anson, R. (1993). The role
of the facilitator in computer-supported meetings. Small Group Research, 24.
Cote, J. A. & Buckley, R. (1987). Estimating trait, method,
and error variance: Generalizing across 70 construct
validation studies. Journal of Marketing Research, 24, 315-318
Crant, J. (2000). Proactive Behavior in Organizations.
Journal Of Management, 26(3).
Darioly, A., & Schmid Mast, M. (2014). The Role of
Nonverbal Behavior in Leadership: An Integrative Review (1st ed., pp. 2-8). Hannover: TIB Hannover.
Dethmers, H. (2017). The Role of Nonverbal Behavior in
Leadership Effectiveness: A multi-method, video-observational study. Enschede: University of Twente.
Engel, L. (2016). Lending a Hand to Improving
Organizational Leadership. In 6th IBA Bachelor Thesis Conference. Enschede: University of Twente.
Engleberg, I., & Wynn, D. (2007). Working in Groups,
Communication Principles and Strategies (4th ed.). Pearson Education Inc.
Fritz, C., & Sonnentag, S. (2009). Antecedents of Day-
Level Proactive Behavior: A Look at Job Stressors and
Positive Affect During the Workday. Journal Of Management, 35(1).
Fuller, B., Marler, L., Hester, K., & Otondo, R. (2015).
Leader reactions to follower proactive behaviour: Giving
credit when credit is due. Human Relations.
Grant, A., Parker, S., & Collins, C. (2009). Getting credit
for proactive behavior: Supervisor reactions depend on
what you value and how you feel. Personnel Psychology, 62(1), 31-55.
Hall, J., Carter, J., & Horgan, T. (2001). Status roles and
recall of nonverbal cues. Journal Of Nonverbal Behavior,
25(2), 79-100.
Kayser, T. (1990). Mining group gold: how to cash in on
the collaborative brain power of a group (1st ed.). El Segundo: Serif Publishing.
Kendon, A. (2004). Gesture: Visible Action as Utterance (1st ed.). Cambridge: Cambridge University Press.
Knapp, M., & Hall, J. (2010). Nonverbal communication in human interaction (7th ed.). Boston: MA: Wadsworth.
Kocsis, D., De Vreede, G., & Briggs, R. (2015). Designing
and Executing Effective Meetings with Codified Best
Facilitation Practices In The Cambridge handbook on
meeting science.. Cambridge: Cambridge University Press.
Mandal, F. (2014). Nonverbal Communication in
Humans. Journal Of Human Behavior In The Social
Environment, 24(4), 417-421.
Matsumoto, D., & Hwang, H. (2013). Cultural similarities
and differences in emblematic gestures. Journal Of Nonverbal Behavior, 37(1), 1-27.
McHugh, m. (2012). Interrater reliability: the kappa
statistic.. Retrieved 14 April 2017, from
https://www.ncbi.nlm.nih.gov/pmc/articles/PMC3900052
/
Mehrabian, A. (1972). Nonverbal Communication (3rd
ed.). New Jersey: Transaction Publishers.
Morrison, E., & Phelps, C. (2017). Taking Charge at
Work: Extrarole Efforts to Initiate Workplace Change.
Academy Of Management Journal, 42(4), 403-419.
Nixon, C., & Littlepage, G. (1992). Impact of Meeting
Procedure on Meeting Effectiveness. Journal Of Business And Psychology, 6(3).
Noldus, L., Trienes, R., Hendriksen, A., Jansen, H., &
Jansen, R. (2000). The observer video-pro: New software
for the collection, management, and presentation of
timestructured data from videotapes and digital media
files. Behavior Research Methods, Instruments, And
Computers, 197-206.
Remland, M. (1981). Developing leadership skills in
nonverbal communication: A situational perspective. Journal Of Business Communication, 18(3).
Rogelberg, S., Leach, D., Warr, P., & Burnfield, J. (2006).
" Not another meeting!" Are meeting time demands
related to employee well-being?. Journal Of Applied Psychology, 91(1), 83.
Romano Jr., N., & Nunamaker Jr., J. (2001). Meeting
Analysis: Findings from Research and Practice. In 34th
Hawaii International Conference on System Sciences. Hawaii.
Watson, D., Clark, L., & Tellegen, A. (1988).
Development and Validation of Brief Measure of Positive
and Negative Affect: The PANAS Scales. Journal Of Personality And Social Psychology, 54(6), 1063-1070.
Zimmerman, P., Bolhuis, J., Willemsen, A., Meyer, E., &
Noldus, L. (2009). The Observer XT: A tool for the
integration and synchronization of multimodal signals. Behavior Research Methods, 41, 731-735.