Embed Size (px)
Citation preview

16
The Influence of Lignite Mining on Water Quality
Barbara Jachimko University of Zielona Góra
Poland
1. Introduction
Mining is one of the oldest human activities in the world. Due to long history and changes in the economic situation there are many abandoned mine areas throughout the world. Mining is an industrial branch which is very destructive to the environment. It influences the environment in a number of ways, such as landscape conversion, changes in the water regime and a negative influence the quality of water. Waters polluted by mining wastes are called AMD (acid mine drainage). AMD, connected to lignite mining are extremely acidic and enriched with iron, sulphate and heavy metals. The pollution was caused by weathering products of different sulphides (mainly pyrite FeS2), which exposed to water and oxidant weather and release protons, sulphate, ferrous and heavy metals into the water. It threatens to the biota and even completely destroys life for a long, difficult to estimate time. The are two ways of preventing such pollution: prevention of AMD formation (activity by source) and treatment AMD already formed. The aim of treatment techniques is to obtain a long-term effect after the treatment activity has been stopped. Until now no success has been achieved. A very interesting example of the influence of lignite mining on water quality is the “anthropogenic lake district” located in Mużakowski Łuk (Western Poland). It comprises about 100 reservoirs of different origin, size and chemical composition, which have never been reclaimed. Among them there are acidic reservoirs of the meromixic type, whose chemical properties have been monitored almost since the appearance of the youngest one, i.e. 1982. On the basis of almost thirty year long observations some interesting remarks, presented below have been formulated. The most important is the difference between the chemical composition of the upper and lower layer, especially the pH value. The chapter presents short review of the occurrence of post-mining areas, the chemistry of acid mine drainage and the description of the “anthropogenic lake district“ as a case study of the influence of lignite mining on water quality.
2. Scale of the problem – Global problems with post-mining areas
World lignite deposits are mainly located in Australia, China, some EU countries, Russia, and the USA. China, the world’s largest coal producer now accounts for nearly 40 per cent of the world total. Brown coal (lignite) is burnt in power stations for the production of electricity and is also used for other domestic and industrial purposes (steam coal). In 2007, in Europe, the biggest amounts of lignite were mined in Germany – 180*106 t, Turkey 74*106
www.intechopen.com

Water Quality Monitoring and Assessment
374
t, Greece 66*106 t, Poland – 57*106 t, Czech Republic – 49*106 t, Romania – 75*106 , Bulgaria – 28*106 t. The are three main techniques of lignite mining: underground, open-cast and gasification (on the surface or underground). Nowadays, about 95 to 98% of lignite is mined by the open-cast method and a few percent by the underground one. The underground method was common from the 19th c. till the first half of 20th c. Then, it was discontinued due to low safety, efficiency and economical aspects. Many accidents and cases of excavation flooding occurred. The youngest mine technique is underground gasification in a temperature of ca. 1200oC. The method has not become popular due to numerous disadvantages (thermal conversion of the surrounding rocks, toxic gases and fumes, earth surface deformations, changes in the hydrological balance, groundwater pollution by minerals and benzene). Therefore, it can be used in uninhabited areas, such as deserts or sea shelves. (Kasztelewicz et al. 2008).
Europe has a long tradition of mining beginning with flint mines, then metals, such as copper, gold and silver, ending with coal. The Phoenicians mined metals in Spain in the Bronze Age. The first gold coins were produced in Bulgaria, Greece and Turkey around 700 BC. Techniques of underground mining and even dewatering were improved by The Romans. Some fields started to be abandoned in the middle of the nineteenth century and needed control of environmental impact and remediation (Wolkersdorfer & Bowell, 2005). In 2008 the 32 EU countries produced 10 per cent of the world’s coal (all types) of which approximately half came from Germany and Poland. (Brown et al. 2010) – Table 1. During the last 100 years in Germany 10 lignite mining districts come into being (Niederrheinischer in Nordrhein-Westfalen, Thueringsch-Saechsischer, now Mitteldeutsches, Lausitzer, Niederhessischer, Braunschweig-Magdeburger, Oberpfaelzer, Westerwald, Rhein-Main, Ostdeutcher –after the war in Poland, Schlesischer – after the war in Poland).
In Poland there are five lignite mines: Adamów, Bełchatów, Konin, Turów, and Sieniawa, with a total production of 56*106 tonnes in 2010. In all of them lignite is produced by the open cast method, excluding “Sieniawa”. “Sieniawa” located in Ziemia Lubuska, is one of the oldest brown coal fields in Poland. It was discovered in the middle of the 19th c. The exploitation started in 1873 in the mine called “Emiliensglück”. The mine was destroyed during the Second Word War. Then it was activated in 1950 as the mine “Sieniawa”. In 1983 it produced about 209*103 tonnes of coal. More then half of total production, ca. 33 mln Mg per year came from Bełchatów, 20% from Turów, 17% from Konin and 8,5% from Adamów.
3. Influence of mine activity on water resources
Mining must be preceded by seam dewatering. It changes the hydrological regime and upsets the water balance. Lowering the water table causes lack of water in domestic wells, it decreases soil humidity and river flow. After closure many pits are filled back with groundwater, which had been earlier polluted by discharge from mining wastes and overburden material. In Poland in 2002, about 361 million m3 of water were pumped from open lignite mines, producing cones of depression of 1200 km2 (Wilk, 2003). In the “Bełchatów” mine (Poland) the cone of depression was about 730 km2. In Poland the drainage water is generally of good quality and not environmentally hazardous, with the exception of water from Turów with the salinity of over 5 g/l. Some of the serious AMD problems occur in Germany, in the Lausitz and around Leipzig. They come from the high AMD potential and deficit of water in the area. About one third of the total amount of about
www.intechopen.com

The Influence of Lignite Mining on Water Quality
375
500 open-cast pit lakes in Germany were acid with a pH below 3 (Fyson A., Nixdorf B., Kalin M., 2006). 168 pit lakes have been documented in the Lausitz and approximately half of them are extremely acidic (pH 2.4-3.4) (Table 1). Acidic mine lakes in the Lausitz contain huge amount iron (up to 800 mg/dm3) and sulphate (up to 4636 mg/dm3).
Parameter unit minimum maximum
pH - 2.4 3.4
Acidity mmol/dm3 0.1 26.6
Total Fe mg/dm3 0.2 800
Sulphate mg/dm3 460 4636
Total organic mgC/dm3 0.8 10.9
Total N mg/dm3 0.9 5.3
Total P µg/dm3 4 26
Table 1. Summary of some chemical parameters for 75 acidic mine lakes in the Lausitz region (Nixdorf et al. 2001).
4. Chemistry of AMD
4.1 Weathering of minerals accompanying coal and metal ores
Mining affects the natural cycles of some elements, mainly sulphur and iron. It changes the natural base acid balance by the increase of the amount of sulphides minerals exposed to water and atmosphere. Protons and other acid ions released due to accelerated dissolution should be neutralised by the reactions of carbonates and silicates weathering. Coal deposits often contain very small quantities of base materials, which inhibits neutralisation. Sulphur-bearing minerals, such as iron sulphides, sphalerite (ZnS), chalcopyrite (CuFeS2), galena (PbS), arsenopyrite (FeAsS) often occur with coal and metal ores. The pyrite content in mine wastes was estimated at between 0,1 and 5% (weight) (Blodau, 2006). In Turów (Poland) the pyrite content was in the range of 0,3 to 0,5% (Kwiatkowski, 2006) and in Sieniawa below 0,8%. Iron-disulphides (FeS2) exist in two main forms: pyrite and marcasite, which have the same chemical composition and different crystallography. Pyrite is the most stable and prevalent form.
Pyrite oxidation is the main process involved in acidity generation. Two oxidants are involved in pyrite oxidation : oxygen and ferric ion, Fe (III).
The reactions of pyrite weathering under the exposure to air and water are as follows:
FeS2+7/2O2+H2O=Fe2++2SO42-+2H+ [1]
Fe2++1/4O2+H+= Fe3++ 1/2H2O [2]
Fe3++ 3H2O=Fe(OH)3+3H+ [3]
FeS2+14Fe3++8H2O=15Fe2++2SO42-+16H+ [4]
According to the reactions [1] and [4] ferrous and sulphate ions are released at the rate of 1:2
(Lenk & Wisotzky, 2001). In the first stage sulphide oxidation one mole of oxidized pyrite
gives two moles of protons and two moles of sulphides. In an anoxic milieu, ferrous ions are
www.intechopen.com

Water Quality Monitoring and Assessment
376
inert and can exist in high concentrations. The reaction [4] describes pyrite oxidation by
ferric ions (Fe(III)). Ferric ions coming form pyrite weathering supply reactive Fe(III) and
allow the process to proceed. The rate constant of the reaction [2] depends on pH, so
oxidation of ferrous to ferric in a pH below 3 is extremely slow (Nordstrom, 1982). In the
acidic range (pH from 2,5 to 3,5) ferrous oxidation is catalysed by microorganisms. In a
neutral to alkaline milieu Fe(III) concentration is limited by the precipitation of hydrous
ferric oxides and the importance of the reaction [2] decreases. The reaction of pyrite
oxidation is surface controlled (Evangelou, 1995) and the nature of products depends on the
origin and shape of pyrite.
The final AMD chemistry depends on the following factors:
• amounts of sulphides exposed to weathering factors,
• weathering reaction rate,
• secondary reactions, such as ferric minerals precipitation and redox reactions,
• availability of base minerals.
4.2 Secondary processes in the aspect of water acidity
After pyrite weathering products, such as protons, sulphates (VI) and ferrous ions are
released into water, different secondary processes occur. The processes involve precipitation
(mainly of iron, aluminium or calcium minerals), ion exchange, isomorphic substitution,
redox reaction (often supported by microorganisms) and the transformation of solids. The
processes influence water quality and on the basis of the impact on pH, they are classified as
acidity or alkalinity generation. The most important process generating acidity is the
precipitation different ferric compounds (Table 2). Their accumulation in acid reservoirs is
an important part of the iron cycle in the environment (Cornell & Schwertmann, 2000).
Mineral Formula Reaction
Ferrihydrite Fe(OH)3 Fe(OH)3+3H+⇔Fe3++3H2O
K-Jarosite KFe3 (SO4)2(OH)6 K++3Fe3++2SO42- ⇔KFe3 (SO4)2(OH)6+6H+
H-jarosite HFe3 (SO4)2(OH)6 3Fe3++2SO42-+6H2O ⇔HFe3 (SO4)2(OH)6+5H+
Schwertmannite Fe8O8(OH)x(SO4)y Fe8O8(OH)x(SO4)y+(24-2y)H+⇔ 8Fe3++ySO42-+(24-2y+x)/H2O
Goethite FeOOH FeOOH+3H+⇔Fe3++2H2O
melanterite FeSO4*7H2O Fe3++SO42-+7H2O ⇔FeSO4 *7H2O
siderite FeCO3 Fe3++CO2(g)+H2O ⇔FeCO3 +2H+
Table 2. Influence of ferric minerals on acidity generation
Goethite (named after Johann Wolfgang von Goethe) is the most thermodynamically stable
phase at a pH>2, but it occurs in minor quantities within precipitates, however, it is in
common in bottom sludge. Optimum pH conditions for schwertmannite formation were
found between 2.8 and 3.2 (Bigham, 1996). Jarosite forms at a pH<2.5 and ferrihydrite (basic
formula Fe5O8H*H2O) precipitates at a pH>4.5 (Blodau, 2006).
According to Langmuir (1997) the highest pH value, for the potassium concentration of 10-4
and sulphate of 10-2 mol/kg the pH value is 3.8. Ferric atoms involved in the crystalline
structure of minerals are often replaced by other ions, such as the substitution of aluminium
www.intechopen.com

The Influence of Lignite Mining on Water Quality
377
in goethite. The general formula of goethite incrusted by aluminium is Fe1-xAlx)y/3O1-
y(OH)1+y, where y may reach 0.25 (Wolska & Schwertman 1993).
Aluminium precipitates in the form of gibbsite and kaolinite and in the presence of high
sulphate concentrations, in the form of different sulphates such as alunogen, alunite or
jurbanite.
According to Nordstrom (1982), the stability for particular minerals, for the sulphate
concentration of 10-4 mol/kg, ranges as follows:
• 0-3.3 pH – jurbanite AlSO4(OH)*5H2O
• 3.3-4.47 pH – alunite KAl3(SO4)2(OH)6
• pH>4.47 gibbsite Al(OH)3.
Schwertmannite is metastable to goethite and transforms in solid phase with protons
release, according to the reaction:
Fe8O8(OH)5.5(SO4)1.25(s)+2.5H2O=8FeOOH(s)+2.5H++1.25SO42- [5]
Another mineral, which often precipitates in post-mine water is gypsum:
Ca2++SO42-+2H2O=CaSO4*2H2O [6]
The reaction [6] has no direct influence on the acidity balance (except for changing the
concentration of HSO4- ), but it considerably limits mineralization.
Processes involved in acidity consumption include the dissolution of base minerals (calcite,
dolomite, biotite, plagioclase, orthoclase), cation exchange and redox/precipitation
reactions. In the case of lack of base minerals in soils pH may reach an extremely low value,
even below 1. It accelerates the rate of silicates weathering and releases aluminium ions into
the water. Redox processes with the participation of organic matter usage as a reducing
agent result in ferric and sulphate reduction contrary to pyrite weathering. The processes of
sulphate and iron reduction are controlled by electron donor availability (Blodau et. al.,
2000), temperature and pH (Koschorreck et al., 2003).
4.3 Acid base balance in AMD
In order to understand AMD chemistry and predicting the results of neutralisation
strategies it is crucial to know the acid-base theory by Stumm & Morgan (1996). The theory
was adopted to AMD by Uhlmann in Nixdorf & Deneke (2004). On the basis of hydrolysis
reactions of weak anions (HSO4-) or cations (Fe3+, Al3+) acidity and alkalinity can be
described as follows:
Aci=[H+]+3[Fe3+(aq)]+3[Al3+(aq)]-[HCO3-]-[OH-] [7]
Alk = [HCO3-]-[OH-]-[H+]-3[Fe3+(aq)]-3[Al3+(aq)] [8]
where: [H+], [Fe3+(aq)], [Al3+(aq)], [HCO3-], [OH-] – the activity of the ion.
Calculations of alkalinity and acidity according to the above equations are difficult due to the occurrence of iron and aluminium in different intermediates (hydrolysis), mainly as
www.intechopen.com

Water Quality Monitoring and Assessment
378
hydroxyl complexes. Acidity and alkalinity can also be calculated on the basis of strong anions and cations with the differentiation of oxic conditions. For an anoxic milieu acidity and alkalinity can described according the following equations:
Aci anox = 2[SO42-]+[Cl-]+[NO3-]-2[Ca2+]-2[Mg2+]-[Na+]-[K+]-[NH4+]-2[Fe2+] [9]
Alk anox = 2[Ca2+]+2[Mg2+]+[Na+]+[K+]+[NH4+]+2[Fe2+]-2[SO42-]-[Cl-]-[NO3-] [10]
Therefore under oxic conditions ferrous ions are oxidised to ferric, which is a weak base. And the above equations can be modified to:
Aci ox = 2[SO42-]+[Cl-]+[NO3-]-2[Ca2+]-2[Mg2+]-[Na+]-[K+]-[NH4+] [11]
Alk ox = 2[Ca2+]+2[Mg2+]+[Na+]+[K+]+[NH4+]-2[SO42-]-[Cl-]-[NO3-]- [12]
In order to estimate the aciditity of water from copper mines (high copper concentration), Evangelou (1995) formulated the neutralisation potential (NP), which is defined as follows:
2 2 3 243 3
2 2 3 2CO HCO OH HSO H Fe Al Cu
NP c c c c c c c c− − − − + + + += + + − − − − − [13]
c- ion concentration, mmol/dm3.
Schoepke (1999) adapted this expression for lignite mine water:
2 2 3 243 3
32 2 3 2 2FeCO HCO OH HSO H Fe Al MnNP c c c c c c c c c− − − − + + + ++= + + − − − − − − [14]
If alkalinity according to Stumm&Morgan (1996) can be described as:
34 3
3H HSO Fe HCO
Alk c c c c+ − + −= − − − + [15]
Then the NP can be shortened to:
2 3 32 3 2Fe Al Mn
NP Alk c c c+ + +≈ − − − [16]
Alk means the results of 0.1N NaOH titration to a pH= 4.3.
In acid water NP is below zero and for base has positive values. The goal of remediation strategies is to achieve an NP above 0.2 mmol/dm3 to lower acidity to the expected level. The choice of a neutralization strategy depends on the neutralization algorithm, which includes the following reactions:
1. protons neutralisation: H++NaOH=H2O+Na+ [17]
2. Fe(III) hydrolysis, pH>3: Fe3++3NaOH=Fe(OH)3+3Na+ [18]
3. Al(III) hydrolysis, pH>4: Al3++3NaOH=Al(OH)3+3Na+ [19]
Tootche et al. (2003) studied the buffering mechanisms of acidic mining lakes in the open cast lignite mining lake (Plessa 111) in Lausitz (Germany). On the basis of laboratory investigations, hydrochemical modelling and mineralogical structure he detected four different buffers in four successive sections of the titration curve:
www.intechopen.com

The Influence of Lignite Mining on Water Quality
379
1. hydrogen sulphate buffering with no precipitates :
HSO4-=SO42-+H+ [20]
2. iron buffering with iron hydroxide precipitation and sulphate sorption:
precipitation: Fe3++3H2O→Fe(OH)3(s)+3H+ [21]
sorption: Fe-OH +SO42-+H+→Fe-SO4-+H2O [22]
Fe-OH +SO42-→Fe-OHSO42- [23]
Fe-OH +Ca2+→Fe-OCa++H+ [24]
Fe-OH +Mg2+→Fe-OMg++H+ [25]
3. aluminium buffering: aluminium hydroxysulphate precipitation:
Al3++ x SO42- +(3-2x)H2O→Al(OH)3-2x(SO4)x(s)+(3-2x)H+ [26]
and also Mn-buffer – manganese oxide precipitation
Mn2++2H2O→FeO2(s)+4H++2e- [27]
4. an additional soil phase buffer which was based on: a. ion exchange calcium and magnesium on goethite, b. mineral transformation of schwertmannite into goethite with the release of protons and
sulphate:
Fe16O16(OH)16-2x(SO4)x(s)+2xH2O→16 FeOOH+xSO42-+2xH+ [28]
The first section of the titration curve was in a pH range of 2.5 to 3, the second – 3.5 to 4.5,
the third – 4.5 to 5.5 and the last one - above 5.5. The longer the buffer zones are, the more of
the neutralization agent must be used.
5. Antrophogenic lake district in Łuk Mużakowski – Poland as a case study of the influence of brown coal mining on water resources
5.1 Location and origin
The “anthropogenic lake district” is located along the Polish-German border between
Trzebiel and Łęknica. It comprises about 100 reservoirs of different sizes and chemical
properties with a total surface of about 1 500 000 m2. The reservoirs were generated due to
lignite mining which started in the second half of the 19-th century and lasted till the seventies
of the 20-th century. In 19-th century seven mining companies were operated in this area. The
first one was founded in Raszyn in 1983, the next in Tuplice a year later, then “Wiktor” in
Trzebiel in 1898 and in Nowe Czaple in 1900. The best known mine in this area was “Babina”
in Łęknica. It was founded in 1922 and operated (as the last one) till 1973 (Jędrczak, 1992).
Exploitation was done by means of two methods, at the beginning underground and later
open cast. Both techniques resulted in unfavourable changes in the landscape, such as pits and
sinks, which after being filled with water created pit and hollow lakes.
www.intechopen.com

Water Quality Monitoring and Assessment
380
Reservoirs are divided into three groups depending on their origin and location (Fig. 1.):
Fig. 1. Map of the “antrophogenic lake district“
1-62 reservoir number
acidotrophic reservoir
54 - number of res. under research
LEGEND
Warsaw
www.intechopen.com
The Influence of Lignite Mining on Water Quality
381
1. ca. 30, the oldest hollow reservoirs situated near Tuplice; they have elongated shape with axis NE-SW, their surface varies from <1 to 15 ha and maximal depth from 1.5 to 5.5 m.
2. 33 hollow reservoirs situated between Trzebiel and Kamienica; they are rather small, with a surface lower than 5 ha, but relatively deep to 9.5 m.
3. 33, the youngest and biggest pit reservoirs situated near Łęknica; their surface varies from 1.8 to 22 ha, and the maximal depth from 3.5 to 21.5 m.
The reservoirs have never been remediated. One of them was used as a domestic waste receiver and due to eutrophisation it disappeared. Some of the smallest reservoirs are used as fish farms. The rest of them are not exploited economically nor touristically.
5.2 Methods
The reservoirs of the “antrophogenic lake district” were monitored irregularly. The first data come from the early eighties, about five years after the youngest reservoir came into being. The chemistry of some reservoirs was described by Jędrczak (1992) and Jachimko (1998). In the years 2006-2009, mainly meromictic reservoirs were investigated (Jachimko, 2007; Jachimko&Kołodziejczyk, 2008). All research was based an analysis of water samples taken up along the vertical profile (from the surface and then every two meters in depth), from the deepest place of each reservoir. The water analyses were supplemented by sludge chemistry. The hydrogeochemical simulator PHREEQC (Parkhurst&Apello, 1999; Apello&Postma, 2006) was used to calculate saturation indexes with the use of constants included in the program. NP according to the reaction [14] was calculated to evaluate the acidification.
5.3 Chemistry of reservoirs
The reservoirs of the “antrophogenic lake district” have different chemical properties (Table 3). According to the pH value and redox potential the reservoirs were classified into three groups:
1. acidotrophic with a pH ranging between 2.6 and 3.7 and redox potential of 605 to 755 mV,
2. intermediate with a pH ranging between 2.6 and 3.7 and redox potential of 605 to 755 mV
3. “others” with a pH ranging between 5.2 and 7.4 and redox potential of 380 to 600 mV.
Acidotrophic reservoirs are located in the south of the district. They are mainly the youngest reservoirs of pit origin. “Others” occur in the north and belong to the oldest group. There were only two intermediate reservoirs, no 11 and no 21, but their chemistry varied from one another. No 21 was similar to the acidotrophic class and no 11 to “others”. The pH value and redox potential were different in the profiles of most reservoirs. The biggest changes of the factors were found in acidotrophic reservoirs Re 25, 48 and 54. Surface waters were very acidic (pH<3.4) and had a high redox potential (>750 mV). However, waters close to the bottom had a pH of above 4 and a redox potential of less than 400 mV. Within the acidotrophic group the changes of the pH value in the vertical profile were insignificant. The pH values in vertical profile in the group of “others” reservoirs were almost constant or increased from the surface to the bottom (with the exception of very shallow reservoir no 8) (Fig. 2).
www.intechopen.com

Water Quality Monitoring and Assessment
382
60
328
48
62
14
37
ZZZBBBIIIOOORRRNNNIIIKKKIII
“““PPPOOOZZZOOOSSSTTTAAAŁŁŁEEE”””
1121
53
50
54
55
43
38
33
7
41
2831
27 169
25
200
300
400
500
600
700
800
900
2 3 4 5 6 7 8 9
odczyn, pH
pote
ncj
ał r
edoks,
mV
zbiorniki “pozostałe”zbiorniki acidotroficzne zbiornikiprzejściowe
acidotrophic res. intermediateres.
„others” res.
pH
Red
ox
po
ten
tia
l, m
V
Fig. 2. pH-value versus redox potential in vertical profiles of reservoirs (points represent surface, arrows - bottom layer)
The chemical composition and biocenosis of the “others” reservoirs were similar to the natural lakes. The evidence of mine origin are a high concentration of iron in the deeper part of the water body, the iron to sulphur ratio and a low neutralisation potential. In five reservoirs of this type, (no 7, 9, 27, 33 and 32) iron to the sulphur ratio in the bottom layer meets the values which result from pyrite weathering. The iron concentration in uppers layers is very small, lower than 0,05 mmol/dm3, due to the low solubility of ferric compounds in this pH region. Close to the bottom due to ferric reduction the concentration of iron remained on the primary, high level. The sulphate concentration changed in a very small range with depth and ranged from 0,15 to 2 mmol/dm3. In some reservoirs the sulphate concentration decreased with depth, probably as a result of reduction, but in the others it increased as a result of continuous AMD interaction. The bottom layer of reservoirs 25 and 48 contained much more ferrous irons than resulted from pyrite weathering. It was probably connected with meromictic type of the reservoirs.
parameter unit “others”
reservoirs intermediate
reservoirs acidotrophic
reservoirs
pH - 5,96 7,85
4,18 5,64
2,41 5,85
calcium mg/dm3 10,0 79,6
19,5 50,6
13,9 334
sulphate (VI) mg/dm3 10,8
186,3 37
171,6 75,5 3935
tot. iron mg/dm3 0,14 39,2
0,87 1,73
0,82 1618
aluminum mg/dm3 0,013 0,431
0,114 0,542
0,195 20,59
potassium mg/dm3 1,7 11,6
2,3 3,1
2,0 36,9
Table 3. Minimal and maximal values of water quality parameters (own results)
www.intechopen.com

The Influence of Lignite Mining on Water Quality
383
The water of “others” is of the calcium bicarbonate or calcium sulphate type. The percentage of calcium in the “others” reservoirs ranged from 34 to 71% of total cations and decreased with depth. In acidotrophic reservoirs it was smaller and varied from 16 to 59%. The iron content ranged from 0,1 to 30 % of total cations in the “others” reservoirs and reached 68% in the acidotrophic ones. Sulphate averaged from 34 to 72% of anions in the “other” reservoirs and dominated in almost all of them. The percentage of bicarbonate ranged from 9 to 50 % and chloride from 5 to 20% of total anions. Sulphate dominated in all acidotrophic reservoirs and ranged from 81 to 99,6%.
The chemistry of the reservoirs was interpreted with means of SI of ferric, aluminium and calcium minerals. Figure 3 presents the relationship of SI of the selected minerals and pH. The iron content was much higher than calculated from goethite or jarosite K solubility. The reservoirs were oversaturated to goethite in the whole range of pH, and to ferric hydrooxides in a pH over 4. Jarosite K was oversaturated in a pH below 3.5 and over 6.5 (with the exclusion of water with very little iron (concentration below 0.2 mg/dm3).
R7
R8
R 9
zb 14
R 16
R 27
R 31
R 32
R 33
R 41
0,0
0,2
0,4
0,6
0,8
1,0
0,0 0,5 1,0 1,5 2,0
sulphate, mmol/dm3
tot.
iro
n,
mm
ol/
dm
3 R 25
R37
R 48
R 50R 55R 60
R 62
0,0
2,0
4,0
6,0
0,0 2,0 4,0 6,0 8,0 10,0
sulphate, mmol/dm3
tot.
iro
n,
mm
ol/
dm
3
Fig. 3. Coexistence iron and sulphate in “others” (left) and aciditrophic reservoirs of the “antrophogenic lake district”.
The saturation of waters by aluminium compounds depended on pH in the following way:
• pH<4.7 - undersaturation to aluminium hydroxide, and below 4 also alunite, SI value incereased with pH,
• pH>4.7 – oversaturation to gibbsite, and in the range between 4 to 7.5 also alunite,
• pH>7.5 – undersaturation to aluminium hydroxide and alunite.
Most of the reservoirs, mainly “others” were slightly undersaturated to calcium sulphate, as gipsum or anhydrite. In the “others” reservoirs (no 14 i 16 i 27) and a pH above 7.5 hydroxapatite could precipitate. The saturation state existed only in acidotrophic reservoirs. The content of aluminium was limited by gibbsite in a pH over 4.7.
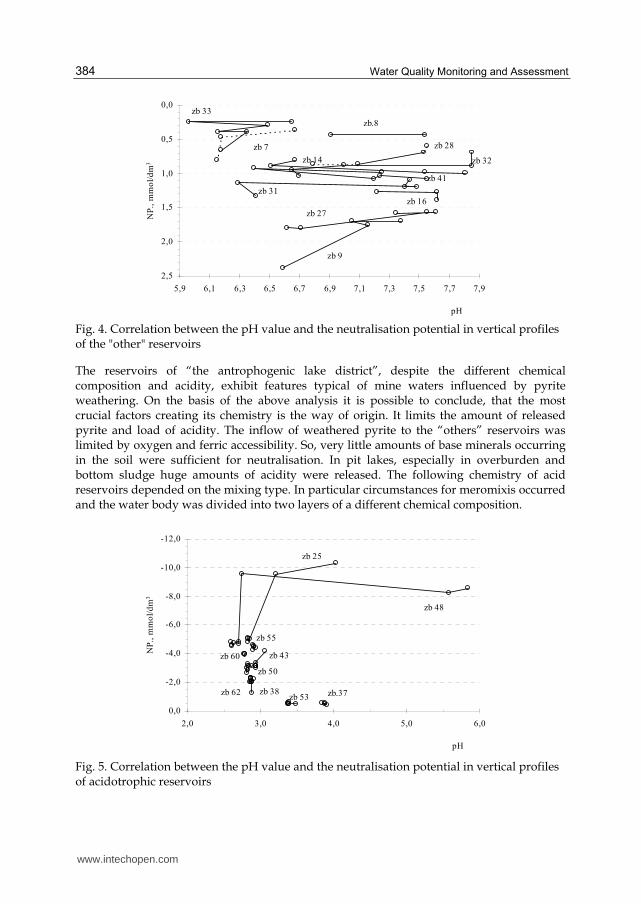
Based on the correlation between pH and neutralisation potential, sensibility on accidental acidification of "others" reservoirs and reclamation processes of acid reservoirs can be distinguished, as follows (Fig. 4. and 5. ):
1. among the "others" reservoirs no 33 and 7 are the most sensible on acidification, 2. among the acidotrophic reservoirs no 37 and 53 should be reclaimed in first, 3. high pH of the deeper part of reservoirs no 25 and 48 does not indicate their real
neutralisation.
www.intechopen.com
Water Quality Monitoring and Assessment
384
zb 7
zb.8
zb 9
zb 14
zb 16
zb 27
zb 28
zb 31
zb 32
zb 33
zb 41
0,0
0,5
1,0
1,5
2,0
2,5
5,9 6,1 6,3 6,5 6,7 6,9 7,1 7,3 7,5 7,7 7,9
pH
NP
., m
mo
l/d
m3
Fig. 4. Correlation between the pH value and the neutralisation potential in vertical profiles of the "other" reservoirs
The reservoirs of “the antrophogenic lake district”, despite the different chemical composition and acidity, exhibit features typical of mine waters influenced by pyrite weathering. On the basis of the above analysis it is possible to conclude, that the most crucial factors creating its chemistry is the way of origin. It limits the amount of released pyrite and load of acidity. The inflow of weathered pyrite to the “others” reservoirs was limited by oxygen and ferric accessibility. So, very little amounts of base minerals occurring in the soil were sufficient for neutralisation. In pit lakes, especially in overburden and bottom sludge huge amounts of acidity were released. The following chemistry of acid reservoirs depended on the mixing type. In particular circumstances for meromixis occurred and the water body was divided into two layers of a different chemical composition.
zb 25
zb.37zb 38
zb 43
zb 48
zb 50
zb 53
zb 55
zb 60
zb 62
-12,0
-10,0
-8,0
-6,0
-4,0
-2,0
0,0
2,0 3,0 4,0 5,0 6,0
pH
NP
., m
mo
l/d
m3
Fig. 5. Correlation between the pH value and the neutralisation potential in vertical profiles of acidotrophic reservoirs
www.intechopen.com
The Influence of Lignite Mining on Water Quality
385
5.4 Influence of the mixing type on the chemistry of lakes – Meromixis reservoirs
Meromictic lakes are lakes which do not mix completely. This phenomenon is not common
in natural lakes, but it often occurs in mine lakes. The following mechanism creates
meromixis in the development of pit lakes: a) formation of a less mineralized mixolimnion
by the inflow of less mineralized water to the lake surface, b) enrichment of iron and
sulphate due to the transport of secondary minerals from mixolimnion to monimolimnion,
c) influence of sea water d) accumulation of substances in the monimolimnion due to
biological decay, e) evaporation f) influence of groundwater with high TDS
(Boehrer&Schultze 2006 and references there in). The deepest part of the meromictic lake
water body – monimolimnion – has often a very specific chemical composition: strong
anoxia, rich in hydrogen sulphide and products of microbial decay. Among the acidotrophic
reservoirs of the “anthropogenic lake district” three of them are of the meromictic type with
a pH of monimolimnion over 4.6. The pH increase had a great influence on lake chemistry
and caused iron and sulphate accumulation in monimolimnion and turned back the
stratification of aluminium.
The research presented below focused on the biggest lake - no 54 which comes from 1973
(there are no exact data about the rate and duration of filling up). The reservoir is located
about 2 km east of Łęknica, 2.3 km west of Przewoźniki and 2 km south of Nowe Czaple
(Fig. 1). The reservoir is surrounded by strongly eroded heaps of excavation. The
surrounding area is covered with forest. The morphometry of the reservoir is presented in
Table 4.
water level
m above see level
surface aream2
max length,
m
max width,
m
extension coefficient
max depth
m
shore line
length m
shoreline development
132.0 202,000.0 896 468 1.91 21.5 2625 1.65
Table 4. Morphometry of reservoir no 54
The first data about composition of the lake come from February 1981, eight years after
coming into existence. From the study it is known that the lake is extremely acidic with a
high concentration of iron and sulphur. The reservoir has no surface inflows such as streams
or other lakes. It results in the fact that the chemical composition of its waters depends
mainly on the composition of groundwater and precipitation, and reactions within the water
body.
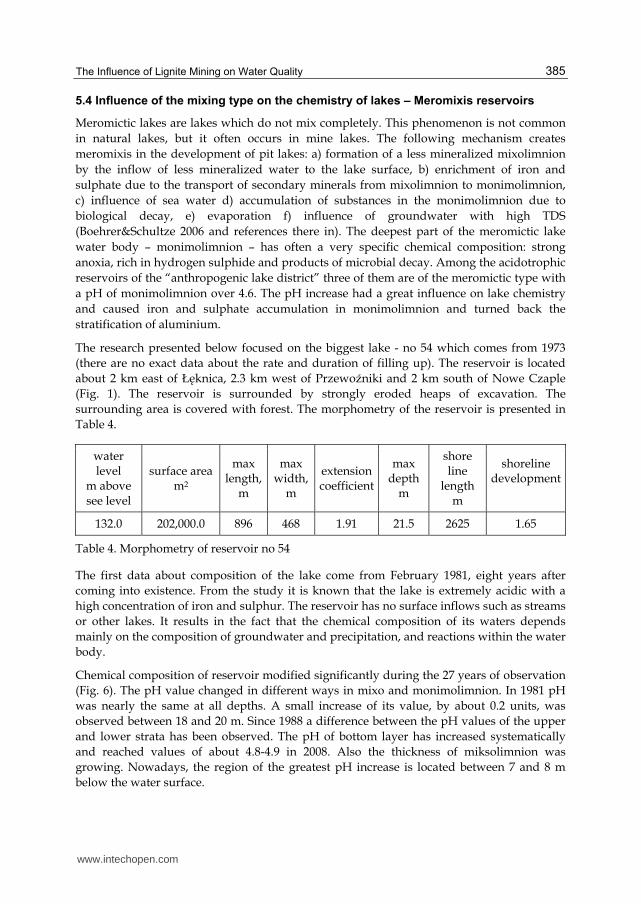
Chemical composition of reservoir modified significantly during the 27 years of observation
(Fig. 6). The pH value changed in different ways in mixo and monimolimnion. In 1981 pH
was nearly the same at all depths. A small increase of its value, by about 0.2 units, was
observed between 18 and 20 m. Since 1988 a difference between the pH values of the upper
and lower strata has been observed. The pH of bottom layer has increased systematically
and reached values of about 4.8-4.9 in 2008. Also the thickness of miksolimnion was
growing. Nowadays, the region of the greatest pH increase is located between 7 and 8 m
below the water surface.
www.intechopen.com

Water Quality Monitoring and Assessment
386
The changes in iron concentration in vertical profile had two patterns. The first one, in the years 1981 and 1988, showed gentle increase in iron concentration from the surface to the bottom. Later a sharp boundary between iron concentration in the upper and lower part of the water body appeared. Iron concentration in the mixolimnion layer was almost steady during the following research period. Iron concentration in monimolimnion increased with depth and ranged from about 100 to more than 800 mg/dm3 in the years 1981-88 and, since 1993, to more than 1500 mg/dm3 .
02/8
1
03/88
09/93
09/06
12/0
6
10/0
,8
0
2
4
6
8
10
12
14
16
18
20
22
2 2,5 3 3,5 4 4,5 5
pH
depth
, m termocline region
02/81
03/8
8
09/06
12/06
10/0,8
09/9
3
0
2
4
6
8
10
12
14
16
18
20
22
50 250 450 650 850 1050 1250 1450
Fe tot, mg/dm3
depth
, m
02/81
03/88
09/0
6
12/06
10/08
09/93
0
2
4
6
8
10
12
14
16
18
20
22
800 1200 1600 2000 2400 2800 3200 3600 4000 4400
sulphate, mg/dm3
depth
, m
02/81
09/06
12/06
10/08
09/9
30
2
4
6
8
10
12
14
16
18
20
22
1 11 21 31 41 51 61 71 81
aluminium, mg/dm3
de
pth
, m
Fig. 6. Chemical composition of reservoir no 54 in the years 1988-2008
Sulphate concentration did not change as rapidly as iron concentration. In the years 1981-88 sulphate concentration was almost steady in the upper part of water body (from the surface to 11 m in depth). Deeper, the sulphur content increased with depth. The research done later, showed a low concentration of sulphate in the layer 0-7 m, a rapid concentration increase between 7 and 11 m to values of about 3000 mg/dm3, and then a further gentle increase with depth to a maximum concentration of about 4300 mg/dm3.
Aluminium concentration had two different profiles. The first one comes from 1981, when aluminium concentration was the highest and increased with depth. Later the concentration of aluminium decreased significantly with depth from the amount of about 35 to lees than 10 mg/dm3.
In 1981 potassium concentration was low and varied from 3 in miksolimnion to 7 mg/dm3 close to the bottom. The potassium amount in mixolimnion did not change significantly during the following period. The maximum concentration in miksolimnion (5.8 mg/dm3) was stated in 2008. In monimolimnion potassium concentration increased gradually and exceeded 30 mg/dm3 in 2008.
www.intechopen.com

The Influence of Lignite Mining on Water Quality
387
Solid
name
formula data log IS on the depth, m below water surface
0 1 3 5 7 9 11 13 15 17 19 21
Fe(OH)3a 1981
2007
-1.15
-1,32
-1.15
-1,34
-1.16
-1,29
-1.17
-1,11
-1.17
-1,18
-0.76
*)
-0.72 -0.72 -0.69 -0.67 -0.64 -0.64
goethite FeOOH 1981
2007
4.50
4.30
4.50
4,18
4.50
3,99
4.40
4,11
3.97
4,01
3.39 3.39 3.67 3.17 2.85 2.59 3.16
jarosite
K
KFe3(SO4)2(OH)6 1981
2007
2.81
2.83
2.66
2.61
2.61
2.28
2.61
2.57
1.7
2.44
3.39 3.67 0.75 -0.64 -1.44 -2.14 -0.97
alunite KAl3(SO4)2(OH)6 2007 3.33 3.92 2.06 2.68 5.36 6.29
gibsite Al(OH)3 2007 -0.82 -1.15 -1.59 -1.31 -0.05 0.43
Table 5. SI for selected solids in 1981 and 2007 (lack of value means very low level)
Based on the chemical properties and SI values (table 5) of the lake two periods of its development can be distinguished:
1. “the iron period” with the intensive processes of ferrous precipitation in miksolimnion
(termocline was then located between 9 and 11m below the water surface).
The sedimentation of jarosite K and probably be also goethite caused transport of ferrous,
potassium and sulphate to the deeper part of the water body. On the boundary of oxic and
anoxic zones dissolution of minerals and the release ions into the water body occurred. We
can also suppose that the main reason for the pH change in monimolimnion was ferrous
reduction. These processes affected the pH values by consuming protons, but didn’t reduce
the acidity of water (Schoepke 2001). The potassium stratification confirms the main role of
jarosite K precipitation in miksolimnion.
2. “the iron-alum period” – from 1988 up till now, with two buffer zones, ferrous
precipitation in miksolimnion and alum in monimolimnion. The processes in the
mixolimnion over that period were similar to the “iron period”. Also the chemical
composition of miksolimnion did not show any significant changes and were similar to
the initial composition. The only difference is alum concentration which decreased by
about 20 mg/dm3, which means almost 50% of initial value. Due to the fact that
monimolimnion acted as a sink for ferrous precipitates, the amounts of precipitate
dissolution products increased. The concentration of almost all (excluding aluminium)
ions analysed increased by orders of magnitude. The pH values increased from 3 to 4.5-
4.9. It created the conditions for aluminium salts precipitation and lowered aluminium
concentration in monimolimnion.
It seems that the future of reservoir 54 depends on the dynamics of pyrite oxidation
products discharge. The total load of iron and sulphate has begun to increase for a few
years. It allows the mixolimnion to reach equilibrium with iron compounds.
Monimolimnion will still act as a sink for ferrous and sulphate ions. Lack of organic
compounds inhibits sulphate reduction and secondary sulphides precipitation. Such a
situation will stabilise meromixis for a long time.
www.intechopen.com

Water Quality Monitoring and Assessment
388
6. Summary
The “anthropogenic lake district” located in Łuk Mużakowski is a drastic example of the
destruction of the environment by lignite mining. The pollution of acid reservoirs is very
stable and until now no diminishing tendency has been observed. The chemistry of the
group of “others” reservoirs balances between the constant inflow of acid groundwater and
neutralising processes as reduction with the use organic matter or the dissolution of base
minerals. The composition of acidic reservoirs depends on their mixing pattern. Meromixis,
which was created in three of the reservoirs in the area caused changes of chemical
properties of monimolimnion. The monimolimnion acted as a sink for products of the
dissolution of ferrous salts and affected water density and stabilized meromixis. Intensive
precipitation of ferrous salts in the oxic zone and the dissolution of the precipitations
resulting from ferrous reduction in monimolimnion cause an increase in pH to a value over
4. It created the next buffering aluminium zone in monimolimnion.
7. References
Appelo, C.A.J.; Postma, D. (2006). Geochemistry, groundwater and pollution, 2ND edition, ISBN
04 1536 421 3 Amsterdam, the Netherlands
Bigham, J.M.; Schwertmann, U.; Traina, S.J.; Winland, R.L., Wolf, M. (1996). Schwertmannite
and the chemical modelling of iron in acid sulphate waters. Geochim Cosmochim
Acta Vol 60., No.12, pp. 2111-2121
Blodau C., Peine A., Hoffman S., Peiffer S. (2000). Organic matter diagenesis in acidic mine
lakes. Acta Hydrochim Hydrobiol Vol. 28, pp.123-35
Blodau, C. (2006). A review of acidity generation and consumption in acidic coal mine lakes
and their watersheds. Science of the Total Environment No.369, pp. 307-332
Boehrer B, Schulze M., (2006). On the relevance of meromixis in mine pit lakes.
IMWA/02000/pp 200-213
Brown, T. J.; Idoine, N. E.; Bide T.; Mills, A. J.; Hobbs S. F. (2010) .European Mineral Statistics
2004–08 A product of the World Min. Statistics database Nottingham British Geol.
Survey
Cornell, R., Schwertmann U. (2000). The Iron Oxides: Structure, Properties, Reactions,
Occurrences and Uses. ISBN 40-471-97056-5 Wiley-VCH
Evangelou, V.P. (1995). Pyrite oxidation and its control, ISBN 0-8493-4732-7, CRC Press, New
York
Fyson, A.; Nixdorf, B.; Kalin, M. (2006). The acidic lignite pit lakes of Germany-Microcosm
experiments on acidity removal through controlled eutrophisation. Ecological
Engineering, Vol 28, Issue 3, pp. 288-295
Jachimko, B., Kołodziejczyk, U. (2008). Effect of lignite mining on quality of water resources,
Przemysł Chemiczny Vol. 87, nr 5, pp. 482--484
Jachimko, B. (2007).The influence of heap weathering on the iron and calcium release into
water. Zeszyty Naukowe Uniwersytetu Zielonogórskiego - (Inżynieria Środowiska ; 13)
No133, pp 181—187, ISBN 978-83-7481-082-1 (in polish)
www.intechopen.com

The Influence of Lignite Mining on Water Quality
389
Jędrczak, A. (1992). Chemical composition of water of anthropogenic lake district in the
“Mużakowski Łuk”. Wyd. WSInż. w Zielonej Górze, Seria Monografie;, No 5, ss 135
(in polish), ISSN-0239-7290
Kasztelewicz, Z., Polak, K., Zajączkowski, M. (2008). The methods of excavation and
processing of brown coal in the first half of XIX centaury, Kwartalny Biuletyn
Informacyjny Węgiel Brunatny, No. 4/65 (in polish)
Kosschorek, M., Wendt-Potthoff, K., Geller, W.(2003). Microbial sulphate reduction at low
pH in sediments of acidic lake in Argentina. Environ Sci Technol Vol. 37, No 6,
pp.1159-62
Kwiatkowski, W. (2006). In the laboratory of coal quality Kwartalny Biuletyn Informacyjny
„Węgiel brunatny“, Vol 4 no 57, http://www.ppwb.org.pl/wb/57/11.php (in
polish)
Langmuir, D. (1997). Aqueous Environmental Geochemistry. ISBN 0-02-367412-1 Prentice-H.Inc.
Lenk, S.; Wisotzky, F. (2007). Chemische Beschaffenheit und mmodellierte Genese von
Grundwassern in Braunkohlenabraumkippen des Tagebaues Inden Grundwasser
Vol 12,pp.301-313
Nixdorf, B.;Deneke, R. (2004). Grundlagen und Massnahmen zur biogenen Alkalinisierung von
sauren Tagebauseen. ISBN 3-89998-038-7, Wesissensee Verlag, Berlin
Nixdorf, B.; Hemm, M.; Schlundt, A.; Kapfer, M.; Krumbeck, H.; (2001) Tagebauseen in
Deutchland - ein Ueberblick. Umwaltforschungsplan des Bundesministeriums fuer
Umwelt, Naturschutz und Reactorsicherheit Forschungsbericht 298 22 240 UBA-FB
000146
Nordstrom, D.K. (1982). The effect of sulfate on aluminum concentrations in natural waters:
Some stability relations in the system Al2O3-SO3-H2O at 298 K. Geochim. Cosmochim
Acta, Vol 46, pp.681-692
Parkhurst, D.; Appelo, C.A.J. (1999). User’s guide to PHREEQC (Version2)- a computer program
for speciacion, batch-reaction, one-dimensional transport, and inverse geochemical
calculations. Denver, available from
http://wwwbrr.cr.usgs.gov/projects/GWC_coupled/phreeqc/
Schoepke, R. (1999). Erarbeitung einer Methodik zur Beschreibung hydrochemischer Prozesse In
Kippengrundwasserleitern BTU Cottbus LS Wassertechnik, Schriftenreihe
Siedlungswasserwirtschaft und Umwelt, 1999, Vol.2
Schöpke, R.; Koch, R.; Querfelli, I.; Striemann, M.; Preuß, V.; Regel, R. (2001). Anwendung
des Neutralisationspotentials bei der Bilanzierung von Saeure-Base-Reaktionen im
Umfeld des Braunkohlebergbaues. Grundwasser Vol 1, pp. 23-29
Stumm, W.; Morgan, J.J. (1981). Aquatic chemistry – an introduction emphasing chemical
equilibria in natural waters, 2nd ed.; ISBN 0-471-51185-4 New York
Tootche, O.; Pothig, R.; Uhlmann, W.; Buttchr, H.; Steinberg, Ch. (2003). Buffering
mechanisms in acidic mining lakes-A model-Based Analysis. Aquatic Geochemistry
No.9, pp 343-359
Wilk, Z. (2003). Hydrogeology of Polish mineral deposits and water problems of mining. ISBN: 83-
89388-20-0, Wyd. AGH (in polish)
Wolkersdorfer, Ch., Bowell, B. (2005). Contemporary reviews of mine water studies in
Europe. Mine Water and the environment Vol. 24, No1, pp.2-37
www.intechopen.com

Water Quality Monitoring and Assessment
390
Wolska, E.; Schwertmann, U. (1993) The mechanism of solid solution formation between
goethite and diaspore. Neues Jahrb. Miner. Monatsh, Vol 5, pp. 213-233
www.intechopen.com

Water Quality Monitoring and AssessmentEdited by Dr. Voudouris
ISBN 978-953-51-0486-5Hard cover, 602 pagesPublisher InTechPublished online 05, April, 2012Published in print edition April, 2012
InTech EuropeUniversity Campus STeP Ri Slavka Krautzeka 83/A 51000 Rijeka, Croatia Phone: +385 (51) 770 447 Fax: +385 (51) 686 166www.intechopen.com
InTech ChinaUnit 405, Office Block, Hotel Equatorial Shanghai No.65, Yan An Road (West), Shanghai, 200040, China
Phone: +86-21-62489820 Fax: +86-21-62489821
The book attempts to covers the main fields of water quality issues presenting case studies in variouscountries concerning the physicochemical characteristics of surface and groundwaters and possible pollutionsources as well as methods and tools for the evaluation of water quality status. This book is divided into twosections: Statistical Analysis of Water Quality Data;Water Quality Monitoring Studies.
How to referenceIn order to correctly reference this scholarly work, feel free to copy and paste the following:
Jachimko Jachimko Barbara (2012). The Influence of Lignite Mining on Water Quality, Water QualityMonitoring and Assessment, Dr. Voudouris (Ed.), ISBN: 978-953-51-0486-5, InTech, Available from:http://www.intechopen.com/books/water-quality-monitoring-and-assessment/the-influence-of-lignite-mining-on-water-quality

© 2012 The Author(s). Licensee IntechOpen. This is an open access articledistributed under the terms of the Creative Commons Attribution 3.0License, which permits unrestricted use, distribution, and reproduction inany medium, provided the original work is properly cited.


![V.S LIGNITE POWER Pvt. Ltd [Gurha East Lignite Mine (1 MPTA)] · V.S LIGNITE POWER Pvt. Ltd [Gurha East Lignite Mine (1 MPTA)] AT VILLAGE-GURHA, KOLAYAT, BIKANER, ... Embankment has](https://img.pdfslide.us/doc/110x75/5e8c64539924dc7ac37938bd/vs-lignite-power-pvt-ltd-gurha-east-lignite-mine-1-mpta-vs-lignite-power.jpg)