Embed Size (px)
Citation preview
THE INFLUENCE OF GESTALT GROUPING PRINCIPLES ON ACTIVE
VISUAL REPRESENTATIONS:
NEUROPHYSIOLOGICAL EVIDENCE
by
ANDREW WILLIS MCCOLLOUGH
A DISSERTATION
Presented to the Department of Psychologyand the Graduate School of the University of Oregon
in partial fulfillment of the requirementsfor the degree of
Doctor of Philosophy
June 2011

DISSERTATION APPROVAL PAGE
Student: Andrew Willis McCollough
Title: The Influence of Gestalt Grouping Principles on Active Visual Representations:Neurophysiological Evidence
This dissertation has been accepted and approved in partial fulfillment of therequirements for the Doctor of Philosophy degree in the Department of Psychologyby:
Edward K. Vogel ChairEdward Awh MemberUlrich Mayr MemberPaul van Donkelaar Outside Member
and
Richard Linton Vice President for Research and GraduateStudies/Dean of the Graduate School
Original approval signatures are on file with the University of Oregon GraduateSchool.
Degree awarded June 2011
ii

c© 2011 Andrew Willis McCollough
iii
DISSERTATION ABSTRACT
Andrew Willis McCollough
Doctor of Philosophy
Department of Psychology
June 2011
Title: The Influence of Gestalt Grouping Principles on Active Visual Representations:Neurophysiological Evidence
Approved:Edward K. Vogel
The cognitive ability to group information into chunks is a well known
phenomenon, however, the effects of chunking on visual representations is not well
understood. Here we investigate the effects of visual chunking using Gestalt grouping
principles in two tasks: visual working memory change detection and multiple object
tracking. Though both these tasks have been used to study cognitive functions in
the past, including object-based attention, attentional control and working memory
capacity, the effect of grouping on mental representations in these tasks has not been
well characterized. That is, while researches have measured effects of grouping on
behavioral output in similar tasks, there are few studies of the effects of grouping
on neurophysiological indices of object representations. Indeed, these current studies
are the first to use event-related potentials (ERPs) to elucidate the effect of grouping
on active mental representations of visual stimuli. In the visual working memory
task, observers remembered either the color or orientation of pacman stimuli across a
delay. We manipulated the collinearity of these objects, whether or not they formed a
Kanizsa triangle figure, and measured the behavioral and electrophysiological effects.
iv

In the multiple object tracking task, a subset of identical stimuli were briefly cued
as targets and then their motion was tracked by participants. We manipulated
whether and which Gestalt heuristics were used to bind targets together during
their motion and measured the effects on behavior and electrophysiology. In both
tasks we compared the grouped to ungrouped conditions. We found that across
experiments and tasks behavioral performance was enhanced in grouping conditions
compared to ungrouped conditions. Furthermore, the waveforms evoked by grouped
stimuli were reduced compared to waveforms produced in response to locally identical
but ungrouped stimuli. These data suggest that the mental representation of visual
objects may be reshaped moment-by-moment by grouping cues or task demand, giving
rise to a flexible, active and dynamic yet parsimonious representation of the visual
world.
v

CURRICULUM VITAE
NAME OF AUTHOR: Andrew Willis McCollough
GRADUATE AND UNDERGRADUATE SCHOOLS ATTENDED:University of Oregon, Eugene, OregonUniversity of Arizona, Tucson, ArizonaParadise Valley Community College, Phoenix, Arizona
DEGREES AWARDED:Doctor of Philosophy, Cognitive Neuroscience, 2011, University of OregonMaster of Science in Psychology, 2006, University of OregonBachelor of Science in Psychology, 2000, University of Arizona
AREAS OF SPECIAL INTEREST:Cognition,Visual Attention, Working Memory, Multiplie Object Tracking
PROFESSIONAL EXPERIENCE:
Graduate Research Fellow, Department of Psychology, University of Oregon,Eugene, OR 2004-2009
Graduate Teaching Fellow, Department of Psychology, University of Oregon,Eugene, OR 2009-2011
Post-Graduate Researcher, Department of Psychology, University of Oregon,Eugene,OR 2003-2004
Cultural Ambassador, Department of Education, Iwatsuki, Japan 2001-2003
Research Assistant, Department of Biology, University of Arizona, Tucson,Arizona 2000-2001
GRANTS, AWARDS AND HONORS:
NSF Systems Training Grant, 2004-2007
vi
PUBLICATIONS:
Ikkai, A., McCollough, A. W., & Vogel, E. K. (2010, April). Contralateral delayactivity provides a neural measure of the number of representations in visualworking memory. Journal of Neurophysiololgy , 103 (4), 1963–8.
Drew, T., McCollough, A. W., Horowitz, T. S., & Vogel, E. K. (2009, April).Attentional enhancement during multiple-object tracking. PsychonomicBulletin & Review , 16 (2), 411-4117.
McCollough, A. W., Machizawa, M. G., & Vogel, E. K. (2007, January).Electrophysiological measures of maintaining representations in visual workingmemory. Cortex; A Journal Devoted to the Study of the Nervous System andBehavior , 43 (1), 77–94.
Drew, T., McCollough, A. W., & Vogel, E. K. (2006, October). Event-relatedpotential measures of visual working memory. Clinical EEG and Neuroscience:Official Journal of the EEG and Clinical Neuroscience Society (ENCS), 37 (4),286–291.
Vogel, E. K., McCollough, A. W., & Machizawa, M. G. (2005, November).Neural measures reveal individual differences in controlling access to workingmemory. Nature, 438 (7067), 500–503.
vii
ACKNOWLEDGEMENTS
I could not have completed this dissertation without the help and support of far
too many people to include here, but I would like to extend special thanks to those who
have been particularly instrumental in directing, mentoring, inspiring, encouraging,
and supporting me in all my endeavors, not least this work. I would like to thank the
teacher who first acknowledged my interest in science: Andy Mazzolini; so long and
thanks for the fish stories. Rebekah Pickard for emotional support. Kris Antonsen
for being a research role model. My father for reading, and my mother for listening.
My brothers, David, Joel, and Wes for having come through it.
I would like to thank all of the scientists I have worked with: Hans Bohnert and
Brian Larkins at the University of Arizona, and my long-suffering advisor, Ed Vogel.
I would also like to thank all the members of my dissertation committee: Ed Awh,
Ulrich Mayr and Paul van Donkelaar. Thanks also to fellow lab members colleagues
and collaborators: Trafton Drew, Keisuke Fukuda, Veronica Perez, Nathan Ashby,
and Richard Matullo.
viii

I dedicate this dissertation to Stephanie.
per ardua ad astra
ix

TABLE OF CONTENTS
Chapter Page
I. GENERAL INTRODUCTION . . . . . . . . . . . . . . . . . . . . . . 1
1.1. Visual Working Memory . . . . . . . . . . . . . . . . . . . . . 2
1.2. Gestalt Grouping and Figure Completion . . . . . . . . . . . . 17
1.3. Objects, Grouping and Multiple Object Tracking . . . . . . . . 33
1.4. Conclusions and Overview of Present Studies . . . . . . . . . . 47
II. MODAL COMPLETION AND VISUAL WORKING MEMORY:BOTTOM-UP AND TOP-DOWN INFLUENCES . . . . . . . . . . 50
2.1. Introduction . . . . . . . . . . . . . . . . . . . . . . . . . . . . 50
2.2. Experiment Description . . . . . . . . . . . . . . . . . . . . . . 53
2.3. Method . . . . . . . . . . . . . . . . . . . . . . . . . . . . . . . 54
2.4. Results . . . . . . . . . . . . . . . . . . . . . . . . . . . . . . . 58
2.5. Discussion . . . . . . . . . . . . . . . . . . . . . . . . . . . . . 63
III. MULTIPLE OBJECT TRACKING AND CONNECTEDNESS . . . . 69
3.1. Introduction . . . . . . . . . . . . . . . . . . . . . . . . . . . . 69
3.2. Experiment Description . . . . . . . . . . . . . . . . . . . . . . 72
3.3. Method . . . . . . . . . . . . . . . . . . . . . . . . . . . . . . . 74
3.4. Results . . . . . . . . . . . . . . . . . . . . . . . . . . . . . . . 78
x

Chapter Page
3.5. Discussion . . . . . . . . . . . . . . . . . . . . . . . . . . . . . 88
IV. MULTIPLE OBJECT TRACKING AND COMMON FATE . . . . . . 91
4.1. Introduction . . . . . . . . . . . . . . . . . . . . . . . . . . . . 91
4.2. Experiment Description . . . . . . . . . . . . . . . . . . . . . . 93
4.3. Methods . . . . . . . . . . . . . . . . . . . . . . . . . . . . . . 95
4.4. Results . . . . . . . . . . . . . . . . . . . . . . . . . . . . . . . 96
4.5. Discussion . . . . . . . . . . . . . . . . . . . . . . . . . . . . . 104
V. MULTIPLE OBJECT TRACKING AND PROXIMITY . . . . . . . . 108
5.1. Introduction . . . . . . . . . . . . . . . . . . . . . . . . . . . . 108
5.2. Experiment Description . . . . . . . . . . . . . . . . . . . . . . 110
5.3. Methods . . . . . . . . . . . . . . . . . . . . . . . . . . . . . . 110
5.4. Results . . . . . . . . . . . . . . . . . . . . . . . . . . . . . . . 113
5.5. Discussion . . . . . . . . . . . . . . . . . . . . . . . . . . . . . 118
VI. CONCLUSION . . . . . . . . . . . . . . . . . . . . . . . . . . . . . . . 126
6.1. Chapter Summaries . . . . . . . . . . . . . . . . . . . . . . . . 126
6.2. General Conclusion . . . . . . . . . . . . . . . . . . . . . . . . 128
REFERENCES CITED . . . . . . . . . . . . . . . . . . . . . . . . . . . . . . 130
xi
LIST OF FIGURES
Figure Page
1.1. Kanizsa Figure . . . . . . . . . . . . . . . . . . . . . . . . . . . . . . . 21
1.2. Serrated Edge Illusion . . . . . . . . . . . . . . . . . . . . . . . . . . . 23
1.3. Star Edge Illusion . . . . . . . . . . . . . . . . . . . . . . . . . . . . . . 24
2.1. Experiment 1 Paradigm . . . . . . . . . . . . . . . . . . . . . . . . . . 54
2.2. Electrode Montage . . . . . . . . . . . . . . . . . . . . . . . . . . . . . 57
2.3. Experiment 1 Behavioral Performance . . . . . . . . . . . . . . . . . . 59
2.4. Experiment 1 Grand Average Difference Waves . . . . . . . . . . . . . 64
2.5. Experiment 1 Mean Amplitudes . . . . . . . . . . . . . . . . . . . . . . 65
3.1. Multiple Object Tracking: Basic Design . . . . . . . . . . . . . . . . . 72
3.2. Experiment 2 Paradigm . . . . . . . . . . . . . . . . . . . . . . . . . . 75
3.3. Experiment 2 Behavioral Performance . . . . . . . . . . . . . . . . . . 79
3.4. Experiment 2 Ipsi-Contra Waves . . . . . . . . . . . . . . . . . . . . . 82
3.5. Experiment 2 Difference Waves . . . . . . . . . . . . . . . . . . . . . . 83
3.6. Experiment 2 Mean Amplitudes . . . . . . . . . . . . . . . . . . . . . . 84
3.7. Experiment 2 Grand Average Difference Waves . . . . . . . . . . . . . 86
3.8. Experiment 2 Amplitude Differences . . . . . . . . . . . . . . . . . . . 87
4.1. Experiment 3 Paradigm . . . . . . . . . . . . . . . . . . . . . . . . . . 94
4.2. Experiment 3 Behavioral Performance . . . . . . . . . . . . . . . . . . 98
4.3. Experiment 3 Difference Waves . . . . . . . . . . . . . . . . . . . . . . 100
4.4. Experiment 3 Grand Average Difference Waves . . . . . . . . . . . . . 101
4.5. Experiment 3 Mean Amplitudes . . . . . . . . . . . . . . . . . . . . . . 103
4.6. Experiment 3 Difference Amplitudes . . . . . . . . . . . . . . . . . . . 105
xii

Chapter Page
5.1. Experiment 4 Paradigm . . . . . . . . . . . . . . . . . . . . . . . . . . 111
5.2. Experiment 4 Behavior . . . . . . . . . . . . . . . . . . . . . . . . . . . 114
5.3. Experiment 4 Contra-Ipsi Waveforms . . . . . . . . . . . . . . . . . . . 116
5.4. Experiment 4 Difference Waves . . . . . . . . . . . . . . . . . . . . . . 119
5.5. Experiment 4 Grand Average Difference Waves . . . . . . . . . . . . . 120
5.6. Experiment 4 Mean Amplitudes . . . . . . . . . . . . . . . . . . . . . . 121
5.7. Experiment 4 Mean Amplitude Differences . . . . . . . . . . . . . . . . 122
xiii
CHAPTER I
GENERAL INTRODUCTION
Max Wertheimer noted in his 1920 monograph, “I stand at the window and see a
house, trees, sky,” meaning by this that the phenomenal visual world consists of the
unified perception of objects placed in space and time. Despite the knowledge that
the actual image projected onto the retina by the optic lens is a patchwork of colors,
except under the extraordinary conditions of disease, neurological tissue damage,
pharmaceuticals, or similar perception-altering influence, the mental representations
of apprehended objects appear as unified, whole object in the world. It is important to
note that contours or color swatches which, in the completed percept seem united on
a continuous surface or bounded by a closed contour, in the initial retinal patchwork
may be widely separated in retinotopic space or divided by disparate colors or edges.
Thus, the question of how an initially disorganized and inchoate visual riot of color
may be sewn together in the mind’s eye to create the phenomenological world has
intrigued psychological researchers from William James and Max Wertheimer to
the present day. Through processes not yet fully understood, individual swatches
in the visual field are patched together, edges are discovered and contours are
formed, followed, and completed. The figure is separated from the background,
and an object is presented to awareness to be remembered, manipulated, or stored.
Some of these processes have been described at various levels of analysis: modal
completion of camouflaged items, or amodal completion of occluded figures, Gestalt
grouping principles linking elements together to form composite objects and the
maintenance of those objects in visual memory within static or dynamic tasks.
This dissertation will consider the behavioral and electrophysiological correlates of
1
visual awareness in both static and dynamic tasks, and investigate the influence of
contour completion phenomena and select Gestalt grouping principles on behavioral
and electrophysiological indices of active visual representation.
As noted by Wertheimer, grouping allows an individual to organize large amounts of
information into smaller chunks which may then be more easily managed in memory.
The subject visual world does not consist of hundreds of color patches, but unified
percepts. These percepts persist in visual memory as active visual representations,
and it is not yet fully understood how these bottom-up or top-down grouping processes
affect visual representations. The next sections will selectively review visual working
memory, gestalt perception, and multiple object tracking literature in order to provide
a background against which the studies in this dissertation will be presented.
1.1. Visual Working Memory
Visual working memory (VWM) is a cognitive system that enables us to maintain
information about objects in the immediate visual environment in order that those
objects may be manipulated, evaluated, or acted upon. This memory subsystem
is comprised of several processes which sustain the operations of VWM. These
include the encoding or consolidation, of incoming visual information (W. Phillips,
1974; W. Phillips & Christie, 1977), maintenance or storage (Luck & Vogel,
1997) of information in memory and comparison processes whereby the information
maintained in memory is matched against other external or internal information
(Hyun, Woodman, Vogel, Hollingworth, & Luck, 2009).
Research has demonstrated that this visual working memory system is severely
constrained and able to hold only a few objects at a time (Sperling, 1960; Pashler,
1988; Luck & Vogel, 1997). The degree of resolution, defined as the amount of detail
2
maintained about the object, is also limited in visual working memory (Wilken &
Ma, 2004; Alvarez & Cavanagh, 2004; Awh, Barton, & Vogel, 2007; Scolari, Vogel,
& Awh, 2008; Zhang & Luck, 2008).These properties of visual working memory
are distinct and uncorrelated, and this distinction between visual working memory
capacity and resolution is supported by both empirical data as well as computational
models(Wolters & Raffone, 2008). However, investigation of which characteristics of
memory are altered with expertise has been sparse in the visual memory literature,
though there are recent exceptions (Curby & Gauthier, 2007; Scolari et al., 2008;
Curby, Glazek, & Gauthier, 2009; C. D. Moore, Cohen, & Ranganath, 2006).
1.1.1. Limited Capacity
Questions central to the understanding of visual working memory are what are
the significant constraints on working memory (capacity limits, resolutions limits)
and what is the nature of the representations maintained? Since Sperlings partial
report Sperling (1960) task short-term memory researches have been interested in
these questions (W. Phillips & Christie, 1977). Luck and Vogel 1997 examined both
questions as using a change detection task. In this task, frequently used to study
working memory of all types, the items to be remembered are briefly presented,
followed by a retention interval, followed by a probe testing the items that were to be
remembered. In Luck & Vogel 1997, the memory arrays consisted of colored squares
in several set sizes (1–12 items in the memory array). At the test array, subjects
were asked to respond whether the test array was the same as or different to the
initial memory array. Under these conditions, subjects generally displayed a memory
capacity of 3–4 items, averaged across several set sizes. Through this experiment and
3
experiments of a similar nature (Luck & Vogel, 1997), mnemonic capacity in VSWM
is generally thought to be no greater than 3–4 items at any one time (Cowan, 2001).
1.1.2. Object Maintenance
In this experiment, however the subjects were required to remember only a single
feature per object. Thus, item capacity and feature capacity in that experiment were
confounded. In order to better delimit the nature of the VWM representations, Luck
& Vogel also examined conjunctions of features within a single item. That is, they
examined whether increasing the number of feature dimensions memorized would
change mnemonic capacity. This experiment alone, however, does not address the
nature of mnemonic representations, that is, whether they exist as integrated objects
or collections of features, and whether or not there is a cost to remembering greater
numbers of feature dimensions per object. They therefore presented subjects with
colored lines and asked the subjects to to remember either orientation (orientation
condition) their color (color condition) or the conjunction of color and orientation.
In this experiment they found that orientation was remembered slightly better than
color, but the conjunction of both was remembered just as well as color. That is,
there was no cost to remembering twice as many features, so long as the features
were within a single object (Luck & Vogel, 1997). But, see (Xu, 2002, 2006; Delvenne
& Bruyer, 2006).
1.1.3. Information Load
More recently, the hypothesis that feature dimensions of mnemonic items could
be represented for free has come under fire. Alvarez and Cavanagh investigated
memory for simple and complex objects, from simple colored squares to two
4
dimensional projections of cubes and Chinese ideographs. A strong object-based
representation scheme, assuming that feature dimensions are bound at no cost in an
integrated object, should predict that accuracy would be the same across all object
types. However, using a change detection paradigm similar to that of Luck & Vogel,
they found that change detection accuracy dropped according to the complexity of
the type of item to be remembered, that is, even holding the number of items the
same, as the total information in the array increased, accuracy dropped. They then
proposed that VWM is not constrained by the number of items to be remembered,
but rather by the total amount of information being maintained. Thus, in contrast to
a slot or object model of memory, they propose a pool of resources model of memory.
In this model, a given representation is allocated an amount of general mnemonic
resources, which could, in principle, be subdivided ad libitum. Thus, according to
these results there is no a priori limit to the number of items represented, it is simply
that as more items are represented each item gets fewer resources and thus becomes
less and less likely to be recalled correctly at test (Alvarez & Cavanagh, 2004).
This contrary hypothesis ignited a debate in the literature. On the one hand
is the strong hypothesis that items in memory are represented in an all-or-none
fashion, or slot-like more recent investigations using identical stimuli have proposed
an alternative interpretation of the results. Awh et al. (2007) using the same stimuli,
examined whether the Alverez and Cavanagh data are best explained by a pool of
resources model or some other way. They presented subjects with various set sizes
of items in a similar change detection paradigm as Alvarez and Cavanagh, using
simple and complex stimuli, but probed subjects on their ability to report a change
either between categories (color to cube, for example) or within category (cube to
cube). Their results demonstrated that large changes across categories were as easily
5
detected as color to color changes, whereas changes within a category, such as cube to
cube or ideograph to ideograph, were more difficult to remember. Awh et al. argue
that for subjects to perform well at this task they would need to be able to have a
representation of all the items in the memory array, since they were able to perform
normally on large change trials, but that there is a resolution limit for each of the items
which decreases the subjects accuracy when comparing the mnemonic items with the
probe array. Furthermore, they found no correlation in the subjects capacity limit
for large-change trials and small-change trials, further arguing for separable processes
or mechanisms in detecting large (number limited) and small (resolution limited)
changes. Thus, according to these data, both the number of objects as well as the
resolution with which those objects are held affect the ability of the subject to detect
a change. In this view, greater complexity increases the number of errors but those
errors are caused by a failure during the comparison of the test array with mnemonic
objects rather than the number of items held in memory. That is, the items, though
represented, are not represented with sufficient precision to enable accurate change
detection. Therefore, memory capacity (during maintenance) is limited by the number
of objects, but that the comparison process is limited by the precision or resolution
with which those items are represented.
1.1.4. Capacity and Resolution
Xu and Chun (2005) have begun to explore possible neural substrates for these
separable limits for VWM in fMRI change detection experiments which used stimuli
having the same number of features spread over fewer or more items. In these
experiment, one or more shapes could posses one or more features in a change
detection task performed in an event-related fMRI experiment. During this task
6
activation in the IPS was observed. This activation in inferior IPS increased according
to the number of mnemonic objects, however, activation in superior IPS increased
according to the number of features to be remembered. Thus for simple objects the
limit was about 4 or 5 in both areas, and remained so for inferior IPS. However,
as complexity per object increased, the number of features represented in superior
IPS decreased so that fewer complex objects were represented during the memory
retention interval. Xu & Chun propose a model of visual working memory which
assumes separate limitations for the number of objects remember, individuation of
objects, and a second, resolution-limited constraint for the identification of items. In
their model, early individuation is accomplished, perhaps pre-attentively, using coarse
information, whereas later identification requires more features to be maintained
in memory and thus the total number of features the objects posses also limit
mnemonic capacity. Olson & Jiang examined the affect of configuration on mnemonic
representations during a color change detection task. They varied the amount of
configural information which was preserved from the memory array to the test
array, either by varying the number of items which reappeared in the test array
(spatial configuration) or by varying the colors which reappeared in the test array
(color configuration) and found that disruption of spatial configuration significantly
lowered change detection accuracy more so than the disruption of color configuration
information. These and other results imply a hierarchy within VWM such that spatial
location is identified first followed by other featural information (Jiang, Olson, &
Chun, 2000). These results also provide further behavioral evidence for the Xu
& Chun model. The Xu & Chun data do not, however, entirely resolve capacity
limitation debates in VWM. The Alvarez and Cavanaugh model allow for some core
features to be stored without cost as part of an object, and number + resolution
7
models does not address what resolution consists of, how it may be allocated across
items, and whether some items may be flexibly allocated more resolution than
others. Some questions which arise while considering this hypothesis are: what are
candidate core features? Can resolution be flexible allocated? Can resolution for an
object be enhanced or trained such that objects of expertise are remembered with
greater fidelity? Vogel, Woodman, and Luck (2006) demonstrated that features of
an object may be flexibly maintained or selected according to task demands. They
measured consolidation times of colored, oriented bars by using a mask presented and
various intervals subsequent memory array presentation in order to disrupt VWM
encoding. They then measured working memory capacity for colors, orientations,
or the conjunction of the two. Vogel et al. found that while capacity was nearly
equivalent for colors, conjunctions, and orientations, if the mask was presented during
encoding capacity was decreased more for the conjunction condition than for the other
conditions. These data were interpreted to mean that, even though both color and
orientation may be stored with no additional cost in terms of capacity, there is a
tradeoff in terms of consolidation time. Thus, multiple features require longer to
store in memory than single features.
1.1.5. Complexity
Faces are complex, highly salient objects in the visual environment and it is
has been previously demonstrated that faces are percieved in a holistic manner
Inverted faces, however, though equally complex are not perceived in holistically
(Yin, 1969; R. Phillips & Rawles, 1979; Eimer, 2000). If the number of faces that
can be remembered is greater for upright faces than inverted faces, or other complex
objects which are not expertise objects, than it may be the case that the capacity
8
these objects (number) has been enhanced by expertise. Curby and Gauthier used a
change detection task to estimate capacity for faces, comparing memory for upright
faces to inverted faces and other complex, familiar objects which were not objects of
expertise, watches and cars Curby and Gauthier (2007). They found that memory
for upright faces was greater as measured by K (Pashler, 1988; Cowan, 2001) for
the upright faces than for inverted faces or other objects. Furthermore, this effect
interacted with exposure duration, such that longer memory array durations, 500,1500
2500 ms monotonically increased the number of faces remembered, up to an average
of about 2.5, what is typically seen for VWM capacity (Cowan, 2001). Curby and
Gauthier interpreted this data is a perceptual expertise effect enhancing the number
of items which can be remembered in the domain of expertise. However, the two-
factor model of VWM also allows another possibility. Both number of items and
complexity/visual information are factors, so it may be that Curby and Gauthier,
instead of demonstrating a greater memory for faces (in terms of number of items)
per se, demonstrated enhanced resolution for faces. Scolari et al. (2008) tested this
hypothesis in a change detection task comparing cross-category changes (face/inverted
face or face/cubes etc.) with within-category changes (face to face or cube to cube).
If expertise increases the number of items in memory then the advantage for upright
over inverted faces should be maintained under these conditions. On the other hand,
if expertise simply enhances the resolution, or allows more information to be stored
for a given item, then they should only find and advantage for upright faces in
the within-category condition. That is exactly what Scolari and Awh found; an
expertise advantage for upright faces but only in the within-category (small change)
condition. They interpret this data as providing evidence that expertise, rather
than increasing the number of items which can be remembered, may only increase
9
the amount of information maintained per item. This conclusion fits well with the
expertise literature showing an increase per chunk information storage but equivalent
chunks for both experts and novices (Gobet & Simon, 1996b; Saariluoma & Laine,
2001; Gobet & Clarkson, 2004). This is in contrast to the Zhang and Luck model
which posits a fixed number of slots for item, each item having a fixed resolution, or
amount of information that it can store (Zhang & Luck, 2008; Hyun et al., 2009). In
this model, if more resolution is required to remember an object with high fidelity,
then several of these slots may be averaged together. The recent Scolari and Awh
data show that resolution may not be a fixed value at all, at least not for objects
of expertise. These results are not necessarily contradictory; for items which are not
within the experts domain the resolution available for several slots may be pooled
and a single, high-fidelity item may be remembered. For objects in the domain of
expertise, if items in working memory are the activated portion of LTM (Cowan,
1999, 2001), then items within domain expertise may simply have more associated
information which then fit within the basic capacity limits.
1.1.6. Computational Models
Rafone et al. have proposed a computational model using biological constraints
which provide a plausible analytical explanation for a four item limit in working
memory. They model a system of dynamically interacting neurons and found that
integrated item representations could be represented in a network of reverberating,
synfiring nodes. The total number of neurons firing together (perhaps representing
the amount of information) was not a constraining factor in this model, but rather the
number of synchronously firing neuron groups. That is, using biologically plausible
parameters for neuronal firing rates, no more than four synchronous patterns could
10
be represented in the network simultaneously. Attempting to insert another pattern
caused catastrophic interference, entirely degrading both or multiple signals. Thus,
they found that items were encoded in an all or none fashion within what they refer
to as a chunking field, a system of neurons firing coherently in a reverberating manner
(Raffone & Wolters, 2001; Wolters & Raffone, 2008). The evidence is growing, then,
that visual working memory is limited in both the number of items that may be
represented as well as the total number of features or visual information that may
be stored concurrently.If that is the case, then expertise may enhance memory by
either increasing the number of items (increasing capacity) or by increasing the visual
information/resolution of a fixed number of items (increasing resolution) or both. Not
considered here is the further possibility that expertise may enhance the selection of
items to be remembered (Woodman, Vecera, & Luck, 2003; Fukuda & Vogel, 2009).
1.1.7. Expert Memory and Visual Working Memory
Working memory in general, and visual working memory in particular, is
theoretically constructed as a system that enables the online and offline maintenance
and manipulation of information so that it may be acted upon. Elite performance,
or expertise, often places extraordinarily high demands upon memory systems and
working memory in particular. In those domains which involve extensive manipulation
of visual information, such as chess, Othello, music, scrabble and other domains
which nonetheless require support from visual working memory such as poker, bridge
etc. (Charness, 1979; Wolff, Mitchell, & Frey, 1984; K. Ericsson & Lehmann, 1996;
Kalakoski, 2007; Halpern & Wai, 2007). It follows, therefore, that if visual working
memory is to some degree trainable then extended, intensive, deliberate practice
required for expertise (A. Ericsson, Nandagopal, & Roring, 2007) may be able to
11
modify some aspects of working memory to better adapt to the domain requirements.
This section will examine how the theoretical construct of VWM may interact with
the phenomenon of expert memory.
Visual memory studies require care to prevent grouping and enable accurate
estimates of capacity, as noted by Cowan (2001). More ecologically, studies of chess
board recall, have demonstrated precisely this effect in experts, showing that extensive
practice in the domain enables greater recall of chess positions (Gobet & Simon,
1996a), with higher accuracy, and that such recall is modulated by the constraints
of the game, that is, legal board positions are better remembered than illegal board
positions, (Chase & Simon, 1973). Even the in-game strategic positions of the pieces
can influence memory performance (McGregor & Howes, 2002)
VWM supports problem solving, mental manipulation and search in chess
(Gobet, 1997; Schultetus & Charness, 2000). Experiments using either a interpolated
visual working memory secondary task or a verbal task during a chess task a found
that the verbal load had no affect on expert memory, but performing a secondary
visual task interfered with the the chess task (Saariluoma, 1992). However, not only
does VWM support expert memory performance directly, they also appear to share
neural structures. That is, brain regions correlated with VWM tasks have been shown
to be modulated by the degree of expertise of the subject (C. D. Moore et al., 2006).
Furthermore, working memory regions have also been demonstrated to be involved
in the strategic recoding of information, chunking, a critical theoretical aspect of
expert memory (Bor & Owen, 2007; Bor, Cumming, Scott, & Owen, 2004; Bor,
Duncan, Wiseman, & Owen, 2003). The two-factor model of visual working memory,
consisting of a capacity and resolution limited store, provides a plausible pathway
by which intensive practice may be able to affect the nature, number, or contents
12
of mnemonic representations. While great deal of the available evidence indicates
that the number of items may be fixed, e.g. Luck and Vogel (1997), the amount
of detail within each item, as well as what may be considered an item or object,
is probably plastic and can be altered by experience (Zimmer, 2008; Scolari et al.,
2008). Therefore, even if the absolute number of items maintained in working memory
is fixed, there exists a plausible cognitive mechanism and putative neural substrates,
whereby items could be recoded into more information-dense representations. The
computational modeling of visual working memory of Raffone and Wolters (2001)
also provides support for the hypothesis that, though the number of representations
in memory may be fixed, increasing the amount of information contained in each
item may be malleable. Rafone et al. modeled reciprocally firing neurons connected
in reverberating circuits. They found, using biologically plausible parameters for each
neuron, that information could be stored in synchronously spiking neurons. Each of
these chunking fields could store an arbitrary number of features as neurons were
added, however, in their model a maximum of four distinct ensembles could oscillate
without degrading. Expert memory is also characterized by the selectivity of the
information chosen to be remembered (Ericcson, Chase, & Faloon, 1980; Saariluoma
& Kalakoski, 1997). This point of intersection between visual working memory
and expert memory is the filtering process which constrains the information that is
allowed into working memory (Saariluoma & Kalakoski, 1997; Vogel, McCollough, &
Machizawa, 2005). Recent work (Vogel et al., 2005; Woodman & Vogel, 2008; McNab
& Klingberg, 2008; Fukuda & Vogel, 2009) have demonstrated that visual working
memory is highly dependent on selection mechanisms to modulate the information
stored in memory, and that differences in these mechanisms are correlated with
differences in capacity as well as intelligence. Inefficiency in these filtering mechanisms
13

have also been correlated with unnecessary storage of task-irrelevant information
(McNab & Klingberg, 2008; Fukuda & Vogel, 2009). The Constraint Attunement
model of Vicente and Wang (1998) may fit this concept the best, however, as early
as de Groot it was recognized the experts perceive a scene differently than novices,
extracting the relevant information at a glance (Groot, 1965). While some video game
studies suggest that attentional filtering may be modified in this way (Day, Arthur,
& Gettman, 2001; Green & Bavelier, 2003), more research needs to be done to clarify
the role of selective attention in expert memory.
Recent data suggests that the effective operation of visual working memory requires
the existence of distinct categories (Olsson & Poom, 2005; Zimmer, 2008). For
example, Zimmer et al. presented subjects in a change detection task with Chinese
ideograms to remember, as well as a change detection task with psuedorandom, or
a false-font chinese character. The subjects where either Germans with little or no
exposure to Chinese characters, or educated native Chinese speakers and readers with
extensive training in reading these characters. Though performance on the false-font
characters where equivalent between Chinese and German native speakers, Chinese
speakers where able to remember more of the actual ideograms. Similar results have
obtained in the visual working memory domain as well, Olsson and Poom (2005) used
unfamiliar and difficult to classify objects in a change detection task. They found
that subjects were able to remember objects which fit discrete categories at normal
rates, but objects which varied along a continuous shape or color space were poorly
remembered, reducing memory capacity to only one item. One aspect of the resolution
of items in memory, then, may simply be whether there is a sufficiently robust
representation of the category in long term memory. Gordan Logan has proposed
an Instance Theory of Attention and Memory, which suggests that object recognition
14
and working memory are equivalent. The process of recognizing and object and the
process of encoding the object are, in this theory, equivalent processes (Logan, 2002).
In this model then, the recognition of an object would necessarily entail the immediate
access to all the information available for that object, yet not necessarily require any
more slots in memory. Further, an object which had no corresponding representation
in LTM, an entirely novel object, would be correspondingly difficult to remember.
1.1.8. Neural Measures of Visual Working Memory
Neural data is important in order to further constrain theoretical models of
working memory. Functional Magnetic Resonance imaging, an indirect measure
of metabolic activity in the brain, and Event Related Potentials, which are
electrophysiological measures of neural activity, have in recent decades been able to
use their highly spatially or temporally resolved imaging data to constrain cognitive
theories. On the one hand, fMRI provides highly spatially resolved images of neural
activity with low temporal resolution, while on the other, ERPs display highly
temporally resolved images of electrical activity within the brain, at a low spatial
resolution. Both techniques have contributed substantially to the development of
working memory theory.
The high spatial resolution of fMRI, event-related potentials (ERPs) provide an online
measure of cognitive processing with excellent temporal resolution (Picton, Hillyard,
Krausz, & Galambos, 1974; Hillyard & Picton, 1978). Several ERP studies have
observed a large, broadly distributed negative slow wave during the retention interval
of WM tasks (D. Ruchkin, Johnson, Grafman, Canoune, & Ritter, 1992; D. Ruchkin,
Johnson, Canoune, & Ritter, 1990). This component has been shown to be sensitive
to task difficulty (D. S. Ruchkin, Grafman, Cameron, & Berndt, 2003), and appears
15
to have a somewhat different scalp distribution for spatial and object WM tasks
(D. Ruchkin, Johnson, Grafman, Canoune, & Ritter, 1997). However, the degree to
which this activity is specifically related to WM per se has not yet been definitively
demonstrated. That is, there are several potential non-mnemonic processes that may
occur during the retention period that could contribute to this activity. For example,
during the retention period, in addition to maintaining the memory items the subject
also anticipates the onset of the test display and e. Consequently, it is plausible that
this negative slow wave may not only reflect the maintenance of information in WM,
but is also partially due to this anticipation process. Indeed, the contingent negative
variation (CNV) is a well studied ERP component that has similar characteristics to
this negative slow wave (e.g., polarity, scalp distribution, timing) (Tecce, 1972). It
has been shown to precede the onset of a task relevant stimulus and is thought to
reflect, in part, the anticipation of making a behavioral response. While it is possible
that this negative slow wave does reflect a memory process, the general problem with
using this activity as a neural correlate of WM is that it is non-specific with regard to
the items that are being held in WM. Consequently, it is difficult to disentangle the
memory processes from other task- general processes such as arousal, attention, or
simply the anticipation of making a response. More recently, Klaver, Talsma, Wijers,
Heinze, and Mulder (1999) have reported a similar ERP component that appears to
provide a more specific measure of maintaining information in visual WM. In this
study, subjects were presented a display containing two abstract shapes (one in each
hemifield) and were cued to remember the item on either the left or right side of the
display over a 1500 msec blank interval. Shortly following the onset of the memory
array, a negative wave was observed at posterior electrode sites that were contralateral
to the position of the memory item which persisted throughout the retention period.
16
This sustained contralateral activity is potentially a good candidate for a neural
correlate of visual WM because it provides more specific information with regard to
the position of the remembered item, which makes it less likely to be due to more
task-general processes.
The CDA ( Contralateral Delay Activity) is a lateralized ERP component that reflects
the encoding and maintenance of object representations in VWM (McCollough,
Machizawa, & Vogel, 2007; Vogel & Machizawa, 2004), and is sensitive to the
individuals ability to exclude irrelevant items present in the memory display (Vogel
et al., 2005). The CDA is maintained during the delay period of lateralized visual
working memory tasks such as change detection. CDA amplitude increases as a
function of the number of items that the subject is currently holding in visual WM
and reaches an asymptotic limit for array sizes of 3–4 items. That is, the CDA
reaches asymptote at the same set size as behavioral measures of memory capacity
and is different for each subject depending on individual memory capacity. Therefore,
the CDA provides a measure of the number of items currently in memory and is also
sensitive to individual differences in distractor exclusion and item maintenance.
1.2. Gestalt Grouping and Figure Completion
Max Wertheimer described figural Gestalt Grouping principles in his classic
1932 monograph, “The Laws of Organization in Perceptual Forms”. He
described basic rules by which the visual world is organized into forms or
objects that are perceived:,figure/ground articulation, proximity, similarity, common
fate, continuation, good gestalt, past experience, closure etc.(Wertheimer, 1938;
Westheimer, 1999). More recently, perception researches have proposed principles
of common region, (S. E. Palmer, 1992) convexity (Liu, Jacobs, & Basri, 1999)
17
and element connectedness (Han, Humphreys, & Chen, 1999). It is important
to note that this taxonomy is concerned with what is subjectively perceived, and
that each principle holds, ceteris paribus, the other grouping principles. A detailed
hierarchy describing which Gestalt principle dominates over others has not yet been
determined, however, generally when Gestalt principles cohere, they increase the
perceived grouping strength of the figure, while in cases of competition the overall
perceptual organization of the figure is degraded or the figure becomes perceptually
ambiguous. The canonical gestalt grouping principles are as follows: similarity,
continuation, closure, proximity, figure/ground, common fate, good gestalt, past
experience. Similarity is the principle by which items are grouped together which
share some common feature such as shape, color, orientation etc. Good continuation
is describes that items will be grouped together if they perpetuate or continue some
global aspect of the figure. Closure describes the situation where elements or lines
complete a figure by forming a closed boundary. Common fate describes the grouping
together of elements which share movement, that is move in the same way. Good
gestalt refers to the grouping of elements which provide the simplest grouping out of
many possibilities. Past experience describes how some elements of a figure may be
grouped together because in the past they have always been grouped together, not
from any particular perceptual grouping properties (Wertheimer, 1938).
Modal and amodal completion are also common perceptual phenomena which aid in
parsing the visual world. These terms refer to the process by which elements in a
display are unified by the perception of a single whole in one of two modes, modal or
amodal. Modal completion refers to such perception when the completed parts are
out of sight and based on the visible elements, the completed percept possess actual
visual properties: color, contour etc. Amodal completion refers to the perceptual
18
completion of a figure behind an occluding form, in this mode there is no visual
percepts associated with the amodally completed object. As in interesting aside,
these processes appear to be evolutionarily conserved, evidence for the perception of
illusory figures has been observed in monkeys, cats, fish and even insects (Grosof,
Shapley, & Hawken, 1993; Chen, Zhang, & Srinivasan, 27; Sovrano & Bisazza, 2009).
This highlights the critical nature of these mechanisms for visual processing across
species.
1.2.1. Completion
Completion processes aid in separating figure from ground. Objects in front
of the background. Modal completion completes objects in the foreground, amodal
completion completes objects that are in the background and occluded by foreground
objects. That is, foreground objects which are camouflaged and background items
which are partially obscured. Earlier studies of the time course of perceptual
completion showed that modal completion occurs within 100 - 200 ms, and shorter
presentations leave the fragmented figures uncompleted (Ringach & Shapley, 1996)
There are two kinds of completion processes, modal and amodal. Completion of
camouflaged objects, that is objects in the foreground, Figure 1.1. on page 21 , is
called modal completion, since these type of figures are completed “in the visual
mode” such that actual percept of contours, contrast, color etc. is perceived. This
is in contrast to objects which are partial occluded by foreground objects and are
amodally completed (Kanizsa, 1985; S. Palmer, Neff, & Beck, 1997). These since the
objects are completed behind the occluder without any perceptual component, as in
the outline of the triangle in Figure 1.1., for example.
19
There is debate over weather illusory figures are generated in a bottom-up manner
utilizing neural paths laid down early in development, or generated in a top-down
process that utilizes later cognition. These figures are supported by illusory contours
constructed by the visual system based on perceptual input but without an actual
visual contour being present. Such subjective contours, as simply created by Kanizsa
figures, are constructed by arranging elements, or inducers, that produce the illusory
contour (Singh, Hoffman, & Albert, 1999). They have been shown to be created by
re-entrant feedback between V2 and higher areas and low-level processing in V1 (Lee
& Nguyen, 2001; Mendola, Dale, Fischl, Liu, & Tootell, 1999; Murray, Schrater, &
Kersten, 2004) The amodal completion occurs at early stages of the visual system:
amodal completion of contours in macaques and humans has been observed in V1
(Sasaki, 2007). However, there is considerable debate as to whether modal and amodal
completion reflect the output of a single processes or multiple processes.
The segregation of background and foreground, established by depth information,
may be the mechanism which drives boundary ownership, which in turn drives
modal/amodal completion mechanisms(B. L. Anderson, Singh, & Fleming, 2002;
B. Anderson, 2007). A controversy exist as to whether identical underlying processes
drive the formation of Amodal and modal contours, however, and while a consensus
has not yet been reached, there are several distinctions which can be made. Using
stereoscopic displays, and thus identical information, binocular disparity can be used
to force the percept of either modally completed figures or amodally completed figures
using visually identical stimuli and only switching which eye sees which stimulus,
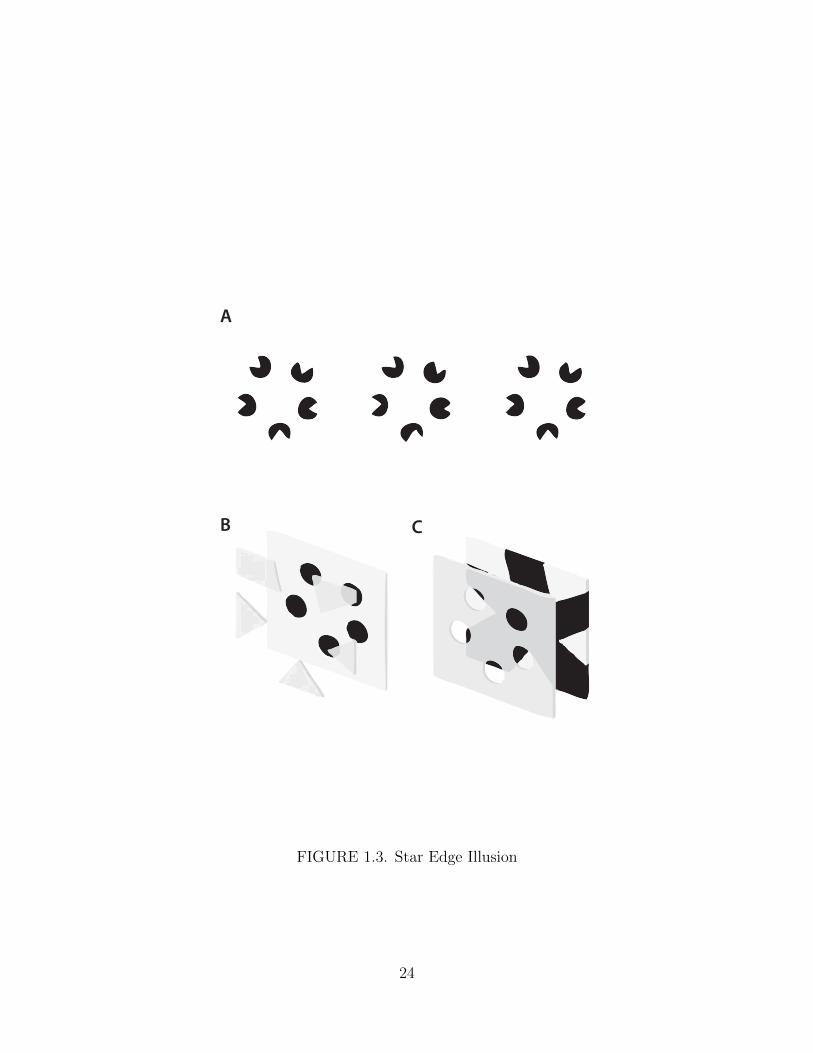
e.g. this Figure 1.3. on page 24 from B. L. Anderson et al. (2002). In contrast
to predictions of the strong “identity hypothesis” these figures produce markedly
different percepts, such as in the serrated edge illusion (B. L. Anderson et al., 2002;
20

FIGURE 1.1. Kanizsa Figure
21
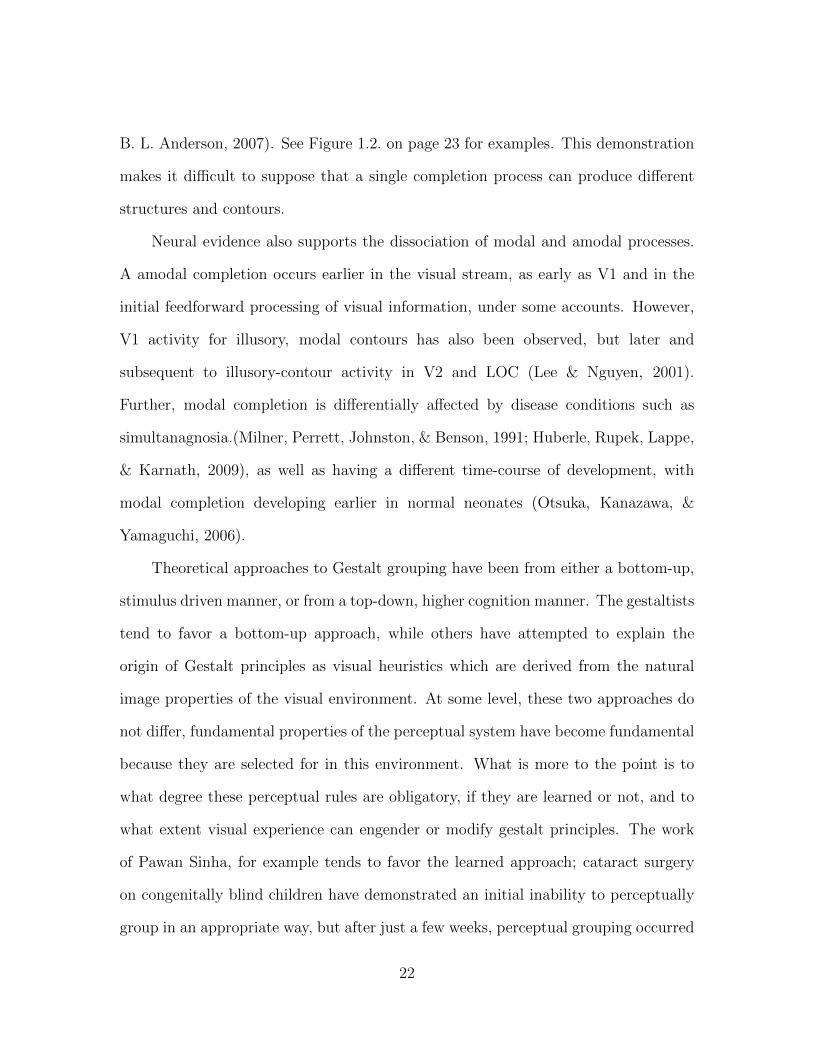
B. L. Anderson, 2007). See Figure 1.2. on page 23 for examples. This demonstration
makes it difficult to suppose that a single completion process can produce different
structures and contours.
Neural evidence also supports the dissociation of modal and amodal processes.
A amodal completion occurs earlier in the visual stream, as early as V1 and in the
initial feedforward processing of visual information, under some accounts. However,
V1 activity for illusory, modal contours has also been observed, but later and
subsequent to illusory-contour activity in V2 and LOC (Lee & Nguyen, 2001).
Further, modal completion is differentially affected by disease conditions such as
simultanagnosia.(Milner, Perrett, Johnston, & Benson, 1991; Huberle, Rupek, Lappe,
& Karnath, 2009), as well as having a different time-course of development, with
modal completion developing earlier in normal neonates (Otsuka, Kanazawa, &
Yamaguchi, 2006).
Theoretical approaches to Gestalt grouping have been from either a bottom-up,
stimulus driven manner, or from a top-down, higher cognition manner. The gestaltists
tend to favor a bottom-up approach, while others have attempted to explain the
origin of Gestalt principles as visual heuristics which are derived from the natural
image properties of the visual environment. At some level, these two approaches do
not differ, fundamental properties of the perceptual system have become fundamental
because they are selected for in this environment. What is more to the point is to
what degree these perceptual rules are obligatory, if they are learned or not, and to
what extent visual experience can engender or modify gestalt principles. The work
of Pawan Sinha, for example tends to favor the learned approach; cataract surgery
on congenitally blind children have demonstrated an initial inability to perceptually
group in an appropriate way, but after just a few weeks, perceptual grouping occurred
22

A
B C
FIGURE 1.2. Serrated Edge Illusion
23
A
B C
FIGURE 1.3. Star Edge Illusion
24
(Ostrovsky, Andalman, & Sinha, 2006; Ostrovsky, Meyers, Ganesh, Mathur, & Sinha,
2009; Kimchi & Hadad, 2002).
1.2.2. Development and Disorders
Importantly, Gestalt grouping is not only a matter of perception or the ability
of individual to make sense of the visual world. Or rather, since perceptual grouping
is a core cognitive ability which develops over the lifespan, and central to the
visual systems ability to decode the world, is necessarily of importance. Perceptual
grouping can be perturbed by visual disorders, and thus neuropsychological studies
can use failures of perceptual grouping to better understand the system as a whole.
Attentional deficits are reduced when gestalt grouping cues are used across the midline
(Brooks, Wong, & Robertson, 2005)and extinction in Balint’s syndrome can also
be eliminated using gestalt grouping (Riddoch, Rappaport, & Humphreys, 2009)
cues. There is impaired global processing in autism(Scherf, Luna, Kimchi, Minshew,
& Behrmann, 2008), indexable using grouping cues, and visuospatial organization
is disrupted in patients with schizophrenia (Anne, Assche Mitsouko, Caroline, &
David, 2010). Organic damage can also impair gestalt grouping, as in a clinical
case study of a woman with visual form agnosia, who, despite normal visual acuity
and intelligence showed an inability to use Gestalt cues of proximity, continuity, or
symmetry.(Milner et al., 1991). Nonetheless, patient D.F. was able to read words,
and discriminate orientations, hence failure to process whole figures was not caused
by a deficit in low-level edge or orientation detectors per se, but rather a deficit in the
perception of higher-level figures. Her lesion was located in lateral occipital cortex.
EEG studies of gestalt perception in schizophrenia have also demonstrated poorer
recognition of gestalt stimuli (contour grouping in a texture field) than controls,
25
(Vianin et al., 2002). Modulation of the P300, which is commonly taken to indicate
updating of visual working memory, and modulate in categorization tasks, was also
reduced in schizophrenic individuals compared to controls (Vianin et al., 2002),
providing evidence for a deficit in the integration or mis-integration of information
this condition. Studies of patients with hemispatial neglect have shown that
perceptual grouping may occur independently of attentional allocation.(Shomstein,
Kimchi, Hammer, & Behrmann, 2010) Patients were asked to perform a fine same/
different judgement of checkerboard patterns, while in the neglected hemifield a
corresponding grid of dots grouped by color into either horizontal or vertical stripes
was presented. The grouping array was then either changed or not. Behavioral
data indicated that there was a congruency effect caused by the perceptually
grouped array, despite being consciously unavailable to the subjects. Notably, this
effect was greater for neglected distractors than unattended distractors (when the
irrelevant grouped items were presented in the same hemifield), providing further
evidence for the dual role of attention in both enhancing target processing as well
as suppressing irrelevant distractors. In the same-hemifield (ipsilesional) condition,
for both patients and controls, attention could operate normally, however, when the
distractors were in the contralesional hemifield, normal attentional suppression did
not occur. However, simultaneous changes on left and right hemifields were detectable
by an extinction patient when those changes produced an illusory object, but not
otherwise.(Mattingley, Davis, & Driver, 1997) Huberle et al. investigated whether
temporal as well as spatial integration mechanisms are disrupted in simultanagnosia,
they presented patients and controls with shape-from-motion and biological-motion
point-light displays which require integration of local cues over time in order to
perceive the figure. They found preservation of the identification of biological
26
motion displays, but not for object recognition in shape-from-motion displays. Thus
arguing both for dissociable processes for general object and specific biological motion
detection, as well as an arguing against working memory per se as being the cause
of impaired global shape perception (Huberle et al., 2009). Further evidence of the
utility of gestalt cues at understanding the underlying cognitive disfunction comes
from dynamic and static visual memory paradigms. In the ball flight task, an object
moves across a screen and then after a delay a static ball “trajectory” is displayed.
Schizophrenic patients demonstrated a selective recency strategy, memorizing the last
3 or 4 end segments, compared to controls who showed no bias. In a static version of
the task, essentially a working memory change detection task with a single, complex
line, schizophrenics again demonstrated a deficiency in the integration of the separate
line segments into a unified whole (Cocchi et al., 2007).
1.2.3. Attention and Gestalt Processing
In what way is perceptual grouping influenced by attention? ERP studies of early
visual components have demonstrated attentional spreading across visual objects, as
indexed by enhanced performance on detection tasks (Duncan, 1984; Egly, Driver, &
Rafal, 1994) or increased increased amplitude for the P1 or N1 to probes on objects
or at equidistant locations.(Luck, Heinze, Mangun, & Hillyard, 1990; Mangun &
Hillyard, 1991; Heinze et al., 1994; Mangun, Buonocore, Girelli, & Jha, 1998; Hillyard,
Vogel, & Luck, 1998; Hopfinger, Buonocore, & Mangun, 2000; Hopf, Vogel, Woodman,
Heinze, & Luck, 2002; Martınez et al., 2006).
Similar behavioral effects have been found for subjective figures, (Dodd & Pratt,
2005), slowed reaction time for subjective figures in attentive processing (Pritchard
& Warm, 1983) ERP components & attention Several components of the visual
27

evoked ERP have been shown to be sensitive to modulations of attention, particularly
early components of the visual evoked potential, the N1 and the P1. These early
components have been shown to be enhanced at at locations or objects which
are attended, compared to items or locations which are unattended (Mangun et
al., 1998). This enhanced component amplitude has also been shown to spread
through an object, such that locations within an object also show increased response
to probes, compared to equidistant locations in an unattended location or on an
unattended object (Martınez et al., 2006). Similar attentional effects, both behavioral
and electrophysiologically, have been found in subjective objects, such as Kanizsa
triangles or amodal rectangles. For example, attention has been shown to confer
similar advantages in search task using real, illusory, and occluded objects. When
attention was directed at a part of an object, whether the object is defined by
contours, illusory contours, or is partially occluded, other parts of the object show
advantages.(C. Moore, Yantis, & Vaughan, 1998) Similarly, Davis and Driver (1994)
showed that in search for illusory objects may occur in parallel in a pop-out task, but
search was impaired for targets which appeared behind illusory objects. Specifically,
search for a notched circle among whole circles and Kanizsa illusory objects was serial
when the notch of the circle was located same position as a Kanizsa inducer, so that
the circled appeared to amodally complete behind the illusory figure (Davis & Driver,
1994, 1998).
Using Kanizsa inducers arranged in a square Korshunova showed that the N100
response greater from the figure when the the inducers were arranged to form an
illusory square compared to when the inducers where orientated to prevent illusory
contour formation (Korshunova, 1999). In another experiment, analogous to the
Egly and Driver study discussed above, Han et al. cued ends of subjective rectangles
28
and showed that the contralateral N1 was enhanced for both modally and amodally
completed rectangles. (Han, 2004) These results were replicated by Proverbio et al.
in a subjective square detection task using modally completed figures, again Kanizsa
stimuli. In this task, foveally presented Kanizsa inducers were oriented to either
produce a subject illusion or not; both symmetric and asymmetric inducers were
used and they topographically mapped the ERP responses. They found greater N1
response in trials in which the inducers formed illusory squares than when the inducers
did not form a subjective square (Proverbio & Zani, 2002) Extending these findings,
van der Helden replicated the Egly & Driver cued object advantage data with modally
and amodally completed figures. RTs were faster and early ERP components (the
N1) were greater for both modally and amodally completed objects (Helden, 2010).
This is particularly interesting in that this provides evidence against purely low-
level accounts of object formation, such as texture or continuous contours as entry-
level representations (S. E. Palmer, 1992). However, larger N1s have been found for
modally completed compared to amodally completed or randomly oriented Kanizsa
inducers (Brodeur, Lepore, & Debruille, 2006). The Davis and Driver results have
been further supported by evidence that illusory figures influence attention comes
from a visual search and cueing experiment. In the first experiment Kanizsa triangles
lead to rapid, pop-out in a complex search, in the second experiment the Kanizsa
figures were used to as non-informative cues in a choice-RT task. The contralateral
N1 to the target was greater when the Kanizsa triangle was a valid cue compared
to invalid or no-target trials (Senkowski, Rottger, Grimm, Foxe, & Herrmann, 2005).
Taken together, these studies support the hypothesis that the objects of attention
are objects and that these objects are direct the distribution of attention at an early
stage. If so that is the case, what might be the underlying neural substrates of
29
perceptual grouping? Initial demonstrations of the locus of the neural correlates
of perceptual grouping early in the visual stream comes from single-unit recording
studies of the macaque visual cortex. Illusory figures (both Kanizsa triangles and
“wrench head” inducers) elicited single-unit responses in area 18 (V2), though not in
area 17 (V1). These responses were sensitive to manipulations of the illusory contours
which strengthen or weaken subjective illusions in humans (non-linearity, distance,
contrast) even if the inducers themselves were not in the receptive field of the recorded
neurons (Heydt, Peterhans, & Baumgartner, 1984). But see Grosof et al. (1993) for
evidence of illusory contour response in V1. These data are in accord with a model
of perceptual completion proposed by Grossberg. In this model, contour completion
is accomplished through feed-forward and feedback loops in V1 and V2, with longer-
range connections being supported by V2 activity and feedback through the LGN
(Grossberg, Mingolla, & Ross, 1997). Dynamics of subjective contour formation in
the early visual cortex(Lee & Nguyen, 2001)
fMRI studies have also found evidence in humans that perceptual grouping early
in visual stream. Murray et al. demonstrated that line segments organized in to 2D
or 3D shapes increased activity in LOC while simultaneously decreasing activity in
V1, compared to the same line segments when randomly displayed. Structure from
motion displays are stimulus displays in which individual elements are perceptually
joined together by their common movement, a form of Gestalt common fate grouping.
In a subsequent experiment Murray et al. used exactly such SFM displays in contrast
to velocity-scrambled displays to replicate their results (Murray et al., 2004; Murray,
Kersten, Olshausen, Schrater, & Woods, 2002). Similar results have been reported by
others. Intriguingly, there is evidence from fMRI that the formation of a perceptual
group may reduce activity in visual cortex. Object parts which were arranged to
30
suggest objects reduced activity in primary visual cortex, compared to when the same
parts were distributed randomly. This decrease in V1 activity was associated with
increased LOC activity, providing further evidence for feedback models of perceptual
organization (Fang, Kersten, & Murray, 2008). See also (Stanley & Rubin, 2003;
Han, Song, Ding, Yund, & Woods, 2001; Mendola et al., 1999; Seghier & Vuilleumier,
2006) for similar results. This may be taken as evidence that the perception of visual
objects requires interaction between areas of the visual cortex, and early activity in
V1 is not simply a reflection of the incoming visual stream, but instead shows that
even the earliest cortical processing stages reflect re-entrant processing that must
be understood in terms of non-linear feedback cycles. However, see Ffytche and
Zeki (Ffytche & Zeki, 1996) for evidence suggesting that V2 is capable of processing
illusory contours in isolation.
As the majority of tasks reviewed presented the stimuli foveally, or directed
attention to the stimuli, another question which arises is whether or not perceptual
grouping, requires attention to operate, or does it act “pre-attentively.” Feedback
models do not necessarily address this question. There have been several attempts to
answer this question (Driver, etc) through both behavioral tasks as well as using
ERP components to index the rapid allocation of attention within and between
objects. With some authors contending that attention is necessary to form subjective
figures (Rock, Linnett, Grant, & Mack, 1992; Mack, Tang, Tuma, Kahn, & Rock,
1992; Pritchard & Warm, 1983) and others arguing that attention is not necessary
(C. Moore et al., 1998; C. M. Moore & Egeth, 1997; C. M. Moore, Hein, Grosjean,
& Rinkenauer, 2009; Lamy, Segal, & Ruderman, 2006; Kahneman & Henik, 1981).
The Mack et al. results have been explained by the fact that, rather than subjects
reporting whether there was grouping or not, subjects reported their memory of
31
whether there was grouping, in this inattention task. Unfortunately, a results from the
inattentional blindness literature has demonstrated that items which are unattended
are typically not reportable and thus these negative results may be interpreted as the
subjects’ failing to remember the items, not necessarily failing to perceive them.
To summarize, the literature is divided on the degree to which attention is required
for perceptual grouping or completion, whereas other questions of timing and which
neural areas are involved have achieved much more of a consensus. Though see
((S. Palmer, 2002)) However, of more interest here is the effects of perceptual
organization principles on active visual representations. It is apparent from the
above review that perceptual grouping occurs early in the visual stream, it is able to
influence the distribution of attention, and that subjectively completed objects are
similar to other types of objects and direct attention in a similar manner. Evidence
from visual search shows parallel, rapid detection of illusory figures, and that illusory
figures are able to hide the presence of targets. Completion, whether modal or amodal
appears to occur in V1 and V2, with interaction and feedback from higher cortical
areas such as LOC, and that organized percepts reduce BOLD activity in striate
cortex. However, it is still an open question as to whether the reduction in early
cortical activity corresponds in some manner to a reduction the resources required to
maintain the active visual representation.
1.2.4. Discussion
As can be seen from the above review, Gestalt grouping and completion
phenomena are fundamental to the way in which the visual system across species
creates the subjective visual percept. These mechanisms are dysfunctional in disease,
develop over time, depend on visual experiences to develop, and underlie the visual
32
experience. These phenomena are cornerstone to the way in which the visual world
is organized, perceived and represented in memory, and therefore it is important to
further develop our understanding of visual memory. In the next section studies which
have examined the interaction between visual memory and gestalt principles will be
reviewed.
1.3. Objects, Grouping and Multiple Object Tracking
Chunks are commonly defined as, “A collection of elements having strong
associations with one another, but weak associations with elements within other
chunks.” (Gobet et al., 2001). The extensive literature on expertise and memory
contrasts with the relatively few studies which have examined expertise effects on
visual working memory, or the effects of perceptual grouping phenomena in particular
on the storage and maintenance of items if memory. This is especially surprising
considering the well-known confound of chunking in attempts to establish baseline
figures of merit for visual working memory, such as encoding speed, maintenance
capacity, retrieval precision etc. See Cowan (2001) for a review of paradigms
designed to reduce the contributions of long term memory and chunking. In some
theoretical views the elimination of long-term contributions is not even possible
(Cowan, 2008), since the representation itself is by definition reactivated long-term
memory representations. In any case, the quantification of the grouping effects is a
desirable goal. Specifically, understanding how does perceptual grouping affect items
in memory in terms of the quantity, organization, or type of the visual representation?
Several early attempts to quantify the nature of visual chunking mechanisms in
working memory used dot stimuli. Wilton and File (1975) used memorized random
patterns and asked subjects to report the relationships between selected dots.
33
Quadrants were drawn on each dot and subjects responded with the quadrant through
which a line would pass from the center of X to Y. Some of the possible relationships
were eliminated by blacking out certain quadrants so that the number of dots
and the number of spatial relationships could be varied independently. Subjects‘
responses depended on the number of dots they were required to memorize, but not
on the number of relationships between. Thus, it appears that knowledge of spatial
relationships in this experiment was computed as necessary rather than drawing on
a store of memorized relationships. In a subsequent experiment they demonstrated
that subjects’ accuracy on a old/new task using memorized patterns was greater on
trials that used dots from a memorized pattern that were located near to each other
in the pattern than on trials in which the probe dots were selected at random from
the memorized pattern. This was used as evidence to suggest that subjects group
the memorized dots into higher order patterns which are subsequently more easily
recalled. By analogy, imagine a picture of a president in which only a few points
are sampled at random: the image would be difficult or impossible to identify. On
the other hand, if the same number of points were clustered together some feature
may be revealed in sufficient detail to enable the recall of the entire face (Wilton &
File, 1975). A more pertinent attempt to the study of visual working memory was
Bartram 1978 who examined, as it was termed, “post-iconic visual storage” using a
tachistoscopic reconstruction, or recall paradigm with random dot figures. Subjects
were presented with patterns of dots in a four by five array and then recreated the
pattern on demand. The first experiment showed that subjects tended to recall
the dot patterns in spatial clusters, or chunks, consisting of three or four spatially
adjacent discs when the order or of recall was unconstrained. When the order of
recall was constrained, e.g. top-down or bottom-up, subjects attempted to create
34

these chunks in accordance with the recall constraint. Bartram suggested that items
are encoded according to the distribution of attention across the visual field, and this
distribution influenced by both visual information ( the a priori distribution of dots
in the unconstrained condition) as well as being flexible enough to organize chunks
to best satisfy task demands, as when the order of recall was constrained. (Bartram,
1978) Similarly, Woodman et al. asked subjects to detect color changes in squares
arranged according gestalt principle of proximity. In a change detection task, a single
item in the memory array was pre-cued, directing attention to a specific quadrant
of the display. The items in the memory array were arranged according to gestalt
principles of proximity (Experiment 1) or connectedness (Experiment 2). After a brief
retention interval, subjects responded as to whether a single cued item in the whole-
probe test array had changed color or not. Change detection accuracy was greater for
items at the cued location than other locations, and greater in the larger set size for
items in the cued perceptual group. Similar results were found for connectedness cues
as well, indicating that perceptual grouping can influence which items are selected
for representation in memory (Woodman et al., 2003).
1.3.1. Benefit of Objecthood
Correspondingly, evidence has accumulated that supports an object benefit in
visual working memory. Across several paradigms and methodologies converging
evidence suggests that the information represented in visual memory is encapsulated
to form a unitary construct. The exact form of that representation is not yet known,
however, the representation (Xu, 2002) appears to be flexible, depends to some degree
on prior experience, is influenced by gestalt cues etc. Amodal completion has been
used to study object affects on visual working memory capacity. When eight colored
35
line segments were presented such that a gap divided collinear segments, individual’s
working memory capacity was less than when when a task-irrelevant occluder filled the
gap and allowed modal completion to connect the line segments. (Walker & Davies,
2003). These data suggest, along with Luck and Vogel (1997), that the basic units of
visual working memory are objects, not unbound features, and that multiple feature
values are better stored within an object then segregated among several objects. In a
series of experiments using conjunctions of features, Luck & Vogel showed that change
detection accuracy for multiple features within objects incurred no cost, compared to
when subjects were required to detect changes in single features. Similarly, in a fMRI
experiment, simple objects grouped by placing them within an enclosure were better
recalled. In addition, fMRI BOLD activation in the inferior intra-parietal sulcus
tracked the number of composite (grouped) objects rather than the number of simple
elements (Xu & Chun, 2007). In a series of change detection studies with objects
composed of parts, subjects detected changes better when the features can from the
same part of an conjoint object rather than different parts or from disjunct parts (Xu,
2002). These results were replicated when subjects remembered multiple features,
colors and orientations, of objects consisting of a body and tail. Again, co-localized
features were remembered better than when features were distributed over separated
parts, or when an occluder obscured the junction between the parts. This is in
contrast to Walker and Davies (2003), however, in this case the occluded parts differed
across feature dimensions as well as proximity or connectedness. Further experiments
contrasting proximity and connectedness demonstrated that element connectedness
conferred greater “object hood” and a greater accuracy benefit than proximity alone
(Xu, 2006). But see a contrasting viewpoint suggesting that the benefits observed
may be due to global configurations (Delvenne & Bruyer, 2006). The issue of a
36
configuration effect on working memory was also taken addressed by Jiang et al.
using multiple types of conjunction stimuli. As noted above, the relationship of
parts and wholes, as shown above, is important for the creation of subjective objects.
However, the interrelationship between elements or objects in the scene may also be
important for memory storage. Jiang et al. demonstrated an asymmetric effect of
global item configuration on color change detection accuracy such that changes in
global configuration reduced performance, even if the item to be probed was cued
in advance of the test and showed an effect of type of test (single or whole probe)
on change detection, interpreting these results as providing evidence that some color
information may be stored relationally. However, these experiments also allowed
multiple repetitions of colors and this may have encouraged other forms of grouping. It
is well known that such chunked information is better recalled when recall is prompted
within rather than across chunk boundaries. Breaking such configurations may be one
mechanism by which accuracy was reduced in the single probe condition. Subsequent
experiments replicate similar studies by Walton and file, showing that visual memory
for spatial locations is utilizes ad hoc configurations to enhance performance and test
arrays which break these configurations reduce performance (Jiang, Chun, & Olson,
2004; Jiang et al., 2000). Concluding that grouping affects representation even when
the grouping is irrelevant. As will be seen, this is not the case for some kinds of
stimuli.
1.3.2. Multiple Object Tracking
Even a simple activity such as watching birds in flight requires the ability to
attend multiple moving objects in the visual world. This ability is known to be highly
limited, such that on average only about four items may be followed at any one time
37

(Z. W. Pylyshyn & Storm, 1988; Scholl, Pylyshyn, & Feldman, 2001; Cavanagh &
Alvarez, 2005). However, how these items are selected and tracked through their
movements, and the characteristics of their representations during tracking are not
well understood.
In the basic multiple object tracking (MOT) paradigm, a number of items are
presented on the screen and a subset of those items are designated as targets during
a cue phase. Subsequent to the cueing phase, all the items become identical and
begin to move around the field of view, this is termed the tracking phase. finally,
all the items stop moving and a single item is selected to be probed. Participants
then indicate whether the probed item was or was not a member of the original set
of target items (Z. W. Pylyshyn & Storm, 1988).
This task can be conceptually divided into several cognitive phases: first, targets
must be located among distractors, then those target items must be maintained
as target items, and finally the probed item must be assigned to either the target
set or distractor set during probe phase. The underlying cognitive and neural
processes supporting these divisions are not fully understood, and there are several
competing models and debates over specific aspects of those models within the
literature (Z. W. Pylyshyn & Storm, 1988; Scholl et al., 2001). The are several
controversies which have arisen concerning the nature of multiple object tracking.
Those controversies fall into three main groups: debates of the nature of the items to
be tracked, the “what is tracked” question. Arguments over how these items, however
defined, are tracked, and finally, what are the nature of the limits (capacity, identity
etc) of multiple object tracking. I will only specifically address the debate of what
the nature of active representations may be in MOT, and how tracking them maybe
accomplished.
38
Some questions arise in multiple object tracking. first, what exactly is tracked?
Objects, features, locations etc. Secondly, how is that tracking accomplished? Finally,
what kinds of limitations constrain performance in MOT? Evidence from Scholl et
al suggest that what is tracked is an object. In their experiments, subjects tracked
four targets among four distractors. In the critical condition, targets were joined
to distractors by lines so that target-distractor pairs formed extended objects, or
barbells. Though subjects could track four targets independently when there were
eight total objects in view, when their where only four objects, yet joined as target-
distractor pairs, subjects could not track the targets at all (Scholl et al., 2001).
Further evidence from VanMarle and Scholl (2003) demonstrated that objects where
easier to track than equivalent displays in which the subjects were required to track
substances instead. Finally, recent neural data from Drew and Vogel (2008) have also
demonstrated ERP component which closely indexes the number of items accurately
tracked regardless difficulty manipulations, spacing etc. There are several models
which have attempted to address the question of how the tracking of objects is
accomplished. These models, broadly defined, consist of models of pre-attentive
indexes, single focus attentional switching, grouping items within a single focus or
multifocal attention (Cavanagh & Alvarez, 2005; Howe, Cohen, Pinto, & Horowitz,
2010; Z. W. Pylyshyn & Storm, 1988; Yantis, 1992). Furthermore, whatever model is
chosen it must attempt to answer first, how items that are to be tracked are selected,
and secondly, the and updating process which maintains tracking of those items during
the tracking period (Alvarez & Scholl, 2005; Z. Pylyshyn, 2006).
The MOT task was initially developed to test ideas concerning the visual indexing
of objects in the visual world in order to attempt to ground cognitive concepts with
preconceptual objects. That is, it is logically necessary in order for concepts to exist
39
that pre-concepts must also exist. Therefore, for those concepts to be attached to
items in the real world, there must be some mechanism which itself does not depend
on pre-existing concepts in order to bridge the gap between concept and object.
Hence the idea of FINST, or fingers of INSTantiation. In the same way that a child
which does not posses the word for “moon” can nonetheless point to the object in
the world, Pylyshyns “FINST”s can index (literally, point) to objects in the world
without recourse to existing concepts in the mind; thus providing a demonstrative
mechanism for situating visual cognition within the world. A further, crucial aspect
of FINSTs is that provided an extended means of indexing the individual item
across time without respect to specific features or locations that that item may
have (Z. W. Pylyshyn & Storm, 1988). As applied to MOT, FINST pre-attentively
indexes some number visual objects which attentional functions of feature binding
or recognition may or may not then operate over. In the original conception, these
indexes are “sticky” and automatically track the targets. Many researchers have
pointed out that this is contrary to the subjective difficulty of this task, and the
necessity of continuous attention to the targets in order to prevent the targets from
being lost during the tracking phase. However, the alternative of rapidly switching
singular focus of attention was shown to be a poor explanation for the tracking data,
and other researchers have shown switching times to exceed fastest estimates of the
reallocation of spatial attention (Yantis, 1992; Cavanagh & Alvarez, 2005).
Experiments from visual search have demonstrated that while pre-attentive
objects exist, they exist as unbound (un-categorized or within-object perceptually
organized feature-bundles) (Wolfe & Bennett, 1997). Thus, in MOT, the property
of an object on the screen, and one that is blinking, requires the active binding
of attention. Hence the limited number. However, all items on the screen are
40

indexed. That is, some information about all the items on the screen is known
pre-attentively. However, if attention slips, then the binding of the target concept to
a particular instance of a moving item on the screen is lost. Pylyshyn is correct in
that ontologically demonstratives are required, however, he goes to far in proposing
that these pre-attentive processes are further able to maintain information about the
items they are tracking. Rather, these are pointers, demonstratives, which in fact do
not contain or retain information about the items on the screen per se. As described
by Z. W. Pylyshyn and Storm (1988):
(1) Early visual processes segment the visual field into feature-clusters
which tend to be reliable proximal counterparts of distinct individual
objects in a distal scene; (2) Recently activated clusters compete for a
pool of four to five visual indexes or FINSTs; (3) Index assignment is
primarily stimulus-driven, although some restricted cognitively mediated
processes, such as scanning focal attention until an object is encountered
that elicits an index, may also result in the assignment of an index;
(4) Indexes keep being bound to the same individual visual objects as
the latter change their properties and locations, within certain as-yet-
unknown constraints (which is what makes them perceptually the same
objects); and (5) Only indexed objects can enter into subsequent cognitive
processes, such as recognizing their individual or relational properties, or
moving focal attention or gaze or making other motor gestures to them.
This may be explained by asserting that the indexing process is automatic and
operates continuously and promiscuously: attention is needed to prevent distractors
from becoming indexed. Indeed, even after attention is applied to an item, Wolfe et
al. have demonstrated that post-attentively no perceptual information is maintained
41
about that item in visual search tasks, with obvious application to MOT (Wolfe &
Bennett, 1997). If MOT is considered as a series of instantaneous search tasks. When
considered in this light, the FINST theory is less a model of how MOT is performed
and more a model of how items in the world are connected to their object files. Thus,
while FINST fails as a model of MOT, it may succeed as a bridge from pre-conceptual
things in the environment (FINGS) to recognized objects. In this view, all (or some
large subset) of items are indexed as existing by FINST, but attention is required
to maintain specific identity of distractors and targets. In a related paper, Wolfe,
Klempen, and Dahlen (2000) further showed that while conceptual knowledge of a
scene may build up over repeated scans, the perceptual qualities of items in a scene,
particularly the binding of multiple features into coherent objects, are not maintained
after attention has shifted to a new item or location.
Leaving FINST aside, there are two other general categories of MOT models: singular
attentional spotlight (usually considered to be a rapid serial deployment of attention
model or grouping) and multifocal attention. Singular attentional spotlight admits
of only a single focus of attention that is either rapidly shifted from tracked object
to tracked object, or in the case of Yantis’ grouping models, tracks a single multi-
vertexed polygon. The multifocal model of attention allows attention to be split over
multiple locations, simultaneously following individual tracked items. As mentioned
above, the serial, rapidly shifting models of singular attention are effectively defunct,
since data from several experiments have demonstrated that attention in such a
model would be required to shift from object to object at speeds far exceeding the
most optimistic estimates of attentional shifts.(Yantis, 1992; Cavanagh & Alvarez,
2005; Z. W. Pylyshyn & Storm, 1988). However, it is known that attention can
spread within an object, and that perceptually grouped items as well. Thus, if it
42

is possible to group multiple items into a single, composite unit (imagine tracked
items as the vertices of a polygon), then it should be possible to track that unit as a
whole with a single focus of attention on a gestalt object. Steven Yantis performed
several experiments to determine whether or not MOT may be explained as a singular
spotlight tracking just such a composite object. In a series of seven experiments he
showed that tracking performance may be improved by presenting the items to be
tracked in arrays which support perceptual grouping processes, or by suggesting a
grouping strategy to participants. Further experiments demonstrated that subjects
were better able to track items when those items shared a common fate, and failed
at tracking when targets and distractors were similarly bound together by common
motion. This evidence was taken to support a model in which subjects effortfully
track a single, composite object constructed by pre-attentively grouped elements
using a singular focus of attention (Yantis, 1992). According to this model of MOT,
the constitution of an object depends on the perceptual grouping processes in play
and these grouping processes may be modulated by task, attention, or other top-
down influence independently of the effects of stimulus-driven processing. This is in
contrast to the FINST model, in which the computationally intensive tracking task is
performed automatically by early, cognitively impenetrable processes, and in accord
with object-file concepts of Kahneman and Treisman, at least so long as the object files
can be composed of at least spatially and potentially featurally disparate items (Dam
& Hommel, 2010; Scholl et al., 2001; Yantis, 1992). Finally, the model of multifocal
attention has received much support, and in fact may be the best model to date. In
this model, attention is simply split among each of the target items, up to some limit.
There is considerable converging evidence that, contrary to the prior, widespread
belief that attention is limited to a single location or object, in fact attention may
43
be split between two or more locations, limited to as many as four(Awh & Pashler,
2000), and this limit converges with estimates of memory capacity. If this is the
case, as it seems to be in MOT as well, then items may be tracked by continuously
monitoring the disparate items in parallel, updating spatial references as necessary.
This concept is supported by behavioral as well as recent neural tracking data (Drew
& Vogel, 2008) , as well as evidence from measuring the enhancement of early ERPs
on tracked targets during MOT (Drew, McCollough, Horowitz, & Vogel, 2009). This
model has the advantage of being conceptually intuitive as well as corresponding to
the introspection of the task.
Multiple Object Tracking and Perceptual Grouping As the research review has
suggested, multifocal attention combined with some sort of grouping strategy may
support the tracking of multiple objects. That is, observers may track multiple items
by spontaneously grouping disparate items into a single “virtual object”. This object
however, in order to respond to changing demands in the real world, may need to
be flexible, such that the active representation at any moment may reflect competing
perceptual cues or top-down attentional requirements. A strict reading of FINST
does not allow for such flexibility; tracking is automatic and insensitive to direct
manipulation by higher cognition. The multifocal model does not allow for the
possibility of grouping effects underlying tracking, and the Yantis model of grouping
does not accommodate multiple attentional foci. A synthesis approach may be fruitful
in this case.
Considerable evidence from the perceptual literature supports an early
segregation of the visual world into perceptual units,(Ehrenstein & Gillam, 1998;
Marr, 1976; Sayim, Westheimer, & Herzog, 2010; Herrmann & Bosch, 2001;
Westheimer, 1999; Kovacs, 1996; Sugita, 1999; Kovacs, 2000; Wertheimer, 1938;
44
S. Palmer & Rock, 1994; Merikle, 1980; Attneave, 1968; Han et al., 1999; Pomerantz,
2003), and evidence from visual search supports the hypothesis that these units
are bundles of features (Wolfe & Bennett, 1997) that are temporarily bound into
discriminable objects when “moused over” with attention. These early features can
guide attention to these locations,(Wolfe & Horowitz, 2004) as information is fed back
into processing in a recurrent, or reentrant manner. Applied to the MOT task, targets
are quickly selected from distractors in a pop-out manner, guided by a simple feature
search. However, during the tracking phase all features are identical, only the history
of the item as remembered segregates target from distractor, in the typical MOT
task. It is here that FINST fails completely, since fundamental to the hypothesis
is the proposition that FINSTs maintain the history of the item despite changes
in local features or location. This proposition is unsupported by any data. Some
questions remain, however. For example, to what extent are are grouping processes
used in MOT and are the effortful grouping strategies demonstrated by Yantis (1992)
equivalent to bottom-up perceptual gestalt processes? If they are not equivalent,
would further perceptual support provide evidence for rapid and automatic tracking
mechanisms vis a vis FINST? Do the active representations reflect the number of
physical items in view, or the subjective percept? Furthermore, the difference between
subjects to whom strategic grouping was suggested and those who did not receive that
instruction only existed during the first several blocks, indicating that subjects rapidly
learned some strategy, either a “polygon” strategy or some other with similar effect.
Nonetheless, subjects were able to track multiple targets in early blocks with lower
accuracy. Thus the assertion that MOT is accomplished by linking items to an internal
polygon representation which is constantly updated to match the environment is not
the only interpretation of the data.
45

Recently, Drew, Horowitz, Wolfe, and Vogel (2011) reported an electrophysiological
measure of tracking multiple objects, describing an ERP index of the number of items
being tracked at any one time. This component is a tracking homolog to the working
memory index, the CDA. The tracking component was shown to be modulated only
by the number of items tracked rather than the number of distractors, speed or
difficulty, or tracking area. This chapter and the following chapters will use this
component to more precisely investigate the nature of the active visual representation
during tracking. Though Yantis (1992) showed a behavioral benefit of perceptually
supported tracking it is unknown whether or not bottom-up perceptual grouping
mechanisms may influence the representation of items during tracking. Given the
putative connection between visual working memory and tracking as demonstrated by
Oksama and Hyona (2004) and Drew and Vogel (2008), as well as the above-discussed
MOT perceptual grouping experiments of Yantis, it is not too speculative to suggest
that the manipulation of grouping cues during an MOT task may also manipulate
the tracking load and thus the indexed ERP activity, providing a window into the
moment-by-moment representation of atomic or composite objects in MOT. If so, this
tool may enable parsing the tracking mechanism among automatic processes, gestalt
perception, and strategic, effortful control. Here, we investigate whether supplying the
participant with low level cues such as connecting lines, common motion, or proximity
could improve tracking performance, and whether these manipulations also affect the
neural representations as indexed by the online tracking activity.
1.3.3. Discussion
Altogether, converging evidence indicate that the unit of visual memory is the
object, however undefined and flexible that term may be. Object benefits in visual
46

memory has been found for single and multiple feature detection and conjunctions of
features. There is some evidence that directed attention may serve as the active means
by which items are segregated or joined into composite objects; certainly configural
and grouping cues as well as task constraints guide which items may be stored int
memory. FMRI data, in addition, demonstrate that the grouping cues or complexity
may affect the atomic or composite nature of the active visual representation. Further
evidence is needed to understand under what conditions disparate items may be
composed or disjoined, and some of these questions may be better answered via
electrophysiological measures of perceptual grouping of active visual representations.
Additionally, of particular interest is the temporally extended nature of objects in the
world, as distinct from the typical brief presentation of information (Sperling 1972)
in visual memory paradigms. In the following section a relatively recent experimental
paradigm is reviewed which may be better able to address the temporally extended
nature of object formation or transformation, the multiple object tracking paradigm.
1.4. Conclusions and Overview of Present Studies
1.4.1. Dissertation Outline
The gist of the matter is this: Every impression that comes in from
without, be it a sentence which we hear, an object of vision, or an effluvium
which assails our nose, no sooner enters our consciousness than it is drafted
off in some determinate direction or other, making connection with the
other materials already there, and finally producing what we call our
reaction. The particular connections it strikes into are determined by our
past experiences and the ’associations’ of the present sort of impression
with them. -William James
47
The empirical chapters of this dissertation that follow this introduction are
focused on the behavioral and electrophysiological indices of actively represented
visual object representations. Chapter Two describes the results of a behavioral and
electrophysiological study on the effects of modal completion, using Kanizsa objects,
on visual working memory representations. The experiment shows that perceptual
grouping effectively reduces working memory load in an orientation memory task,
as demonstrated by increased accuracy in the task and reduced contralateral delay
activity and investigates whether or not these effects seen are obligate or voluntary,
that is, whether top-down attentional control is able to selectively alter the effect
of perceptual grouping on visual working memory representations. Using Kanzisa
stimuli, in both an orientation and a color change detection paradigm this chapter
demonstrates that attention can successfully alter the visual representation depending
on the relevance of the grouping cues to the task. Individual differences in grouping
ability are also correlated with the electrophysiological measures of working memory
load. Chapter Three extends these results to another gestalt grouping cue, element
connectedness, and determines that the presence of a task-irrelevant connecting lines
between independently moving tracked objects in a dynamic visual task is sufficient
to alter tracking load and enhance performance. Chapter Four investigates the gestalt
grouping cue of common fate to investigate the effects of grouping on visual object
representations during a multiple object tracking task, finding a benefit for some
kinds of common motion and not others in reducing tracking load as measured by
contralateral delay activity and the N2pc.
Chapter Five extends these MOT results further and further investigates the
relationship between proximity cues and motion grouping cues in representing visual
48
items in active representation. In Chapter Six the preceding empirical studies are
summarized and general conclusions are drawn.
1.4.2. Thesis Statement
Taken together, these studies address the question of the influence of Gestalt
grouping principles and illusory completion processes on object representations in
both static and dynamic tasks involving the maintenance of visual information in an
immediately accessible state, the active visual representation, and examine the degree
to which individual differences may affect the active maintenance of unified object
representations.
49
CHAPTER II
MODAL COMPLETION AND VISUAL WORKING MEMORY: BOTTOM-UP
AND TOP-DOWN INFLUENCES
2.1. Introduction
In order to make sense of the visual world scene components must be organized
in some fashion. Gestalt theorists have provided a general framework by which we
can understand this visual organization; however, how, when, and where perceptual
grouping is performed in the brain is currently controversial and incompletely
understood. In addition to classical gestalt grouping cues, a basic operation of the
visual system is figure completion. That is, an object in the visual world that is
partially occluded by foreground objects, or partially camouflaged against a matching
background, are not perceived as a fragmented collection of objects but rather a
unified whole behind the occluders, e.g. a cat moving behind a picket fence, or the
sudden perception of a tiger.
There are two general completion phenomena: modal and amodal. Amodal
completion is so termed because the subjective percept is created outside the visual
mode, that is, there are no specific sensory components of texture, color etc. of
the occluded parts of the cat behind the fence. Conversely, one can imagine tiger
camouflaged against a background of tall grass. In this case the foreground object,
the tiger, is hidden unless cues such as common motion, contour completion, or other
pattern recognition processes allows the segregation of the patchwork tiger from the
background. Specifically, the phenomenon of modal completion occurs when inducing
elements (such as tiger stripes or Kanizsa pac-men) induce a subjective percept of an
50
object, even though there exists no objective contour, texture, or color. See Figure 1.1.
on page 21.
Many questions are being debated in the literature concerning the process of
figure completion: is this a singular process, or are there multiple processes of
completion? When does figure completion occur? What downstream effects does
this processes have on further encoding? While the process of amodal completion
is interesting in its own right it will not be considered further here. Instead, this
chapter describes the use of modal completion phenomena to investigate the nature
of working memory representations. These experiments use the behavioral and
electrophysiological measurements of active visual representations in order to attempt
to answer some of these questions.
Specifically, the nature and number of active contents of visual working memory
may be assessed in several ways, however, a common means by which to do so is the
change detection task. In this task, a number of items are displayed and the subject is
asked to remember as many of the items as possible. Typical change detection tasks
probe the subjects’ ability to detect changes in simple geometric stimuli with few
feature dimensions, such as item orientation, color, shape, or conjunctions of multiple
features. Care must be taken in any task attempting to probe memory and which
assess the capacity of memory, to obtain a pure estimate of visual memory capacity
without intermodal contamination, such as re-encoding of visual stimulus as verbal
information ( See Cowan (2001) for an exhaustive discussion), as well as possible
long-term memory, or chunking contributions. That is, chunking as described in the
verbal literature is a means by which information may be more rapidly organized
and remembered with higher accuracy. While chunking and LTM have been studied
intensively for decades in the verbal realm, as discussed earlier, and chunking via
51
long-term memory organization, e.g. chess grandmasters, has been described as
well, relatively few researchers have examined the process of chunking within visual
memory. Particularly, how might chunking via perceptual grouping principles or
top-down attention affect the nature of active memory representations?
Previous studies of working memory have typically confounded objects, features
of objects, and subjective percepts of objects. It is clear, for example that several
randomly arranged and differently colored items are subjectively perceived as separate
objects, and that the capacity to remember such items is severely limited. However,
it is not known whether perceptual grouping may reduce the active memory load
or merely enhance subsequent recall. The strong subjective percept produced by
Kanizsa triangles is an ideal tool with which to investigate this question. Three
coherently organized Pac-men inducers form a percept of a singular triangle, allowing
for the separable dimensions of element or inducer number and perceptual object.
Thus, orientation change detection may be used to asses the behavioral enhancement
provided by perceptual grouping, if any. Additionally, the ongoing load in visual
working memory may also be indexed using neural data via the contralateral delay
activity. Thus, the affects of perceptual grouping on active representations may be
assessed. Furthermore, it may be that any effect of perceptual grouping on memory
load is automatic and occurs irrespective of task demands. On the other hand, it may
be that subjects strategically allocate memory resources in such a way as to represent
the information in memory in as compact a form as possible. In this experiment I
investigate the effects of perceptual grouping on active visual memory representations,
and ask whether these effects are obligate or to some extent voluntary. Specifically,
are perceptual elements themselves maintained in visual memory, or only a subjective
percept? Is modal completion an efficient process to reduce working memory load?
52
Are perceptual grouping effects driven by bottom-up or top-down processes or both?
What individual differences, if any, exist in this interaction? In this experiment I
used pac-men inducers colored from a set of highly discriminable colors in a change
detection task with either one, three, or three grouped inducers in two blocks of trials.
In the first block subjects were asked to remember the the orientation of the inducers
irrespective of color and in the second block the were asked to remember the color
irrespective of the orientation of the inducer. If features are obligatorily encoded in
working memory, than behavior and ERP for three element and grouped displays
should be equivalent between blocks. On the other hand, if top-down attention is
able to selectively encode task-relevant features in order to reduce memory load, then
trials in which the task relevant feature can be grouped should show a behavioral
advantage as well as a reduction in online memory load as indexed by the CDA. One
alternative hypothesis might be that, rather than any reduction in working memory
load being the product of a reduction in the number of objects, perhaps it could
be a result of an increase in the efficiency of processing provided by the perceptual
grouping cues. If this is the case, then we should expect that grouping cues should
facilitate the processing of Kanizsa figures either when the color or the orientation
of the items are relevant. On the other hand, selective reduction of CDA amplitude
in groupable vs non-groupable conditions would support an information chunking
account rather than a processing efficiency account.
2.2. Experiment Description
In this experiment we intended to test the question of how strong visual grouping
cues and task demand jointly influence the active representations in visual working
memory. In order examine the effect of grouping cues we utilized the classic Kanizsa
53
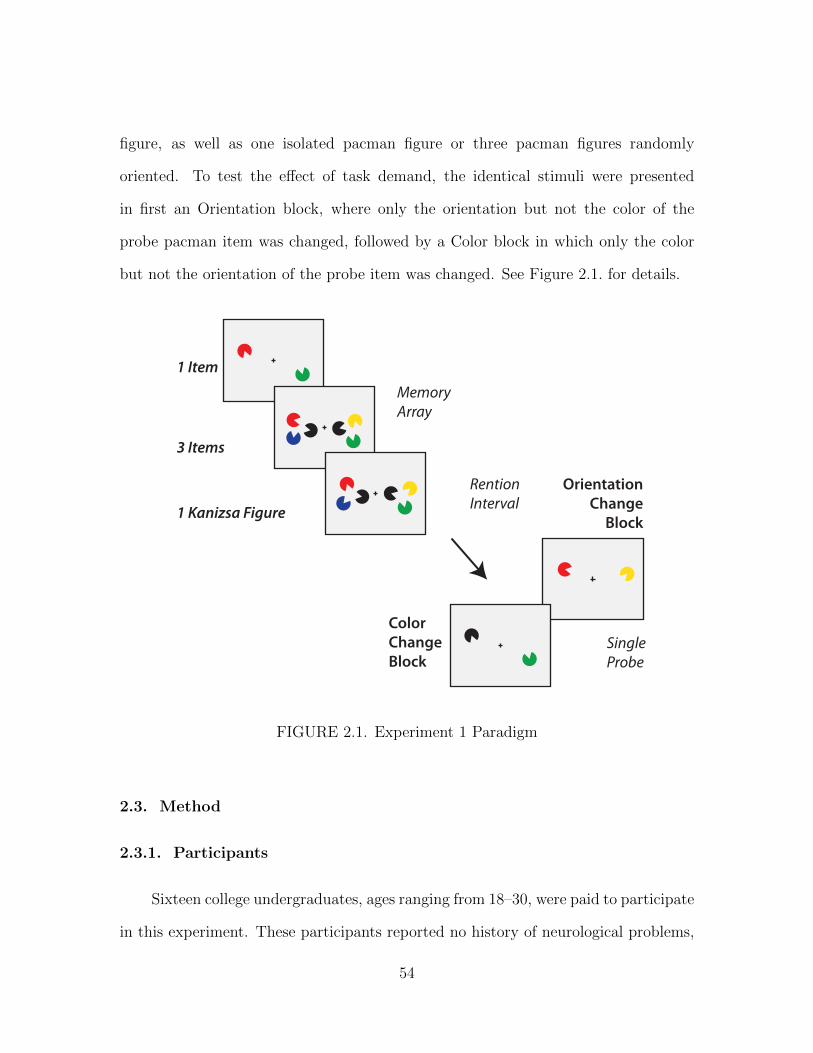
figure, as well as one isolated pacman figure or three pacman figures randomly
oriented. To test the effect of task demand, the identical stimuli were presented
in first an Orientation block, where only the orientation but not the color of the
probe pacman item was changed, followed by a Color block in which only the color
but not the orientation of the probe item was changed. See Figure 2.1. for details.
OrientationChange
Block
Color Change Block
1 Kanizsa Figure
SingleProbe
Rention Interval
MemoryArray
3 Items
1 Item
FIGURE 2.1. Experiment 1 Paradigm
2.3. Method
2.3.1. Participants
Sixteen college undergraduates, ages ranging from 18–30, were paid to participate
in this experiment. These participants reported no history of neurological problems,
54
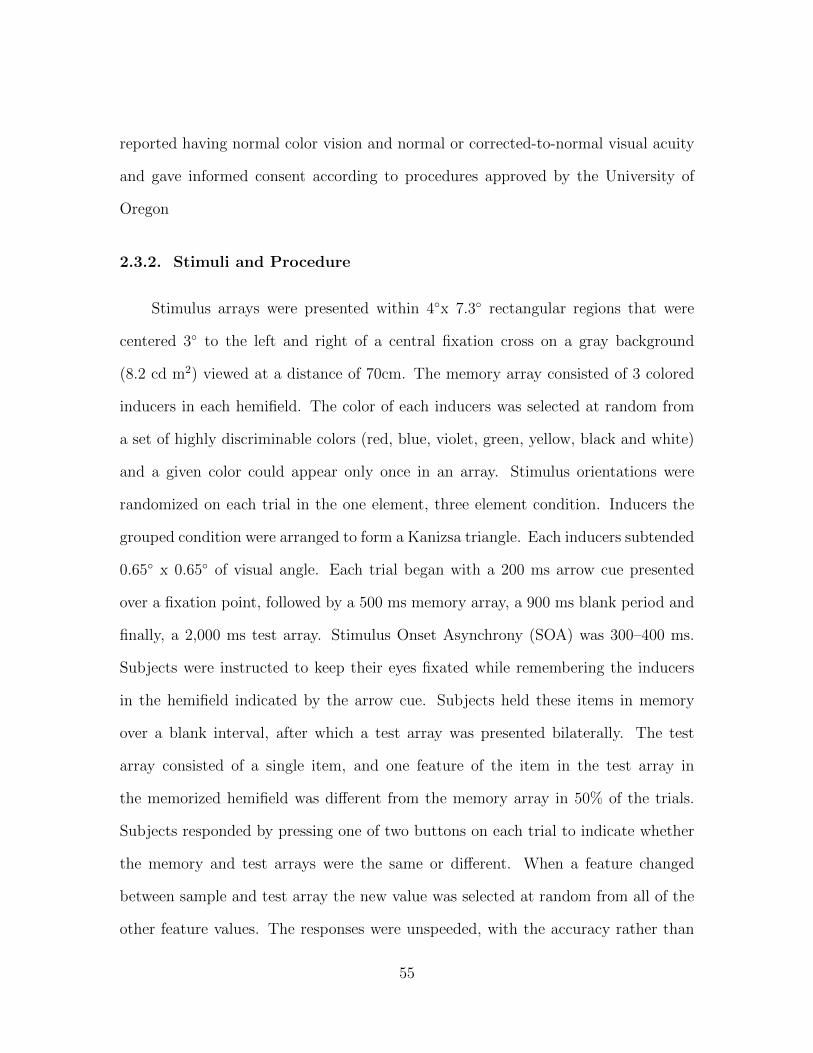
reported having normal color vision and normal or corrected-to-normal visual acuity
and gave informed consent according to procedures approved by the University of
Oregon
2.3.2. Stimuli and Procedure
Stimulus arrays were presented within 4◦x 7.3◦ rectangular regions that were
centered 3◦ to the left and right of a central fixation cross on a gray background
(8.2 cd m2) viewed at a distance of 70cm. The memory array consisted of 3 colored
inducers in each hemifield. The color of each inducers was selected at random from
a set of highly discriminable colors (red, blue, violet, green, yellow, black and white)
and a given color could appear only once in an array. Stimulus orientations were
randomized on each trial in the one element, three element condition. Inducers the
grouped condition were arranged to form a Kanizsa triangle. Each inducers subtended
0.65◦ x 0.65◦ of visual angle. Each trial began with a 200 ms arrow cue presented
over a fixation point, followed by a 500 ms memory array, a 900 ms blank period and
finally, a 2,000 ms test array. Stimulus Onset Asynchrony (SOA) was 300–400 ms.
Subjects were instructed to keep their eyes fixated while remembering the inducers
in the hemifield indicated by the arrow cue. Subjects held these items in memory
over a blank interval, after which a test array was presented bilaterally. The test
array consisted of a single item, and one feature of the item in the test array in
the memorized hemifield was different from the memory array in 50% of the trials.
Subjects responded by pressing one of two buttons on each trial to indicate whether
the memory and test arrays were the same or different. When a feature changed
between sample and test array the new value was selected at random from all of the
other feature values. The responses were unspeeded, with the accuracy rather than
55
the speed of the response stressed during instruction. Each of the participants were
tested in a single session of 90 minutes, with each trial block lasting ∼6 minutes with
two short breaks of 20s spaced evenly throughout each block. Each subject performed
at least 240 trials per condition in each experiment.
2.3.3. Electrophysiological Recording and Analysis
Electroencephalographic (EEG) activity was recorded from 20 tin electrodes
mounted in an elastic cap (Electrocap International), using the International 10/20
System, along with several costume locations. In addition to the standard sites, four
additional sites were used: OL and OR, positioned midway between O1 and T5 on the
left hemisphere and O2 and T6 on the right; Poz, located on the midline between Pz
and O1-O2, and PO3 and PO4, located halfway between POz and T5 on the left and
POz and T6 on the right. See Figure 2.2. on page 57 for the electrode montage. All
sites were recorded with a left-mastoid reference, and the data were re-referenced
offline to the algebraic average of the left and right mastoids. The horizontal
electrooculogram (EOG) was recorded from electrodes placed approximately 1cm
to the left and right of the external canthus of each eye to measure horizontal eye
movements. In order to detect blinks and vertical eye movements the vertical EOG
was recorded from an electrode mounted beneath the left eye and referenced to the
right mastoid. Trials containing artifacts: ocular, movement, or amplifier saturation
(blocking) were excluded from further analysis, which accounted for the exclusion of
an average of 29% of trials. Three subjects with trial rejection rates in excess of 35%
were excluded from the sample. The EEG and the EOG were amplified with a SA
Instrumentation amplifier with a bandpass of 0.01–80 Hz and were digitized at 250
Hz in LabView 6.1 running on a Macintosh.
56
C3 Cz C4 T4T3
T5PO3
OL
O1
POz
PO4
OR
O2
T6
Pz
F3 Fz F4
FIGURE 2.2. Electrode Montage
57

2.4. Results
2.4.1. Behavior
Performance on the task overall was good and within the range usually seen for
change detections tasks. In the Orientation block, overall mean performance was ( M
= .88, SE=.017), while in the Color block mean performance was also high, M = .93,
SE = .01. Differences existed between the conditions, such that the performance best
on 1 item, worst on 3 items, and between 1 and 3 items for the Kanizsa condition,
(Kanizsa: M = .89, SE=.02), (Three Items: M = .78, SE=.02), (One Item: M =
.98, SE=.01) in the Orientation block, while in the Color block performance was also
greatest for one item, but worse for three and kanizsa, (Kanizsa: M = .92, SE=.01),
(Three Items: M = .88, SE=.01), (One Item: M = .98, SE=.01). See Figure 2.3. on
page 59. A two-way analysis of variance (Block x Set Size) yielded a main effect for
the Block, F(1, 14) = 15.00, p < .01, such that the average accuracy was significantly
higher on the Color block (M =.92% , SD = 0.03 ) than on the Orientation block
(M = 0.88%, SD = 0.05). The effect of Set Size, F(2,28) = 78.83, p<0.001 was also
significant. In addition, the interaction effect was significant, F(2,28) = 9.93, p <
.001, indicating that the Set Size effect was greater in the Orientation condition than
in the Color condition. Planned comparisons indicated that the Kanizsa group (M =
91.5 %, SD = .04) in the Color block was significantly greater from three elements
ungrouped (M = 88.6%, SD = 0.09) at t = 2.13, df = 26, p=0.04) from three elements
ungrouped.
Behavioral performance on the memory task varied as a function of the number
of groups and elements in the display with the highest accuracy for one element (95%),
the lowest accuracy for three elements (70%). There was an effect of grouping such
58
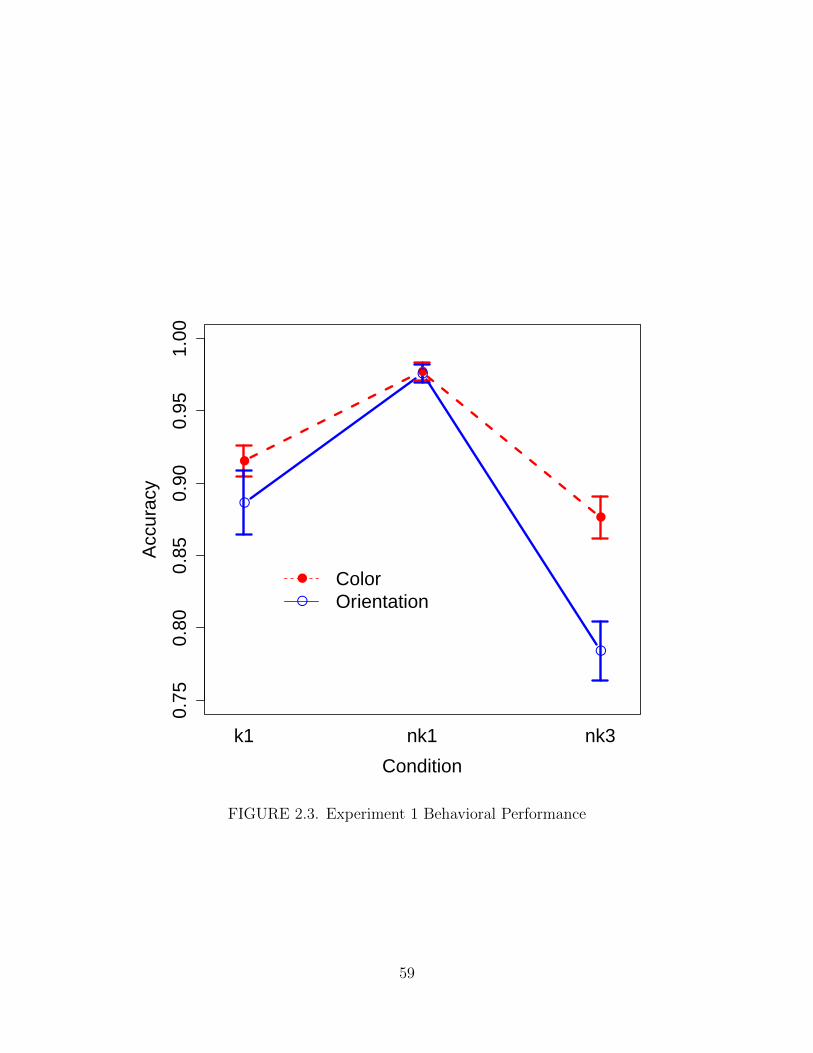
0.75
0.80
0.85
0.90
0.95
1.00
Condition
Acc
urac
y
k1 nk1 nk3
●
●
●
●
●
●
●
●
ColorOrientation
FIGURE 2.3. Experiment 1 Behavioral Performance
59
that accuracy for three elements grouped together into a single perceived object was
88%, in between one element alone or three elements ungrouped. These differences
were found to be highly reliable in a 1-way ANOVA [F(2,15) = 20.00. Of particular
interest is whether there is a benefit for the groupable dimension when that dimension
is being tested, e.g. whether there is a benefit of the Kanizsa configuration in the
Orientation block. A paired t-test revealed significant difference between 3 elements
grouped and three elements ungrouped (t(14) = 8.17, p <.001) for the Orientation
block, and the Color block (t(14) = 3.52, p<0.001), with Color memory in the grouped
condition approximately .2 objects greater and approximately .8 objects greater in
the Orientation block. Furthermore, there was a reliable difference between the
performance benefit between Color and Orientation blocks, (t(14) = 5.26, p<.001).
In order to determine the relationship between behavioral conditions, a correlation
matrix was calculated for working memory capacity in each condition. Performance
between three items grouped and ungrouped were highly correlated for Color (r =
.77, p<.01) and Orientation (r=.77, p<.05), but not between Color and Orientation.
However, the there was no significant correlation between performance on three
ungrouped items between the Color and Orientation blocks. A multiple regression
analysis was performed to determine which variables were predictive of the grouping
performance in each block. The results of the regression indicated that orientation
K and color grouping performance predicted orientation grouping performance,
explaining 57% of the variance (r2 = .47, F(2,12) = 8.03, p <.01). Orientation K
significantly predicted grouping performance ( = .08, p<.05) as did Color grouping
performance ( = .89 p<.05), with performance on the grouping task contributing
more. Performance on the ungrouped items in each corresponding block did not
increase the model fit. However, how did individual differences in working memory
60
capacity relate to the degree of grouping benefit? To answer this question, a grouping
benefit score was calculated by subtracting the performance on three ungrouped items
from the performance on three grouped items for Color and Orientation separately,
using Cowan’s formula. There was a reliable relationship between Color K and
performance in the Color Kanizsa condition, (r =.77, p<.01). A similar relationship
existed between Orientation K and performance on the Orientation Kanizsa condition
(r=.77, p<.01). A grouping efficiency score was calculated by dividing the difference
between the grouped and ungrouped conditions by the difference between the 1
element and ungrouped condition.
2.4.2. Electrophysiology
Two hundred milliseconds after the onset of the cue array we observed a transient
negative going waveform over the hemisphere that was contralateral to the attended
hemifield. This activity was followed by a larger and sustained activity which lasted
the duration of the trial. See 2.4. on page 64 for difference waves. Analysis were
performed over a 400 ms time window within each trial. ERP data were averaged
into Color and Orientation blocks on three factors of Set Size (Kanizsa, non-Kanizsa, 1
element). Mean amplitudes for each condition in both blocks were calculated from the
grand average of the difference waves for each condition at electrode sites P3/P4;OL/
OR; T5/T6;PO3/PO4, see 2.5. on page 65. A two-way ANOVA yielded a main effect
of Block (F(1, 14) = 15.00, p< .001) and Set Size (F (2,28) = 78.83, p <.001) and a
significant set size by block interaction (F(2,24) = 3.05, p<.02). Further planned
analysis reveal that the amplitude of the CDA in the Color condition depended
on set size and was greater for 3 elements than 1 element (t(14) = 5.09, p<.001),
but that there was no difference between amplitude for 3 elements and Kanizsa set
61

size overall in the Color condition (p>.3). However, in the Orientation block the
amplitude for 3 elements was reliably greater than for 1 element (t(14)=5.18, p<.001
or a Kanizsa group (t(14) =2.33, p<.05). In addition to the mean differences between
conditions, of interest is the individual response to the grouping cues. Accordingly,
a difference score was calculated by taking the difference between 1 and three
elements ungrouped and 1 Kanizsa and 3 elements to create an electrophysiological
measurement of maintenance in memory of grouped and ungrouped elements. This
grouping measurement was then correlated with behavioral performance. As seen in
other experiments, working memory capacity correlated with the difference between
1 and 3 elements (r=.6, p<.05). In addition, the difference measuring of grouping
correlated with the amplitude difference between grouped and ungrouped items in
the Orientation block, but not the Color block.
The data were further analyzed by examining the ipsi-contra waveforms. It may be
the case that the reduction in amplitude in the CDA is due to a ipsilateral effect
(not associated with objects in memory) in contrast to a contralateral effect. If
this is the case, then the ipsilateral waveforms should differ from each other, and
the contralateral waveforms should be equivalent. To test this hypothesis, mean
amplitudes were compared for each of the color and orientation blocks between the
kanizsa condition and the ungrouped condition. There was no effect of grouping on the
ipsi waveforms for the Color block (p> .5) or the Orientation block (p >.7). As noted
above, there was no reliable correlation between Color K and Orientation K. However,
what about the relationship between working memory capacity for color or orientation
and the CDA amplitude? Capacity scores for each condition were correlated with the
amplitude difference between 1 element and 3 elements in Color and Orientation
blocks, as well as the amplitude difference between 3 elements and 1 group in both
62
Color and Orientation blocks. Replicating previous research (REF), a correlation was
seen between working memory capacity and the amplitude difference between 1 and
3 elements in the Color block, however these effects were marginal r = .41, (t(13) =
1.64, p =.06). No correlation was observed between Orientation capacity and CDA
amplitude difference between 1–3. However, of particular interest is the putative
grouping effect, that is, what is the correlation of the CDA grouping effect (difference
between grouped and non-grouped elements) and working memory capacity. There
was a correlation between grouping efficiency and the grouped-ungrouped amplitude
in the orientation block (r = .41, p = .11).
2.5. Discussion
Despite the fact that visual working memory is capacity limited and the visual
world contains many items, we are nonetheless able to glean a large amount of
information from the world. One possible mechanism which may explain this
discrepancy between the myriad objects available in the world and the constrained
space in mind is the is the ability of the visual system to group or chunk incoming
stimuli into a form which best reduces online storage requirements. Accordingly, in
this experiment we asked three main questions about perceptual grouping interactions
with working memory: 1) Is modal completion an efficient process to reduce working
memory load?; 2) are items which can be perceptually grouped together actively
represented as fewer items in working memory than those items which cannot be
so grouped; 3) Are perceptual grouping effects driven by bottom-up or top-down
processes or both? 4) Are there individual differences in these grouping processes? In
order to answer these questions we presented subjects with pac-man shaped objects
either singly, in a group of three elements randomly oriented, or in a group of
63

FIGURE 2.4. Experiment 1 Grand Average Difference Waves
64
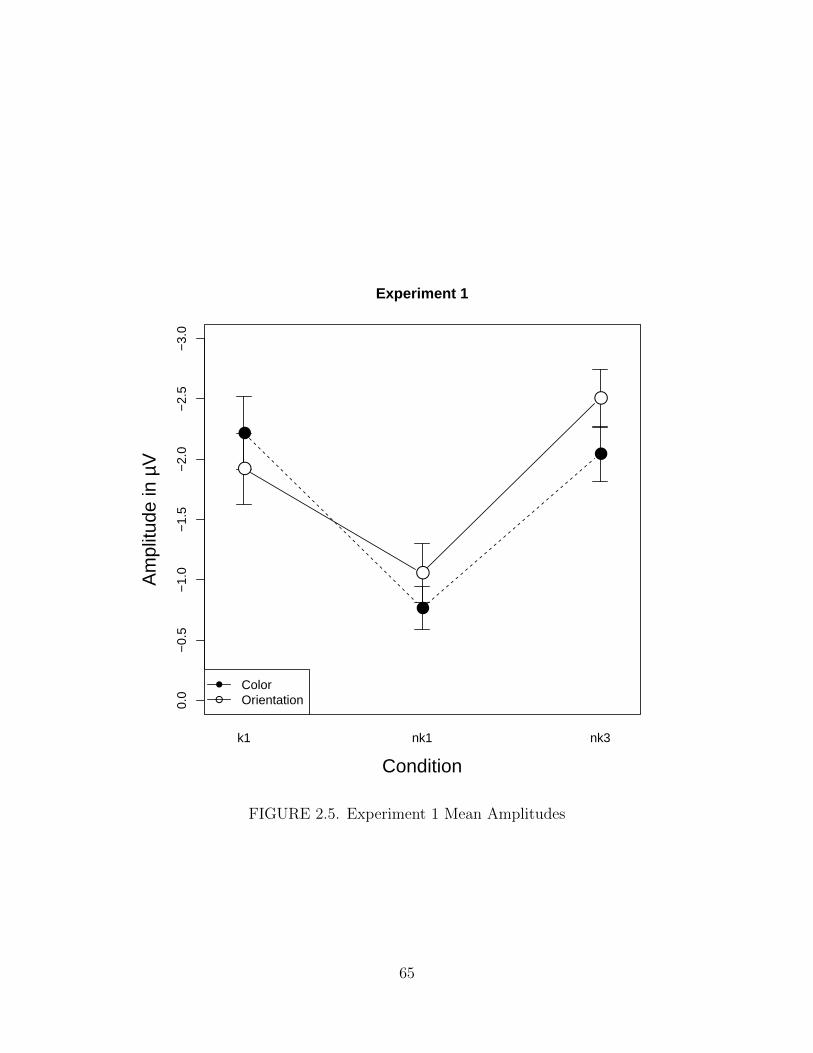
0.0
−0.
5−
1.0
−1.
5−
2.0
−2.
5−
3.0
Experiment 1
Condition
Am
plitu
de in
µV
k1 nk1 nk3
●
●
●●
●
●
●
●
ColorOrientation
FIGURE 2.5. Experiment 1 Mean Amplitudes
65
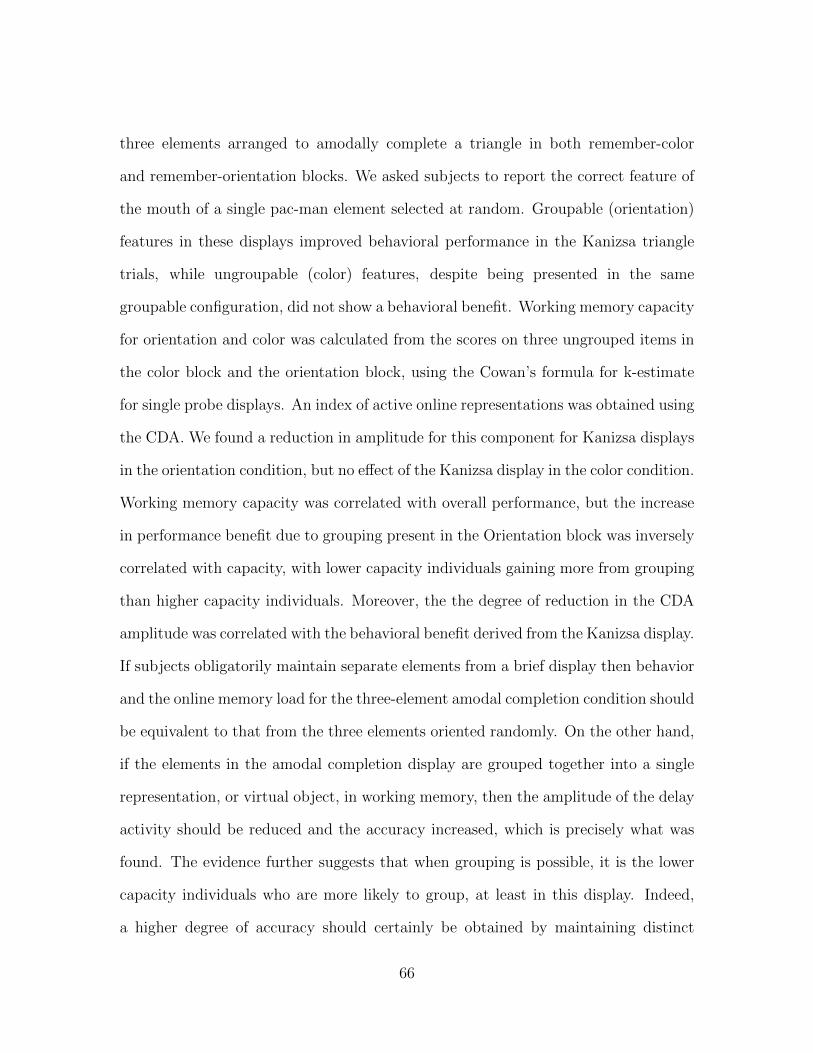
three elements arranged to amodally complete a triangle in both remember-color
and remember-orientation blocks. We asked subjects to report the correct feature of
the mouth of a single pac-man element selected at random. Groupable (orientation)
features in these displays improved behavioral performance in the Kanizsa triangle
trials, while ungroupable (color) features, despite being presented in the same
groupable configuration, did not show a behavioral benefit. Working memory capacity
for orientation and color was calculated from the scores on three ungrouped items in
the color block and the orientation block, using the Cowan’s formula for k-estimate
for single probe displays. An index of active online representations was obtained using
the CDA. We found a reduction in amplitude for this component for Kanizsa displays
in the orientation condition, but no effect of the Kanizsa display in the color condition.
Working memory capacity was correlated with overall performance, but the increase
in performance benefit due to grouping present in the Orientation block was inversely
correlated with capacity, with lower capacity individuals gaining more from grouping
than higher capacity individuals. Moreover, the the degree of reduction in the CDA
amplitude was correlated with the behavioral benefit derived from the Kanizsa display.
If subjects obligatorily maintain separate elements from a brief display then behavior
and the online memory load for the three-element amodal completion condition should
be equivalent to that from the three elements oriented randomly. On the other hand,
if the elements in the amodal completion display are grouped together into a single
representation, or virtual object, in working memory, then the amplitude of the delay
activity should be reduced and the accuracy increased, which is precisely what was
found. The evidence further suggests that when grouping is possible, it is the lower
capacity individuals who are more likely to group, at least in this display. Indeed,
a higher degree of accuracy should certainly be obtained by maintaining distinct
66
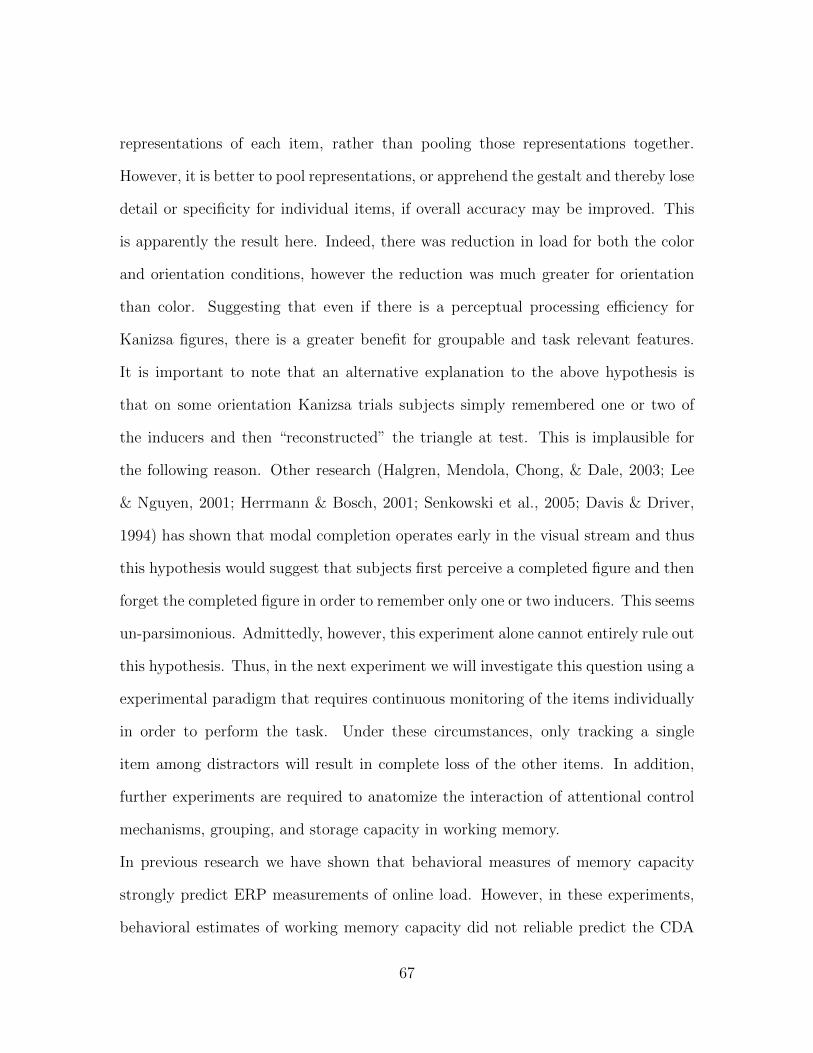
representations of each item, rather than pooling those representations together.
However, it is better to pool representations, or apprehend the gestalt and thereby lose
detail or specificity for individual items, if overall accuracy may be improved. This
is apparently the result here. Indeed, there was reduction in load for both the color
and orientation conditions, however the reduction was much greater for orientation
than color. Suggesting that even if there is a perceptual processing efficiency for
Kanizsa figures, there is a greater benefit for groupable and task relevant features.
It is important to note that an alternative explanation to the above hypothesis is
that on some orientation Kanizsa trials subjects simply remembered one or two of
the inducers and then “reconstructed” the triangle at test. This is implausible for
the following reason. Other research (Halgren, Mendola, Chong, & Dale, 2003; Lee
& Nguyen, 2001; Herrmann & Bosch, 2001; Senkowski et al., 2005; Davis & Driver,
1994) has shown that modal completion operates early in the visual stream and thus
this hypothesis would suggest that subjects first perceive a completed figure and then
forget the completed figure in order to remember only one or two inducers. This seems
un-parsimonious. Admittedly, however, this experiment alone cannot entirely rule out
this hypothesis. Thus, in the next experiment we will investigate this question using a
experimental paradigm that requires continuous monitoring of the items individually
in order to perform the task. Under these circumstances, only tracking a single
item among distractors will result in complete loss of the other items. In addition,
further experiments are required to anatomize the interaction of attentional control
mechanisms, grouping, and storage capacity in working memory.
In previous research we have shown that behavioral measures of memory capacity
strongly predict ERP measurements of online load. However, in these experiments,
behavioral estimates of working memory capacity did not reliable predict the CDA
67
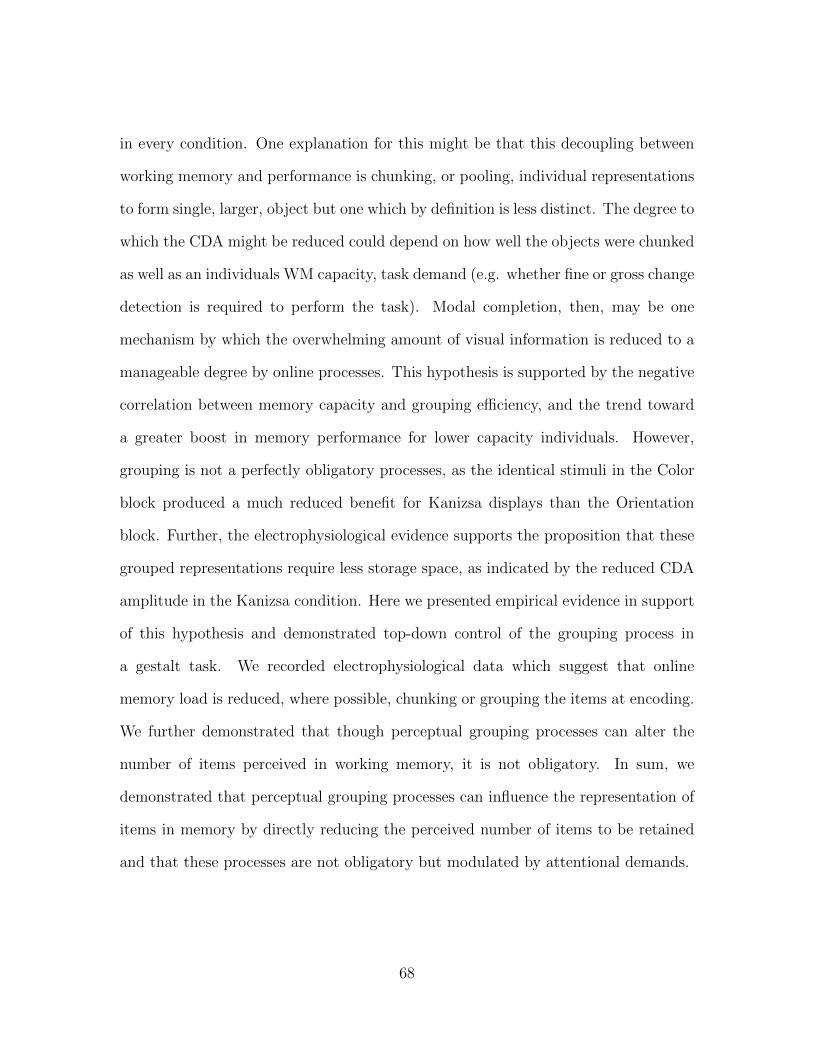
in every condition. One explanation for this might be that this decoupling between
working memory and performance is chunking, or pooling, individual representations
to form single, larger, object but one which by definition is less distinct. The degree to
which the CDA might be reduced could depend on how well the objects were chunked
as well as an individuals WM capacity, task demand (e.g. whether fine or gross change
detection is required to perform the task). Modal completion, then, may be one
mechanism by which the overwhelming amount of visual information is reduced to a
manageable degree by online processes. This hypothesis is supported by the negative
correlation between memory capacity and grouping efficiency, and the trend toward
a greater boost in memory performance for lower capacity individuals. However,
grouping is not a perfectly obligatory processes, as the identical stimuli in the Color
block produced a much reduced benefit for Kanizsa displays than the Orientation
block. Further, the electrophysiological evidence supports the proposition that these
grouped representations require less storage space, as indicated by the reduced CDA
amplitude in the Kanizsa condition. Here we presented empirical evidence in support
of this hypothesis and demonstrated top-down control of the grouping process in
a gestalt task. We recorded electrophysiological data which suggest that online
memory load is reduced, where possible, chunking or grouping the items at encoding.
We further demonstrated that though perceptual grouping processes can alter the
number of items perceived in working memory, it is not obligatory. In sum, we
demonstrated that perceptual grouping processes can influence the representation of
items in memory by directly reducing the perceived number of items to be retained
and that these processes are not obligatory but modulated by attentional demands.
68
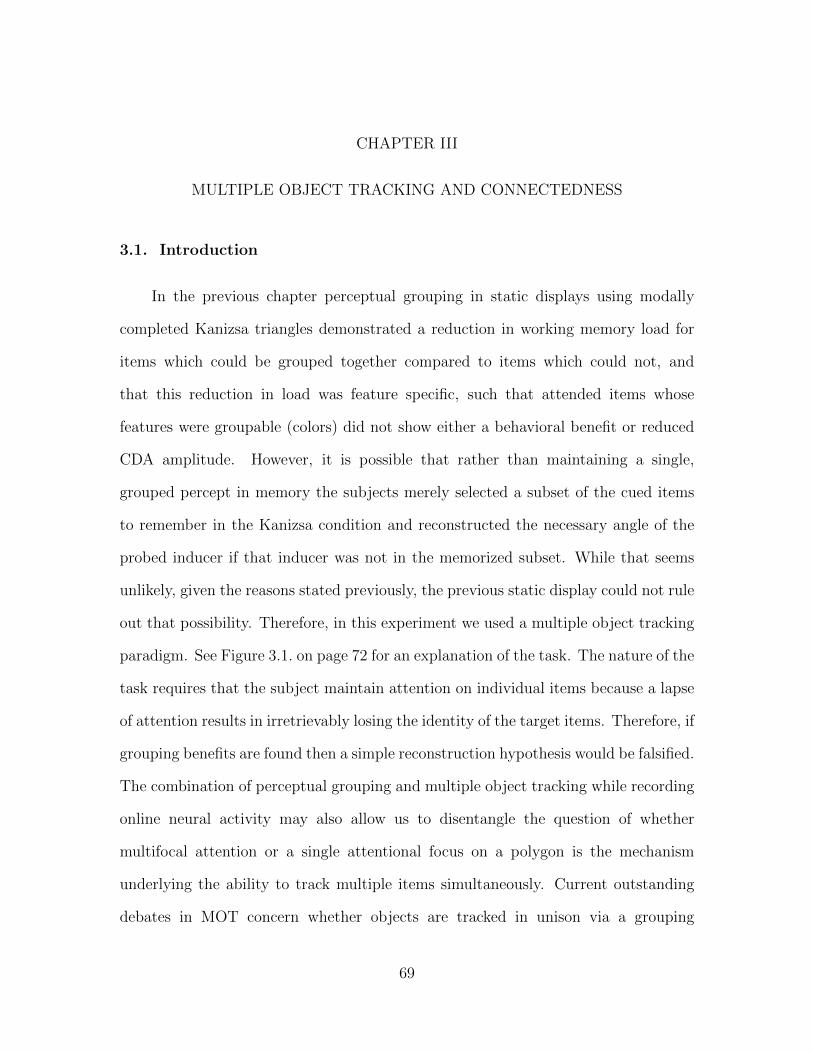
CHAPTER III
MULTIPLE OBJECT TRACKING AND CONNECTEDNESS
3.1. Introduction
In the previous chapter perceptual grouping in static displays using modally
completed Kanizsa triangles demonstrated a reduction in working memory load for
items which could be grouped together compared to items which could not, and
that this reduction in load was feature specific, such that attended items whose
features were groupable (colors) did not show either a behavioral benefit or reduced
CDA amplitude. However, it is possible that rather than maintaining a single,
grouped percept in memory the subjects merely selected a subset of the cued items
to remember in the Kanizsa condition and reconstructed the necessary angle of the
probed inducer if that inducer was not in the memorized subset. While that seems
unlikely, given the reasons stated previously, the previous static display could not rule
out that possibility. Therefore, in this experiment we used a multiple object tracking
paradigm. See Figure 3.1. on page 72 for an explanation of the task. The nature of the
task requires that the subject maintain attention on individual items because a lapse
of attention results in irretrievably losing the identity of the target items. Therefore, if
grouping benefits are found then a simple reconstruction hypothesis would be falsified.
The combination of perceptual grouping and multiple object tracking while recording
online neural activity may also allow us to disentangle the question of whether
multifocal attention or a single attentional focus on a polygon is the mechanism
underlying the ability to track multiple items simultaneously. Current outstanding
debates in MOT concern whether objects are tracked in unison via a grouping
69
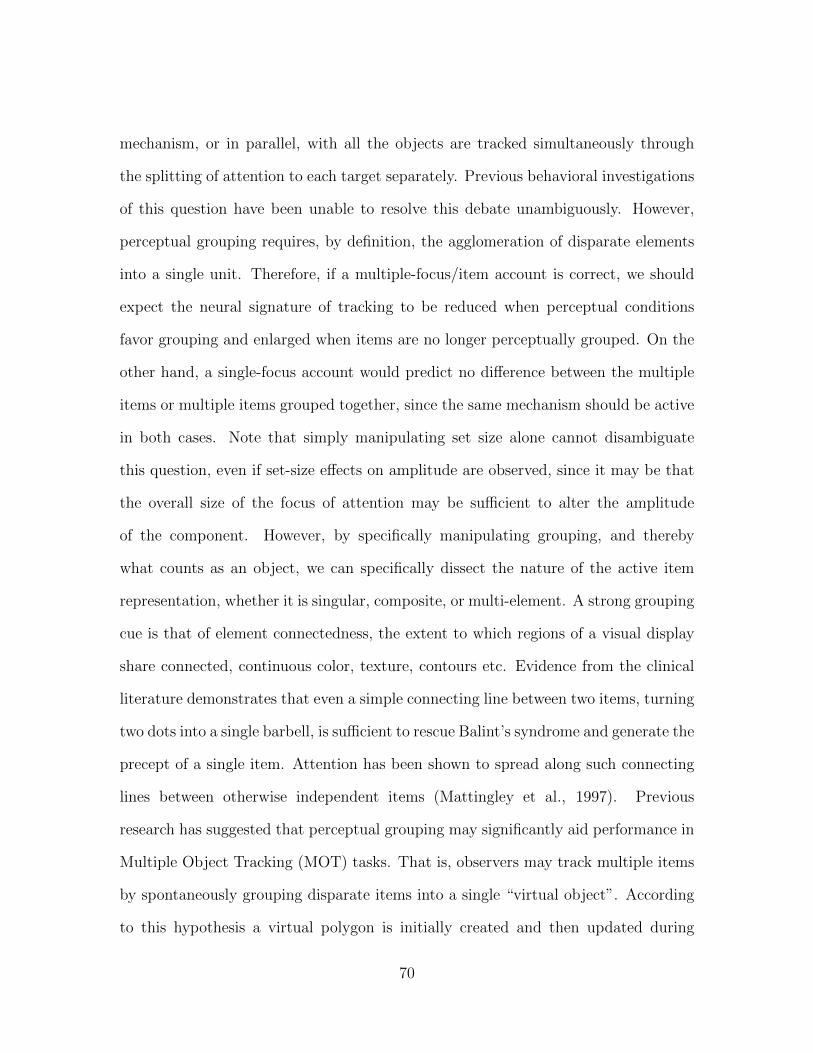
mechanism, or in parallel, with all the objects are tracked simultaneously through
the splitting of attention to each target separately. Previous behavioral investigations
of this question have been unable to resolve this debate unambiguously. However,
perceptual grouping requires, by definition, the agglomeration of disparate elements
into a single unit. Therefore, if a multiple-focus/item account is correct, we should
expect the neural signature of tracking to be reduced when perceptual conditions
favor grouping and enlarged when items are no longer perceptually grouped. On the
other hand, a single-focus account would predict no difference between the multiple
items or multiple items grouped together, since the same mechanism should be active
in both cases. Note that simply manipulating set size alone cannot disambiguate
this question, even if set-size effects on amplitude are observed, since it may be that
the overall size of the focus of attention may be sufficient to alter the amplitude
of the component. However, by specifically manipulating grouping, and thereby
what counts as an object, we can specifically dissect the nature of the active item
representation, whether it is singular, composite, or multi-element. A strong grouping
cue is that of element connectedness, the extent to which regions of a visual display
share connected, continuous color, texture, contours etc. Evidence from the clinical
literature demonstrates that even a simple connecting line between two items, turning
two dots into a single barbell, is sufficient to rescue Balint’s syndrome and generate the
precept of a single item. Attention has been shown to spread along such connecting
lines between otherwise independent items (Mattingley et al., 1997). Previous
research has suggested that perceptual grouping may significantly aid performance in
Multiple Object Tracking (MOT) tasks. That is, observers may track multiple items
by spontaneously grouping disparate items into a single “virtual object”. According
to this hypothesis a virtual polygon is initially created and then updated during
70

tracking, with the vertices of the polygon consisting of the tracked elements (Yantis,
1992). Recent research has shown that targets linked to distractors are in fact more
difficult to track, perhaps because attentional spreading confounds linked targets and
distractors into a single, erroneously merged percept (Scholl et al., 2001).
Recently our lab has demonstrated an ERP component, the CDA, sensitive to
the number of successfully tracked items in a MOT task such that the amplitude of the
component increases with increasing set size up to the individual subjects tracking
capacity (Drew & Vogel 2008 J. Neuroscience). Here, we investigated whether a
real or virtual polygon between targets in a tracking task would enhance behavioral
performance and reduce tracking load (as indexed by a reduction in amplitude of the
CDA). We attempted to answer several questions, specifically: 1) Do grouping cues
alter how items are represented during tracking? 2) If so, in what way and what
kinds of cues are the most effective? 3) Do perceptual grouping cues affect tracking
performance? 4) What are the neural measures of individual differences in perceptual
grouping during multiple object tracking?
In this study MOT performance was measured by asking subjects to track 1, 3,
or grouped objects among 10 total objects in a single visual hemifield. The effect of
the perceptual grouping cue, in this case, common fate, on behavioral performance
as well as electrophysiological measure of online tracking activity were measured. If
the strong perceptual grouping hypothesis for MOT is correct, that is, if the tracking
of multiple objects is facilitated by the combination of several objects into a single
percept, then this effect should be stronger in the explicitly grouped condition than
in the standard task. Furthermore, the online measure of activity should enable the
degree to which disparate items are grouped into a single unit for the purpose of
tracking. If the presence of actual grouping lines connecting the three targets in a
71
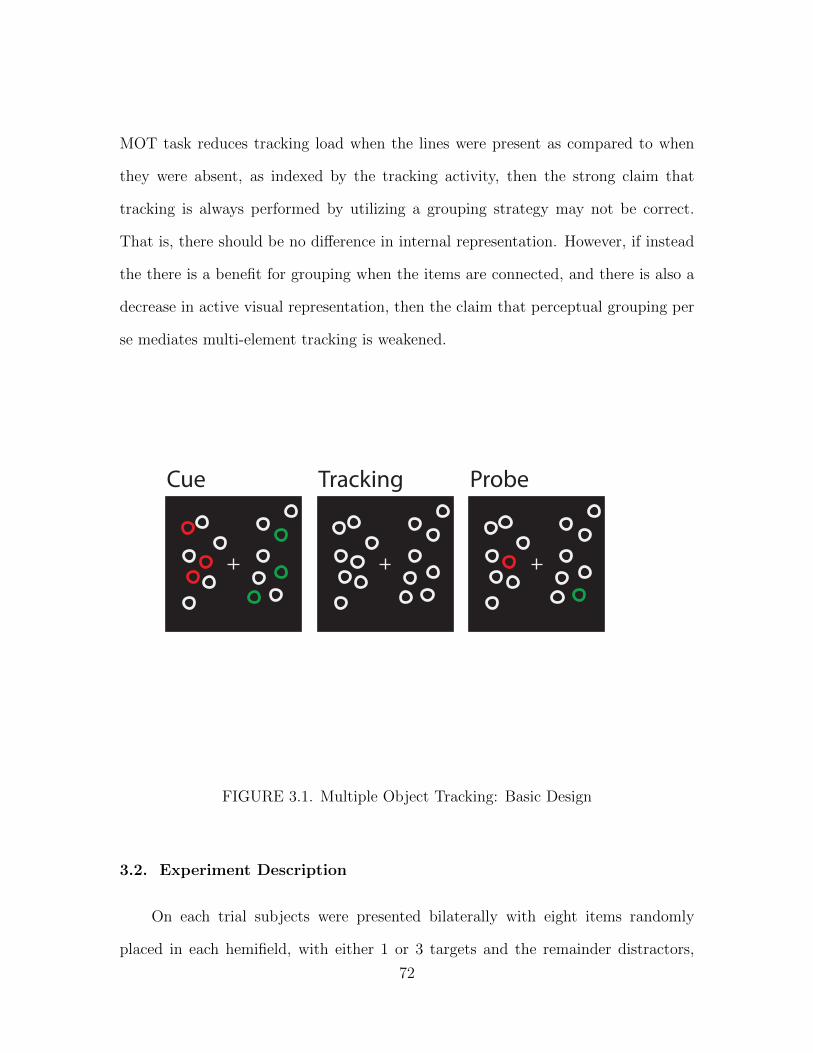
MOT task reduces tracking load when the lines were present as compared to when
they were absent, as indexed by the tracking activity, then the strong claim that
tracking is always performed by utilizing a grouping strategy may not be correct.
That is, there should be no difference in internal representation. However, if instead
the there is a benefit for grouping when the items are connected, and there is also a
decrease in active visual representation, then the claim that perceptual grouping per
se mediates multi-element tracking is weakened.
Cue Tracking Probe
FIGURE 3.1. Multiple Object Tracking: Basic Design
3.2. Experiment Description
On each trial subjects were presented bilaterally with eight items randomly
placed in each hemifield, with either 1 or 3 targets and the remainder distractors,
72

on a black background. See 3.2. on page 75. On one third of the trials there was one
target, one third of trials were 3 targets, and one third of trials there were 3 targets
connected together with joining lines of the same color forming an irregular triangle.
Each trial consisted of an initial cue phase lasting 500ms and a longer tracking phase
lasting 3000 ms. For the first 500 ms of each trial, the cue period, all the items
were stationary with a subset of the items, the targets, drawn in red (in the attended
hemifield) while the remaining items in that hemifield, the distractors, were drawn in
blue. In the unattended hemifield a number of items equal to the number of red targets
were drawn in green with the remainder of items rendered in blue. Following the cue
period, all the items turned to white (including joining lines) and began moving
within their respective hemifield for 5 seconds, the tracking period. In all conditions
the items moved randomly; the lines joining targets did not constrain the movement of
the joined items. The tracking period was divided into a short 500 ms period, during
which the joining lines on both sides faded completely away, and the remainder of the
tracking period during which the items continued to move randomly. At the end of
the tracking period all motion ceased and a single item on the attended side turned
red. Subjects were asked to track the targets and report via button press whether
the final red item was one of the tracked items or not. In experiment 1 we asked
subjects to track one, three, or three joined targets in each trial to so that we could
determine whether tracking load, as measured by the ERP index of tracked items,
was modulated by the bottom-up perceptual grouping cues provided by the bottom-
up perceptual support of the joining lines. We time locked to the onset of the cue
array and recorded throughout the duration of the trial until the test array so that we
could observe transient selection of targets, memorial representation of items, tracking
during perceptual support, and tracking after perceptual support. If tracking load
73

were reduced with perceptual support then we should expect a concurrent reduction
in the amplitude of the tracking CDA and a subsequent enhancement of behavioral
performance, both behavior and ERP should look more like the one item condition.
On the other hand, if the tracking load remained constant and was not reduced by
perceptual support during tracking we should expect that the amplitude of the ERP
measure and the behavioral performance in the grouped condition to be similar to
the baseline three target condition.
3.3. Method
3.3.1. Participants.
Neurologically normal participants (26 subjects) from the Eugene, OR
community gave informed consent according to procedures approved by the University
of Oregon institutional review board.
3.3.2. Stimulus displays and procedure.
All the multiple object tracking experiments used the same general procedure,
which is described below.
3.3.3. Experiment Procedure
In all of the following multiple object tracking experiments the following general
protocols were observed. The stimuli were presented with Presentation software
(Neurobehavioral Systems) on a CRT screen in a semi-dark room. Subjects sat
approximately 1 meter from the CRT screen while items were presented within 4◦x
7.3◦ rectangular regions bilaterally, centered 3◦to the left and right of the middle of the
screen. A white fixation cross was presented in the center of the screen, against a black
74
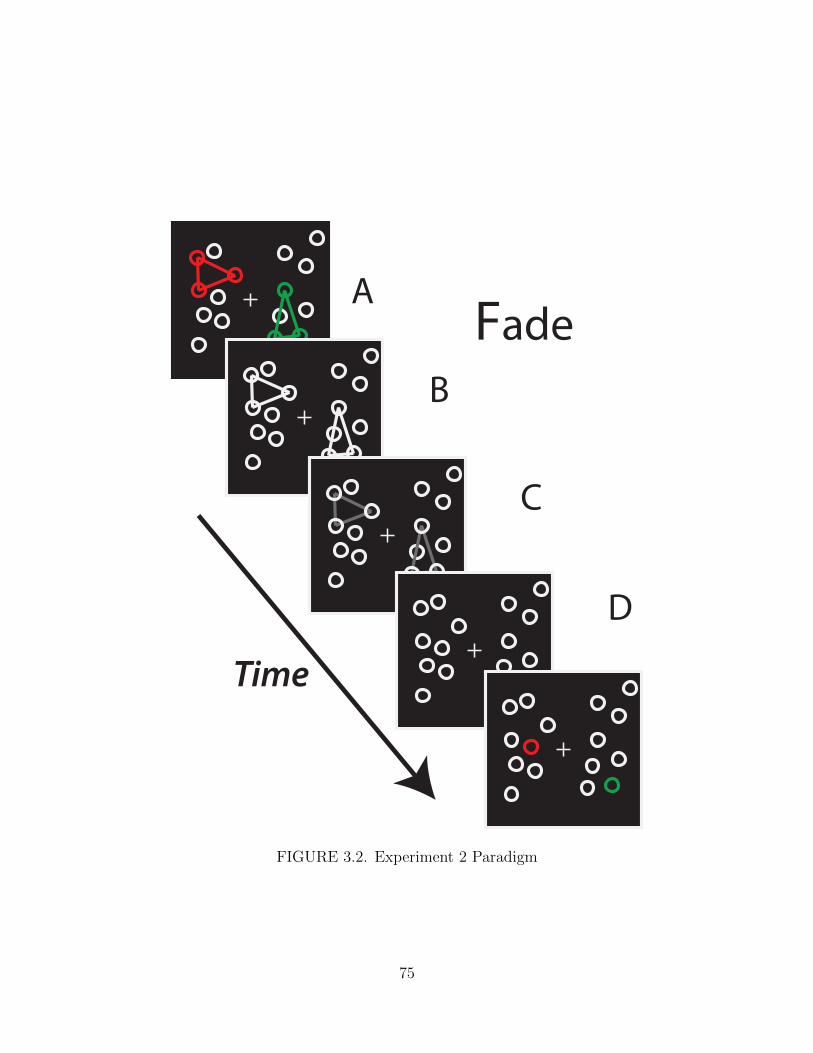
A
B
C
D
Time
Fade
FIGURE 3.2. Experiment 2 Paradigm
75
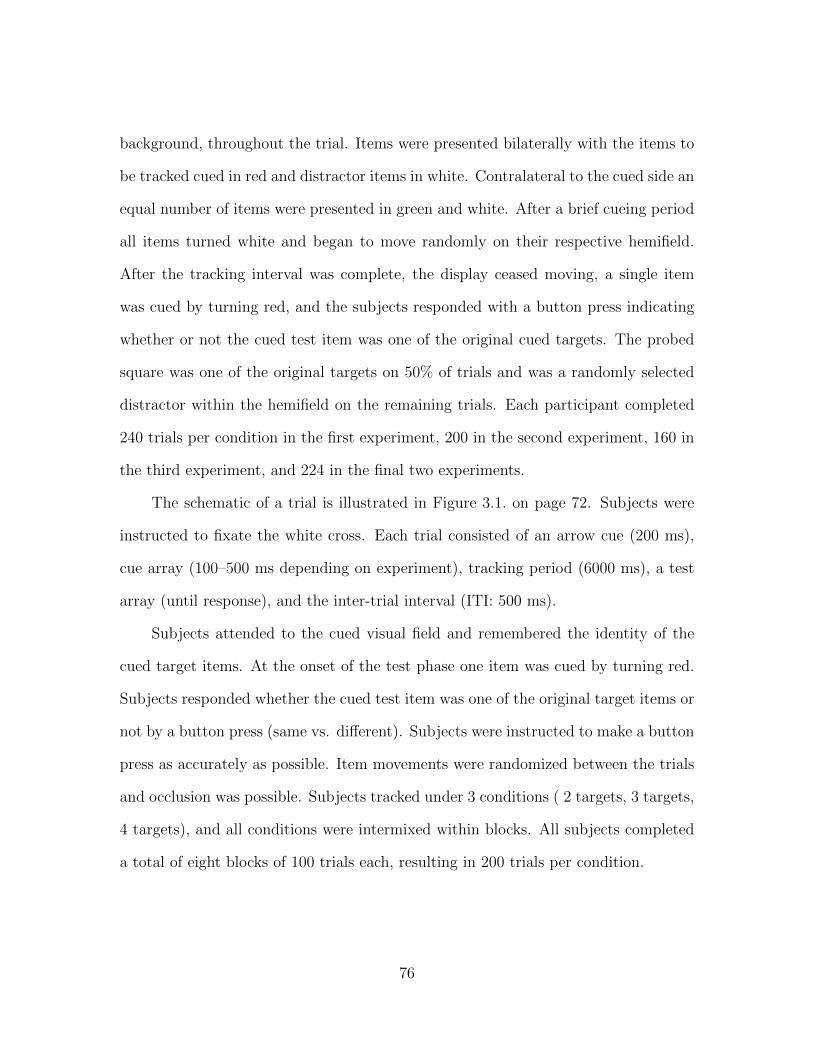
background, throughout the trial. Items were presented bilaterally with the items to
be tracked cued in red and distractor items in white. Contralateral to the cued side an
equal number of items were presented in green and white. After a brief cueing period
all items turned white and began to move randomly on their respective hemifield.
After the tracking interval was complete, the display ceased moving, a single item
was cued by turning red, and the subjects responded with a button press indicating
whether or not the cued test item was one of the original cued targets. The probed
square was one of the original targets on 50% of trials and was a randomly selected
distractor within the hemifield on the remaining trials. Each participant completed
240 trials per condition in the first experiment, 200 in the second experiment, 160 in
the third experiment, and 224 in the final two experiments.
The schematic of a trial is illustrated in Figure 3.1. on page 72. Subjects were
instructed to fixate the white cross. Each trial consisted of an arrow cue (200 ms),
cue array (100–500 ms depending on experiment), tracking period (6000 ms), a test
array (until response), and the inter-trial interval (ITI: 500 ms).
Subjects attended to the cued visual field and remembered the identity of the
cued target items. At the onset of the test phase one item was cued by turning red.
Subjects responded whether the cued test item was one of the original target items or
not by a button press (same vs. different). Subjects were instructed to make a button
press as accurately as possible. Item movements were randomized between the trials
and occlusion was possible. Subjects tracked under 3 conditions ( 2 targets, 3 targets,
4 targets), and all conditions were intermixed within blocks. All subjects completed
a total of eight blocks of 100 trials each, resulting in 200 trials per condition.
76
3.3.4. Motion Parameters
The direction of motion varied randomly, and the annuli bounced off the border
of the viewing area, but not off of each other (brief occlusion possible). The speed
of motion varied from 0.25 to 1.86 of visual angle per second with an average of
1◦/s. Motion trajectory was linear and changed at random intervals or when the
object made contact with the (invisible) outer barrier of the viewing area. Several of
these parameters were modified slightly in the subsequent experiments in chapters 4
and 5. In particular, the circles bounced off (no occlusion) of each other when they
made contact, vibrated in place, moved together, or other modulation of movement
parameters which will be explicated further in the relevant chapter. These changes
made no observable difference in the ERP data or behavioral performance between
experiments for baseline conditions.
3.3.5. Measuring Tracking Capacity
The formula of Scholl et al. (2001) was used to derive the effective number of
objects tracked: M = n(2P ) , where M is the effective number of objects tracked,
n is the number of targets, and P is the empirically observed proportion of correct
answers.
3.3.6. Electrophysiological Recording and Analysis
ERPs were recorded in each experiment using our standard recording and
analysis procedures, including rejection of trials contaminated by blocking, blinks, or
large (> 1◦ ) eye movements (Vogel et al.,1998; McCollough et al., 2007). EEG was
recorded from 22 tin electrodes mounted in an elastic cap (Electrocap International,
Eaton, OH) using the International 10/20 System.10/20 sites F3, FZ, F4, T3, C3,
77

CZ, C4, T4, P3, PZ, P4, T5, T6, O1, and O2 were used along with five nonstandard
sites: OL midway between T5 and O1; OR midway betweenT6 and O2; PO3 midway
between P3 and OL; PO4 midway between P4 and OR; andPOz midway between PO3
and PO4. All sites were recoded with a left-mastoid reference, and the data were re-
referenced off-line to the algebraic average of the left and right mastoids. Horizontal
electrooculogram (EOG) was recorded from electrodes placed ∼1 cm to the left and
right of the external canthi of each eye to measure horizontal eye movements. To
detect blinks, vertical EOG was recorded from an electrode mounted beneath the left
eye and referenced to the left mastoid. Subjects with trial rejection rates 30% were
excluded from the sample. Contralateral waveforms were computed by averaging the
activity re- corded over the right hemisphere when subjects tracked items in the array
at the left side of screen. Contralateral tracking activity was measured at posterior
parietal, lateral occipital, posterior temporal,parietal, and occipital electrode sites as
the difference in mean amplitude between the ipsilateral and contralateral waveforms.
Five temporal measurement windows were used for analysis of ERP components,
specifically the N2pc, CDA, and tracking activity. These temporal windows were 150
–200 ms, 300–600ms and 800–1000ms post-stimulus onset.
3.4. Results
3.4.1. Behavior
Behavioral performance within multiple object tracking was measured with
accuracy at each set size. The data displayed in 3.3. on page 79 show the results
for 24 subjects for each set size, 1, 3, and 3 grouped targets (SS1 M = 0.79, SE =
0.02, SS3 M = 0.63, SE =.02, SSG M =0.68, SE =.02 ). As can be seen in 3.3. on
page 79 performance was best for tracking a single item, worst for 3 items, and in
78

between for 3 items grouped, demonstrating an apparent performance enhancement
when tracked items had at one point in their trajectory been grouped with each other.
These results were confirmed with a repeated measures ANOVA which demonstrated
a main effect of set size (F (2,46) = 78.558, p< .05). Planned comparison revealed a
large and reliable difference between set size one and three (t(23)=10.54, p <0.001)
and between three targets and three grouped (t(23)=4.64, p <0.001).
0.5
0.6
0.7
0.8
0.9
1.0
Condition
Acc
urac
y
ss1 ss3 ss1G
●
●
●
Experiment 2
FIGURE 3.3. Experiment 2 Behavioral Performance
79

3.4.2. Electrophysiology
Two hundred milliseconds after the onset of the cue array we observed a
transient negative going waveform over the hemisphere that was contralateral to the
attended hemifield. This activity was followed by a larger and sustained activity
which lasted the duration of the stationary cue phase. Following motion onset
this contralateral sustained activity further increased in amplitude and maintained
throughout the duration of the trial until the test was presented. This pattern of
activity corresponded closely to ERP waveforms previously reported (Drew & Vogel,
2008).
Analysis were performed over five time windows within each trial: an early cue phase,
late cue phase, early tracking phase, late tracking phase. These time windows are
termed N2pc, Early CDA, Late CDA, Fade, and MOT, corresponding to 150–200
ms, 200–300 ms, 300–700ms, 700–1200 ms, and 1200–2200 ms post-stimulus onset.
Amplitude of the negative-going amplitudes are shown in 3.4. on page 82. The
transient activity during the cue phase was primarily located over posterior electrodes,
and maximally over lateral occipital electrodes (OL/OR). The sustained activity
during the cue phase was broadly distributed over the posterior electrode sites with a
maximum over posterior parietal electrodes (P03/P04). The sustained activity during
the early tracking phase was significantly modulated by set size as well as by presence
of grouping lines, such that the amplitude of waveform when there were three joined
targets being tracked was less than that of three targets not so joined, yet greater
than one item tracked alone. In order to better view this differences, difference waves
were constructed by subtracting the ipsiliateral waveforms from the contralateral
waveforms for electrodes F3/F4;C3/C4;P3/P4;O1/O2; OL/OR; T5/T6;PO3/PO4.
See 3.5. on page 83.
80
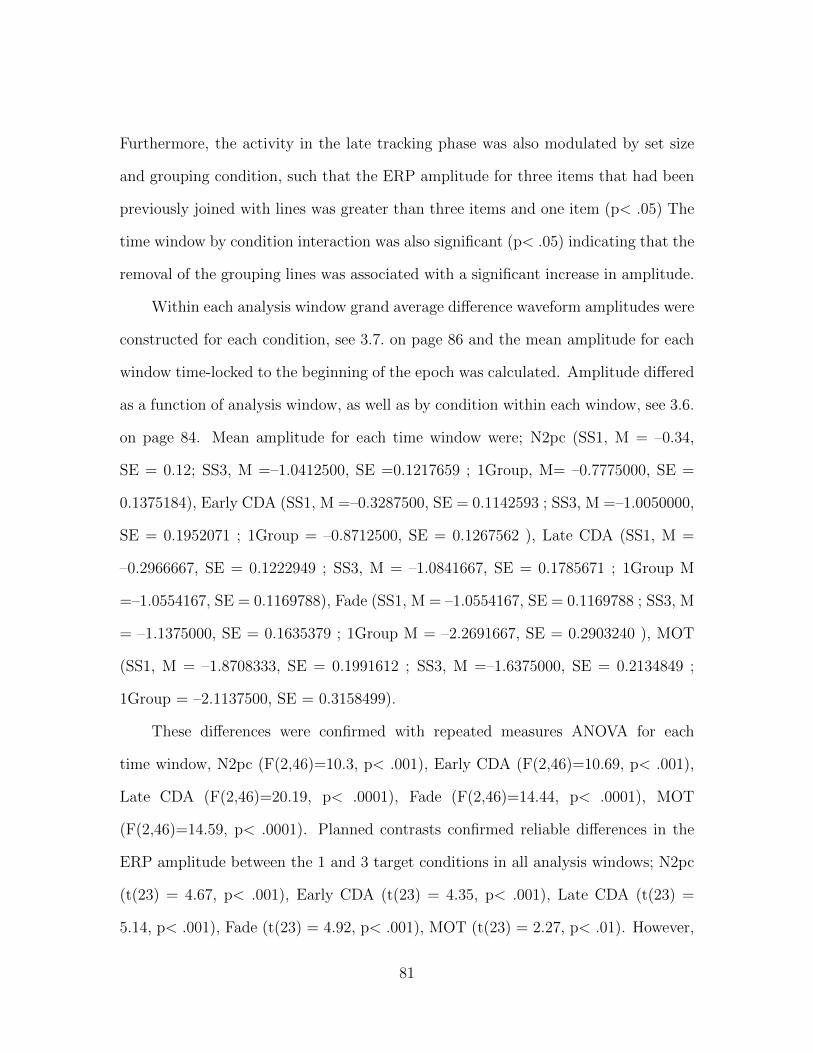
Furthermore, the activity in the late tracking phase was also modulated by set size
and grouping condition, such that the ERP amplitude for three items that had been
previously joined with lines was greater than three items and one item (p< .05) The
time window by condition interaction was also significant (p< .05) indicating that the
removal of the grouping lines was associated with a significant increase in amplitude.
Within each analysis window grand average difference waveform amplitudes were
constructed for each condition, see 3.7. on page 86 and the mean amplitude for each
window time-locked to the beginning of the epoch was calculated. Amplitude differed
as a function of analysis window, as well as by condition within each window, see 3.6.
on page 84. Mean amplitude for each time window were; N2pc (SS1, M = –0.34,
SE = 0.12; SS3, M =–1.0412500, SE =0.1217659 ; 1Group, M= –0.7775000, SE =
0.1375184), Early CDA (SS1, M =–0.3287500, SE = 0.1142593 ; SS3, M =–1.0050000,
SE = 0.1952071 ; 1Group = –0.8712500, SE = 0.1267562 ), Late CDA (SS1, M =
–0.2966667, SE = 0.1222949 ; SS3, M = –1.0841667, SE = 0.1785671 ; 1Group M
=–1.0554167, SE = 0.1169788), Fade (SS1, M = –1.0554167, SE = 0.1169788 ; SS3, M
= –1.1375000, SE = 0.1635379 ; 1Group M = –2.2691667, SE = 0.2903240 ), MOT
(SS1, M = –1.8708333, SE = 0.1991612 ; SS3, M =–1.6375000, SE = 0.2134849 ;
1Group = –2.1137500, SE = 0.3158499).
These differences were confirmed with repeated measures ANOVA for each
time window, N2pc (F(2,46)=10.3, p< .001), Early CDA (F(2,46)=10.69, p< .001),
Late CDA (F(2,46)=20.19, p< .0001), Fade (F(2,46)=14.44, p< .0001), MOT
(F(2,46)=14.59, p< .0001). Planned contrasts confirmed reliable differences in the
ERP amplitude between the 1 and 3 target conditions in all analysis windows; N2pc
(t(23) = 4.67, p< .001), Early CDA (t(23) = 4.35, p< .001), Late CDA (t(23) =
5.14, p< .001), Fade (t(23) = 4.92, p< .001), MOT (t(23) = 2.27, p< .01). However,
81
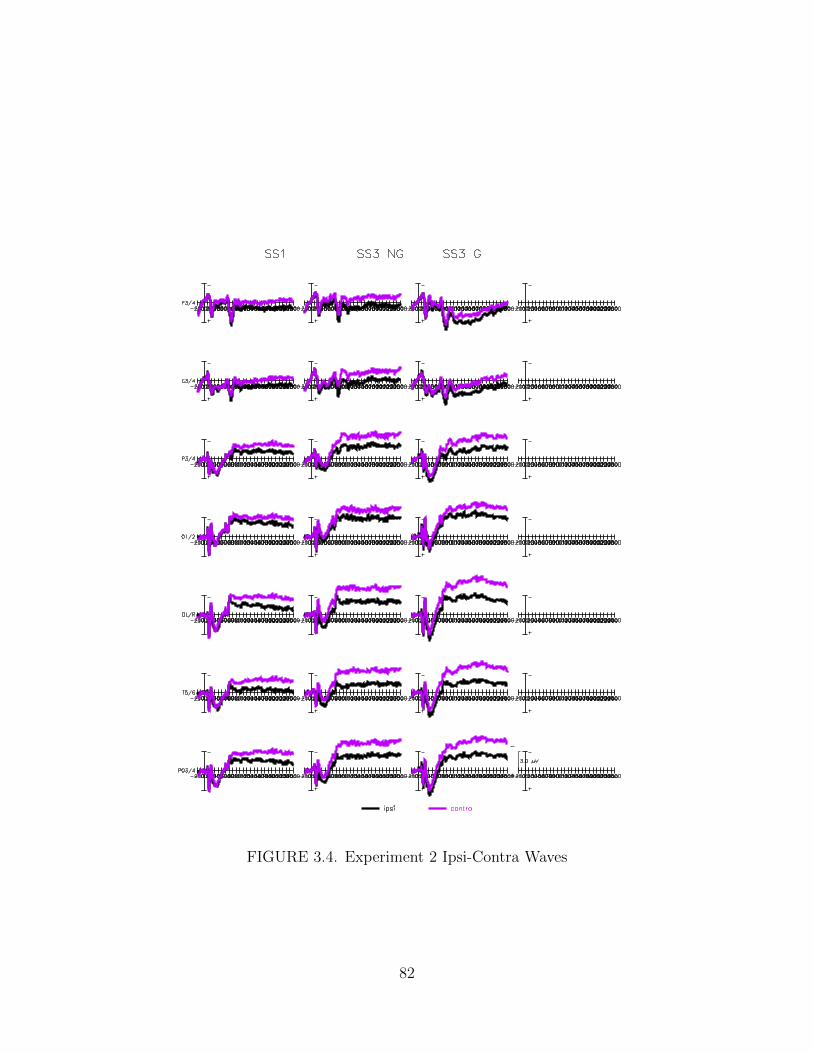
FIGURE 3.4. Experiment 2 Ipsi-Contra Waves
82

FIGURE 3.5. Experiment 2 Difference Waves
83
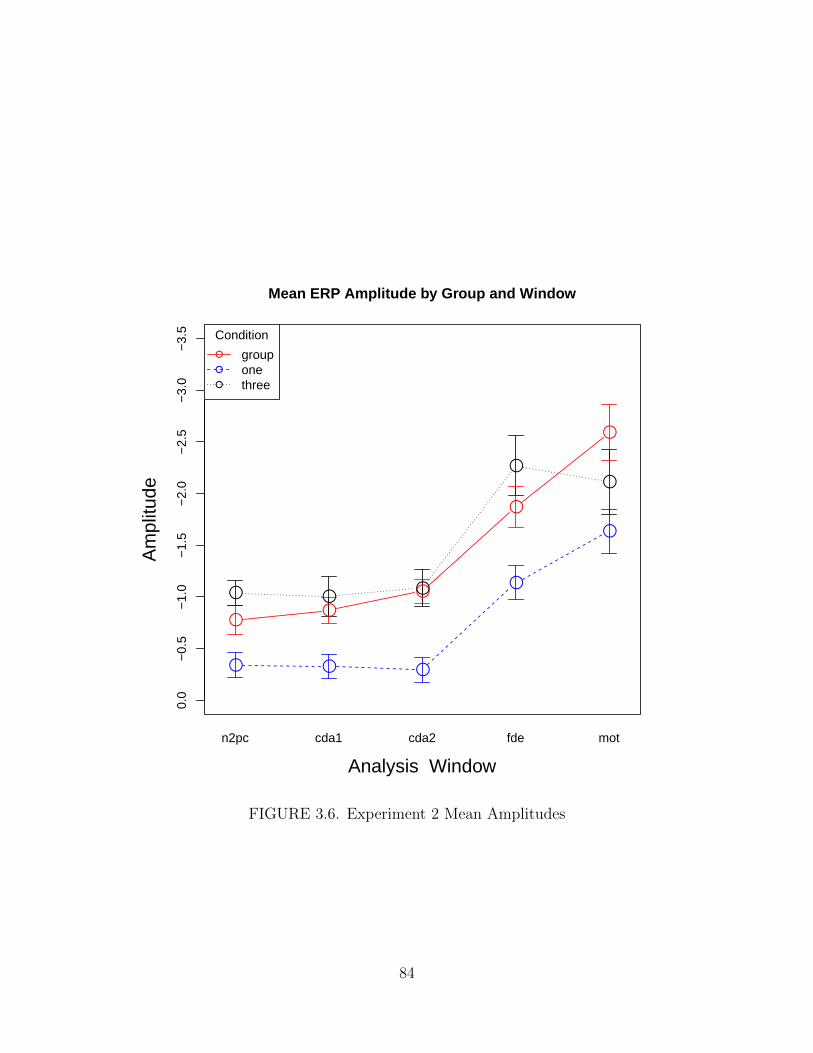
0.0
−0.
5−
1.0
−1.
5−
2.0
−2.
5−
3.0
−3.
5
Mean ERP Amplitude by Group and Window
Analysis Window
Am
plitu
de
n2pc cda1 cda2 fde mot
●●
●
●
●
● ● ●
●
●
● ●●
●●
●
●
●
Condition
grouponethree
FIGURE 3.6. Experiment 2 Mean Amplitudes
84
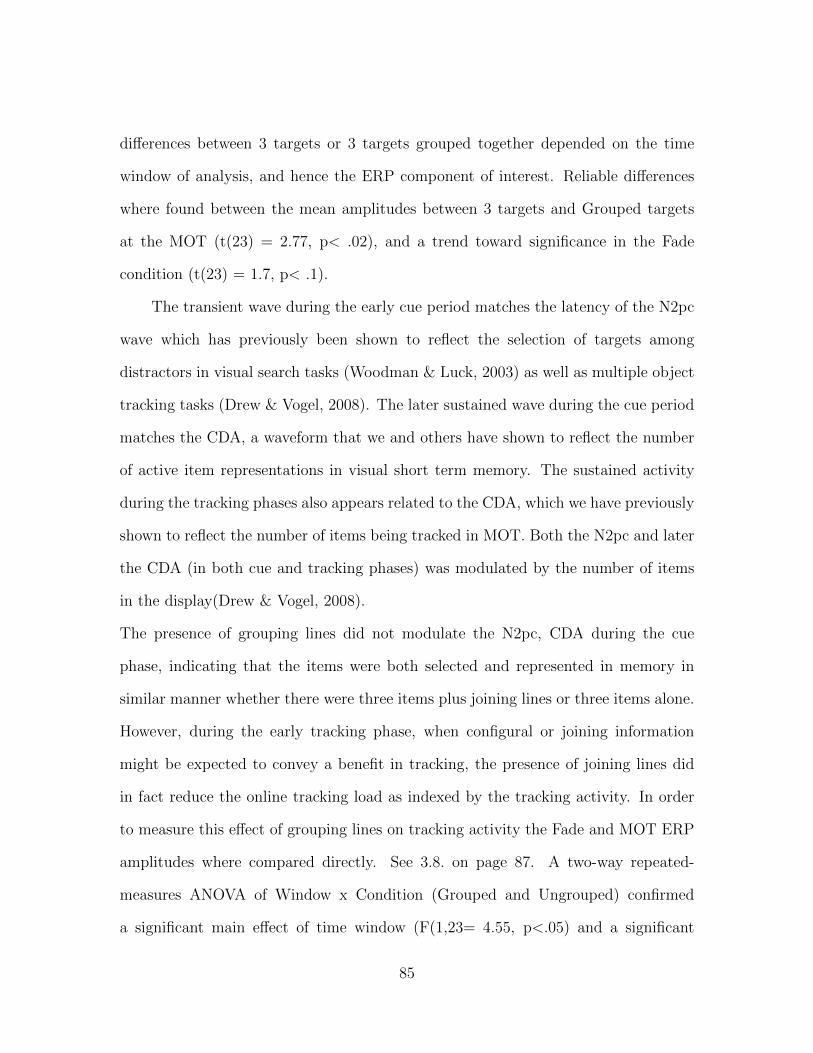
differences between 3 targets or 3 targets grouped together depended on the time
window of analysis, and hence the ERP component of interest. Reliable differences
where found between the mean amplitudes between 3 targets and Grouped targets
at the MOT (t(23) = 2.77, p< .02), and a trend toward significance in the Fade
condition (t(23) = 1.7, p< .1).
The transient wave during the early cue period matches the latency of the N2pc
wave which has previously been shown to reflect the selection of targets among
distractors in visual search tasks (Woodman & Luck, 2003) as well as multiple object
tracking tasks (Drew & Vogel, 2008). The later sustained wave during the cue period
matches the CDA, a waveform that we and others have shown to reflect the number
of active item representations in visual short term memory. The sustained activity
during the tracking phases also appears related to the CDA, which we have previously
shown to reflect the number of items being tracked in MOT. Both the N2pc and later
the CDA (in both cue and tracking phases) was modulated by the number of items
in the display(Drew & Vogel, 2008).
The presence of grouping lines did not modulate the N2pc, CDA during the cue
phase, indicating that the items were both selected and represented in memory in
similar manner whether there were three items plus joining lines or three items alone.
However, during the early tracking phase, when configural or joining information
might be expected to convey a benefit in tracking, the presence of joining lines did
in fact reduce the online tracking load as indexed by the tracking activity. In order
to measure this effect of grouping lines on tracking activity the Fade and MOT ERP
amplitudes where compared directly. See 3.8. on page 87. A two-way repeated-
measures ANOVA of Window x Condition (Grouped and Ungrouped) confirmed
a significant main effect of time window (F(1,23= 4.55, p<.05) and a significant
85
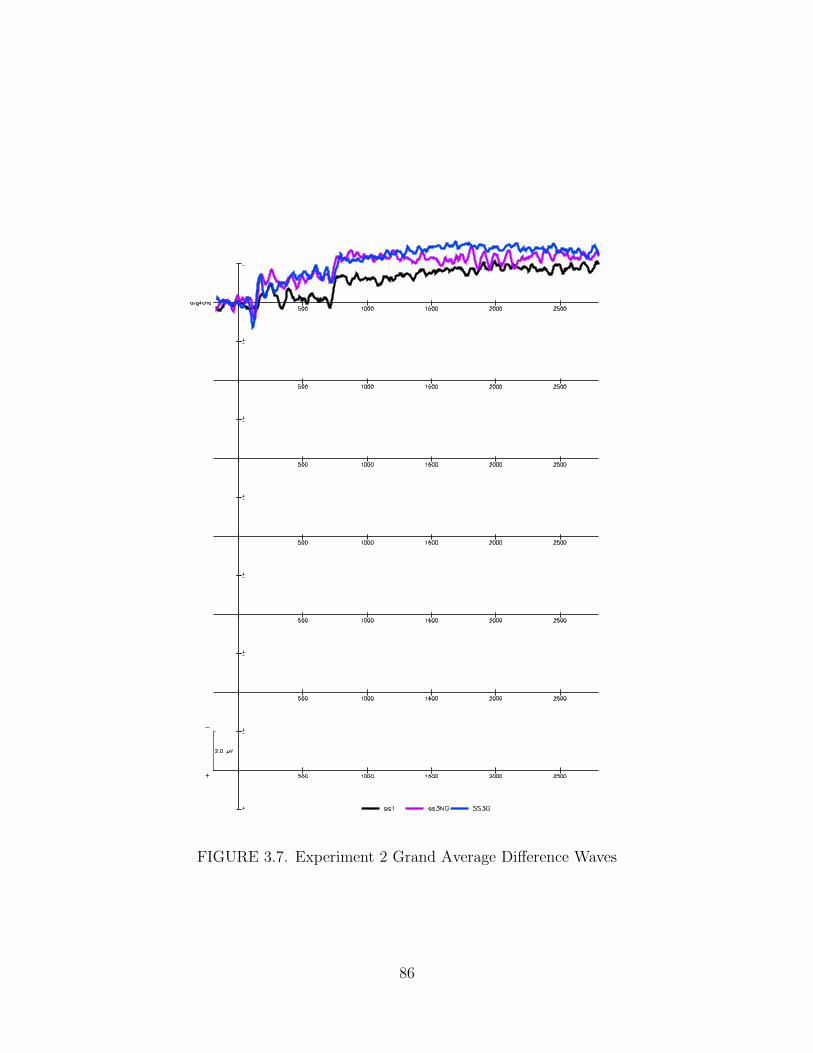
FIGURE 3.7. Experiment 2 Grand Average Difference Waves
86
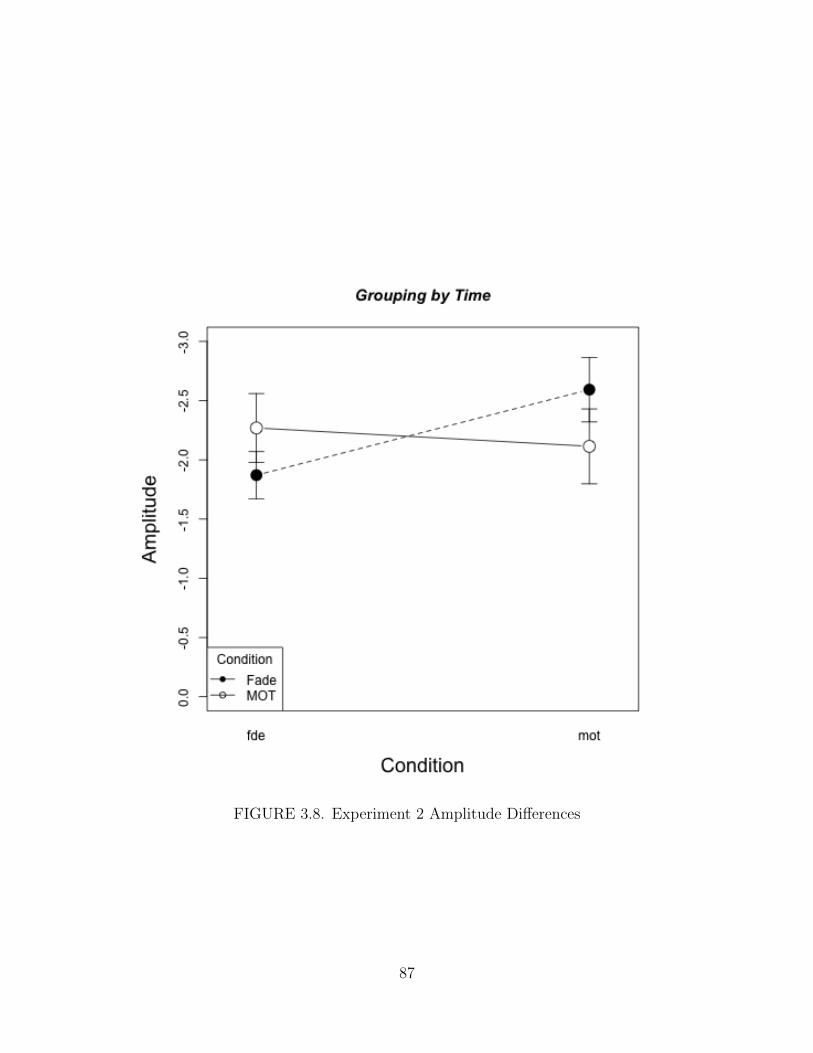
FIGURE 3.8. Experiment 2 Amplitude Differences
87
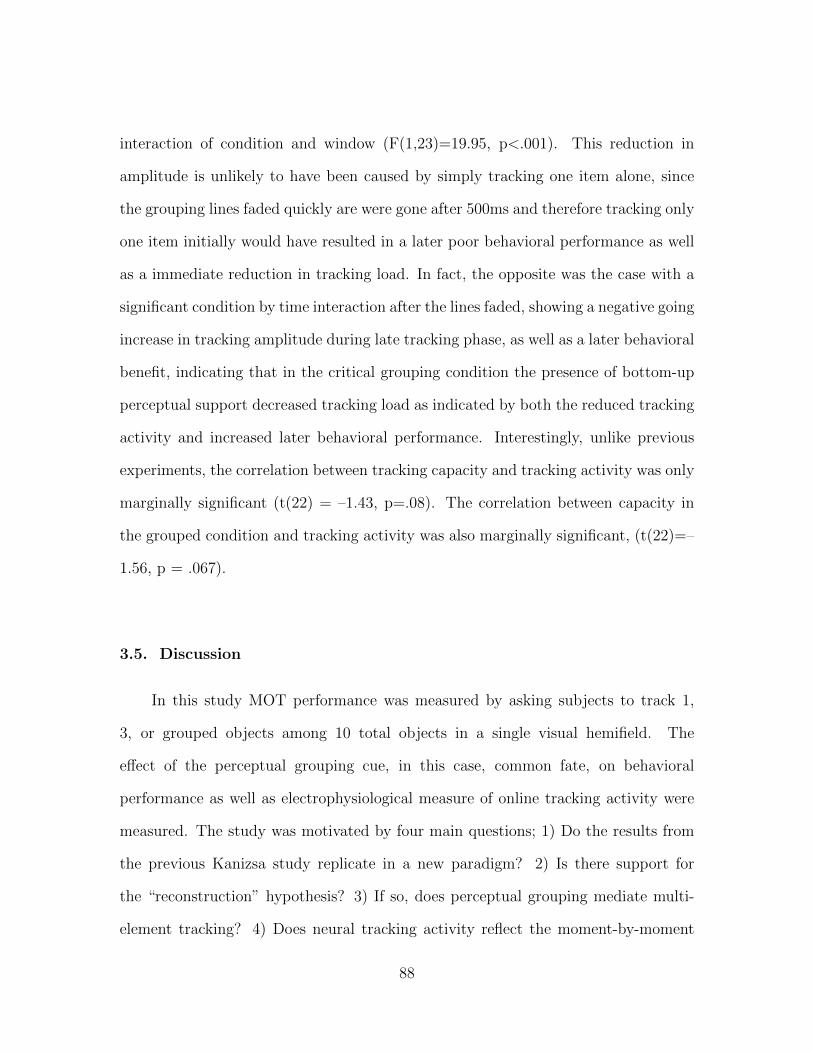
interaction of condition and window (F(1,23)=19.95, p<.001). This reduction in
amplitude is unlikely to have been caused by simply tracking one item alone, since
the grouping lines faded quickly are were gone after 500ms and therefore tracking only
one item initially would have resulted in a later poor behavioral performance as well
as a immediate reduction in tracking load. In fact, the opposite was the case with a
significant condition by time interaction after the lines faded, showing a negative going
increase in tracking amplitude during late tracking phase, as well as a later behavioral
benefit, indicating that in the critical grouping condition the presence of bottom-up
perceptual support decreased tracking load as indicated by both the reduced tracking
activity and increased later behavioral performance. Interestingly, unlike previous
experiments, the correlation between tracking capacity and tracking activity was only
marginally significant (t(22) = –1.43, p=.08). The correlation between capacity in
the grouped condition and tracking activity was also marginally significant, (t(22)=–
1.56, p = .067).
3.5. Discussion
In this study MOT performance was measured by asking subjects to track 1,
3, or grouped objects among 10 total objects in a single visual hemifield. The
effect of the perceptual grouping cue, in this case, common fate, on behavioral
performance as well as electrophysiological measure of online tracking activity were
measured. The study was motivated by four main questions; 1) Do the results from
the previous Kanizsa study replicate in a new paradigm? 2) Is there support for
the “reconstruction” hypothesis? 3) If so, does perceptual grouping mediate multi-
element tracking? 4) Does neural tracking activity reflect the moment-by-moment
88
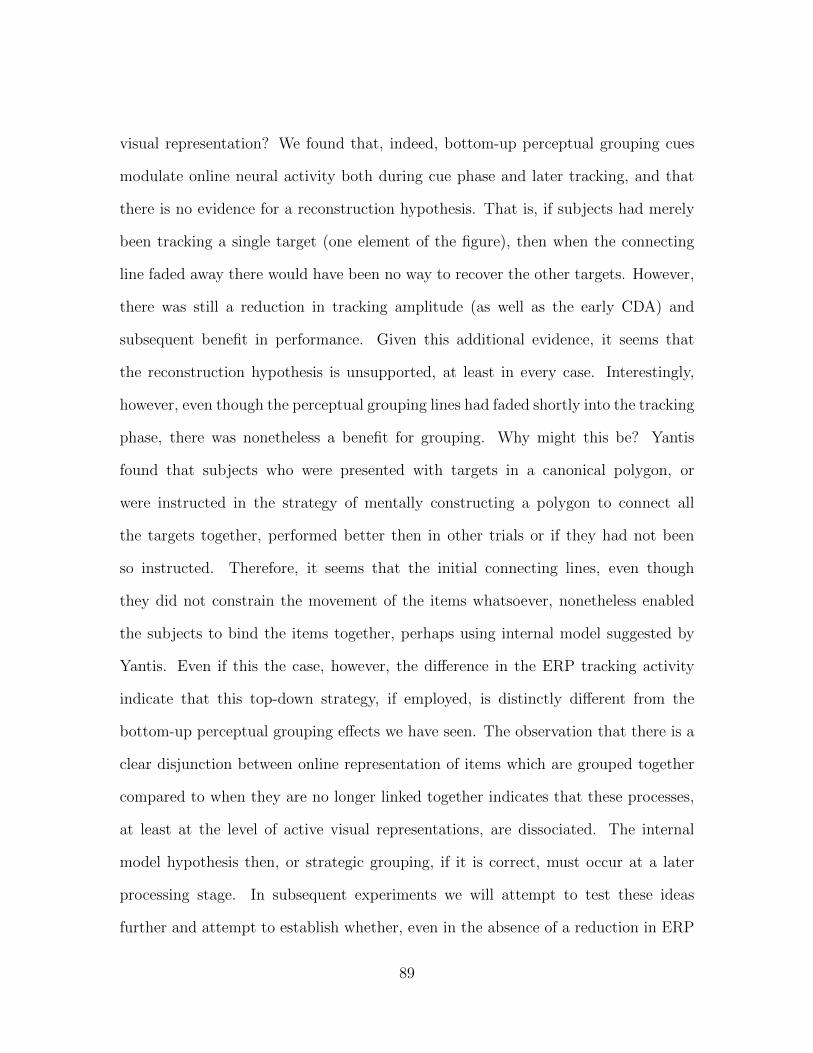
visual representation? We found that, indeed, bottom-up perceptual grouping cues
modulate online neural activity both during cue phase and later tracking, and that
there is no evidence for a reconstruction hypothesis. That is, if subjects had merely
been tracking a single target (one element of the figure), then when the connecting
line faded away there would have been no way to recover the other targets. However,
there was still a reduction in tracking amplitude (as well as the early CDA) and
subsequent benefit in performance. Given this additional evidence, it seems that
the reconstruction hypothesis is unsupported, at least in every case. Interestingly,
however, even though the perceptual grouping lines had faded shortly into the tracking
phase, there was nonetheless a benefit for grouping. Why might this be? Yantis
found that subjects who were presented with targets in a canonical polygon, or
were instructed in the strategy of mentally constructing a polygon to connect all
the targets together, performed better then in other trials or if they had not been
so instructed. Therefore, it seems that the initial connecting lines, even though
they did not constrain the movement of the items whatsoever, nonetheless enabled
the subjects to bind the items together, perhaps using internal model suggested by
Yantis. Even if this the case, however, the difference in the ERP tracking activity
indicate that this top-down strategy, if employed, is distinctly different from the
bottom-up perceptual grouping effects we have seen. The observation that there is a
clear disjunction between online representation of items which are grouped together
compared to when they are no longer linked together indicates that these processes,
at least at the level of active visual representations, are dissociated. The internal
model hypothesis then, or strategic grouping, if it is correct, must occur at a later
processing stage. In subsequent experiments we will attempt to test these ideas
further and attempt to establish whether, even in the absence of a reduction in ERP
89

activity a benefit of ongoing perceptual support, as distinct from perceptual grouping,
is supported. An alternative explanation is that, perhaps it was not the establishment
of an internal representation of a polygon which mediated the enhanced behavior, but
rather that the bottom-up grouping cues tagged the targets during the early phase of
tracking, essentially prolonging the selection or cue phase and providing an attentional
buffer against distractors during early tracking. This hypothesis substitutes top-
down modeling of the stimuli for bottom-up, stimulus driven processes. If this is
the case, then manipulation of the grouping cues may allow us to further dissect
this process. For example, through manipulation of perceptual grouping cues such
as common fate or proximity. As an interesting aside, even though there were more
visual elements on the screen in the grouped condition, online activity was actually
less then when the subjects were tracking ungrouped targets. This indicates that it
is not the number or amount of visual elements per se that drive the component and
by implication, the active visual representation, but the subjective percept. Here,
we investigated whether a real or virtual polygons between targets in a tracking
task would enhance behavioral performance and reduce tracking load (as indexed by
a reduction in amplitude of the CDA). We found that the the presence of actual
grouping lines connecting the three targets in a MOT task reduced tracking load
when the lines were present as compared to when they were absent, as indexed by the
tracking activity and behavioral performance. These results suggest that perceptual
grouping does indeed play a role in tracking, but this role may be primarily restricted
to situations when there are strong bottom-up cues for grouping the objects together,
rather than as the default mode of tracking.
90
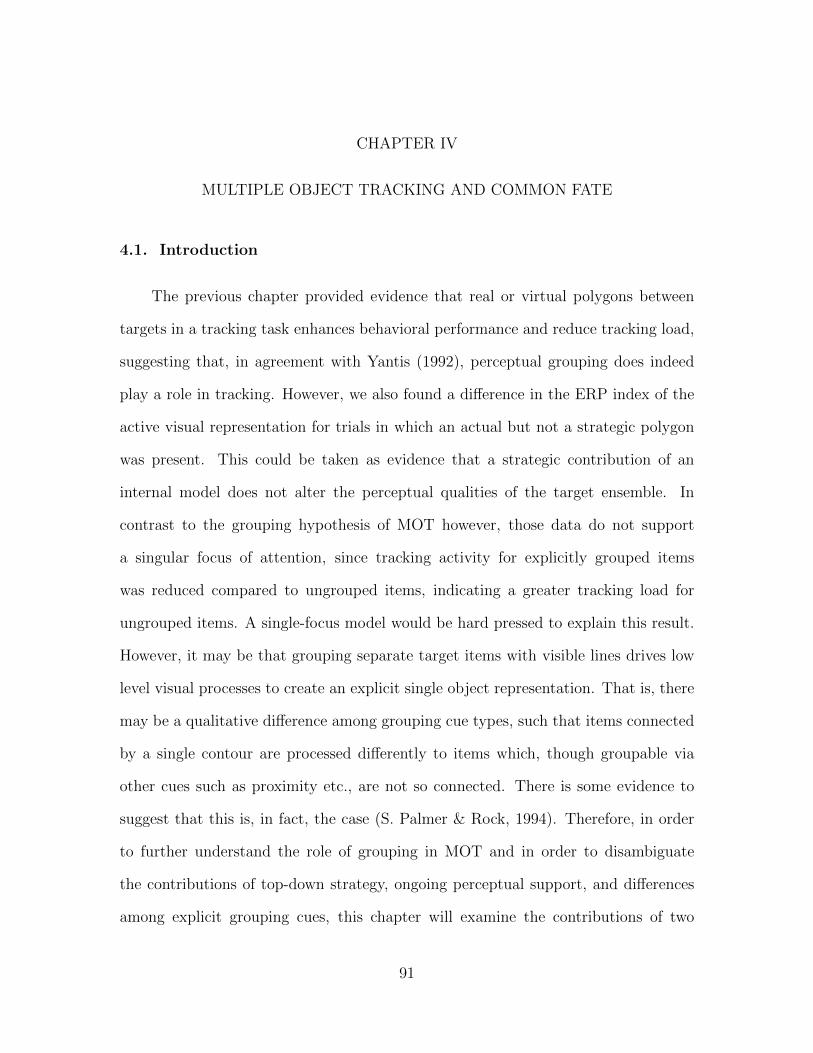
CHAPTER IV
MULTIPLE OBJECT TRACKING AND COMMON FATE
4.1. Introduction
The previous chapter provided evidence that real or virtual polygons between
targets in a tracking task enhances behavioral performance and reduce tracking load,
suggesting that, in agreement with Yantis (1992), perceptual grouping does indeed
play a role in tracking. However, we also found a difference in the ERP index of the
active visual representation for trials in which an actual but not a strategic polygon
was present. This could be taken as evidence that a strategic contribution of an
internal model does not alter the perceptual qualities of the target ensemble. In
contrast to the grouping hypothesis of MOT however, those data do not support
a singular focus of attention, since tracking activity for explicitly grouped items
was reduced compared to ungrouped items, indicating a greater tracking load for
ungrouped items. A single-focus model would be hard pressed to explain this result.
However, it may be that grouping separate target items with visible lines drives low
level visual processes to create an explicit single object representation. That is, there
may be a qualitative difference among grouping cue types, such that items connected
by a single contour are processed differently to items which, though groupable via
other cues such as proximity etc., are not so connected. There is some evidence to
suggest that this is, in fact, the case (S. Palmer & Rock, 1994). Therefore, in order
to further understand the role of grouping in MOT and in order to disambiguate
the contributions of top-down strategy, ongoing perceptual support, and differences
among explicit grouping cues, this chapter will examine the contributions of two
91
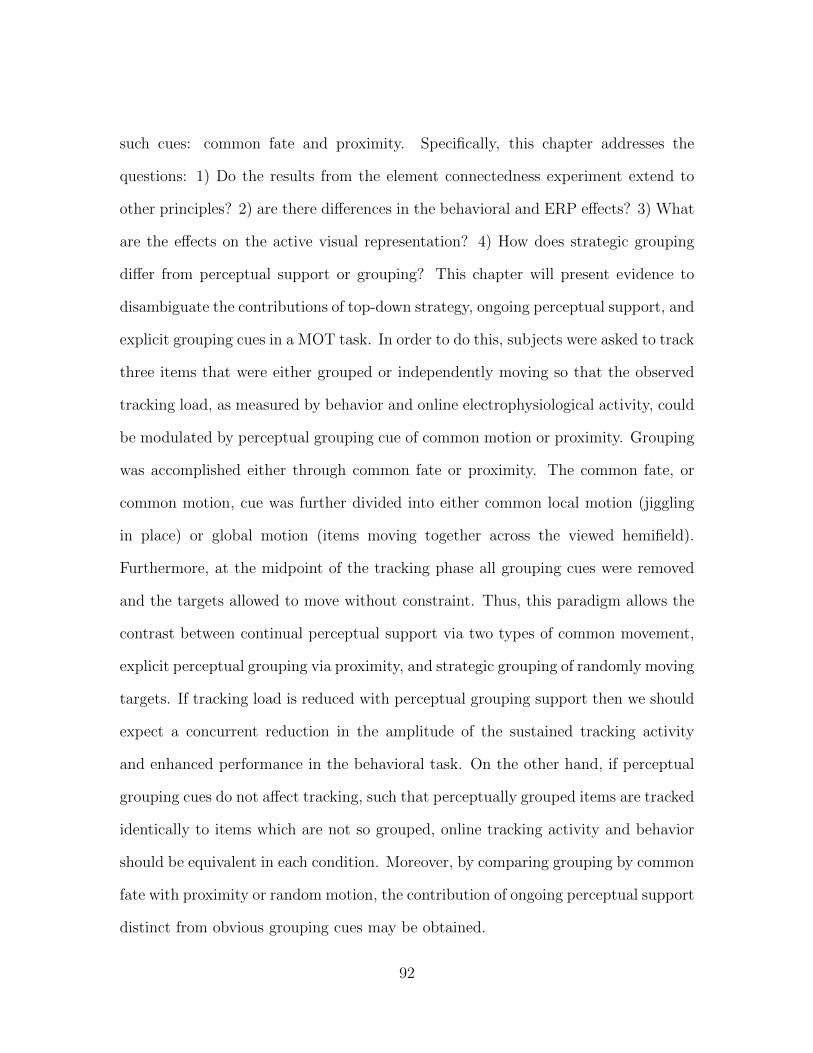
such cues: common fate and proximity. Specifically, this chapter addresses the
questions: 1) Do the results from the element connectedness experiment extend to
other principles? 2) are there differences in the behavioral and ERP effects? 3) What
are the effects on the active visual representation? 4) How does strategic grouping
differ from perceptual support or grouping? This chapter will present evidence to
disambiguate the contributions of top-down strategy, ongoing perceptual support, and
explicit grouping cues in a MOT task. In order to do this, subjects were asked to track
three items that were either grouped or independently moving so that the observed
tracking load, as measured by behavior and online electrophysiological activity, could
be modulated by perceptual grouping cue of common motion or proximity. Grouping
was accomplished either through common fate or proximity. The common fate, or
common motion, cue was further divided into either common local motion (jiggling
in place) or global motion (items moving together across the viewed hemifield).
Furthermore, at the midpoint of the tracking phase all grouping cues were removed
and the targets allowed to move without constraint. Thus, this paradigm allows the
contrast between continual perceptual support via two types of common movement,
explicit perceptual grouping via proximity, and strategic grouping of randomly moving
targets. If tracking load is reduced with perceptual grouping support then we should
expect a concurrent reduction in the amplitude of the sustained tracking activity
and enhanced performance in the behavioral task. On the other hand, if perceptual
grouping cues do not affect tracking, such that perceptually grouped items are tracked
identically to items which are not so grouped, online tracking activity and behavior
should be equivalent in each condition. Moreover, by comparing grouping by common
fate with proximity or random motion, the contribution of ongoing perceptual support
distinct from obvious grouping cues may be obtained.
92
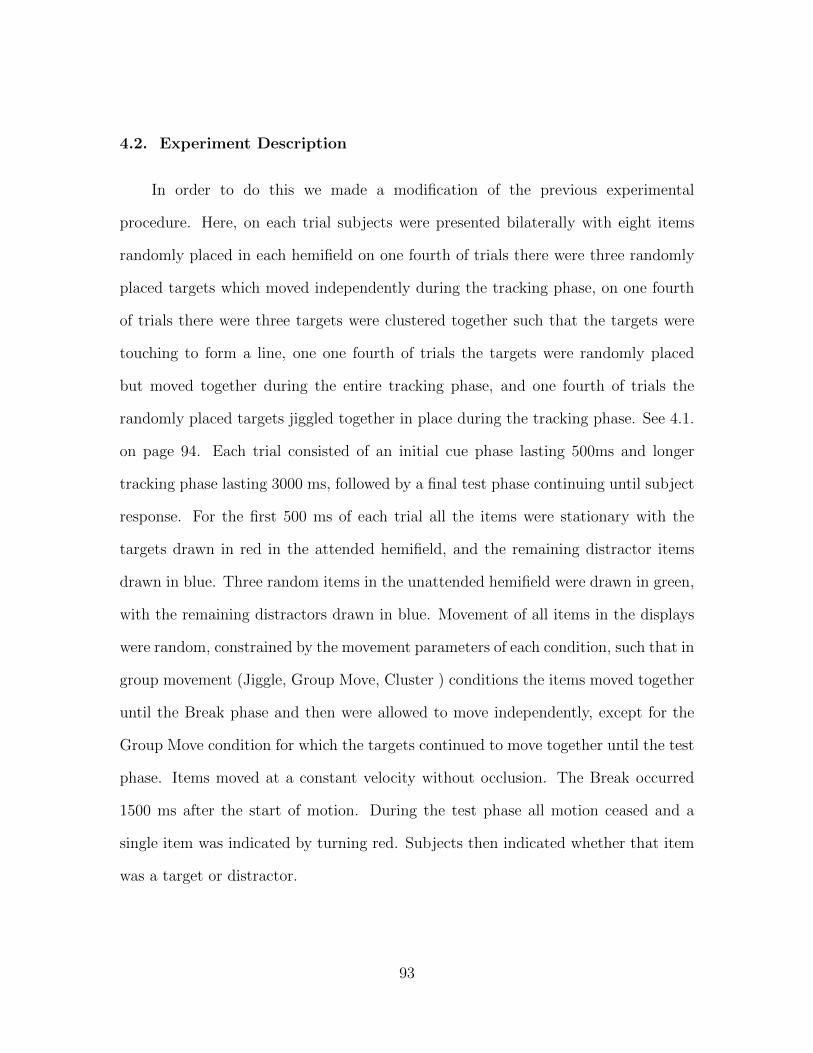
4.2. Experiment Description
In order to do this we made a modification of the previous experimental
procedure. Here, on each trial subjects were presented bilaterally with eight items
randomly placed in each hemifield on one fourth of trials there were three randomly
placed targets which moved independently during the tracking phase, on one fourth
of trials there were three targets were clustered together such that the targets were
touching to form a line, one one fourth of trials the targets were randomly placed
but moved together during the entire tracking phase, and one fourth of trials the
randomly placed targets jiggled together in place during the tracking phase. See 4.1.
on page 94. Each trial consisted of an initial cue phase lasting 500ms and longer
tracking phase lasting 3000 ms, followed by a final test phase continuing until subject
response. For the first 500 ms of each trial all the items were stationary with the
targets drawn in red in the attended hemifield, and the remaining distractor items
drawn in blue. Three random items in the unattended hemifield were drawn in green,
with the remaining distractors drawn in blue. Movement of all items in the displays
were random, constrained by the movement parameters of each condition, such that in
group movement (Jiggle, Group Move, Cluster ) conditions the items moved together
until the Break phase and then were allowed to move independently, except for the
Group Move condition for which the targets continued to move together until the test
phase. Items moved at a constant velocity without occlusion. The Break occurred
1500 ms after the start of motion. During the test phase all motion ceased and a
single item was indicated by turning red. Subjects then indicated whether that item
was a target or distractor.
93

E�ect of Grouping
MOT Grouping E�ects
Group Move Cluster Jitter
Random
FIGURE 4.1. Experiment 3 Paradigm
94
4.3. Methods
4.3.1. Paricipants
Neurologically normal participants (17 subjects) from the Eugene, OR
community gave informed consent according to procedures approved by the University
of Oregon institutional review board. Three subjects were rejected from analysis
utilizing the criterion previously stated in Experiment 2.
4.3.2. Stimulus and procedure
The general procedure for stimulus presentation and parameters as well as EEG
recording, measurement and analysis for this experiment was identical to Experiment
2. See Figure 4.1. on page 94 for experiment and condition diagram. This experiment
consisted of four conditions: Random, Cluster, Jiggle, Group. The Random condition
served as a baseline MOT condition in which participants tracked three items among
five distractors. In the Cluster condition three items were placed adjacent to each
other so as to form and apparent dotted line or beads on a string percept. The third
condition consisted of three targets, randomly placed but whose motion was bound
such that they moved in formation, sharing a common group trajectory as if fixed
on the vertices of a randomly generated triangle. The fourth condition, Jiggle, was
similar to the Group condition, except that the bound targets “jiggled” back and forth
in place in a vibratory motion at approximately 20 Hz with a displacement no greater
than 1/2 object diameter. In all conditions the distractors moved randomly. In all
conditions, in the non-tracked hemifield, the differently (green) distractors moved
among blue distractors. Motion for grouped target items the “Jiggle” and “Cluster”
conditions decohered at the midpoint (3000ms), the “break” , in the tracking period.
95
Motion for the other two conditions remained unchanged. Each trial lasted for 3600
ms; for analysis purposes, the EEG data was analyzed for five time windows: 150–
250ms, 250–700ms, 800–1200ms, 2700–3100 ms, and 3400–3600 ms. These correspond
to the N2pc, CDA, and three tracking period time windows: early tracking, late
tracking (after the break), and trailing (the last few ms of the tracking period).
4.4. Results
In the previous experiment we found that the presence of strong bottom-up
perceptual grouping reduced tracking load and increased behavioral performance.
In this experiment we investigate whether other forms of perceptual grouping,
here common motion and proximity, might also reduce tracking load and increase
performance. On each trial subjects were presented bilaterally with eight items
randomly placed in each hemifield, with three targets and the remainder distractors,
on a black background, in one of three conditions. In one third of trials were three
targets which moved randomly after motion onset, on one third of trials there were
three targets placed in a line with edges touching which moved as one item, and
in one third of trial there were three randomly placed items which moved as one
item. Each trial consisted of an initial cue phase lasting 500ms and a longer tracking
phase lasting 3000 ms. For the first 500 ms of each trial, the cue period, all the
items were stationary with a subset of the items, the targets, drawn in red (in the
attended hemifield) while the remaining items in that hemifield, the distractors, were
drawn in blue. In the unattended hemifield a number of items equal to the number
of red targets were drawn in green with the remainder of items rendered in blue.
Following the cue period, all the items turned to white and began moving within
their respective hemifield for 5 seconds, the tracking period. In the random condition
96
all the items moved randomly throughout the entire tracking period. In the cluster
condition, items moved together for 1500ms after which the clustered items broke
apart and began moving separately, thus dividing the tracking period into an early
1500 ms period and a later 1500 ms tracking period. In the group motion condition
all the items continued to move together until the end of the tracking period. In all
conditions the items were tracked for the same duration. At the end of the tracking
period all motion ceased and a single item on the attended side turned red. Subjects
were asked to track the targets and report via button press whether the final red item
was one of the tracked items or not. We asked subjects to track the three targets in
each trial to so that we could determine whether tracking load, as measured by the
ERP index of tracked items, was modulated by the bottom-up perceptual grouping
cues provided by the bottom-up perceptual support either close proximity or group
motion. We time locked to the onset of the cue array and recorded throughout the
duration of the trial until the test array so that we could observe transient selection
of targets, memorial representation of items, tracking during perceptual support, and
tracking after perceptual support.
4.4.1. Behavior
Performance was measured by button press, and as can be seen from Figure 4.2.
on page 98 ), performance was generally high, the average across conditions was
.89, SE = .016, and there were small, if any differences in performance across the
conditions as can be seen from the behavioral performance in Figure 4.2.. This was
confirmed with a one-way repeated measures ANOVA, (F(3,39) = 0.77, p = .52).
Collapsing across conditions by averaging values for Break and Non-break conditions
revealed only a marginal effect of grouping ( t(13)=1.43, p=.088).
97

0.5
0.6
0.7
0.8
0.9
1.0
Condition
Acc
urac
y
b_cl b_rn b_gm b_jt
●●
● ●
Experiment 3 Behavior
FIGURE 4.2. Experiment 3 Behavioral Performance
98
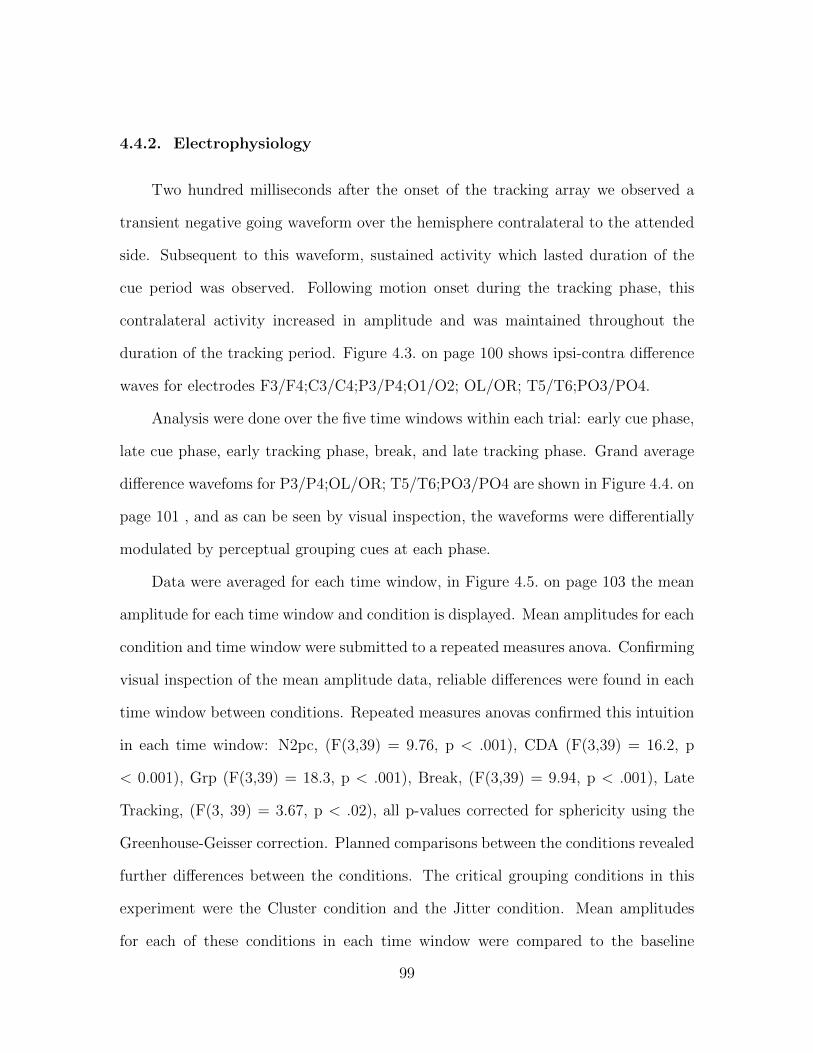
4.4.2. Electrophysiology
Two hundred milliseconds after the onset of the tracking array we observed a
transient negative going waveform over the hemisphere contralateral to the attended
side. Subsequent to this waveform, sustained activity which lasted duration of the
cue period was observed. Following motion onset during the tracking phase, this
contralateral activity increased in amplitude and was maintained throughout the
duration of the tracking period. Figure 4.3. on page 100 shows ipsi-contra difference
waves for electrodes F3/F4;C3/C4;P3/P4;O1/O2; OL/OR; T5/T6;PO3/PO4.
Analysis were done over the five time windows within each trial: early cue phase,
late cue phase, early tracking phase, break, and late tracking phase. Grand average
difference wavefoms for P3/P4;OL/OR; T5/T6;PO3/PO4 are shown in Figure 4.4. on
page 101 , and as can be seen by visual inspection, the waveforms were differentially
modulated by perceptual grouping cues at each phase.
Data were averaged for each time window, in Figure 4.5. on page 103 the mean
amplitude for each time window and condition is displayed. Mean amplitudes for each
condition and time window were submitted to a repeated measures anova. Confirming
visual inspection of the mean amplitude data, reliable differences were found in each
time window between conditions. Repeated measures anovas confirmed this intuition
in each time window: N2pc, (F(3,39) = 9.76, p < .001), CDA (F(3,39) = 16.2, p
< 0.001), Grp (F(3,39) = 18.3, p < .001), Break, (F(3,39) = 9.94, p < .001), Late
Tracking, (F(3, 39) = 3.67, p < .02), all p-values corrected for sphericity using the
Greenhouse-Geisser correction. Planned comparisons between the conditions revealed
further differences between the conditions. The critical grouping conditions in this
experiment were the Cluster condition and the Jitter condition. Mean amplitudes
for each of these conditions in each time window were compared to the baseline
99
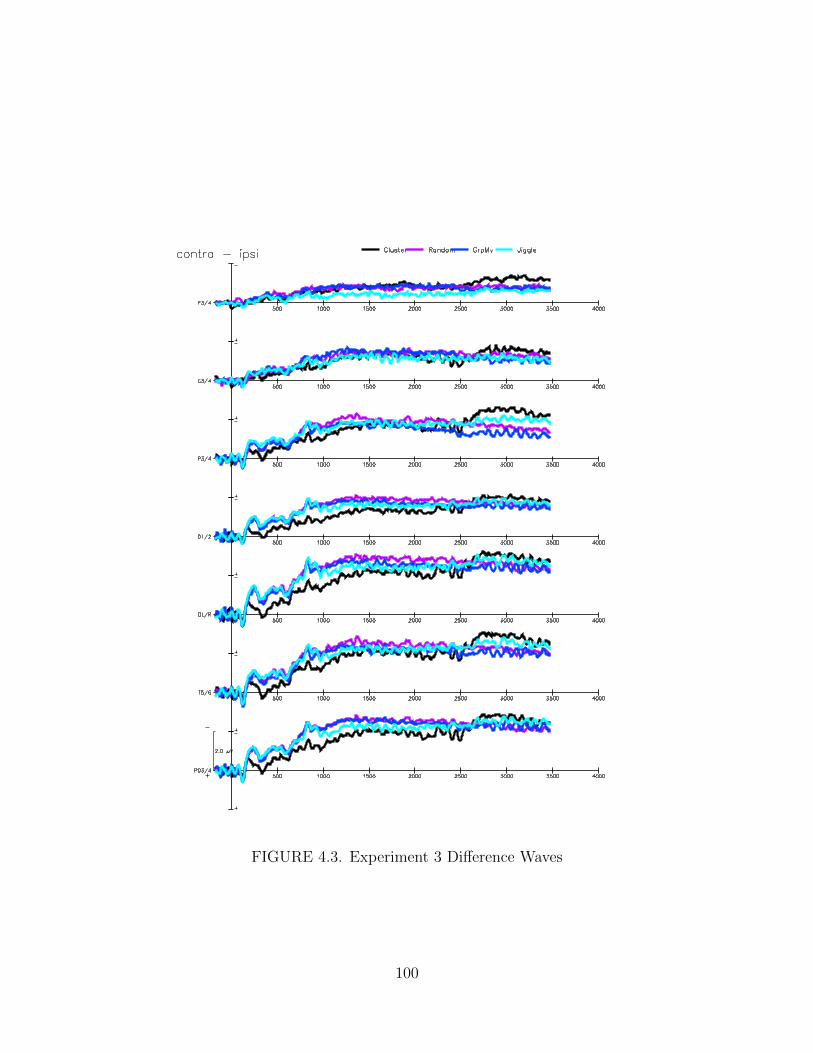
FIGURE 4.3. Experiment 3 Difference Waves
100
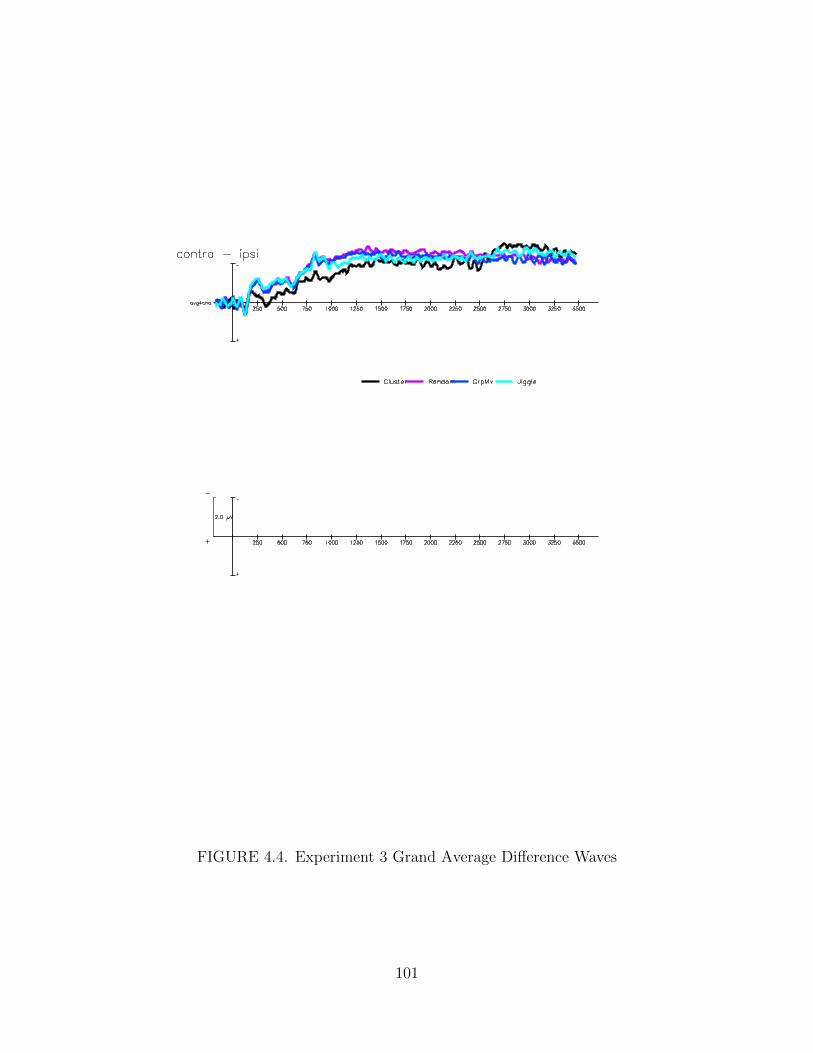
FIGURE 4.4. Experiment 3 Grand Average Difference Waves
101
Random condition. Reliable differences were found between the Cluster condition
and the Random condition in each time window; N2pc, (t(13)=3.52, p <.05), CDA,
(t(13)=6.11, p <.0001), Grp, (t(13)=5,55, p <.0001), Break, (t(13)=5.15, p <.001),
and Late Tracking phase as well, (t(13)=2.24, p <.03). The ERP amplitudes in the
Jitter condition were also compared to the amplitudes in the Random condition for
each time window, however only marginally significant differences were found between
these two conditions in the Break analysis window, (t(13)=2.08, p <.06). However,
reliable differences were found in the Late Tracking window, (t(13)=2.31, p <.05).
In order to better illustrate the differences between baseline and grouping conditions,
difference scores were calculated by subtracting the ERP mean amplitudes in each
grouping condition (Cluster, Jitter, Group Move) from the baseline Random condition
in Figure 4.6. on page 105.
The change in amplitude in the grouping conditions from “grouped” to
“ungrouped” at the Break point was also of interest. In order to examine this
amplitude change, a two-way repeated measures ANOVA with factors of Condition
and Analysis Window (GRP, BRK) was conducted. This analysis revealed a
significant effect of analysis window (F(1, 3) = 59.9, p < .0001), and a significant
interaction between Condition and Window (F(3,39) = 49.47, p < .0001).
Previous MOT studies with ERPs have demonstrated a correlation between
the difference in ERP amplitudes between low and high set size conditions and
tracking performance in these conditions. In addition, enhanced N2pc amplitude
as also been correlated with an increase in tracking performance. Importantly, simple
amplitude of the ERP does not so correlate, rather, it is the difference in amplitude
between set sizes that correlates with performance. Analogous results have also
been demonstrated using the CDA. In this experiment, however, only set sizes of
102
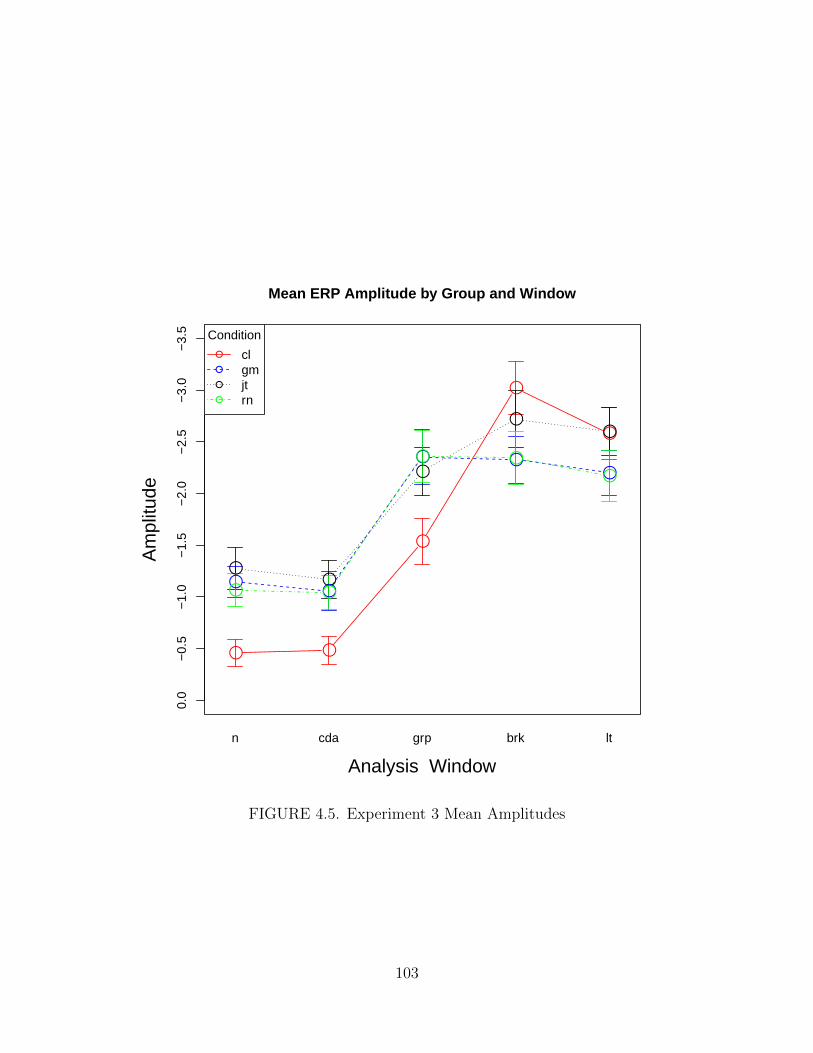
0.0
−0.
5−
1.0
−1.
5−
2.0
−2.
5−
3.0
−3.
5
Mean ERP Amplitude by Group and Window
Analysis Window
Am
plitu
de
n cda grp brk lt
● ●
●
●
●
●●
● ●●
●●
●
●●
● ●
● ●●
●
●
●
●
Condition
clgmjtrn
FIGURE 4.5. Experiment 3 Mean Amplitudes
103
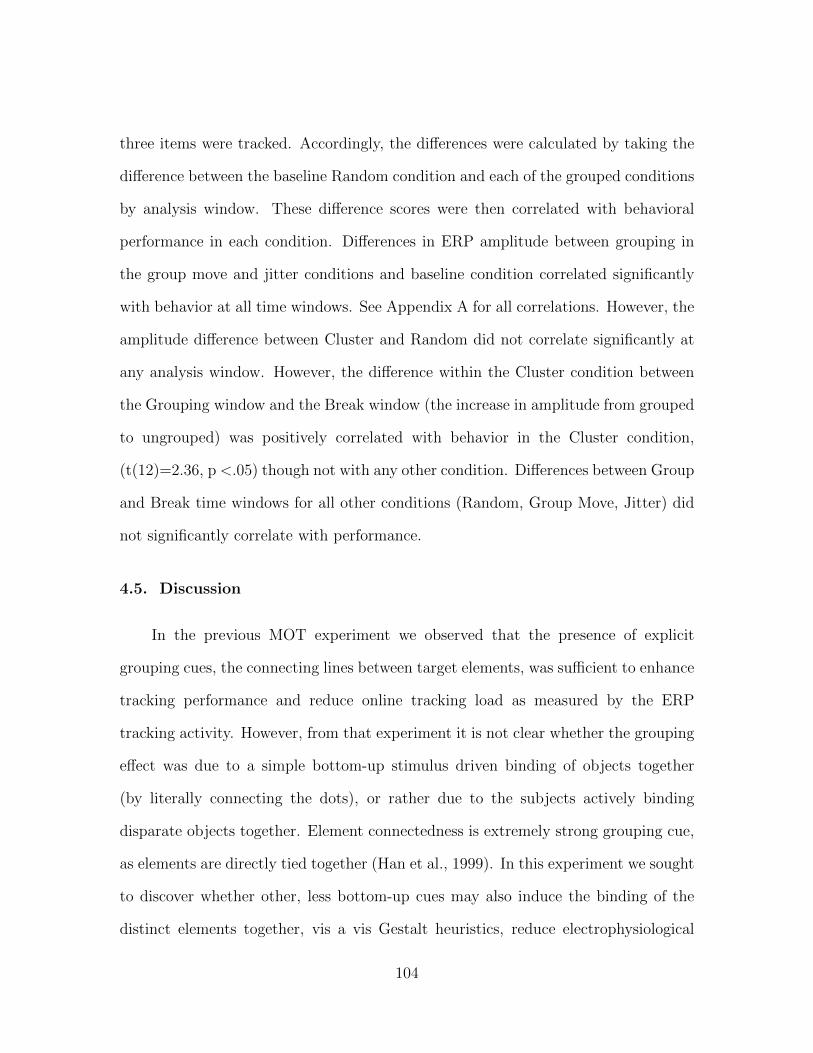
three items were tracked. Accordingly, the differences were calculated by taking the
difference between the baseline Random condition and each of the grouped conditions
by analysis window. These difference scores were then correlated with behavioral
performance in each condition. Differences in ERP amplitude between grouping in
the group move and jitter conditions and baseline condition correlated significantly
with behavior at all time windows. See Appendix A for all correlations. However, the
amplitude difference between Cluster and Random did not correlate significantly at
any analysis window. However, the difference within the Cluster condition between
the Grouping window and the Break window (the increase in amplitude from grouped
to ungrouped) was positively correlated with behavior in the Cluster condition,
(t(12)=2.36, p <.05) though not with any other condition. Differences between Group
and Break time windows for all other conditions (Random, Group Move, Jitter) did
not significantly correlate with performance.
4.5. Discussion
In the previous MOT experiment we observed that the presence of explicit
grouping cues, the connecting lines between target elements, was sufficient to enhance
tracking performance and reduce online tracking load as measured by the ERP
tracking activity. However, from that experiment it is not clear whether the grouping
effect was due to a simple bottom-up stimulus driven binding of objects together
(by literally connecting the dots), or rather due to the subjects actively binding
disparate objects together. Element connectedness is extremely strong grouping cue,
as elements are directly tied together (Han et al., 1999). In this experiment we sought
to discover whether other, less bottom-up cues may also induce the binding of the
distinct elements together, vis a vis Gestalt heuristics, reduce electrophysiological
104
−1.
0−
0.5
0.0
0.5
1.0
ERP Amplitude Differences by Window
Analysis Window
Am
plitu
de
n cda grp brk lt
●●
●
●
●
●●
● ●●
●●
●
●●
●
Condition
rnclrngmrnjt
FIGURE 4.6. Experiment 3 Difference Amplitudes
105
tracking activity or enhance tracking performance. In particular, it should be the
case that if tracking load is reduced by perceptual grouping then we should expect a
concurrent reduction in the amplitude of the sustained tracking activity and enhanced
performance in the behavioral task. On the other hand, if perceptual grouping cues
other than element connectedness do not affect tracking, then online tracking activity
and behavior would be the same in all conditions, since all conditions contained
equivalent numbers of elements. Furthermore, the Group Move condition allowed
us to ask whether, even in the absence of a clear reduction in tracking activity,
performance could be enhanced. First, we found that that strategic grouping, the
Cluster condition, in which the elements moved together in close proximity, was
sufficient to reduce the online electrophysiological activity during cue and tracking
phase, as compared to the Random condition. Though that reduction per se
did not correlate with behavioral differences, and in fact there were no overall
behavioral differences between the conditions, there was a significant correlation
between behavioral performance and degree to which the elements were initially
bound and then unbound. This unbinding effect, in which the amplitude of the
tracking activity increased when motion coherence decreased, was also seen in the
Jitter condition. In this experiment there was no reliable difference in tracking
activity for elements that moved together and for random elements. It may be the
case that the grouping cue was not strong enough to induce this reduction. This
chapter presented evidence to disambiguate the contributions of top-down strategy,
ongoing perceptual support, and explicit grouping cues in a MOT task. Subjects
were asked to track items that were grouped with differing Gestalt cues, or none.
Grouping was accomplished either through common fate or proximity. We found that
separate items which were grouped by proximity demonstrated a marked reduction
106
in online tracking load as indexed by the ERP. Not only that, but when the items
were separated, the amplitude of the tracking waveform increased to that of items
that were individually selected and tracked. The data here support the hypothesis
that there are differences in strategic grouping, such as when a subject deliberately
imagines connecting polygons, compared to bottom-up perceptual grouping in which
Gestalt cues drive subjective perception of an composed object. That evidence is
from two sources: the behavioral benefit in tracking accuracy in the Cluster condition
compared to ungrouped conditions, and the ERP component amplitude in those same
conditions. Specifically, the correlation between electrophysiology and behavior in the
proximity grouping condition, closely spaced yet distinct target items was enhanced
compared to the separate target condition. However, no such differences existed
between the global common motion condition and the ungrouped condition in terms
of tracking activity, suggesting that there were no differences in those conditions in
the active visual representation. Perceptual grouping cues can reduce online tracking
activity and enhance performance, but there are important differences among types of
cues. Explicit spatial cues can quickly segregate targets and cohere initially separate
items into a unified percept. On the other hand, extended temporal or motion
cues may not result in such immediate segregation and grouping, depending on the
cue. Overall, the grouping results from the previous experiments were replicated
and extending with other gestalt cues. Furthermore, the novel “break” time point
demonstrated that perceptual grouping is updateable from moment to moment.
Finally, strategic grouping differs from ongoing perceptual support in that perceptual
support did not result in a decrease in ERP tracking component; the amplitude did
not decline over time, suggesting that targets, if lost, were rapidly regained, and that
percepts of the disparate objects remained separable.
107
CHAPTER V
MULTIPLE OBJECT TRACKING AND PROXIMITY
5.1. Introduction
In the preceding chapters we have demonstrated that the perceptual cues of
completion, common fate, line groups etc. can influence the representation of items
in active representation, whether in memory or actively tracked. Furthermore, we
have demonstrated that the sustained activity is updated in a dynamic fashion, that
is, what constitutes an “item” in memory, as indexed by sustained neural activity, is
not only not the raw sensory data, rather perceptual groups, but that these perceptual
groups are flexible: they are actively updated and modified over time as needed to
perform the task. Furthermore, we offered some evidence that perceptual support
can increase behavioral performance and enhance the representations of items even if
they are not explicitly joined together into a single representation. That is, tracking
may be improved in at least three ways: by enhancing the selection of the targets to
be tracked, by supporting the more effective tracking of targets or by enabling the
more efficient suppression of distractors.
The N2pc is a early ERP component that is thought to index the selection of
targets. Previous research, Drew et al. (2011) has shown that the amplitude of the
N2pc is correlated with behavioral performance in a MOT task. Facilitating target
selection by providing a strong grouping cue such as common location, proximity,
or systematic regularity in item presentation, should improve the selection of targets
and therefore enhance the active representations of the items and provide a strong
correlation with behavior. This experiment seeks to confirm and extend the results of
108
the previous chapters and address the following questions: 1) Are early components,
such as the N2pc sensitive to the number of items that are proximate to each other,
or only sensitive to the number of items and can an “individuation” hypothesis be
explored with this data? 2) How sensitive is the proximity cue in perceptual grouping?
3) Can early perceptual grouping distinguished from later tracking? 4) What is
the speed of perceptual grouping/segregation? 5) Does the early benefit provided
by perceptual grouping occur even if grouping cues are removed immediately? 6)
How crucial is ongoing perceptual support, as compared to perceptual grouping, for
modulation of the tracking ERP component? It this modulated by increasing the
effectiveness of target selection or enhancing distractor suppression?
The CDA, as demonstrated previously, indexes the perceived number of objects.
During the cue phase of the MOT task we are able to observe the number of items
the subject perceives. If object individuation in working memory is critical during
this phase, then the correlation with behavioral performance should reflect this.
In this experiment, we attempt to further test these hypothesis by manipulating
the strength of the proximity and motion grouping cues in a MOT experiment. That
is, is it the case that merely grouping items together at some stage of the task provides
tracking enhancement, or does the timing and duration of the grouping cues play a
critical role? Here, three types of target grouping were contrasted with each other and
with ungrouped targets. Subjects were asked to track targets that were either grouped
proximal to each other for the duration of the cue phase and tracking phase, or were
initially grouped and then ungrouped during the entire tracking phase. Additionally,
subjects tracked randomly spaced targets which moved independently, or targets that
were randomly spaced but moved in a linked fashion.
109
5.2. Experiment Description
Identical stimulus and recording parameters were used in this experiment as in
the previous MOT experiments. Four stimulus conditions, similar to the previous
experiments, were used each consisting of three targets and five distractor elements.
The conditions can be divided into three grouping conditions and one baseline
condition. The grouping conditions were Cluster, Cluster Break, and Group Move. In
contrast to the previous experiments, all elements here were presented in a circle. In
the Cluster condition, items appeared on the circle next to (though not touching) each
other, and moved with each other. At the midpoint of the tracking phase the Cluster
elements began moving independantly. The Cluster Break condition was identical to
the Cluster condition for the first 500 ms, but at the end of the cue period the Cluster
Break targets began moving randomly. The Group Move elements were presented on
the circle during the cue phase with at least one distractor interpolated between
each target. Elements in the Group Move condition moved together throughout
the duration of the trial. Finally, elements in the Random condition were presented
randomly in the circle and moved randomly during the tracking phase. See Figure 5.1.
on page 111 for a graphical depicition of the conditions.
5.3. Methods
On each trial subjects were presented bilaterally with eight items placed in each
hemifield, three targets and the remainder distractors, on a black background, in four
conditions. In one half of trials were 3 targets placed sequential around an invisible
circle (the cluster and break conditions), in one fourth of trials there were 3 targets
placed randomly around the circle (random), and in one fourth of trials target items
were placed with at least one distractor between (group motion). Each trial consisted
110
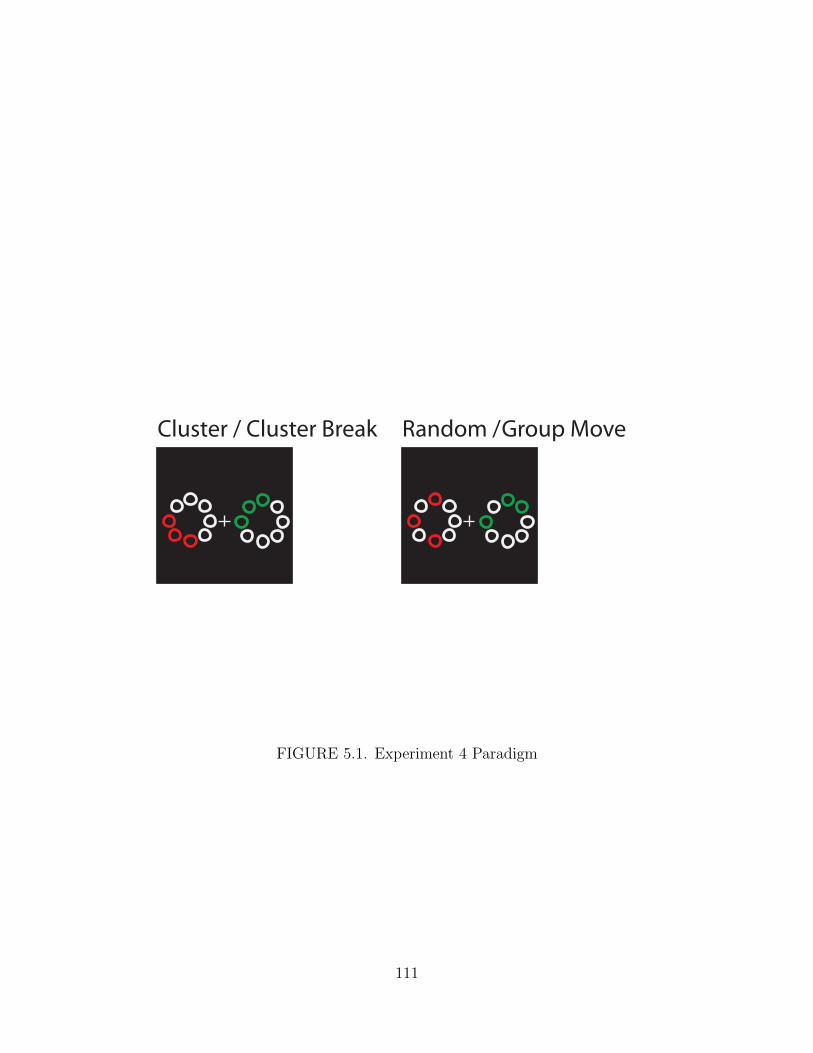
Cluster / Cluster Break Random /Group Move
FIGURE 5.1. Experiment 4 Paradigm
111

of an initial cue phase lasting 500ms and a longer tracking phase lasting 3000 ms.
For the first 500 ms of each trial, the cue period, all the items were stationary with
a subset of the items, the targets, drawn in red (in the attended hemifield) while
the remaining items in that hemifield, the distractors, were drawn in blue. In the
unattended hemifield a number of items equal to the number of red targets were drawn
in green with the remainder of items rendered in blue. Following the cue period, all
the items turned to white and began moving within their respective hemifield for
5 seconds. The movement was random unless constrained by the condition (cluster
items and group motion items moved together). The tracking period was divided into
an early tracking 1500 ms period, and the remainder of the tracking period during
which the items continued to move randomly. All other aspects of the trial were the
same as in the previous experiments.
5.3.1. Participants
Neurologically normal participants (17 subjects) from the Eugene, OR
community gave informed consent according to procedures approved by the University
of Oregon institutional review board. Five subjects were rejected from analysis
utilizing the criterion previously stated in Experiment 2.
5.3.2. Stimulus and Procedure
The general procedure for stimulus presentation and parameters as well as EEG
recording, measurement and analysis for this experiment was identical to Experiment
2. Figure 5.1. on page 111. This experiment consisted of four conditions: Random,
Cluster, Cluster Break, Group in a static cue phase and a dynamic tracking phase.
Targets and distractors were placed equidistant from each other on the circumference
112
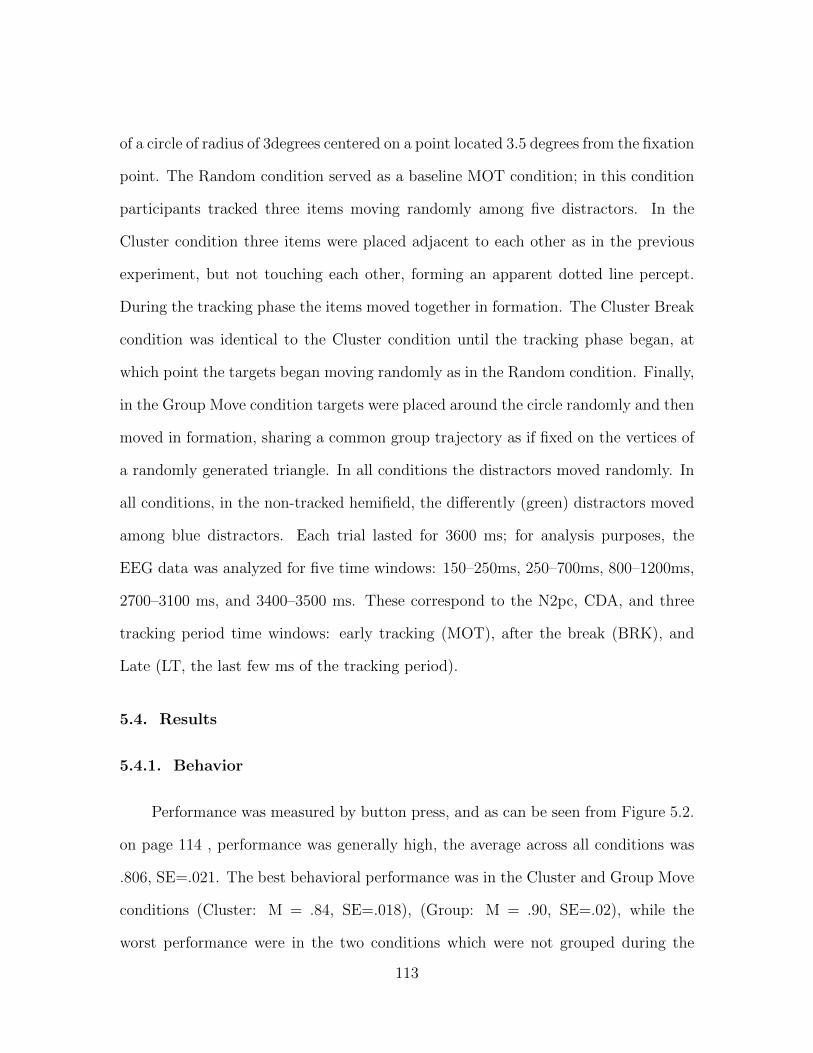
of a circle of radius of 3degrees centered on a point located 3.5 degrees from the fixation
point. The Random condition served as a baseline MOT condition; in this condition
participants tracked three items moving randomly among five distractors. In the
Cluster condition three items were placed adjacent to each other as in the previous
experiment, but not touching each other, forming an apparent dotted line percept.
During the tracking phase the items moved together in formation. The Cluster Break
condition was identical to the Cluster condition until the tracking phase began, at
which point the targets began moving randomly as in the Random condition. Finally,
in the Group Move condition targets were placed around the circle randomly and then
moved in formation, sharing a common group trajectory as if fixed on the vertices of
a randomly generated triangle. In all conditions the distractors moved randomly. In
all conditions, in the non-tracked hemifield, the differently (green) distractors moved
among blue distractors. Each trial lasted for 3600 ms; for analysis purposes, the
EEG data was analyzed for five time windows: 150–250ms, 250–700ms, 800–1200ms,
2700–3100 ms, and 3400–3500 ms. These correspond to the N2pc, CDA, and three
tracking period time windows: early tracking (MOT), after the break (BRK), and
Late (LT, the last few ms of the tracking period).
5.4. Results
5.4.1. Behavior
Performance was measured by button press, and as can be seen from Figure 5.2.
on page 114 , performance was generally high, the average across all conditions was
.806, SE=.021. The best behavioral performance was in the Cluster and Group Move
conditions (Cluster: M = .84, SE=.018), (Group: M = .90, SE=.02), while the
worst performance were in the two conditions which were not grouped during the
113
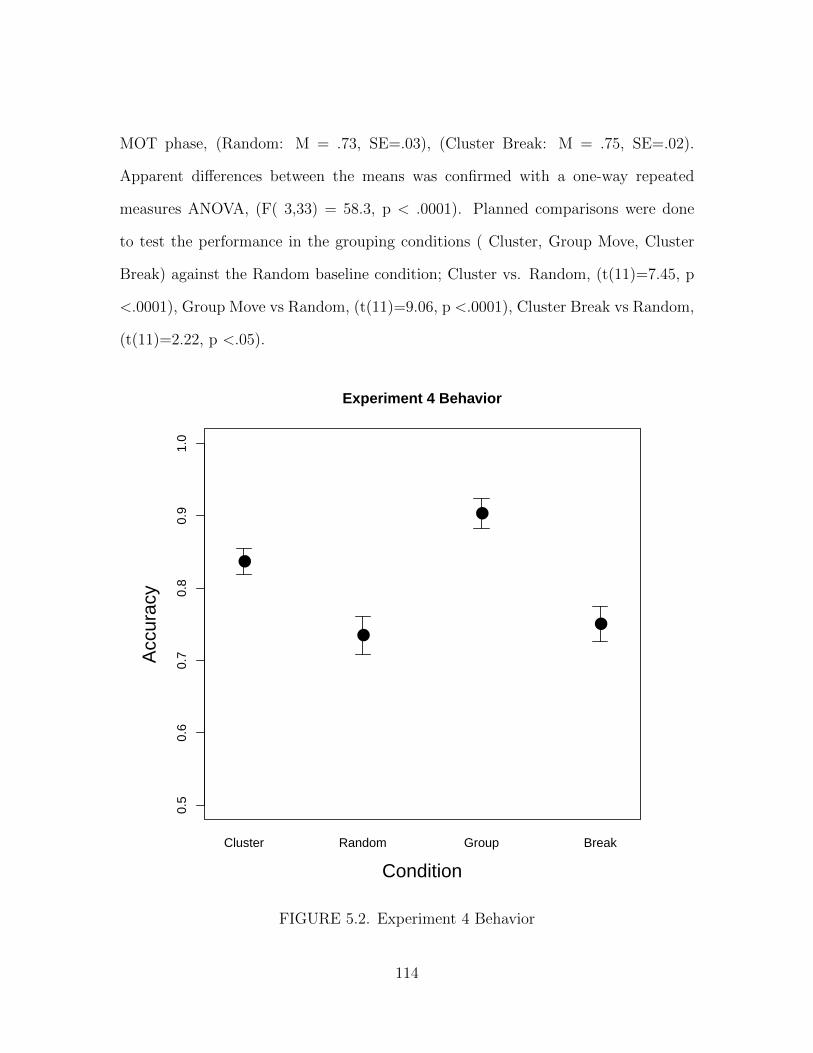
MOT phase, (Random: M = .73, SE=.03), (Cluster Break: M = .75, SE=.02).
Apparent differences between the means was confirmed with a one-way repeated
measures ANOVA, (F( 3,33) = 58.3, p < .0001). Planned comparisons were done
to test the performance in the grouping conditions ( Cluster, Group Move, Cluster
Break) against the Random baseline condition; Cluster vs. Random, (t(11)=7.45, p
<.0001), Group Move vs Random, (t(11)=9.06, p <.0001), Cluster Break vs Random,
(t(11)=2.22, p <.05).
0.5
0.6
0.7
0.8
0.9
1.0
Condition
Acc
urac
y
Cluster Random Group Break
●
●
●
●
Experiment 4 Behavior
FIGURE 5.2. Experiment 4 Behavior
114
5.4.2. Electrophysiology
The electrophysiological response in this experiment followed closely that of the
two previous MOT experiments. Ipsi-Contra waveforms time locked to tracking array
onset show a negative-going waveform beginning about 200 ms after array onset. This
difference remained until motion onset, at which point the amplitude increased. See
Figure 5.3. on page 116. Difference waves for electrodes F3/F4;C3/C4;P3/P4;O1/
O2; OL/OR; T5/T6;PO3/PO4 are presented in Figure 5.4. on page 119 , grand
averages for electrodes P3/P4;OL/OR; T5/T6;PO3/PO4 are presented in Figure 5.5.
on page 120. Four time windows within each trial, and early cue phase “N2pc”, late
cue phase “CDA”, early tracking phase “Group”, late tracking phase subsequent to
the break, “Break”, were selected, and the mean of the ERP amplitudes in each time
window were averaged. See Figure 5.6. on page 121 for a plot of the mean amplitude
in each condition. These mean amplitudes were then compared within each time
window of analysis. Repeated measures anova for the N2pc time window (F(3,33)
= 1.52, p > .05) revealed no effect of condition, for CDA window, (F(3,33) = 1.6, p
> .05), or the Grouping window, (F(3,33) = 2.26, p = .09). However, there was an
reliable difference between the means in the Break time window, (F(3,33) = 2.19, p
< .05).
The degree of clustering (clustered or random) did not modulate the N2pc or
the CDA during the cue phase, indicating that the items were both selected and
represented in memory in similar manner whether the three items were close to each
other or widely separated in the cue array. However, during the early tracking phase,
when configural information might be expected to convey a benefit in tracking, the
Cluster amplitude was reduced compared to the other three conditions, including the
identical up to that point Cluster Break condition. Another factor of interest in this
115
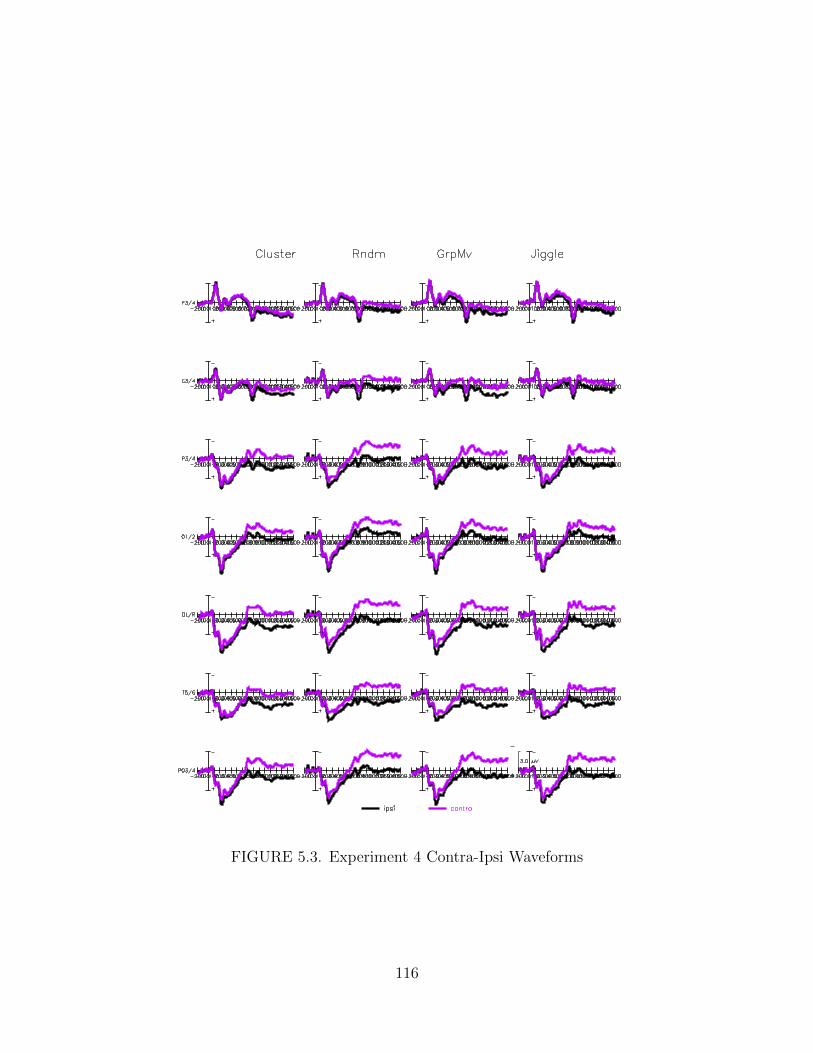
FIGURE 5.3. Experiment 4 Contra-Ipsi Waveforms
116
experiment was to compare the Cluster and Cluster Break conditions at the transition
between CDA and Grouping windows in order to determine if there was a significant
rise in amplitude of the items, if those items had been associated at the beginning of
the cue phase, but not having moved together. A two-way repeated measures anova
with factors of Condition (Cluster, Cluster Break) and Window (CDA, Grouping)
was performed and revealed no effect of condition (p > .05, but reliable effect of
window (F(1,11) = 56.4, p < .0001). A marginally significant interaction was also
seen (F(1,11) = 3.74, p =.08). Similar analysis for the other conditions showed similar
results. Another factor of interest in this experiment was the change in amplitude
within a single condition when transitioning from a grouped state to an ungrouped
state. There were two conditions and two time windows in which this happened.
That is, the comparison within the Cluster Break condition going from the CDA
window to the Grouping window, and the comparison between the Cluster condition
from Grouping to Break. Since the major factor of interest in this experiment was to
what degree grouping influence the amplitude of the measured ERPs as compared to
the baseline condition, difference variables were constructed by subtracting the mean
amplitude of the grouping condition (Cluster, Cluster Break, or Group Move) from
the baseline Random condition. See Figure 5.7. on page 122. The subtractions
were then compared with in each time window of interest to determine whether
reliable differences existed between the conditions. Another factor of interest was the
randomization of the Cluster condition at the Break window. A two-way ANOVA
with factors of Condition and Window revealed significant interaction (F(1,11) = 15.3,
p < .002) between the baseline condition, Random, and the Cluster condition across
these time points. A similar analysis also revealed that the apparent drop in tracking
activity amplitude in the Random condition compared to the Group Move condition
117
was also performed. The Group Move condition was not reduced compared to the
Random condition, in fact the opposite. The Group Move condition maintained an
amplitude as large as the baseline condition throughout the first three phases, and
then maintained a greater amplitude during the Break window the Random condition,
a main effect of window (F(1,11) = 7.61, p < .05), but also a reliable interaction
(F(1,11) = 6.14, p < .05), indicating that the Random condition decreased more than
the Group Move condition across the tracking analysis windows. As in the previous
experiments, a correlational analysis was conducted in order to determine whether the
differences observed in the ERP waveforms were linked with behavioral outcomes. No
significant correlations between behavior and amplitude differences between baseline
and grouping conditions for each time window, except for the Random/Group Move
subtraction and the Cluster Break and Random conditions There was a marginally
significant correlation between the Cluster condition behavior and ERP amplitude
(t(10)=1.7, p =.06) as well as the reliable correlation between Cluster amplitude
difference and Random condition behavior (t(10)=2.8, p <.05), and the Cluster Break
condition (t(10)=1.70, p =.06).
5.5. Discussion
The experiments so far have demonstrated that perceptual grouping cues can
be used to enhance the efficiency of visually encoded information. Evidence for
this includes the increased behavioral performance for items which are perceptually
grouped, as well as the reduction in the electrophysiological indexes of active visual
representations. This experiment extend these data by contrasting proximity and
motion cues to determine the conjoint or disjunctive effects on both early and
late ERP indexes of object perception. Particularly the question of whether early
118

FIGURE 5.4. Experiment 4 Difference Waves
119
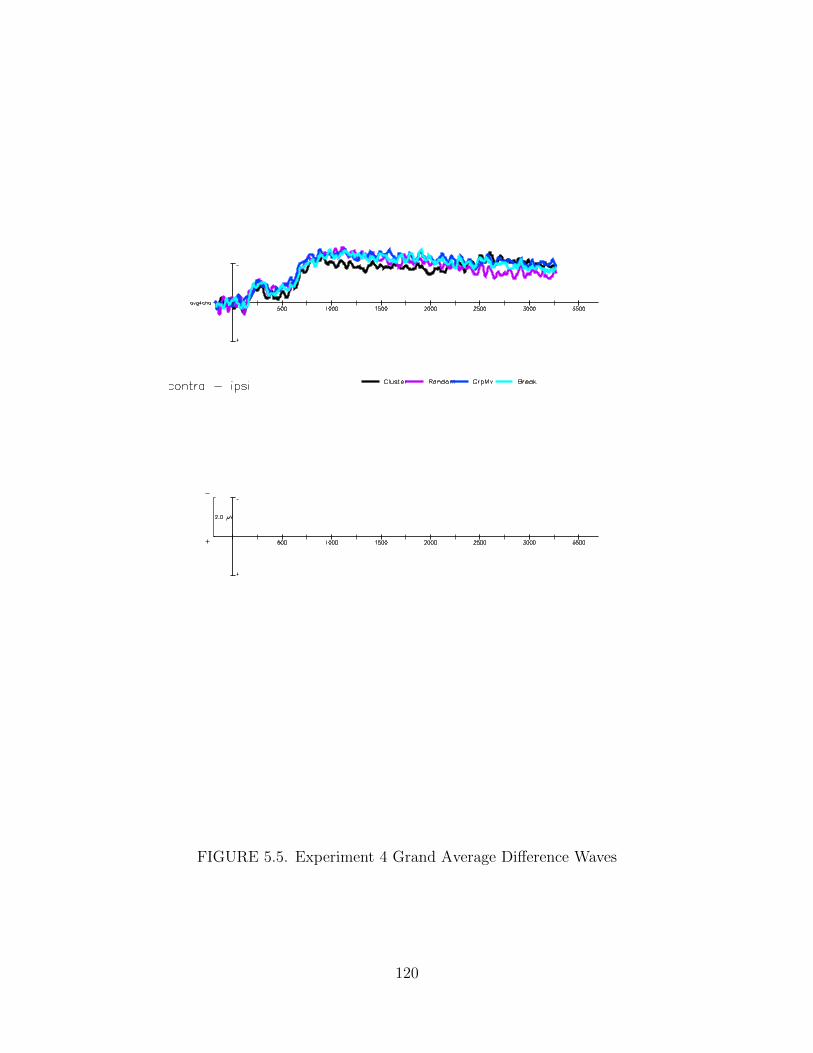
FIGURE 5.5. Experiment 4 Grand Average Difference Waves
120
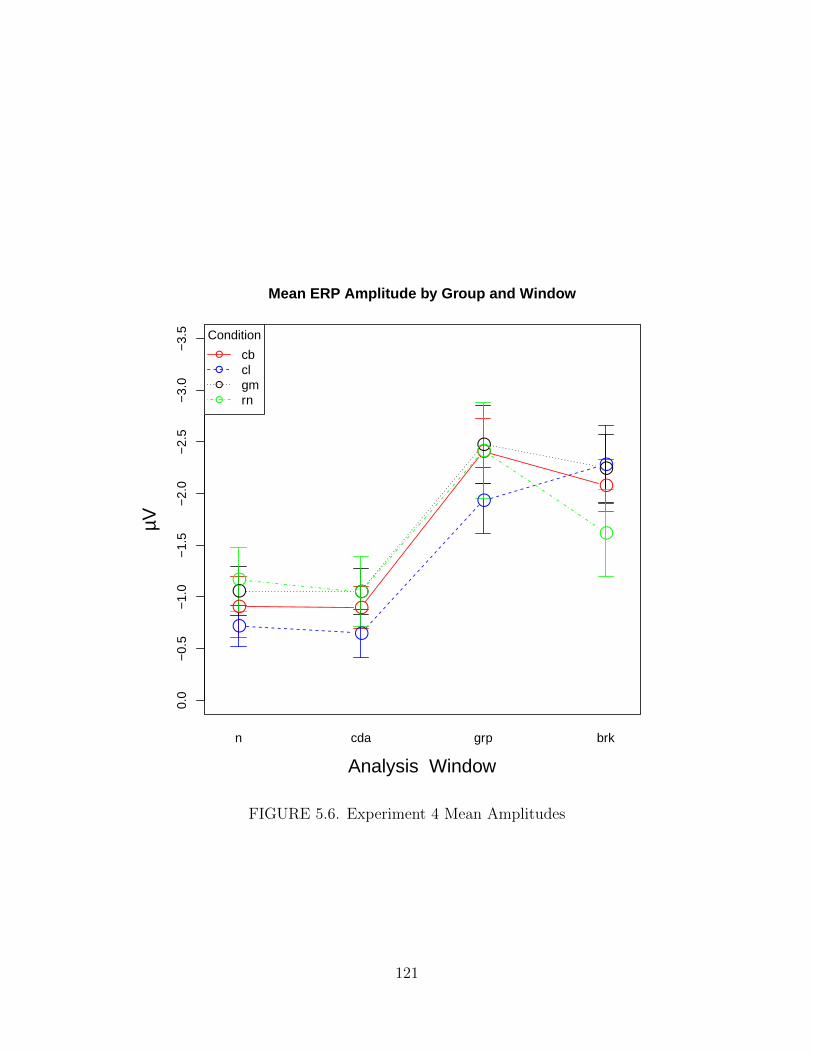
0.0
−0.
5−
1.0
−1.
5−
2.0
−2.
5−
3.0
−3.
5
Mean ERP Amplitude by Group and Window
Analysis Window
µV
n cda grp brk
● ●
●
●
● ●
●
●
● ●
●
●
●●
●
●
●
●
●
●
Condition
cbclgmrn
FIGURE 5.6. Experiment 4 Mean Amplitudes
121
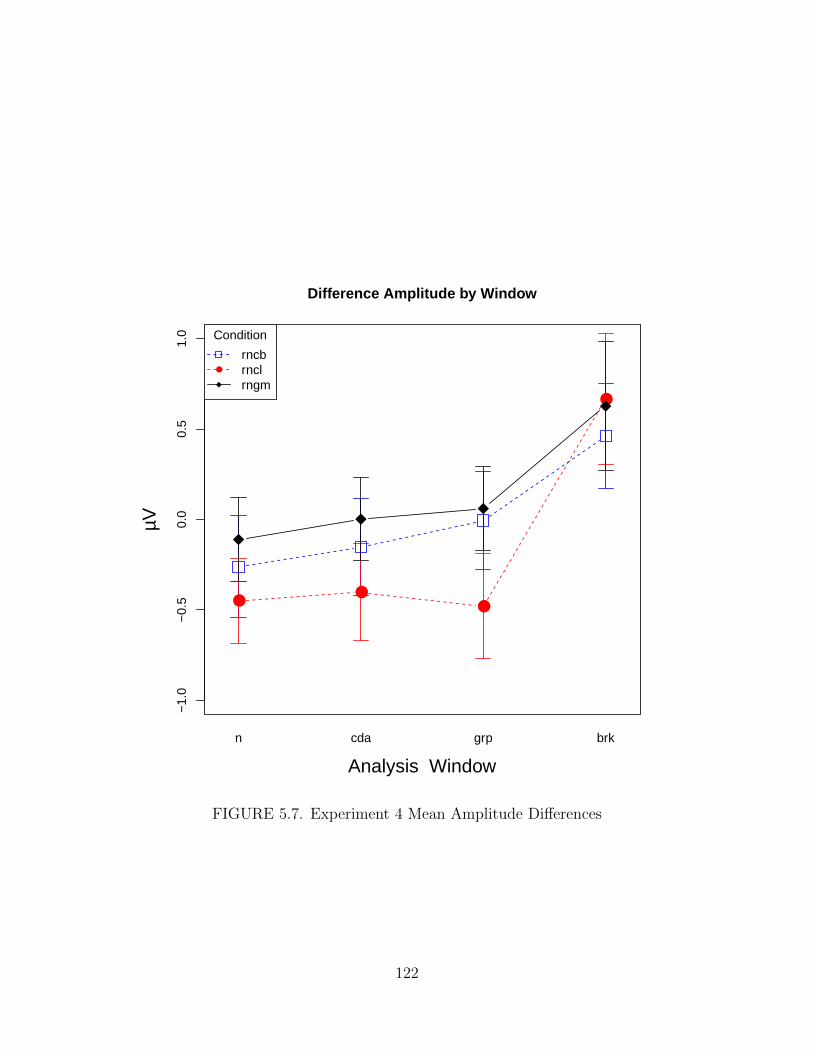
−1.
0−
0.5
0.0
0.5
1.0
Difference Amplitude by Window
Analysis Window
µV
n cda grp brk
●●
●
●
●
Condition
rncbrnclrngm
FIGURE 5.7. Experiment 4 Mean Amplitude Differences
122
N2pc component was sensitive to the number of elements or the subjective percept,
and whether early grouping, prior to motion onset, may still reduce tracking load.
Furthermore, motion and proximity cues were contrasted across the tracking period.
In this experiment, we attempt to further test these hypothesis by manipulating
the strength of the proximity and motion grouping cues in a MOT experiment. That
is, is it the case that merely grouping items together at some stage of the task provides
tracking enhancement, or does the timing and duration of the grouping cues play a
critical role? Here, three types of target grouping were contrasted with each other and
with ungrouped targets. We found reliable modulations in both the amplitude of the
online tracking activity and the behavioral performance which varied depending on
the strength of the grouping cues and the presence or absence of ongoing perceptual
support throughout the duration of the trial.
In all the grouping conditions behavioral performance was enhanced compared to
random items, indicating that grouping cues, no matter when perceived, may improve
performance. These data are consistent with prior results both in this dissertation
and Yantis (1992). The electrophysiological response varied according to the type
and timing of the grouping cues and component of interest. Earlier components,
the N2pc and CDA, were sensitive to the proximity of the targets. That is, the
targets in the proximity and proximity-break conditions demonstrated a reduction
in component amplitude in comparison to the random or motion groups. However,
during the tracking phase, only the proximity group showed reduce tracking load
as indexed by the tracking activity and increased behavioral accuracy for those
conditions. Therefore, the data support the hypothesis that early components such as
the N2pc and CDA are sensitive to the subjective percept. Distance between elements
in this experiment were typical for previous MOT experiments.
123
As in the first experiment, we observed the N2pc for items during the cue phase.
We observed an effect of condition on the amplitude such that the N2pc was smaller
for the cluster condition than the the other three conditions, indicating that the
items were being selected as a single item. In the later cue phase, we observed the
same component as previously, the CDA, which was modulated by proximity such
that amplitude in the cluster condition was lower than amplitude in the other two
conditions. In the early tracking phase, after motion onset, we again observed an
increase in the amplitude of the CDA consistent with previous results in Experiment 1,
but again a reduction in tracking load for the cluster condition compared to the other
two conditions. After 1500ms of tracking the items in the cluster condition broke apart
and began moving randomly, while the items in move together or random condition
continued moving as previously. Approximately 500 ms after the items in the cluster
condition began moving randomly we observed an increase in the amplitude of the
CDA for the cluster condition until it exceed the amplitude for the other conditions.
However, this amplitude decreased until it was equivalent to the other two movement
conditions by the end of the tracking period.
Interestingly, the group motion activity showed no reduction component
amplitude. This can be taken as evidence that despite increased behavioral
performance, elements of the grouped were individuated during tracking rather than
perceptually grouped. However, amplitude for the common motion grouped items
was initially indistinguishable from the random condition. Differences in tracking
activity only emerged over time. This may best be explained by the concept of
perceptual support, rather than perceptual grouping. Consider the fate of items
which are dropped in the random condition: those items cannot be recovered and the
subject either begins tracking a random item or simply holds on to the remaining
124
items. On the other hand, in the common motion condition if an item is dropped
it can be efficiently recovered, since there are strong motion cues segregating the
tracked items from distractors. However, the common motion items were nonetheless
not represented as a single item, at least insofar as the tracking activity indicates.
Finally, early proximity grouping had only a small behavioral affect on tracking
and the ERP tracking activity. Interestingly, the tracking activity for these “break”
items did not differ from random items during the first half of the tracking period, and
only barely above the random items in the second half. This can be taken as evidence
that perceptual grouping happens on a moment-by-moment manner in which the
history of the objects, at least in this experiment, does not seem to matter. As soon
as the items began to move independently they were immediately individuated and
tracked. This is also supported by the increase in the tracking activity of the proximity
grouped items, which was initially reduced compared to the other conditions, but at
the “break” immediately increased in amplitude.
125

CHAPTER VI
CONCLUSION
Many researchers have studied grouping, memory, and tracking tasks over the
past ten decades of research on the topic, for the most part focusing on effects
in performance which highlight which items may be selected from maintenance in
memory, rather than specifically on the representation itself. In ERP research, while
some investigators have examined how Gestalt processing or subject figures modulate
early ERP components, none save these present experiments have specifically
examined the effect of illusory figures on active, online representations of visual
items. The present dissertation was concerned with understanding the effects of
modal completion In a visual working memory task, and how attention or task
demand creates top-down influences on illusory items, as well as examining gestalt
grouping effects on tracking multiple items simultaneously. A complete explanation
of the interaction of these effects in producing items in memory has not yet been
proposed. The general aim of this thesis was to explore the influence of early
grouping and completion mechanisms on online, active visual object representations,
using behavioral accuracy and ERP indexes of memory load to gain insight into the
representation and processing. Specific questions addressed here were: Does modal
completion alter visual working memory representations? Are these effects obligate
or modulate by attention? How do gestalt cues alter dynamic visual representations?
6.1. Chapter Summaries
Chapter I briefly covered the topics of visual working memory and perceptual
grouping and described the framework and assumptions that were used in
126
developing these experiments. The dissertation began with discussion of the current
understanding and controversies in the cognitive construct of visual working memory,
primarily the contrasting views of primary units of visual working memory as
discreet, coherent, bound objects or as general, finely-divisible resource, as in the
signal-detection model. Also reviewed was literature relevant to multiple object
tracking, the proposed methods by which this system may operate and the neural
indexes of the same. In addition to a discussion of the primary measures indexing
actively maintained, visually attended objects in both static (working memory) and
dynamic (tracking) displays the fundamental grouping principles which underlie the
formation of object percepts were also discussed. Gestalt grouping principles and
the corollary modal and amodal completion phenomena were reviewed, as well as
current controversies in the literature concerning the neural origins, consequences,
developmental time course, and clinical disease models. finally, this chapter discussed
known and hypothesized interactions between visual memory and tracking, and the
grouping or illusory contour processes motivating the subsequent experiments.
In Chapter II a paradigm for studying visual working memory, the change
detection task, was applied to the study of perception in the service of understanding
how apparently low-level, early mechanisms of vision may influence higher level
cognition, specifically, the representation of items in visual working memory. This
chapter described the use of the hybrid perceptual grouping/change detection
methodology to test the hypothesis that top-down attentional control can influence
the nature of item representations in memory. Specifically, the experiment compared
the allocation of memory resources as indexed by the CDA when the to-be-
remembered feature of the objects was congruent with the grouping mechanism, or
127
incongruent. The data suggested that the identical visual stimulus can be represented
in memory differently depending on task demand.
Chapter III described the extension of this research from static displays to
dynamic displays of motion in order to investigate another more recently defined
grouping principle, that of connectedness. Here, the presence or absence of connecting
lines between moving targets in displays increased the accuracy while simultaneously
decreasing the amount of resources allocated online.
Chapter IV described the extension of this research to other dynamic displays of
motion in order to investigate another common grouping principle, that of common
fate. The results demonstrated that the neural index was a more sensitive measure
of the affect of perceptual grouping on memory representations than were behavioral
measures. Furthermore, an effect of grouping was found not only on the sustained
tracking activity but also on earlier ERPs, indicating that perceptual grouping most
certainly occurs early in the processing stream.
Finally, in Chapter V the differential effects of common fate and proximity on
active visual representations were tested. The results demonstrated that the neural
index of active representations were sensitive to the grouping principle employed.
6.2. General Conclusion
Overall, the results have shown the utility of using ERPs to examine these kinds
of questions. By taking a waveform with known behavior in a well-defined task,
and applying these tools to a new questions and phenomena, our understanding
of the mechanisms of both perceptual grouping and visual working memory has
been deepened. We have extended our knowledge of when perceptual grouping
occurs and its reciprocal effects on memory and attention. Further, these chapters
128
have demonstrated that the influence of perceptual grouping or Gestalt grouping
principles on memory, is not a singular processing event, but rather a dynamic and
active process which is influenced in turn by the allocation of attentional resources
and task demand. Overall, we have shown that grouping may reduce online visual
working memory requirements and have demonstrated that the effects of perceptual
grouping on visual memory are not obligatory but can be influenced by attention.
The result encompasses not only visual representations of static items, but also
dynamic stimuli, showing that that grouping can modulate both ERPs associated
with tracking and performance. In addition, evidence was presented in to support
the hypothesis that the grouping principle of element connectedness can modulate
both behavior, by increasing performance on the task, and ERPs, by dynamically
modulating the amplitude of an online, continuous measure of an object ensemble.
Clearly, the common viewpoint of perceptual grouping as a static, unidirectional
event in the visual system is erroneous, and if we are to continue to develop our
understanding of visual processing, of the parsing of the visual world as well as the
internal representations of that external world, we need to further our understanding
of the how perceptual grouping shapes our perception and in turn is shaped by our
apperception. Taken together, these studies address the question of the influence
of Gestalt grouping and illusory completion processes on object representations in
both static and dynamic tasks involving the maintenance of visual information in
an immediately accessible state, as well as examine whether individual differences
in memory capacity may contribute to the active maintenance of unified object
representations. In sum, grouping alters the percept of the visual stimulus and
reduces resource requirements, moreover, these changes can be tracked dynamically
using electrophysiological measures of visual representations.
129
REFERENCES CITED
Alvarez, G. A., & Cavanagh, P. (2004, February). The capacity of visual short-termmemory is set both by visual information load and by number of objects.Psychological Science: A Journal of the American Psychological Society , 15 (2),106–111.
Alvarez, G. A., & Scholl, B. J. (2005, November). How does attention select andtrack spatially extended objects? New effects of attentional concentration andamplification. Journal of Experimental Psychology: General , 134 (4), 461–476.
Anderson, B. (2007). Filling-in models of completion: Rejoinder to Kellman,Garrigan, Shipley, and Keane (2007) and Albert (2007). Psychological Review ,114 (2), 509–527.
Anderson, B. L. (2007, April). The demise of the identity hypothesis and theinsufficiency and nonnecessity of contour relatability in predicting objectinterpolation: Comment on Kellman, Garrigan, and Shipley (2005).Psychological Review , 114 (2), 470–487.
Anderson, B. L., Singh, M., & Fleming, R. W. (2002, March). The interpolation ofobject and surface structure. Cognitive Psychology , 44 (2), 148–190.
Anne, G., Assche Mitsouko van, Caroline, H., & David, L. (2010, December).Visuo-perceptual organization and working memory in patients withschizophrenia. Neuropsychologia, 49 (3), 435–443.
Attneave, F. (1968, September). Triangles as ambiguous figures. American Journalof Psychology , 81 (3), 447–453.
Awh, E., Barton, B., & Vogel, E. K. (2007, July). Visual working memoryrepresents a fixed number of items regardless of complexity. PsychologicalScience: A Journal of the American Psychological Society , 18 (7), 622–628.
Awh, E., & Pashler, H. (2000, April). Evidence for split attentional foci. Journal ofExperimental Psychology-Human Perception and Performance, 26 (2), 834–846.
Bartram, D. (1978, July). Post-iconic visual storage: Chunking in the reproductionof briefly displayed visual patterns. Cognitive Psychology , 10 (3), 324–355.
Bor, D., Cumming, N., Scott, C., & Owen, A. (2004, June). Prefrontal corticalinvolvement in verbal encoding strategies. European Journal of Neuroscience,19 (12), 3365–3370.
130
Bor, D., Duncan, J., Wiseman, R. J., & Owen, A. M. (2003, January). Encodingstrategies dissociate prefrontal activity from working memory demand. Neuron,37 (2), 361–367.
Bor, D., & Owen, A. M. (2007, February). Cognitive training: Neural correlates ofexpert skills. Current Biolology , 17 (3), 95–97.
Brodeur, M., Lepore, F., & Debruille, J. B. (2006, January). The effect ofinterpolation and perceptual difficulty on the visual potentials evoked byillusory figures. Brain Research, 1068 (1), 143–150.
Brooks, J. L., Wong, Y., & Robertson, L. C. (2005, January). Crossing the midline:Reducing attentional deficits via interhemispheric interactions.Neuropsychologia, 43 (4), 572–582.
Cavanagh, P., & Alvarez, G. A. (2005, July). Tracking multiple targets withmultifocal attention. Trends in Cognitive Science, 9 (7), 349–354.
Charness, N. (1979). Components of skill in bridge. Canadian Journal ofPsychology , 33 (1), 1–16.
Chase, W., & Simon, H. (1973, January). Perception in Chess. CognitivePsychology , 4 (1), 55–81.
Chen, L., Zhang, S., & Srinivasan, M. V. (27, March). Global perception in smallbrains: Topological pattern recognition in honey bees. Proceedings of theNational Academy of Sciences of the United States of America, 100 (11),6884–6885.
Cocchi, L., Schenk, F., Volken, H., Bovet, P., Parnas, J., & Vianin, P. (2007,August). Visuo-spatial processing in a dynamic and a static working memoryparadigm in schizophrenia. Psychiatry Research, 152 (2-3), 129–142.
Cowan, N. (1999, January). An embedded-processes model of working memory. InA. Miyake & P. Shah (Eds.), Models of working memory: Mechanisms of activemaintenance and executive control (p. 62-101). New York, NY: CambridgeUniversity Press.
Cowan, N. (2001, February). The magical number 4 in short-term memory: Areconsideration of mental storage capacity. Behavioral & Brain Science, 24 (1),87–114; discussion 114–85.
Cowan, N. (2008). What are the differences between long-term, short-term, andworking memory? Progress in Brain Research, 169 , 323–338.
Curby, K. M., & Gauthier, I. (2007, August). A visual short-term memoryadvantage for faces. Psychonomic Bulletin & Review , 14 (4), 620–628.
131
Curby, K. M., Glazek, K., & Gauthier, I. (2009, February). A visual short-termmemory advantage for objects of expertise. Journal of ExperimentalPsychology: Human Perception and Performance, 35 (1), 94–107.
Dam, W. O. van, & Hommel, B. (2010, October). How object-specific are objectfiles? evidence for integration by location. Journal of Experimental Psychology:Human Perception and Performance, 36 (5), 1184–1192.
Davis, G., & Driver, J. (1994, October). Parallel detection of kanizsa subjectivefigures in the human visual system. Nature, 371 (6500), 791-793.
Davis, G., & Driver, J. (1998, February). Kanizsa subjective figures can act asoccluding surfaces at parallel stages of visual search. Journal of ExperimentalPsychology-Human Perception and Performance, 24 (1), 169–184.
Day, E. A., Arthur, W., & Gettman, D. (2001, October). Knowledge structures andthe acquisition of a complex skill. Journal of Applied Psychology , 86 (5),1022–1033.
Delvenne, J.-F., & Bruyer, R. (2006, September). A configural effect in visualshort-term memory for features from different parts of an object. QuarterlyJournal of Experimental Psychology , 59 (9), 1567–1580.
Dodd, M., & Pratt, J. (2005). Allocating visual attention to grouped objects.European Journal of Cognitive Psychology , 17 (4), 481–497.
Drew, T., Horowitz, T. S., Wolfe, J. M., & Vogel, E. K. (2011, January).Delineating the neural signatures of tracking spatial position and workingmemory during attentive tracking. Journal of Neuroscience, 31 (2), 659–668.
Drew, T., McCollough, A. W., Horowitz, T. S., & Vogel, E. K. (2009, April).Attentional enhancement during multiple-object tracking. PsychonomicBulletin & Review , 16 (2), 411–417.
Drew, T., & Vogel, E. K. (2008, April). Neural measures of individual differences inselecting and tracking multiple moving objects. Journal of Neuroscience,28 (16), 4183–4191.
Duncan, J. (1984, December). Selective attention and the organization of visualinformation. Journal of Experimental Psychology: General , 113 (4), 501–517.
Egly, R., Driver, J., & Rafal, R. D. (1994, June). Shifting visual attention betweenobjects and locations: Evidence from normal and parietal lesion subjects.Journal of Experimental Psychology. General , 123 (2), 161–177.
132
Ehrenstein, W. H., & Gillam, B. J. (1998, January). Early demonstrations ofsubjective contours, amodal completion, and depth from half-occlusions:”Stereoscopic experiments with silhouettes” by Adolf von Szily (1921).Perception, 27 (12), 1407–1416.
Eimer, M. (2000, January). Effects of face inversion on the structural encoding andrecognition of faces. Cognitive Brain Research, 10 (1–2), 145–158.
Ericcson, K. A., Chase, W. G., & Faloon, S. (1980, June). Acquisition of a memoryskill. Science (New York, N.Y.), 208 (4448), 1181–1182.
Ericsson, A., Nandagopal, K., & Roring, R. (2007, September). Toward a science ofexceptional achievement: Attaining superior performance through deliberatepractice. Annals of the New York Academy of Sciences , 1172 (1), 199–217.
Ericsson, K., & Lehmann, A. (1996). Expert and exceptional performance:Evidence of maximal adaptation to task constraints. Annual Review ofPsychology , 47 , 273–305.
Fang, F., Kersten, D., & Murray, S. O. (2008, January). Perceptual grouping andinverse fMRI activity patterns in human visual cortex. Journal of Vision, 8 (7),2.1–2.9.
Ffytche, D. H., & Zeki, S. (1996, April). Brain activity related to the perception ofillusory contours. Neuroimage, 3 (2), 104–108.
Fukuda, K., & Vogel, E. (2009, July). Human variation in overriding attentionalcapture. Journal of Neuroscience, 29 (27), 8726–8733.
Gobet, F. (1997, January). A pattern-recognition theory of search in expertproblem solving. Thinking & Reasoning , 3 , 291–313.
Gobet, F., & Clarkson, G. (2004, November). Chunks in expert memory: Evidencefor the magical number four ... or is it two? Memory , 12 (6), 732–747.
Gobet, F., Lane, P., Croker, S., Cheng, P., Jones, G., Oliver, I., et al. (2001, June).Chunking mechanisms in human learning. Trends in Cognitive Science, 5 (6),236–243.
Gobet, F., & Simon, H. (1996b, July). Recall of random and distorted positions:Implications for the theory of expertise. Memory & Cognition, 24 (4), 493–503.
Gobet, F., & Simon, H. A. (1996a, July). Recall of random and distorted chesspositions: Implications for the theory of expertise. Memory & Cognition,24 (4), 493–503.
133
Green, C. S., & Bavelier, D. (2003, May). Action video game modifies visualselective attention. Nature, 423 (6939), 534–537.
Groot, A. (1965). Thought and choice in chess (2nd ed.). The Hague, Netherlands:Mouton Publishers.
Grosof, D. H., Shapley, R. M., & Hawken, M. J. (1993, October). Macaque V1neurons can signal ’illusory’ contours. Nature, 365 (6446), 550–552.
Grossberg, S., Mingolla, E., & Ross, W. D. (1997, March). Visual brain and visualperception: How does the cortex do perceptual grouping? Trends inNeuroscience, 20 (3), 106–111.
Halgren, E., Mendola, J., Chong, C. D. R., & Dale, A. M. (2003, April). Corticalactivation to illusory shapes as measured with magnetoencephalography.Neuroimage, 18 (4), 1001–1009.
Halpern, D. F., & Wai, J. (2007, June). The world of competitive Scrabble: Noviceand expert differences in visuopatial and verbal abilities. Journal ofExperimental Psychology Applied , 13 (2), 79–94.
Han, S. (2004, August). Interactions between proximity and similarity grouping:An event-related brain potential study in humans. Neuroscience Letters ,367 (1), 40–43.
Han, S., Humphreys, G. W., & Chen, L. (1999, May). Uniform connectedness andclassical Gestalt principles of perceptual grouping. Perception &Psychophysics , 61 (4), 661–674.
Han, S., Song, Y., Ding, Y., Yund, E. W., & Woods, D. L. (2001, November).Neural substrates for visual perceptual grouping in humans. Psychophysiology ,38 (6), 926–935.
Heinze, H. J., Luck, S. J., Munte, T. F., Gos, A., Mangun, G. R., & Hillyard, S. A.(1994, July). Attention to adjacent and separate positions in space: Anelectrophysiological analysis. Perception & Psychophysics , 56 (1), 42–52.
Helden, J. van der. (2010). Early erp components show cued object advantage inkanizsa and amodal subjective figures. Dissertation, Rijksuniveriteit,Groningen, Netherlands.
Herrmann, C. S., & Bosch, V. (2001, April). Gestalt perception modulates earlyvisual processing. Neuroreport , 12 (5), 901–904.
Heydt, R. V. D., Peterhans, E., & Baumgartner, G. (1984, June). Illusory contoursand cortical neuron responses. Science, 224 (4654), 1260–1262.
134

Hillyard, S., Vogel, E. K., & Luck, S. J. (1998, August). Sensory gain control(amplification) as a mechanism of selective attention: Electrophysiological andbehavioral evidence. Philosophical Transactions of the Royal Society B,Biological Sciences , 353 (1373), 1257–1270.
Hopf, J., Vogel, E., Woodman, G., Heinze, H., & Luck, S. J. (2002, October).Localizing visual discrimination processes in time and space. JournalNeurophysiology , 88 (4), 2088–2095.
Hopfinger, J. B., Buonocore, M. H., & Mangun, G. R. (2000, March). The neuralmechanisms of top-down attentional control. Nature Neuroscience, 3 (3),284–291.
Howe, P. D. L., Cohen, M. A., Pinto, Y., & Horowitz, T. S. (2010, January).Distinguishing between parallel and serial accounts of multiple object tracking.Journal of Vision, 10 (8), 11.
Huberle, E., Rupek, P., Lappe, M., & Karnath, H.-O. (2009, January). Perceptionof global gestalt by temporal integration in simultanagnosia. European JournalNeuroscience, 29 (1), 197–204.
Hyun, J.-S., Woodman, G. F., Vogel, E. K., Hollingworth, A., & Luck, S. J. (2009,August). The comparison of visual working memory representations withperceptual inputs. Journal of Experimental Psychology: Human Perception andPerformance, 35 (4), 1140–1160.
Jiang, Y., Chun, M. M., & Olson, I. R. (2004, April). Perceptual grouping inchange detection. Perception & Psychophysics , 66 (3), 446–453.
Jiang, Y., Olson, I. R., & Chun, M. M. (2000, May). Organization of visualshort-term memory. Journal of Experimental Psychology: Learning, Memory,and Cognition, 26 (3), 683–702.
Kahneman, D., & Henik, A. (1981). Perceptual organization and attention.Perceptual Organization, 181–211.
Kalakoski, V. (2007, April). Effect of skill level on recall of visually presentedpatterns of musical notes. Scandinavian Journal of Psychology , 48 (2), 87–96.
Kanizsa, G. (1985). Seeing and thinking. Acta Psychologica, 59 (1), 23–33.
Kimchi, R., & Hadad, B.-S. (2002, January). Influence of past experience onperceptual grouping. Psychological Science: A Journal of the AmericanPsychological Society , 13 (1), 41–47.
135
Klaver, P., Talsma, D., Wijers, A., Heinze, H., & Mulder, G. (1999, July). Anevent-related brain potential correlate of visual short-term memory.Neuroreport , 10 (10), 2001–2005.
Korshunova, S. G. (1999, January). Visual evoked potentials induced by illusoryoutlines (Kanizsa’s square). Neuroscience and Behavioral Physiology , 29 (6),695–701.
Kovacs, I. (1996, December). Gestalten of today: Early processing of visualcontours and surfaces. Behavioural Brain Research, 82 (1), 1–11.
Kovacs, I. (2000, January). Human development of perceptual organization. VisionResearch, 40 (10–12), 1301–1310.
Lamy, D., Segal, H., & Ruderman, L. (2006, January). Grouping does not requireattention. Perception & Psychophysics , 68 (1), 17–31.
Lee, T. S., & Nguyen, M. (2001, February). Dynamics of subjective contourformation in the early visual cortex. Proceedings of the National Academy ofSciences of the United States of America, 98 (4), 1907–1911.
Liu, Z., Jacobs, D. W., & Basri, R. (1999, January). The role of convexity inperceptual completion: Beyond good continuation. Vision Research, 39 (25),4244–4257.
Logan, G. D. (2002, May). An instance theory of attention and memory.Psychological Review , 109 (2), 376–400.
Luck, S. J., Heinze, H. J., Mangun, G. R., & Hillyard, S. A. (1990, June). Visualevent-related potentials index focused attention within bilateral stimulusarrays. II. Functional dissociation of P1 and N1 components.Electroencephalography and Clinical Neurophysiology , 75 (6), 528–542.
Luck, S. J., & Vogel, E. K. (1997, November). The capacity of visual workingmemory for features and conjunctions. Nature, 390 (6657), 279–281.
Mack, A., Tang, B., Tuma, R., Kahn, S., & Rock, I. (1992, October). Perceptualorganization and attention. Cognitive Psychology , 24 (4), 475–501.
Mangun, G. R., Buonocore, M. H., Girelli, M., & Jha, A. P. (1998, January). ERPand fMRI measures of visual spatial selective attention. Human BrainMapping , 6 (5-6), 383–389.
Mangun, G. R., & Hillyard, S. A. (1991, November). Modulations of sensory-evokedbrain potentials indicate changes in perceptual processing during visual-spatialpriming. Journal of Experimental Psychology: Human Perception andPerformance, 17 (4), 1057–1074.
136

Marr, D. (1976, October). Early processing of visual information. PhilosophicalTransactions of the Royal Society of Londaon, B, Bilogical Sciences , 275 (942),483–519.
Martınez, A., Teder-Salejarvi, W., Vazquez, M., Molholm, S., Foxe, J. J., Javitt,D. C., et al. (2006, February). Objects are highlighted by spatial attention.Journal of Cognitive Neuroscience, 18 (2), 298–310.
Mattingley, J. B., Davis, G., & Driver, J. (1997, January). Preattentive filling-in ofvisual surfaces in parietal extinction. Science, 275 (5300), 671-674.
McCollough, A. W., Machizawa, M. G., & Vogel, E. K. (2007, January).Electrophysiological measures of maintaining representations in visual workingmemory. Cortex; A Journal Devoted to the Study of the Nervous System andBehavior , 43 (1), 77–94.
McGregor, S. J., & Howes, A. (2002, July). The role of attack and defensesemantics in skilled players’ memory for chess positions. Memory & Cognition,30 (5), 707–717.
McNab, F., & Klingberg, T. (2008, January). Prefrontal cortex and basal gangliacontrol access to working memory. Nature Neuroscience, 11 (1), 103–107.
Mendola, J., Dale, A., Fischl, B., Liu, A., & Tootell, R. (1999, October). Therepresentation of illusory and real contours in human cortical visual areasrevealed by functional magnetic resonance imaging. Journal Of Neuroscience,19 (19), 8560–8572.
Merikle, P. M. (1980, September). Selection from visual persistence by perceptualgroups and category membership. Journal of Experimental Psychology,General , 109 (3), 279–295.
Milner, A., Perrett, D., Johnston, R., & Benson, P. (1991, January). Perceptionand action in ’visual form agnosia’. Brain, 114 (1), 405–428.
Moore, C., Yantis, S., & Vaughan, B. (1998, March). Object-based visual selection:Evidence from perceptual completion. Psychological Science, 9 (2), 104–110.
Moore, C. D., Cohen, M. X., & Ranganath, C. (2006, October). Neural mechanismsof expert skills in visual working memory. Journal of Neuroscience, 26 (43),11187–11196.
Moore, C. M., & Egeth, H. (1997, April). Perception without attention: Evidenceof grouping under conditions of inattention. Journal of ExperimentalPsychology: Human Perception and Performance, 23 (2), 339–352.
137
Moore, C. M., Hein, E., Grosjean, M., & Rinkenauer, G. (2009, May). Limitedinfluence of perceptual organization on the precision of attentional control.Attention, Perception & Psychophysics , 71 (4), 971–983.
Murray, S. O., Kersten, D., Olshausen, B. A., Schrater, P., & Woods, D. L. (2002,November). Shape perception reduces activity in human primary visual cortex.Proceedings of the National Academy of Sciences of the United States ofAmerica, 99 (23), 15164–15169.
Murray, S. O., Schrater, P., & Kersten, D. (2004, January). Perceptual groupingand the interactions between visual cortical areas. Neural Networks: TheOfficial Journal of the International Neural Network Society , 17 (5-6), 695–705.
Oksama, L., & Hyona, J. (2004). Is multiple object tracking carried outautomatically by an early vision mechanism independent of higher-ordercognition? An individual difference approach. Visual Cognition, 11 (5),631–671.
Olsson, H., & Poom, L. (2005, June). Visual memory needs categories. Proceedingsof the National Academy of Sciences of the United States of America, 102 (24),8776–8780.
Ostrovsky, Y., Andalman, A., & Sinha, P. (2006, December). Vision followingextended congenital blindness. Psychological Science: A Journal of theAmerican Psychological Society , 17 (12), 1009–1014.
Ostrovsky, Y., Meyers, E., Ganesh, S., Mathur, U., & Sinha, P. (2009, December).Visual parsing after recovery from blindness. Psychological Science: A Journalof the American Psychological Society / APS , 20 (12), 1484–1491.
Otsuka, Y., Kanazawa, S., & Yamaguchi, M. K. (2006, January). Development ofmodal and amodal completion in infants. Perception, 35 (9), 1251–1264.
Palmer, S. (2002, January). Perceptual grouping: It’s later than you think. CurrentDirections in Psychological Science, 11 (3), 101–106.
Palmer, S., Neff, J., & Beck, D. (1997). Grouping and amodal completion. IndirectPerception, 63–75.
Palmer, S., & Rock, I. (1994, March). Rethinking perceptual organization: The roleof uniform connectedness. Psychonomic Bulletin & Review , I (1), 29-55.
Palmer, S. E. (1992, July). Common region: A new principle of perceptualgrouping. Cognitive Psychology , 24 (3), 436–447.
Pashler, H. (1988, October). Familiarity and visual change detection. Perception &Psychophysics , 44 (4), 369–378.
138
Phillips, R., & Rawles, R. (1979, January). Recognition of upright and invertedfaces: A correlational study. Perception, 8 (5), 577–583.
Phillips, W. (1974). On the distinction between sensory storage and short-termvisual memory. Perception and Psychophysics , 16 (2), 283–290.
Phillips, W., & Christie, D. (1977, December). Components of visual memory.Quarterly Journal of Experimental Psychology , 29 (1), 117–133.
Pomerantz, J. R. (2003, November). Wholes, holes, and basic features in vision.Trends Cognitive Science, 7 (11), 471–473.
Pritchard, W. S., & Warm, J. S. (1983, June). Attentional processing and thesubjective contour illusion. J Exp Psychol Gen, 112 (2), 145–175.
Proverbio, A. M., & Zani, A. (2002, January). Electrophysiological indexes ofillusory contours perception in humans. Neuropsychologia, 40 (5), 479–491.
Pylyshyn, Z. (2006, January). Some puzzling findings in multiple object tracking(MOT): II. Inhibition of moving nontargets. Visual Cognition, 14 (2), 175–198.
Pylyshyn, Z. W., & Storm, R. W. (1988, January). Tracking multiple independenttargets: Evidence for a parallel tracking mechanism. Spatial Vision, 3 (3),179–197.
Raffone, A., & Wolters, G. (2001, August). A cortical mechanism for binding invisual working memory. Journal of Cognitive Neuroscience, 13 (6), 766–785.
Riddoch, M. J., Rappaport, S. J., & Humphreys, G. W. (2009, January).Extinction: A window into attentional competition. Progress in BrainResearch, 176 , 149–159.
Ringach, D. L., & Shapley, R. (1996, October). Spatial and temporal properties ofillusory contours and amodal boundary completion. Vision Research, 36 (19),3037–3050.
Rock, I., Linnett, C. M., Grant, P., & Mack, A. (1992, October). Perception withoutattention: Results of a new method. Cognitive Psychology , 24 (4), 502–534.
Ruchkin, D., Johnson, R., Canoune, H., & Ritter, W. (1990, November).Short-term memory storage and retention: An event-related brain potentialstudy. Electroencephalography and Clinical Neurophysiology , 76 (5), 419–439.
Ruchkin, D., Johnson, R., Grafman, J., Canoune, H., & Ritter, W. (1992, June).Distinctions and similarities among working memory processes: Anevent-related potential study. Cognitive Brain Research, 1 (1), 53–66.
139
Ruchkin, D., Johnson, R., Grafman, J., Canoune, H., & Ritter, W. (1997,February). Multiple visuospatial working memory buffers: Evidence fromspatiotemporal patterns of brain activity. Neuropsychologia, 35 (2), 195–209.
Ruchkin, D. S., Grafman, J., Cameron, K., & Berndt, R. S. (2003, December).Working memory retention systems: A state of activated long-term memory.Behavioral and Brain Sciences , 26 (6), 709-28; discussion 728–777.
Saariluoma, P. (1992, January). Error in chess: The apperception-restructuringview. Psychological Research, 54 (1), 17–26.
Saariluoma, P., & Kalakoski, V. (1997, July). Skilled imagery and long-termworking memory. American Journal of Psychology , 110 (2), 177–201.
Saariluoma, P., & Laine, T. (2001, April). Novice construction of chess memory.Scandinavian Journal of Psychology , 42 (2), 137–146.
Sasaki, Y. (2007, April). Processing local signals into global patterns. CurrentOpinion in Neurobiology , 17 (2), 132–139.
Sayim, B., Westheimer, G., & Herzog, M. H. (2010, May). Gestalt factors modulatebasic spatial vision. Psychological Science: A Journal of the AmericanPsychological Society , 21 (5), 641–644.
Scherf, K. S., Luna, B., Kimchi, R., Minshew, N., & Behrmann, M. (2008, April).Missing the big picture: Impaired development of global shape processing inautism. Autism Research, 1 (2), 114–129.
Scholl, B. J., Pylyshyn, Z. W., & Feldman, J. (2001, June). What is a visualobject? Evidence from target merging in multiple object tracking. Cognition,80 (1-2), 159–177.
Schultetus, R. S., & Charness, N. (2000, March). Recall or evaluation of chesspositions revisited: The relationship between memory and evaluation in chessskill. American Journal of Psychology , 112 (4), 555–569.
Scolari, M., Vogel, E. K., & Awh, E. (2008, February). Perceptual expertiseenhances the resolution but not the number of representations in workingmemory. Psychonomic Bulletin & Review , 15 (1), 215–222.
Seghier, M. L., & Vuilleumier, P. (2006, February). Functional neuroimagingfindings on the human perception of illusory contours. Neuroscience andBiobehavioral Reviews , 30 (5), 595–612.
Senkowski, D., Rottger, S., Grimm, S., Foxe, J. J., & Herrmann, C. S. (2005,February). Kanizsa subjective figures capture visual spatial attention:Evidence from electrophysiological and behavioral data. Neuropsychologia,43 (6), 872–886.
140
Shomstein, S., Kimchi, R., Hammer, M., & Behrmann, M. (2010, April). Perceptualgrouping operates independently of attentional selection: Evidence fromhemispatial neglect. Attention, Perception & Psychophysics , 72 (3), 607–618.
Singh, M., Hoffman, D. D., & Albert, M. K. (1999, September). Contourcompletion and relative depth: Petter’s rule and support ratio. PsychologicalScience, 10 (5), 423–428.
Sovrano, V. A., & Bisazza, A. (2009, January). Perception of subjective contours infish. Perception, 38 (4), 579–590.
Sperling, G. (1960). The information available in brief visual presentations.Psychological Monographs: General and Applied , 74 (11), 1-29.
Stanley, D. A., & Rubin, N. (2003, January). fmri activation in response to illusorycontours and salient regions in the human lateral occipital complex. Neuron,37 (2), 323–331.
Sugita, Y. (1999, September). Grouping of image fragments in primary visualcortex. Nature, 401 (6750), 269–272.
Tecce, J. J. (1972, February). Contingent negative variation (CNV) andpsychological processes in man. Psychological Bulletin, 77 (2), 73–108.
VanMarle, K., & Scholl, B. J. (2003, September). Attentive tracking of objectsversus substances. Psychological Science: A Journal of the AmericanPsychological Society / APS , 14 (5), 498–504.
Vianin, P., Posada, A., Hugues, E., Franck, N., Bovet, P., Parnas, J., et al. (2002,October). Reduced P300 amplitude in a visual recognition task in patients withschizophrenia. Neuroimage, 17 (2), 911–921.
Vicente, K. J., & Wang, J. H. (1998, January). An ecological theory of expertiseeffects in memory recall. Psychological Review , 105 (1), 33–57.
Vogel, E. K., & Machizawa, M. G. (2004, April). Neural activity predicts individualdifferences in visual working memory capacity. Nature, 428 (6984), 748–751.
Vogel, E. K., McCollough, A. W., & Machizawa, M. G. (2005, November). Neuralmeasures reveal individual differences in controlling access to working memory.Nature, 438 (7067), 500–503.
Vogel, E. K., Woodman, G. F., & Luck, S. J. (2006, December). The time course ofconsolidation in visual working memory. Journal of Experimental Psychology:Human Perception and Performance, 32 (6), 1436–1451.
141
Walker, P., & Davies, S. J. (2003, July). Perceptual completion and object-basedrepresentations in short-term visual memory. Memory & Cognition, 31 (5),746–760.
Wertheimer, M. (1938). Laws of organization in perceptual forms. A Source Bookof Gestalt Psychology , 71–88.
Westheimer, G. (1999, January). Gestalt theory reconfigured: Max Wertheimer’santicipation of recent developments in visual neuroscience. Perception, 28 (1),5–15.
Wilken, P., & Ma, W. (2004, December). A detection theory account of changedetection. Journal of Vision, 4 (12), 1120–1135.
Wilton, R. N., & File, P. E. (1975, May). Knowledge of spatial relations: Apreliminary investigation. Quarterly Journal of Experimental Psychology ,27 (2), 251–257.
Wolfe, J. M., & Bennett, S. C. (1997, January). Preattentive object files: Shapelessbundles of basic features. Vision Res , 37 (1), 25–43.
Wolfe, J. M., & Horowitz, T. S. (2004, June). What attributes guide the deploymentof visual attention and how do they do it? Nat Rev Neurosci , 5 (6), 495–501.
Wolfe, J. M., Klempen, N., & Dahlen, K. (2000, January). Postattentive vision.Journal of Experimental Psychology: Human Perception and Performance,26 (2), 693–716.
Wolff, A. S., Mitchell, D. H., & Frey, P. W. (1984, September). Perceptual skill inthe game of Othello. Journal of Psychology , 118 (1ST Half), 7–16.
Wolters, G., & Raffone, A. (2008, March). Coherence and recurrency: Maintenance,control and integration in working memory. Cognitive Processing , 9 (1), 1–17.
Woodman, G. F., & Luck, S. J. (2003, February). Serial deployment of attentionduring visual search. Journal of Experimental Psychology: Human Perceptionand Performance, 29 (1), 121–138.
Woodman, G. F., Vecera, S. P., & Luck, S. J. (2003, May). Perceptual organizationinfluences visual working memory. Psychonomic Bulletin & Review , 10 (1),80–87.
Woodman, G. F., & Vogel, E. K. (2008, February). Selective storage andmaintenance of an object’s features in visual working memory. PsychonomicBulletin & Review , 15 (1), 223–229.
142
Xu, Y. (2002, November). Encoding color and shape from different parts of anobject in visual short-term memory. Perception & Psychophysics , 64 (8),1260–1280.
Xu, Y. (2006, July). Understanding the object benefit in visual short-term memory:The roles of feature proximity and connectedness. Perception & Psychophysics ,68 (5), 815–828.
Xu, Y., & Chun, M. M. (2005, December). Dissociable neural mechanismssupporting visual short-term memory for objects. Nature, 440 (7080), 91–95.
Xu, Y., & Chun, M. M. (2007, November). Visual grouping in human parietalcortex. Proceedings of the National Academy of Sciences of the United States ofAmerica, 104 (47), 18766–18771.
Yantis, S. (1992, July). Multielement visual tracking: Attention and perceptualorganization. Cognitive Psychology , 24 (3), 295–340.
Yin, R. (1969). Looking at upside-down faces. Journal of Experimental Psychology ,81 (1), 141–145.
Zhang, W., & Luck, S. J. (2008, May). Discrete fixed-resolution representations invisual working memory. Nature, 453 (7192), 233–235.
Zimmer, H. D. (2008). Visual and spatial working memory: From boxes tonetworks. Neuroscience and Biobehavioral Reviews , 32 (8), 1373–1395.
143


![A Holistic Automatic Method for Grouping Facial Features Based … · features into a gestalt whole when it processes face information (holistic face processing, [11]), decreasing](https://img.pdfslide.us/doc/110x75/5f90430e03fed844e035dfb2/a-holistic-automatic-method-for-grouping-facial-features-based-features-into-a-gestalt.jpg)


![Simultaneous Edge Alignment and Learning...mid-level grouping problem where Gestalt laws and perceptual grouping play considerable roles in algorithm design [23,7,44,16]. Latter works](https://img.pdfslide.us/doc/110x75/60b1c0cadd803d392e43f99e/simultaneous-edge-alignment-and-learning-mid-level-grouping-problem-where-gestalt.jpg)