Embed Size (px)
Citation preview
The Influence of Formal and Informal Controls on Employee
Performance: Three Essays
Ruidi Shang
Department of Accounting
The University of Melbourne
ORCID identifier: 0000-0002-6671-0764
Doctor of Philosophy
July 2017
Submitted in total fulfilment of the requirements of the degree of Doctor of
Philosophy
Produced on archival quality paper
ii
DECLARATION
This is to certify that:
(1) This thesis compromises only my original work;
(2) Due acknowledgment has been made to in the text to all other material used;
(3) This thesis is less than 100,000 words in length, exclusive of tables, figures,
bibliographic references and appendices.
Ruidi Shang
03 July 2017
iii
ACKNOWLEDGEMENTS
The past four years have been a wonderful journey for me. I could explore the area that I am
interested in, build up my ability and skills in doing research, and share ideas with wonderful
people from all over the world. None of these could happen without the support from my
supervisors, colleagues, friends, and family. I am glad to express my deep and sincere gratitude
to them.
First and most, I would like to thank my supervisor, Prof. Maggie Abernethy, for her enormous
help, great guidance, and critical evaluation of my work throughout the last four years. When I
joined the Ph.D. program in 2013, I was inexperienced, depressed, and not sure about what I
should do in the future. Maggie found me and kindly offered to be my supervisor. In the past
four years, she helped me find myself and grow up into a mature, responsible person and an
enthusiastic accounting researcher. I cannot remember how many times she read my thesis and
how many comments she has given me (all of which are fast and constructive)! Her kind and
sharp feedback not only helped me develop this thesis but also helped me find my interests in
management accounting research. I really appreciate the effort that she put into my thesis and
the Ph.D. program, and I really enjoy working with her. Maggie is the best role model that I
can even imagine. She works so efficiently and effectively, which changed my view about
lifestyle and helped me become an efficient worker. As an academic, she cares for people in
both academia and practice. Her attitude and vision amazed me and changed the way that I
think of my responsibility in the society. She has demonstrated what is an academic, a mentor,
and a real woman. I have learned a lot from her, and I will keep learning.
I would also like to thank Dr. Chung-Yu Hung, who has been my co-supervisor since 2015.
Chung-Yu gave me wonderful comments and suggestions in the last two years. When I was
frustrated about the framework of my thesis, Chung-Yu gave me enormous help so that I can
eventually develop the three papers in this thesis. Chung-Yu had numerous chats with me and
I really appreciate her effort, patience, and advice. I am thankful for having her as my co-
supervisor. I will remember all the fun we had together and look forward to having more in the
future!
I was fortunate to be part of the Department of Accounting at the University of Melbourne. It
is a wonderful department and I received tremendous support from its faculty members and
Ph.D. students. I would like to give my special thanks to Prof. Greg Clinch, who recruited me
into the Ph.D. program and opened the gate of a wonderful world for me. I give my sincere
thanks to Prof. Naomi Soderstrom and Prof. Anne Lillis, who gave me constant support,
extremely useful feedback, and wise advice in the last four years and in the job market. I thank
Prof. Floral Kuang and Bo Qin for their useful feedback and kind encouragement. I also
appreciate that they shared their life experiences in the Netherlands with me, which prepared
me for the next journey! I thank Dr. Gladys Lee for all the thoughts and experiences she shared
with me, and all the good time we spent together. I also thank Prof. Michael Davern, Prof.
iv
Jennifer Grafton, and Dr. Stephan Schantl for their support and feedback. I also thank the Ph.D.
fellows in the department. They provide me with constant help and make the last four years
more tasteful. I thank the Department for funding me and supporting me in attending various
conferences.
I am highly indebted to the faculty members in Harvard Business School (HBS) for their
support and feedback. They made my visit in HBS enjoyable, fruitful, and memorable. I
especially thank Prof. Dennis Campbell, who not only helped me improve my paper and
prepared me for the job market but also shared many inspiring ideas (and the best coffee in
Boston) with me. I truly appreciate his effort and the wonderful time we spent together. I would
like to thank Wei Cai (now a Ph.D. student at HBS). Without her, I would not be able to
overcome the pressure on the job market. We spent so much wonderful time working and eating
together. I also thank Carolyn, Jee Eun, Jihwon, Paul, and the other PhD fellows for their help
and feedback. I thank Ms. Ellen Willemin for helping arrange my visit.
I was fortunate enough to receive tremendous help from academics around the world. I would
like to thank the participants in the 2016 EAA Doctoral Symposium and the 2017 GMARS
conference, as well as the faculty members at Tilburg University, the University of Amsterdam,
and the University of New South Wales, for their kind and constructive comments on my papers.
I give my special thanks to Prof. Shannon Anderson, for her comments on my paper and her
wonderful classes. My sincere thanks also go to Prof. Michael Williamson, who has been
helping me since 2014. Michael gave me wonderful life and career suggestions, as well as sharp
and detailed feedback on my job market paper. I give great thanks to Prof. Stephan Hollander,
for his critical feedback, the opportunities he kindly offered me, and all the generous help I
received from him. I thank Prof. Eddy Cardinaels for his sharp and thorough comments. I also
thank Prof. Laurance ven Lent, Shane Dikolli, Eva Labro, Karen Sedatole, Jeroen Suijs, Jan
Bowens, Victor Maas, Henri Dekker, Frank Moers, and Gavin Cassar, for their help and
feedback. I also thank my colleagues and friends Lu Yang, Nan Jiang, Wenjiao Cao, Yusiyu
Wang, and Ties de Kok for their support and all the fun we had together.
Finally, I would like to thank my parents for their life-long support. I thank my father for his
unconditional love and support. My deepest thanks go to my mother, an incredible woman who
came from a small village but used all her effort and recourses to help her daughter explore the
big world. Without her vision, support, and hard work in the last 26 years, I would not be able
to have so many wonderful experiences. I hope this thesis makes her proud.
v
TABLE OF CONTENTS
Chapter 1 Thesis Outline…………………………………………………………………… 1
1.1 Overview……………………………………………………………………... 1
1.2 Outline of the Three Essays........…………………………………………...... 3
1.3 Conclusion...…………………………………………………………………. 6
Chapter 2 Performance Reporting Transparency, Group Identity, and Employee
Performance………………………………………………………………….... 10
2.1 Introduction...…………………………………………………………………. 11
2.2 Literature and Hypothesis Development…………………………………….... 16
2.3 Research Site…………………………………………………………….…..... 22
2.4 Method…………………………………….………………………………...... 27
2.5 Results…………………………………..…………………………………….. 34
2.6 Concluding Remarks………………………………………………………….. 57
Chapter 3 Work Norms as a Control Mechanism: Implications for Employee
Performance…………………………………………………………………...… 67
3.1 Introduction...…………………………………………………………………. 68
3.2 Literature and Hypothesis Development…………………………………….... 72
3.3 Research Site…………………………………………………………….…..... 77
3.4 Method…………………………………….………………………………...... 80
3.5 Results…………………………………..…………………………………….. 89
3.6 Concluding Remarks………………………………………………………… 102
vi
Chapter 4 Internal Reporting, Personal Connections, and Employee Performance… 110
4.1 Introduction...……………………………………………………………….. 111
4.2 Literature and Hypothesis Development…………………………………….. 114
4.3 Research Site…………………………………………………………….…... 121
4.4 Method…………………………………….……………………………….... 127
4.5 Results…………………………………..…………………………………… 137
4.6 Concluding Remarks………………………………………………………… 149
Chapter 5 Conclusion…………………………………………………………………….. 156
5.1 Summary……………………………………………………………………. 156
5.2 Contributions……………….…………………………………..…………… 156
5.3 Limitations and Future Research…………………………………….……… 157
vii
LIST OF FIGURES
Chapter 2 Performance Reporting Transparency, Group Identity, and Employee
Performance
Figure 1 Performance Reporting at the Research Site ...……...…………………. 26
Figure 2 Employee Performance in the Group that Changed from Private Reporting
to Public Reporting at the End of 2013……………………………….... 50
Chapter 3 Work Norms as a Control Mechanism: Implications for Employee
Performance
Figure 1 Motivation and Research Question……………………………………… 76
Figure 2 Theoretical Model……………….…………………………………….... 77
Figure 3 Timeline and Groups in the Research Site.………………….……........... 81
Figure 4 Empirical Model……………….………………………………...…….... 89
Figure 5 Promotion of Work Norms and Employee Performance …...………….. 92
Figure 6 Removal of Work Norms and Employee Performance………………… 101
Chapter 4 Internal Reporting, Personal Connections, and Employee Performance
Figure 1 Theoretical and Empirical Framework…………………………………….. 118
Figure 2 Performance Reporting at the Research Site....……...…….………..…. 125
Figure 3 Personal Connections at the Research Site..……………………….…... 126
Figure 4 Theoretical and Empirical Framework………….…………………….... 135
Figure 5 Timeline and Groups………………………..………………….……… 136
viii
LIST OF TABLES
Chapter 2 Performance Reporting Transparency, Group Identity, and Employee
Performance
Table 1 Sample Selection ...………………………………………………………. 29
Table 2 Survey Instruments ...……………………………………………………. 36
Table 3 Descriptive Statistics ...……………………………………………..……. 39
Table 4 Pearson Correlations ...……………………………………………..……. 41
Table 5 Performance Reporting Transparency, Group Identity, and Employee
Performance …………..…………………………………….…………….. 44
Table 6 Group Identity and Employee Performance under Public Reporting..….. 47
Table 7 Group Identity and Employee Performance in a Department with Public
Reporting………...…..…………………………………….…………….. 54
Table 8 Determinants of Group Identity…………………………………..…..…. 56
Chapter 3 Work Norms as a Control Mechanism: Implications for Employee
Performance
Table 1 Sample Selection and Structure ...………………………………………. 84
Table 2 Descriptive Statistics of Employee Performance...………………….……. 91
Table 3 Pearson Correlations ...……………………………………………..……. 94
Table 4 Managers’ Promotion of Work Norms and Employee Performance…..... 96
Table 5 Managers’ Promotion of Work Norms and Employee Performance:
Estimations by Demographic Groups ………………...………………….. 98
Table 6 Removal of Work Norms and Employee Performance ………………… 100
ix
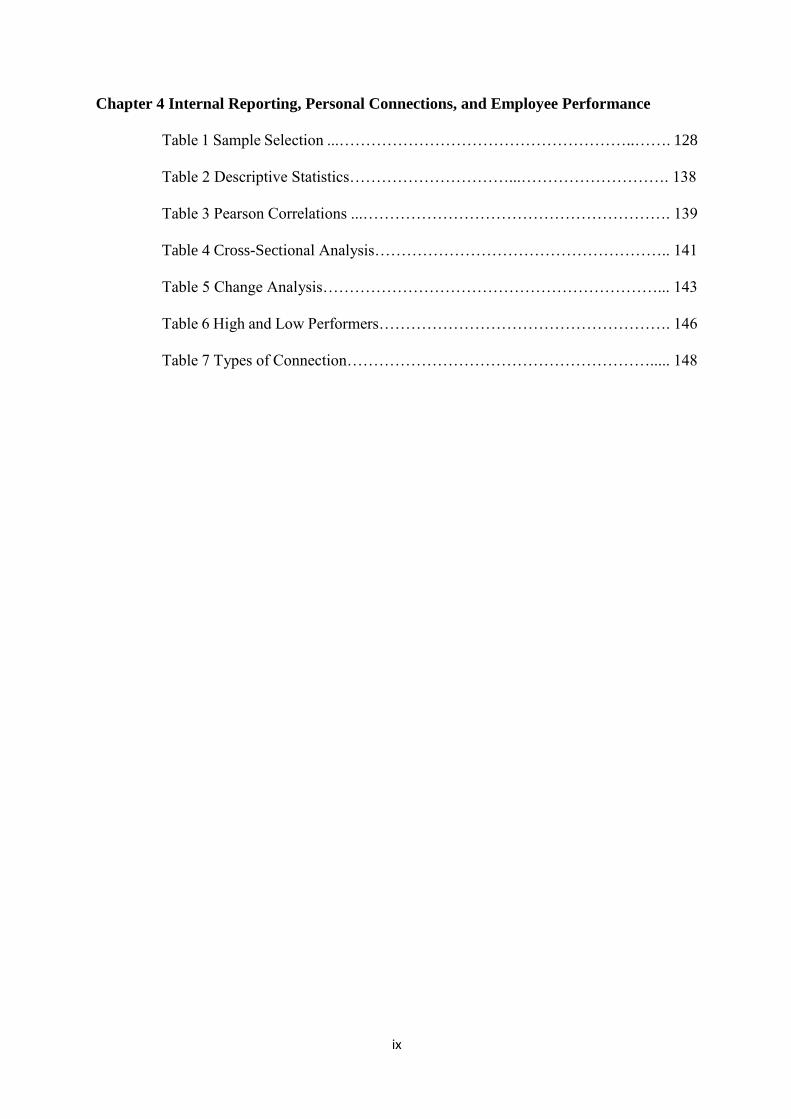
Chapter 4 Internal Reporting, Personal Connections, and Employee Performance
Table 1 Sample Selection ...………………………………………………..……. 128
Table 2 Descriptive Statistics…………………………...………………………. 138
Table 3 Pearson Correlations ...…………………………………………………. 139
Table 4 Cross-Sectional Analysis……………………………………………….. 141
Table 5 Change Analysis………………………………………………………... 143
Table 6 High and Low Performers………………………………………………. 146
Table 7 Types of Connection…………………………………………………..... 148
CHAPTER 1: THESIS OUTLINE
1
CHAPTER I
THESIS OUTLINE
1.1 Overview
This thesis includes three essays that examine how management control systems (MCSs) affect
the behavior of lower-level employees. MCSs play an important role in directing the task
performance of lower-level employees. Managers can align employees’ interests with the
organization’s goals and strategic priorities, and motivate employee actions that contribute to
the desired organizational outcomes through the design of MCSs. Management controls
include both formal and informal controls (Gibbson and Kaplan 2015; Langfield-Smith 1997).
Formal controls—such as financial incentives, performance reporting, and employee
selection—are commonly used by organizations to motivate employee performance. However,
the effectiveness of these formal controls is conditional upon the informal controls, which work
through the cultures and norms that develop within organizations, or by encouraging employees’
identification with their organizations or workgroups. Little research has been conducted on
the role of informal controls, or whether they are effective in motivating employee performance.
The three essays in this thesis add to the existing literature by documenting how formal and
informal controls jointly affect employee performance.
I draw on psychology, management, and economic literature to inform my empirical models.
The development of social identity theory (Akerlof and Kranton 2000, 2003, 2010; Ashforth
and Mael 1989; Hogg 2006; Hogg and Terry 2000; Turner 1991), social comparison theory
(Festinger 1954; Suls and Wheeler 2000), and theories on social and work norms (Cialdini,
Kallgren, and Reno 1990, 1991; Cialdini and Goldstein 2004; Cialdini and Trost 1998) provide
CHAPTER 1: THESIS OUTLINE
2
theoretical foundations for the three studies relating to formal and informal controls. Drawing
on these theories, I examine how employee performance is affected by internal performance
reporting and group identity (essay 1), managers’ promotion of work norms (essay 2), and the
personal connections that employees have in the workplace (essay 3).
I conducted the three studies in a state-owned enterprise (SOE) in China. The SOE provides a
rich dataset of employee performance throughout multiple periods. A range of different formal
controls—including performance measurement and financial incentives, performance
reporting, and employee selection—are adopted in this organization. Additionally, employees’
group identity, work norms, and personal connections are salient in this setting, which allows
the informal norms and beliefs of employees to function as part of the organization’s control
system. These features make this organization an ideal setting for the studies in this thesis.
Specifically, I conduct the first and the third studies in a department with 146 employees. This
department has variation in performance reporting transparency. It allows me to examine how
employee performance is related employees’ group identity and personal connections, and
whether these relations are conditional upon the performance reporting choices made by
managers. I conduct the second study in a different department with 169 employees. Two out
of the five group leaders in this department have taken actions to promote work norms within
their groups. This allows me to examine whether managers’ promotion of work norms is
effective in motivating employee performance in a setting where weak financial incentives are
adopted.
CHAPTER 1: THESIS OUTLINE
3
1.2 Outline of the Three Essays
Essay 1: Performance Reporting Transparency, Group Identity and Employee
Performance
The first essay examines the relation between group identity and employee performance in
groups with private reporting (i.e., employees receive information on their own performance
only) and groups with public reporting (i.e., employees receive information on their own and
their peers’ performance). Using laboratory settings, previous studies find that compared with
private reporting, public reporting is more effective in motivating employee performance
(Hannan et al. 2013; Tafkov 2012). Public reporting makes employees concerned about their
self-image and motivates employees to demonstrate higher performance to “look good” in front
of their peers (Luft, 2016). However, in practice, how employees behave under private and
public reporting may depend on their group identity. “Group identity” is the extent to which
employees identify with their workgroups. Economics, management, and psychology theories
suggest that group identity plays an important role in directing individual behaviors (Akerlof
and Kranton 2000, 2003, 2010; Ashforth and Mael 1989; Hogg and Terry 2000; Terry, Hogg,
and White 1999; Turner 1991). In this study, I examine how group identity is related to
employee performance, and whether the relation between the two variables varies across
workgroups with private and public reporting.
I examine the research question in a department with 146 employees and five workgroups,
three of which adopt private reporting and the other two adopt public reporting. The results
indicate that the relation between group identity and employee performance is conditional upon
managers’ choice regarding performance reporting transparency. Under private reporting,
group identity motivates employees to improve their performance; while under public reporting,
group identity motivates employees with high (low) ability to suppress (improve) their
CHAPTER 1: THESIS OUTLINE
4
performance to look more similar to their peers. These findings add to the literature on internal
reporting (Azmat and Iriberri 2010; Frederickson 1992; Hannan, Krishnan, and Newman 2008;
Hannan McPhee, Newman, and Tafkov 2013; Maas and Van Rinsum 2013; Tafkov 2012), as
well as the growing literature on employees’ group identity (Abernethy, Bouwens, and Kroos
2017; Boivie, Lange, McDonald, and Westphal 2011; Towry 2003). This study also has
practical implications, as the findings suggest that when making decisions about performance
reporting transparency, managers need to consider employees’ group identity and ability, as
well as the performance distribution in the workplace.
Essay 2: Work Norms as a Control Mechanism—Implications for Employee Performance
The second essay examines one mechanism that can be used as part of an organization’s
management control system: manager’s promotion of work norms. In laboratory settings,
psychology studies find that focusing individuals’ attention on a particular norm leads to
individuals’ adoption of the norm (Cialdini et al. 1990, 1991). In organizations, it is an
empirical question whether managers can motivate employee performance through deliberately
promoting the work norms that contribute to the desired organization outcomes. On the one
hand, the formal control mechanisms used in organizations, such as financial incentives, may
overrule the effect of the work norms (Ariely, Loewenstein, and Prelec 2006; Gneezy and
Rustichini 2000; Taylor and Bloomfield 2010). On the other hand, work norms may
complement financial incentives by guiding and motivating employees to demonstrate high
performance (Akerlof and Kranton 2000, 2003; Ashforth and Meal 1989; Hogg and Terry
2000). This study examines this question in a multi-task setting, where the control problem is
to motivate desirable employee actions that can be precisely measured and desirable employee
actions that cannot be precisely measured.
CHAPTER 1: THESIS OUTLINE
5
I conducted this study in a department with 169 employees and five workgroups, where the
leaders of two of the groups take procedures to promote work norms within their groups. The
promoted work norms require employees to engage in desirable actions that can be precisely
measured as well as desirable actions that cannot be precisely measured. The procedures that
the two group leaders take include directly communicating the work norms to employees, as
well as using feedback and recognition to focus employees’ attention on the work norms. The
performance measurement and reward system used by the SOE allowed me to not only measure
employee actions that can be precisely measured, but also construct a proxy for employee
actions that cannot be precisely measured. The results indicate that the group leaders’
promotion of work norms is related to an increase in both types of action. After removing the
work norms, employee performance on tasks that can be precisely measured declined, while
employee performance on tasks that cannot be precisely measured did not change significantly.
These findings contribute to the literature on management controls and employee performance.
The existing literature suggests that the use of financial incentives is subject to high monetary
costs and potential unintended consequences (e.g., employees will pay less attention to tasks
that cannot be measured precisely). This study finds that managers’ promotion of work norms
can complement financial incentives by motivating the desirable actions of employees,
especially for tasks that cannot be precisely measured. The findings also help managers to
better understand how their practices affect the way that employees perform their tasks.
Essay 3: Internal Reporting, Personal Connections and Employee Performance
The third essay examines how personal connections affect the relation between performance
reporting transparency and employee performance. Drawing on social comparison theory
(Festinger 1954; Suls and Wheeler 2000), existing studies experimentally find that reporting
CHAPTER 1: THESIS OUTLINE
6
employee performance publicly in the workplace increases employees’ concern for their self-
image, and motivates employees to demonstrate high performance to “look good” in front of
their peers (Hannan et al. 2013; Tafkov 2012). However, in real-world organizations, different
types of employees may have different image concerns and react differently toward public
reporting. This study examines whether the performance impact of public reporting varies
across employees with and without personal connections in the workplace.
This study focuses on two types of personal connection: the referrer–referral connection and
the family connection. Both types of connections are common in organizations, and can be
important to managers’ decision-making regarding employee selection. Based on social
psychology literature, both types of connection are likely to increase employees’ image concern
(Cupach and Metts 1994; Goffman 1979; Tedeschi 2013). The employee selection channels
and criteria of the SOE allow me to classify employees into two groups: those with and those
without personal connections in the SOE. By comparing the two types of employees, I find that
public reporting has a significant and positive performance effect on those with personal
connections. However, it has no significant effect on the performance of employees who have
no personal connections. These findings contribute to the literature on internal performance
reporting (Hannan et al. 2013; Luft 2016; Maas and Rinsum 2013; Tafkov 2013) and employee
selection (Abernethy, Dekker, and Schultz 2015; Campbell 2012), and suggest that managers
need to consider internal performance reporting and employee selection as integrated control
choices.
1.3 Conclusion
The three essays in this thesis examine how formal and informal controls jointly affect the task
performance of lower-level employees. Drawing on behavioral theories in the social
CHAPTER 1: THESIS OUTLINE
7
psychology, management, and economic literature, and using archival and survey data from a
field site, I find that formal and informal controls function as an integrated system. First, in
settings where group identity is salient, the relation between group identity and employee
performance is conditional on managers’ decisions regarding performance reporting
transparency. Second, in multi-tasking settings where employee performance in some tasks
cannot be precisely measured, managers can combine the use of financial incentives with the
promotion of work norms. Third, the relation between performance reporting transparency and
employee performance is conditional upon employees’ personal connections, which can be
controlled by employee selection channel and criteria. These findings not only add to the
management accounting literature, but also have important implications for the design and
implementation of management controls in organizations.
The remainder of this thesis is structured as follows. Each chapter describes one of the three
essays in detail. The structure of each chapter allows the three essays to be read separately and
in a different order than that presented here. Chapter 2 presents the study that examines the
relation between group identity and employee performance under private and public reporting.
Chapter 3 presents the study on managers’ promotion of work norms. Chapter 4 presents the
study on how personal connections in the workplace affect the performance impact of public
reporting. Chapter 5 concludes the thesis by summarizing the findings, contributions, and
limitations.
CHAPTER 1: THESIS OUTLINE
8
REFERENCES
Abernethy, M., J. Bouwens, and P. Kroos. 2017. Organization identity and earnings
manipulation. Accounting, Organizations and Society. Available at:
http://www.sciencedirect.com/science/article/pii/S0361368217300193 [Accessed 31
May 2017]
Abernethy, M. A., H. C. Dekker, and A. Schultz. 2015. Are employee selection and incentive
contracts complements or substitutes? Journal of Accounting Research 53(4): 633–668.
Akerlof, G. A., and R. E. Kranton. 2000. Economics and identity. Quarterly Journal of
Economics 115(3): 715–753.
Akerlof, G. A., and R. E. Kranton. 2003. Identity and the economics of organizations. The
Journal of Economic Perspectives 19(1): 9–32.
Akerlof, G. A., and R. E. Kranton. 2005. Identity and the Economics of Organizations. Journal
of Economic Perspectives 19(1): 9–32.
Akerlof, G. A., and R. E. Kranton. 2008. Identity, supervision, and work groups. The American
Economic Review 98(2): 212–217.
Akerlof, G. A., and R. E. Kranton. 2010. Identity Economics: How Our Identities Shape Our
Work, Wages, and Well-Being. Princeton, NJ: Princeton University Press.
Ariely, D., G. Loewenstein, and D. Prelec. 2006. Tom Sawyer and the construction of value.
Journal of Economic Behavior and Organization 60(1): 1–10.
Ashforth, B. E., and F. Mael. 1989. Social identity theory and the organization. Academy of
Management Review 14(1): 20–39.
Azmat, G., and N. Iriberri. 2010. The importance of relative performance feedback information:
Evidence from a natural experiment using high school students. Journal of Public
Economics 94(7): 435–452
Boivie, S., D. Lange, M. L McDonald, and J. D. Westphal. 2011. Me or we: The effects of CEO
organizational identification on agency costs. Academy of Management Journal 54(3):
551–576.
Bonner, S. E., R. Hastie, G. B. Sprinkle, and S. M. Young. 2000. A review of the effects of
financial incentives on performance in laboratory tasks: Implications for management
accounting. Journal of Management Accounting Research 12(1): 19–64.
Bonner, S. E., and G. B. Sprinkle. 2002. The effects of monetary incentives on effort and task
performance: Theories, evidence, and a framework for research. Accounting,
Organizations and Society 27(4): 303–345.
Campbell, D. 2012. Employee selection as a control system. Journal of Accounting Research
50(4): 931–966.
Cialdini, R. B., C. A. Kallgren, and R. R. Reno. 1990. A focus theory of normative conduct:
recycling the concept of norms to reduce littering in public places. Journal of Personality
and Social Psychology 58(6): 1015–1026.
Cialdini, R. B., C. A. Kallgren, and R. R. Reno. 1991. A focus theory of normative conduct: A
theoretical refinement and re-evaluation of the role of norms in human behavior.
Advances in Experimental Social Psychology 24: 201–234.
Cupach, W. R., and S. Metts. 1994. Facework. Thousand Oaks, CA: Sage Publications.
Festinger, L. 1954. A theory of social comparison processes. Human Relations 7(2): 117–140.
Frederickson, J. R. 1992. Relative performance information: The effects of common
uncertainty and contract type on agent effort. The Accounting Review 67(4): 647–669.
Gibbons, R., and R. S. Kaplan. 2015. Formal measures in informal management: Can a
balanced scorecard change a culture? American Economic Review: Papers and
Proceedings 105(5): 447–451.
Gneezy, U., and A. Rustichini. 2000. A fine is a price. Journal of Legal Studies 29: 1–17.
CHAPTER 1: THESIS OUTLINE
9
Goffman, E. 1979. The Presentation of Self in Everyday Life. England: Penguin.
Hannan, R. L., R. Krishnan, and A. H. Newman. 2008. The effects of disseminating relative
performance feedback in tournament and individual performance compensation plans.
The Accounting Review 83(4): 893–913.
Hannan, R. L., G. P. McPhee, A. H. Newman and I. D. Tafkov. 2013. The effect of relative
performance information on performance and effort allocation in a multi-task
environment. The Accounting Review 88(2): 553–575.
Hogg, M. A. 2006. Social identity theory. In Contemporary Social Psychological Theories,
edited by P. J. Burk, 111–136. Stanford, CA: Stanford University Press.
Hogg, M. A., and D. I. Terry. 2000. Social identity and self-categorization processes in
organizational contexts. Academy of Management Review 25(1): 121–140.
Luft, J. 2016. Cooperation and competition among employees: Experimental evidence on the
role of management control systems. Management Accounting Research.
doi:10.1016/j.mar.2016.02.00
Kachelmeier, S. J., B. E. Reichert, and M. G. Williamson. 2008. Measuring and motivating
quantity, creativity, or both. Journal of Accounting Research 46(2): 341–373.
Langfield-Smith, K. 1997. Management control systems and strategy: A critical review.
Accounting, Organizations and Society 22 (2): 202–232.
Maas, V. S., and M. Van Rinsum. 2013. How control system design influences performance
misreporting. Journal of Accounting Research 51(5): 1159–1186.
Sprinkle, G. B. 2000. The effect of incentive contracts on learning and performance. The
Accounting Review 75(3): 299–326.
Suls, J., and L. Wheeler. 2000. Handbook of Social Comparison: Theory and Research. New
York, NY: Kluwer Academic/Plenum Publishers.
Tafkov, I. D. 2012. Private and public relative performance information under different
compensation contracts. The Accounting Review 88(1): 327–350.
Tedeschi, J. T. (Ed.) 2013. Impression Management Theory and Social Psychological
Research. NY: Academic Press.
Terry, D. J., M. A. Hogg, and K. M. White. 1999. The theory of planned behavior: Self-identity,
social identity and group norms. British Journal of Social Psychology 38(3): 225–244.
Towry, K. L. 2003. Control in a teamwork environment—The impact of social ties on the
effectiveness of mutual monitoring contracts. The Accounting Review 78(4): 1069–1095.
Turner, J. C. 1991. Social Influence. Pacific Grove, CA: Brooks/Cole.
CHAPTER 2: PERFORMANCE REPORTING TRANSPARENCY, GROUP IDENTITY AND
EMPLOYEE PERFORMANCE
CHAPTER II
PERFORMANCE REPORTING TRANSPARENCY, GROUP IDENTITY
AND EMPLOYEE PERFORMANCE
ABSTRACT
Experimental evidence indicates that compared with private reporting (i.e., employees receive
information on their own performance only), public reporting (i.e., employees receive
information on their own and their peers’ performance) is more effective in motivating
employee performance, as public reporting increases employees’ concern for their self-image.
However, in practice, employees’ image concern may depend on their group identity—the
extent to which employees identify with their workgroups. This study investigates the relation
between group identity and employee performance under private and public reporting. Using
archival and survey data from a Chinese organization, I find that in work groups with private
reporting, group identity is positively related to employee performance. However, in work
groups with public reporting, group identity is negatively related to employee performance. I
explore this further and find that, under public reporting, group identity is negatively (positively)
related to the performance of employees with high (low) ability. This study extends prior
research on the influence of performance reporting transparency on employee performance. It
also highlights the importance for managers to consider the group identity and ability of their
subordinates when making internal reporting choices.
CHAPTER 2: PERFORMANCE REPORTING TRANSPARENCY, GROUP IDENTITY AND
EMPLOYEE PERFORMANCE
11
2.1 Introduction
Social comparison theories in psychology suggest that individuals tend to compare themselves
with others. Doing so allows individuals to evaluate their ability, and adjust their behaviors to
maintain a positive self-image in their social or work group (Festinger 1954; Suls and Wheeler
2000). In organizations, social comparisons make internal performance reporting an important
control mechanism. The way that employee performance is reported in organizations affects
the information that employees receive, the benchmark that they choose to evaluate themselves,
and their subsequent performance. Experimental evidence indicates that compared with private
reporting (i.e., employees receive information on their own performance only), public reporting
(i.e., employees receive information on their own and their peers’ performance) is more
effective in motivating employee performance, as public reporting increases employees’
concern for their self-image (Hannan, McPhee, Newman, and Tafkov 2013; Maas and Rinsum,
2013; Tafkov, 2012). However, in practice, employees’ concern for their self-image may
depend on the extent to which employees perceive themselves as a part of their work group, or
in other words, employees’ group identity.
“Group identity” refers to the extent to which employees identify with their work group
(Akerlof and Kranton 2000, 2003, 2010; Ashforth and Mael 1989). Employees with high group
identity have strong motivation to adjust their performance to enhance their self-image as
members of their group (Akerlof and Kranton 2000, 2003, 2010; Ashforth and Mael 1989;
Hogg and Terry 2000; Terry, Hogg, and White 1999; Turner 1991; Van Knippenberg 2000; Yun,
Takeuchi, and Liu 2007). Performance reporting transparency (private vs. public) affects the
information environment within work groups and the performance benchmark that employees
can choose to evaluate their performance. Therefore, managers’ choice of reporting
transparency is likely to affect the relation between group identity and employee performance.
CHAPTER 2: PERFORMANCE REPORTING TRANSPARENCY, GROUP IDENTITY AND
EMPLOYEE PERFORMANCE
12
This study investigates the relation between group identity and employee performance in
groups with private reporting and groups with public reporting. Examining this question
extends prior research on the influence of performance reporting transparency on employee
performance. This study also highlights the importance for managers to consider the group
identity of their subordinates when making internal reporting choices.
Under private reporting, managers provide employees with information on their own
performance, but not the information on their peers’ performance. Employees do not receive
information on the descriptive norms (i.e., the performance of other employees) of their group.
Therefore, under private reporting, the performance requirements set by the organization tend
to be a more salient performance benchmark than the descriptive norms. Based on the existing
theories, group identity may motivate employees to increase their compliance with the
performance requirements, to reinforce their self-image as organizational participants and
members of their workgroups (Akerlof and Kranton 2000, 2003; Ashforth and Mael 1989;
Hoagg and Terry 2000). Increasing compliance with the performance requirements set by the
organization allows employees to demonstrate higher performance. Therefore, I expect that
group identity is positively related to employee performance in workgroups with private
reporting,
Under public reporting, employees not only can observe the descriptive norms of their groups,
but also are aware that their own performance can be observed by others in their group. It is
unclear how group identity is related to employee performance under public reporting. On the
one hand, employees with high group identity may still be motivated to demonstrate high
performance, as what they would do under private reporting. On the other hand, employees
with high group identity may be motivated to adjust their performance to look more similar to
CHAPTER 2: PERFORMANCE REPORTING TRANSPARENCY, GROUP IDENTITY AND
EMPLOYEE PERFORMANCE
13
others in their group (or in other words, conforming to the group descriptive norms).
Conforming to the group descriptive norms can reinforce employees’ self-image as group
members and prevent them from receiving social punishment from other group members (e.g.,
contempt for low performers, envy for high performers, or even social isolation) (Akerlof and
Kranton 2000, 2010; Charness, Masclet, and Villeval 2013; Smith 2000; Vecchio 2000).
Employees with high group identity may be motivated to increase or decrease their
performance to conform to the group descriptive norms. A potential downside of public
reporting is that some employees may decrease their performance to conform to look more
similar to others in their group. If this is the case, the relation between group identity and
employee performance under public reporting will not be as positive as under private reporting.
Therefore, I hypothesize that there is a positive relation between group identity and employee
performance; and this relation is more positive under private reporting than under public
reporting.
I examine the hypothesis using archival and survey data from a large department within a
Chinese state-owned enterprise (SOE). Employees in this department are responsible for
equipment inspection, operation and maintenance. The department head divides employees
into five workgroups to improve the efficiency of the management. Three features of this
department makes it an ideal setting for this study. First, three of the five workgroups in this
department adopt private reporting, and the other two adopt public reporting. In the three
groups with private reporting, the group leaders provide each group member with a note with
his or her own name and performance on it at the end of every month. In the two groups with
public reporting, the group leaders print the names and performance of all group members in a
table, and distribute this performance table within their groups at the end of every month. The
variation in the performance reporting practices provides an opportunity to examine the role of
CHAPTER 2: PERFORMANCE REPORTING TRANSPARENCY, GROUP IDENTITY AND
EMPLOYEE PERFORMANCE
14
performance reporting transparency with the contextual factors controlled. Second, employees’
group identity is salient in this setting, as employees usually work in the same workgroups for
years and engage various activities with the other members of their workgroups. This feature
provides an opportunity to examine the relation between group identity and employee
performance. Third, the operating environment of this setting is stable. Because of several
features of the SOE (explained in detail in the research site section), most employees work in
the organization and the same workgroups for many years. It allows the examination of
employee performance in multiple periods, which helps mitigate potential biases caused by
unobservable factors in certain time period(s).
I measure employee performance using the archival data of the monthly performance of
employees, and measure employees’ group identity using the survey instruments designed and
validated by prior research (Bartel 2001; Bergami and Bagozzi 2000; Boivie et al. 2011; Mael
and Ashforth 1992; Dukerich et al. 2002; Johnson et al. 2006; Shamir and Kark 2004). The
results indicate that group identity is positively related to employee performance in the groups
with private reporting. Surprisingly, in the groups with public reporting, group identity is
negatively related to employee performance. The unexpected findings for public reporting may
be the result of employees’ conformity. Under public reporting, it is possible that those with
high ability are motivated to suppress their performance and those with low ability are
motivated to improve their performance to conform to the group descriptive norms. To better
interpret the findings of public reporting, I divide employees under public reporting into high
and low ability. I find that, under public reporting, group identity is negatively (positively)
related to the performance of employees with high (low) ability. Additional analyses indicate
that the results are not driven by unobservable group feature(s), and employees’ group identity
is not significantly affected by performance reporting transparency. Overall, the results
CHAPTER 2: PERFORMANCE REPORTING TRANSPARENCY, GROUP IDENTITY AND
EMPLOYEE PERFORMANCE
15
demonstrate that the relation between group identity and employee performance is conditional
on the reporting choices made by the group leaders. Under private reporting, group identity
motivates employees to improve their performance; while under public reporting, group
identity motivates employees with high (low) ability to suppress (improve) their performance
to conform to the descriptive norms (i.e., the performance of others) of their group.
These findings contribute to the literature on internal performance reporting. Using
experimental settings, previous studies demonstrate that public reporting leads to higher
employee performance than private reporting does (Hannan et al. 2013; Tafkov 2012). This
study finds that performance reporting transparency affects employees’ choice of performance
benchmark and their task performance, and suggests that the performance effect of public
reporting is not always positive. Specifically, under private reporting, the salient performance
benchmark is the performance requirements set by the organization. Employees with high
group identity tend to exhibit high compliance toward the performance requirements, which
leads to high task performance. In comparison, the salient performance benchmark under
public reporting is the group descriptive norms. Employees with high group identity exhibit
high conformity toward the group descriptive norms, which means those with high (low) ability
tend to suppress (improve) their task performance.
This study also contributes to the growing literature on employees’ group identity. In recent
years, several studies examine the role of group identity in the accounting literature. Previous
studies find that group identity is negatively related to accounting manipulation (Abernethy et
al. 2017) and agency costs (Boivie et al. 2011). Additionally, experimental evidence indicates
that group identity increases the effectiveness of horizontal monitoring (i.e., employees control
the actions of each other), but decreases the effectiveness of vertical monitoring (i.e.,
CHAPTER 2: PERFORMANCE REPORTING TRANSPARENCY, GROUP IDENTITY AND
EMPLOYEE PERFORMANCE
16
employees report observations of their peers’ actions to managers) (Towry 2003). There is little
evidence on how group identity is related to employee performance, and how this relation is
affected by management control mechanisms such as internal performance reporting. This
study adds to the literature by documenting that the relation between group identity and
employee performance is conditional on the managers’ choice over performance reporting
transparency. When performance reporting transparency is low, group identity is positively
related to employee performance; when it is high, group identity is negatively (positively)
related to the performance of employees with high (low) ability.
This study also has practical implications. The findings suggest that when making decisions
about performance reporting, managers need to consider employees’ group identity and ability,
as well as descriptive norms (or performance distribution) in the workplace. If most employees
in a group demonstrate satisfactory performance, public reporting is likely to lead those with
high group identity and low ability to improve their performance. However, if most employees
fail to demonstrate satisfactory performance, public reporting may lead those with high group
identity and high ability to decrease their performance. Further, management theories posit that
group identity is determined by the in-group and out-group structure, the similarity between
employees and others in their group, as well as group outcome and prestige (Ashforth and Mael
1989; Hogg and Terry 2000). Therefore, managers may need to consider and design internal
performance reporting, employee selection, and group design as an integrated control system.
The remainder of this paper is organized as follows. The next section explains the theoretical
constructs and develops the hypotheses. I then describe the research site and the methodology
of the study, before presenting the results. The final section provides the concluding comments.
CHAPTER 2: PERFORMANCE REPORTING TRANSPARENCY, GROUP IDENTITY AND
EMPLOYEE PERFORMANCE
17
2.2 Literature and Hypothesis Development
Performance Reporting Transparency
Social comparison theories in psychology suggest that individuals have an inherent desire to
compare themselves with others in order to evaluate themselves (Festinger 1954; Suls and
Wheeler 2000). The social comparison process motivates individuals to adjust their behavior
to maintain a positive self-image (i.e., how individuals believe others think of them) in their
social or work groups. Drawing on the social comparison theories, prior studies demonstrate
that internal performance reporting is an effective control mechanism in motivating employee
performance. Specifically, Frederickson (1992) experimentally find that providing employees
with information on their own performance relative to the performance of their peers (i.e.,
relative performance information, or RPI) motivates employees to exhibit high effort. This
finding is consistent with the findings obtained by Azmat and Iriberri (2010) using a natural
experiment in a high school. Further, Hannan et al. (2008) find that the performance effect of
RPI is conditional on the incentive contract (i.e., tournament or individual compensation) as
well as the precision of the RPI information. Later studies also find that providing employees
with RPI may motivate undesirable behaviors, such as sabotaging the work of peers (Charness,
Masclet, and Villeval 2013) or misreporting the budget (Brown, Fisher, Sooy, and Sprinkle
2014).
Previous studies have not only examined the content of internal performance reporting, but
also examined the transparency of internal performance reporting. Using laboratory settings,
recent studies have examined how making performance information public in the workplace
affects employee behaviors. Specifically, Tafkov (2012) find that public RPI (i.e., the
performance ranking of each employee in a group is provided to all group members) is more
effective in motivating employee performance than private RPI (i.e., each employee knows his
CHAPTER 2: PERFORMANCE REPORTING TRANSPARENCY, GROUP IDENTITY AND
EMPLOYEE PERFORMANCE
18
or her own rank only). Hannan et al. (2013) also find that compared to private RPI, public PRI
is more effective in motivating employees to exert high effort in a multi-task setting.
Additionally, Maas and Van Rinsum (2013) find that publicly disclosing managers’ self-
reported performance in the workplace motivates them to report their performance honestly, in
order to maintain a positive self-image in front of their peers. These studies suggest that public
reporting increases employees’ concern for their self-image. Demonstrating a positive (e.g.,
competent or honest) self-image enhances employees’ self-esteem and improves their feelings
about self (Beach and Tesser 2000). It also prevents employees from being looked down on by
their peers, and increases employees’ status in the workplace (Smith 2000). To create and/or
maintain a positive self-image, employees are motivated to adjust their behavior, such as
demonstrating higher performance (Hannan et al. 2013; Tafkov 2012) or reporting their
performance honestly (Maas and Van Rinsum 2013).
Group Identity
However, in practice, employees’ concern for their self-image may depend on the extent to
which they perceive themselves as a part of their work group, or in other words, their group
identity. The concept of “group identity” originates from the social identity theory developed
by Tajfel (1974, 1982) and Turner (1975, 1991). They define group identity as the extent to
which individuals identify with their social or work groups. That is, group identity refers to
individuals’ self-concept which derives from their group membership (Tajfel 1974, 1982;
Turner 1975, 1991). In management literature, Ashforth and Mael (1989) discuss employees’
group identity in organizations and how it differs from other related constructs. They suggest
that one’s group identity refers to the self in terms of one’s group (“I am”). It is a perceptual
cognitive construct that describes the extent to which an employee defines herself in terms of
the group she works for. Conceptually, group identity differs from any specific behaviors (e.g.,
CHAPTER 2: PERFORMANCE REPORTING TRANSPARENCY, GROUP IDENTITY AND
EMPLOYEE PERFORMANCE
19
effort), affective states (e.g., loyalty), or internalization of the goals or values of one’s group
(e.g., commitment). In practice, group identity may affect or be affected by these factors. It
may also be affected by group structure, the similarity and shared goal(s) between group
members, and other individual or group features (Ashforth and Mael 1989; Bergami and
Bagozzi 2000).
The psychology, management, and economics literatures on group identity suggest that group
identity plays an important role in directing individual behaviors. The psychology theories posit
that individuals with higher group identity are more likely to engage in actions that contribute
to group outcomes and the interests of other group members (Haslam and Ellemers 2005; Tajfel
1982; Turner 1975). The management theories posit that group identity motivates employees
to engage in actions that are aligned with the values and norms of their group (Ashforth and
Mael 1989; Hogg and Terry 2000). These propositions are supported by empirical evidence.
For example, psychology studies find that group identity motivates employees to exhibit high
job performance (Van Knippenberg 2000; Yun et al. 2007) and engage in organization
citizenship behaviors and cooperative behaviors (Bergami and Bagozzi 2000; Haslam and
Ellemers 2005; Van Dick, Van Knippenberg, Kerschreiter, Hertel, and Wieseke 2008).
Additionally, Terry et al. (1999) find that group identity leads individuals to conform to the
norms of their group. In the management literature, Boivie et al. (2011) find that chief executive
officers (CEOs) with higher organization identity tend to avoid pursuit of personal gains that
harm the value and image of their firms.
Akerlof and Kranton (2000, 2003, 2008, 2010) consider group identity from an economic
perspective. They suggest that employees with high group identity derive utility by adopting
the norms of their groups (Akerlof and Kranton 2000, 2003). Deviating from group norms not
CHAPTER 2: PERFORMANCE REPORTING TRANSPARENCY, GROUP IDENTITY AND
EMPLOYEE PERFORMANCE
20
only undermines one’s self-image as a group member, but also increases the risk of being
marginalized or isolated by other group members. Employees with high group identity have
strong motivation to adopt the norms of their groups to avoid such negative consequences
(Akerlof and Kranton 2000, 2003). In the accounting literature, Towry (2003) experimentally
finds that group identity increases the effectiveness of horizontal monitoring (i.e., employees
control the actions of each other), but decreases the effectiveness of vertical monitoring (i.e.,
employees report observations of their peers' efforts to managers). Abernethy et al. (2017) find
that managers with incentive-based compensation engage in less opportunistic earnings
manipulation if they identify with their organization. Overall, previous studies indicate that
group identity has an important behavioral effect in organizations.
In real-world organizations, employees may identify with their organizations as well as
subunits (such as divisions, departments, and workgroups) within their organizations.
(Ashforth and Mael 1989; Hogg and Terry 2000). Among units in different organizational
levels, workgroups are most relevant to lower-level employees in their daily work; and
employees’ workgroup identity is usually more salient than their identities derived from units
higher up in the organization (Van Dick et al. 2008). Therefore, this study focuses on employees’
workgroup identity (hereafter, “group” and “workgroup” are interchangeable).
In this study, I investigate the relation between group identity and employee performance under
private and public reporting. Performance reporting transparency (private vs. public) affects
the information environment in the workplace and the performance benchmark that employees
can choose to evaluate their performance. Therefore, the choice of reporting format is likely to
affect the relation between group identity and employee performance. I first consider groups
with private reporting. Under private reporting, managers provide employees with information
CHAPTER 2: PERFORMANCE REPORTING TRANSPARENCY, GROUP IDENTITY AND
EMPLOYEE PERFORMANCE
21
of their own performance, but not the information of their peers’ performance. That is,
employees do not receive information on the descriptive norms (i.e., the common practice of
other employees) of their group. Therefore, the performance requirements set by the
organization tend to be a more salient performance benchmark than the descriptive norms under
private reporting. Based on the existing theories, group identity may motivate employees to
increase their compliance with the performances requirements in order to reinforce their self-
image as organizational participants and members of their workgroups (Akerlof and Kranton
2000, 2003; Ashforth and Mael 1989; Hogg and Terry 2000). Following the performance
requirements allows employees to demonstrate high performance, as organizations usually
measure employee performance based on the extent to which employees meet the performances
requirements. Therefore, I expect that group identity is positively related to employee
performance under private reporting.
I then consider groups with public reporting. Under public reporting, managers provide
employees with the information on their own and their peers’ performance. That is, employees
can observe the descriptive norms (i.e., common practices of others) of their groups, and are
aware that their own performance can be observed by others in their group. It is unclear how
group identity is related to employee performance under public reporting. On the one hand,
employees with high group identity may still tend to demonstrate high performance, as what
they would do under private reporting. On the other hand, based on management and economic
theories, employees with high group identity may be motivated to conform to the descriptive
norms of their groups. Conforming to the descriptive norms of one’s group increases one’s
similarity with other group members, and reinforces one’s self-image as part of the group
(Akerlof and Kranton 2000, 2003, 2010; Ashforth and Mael 1989; Hogg and Terry 2000).
Further, individuals whose behaviors deviate from the group descriptive norms may receive
CHAPTER 2: PERFORMANCE REPORTING TRANSPARENCY, GROUP IDENTITY AND
EMPLOYEE PERFORMANCE
22
social punishment from other group members (e.g., contempt for low performers, envy for high
performers, social isolation), because such deviation threatens the self-image of other group
members (Akerlof and Kranton 2000; Ashforth and Mael 1989; Charness et al. 2013; Hogg
and Terry 2000; Smith 2000; Vecchio 2000). Employees with high group identity may have
strong motivation to reinforce their self-image as group members and avoid being punished by
others in their group. Therefore, employees with high group identity may choose the group
descriptive norms as the performance benchmark, and adjust their behaviors to become more
similar to others in their group. In other words, under public reporting, employees with high
group identity may increase or decrease their performance to conform to the group descriptive
norms.
Overall, based on group identity theories, I expect that group identity is positively related to
employee performance. However, under public reporting, group identity may motivate some
employees to decrease their performance to conform to the group descriptive norms. Because
of this potential downside of public reporting, I expect that relation between group identity and
employee is more positive under private reporting than under public reporting.
Hypothesis: There is a positive relation between group identity and employee performance;
and the relation is more positive under private reporting than under public
reporting.
2.3 Research Site
Overview
The research site of this study is a large department within a Chinese SOE. The SOE has been
the principal driver of the local economy, and has its own schools, hospitals, media, and
CHAPTER 2: PERFORMANCE REPORTING TRANSPARENCY, GROUP IDENTITY AND
EMPLOYEE PERFORMANCE
23
communities. It comprises 34 factories, plants, and institutions. This study focuses on one
department in a power plant in the SOE. Employees in the department are responsible for
equipment inspection, operation, and maintenance. Tasks include inspecting and operating
equipment, identifying and solving hidden issues, and keeping records of the conditions of the
equipment. The purpose of these tasks is to ensure that the equipment functions normally and
safely, prolonging the usable life of the equipment and reducing the risk of operational disasters.
Each employee’s task and responsibility is clearly specified by the SOE.
As the equipment functions 24/7, employees take shifts. The head of the department divides
employees into five workgroups to make the shifts more manageable. Employees in the same
group work on the same shifts. During each shift, employees work individually in different
areas of the workshops. Once allocated into a group, employees usually stay in the same group,
and a change of groups rarely happens. Each group is managed by a group leader and has 18–
25 group members.
Performance Measurement and Reward System
The SOE uses performance measures and financial incentives to motivate employee
performance. Specifically, employees receive performance scores based on the operational
actions they undertake and the operational outcomes they achieve. The operational actions refer
to the procedures and steps that employees take to inspect, operate, and maintain the equipment.
The operational outcomes include a range of parameters on the equipment, such as temperature
and pressure, which reflect the conditions of the equipment. The organization has specified a
series of performance requirements for operational actions and outcomes. It has also specified
rules about how to allocate performance scores to employees based on the extent to which their
operational actions and outcomes meet the performance requirements. Taking a certain set of
CHAPTER 2: PERFORMANCE REPORTING TRANSPARENCY, GROUP IDENTITY AND
EMPLOYEE PERFORMANCE
24
operational actions that can keep the equipment functioning normally allows employees to earn
a reasonable score. In comparison, inspecting the equipment more carefully, identifying and
solving more hidden issues, and choosing optimal operational actions based on the exact
conditions of the equipment helps employees earn higher scores.
The department manager measures employee performance objectively. In particular, the
department manager assesses employee performance by checking the operational records and
the conditions of the equipment. The operational records are kept by the machines and the
computer system employed by the organization. When taking actions to inspect, operate, and
maintain the equipment, employees must tap their ID cards on the machines in the workshops.
The system then records that the employees have taken certain actions in certain areas of the
workshop. The department manager measures employees’ operational actions by checking the
records kept by the system. Additionally, the department manager measures employees’
operational outcomes by checking the parameters on the equipment during each shift, which
are captured by specialized machines and kept in the system. By the end of every month, each
employee receives performance scores based on the extent to which their operational actions
and outcomes meet the performance requirements specified by the organization.
At the end of every month, employees receive a fixed payment and financial incentives. The
financial incentives are calculated based on the performance scores that employees received
for the month, and account for approximately 0–10% of the overall compensation that they
receive. The performance measurement, score allocation, and compensation structure are pre-
specified by the organization and require little judgment of the manager or group leaders.
CHAPTER 2: PERFORMANCE REPORTING TRANSPARENCY, GROUP IDENTITY AND
EMPLOYEE PERFORMANCE
25
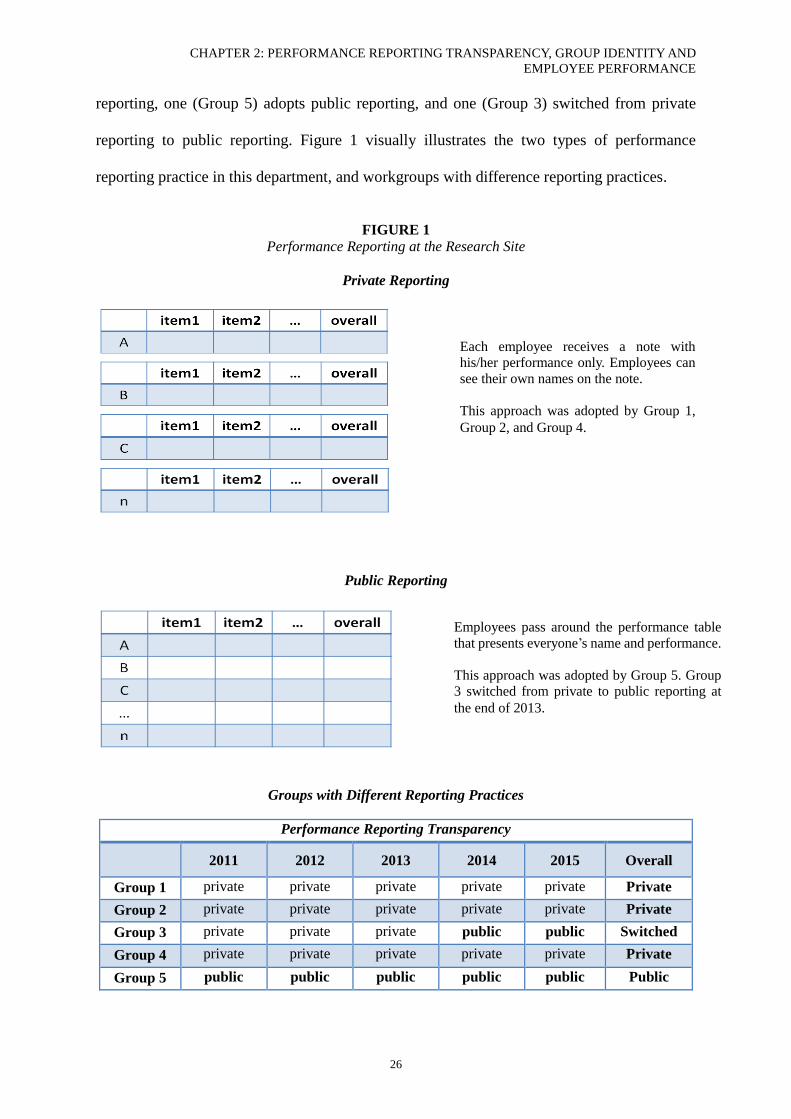
Performance Reporting Transparency
The SOE requires managers to report employee performance so that employees can access the
feedback on their own performance. However, the SOE does not impose strict rules on how
employee performance should be reported in each department or workgroup. In the department
of this study, two types of performance reporting practices have coexisted for years. In one of
the five workgroups (hereafter, Group 5), the group leader prints the names and performance
of all group members on a table, and distributes this performance table to the group members
at the end of every month. Each employee in the group can see their own performance as well
as the performance of their peers (i.e., public reporting). In the other four groups, the group
leaders prepare the same information but print the information on each employee’s
performance in a separate note and only provide each employee with the note that presents his
or her own performance. Employees can only see their own performance and not the
performance of their peers (i.e., private reporting).1
One of the groups (Group 3) switched from private reporting to public reporting at the end of
2013, because the group leader retired and the SOE appointed a new group leader.2 The old
group leader used to print employee performance on A4 paper, cut the paper into pieces, and
gave each employee the piece that contained his or her performance only. The new group leader
asks employees to pass the paper around the group without cutting it.
To sum up, three of the five groups (Groups 1, 2 and 4) in the department adopt private
1 In groups with private reporting, employees in the same group may exchange performance information privately.
When employees have questions or concerns about their performance, they may also request to see the
performance of their peers, in the office of their group leader. Although employees may obtain some information
on their peers’ performance through these channels, the performance transparency in these groups is still lower
than in the group that publicly discloses every employee’s performance. 2 The new group leader was one of the group members in Group 3. The SOE appointed him based on his seniority
(the length of time that he had worked in the SOE) and his leadership potential (subjectively assessed by the
SOE’s upper-level management).
CHAPTER 2: PERFORMANCE REPORTING TRANSPARENCY, GROUP IDENTITY AND
EMPLOYEE PERFORMANCE
26
reporting, one (Group 5) adopts public reporting, and one (Group 3) switched from private
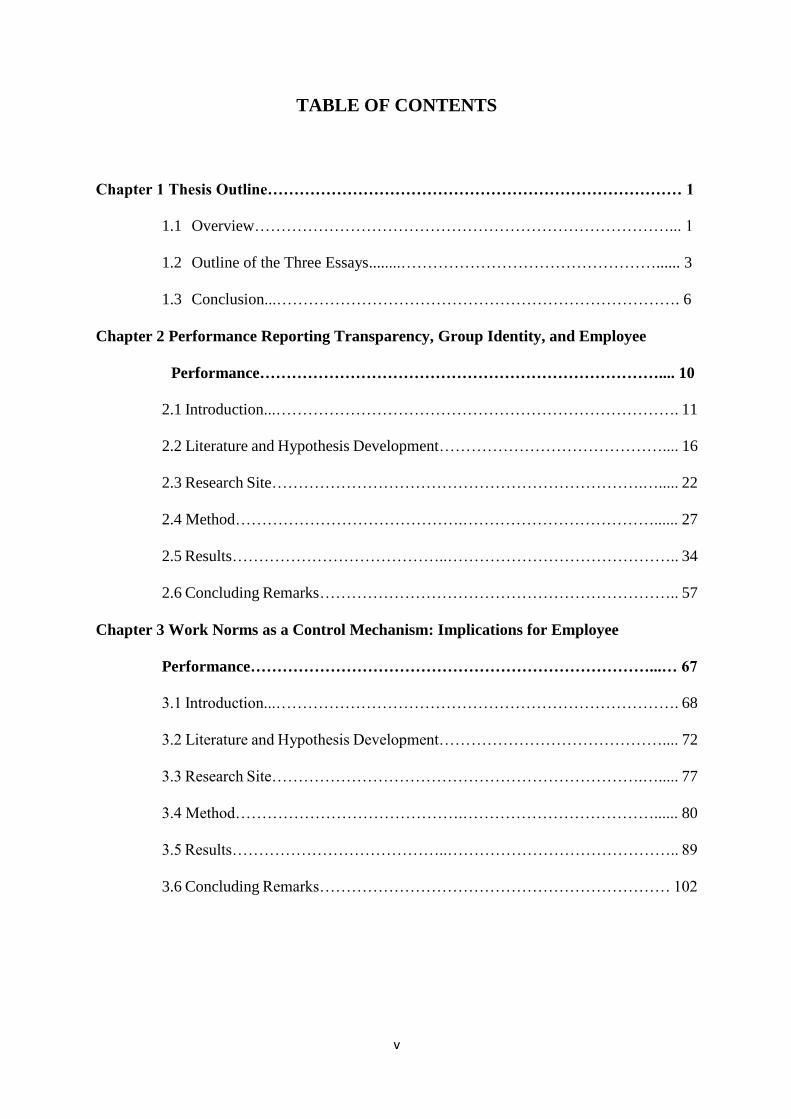
reporting to public reporting. Figure 1 visually illustrates the two types of performance
reporting practice in this department, and workgroups with difference reporting practices.
FIGURE 1
Performance Reporting at the Research Site
Private Reporting
Public Reporting
Groups with Different Reporting Practices
Performance Reporting Transparency
2011 2012 2013 2014 2015 Overall
Group 1 private private private private private Private
Group 2 private private private private private Private
Group 3 private private private public public Switched
Group 4 private private private private private Private
Group 5 public public public public public Public
Each employee receives a note with
his/her performance only. Employees can
see their own names on the note.
This approach was adopted by Group 1,
Group 2, and Group 4.
Employees pass around the performance table
that presents everyone’s name and performance.
This approach was adopted by Group 5. Group
3 switched from private to public reporting at
the end of 2013.
CHAPTER 2: PERFORMANCE REPORTING TRANSPARENCY, GROUP IDENTITY AND
EMPLOYEE PERFORMANCE
27
Rationale for the Choice of Research Site
This department is a suitable research site for the following reasons. First, the two types of
performance reporting in the department (public vs. private) provide an opportunity to examine
the research question with the contextual factors controlled. Second, once allocated into a group,
employees usually stay in the same group for years. Employees in the same group work during
the same shift and conduct various activities together (have lunch, take buses, and attend
group/department meetings, etc.). Therefore, employees’ group identity is likely to be salient.
As financial incentives are relatively weak in this setting, group identity is likely to play a
significant role in affecting employee performance. Third, the operating environment in the
department is stable. Because of the rules imposed by the government, the SOE cannot fire its
employees for poor performance. The compensation and other benefits of this SOE are better
than that of other organizations in the local area. Therefore, most employees choose to stay in
the organization and the same workgroup until retirement. The incentive of promotion is low,
as the operating environment is very stable and the group leaders and department managers are
usually appointed directly by the upper-level management team. The stable operating
environment provides an opportunity to examine the same employees’ performance over
multiple periods. It helps mitigate the effects of unobservable factors or other incentives (such
as career concern) that may affect employee performance in certain period(s).
2.4 Method
Data and Sample
In order to examine the research questions, I collected archival and survey data from the
research site. First, I extracted the archival performance data from the database of the SOE.
The SOE measures the individual performance of employees on a monthly basis. I obtained
the performance data from January 2011 to July 2015. The original dataset includes 146
CHAPTER 2: PERFORMANCE REPORTING TRANSPARENCY, GROUP IDENTITY AND
EMPLOYEE PERFORMANCE
28
employees and 5,422 performance observations. Second, I collected the demographic
information of the 146 employees from the personnel files of the SOE, including the employees’
gender, birthday, hometown, education, political affiliation, and recruitment date. Employees’
demographic characteristics are time-invariant. Third, I administered a survey on May 2015 to
measure employees’ perception on their group and the organization, as well as the personal
connections they have in the workplace. I sent the survey to 445 employees in four different
departments of the SOE, including the department of this study. There are 290 employees who
responded the survey (response rate = 65%). In the department of this study, 79 of the 146
employees responded (response rate = 54%).
In the sample selection process, only Group 5 consistently uses public reporting during the
sample period. Therefore, Group 5 is included in the sample to examine the relation between
group identity and performance under public reporting. It means that the groups chosen to
examine this relation under private reporting should be comparable to Group 5, in terms of data
availability and demographic characteristics. Because there was a breakdown in the computer
system of the SOE in early 2015, most observations in Group 1 and 3 are missing. Specifically,
most data for Group 1 (private reporting) is missing, except for that from January to August
2012 and July to October 2014. In Group 3 (switched reporting), the data from August to
December 2013 and the data from June to December 2014 are missing. To minimize any bias
introduced by unobservable factors in particular years or months and make sure data of private
reporting is comparable to the data of public reporting, I exclude these two groups in the
estimation. I include Group 2 and Group 4 in the sample of estimation, as these two groups
consistently use private reporting during the sample period and are not subject to the data
availability issue. The sample selection is described in Table 1.
CHAPTER 2: PERFORMANCE REPORTING TRANSPARENCY, GROUP IDENTITY AND
EMPLOYEE PERFORMANCE
29
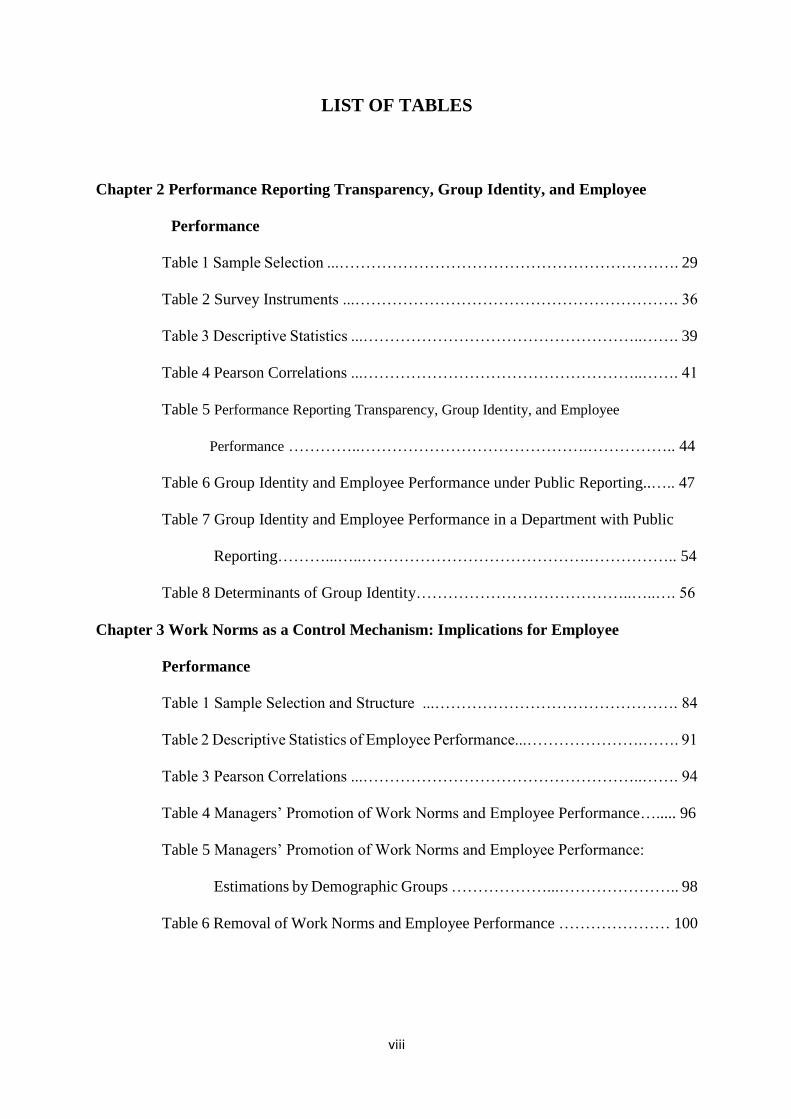
Panel A of Table 1 shows the number of employees and performance observations. The original
dataset on employee performance is from January 2011 to July 2015, and includes all five
workgroups in the department. There are 146 employees and 5,422 performance observations
in total. After excluding the groups with data availability issue, there are 93 employees and
4,253 performance observations left. In the remaining three groups, Group 2 and 4 adopt
private reporting while Group 5 adopt public reporting. After excluding the non-respondents
and one employee whose demographic information is missing in the personnel file, the final
sample includes 51 employees and 2,471 performance observations. Panel B compares
respondents and non-respondents. It shows that respondents are not significantly different with
non-respondents in terms of demographic characteristics. Panel C compares the groups with
private reporting and the group with public reporting. It shows that respondents under private
reporting are not significantly different from those under public reporting in terms of
demographic characteristics, except for the level of education (edu). Specifically, edu is slightly
higher under private reporting than under public reporting (difference = 0.39). This is because
there are five respondents who have master degree in Group 2 (private reporting). In
comparison, Group 4 (private reporting) and Group 5 (public reporting) each has three
respondents with master degree. Given the relatively small size of each group, this small
difference is statistically significant. However, I believe it is unlikely to affect the results
significantly, especially after controlling for employees’ demographic characteristics and the
group fixed effects in the estimation.
CHAPTER 2: PERFORMANCE REPORTING TRANSPARENCY, GROUP IDENTITY AND
EMPLOYEE PERFORMANCE
30
TABLE 1
Sample Selection
Panel A: Sample Selection Process
Workgroups Employees Observations
Original performance data
(Jan. 2011–July 2015) 1, 2, 3, 4, 5 146 5,422
Workgroups with missing
observations (1, 3) (53) (1,169)
2, 4, 5 93 4,253
Non-respondents (41) (1,736)
Missing demographic information (1) (46)
Final sample 2, 4, 5 51 2,471
Panel B: Respondents and Non-respondents
Non-
respondents Respondents Difference t-statistics
age 42.95 42.92 0.03*** 0.02
tenure 23.78 23.70 0.08*** 0.05
gender 0.32 0.24 0.08*** 0.84
home 0.53 0.57 −0.04*** −0.39
edu 0.92 0.98 −0.06*** −0.42
CCP 0.11 0.18 −0.07*** −0.93
Panel C: Private vs. Public Reporting
Private
(Group 2&4)
Public
(Group 5) Difference t-statistics
group size* 32 19 N/A N/A
age 42.55 43.44 −0.89 −0.52
tenure 23.34 24.19 −0.85 −0.47
gender 0.25 0.21 0.04 0.32
home 0.53 0.63 −0.10 −0.69
edu 1.13 0.74 0.39 2.04
CCP 0.13 0.26 −1.34 −1.25
Panel A illustrates the sample selection process. The department used in the main analyses of this study have five workgroups.
Two (Groups 1 and 3) lost most performance observations because of a computer system breakdown. In the remaining three
groups, one (Group 5) adopts public reporting and the other two (Groups 2 and 4) adopt private reporting. After excluding the
non-respondents and the one employee whose demographic information is missing from the system, there are 51 employees
and 2,471 performance observations in the final sample. Panel B compares respondents and non-respondents in the three
groups in the final sample, and shows that respondents are not significantly different with non-respondents. Panel C compares
the group size and demographic characteristics of groups with private reporting and public reporting, respectively.
*Among the 32 respondents under private reporting, 15 were from Group 2 (which has 29 employees total) and 17 were from
Group 4 (which has 31 employees in total). Under public reporting, all the 19 respondents were from the group with public
reporting, Group 5 (which has 33 employees in total).
Empirical Model
I examine the association between group identity and employee performance in groups with
different levels of performance reporting transparency using the following equation:
CHAPTER 2: PERFORMANCE REPORTING TRANSPARENCY, GROUP IDENTITY AND
EMPLOYEE PERFORMANCE
31
Performanceit = β1group_identityi + β2publicit + β3(group_identityi×publicit) + β4leveli
+ β5tenureit + β6horizonit + β7genderi + β8homei + β9edui + β10CCPi
+ β11familyi + β12referrali + β13supporti + β14systemi + εit (1)
Specifically, I examine the association between employees’ performance (Performance) and
group identity (group_identity) under private reporting and public reporting (public). The
coefficient on group identity (β1) captures the relation between group identity and employee
performance under private reporting. The results would be consistent with the hypothesis if β1
is significantly positive. The coefficient on the indictor for public reporting (β2) captures the
effect of public reporting on employee performance. Prior studies find that public reporting is
positively related to employee performance (Hannan et al. 2013; Tafkov 2012). The results
would be consistent with the prior findings if β2 is significantly positive. The coefficient on the
interaction between group identity and public reporting (β3) captures the effect of group identity
under public reporting, incremental to the effect under private reporting (β1). As the hypothesis
expects that the relation between group identity and employee performance is less positive
under public reporting, I expect β3 to be negative. To better interpret the findings, I also divide
the sample based on performance reporting transparency and estimate the following model in
the subsamples:
Performanceit = β1group_identityi + β2leveli + β3tenureit + β4horizonit + β5genderi + β6homei
+ β7edui + β8CCPi + β9familyi + β10referrali + β11supporti + β12systemi
+ εit (2)
CHAPTER 2: PERFORMANCE REPORTING TRANSPARENCY, GROUP IDENTITY AND
EMPLOYEE PERFORMANCE
32
Under both private and public reporting, the results would be consistent with the hypothesis if
the coefficient on group identity (β1) is significantly positive, and β1 is larger under private
reporting than under public reporting. It means that there is a positive association between
employee performance and group identity under private reporting, and the relation is more
positive under private reporting than under public reporting. The details of the variables in the
model are presented as follow.
Variables
Dependent Variable: The dependent variable, Performance, is a measure for employee
performance. As explained in the research site section, the department head evaluates
employees’ actions and outcomes by checking the operational records and equipment
conditions. At the end of every month, the department manager allocates employees with
performance scores by comparing their actions and outcomes with the pre-specified
performance requirements. Performance is the overall performance score each employee
receives at the end of every month. It captures the judgment that employees make when
choosing their operational actions, as well as the effort that employees exert when engaging in
their chosen actions. Based on the rules of the SOE, the financial incentives received by
employees by the end of every month are calculated as (10×Performance). I extract the data
of Performance from the database of the SOE. The data of Performance is on a monthly basis,
and the sample period is from January 2013 to July 2015. Because the highest (lowest)
performance score that an employee can received is 130 (−160), the estimation is censored at
these levels.
Independent Variable: The first independent variable, group_identity, is constructed by nine
survey items designed and validated in previous studies. In particular, Mael and Ashforth (1992)
CHAPTER 2: PERFORMANCE REPORTING TRANSPARENCY, GROUP IDENTITY AND
EMPLOYEE PERFORMANCE
33
develop a six-item measure for individuals’ group identity in an organizational context.
Bergami and Bagozzi (2000) add another two questions about the overlap between one’s self-
image and the image of one’s group. This measurement has been used and validated extensively
by studies in management and organization behaviors (Bartel 2001; Dukerich et al. 2002;
Johnson et al. 2006; Shamir and Kark 2004). Additionally, Boivie et al. (2011) incorporate one
more question on one’s sense of self derived from one’s group membership. In this study, I
adjust the wording of the questions to match with research site. I administered the survey to
445 employees in four departments of the SOE on May 2015, and 290 employees responded
(response rate = 65%). At the department of this study, 79 of the 146 employees responded
(response rate = 54%). The original survey is in Chinese. The English version of the survey is
presented in Appendix A.
The second independent variable, public, is an indicator for workgroups with public reporting.
In the sample, Group 5 adopts public reporting while Group 2 and 4 adopt private reporting.
Public is one for performance observations under public reporting, or zero for performance
observations under private reporting.
Control Variables: To minimize any bias in estimates as a result of omitted variables, I include
three sets of control variables in the estimations. The first set includes employees’ ability and
demographic characteristics. Specifically, level is a proxy for employee ability. Every three
years, the SOE holds an exam to assess employees’ operational skills, and assigns skill levels
to employees based on their exam results. There are four skill levels: 0 (none), 1 (low), 2
(medium), and 3 (high). To achieve a particular level, employees must reach a certain score in
the exam. In this study, the variable level is the skill level assigned by the SOE at the end of
CHAPTER 2: PERFORMANCE REPORTING TRANSPARENCY, GROUP IDENTITY AND
EMPLOYEE PERFORMANCE
34
2012.3 As for demographic characteristics, I control for the number of years that employees
have been working in the SOE (tenure), the indicator for female employees (gender), the
indicator for employees who come from the city where the SOE is located (home), employees’
education level (edu), and the indicator for Chinese Communist Party member (CCP).4
The second set of control variables includes employees’ social and family connections in the
workplace: referral and family. These connections may affect employees’ group identity and
their performance (Beaman and Magruder 2012; Burks, Cowgill, Hoffman, and Housman 2015;
Brown, Setren, and Topa 2016; Hensvik and Skans 2016). Both variables are measured using
survey questions. Referral is constructed using two questions: “How did you enter into the
SOE? (1 = through government allocation = 1; 2 = through another channel)” and “Did you
know any existing employee(s) in the SOE before your entry? (1 = Yes; 2 = No)”. Referral is
an indicator for respondents who were not allocated by the government, and who had personal
connections with existing employees prior to their entry. It is a noisy proxy for the referral–
referrer connection.5 Family is an indicator for employees with family members who also work
3 Due to the data availability constraint, employees’ skill level assessed at the end of 2015 is not available.
However, the skill level assessed in 2012 still constitutes a valid proxy for employee ability between January
2011 and July 2015. 4 Tenure is the number of years that employees have worked in the SOE. Previous research finds that tenure may
affect employee performance through work experiences and commitment to organization (Wright and Bonett
2002). Gender is an indicator for female employees. As the tasks in the research site involve operating heavy
machinery and most employees are male, gender may affect employee performance both physically and
psychologically (Gardiner and Tiggemann 1999). Home is 1 for employees who came from the city where the
SOE is located, or 0 for those who came from other regions of China. As the SOE is the principal driver of the
local economy, employees from the local area may be motivated to work hard and contribute to the economy in
their hometown. Further, I control for the level of education that employees received (edu). Employees with
higher education levels may have received more training and have higher ability to perform their tasks. The next
control variable is CCP, which is a dummy variable indicating employees who have joined the Chinese
Communist Party. Previous research indicates that when the goals and beliefs of employees are congruent with
those of their organizations, employees tend to have higher motivation and better performance (Rich et al. 2010).
As the research site is state owned, the political affiliation of employees may affect their motivation and
performance. The data on these variables is from the personnel files of the SOE. Employees’ age (age) is also
available in the personnel files of the SOE. However, as age is highly correlated with tenure and introduces a
multicollinearity problem, I present age in the descriptive statistics but remove it from the regression estimations. 5 I measure this variable indirectly using the two questions because according to the managers of the SOE, it is
too sensitive to ask employees whether they were introduced to the organization by existing employees. Because
of Chinese social norms (Luo 2007), referrals usually give their referrers material gifts to return the favor and
show their thanks. The referrals may be reluctant to directly tell a third party that they entered into the
organization through personal connections to avoid being perceived as unethical and/or incompetent. To
CHAPTER 2: PERFORMANCE REPORTING TRANSPARENCY, GROUP IDENTITY AND
EMPLOYEE PERFORMANCE
35
in the SOE. It is measured by the following question: “Do you have family members who also
work in the SOE?” The questions used to measure referral and family are presented in
Appendix A.
The third set of control variables includes employees’ perception of the support they received
in their workgroup (support), the shared goals with other members in their group (shared_goal),
and the performance measurement and reward system (PMRS) adopted by the SOE (system).
These perceptions may affect employees’ group identity and performance. These perceptions
are measured by survey questions (Hogg 2006). Following previous research (Eisenberger,
Fasolo, and Davis-LaMastro 1990; Hogg 2006; Rich, Lepine, and Crawford 2010), I include
three questions about employees’ perceived support from their group, and two on the shared
goals between employees and their peers in the survey questionnaire (Eisenberger et al. 1990).
I also include 12 questions about the perceived information and motivational effects of the
PMRS adopted by the SOE (Steelman and Rutkowski 2004; Taylor and Pierce 1999). These
questions are presented in Appendix A. When estimating the empirical models, I also control
for time and group fixed effects. The detailed variable definition is presented in Appendix B.
2.5 Results
Survey Instruments
Table 2 presents the descriptive statistics of the survey instruments. I administered the survey
to 445 employees in four departments of the SOE on May 2015, and 290 employees responded
(response rate = 65%). When answering the questions about group identity, approximately half
of respondents indicated that they agree or highly agree with the statements, suggesting that
increase the response rate and accuracy of the responses, I use the two questions to indirectly capture the
referral–referrer connection of the respondents.
CHAPTER 2: PERFORMANCE REPORTING TRANSPARENCY, GROUP IDENTITY AND
EMPLOYEE PERFORMANCE
36
they highly identify with their groups. Forty percent of respondents indicate that they somewhat
agree with the statements, suggesting that these employees moderately identify with their
groups. The answers of the remaining 10% of the respondents fall between “neutral” and
“strongly disagree”, indicating lower group identity. As Table 2 shows, the mean of employees’
answers is around 5 and 6 for the instruments of group identity (1 = strongly disagree; 7 =
strongly agree). These instruments load into the same factor (α = 0.94).
Besides group identity, the survey also asks about employees’ perception of the support they
received in their workgroup, and the shared goals with other employees in the same workgroup.
For both variables, the instruments load into the same factor (α = 0.95 and 0.91 for perceived
support and perceived shared goals, respectively). The survey also includes questions about
employees’ identification with the SOE as a whole (i.e., organization identity), as well as their
perception of the PMRS adopted by the SOE. The questions on organization identity are similar
to the questions of group identity, with some words adjusted (α = 0.91). As for employees’
perception of the PMRS, the survey includes six questions on the perceived information effects
and six on the perceived motivational effects of the financial incentives (α = 0.96). Similar to
group identity, most answers for the questions on employees’ perception and organization
identity are between 5 (somewhat agree) and 7 (strongly agree). The mean is between 5 and 6,
and the median is 6 for these questions. The final three questions are about employees’ social
and family connections in the workplace. The answers indicate that about 53% of respondents
were allocated into the SOE by the government, while the rest entered through other channels.
About 38% of respondents had connections with the existing employees before they entered
the SOE. Most employees have family connections in the SOE.
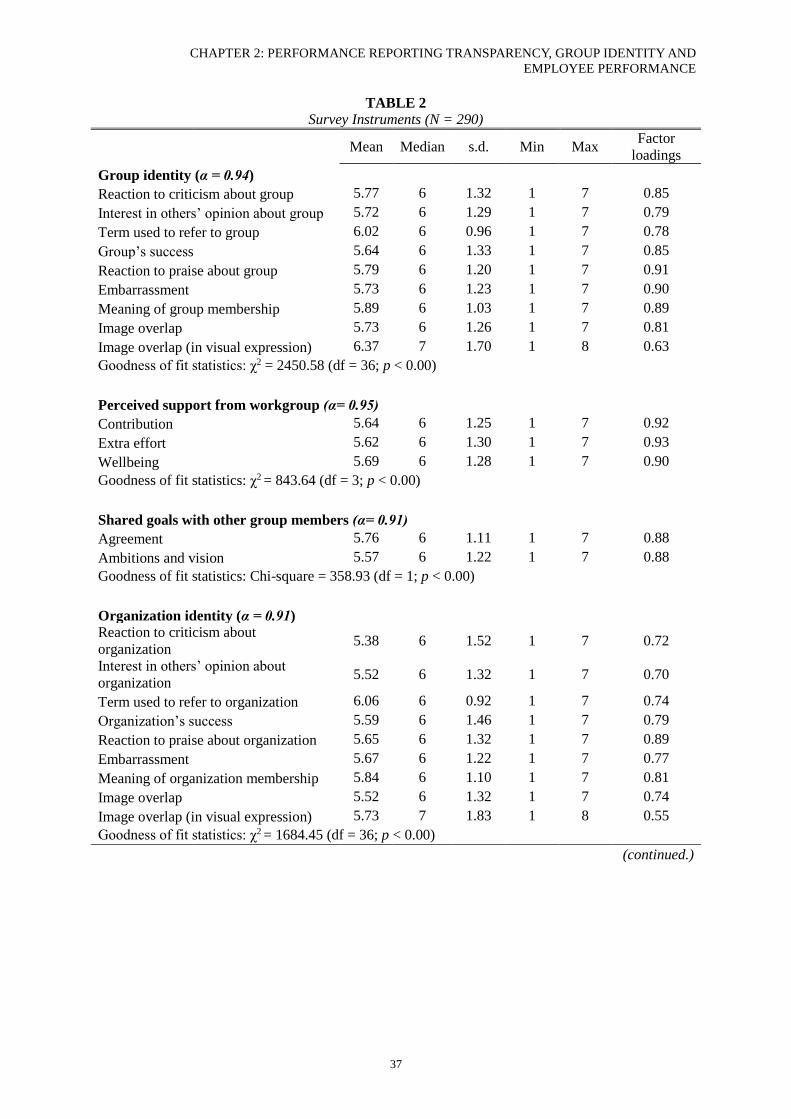
CHAPTER 2: PERFORMANCE REPORTING TRANSPARENCY, GROUP IDENTITY AND
EMPLOYEE PERFORMANCE
37
TABLE 2
Survey Instruments (N = 290)
Mean Median s.d. Min Max
Factor
loadings
Group identity (α = 0.94)
Reaction to criticism about group 5.77 6 1.32 1 7 0.85
Interest in others’ opinion about group 5.72 6 1.29 1 7 0.79
Term used to refer to group 6.02 6 0.96 1 7 0.78
Group’s success 5.64 6 1.33 1 7 0.85
Reaction to praise about group 5.79 6 1.20 1 7 0.91
Embarrassment 5.73 6 1.23 1 7 0.90
Meaning of group membership 5.89 6 1.03 1 7 0.89
Image overlap 5.73 6 1.26 1 7 0.81
Image overlap (in visual expression) 6.37 7 1.70 1 8 0.63
Goodness of fit statistics: χ2 = 2450.58 (df = 36; p < 0.00)
Perceived support from workgroup (α= 0.95)
Contribution 5.64 6 1.25 1 7 0.92
Extra effort 5.62 6 1.30 1 7 0.93
Wellbeing 5.69 6 1.28 1 7 0.90
Goodness of fit statistics: χ2 = 843.64 (df = 3; p < 0.00)
Shared goals with other group members (α= 0.91)
Agreement 5.76 6 1.11 1 7 0.88
Ambitions and vision 5.57 6 1.22 1 7 0.88
Goodness of fit statistics: Chi-square = 358.93 (df = 1; p < 0.00)
Organization identity (α = 0.91)
Reaction to criticism about
organization 5.38 6 1.52 1 7 0.72
Interest in others’ opinion about
organization 5.52 6 1.32 1 7 0.70
Term used to refer to organization 6.06 6 0.92 1 7 0.74
Organization’s success 5.59 6 1.46 1 7 0.79
Reaction to praise about organization 5.65 6 1.32 1 7 0.89
Embarrassment 5.67 6 1.22 1 7 0.77
Meaning of organization membership 5.84 6 1.10 1 7 0.81
Image overlap 5.52 6 1.32 1 7 0.74
Image overlap (in visual expression) 5.73 7 1.83 1 8 0.55
Goodness of fit statistics: χ2 = 1684.45 (df = 36; p < 0.00) (continued.)
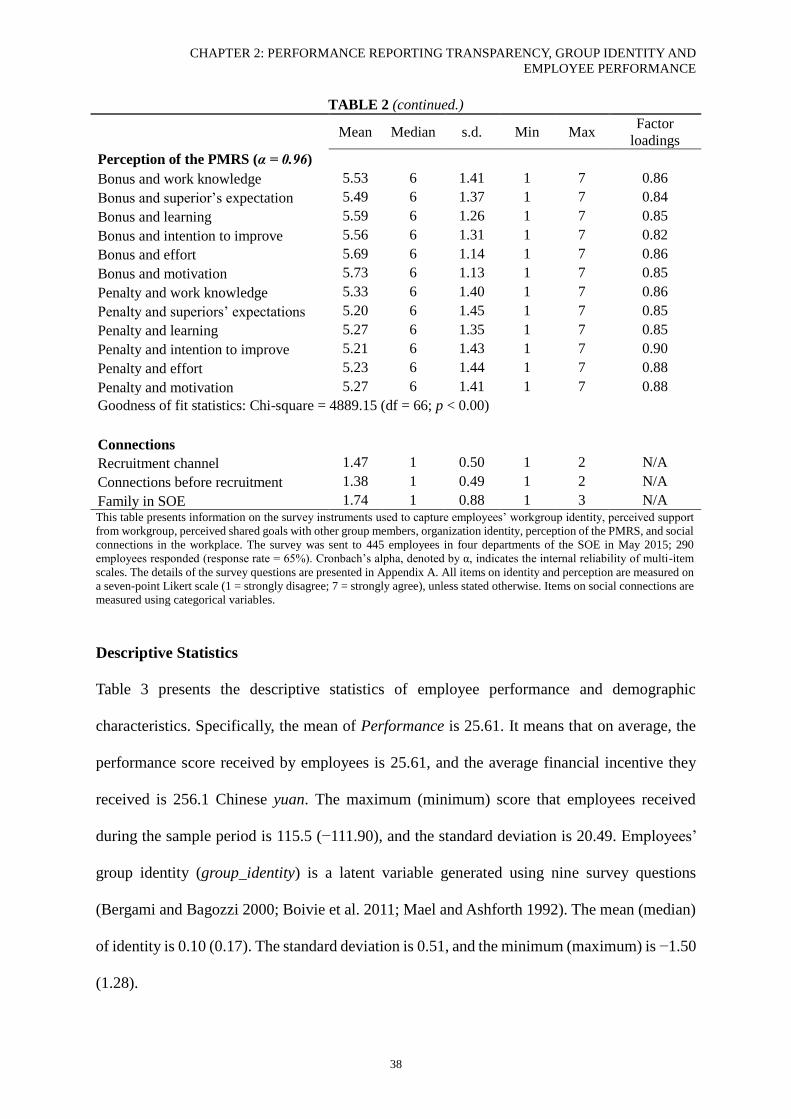
CHAPTER 2: PERFORMANCE REPORTING TRANSPARENCY, GROUP IDENTITY AND
EMPLOYEE PERFORMANCE
38
TABLE 2 (continued.)
Mean Median s.d. Min Max
Factor
loadings
Perception of the PMRS (α = 0.96)
Bonus and work knowledge 5.53 6 1.41 1 7 0.86
Bonus and superior’s expectation 5.49 6 1.37 1 7 0.84
Bonus and learning 5.59 6 1.26 1 7 0.85
Bonus and intention to improve 5.56 6 1.31 1 7 0.82
Bonus and effort 5.69 6 1.14 1 7 0.86
Bonus and motivation 5.73 6 1.13 1 7 0.85
Penalty and work knowledge 5.33 6 1.40 1 7 0.86
Penalty and superiors’ expectations 5.20 6 1.45 1 7 0.85
Penalty and learning 5.27 6 1.35 1 7 0.85
Penalty and intention to improve 5.21 6 1.43 1 7 0.90
Penalty and effort 5.23 6 1.44 1 7 0.88
Penalty and motivation 5.27 6 1.41 1 7 0.88
Goodness of fit statistics: Chi-square = 4889.15 (df = 66; p < 0.00)
Connections
Recruitment channel 1.47 1 0.50 1 2 N/A
Connections before recruitment 1.38 1 0.49 1 2 N/A
Family in SOE 1.74 1 0.88 1 3 N/A This table presents information on the survey instruments used to capture employees’ workgroup identity, perceived support
from workgroup, perceived shared goals with other group members, organization identity, perception of the PMRS, and social
connections in the workplace. The survey was sent to 445 employees in four departments of the SOE in May 2015; 290
employees responded (response rate = 65%). Cronbach’s alpha, denoted by α, indicates the internal reliability of multi-item
scales. The details of the survey questions are presented in Appendix A. All items on identity and perception are measured on
a seven-point Likert scale (1 = strongly disagree; 7 = strongly agree), unless stated otherwise. Items on social connections are
measured using categorical variables.
Descriptive Statistics
Table 3 presents the descriptive statistics of employee performance and demographic
characteristics. Specifically, the mean of Performance is 25.61. It means that on average, the
performance score received by employees is 25.61, and the average financial incentive they
received is 256.1 Chinese yuan. The maximum (minimum) score that employees received
during the sample period is 115.5 (−111.90), and the standard deviation is 20.49. Employees’
group identity (group_identity) is a latent variable generated using nine survey questions
(Bergami and Bagozzi 2000; Boivie et al. 2011; Mael and Ashforth 1992). The mean (median)
of identity is 0.10 (0.17). The standard deviation is 0.51, and the minimum (maximum) is −1.50
(1.28).
CHAPTER 2: PERFORMANCE REPORTING TRANSPARENCY, GROUP IDENTITY AND
EMPLOYEE PERFORMANCE
39
The average skill level of employees is 1.69, which is between the low (= 1) and medium (= 2)
level set by the SOE. By July 2015, the average age of the employees was 42.92 years old, and
the average tenure was 23.70 years. The age and the tenure of employees indicate that most
employees entered the SOE during the late 1980s and early 1990s. The difference between the
average age and the average tenure is only 19 years. This is because most employees entered
the organization immediately after graduating from high school or vocational school, and chose
to stay in the organization for a long time. Twenty-two percent of the employees have five
years, or less than five years, until retirement. Female employees account for 24%; and 57%
of employees came from the city where the SOE is located. Most employees graduated from
senior high school or vocational school, and 18% have joined the Chinese Communist Party.
Thirty-three percent of employees entered the SOE through referral, and 47% have family
connections in the SOE.
The three variables on employee perception are latent variables constructed using the survey
questions. For employees’ perceived support from their workgroups, the mean is 0.15 and the
standard deviation is 0.68. In comparison, employees’ perceptions on shared goals with their
peers and the PMRS adopted by the SOE have larger variation. The mean of these two variables
is 0.07 and 0.20, respectively. The standard deviation of both variables is about 0.80, which is
larger than the standard deviation of the perceived support (0.68). The minimum values of these
two variables are between −2 and −3, which are smaller than the minimum value of the
perceived support (−1.34). The maximum values of all three variables are between 1.00 and
1.50. The final variable is employees’ organization identity. Compared to group_identity,
organization_identity has smaller mean (0.04) and larger standard deviation (0.81).
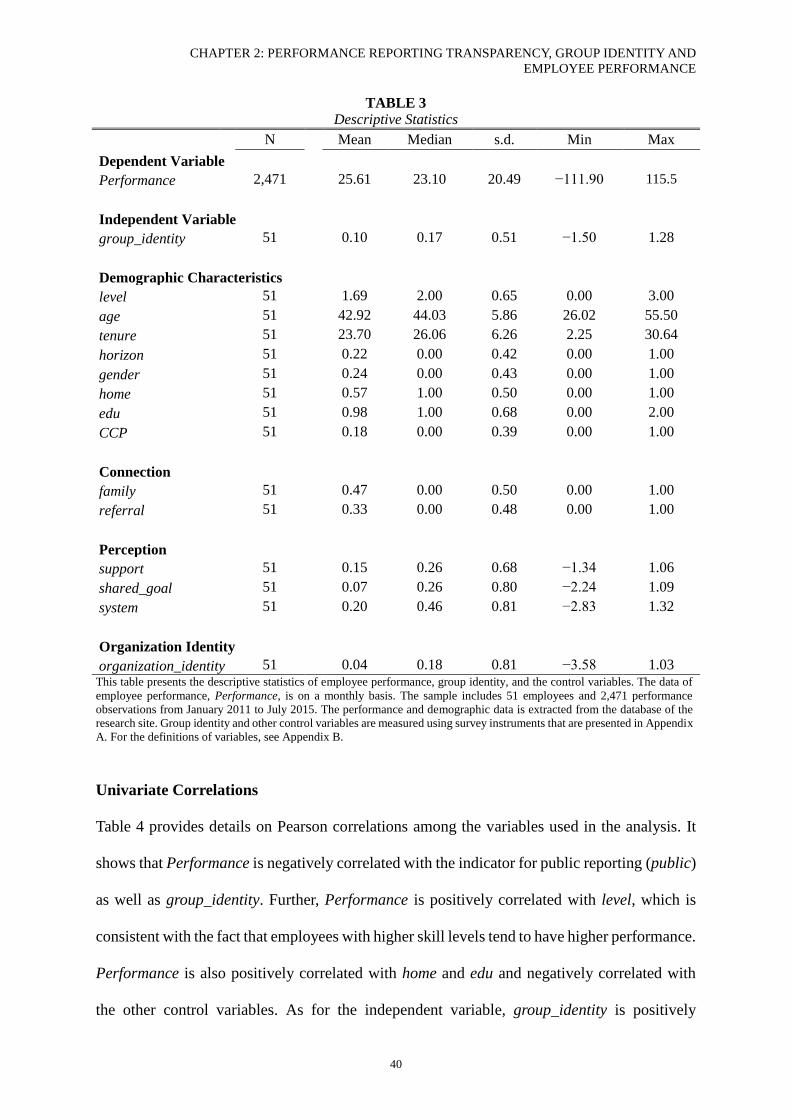
CHAPTER 2: PERFORMANCE REPORTING TRANSPARENCY, GROUP IDENTITY AND
EMPLOYEE PERFORMANCE
40
TABLE 3
Descriptive Statistics
N Mean Median s.d. Min Max
Dependent Variable
Performance 2,471 25.61 23.10 20.49 −111.90 115.5
Independent Variable
group_identity 51 0.10 0.17 0.51 −1.50 1.28
Demographic Characteristics
level 51 1.69 2.00 0.65 0.00 3.00
age 51 42.92 44.03 5.86 26.02 55.50
tenure 51 23.70 26.06 6.26 2.25 30.64
horizon 51 0.22 0.00 0.42 0.00 1.00
gender 51 0.24 0.00 0.43 0.00 1.00
home 51 0.57 1.00 0.50 0.00 1.00
edu 51 0.98 1.00 0.68 0.00 2.00
CCP 51 0.18 0.00 0.39 0.00 1.00
Connection
family 51 0.47 0.00 0.50 0.00 1.00
referral 51 0.33 0.00 0.48 0.00 1.00
Perception
support 51 0.15 0.26 0.68 −1.34 1.06
shared_goal 51 0.07 0.26 0.80 −2.24 1.09
system 51 0.20 0.46 0.81 −2.83 1.32
Organization Identity
organization_identity 51 0.04 0.18 0.81 −3.58 1.03 This table presents the descriptive statistics of employee performance, group identity, and the control variables. The data of
employee performance, Performance, is on a monthly basis. The sample includes 51 employees and 2,471 performance
observations from January 2011 to July 2015. The performance and demographic data is extracted from the database of the
research site. Group identity and other control variables are measured using survey instruments that are presented in Appendix
A. For the definitions of variables, see Appendix B.
Univariate Correlations
Table 4 provides details on Pearson correlations among the variables used in the analysis. It
shows that Performance is negatively correlated with the indicator for public reporting (public)
as well as group_identity. Further, Performance is positively correlated with level, which is
consistent with the fact that employees with higher skill levels tend to have higher performance.
Performance is also positively correlated with home and edu and negatively correlated with
the other control variables. As for the independent variable, group_identity is positively
CHAPTER 2: PERFORMANCE REPORTING TRANSPARENCY, GROUP IDENTITY AND
EMPLOYEE PERFORMANCE
41
correlated with the variables of employee perception and organization identity, which is
consistent with the propositions in the management theories (Ashforth and Mael 1989; Hogg
and Terry 2000). Group_identity is also negatively correlated with level, gender, edu, and
referral. This may be because the tasks in the research site require heavy manual labor.
Employees with high skill and/or education levels, as well as female workers, may thus identify
less with their workgroup. It is unclear whether group_identity and referral are negatively
correlated in the research site. Further, group_identity is positively correlated with age, tenure,
and CCP, which suggests that those who have worked in the organization for a longer time and
those with political affiliation tend to have higher group identity. Overall, the Pearson
correlations indicate that the relation between employee performance, group identity, and
performance reporting transparency is not straightforward and requires further analysis.
Most independent and control variables are significantly correlated with each other. I use
variance inflation factor tests to quantify the severity of multicollinearity, making sure the
results are not affected by the multicollinearity problem. Age, organization_identity, and
shared_goal are not included in the regression estimations because of the multicollinearity
problem. The other variables are not subject to the severe multicollinearity issue.
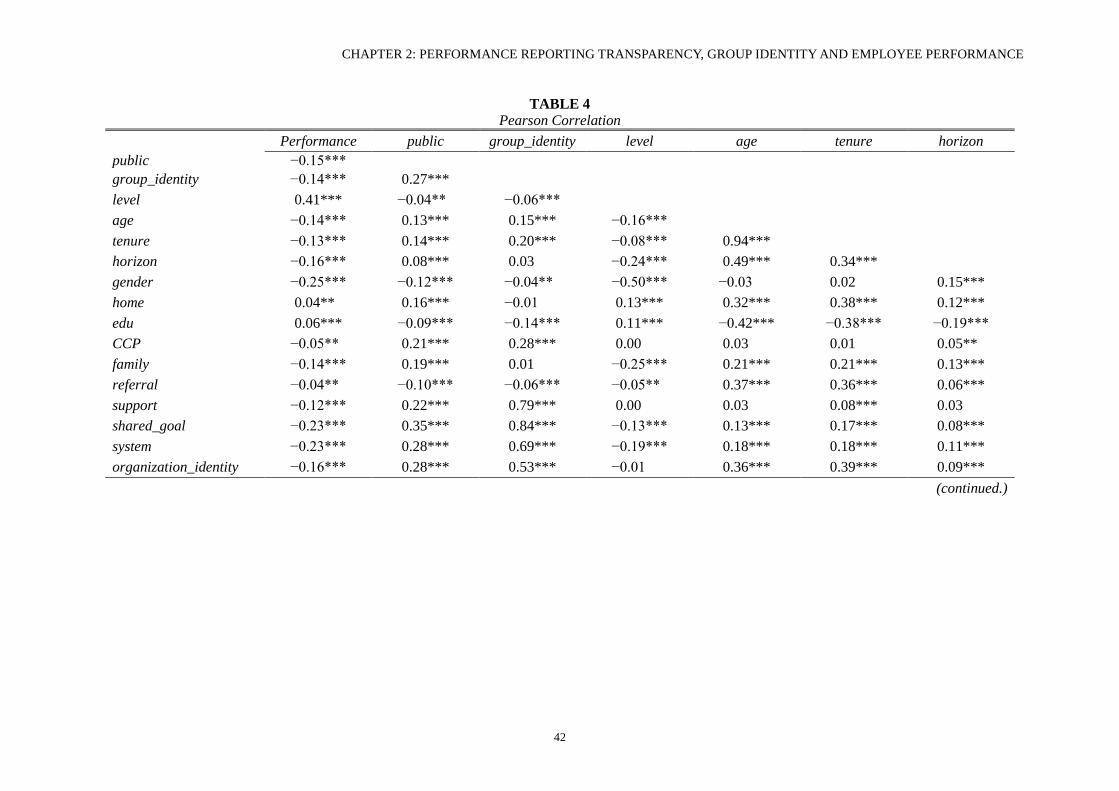
CHAPTER 2: PERFORMANCE REPORTING TRANSPARENCY, GROUP IDENTITY AND EMPLOYEE PERFORMANCE
42
TABLE 4
Pearson Correlation
Performance public group_identity level age tenure horizon
public −0.15***
group_identity −0.14*** 0.27***
level 0.41*** −0.04*** −0.06***
age −0.14*** 0.13*** 0.15*** −0.16***
tenure −0.13*** 0.14*** 0.20*** −0.08*** 0.94***
horizon −0.16*** 0.08*** 0.03*** −0.24*** 0.49*** 0.34***
gender −0.25*** −0.12*** −0.04*** −0.50*** −0.03*** 0.02*** 0.15***
home 0.04*** 0.16*** −0.01*** 0.13*** 0.32*** 0.38*** 0.12***
edu 0.06*** −0.09*** −0.14*** 0.11*** −0.42*** −0.38*** −0.19***
CCP −0.05*** 0.21*** 0.28*** 0.00*** 0.03*** 0.01*** 0.05***
family −0.14*** 0.19*** 0.01*** −0.25*** 0.21*** 0.21*** 0.13***
referral −0.04*** −0.10*** −0.06*** −0.05*** 0.37*** 0.36*** 0.06***
support −0.12*** 0.22*** 0.79*** 0.00*** 0.03*** 0.08*** 0.03***
shared_goal −0.23*** 0.35*** 0.84*** −0.13*** 0.13*** 0.17*** 0.08***
system −0.23*** 0.28*** 0.69*** −0.19*** 0.18*** 0.18*** 0.11***
organization_identity −0.16*** 0.28*** 0.53*** −0.01*** 0.36*** 0.39*** 0.09***
(continued.)
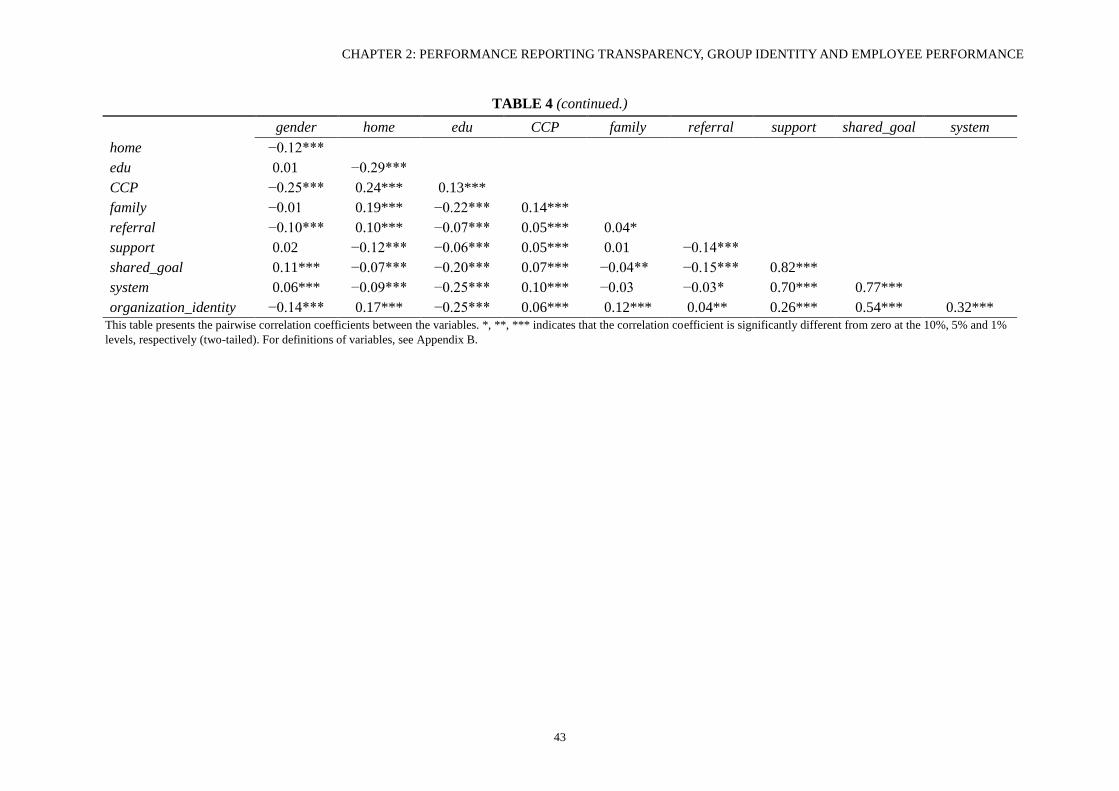
CHAPTER 2: PERFORMANCE REPORTING TRANSPARENCY, GROUP IDENTITY AND EMPLOYEE PERFORMANCE
43
TABLE 4 (continued.)
gender home edu CCP family referral support shared_goal system
home −0.12***
edu 0.01*** −0.29***
CCP −0.25*** 0.24*** 0.13***
family −0.01*** 0.19*** −0.22*** 0.14***
referral −0.10*** 0.10*** −0.07*** 0.05*** 0.04***
support 0.02*** −0.12*** −0.06*** 0.05*** 0.01*** −0.14***
shared_goal 0.11*** −0.07*** −0.20*** 0.07*** −0.04*** −0.15*** 0.82***
system 0.06*** −0.09*** −0.25*** 0.10*** −0.03*** −0.03*** 0.70*** 0.77***
organization_identity −0.14*** 0.17*** −0.25*** 0.06*** 0.12*** 0.04*** 0.26*** 0.54*** 0.32***
This table presents the pairwise correlation coefficients between the variables. *, **, *** indicates that the correlation coefficient is significantly different from zero at the 10%, 5% and 1%
levels, respectively (two-tailed). For definitions of variables, see Appendix B.
CHAPTER 2: PERFORMANCE REPORTING TRANSPARENCY, GROUP IDENTITY AND
EMPLOYEE PERFORMANCE
44
Hypothesis Testing
Table 5 presents the results of the regression estimations. I first estimate the association
between employee performance and group identity in the full sample. The results are presented
in column (1). This shows that group identity is positively associated with employee
performance (β = 6.50, t = 3.98). The indicator for public reporting, public, is also positively
associated with employee performance (β = 3.72, t = 3.98). This is consistent with the prior
finding that public reporting leads to higher employee performance than private reporting does.
However, employee performance is negatively related to the interaction between group identity
and public (β = −10.84, t = −5.23). These coefficients indicate that, under private (public)
reporting, as group identity increases by 1, employee performance increases (decreases) by
6.50 (4.34). This finding is consistent with the expectation that group identity is positively
related to employee performance under private reporting. Surprisingly, it also indicates that in
the group with public reporting, group identity is negatively related to employee performance.
To better understand the association between employee performance and group identity, I
divide the sample based on performance reporting transparency. The results are presented in
columns (2) and (3), respectively. Column (2) shows that in groups with private reporting,
employee performance is positively associated with group identity (β = 11.17, t = 6.13). This
further supports the expectation that group identity and employee performance are positively
related under private reporting. In comparison, column (3) shows that in the group with public
reporting there is a negative association between group identity and employee performance (β
= −5.13, t = 1.73), which is consistent with the interaction coefficient in the full sample.
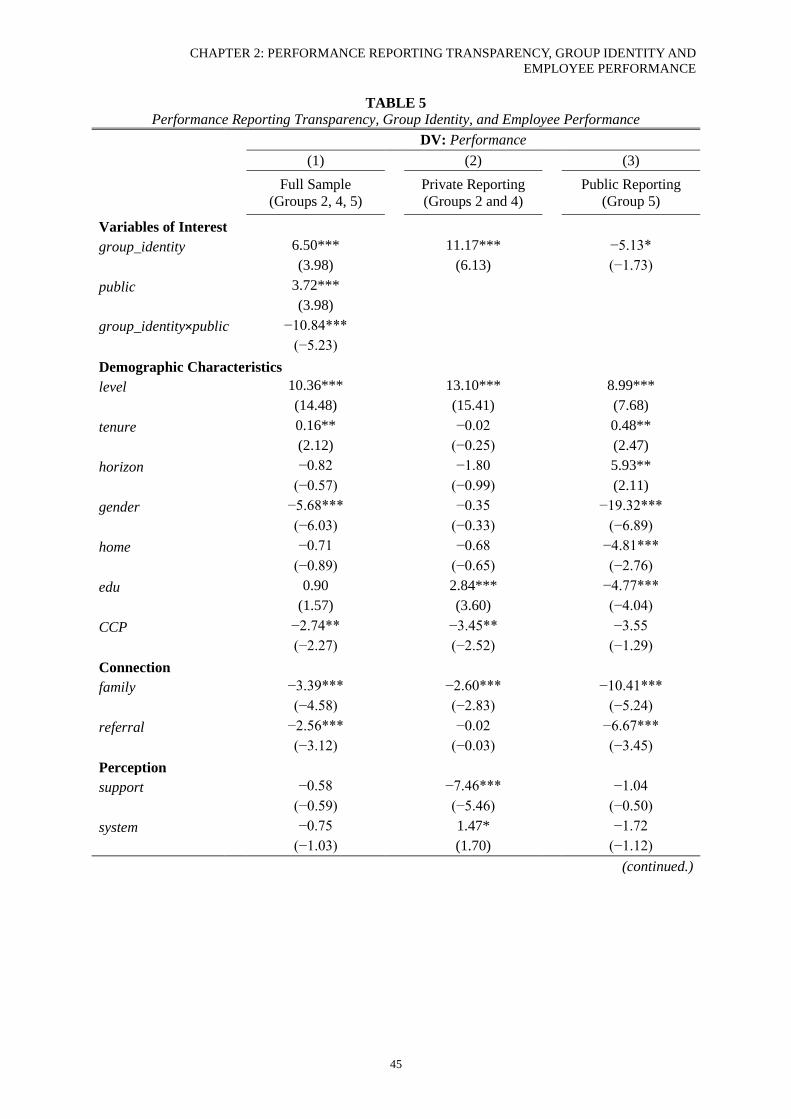
CHAPTER 2: PERFORMANCE REPORTING TRANSPARENCY, GROUP IDENTITY AND
EMPLOYEE PERFORMANCE
45
TABLE 5
Performance Reporting Transparency, Group Identity, and Employee Performance DV: Performance (1) (2) (3)
Full Sample
(Groups 2, 4, 5) Private Reporting
(Groups 2 and 4) Public Reporting
(Group 5)
Variables of Interest
group_identity 6.50*** 11.17*** −5.13*
(3.98) (6.13) (−1.73)
public 3.72***
(3.98)
group_identity×public −10.84***
(−5.23)
Demographic Characteristics
level 10.36*** 13.10*** 8.99***
(14.48) (15.41) (7.68)
tenure 0.16** −0.02 0.48**
(2.12) (−0.25) (2.47)
horizon −0.82 −1.80 5.93**
(−0.57) (−0.99) (2.11)
gender −5.68*** −0.35 −19.32***
(−6.03) (−0.33) (−6.89)
home −0.71 −0.68 −4.81***
(−0.89) (−0.65) (−2.76)
edu 0.90 2.84*** −4.77***
(1.57) (3.60) (−4.04)
CCP −2.74** −3.45** −3.55
(−2.27) (−2.52) (−1.29)
Connection
family −3.39*** −2.60*** −10.41***
(−4.58) (−2.83) (−5.24)
referral −2.56*** −0.02 −6.67***
(−3.12) (−0.03) (−3.45)
Perception
support −0.58 −7.46*** −1.04
(−0.59) (−5.46) (−0.50)
system −0.75 1.47* −1.72
(−1.03) (1.70) (−1.12)
(continued.)
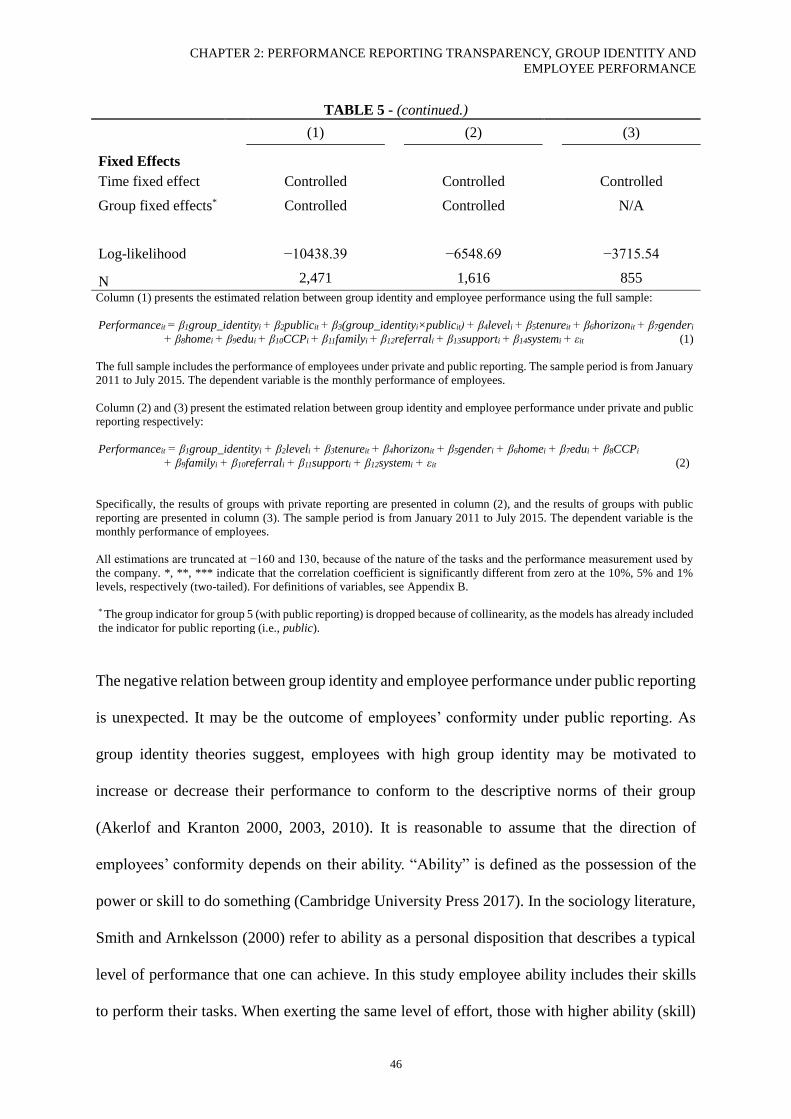
CHAPTER 2: PERFORMANCE REPORTING TRANSPARENCY, GROUP IDENTITY AND
EMPLOYEE PERFORMANCE
46
TABLE 5 - (continued.)
(1) (2) (3)
Fixed Effects
Time fixed effect Controlled
Controlled
Controlled
Group fixed effects* Controlled
Controlled
N/A
Log-likelihood −10438.39 −6548.69 −3715.54
N 2,471 1,616 855
Column (1) presents the estimated relation between group identity and employee performance using the full sample:
Performanceit = β1group_identityi + β2publicit + β3(group_identityi×publicit) + β4leveli + β5tenureit + β6horizonit + β7genderi
+ β8homei + β9edui + β10CCPi + β11familyi + β12referrali + β13supporti + β14systemi + εit (1)
The full sample includes the performance of employees under private and public reporting. The sample period is from January
2011 to July 2015. The dependent variable is the monthly performance of employees.
Column (2) and (3) present the estimated relation between group identity and employee performance under private and public
reporting respectively:
Performanceit = β1group_identityi + β2leveli + β3tenureit + β4horizonit + β5genderi + β6homei + β7edui + β8CCPi
+ β9familyi + β10referrali + β11supporti + β12systemi + εit (2)
Specifically, the results of groups with private reporting are presented in column (2), and the results of groups with public
reporting are presented in column (3). The sample period is from January 2011 to July 2015. The dependent variable is the
monthly performance of employees.
All estimations are truncated at −160 and 130, because of the nature of the tasks and the performance measurement used by
the company. *, **, *** indicate that the correlation coefficient is significantly different from zero at the 10%, 5% and 1%
levels, respectively (two-tailed). For definitions of variables, see Appendix B.
* The group indicator for group 5 (with public reporting) is dropped because of collinearity, as the models has already included
the indicator for public reporting (i.e., public).
The negative relation between group identity and employee performance under public reporting
is unexpected. It may be the outcome of employees’ conformity under public reporting. As
group identity theories suggest, employees with high group identity may be motivated to
increase or decrease their performance to conform to the descriptive norms of their group
(Akerlof and Kranton 2000, 2003, 2010). It is reasonable to assume that the direction of
employees’ conformity depends on their ability. “Ability” is defined as the possession of the
power or skill to do something (Cambridge University Press 2017). In the sociology literature,
Smith and Arnkelsson (2000) refer to ability as a personal disposition that describes a typical
level of performance that one can achieve. In this study employee ability includes their skills
to perform their tasks. When exerting the same level of effort, those with higher ability (skill)
CHAPTER 2: PERFORMANCE REPORTING TRANSPARENCY, GROUP IDENTITY AND
EMPLOYEE PERFORMANCE
47
can achieve better task performance than those with lower ability. That is, to achieve a certain
level of performance, those with low ability must exert higher effort than those with high ability.
To conform to the group descriptive norms (i.e., adjust performance to “look” more similar to
others in one’s group), employees with high (low) ability are likely to suppress (improve) their
performance. If this is the case, group identify would be negatively (positively) related to the
performance of employees with high (low) ability.
To better understand how group identity and employee performance are related under public
reporting, I divide employees in the group with public reporting into two categories based on
their ability. In the research site, the level skills (level) that the SOE assigns to employees based
on their performance in the regular exams reflect employees’ ability in analyzing the equipment
conditions and choosing the appropriate actions. I thus use level to proxy employees’ ability.
The results are presented in Table 6. The results show that group identity is positively related
to the performance of employees with low ability (β = 15.70, t = 1.81), but negatively related
to the performance of employees with high ability (β = −4.52, t = −1.68). These results are
consistent with the argument that group identity motivates employees with high (low) ability
to conform to the descriptive norms in their workgroup by suppressing (improving) their
performance.
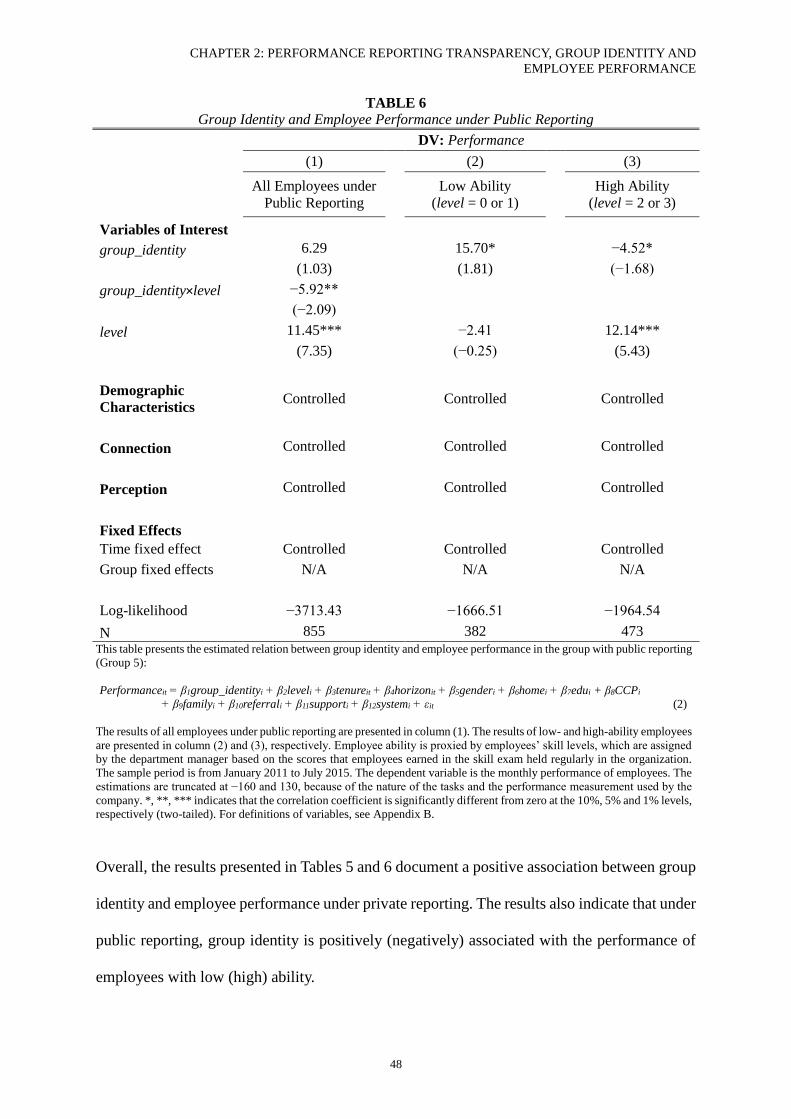
CHAPTER 2: PERFORMANCE REPORTING TRANSPARENCY, GROUP IDENTITY AND
EMPLOYEE PERFORMANCE
48
TABLE 6
Group Identity and Employee Performance under Public Reporting DV: Performance (1) (2) (3)
All Employees under
Public Reporting Low Ability
(level = 0 or 1) High Ability
(level = 2 or 3)
Variables of Interest
group_identity 6.29 15.70* −4.52*
(1.03) (1.81) (−1.68)
group_identity×level −5.92**
(−2.09)
level 11.45*** −2.41 12.14***
(7.35) (−0.25) (5.43)
Demographic
Characteristics Controlled
Controlled
Controlled
Connection Controlled Controlled Controlled
Perception Controlled Controlled Controlled
Fixed Effects
Time fixed effect Controlled Controlled Controlled
Group fixed effects N/A N/A N/A
Log-likelihood −3713.43 −1666.51 −1964.54
N 855 382 473
This table presents the estimated relation between group identity and employee performance in the group with public reporting
(Group 5):
Performanceit = β1group_identityi + β2leveli + β3tenureit + β4horizonit + β5genderi + β6homei + β7edui + β8CCPi
+ β9familyi + β10referrali + β11supporti + β12systemi + εit (2)
The results of all employees under public reporting are presented in column (1). The results of low- and high-ability employees
are presented in column (2) and (3), respectively. Employee ability is proxied by employees’ skill levels, which are assigned
by the department manager based on the scores that employees earned in the skill exam held regularly in the organization.
The sample period is from January 2011 to July 2015. The dependent variable is the monthly performance of employees. The
estimations are truncated at −160 and 130, because of the nature of the tasks and the performance measurement used by the
company. *, **, *** indicates that the correlation coefficient is significantly different from zero at the 10%, 5% and 1% levels,
respectively (two-tailed). For definitions of variables, see Appendix B.
Overall, the results presented in Tables 5 and 6 document a positive association between group
identity and employee performance under private reporting. The results also indicate that under
public reporting, group identity is positively (negatively) associated with the performance of
employees with low (high) ability.
CHAPTER 2: PERFORMANCE REPORTING TRANSPARENCY, GROUP IDENTITY AND
EMPLOYEE PERFORMANCE
49
Additional Analyses
The results of the main findings are subject to two potential issues. First, there is only one
group with public reporting (i.e., Group 5) in the sample. It is thus important to demonstrate
whether the findings about public reporting are driven by performance reporting transparency
or any unobservable group feature(s). Second, it is unclear whether group identity is affected
by performance reporting transparency. If so, the effects of the performance reporting
transparency and group identity would be confounding, and this would complicate the
interpretation of the findings. I conduct three sets of additional analyses to address these issues.
Change of Performance Reporting Transparency
I use two methods to rule out the alternative explanation that the findings about public reporting
are driven by unobservable group feature(s). The first method is to examine employee
performance in a group that changed its performance reporting transparency. Specifically, one
of the groups in the department (Group 3) switched from private to public reporting by the end
of 2013. As mentioned in the research site section, Group 3 experienced a change in group
leader. The old group leader used private reporting, while the new group leader started to use
public reporting since December, 2013. This provides an opportunity to examine whether
employees with different levels of group identity react differently toward a change in
performance reporting transparency.
Because of a computer breakdown in early 2015, the switched group (Group 3) lost its
performance observations for August to December 2013, June to December 2014, and January
to July 2015. Because most data after the change is missing from the switched group, it is
difficult to obtain difference-in-difference estimations. Therefore, I compare employee
performance before and after the change using the available data for the switched group. I also
CHAPTER 2: PERFORMANCE REPORTING TRANSPARENCY, GROUP IDENTITY AND
EMPLOYEE PERFORMANCE
50
use employee performance in the groups with private reporting (Groups 2 and 4) as a reference
for the general patterns in employee performance. Figure 2 presents the results with tables and
figures.
I divide employees into high and low group identity based on the median of group_identity.
Within the subsamples of high or low group identity, I further divide employees into high and
low ability based on their skill levels assessed by the SOE (i.e., level). I first look at employees
with high group identity. Figure 2 shows that after the switched group changed from private to
public reporting, those with high group identity and low ability increased their performance
from 17.42 to 21.25 (p < 0.10). In comparison, those with high group identity and high ability
decreased their performance from 33.40 to 28.82 (p < 0.05). I then look at employees with low
group identity. Figure 2 shows that in the subsample of low group identity, the performance of
employees with low (high) ability increased (decreased) after the change. However, these
changes are not statistically significant. The overall employee performance of the switched
group increased after the change from private to public reporting. Taken together, the patterns
demonstrated in Figure 2 are consistent with the results of the main analysis, which suggest
that group identity is positively (negatively) related to the performance of employees with low
(high) ability under public reporting.
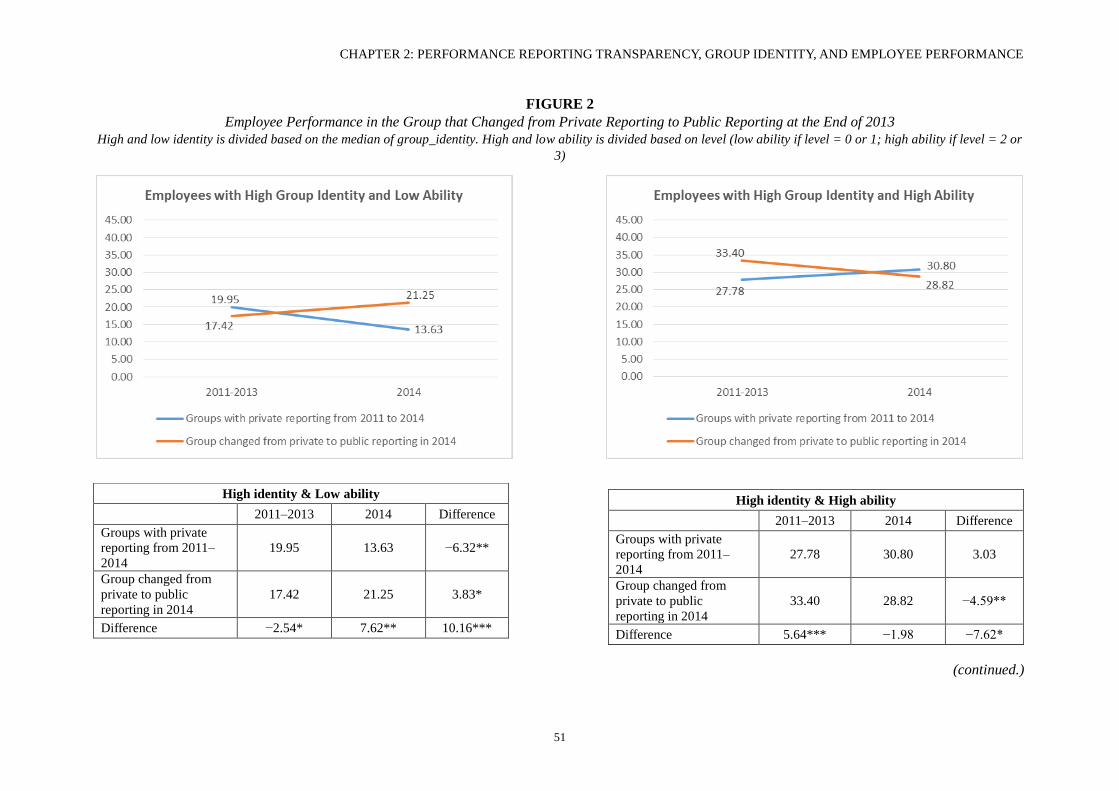
CHAPTER 2: PERFORMANCE REPORTING TRANSPARENCY, GROUP IDENTITY, AND EMPLOYEE PERFORMANCE
51
FIGURE 2
Employee Performance in the Group that Changed from Private Reporting to Public Reporting at the End of 2013
High and low identity is divided based on the median of group_identity. High and low ability is divided based on level (low ability if level = 0 or 1; high ability if level = 2 or
3)
(continued.)
High identity & High ability
2011–2013 2014 Difference
Groups with private
reporting from 2011–
2014
27.78 30.80 3.03
Group changed from
private to public
reporting in 2014
33.40 28.82 −4.59**
Difference 5.64*** −1.98 −7.62*
High identity & Low ability
2011–2013 2014 Difference
Groups with private
reporting from 2011–
2014
19.95 13.63 −6.32**
Group changed from
private to public
reporting in 2014
17.42 21.25 3.83*
Difference −2.54* 7.62** 10.16***
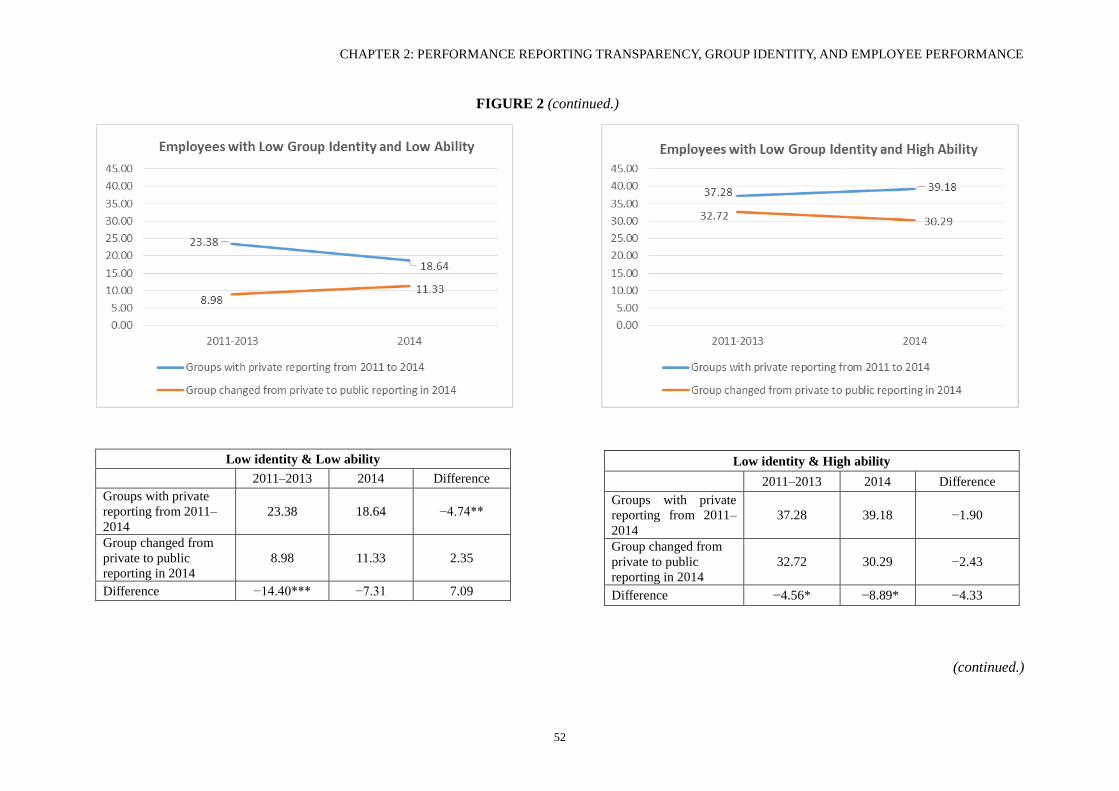
CHAPTER 2: PERFORMANCE REPORTING TRANSPARENCY, GROUP IDENTITY, AND EMPLOYEE PERFORMANCE
52
FIGURE 2 (continued.)
Low identity & Low ability
2011–2013 2014 Difference
Groups with private
reporting from 2011–
2014
23.38 18.64 −4.74**
Group changed from
private to public
reporting in 2014
8.98 11.33 2.35
Difference −14.40*** −7.31 7.09
(continued.)
Low identity & High ability
2011–2013 2014 Difference
Groups with private
reporting from 2011–
2014
37.28 39.18 −1.90
Group changed from
private to public
reporting in 2014
32.72 30.29 −2.43
Difference −4.56* −8.89* −4.33
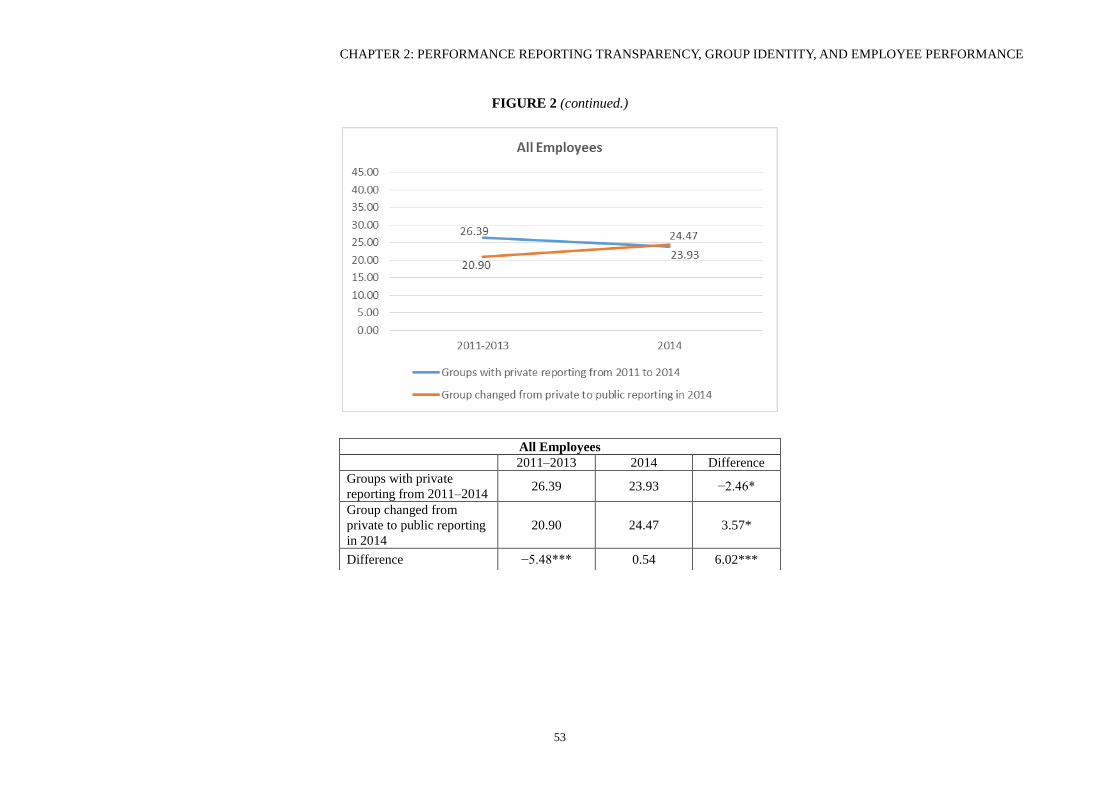
CHAPTER 2: PERFORMANCE REPORTING TRANSPARENCY, GROUP IDENTITY, AND EMPLOYEE PERFORMANCE
53
FIGURE 2 (continued.)
All Employees
2011–2013 2014 Difference
Groups with private
reporting from 2011–2014 26.39 23.93 −2.46*
Group changed from
private to public reporting
in 2014
20.90 24.47 3.57*
Difference −5.48*** 0.54 6.02***
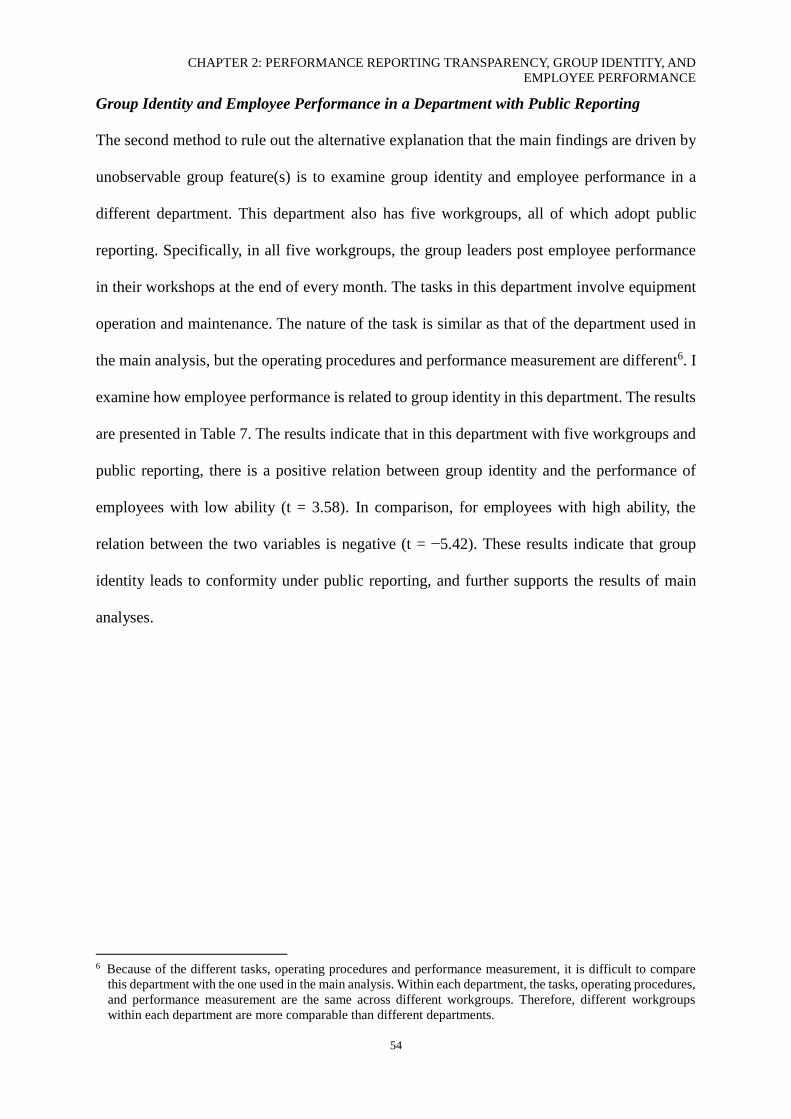
CHAPTER 2: PERFORMANCE REPORTING TRANSPARENCY, GROUP IDENTITY, AND
EMPLOYEE PERFORMANCE
54
Group Identity and Employee Performance in a Department with Public Reporting
The second method to rule out the alternative explanation that the main findings are driven by
unobservable group feature(s) is to examine group identity and employee performance in a
different department. This department also has five workgroups, all of which adopt public
reporting. Specifically, in all five workgroups, the group leaders post employee performance
in their workshops at the end of every month. The tasks in this department involve equipment
operation and maintenance. The nature of the task is similar as that of the department used in
the main analysis, but the operating procedures and performance measurement are different6. I
examine how employee performance is related to group identity in this department. The results
are presented in Table 7. The results indicate that in this department with five workgroups and
public reporting, there is a positive relation between group identity and the performance of
employees with low ability (t = 3.58). In comparison, for employees with high ability, the
relation between the two variables is negative (t = −5.42). These results indicate that group
identity leads to conformity under public reporting, and further supports the results of main
analyses.
6 Because of the different tasks, operating procedures and performance measurement, it is difficult to compare
this department with the one used in the main analysis. Within each department, the tasks, operating procedures,
and performance measurement are the same across different workgroups. Therefore, different workgroups
within each department are more comparable than different departments.
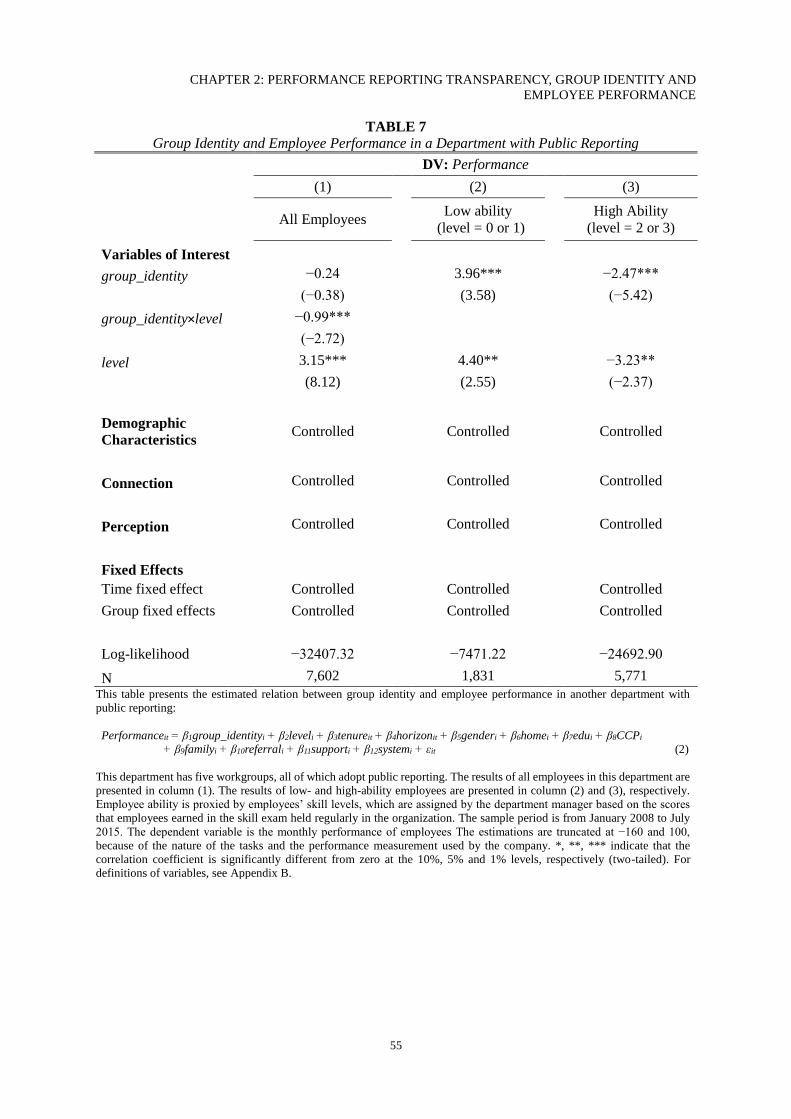
CHAPTER 2: PERFORMANCE REPORTING TRANSPARENCY, GROUP IDENTITY AND
EMPLOYEE PERFORMANCE
55
TABLE 7
Group Identity and Employee Performance in a Department with Public Reporting DV: Performance
(1) (2) (3)
All Employees Low ability
(level = 0 or 1) High Ability
(level = 2 or 3)
Variables of Interest
group_identity −0.24 3.96*** −2.47***
(−0.38) (3.58) (−5.42)
group_identity×level −0.99***
(−2.72)
level 3.15*** 4.40** −3.23**
(8.12) (2.55) (−2.37)
Demographic
Characteristics Controlled
Controlled
Controlled
Connection Controlled Controlled Controlled
Perception Controlled Controlled Controlled
Fixed Effects
Time fixed effect Controlled Controlled Controlled
Group fixed effects Controlled Controlled Controlled
Log-likelihood −32407.32 −7471.22 −24692.90
N 7,602 1,831 5,771
This table presents the estimated relation between group identity and employee performance in another department with
public reporting:
Performanceit = β1group_identityi + β2leveli + β3tenureit + β4horizonit + β5genderi + β6homei + β7edui + β8CCPi
+ β9familyi + β10referrali + β11supporti + β12systemi + εit (2)
This department has five workgroups, all of which adopt public reporting. The results of all employees in this department are
presented in column (1). The results of low- and high-ability employees are presented in column (2) and (3), respectively.
Employee ability is proxied by employees’ skill levels, which are assigned by the department manager based on the scores
that employees earned in the skill exam held regularly in the organization. The sample period is from January 2008 to July
2015. The dependent variable is the monthly performance of employees The estimations are truncated at −160 and 100,
because of the nature of the tasks and the performance measurement used by the company. *, **, *** indicate that the
correlation coefficient is significantly different from zero at the 10%, 5% and 1% levels, respectively (two-tailed). For
definitions of variables, see Appendix B.
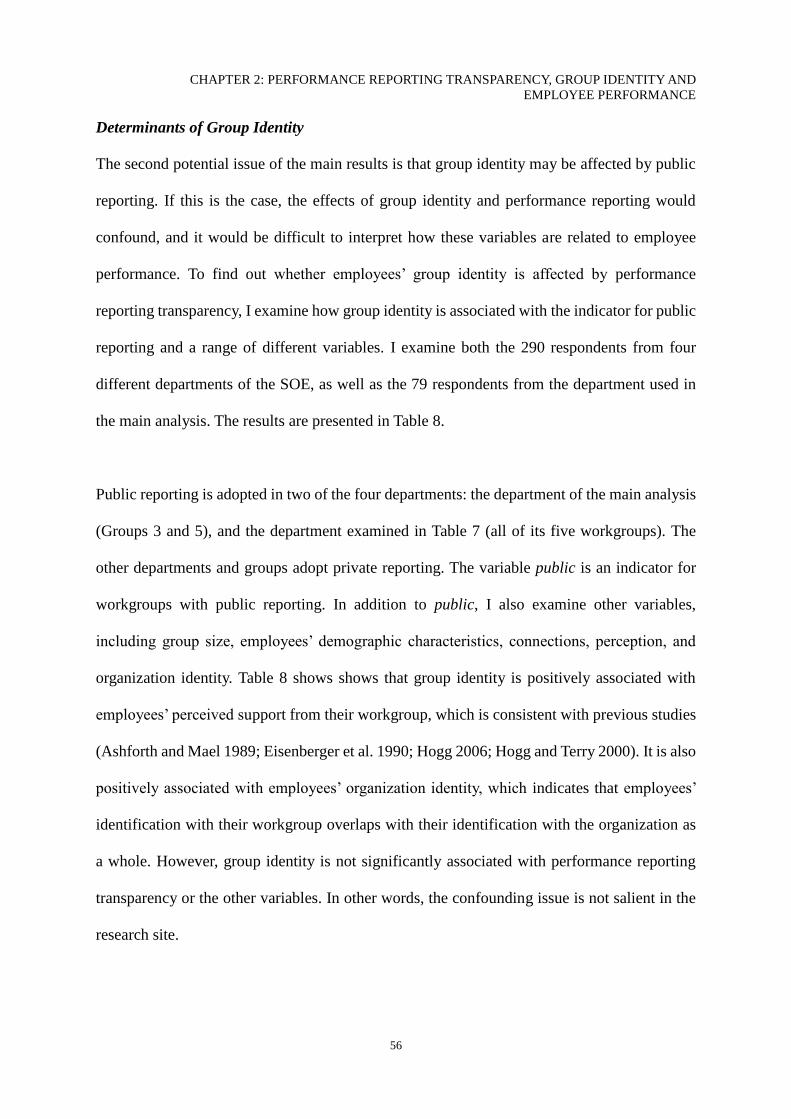
CHAPTER 2: PERFORMANCE REPORTING TRANSPARENCY, GROUP IDENTITY AND
EMPLOYEE PERFORMANCE
56
Determinants of Group Identity
The second potential issue of the main results is that group identity may be affected by public
reporting. If this is the case, the effects of group identity and performance reporting would
confound, and it would be difficult to interpret how these variables are related to employee
performance. To find out whether employees’ group identity is affected by performance
reporting transparency, I examine how group identity is associated with the indicator for public
reporting and a range of different variables. I examine both the 290 respondents from four
different departments of the SOE, as well as the 79 respondents from the department used in
the main analysis. The results are presented in Table 8.
Public reporting is adopted in two of the four departments: the department of the main analysis
(Groups 3 and 5), and the department examined in Table 7 (all of its five workgroups). The
other departments and groups adopt private reporting. The variable public is an indicator for
workgroups with public reporting. In addition to public, I also examine other variables,
including group size, employees’ demographic characteristics, connections, perception, and
organization identity. Table 8 shows shows that group identity is positively associated with
employees’ perceived support from their workgroup, which is consistent with previous studies
(Ashforth and Mael 1989; Eisenberger et al. 1990; Hogg 2006; Hogg and Terry 2000). It is also
positively associated with employees’ organization identity, which indicates that employees’
identification with their workgroup overlaps with their identification with the organization as
a whole. However, group identity is not significantly associated with performance reporting
transparency or the other variables. In other words, the confounding issue is not salient in the
research site.
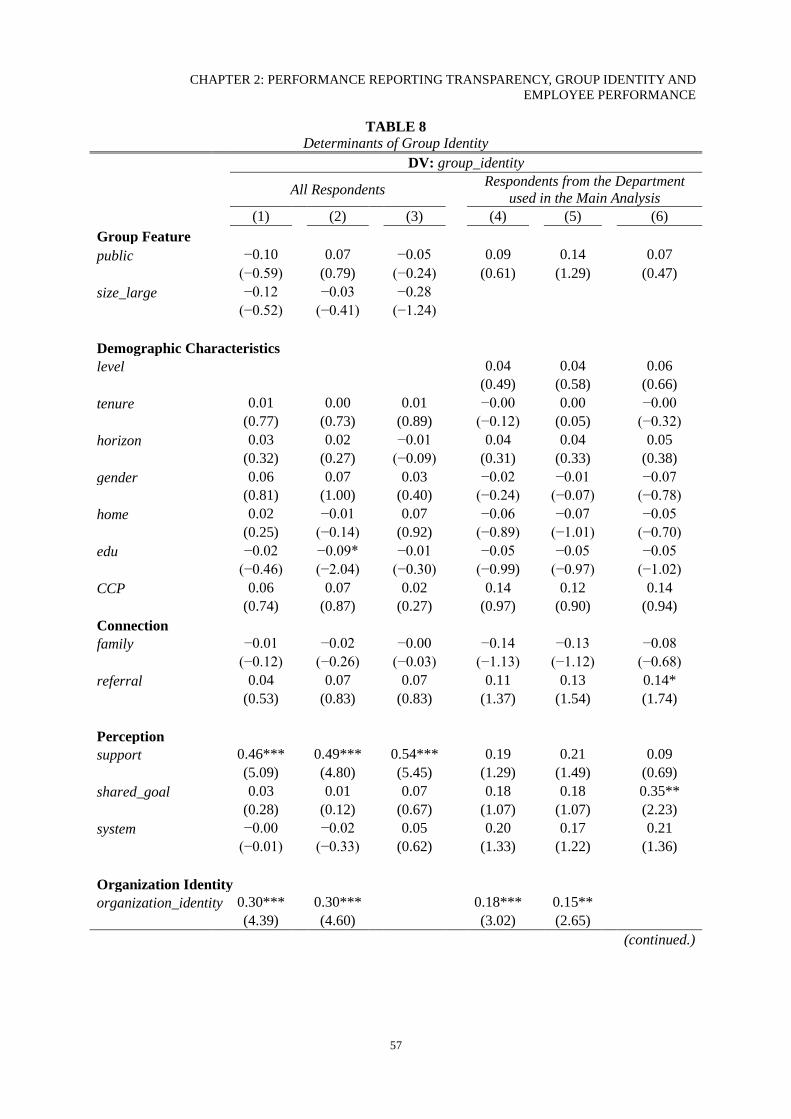
CHAPTER 2: PERFORMANCE REPORTING TRANSPARENCY, GROUP IDENTITY AND
EMPLOYEE PERFORMANCE
57
TABLE 8
Determinants of Group Identity DV: group_identity
All Respondents Respondents from the Department
used in the Main Analysis (1) (2) (3) (4) (5) (6)
Group Feature
public −0.10 0.07 −0.05 0.09 0.14 0.07
(−0.59) (0.79) (−0.24) (0.61) (1.29) (0.47)
size_large −0.12 −0.03 −0.28
(−0.52) (−0.41) (−1.24)
Demographic Characteristics
level 0.04 0.04 0.06
(0.49) (0.58) (0.66)
tenure 0.01 0.00 0.01 −0.00 0.00 −0.00
(0.77) (0.73) (0.89) (−0.12) (0.05) (−0.32)
horizon 0.03 0.02 −0.01 0.04 0.04 0.05
(0.32) (0.27) (−0.09) (0.31) (0.33) (0.38)
gender 0.06 0.07 0.03 −0.02 −0.01 −0.07
(0.81) (1.00) (0.40) (−0.24) (−0.07) (−0.78)
home 0.02 −0.01 0.07 −0.06 −0.07 −0.05
(0.25) (−0.14) (0.92) (−0.89) (−1.01) (−0.70)
edu −0.02 −0.09* −0.01 −0.05 −0.05 −0.05
(−0.46) (−2.04) (−0.30) (−0.99) (−0.97) (−1.02)
CCP 0.06 0.07 0.02 0.14 0.12 0.14
(0.74) (0.87) (0.27) (0.97) (0.90) (0.94)
Connection
family −0.01 −0.02 −0.00 −0.14 −0.13 −0.08
(−0.12) (−0.26) (−0.03) (−1.13) (−1.12) (−0.68)
referral 0.04 0.07 0.07 0.11 0.13 0.14*
(0.53) (0.83) (0.83) (1.37) (1.54) (1.74)
Perception
support 0.46*** 0.49*** 0.54*** 0.19 0.21 0.09
(5.09) (4.80) (5.45) (1.29) (1.49) (0.69)
shared_goal 0.03 0.01 0.07 0.18 0.18 0.35**
(0.28) (0.12) (0.67) (1.07) (1.07) (2.23)
system −0.00 −0.02 0.05 0.20 0.17 0.21
(−0.01) (−0.33) (0.62) (1.33) (1.22) (1.36)
Organization Identity
organization_identity 0.30*** 0.30*** 0.18*** 0.15**
(4.39) (4.60)
(3.02) (2.65)
(continued.)
CHAPTER 2: PERFORMANCE REPORTING TRANSPARENCY, GROUP IDENTITY AND
EMPLOYEE PERFORMANCE
58
TABLE 8 (continued.)
(1) (2) (3) (4) (5) (6)
Group fixed
effects Controlled
No
Controlled
Controlled
No
Controlled
Adjusted R2 58.68% 58.36% 53.44% 60.21% 60.32% 57.12%
N 286 286 286 76 76 76 This table presents the estimated relations between employees’ group identity and other variables. Results of all respondents
(from four different departments of the organization) are presented in column (1) – (3), and the results of the respondents from
the department used in the main analysis (i.e., Tables 5 and 6) are presented in column (4) – (6). *, **, *** indicate that the
correlation coefficient is significantly different from zero at the 10%, 5% and 1% levels, respectively (two-tailed). For definitions
of variables, see Appendix B.
Robustness Checks
In the robustness tests, I first winsorize Performance at 5% and 1% to ensure the results are
not distorted by any extreme values in employee performance. Second, as the dataset in this
study involves multiple periods, I include time-series variables into the models to check the
robustness of the results. After including the lag of Performance in the estimations, the
coefficients on some demographic variables lose significance. The coefficients on the lag
Performance are significantly positive, which suggests employee performance is persistent
over time. The conclusions remain the same. Further, because some employees took sick leave
in certain months and the function of the equipment at times was affected by external factors
like extreme weather, the performance information of some employees is missing in some
months. Excluding the months with missing observations does not change the conclusions.
Additionally, although the main tests exclude two groups to make the private and public
conditions more comparable, including these two groups in the analysis does not change the
conclusion. Finally, I also use OLS instead of the censored model. The adjusted R2 of the
estimations are around 60%, and the conclusions remain the same.
2.6 Concluding Remarks
Using archival and survey data from a field site, I find that the relation between group identity
and employee performance is conditional on the performance reporting transparency in the
CHAPTER 2: PERFORMANCE REPORTING TRANSPARENCY, GROUP IDENTITY AND
EMPLOYEE PERFORMANCE
59
workplace. Specifically, in workgroups with private reporting, higher group identity motivates
employees to improve their performance by following the performance requirements set by the
organization. However, in workgroups with public reporting, higher group identity motivates
employees with high (low) ability to suppress (improve) their performance to conform to the
group descriptive norms.
This study examines how performance reporting transparency affects employees’ performance
through their group identity. However, I do not attempt to make a conclusion about how
performance reporting transparency affects overall employee performance within a group. The
answer to this question is based on the specific conditions of different workgroups. As the
results indicate, the overall performance impact of performance reporting transparency
depends on the group identity and ability of employees, as well as the performance distribution
within a group.
Furthermore, this study is different from the prior research studying the relation between
information environment, employee ability and performance. In particular, Casas-Arce and
Asís Martínez-Jerez (2009) find that providing relative performance information in
tournaments leads high performers to decrease their effort. They suggest that relative
performance information reveals the ability gap between high performers and their peers, so
high performers realize that they can still win the tournaments by exerting lower effort. This
study differs from Casas-Arce and Asís Martínez-Jerez (2009) for three reasons. First, there is
no tournament, formal competition or performance ranking in the research site of this study.
Therefore, employees in this study are less likely to have strong motivation to “win” or “lead”
in their workgroup. Second, when high-ability employees lower their performance, they forgoe
some financial rewards. Such financial sacrifice indicates that high-ability employees are less
CHAPTER 2: PERFORMANCE REPORTING TRANSPARENCY, GROUP IDENTITY AND
EMPLOYEE PERFORMANCE
60
likely to lower their performance just because they realize less effort is needed to demonstrate
higher performance than their peers. Third, the results indicate that it is only the high-ability
employees with higher group identity that are more likely to lower their performance and
sacrifice their financial rewards. In other words, group identity is likely to be the factor that
motivates high-ability employees to lower their performance and sacrifice financial rewards.
Overall, the findings of this study differ from the existing evidence, and highlights the
importance of group identity in driving employee behaviors.
This study contributes to the literature on internal performance reporting (Azmat and Iriberri
2010; Frederickson 1992; Hannan et al. 2008, 2013; Maas and Rinsum 2013; Tafkov 2012).
Previous research finds that public reporting leads to higher employee performance than private
reporting does (Tafkov 2012). However, this study shows that public reporting may lead
employees with high group identity and ability to suppress their performance to conform to
group descriptive norms. This study also adds to the growing literature on group identity
(Abernethy et al. 2016; Empson 2004; Heinle, Hoffman, and Kunz 2012; Towry 2003), by
documenting the relation between group identity and employee performance, and how this
relation is affected by the performance reporting choices made by managers. Further, this study
has practical implications. It suggests that managers need to consider employees’ group identity
and ability, as well as the group descriptive norms when making reporting choices. As group
identity may be affected by such control mechanisms as employee selection and the design of
group structure (Ahsforth and Mael 1989; Hogg and Terry 2000), managers may also need to
consider different management controls as an integrated system.
This study has several limitations. First, it is an open question as to what extent we can
generalize the findings from a single research site. To examine the research question, this study
CHAPTER 2: PERFORMANCE REPORTING TRANSPARENCY, GROUP IDENTITY AND
EMPLOYEE PERFORMANCE
61
used a field site where employees’ group identity is salient and there is a variation in
performance reporting transparency across different workgroups. The findings might not
generalize directly to other firms with different tasks, incentives, and employees with different
backgrounds and personalities. Second, although this study documents the relation between
group identity and employee performance in groups with different performance transparency,
I cannot examine which underlying mechanism(s) are driving these relations, and thus do not
attempt to demonstrate the causal chain that explains these relations. Finally, this study employs
long time-series data from a real-world setting, which makes it difficult to rule out alternative
explanations for the findings. However, given that the context is controlled for and the research
subjects have long tenures in this setting, this does not pose a significant threat. Future research
could attempt to replicate and extend this study in a setting that controls for these limitations.
CHAPTER 2: PERFORMANCE REPORTING TRANSPARENCY, GROUP IDENTITY AND
EMPLOYEE PERFORMANCE
62
REFERENCES
Abernethy, M., J. Bouwens, and P. Kroos. 2017. Organization identity and earnings
manipulation. Accounting, Organizations and Society. Available at:
http://www.sciencedirect.com/science/article/pii/S0361368217300193 [Accessed 31
May 2017]
Akerlof, G. A., and R. E. Kranton. 2000. Economics and identity. Quarterly Journal of
Economics 115(3): 715–753.
Akerlof, G. A., and R. E. Kranton. 2003. Identity and the economics of organizations. The
Journal of Economic Perspectives 19(1): 9–32.
Akerlof, G. A., and R. E. Kranton. 2008. Identity, supervision, and work groups. The American
Economic Review 98(2): 212–217.
Akerlof, G. A., and R. E. Kranton. 2010. Identity Economics: How Our Identities Shape Our
Work, Wages, and Well-Being. Princeton, NJ: Princeton University Press.
Ashforth, B. E., and F. Mael. 1989. Social identity theory and the organization. Academy of
Management Review 14(1): 20–39.
Azmat, G., and N. Iriberri. 2010. The importance of relative performance feedback information:
Evidence from a natural experiment using high school students. Journal of Public
Economics 94(7): 435–452.
Bartel, C. 2001. Social comparisons in boundary-spanning work: Effects of community
outreach on members’ organizational identity and identification. Administrative Science
Quarterly 46(3): 379–413.
Beaman, L., and J. Magruder. 2012. Who gets the job referral? Evidence from a social network
experiment. The American Economic Review 102(7): 3574–3593.
Bergami, M., and R. P. Bagozzi. 2000. Self-categorization, affective commitment and group
self-esteem as distinct aspects of social identity in the organization. British Journal of
Social Psychology 39(4): 555–577.
Boivie, S., D. Lange, M. L McDonald, and J. D. Westphal. 2011. Me or we: The effects of CEO
organizational identification on agency costs. Academy of Management Journal 54(3):
551–576.
Brown, M., E. Setren, and G. Topa. 2016. Do informal referrals lead to better matches?
Evidence from a firm’s employee referral system. Journal of Labor Economics 34(1):
161–209.
Burks, S. V., B. Cowgill., M. Hoffman, and M. Housman. 2015. The value of hiring through
employee referrals. The Quarterly Journal of Economics 130(2): 805–839.
Casas-Arce, P, and Asís Martínez-Jerez, F. 2009. Relative Performance Compensation,
Contests, and Dynamic Incentives. Management Science 55(8): 1306–1320.
Cambridge University Press. 2017. Cambridge online dictionary. Available at:
http://dictionary.cambridge.org/dictionary/english/ability (last accessed May 21, 2017).
Cardinaels, E., and Yin, H. 2015. Think twice before going for incentives: Social norms and
the principal’s decision on compensation contracts. Journal of Accounting Research
53(5): 985–1015.
Charness, G., D. Masclet, and M. C. Villeval. 2013. The dark side of competition for status.
Management Science 60(1): 38–55.
Cialdini, R. B., and N. J. Goldstein. 2004. Social influence: Compliance and conformity.
Annual Review of Psychology 55: 591–621.
Cialdini, R. B., C. A. Kallgren, and R. R. Reno. 1990. A focus theory of normative conduct:
Recycling the concept of norms to reduce littering in public places. Journal of
Personality and Social Psychology 58(6): 1015–1026.
CHAPTER 2: PERFORMANCE REPORTING TRANSPARENCY, GROUP IDENTITY AND
EMPLOYEE PERFORMANCE
63
Cialdini, R. B., C. A. Kallgren, and R. R. Reno. 1991. A focus theory of normative conduct: A
theoretical refinement and re-evaluation of the role of norms in human behavior.
Advances in Experimental Social Psychology 24: 201–234.
Cialdini, R. B., and M. R. Trost. 1998. Social influence: Social norms, conformity, and
compliance. In The Handbook of Social Psychology, Volume II, edited by D. T. Gilbert,
S. T. Fiske, and G. Lindzey, 151–192. New York, NY: Oxford University.
Davis, J. S., G. Hecht, and J. D. Perkins. 2003. Social behaviors, enforcement, and tax
compliance dynamics. The Accounting Review 78(1): 39–69.
Dukerich, J. M., B. R. Golden, and S. M. Shortell. 2002. Beauty is in the eye of the beholder:
The impact of organizational identification, identity, and image on the cooperative
behaviors of physicians. Administrative Science Quarterly 47(3): 507–533.
Eisenberger, R., P. Fasolo, and V. Davis-LaMastro. 1990. Perceived organizational support and
employee diligence, commitment, and innovation. Journal of Applied Psychology 75(1):
51-59.
Empson, L. 2004. Organizational identity change: Managerial regulation and member
identification in an accounting firm acquisition. Accounting, Organizations and Society
29(8): 759–781.
Festinger, L. 1954. A theory of social comparison processes. Human Relations 7(2): 117–140.
Fischer, P., and S. Huddar. 2008. Optimal contracting with endogenous social norms. The
American Economic Review 98(4): 1459–1475.
Frederickson, J. R. 1992. Relative performance information: The effects of common
uncertainty and contract type on agent effort. The Accounting Review 67(4): 647–669.
Gardiner, M., and M. Tiggemann. 1999. Gender differences in leadership style, job stress and
mental health in male and female dominated industries. Journal of Occupational and
Organizational Psychology 72(3): 301–315.
Gibbons, R., and R. S. Kaplan. 2015. Formal measures in informal management: Can a
balanced scorecard change a culture? American Economic Review: Papers and
Proceedings 105(5): 447–451.
Hannan, R. L., R. Krishnan, and A. H. Newman. 2008. The effects of disseminating relative
performance feedback in tournament and individual performance compensation plans.
The Accounting Review 83(4): 893–913.
Hannan, R. L., G. P. McPhee, A. H. Newman, and I. D. Tafkov. 2013. The effect of relative
performance information on performance and effort allocation in a multi-task
environment. The Accounting Review 88(2): 553–575.
Haslam, S. A., and N. Ellemers. 2005. Social identity in industrial and organizational
psychology: Concepts, controversies and contributions. International Review of
Industrial and Organizational Psychology 20(1): 39–118.
Heinle, M. S., C. Hofmann, and A. H. Kunz. 2012. Identity, incentives, and the value of
information. The Accounting Review 87(4): 1309–1334.
Hensvik, L., and O. N. Skans. 2016. Social networks, employee selection, and labor market
outcomes. Journal of Labor Economics 34(4): 825–867.
Hogg, M. A. 2006. Social identity theory. In Contemporary Social Psychological Theories,
edited by P. J. Burk, 111–136. Stanford, CA: Stanford University Press.
Hogg, M. A., and D. I. Terry. 2000. Social identity and self-categorization processes in
organizational contexts. Academy of Management Review 25(1): 121–140.
Ichino, A., and A. Falk. 2003. Clean evidence on peer pressure. Journal of Labor Economics
96(5): 39–57.
Johnson, M. D., F. P. Morgeson, D. R. Ilgen, C. J. Meyer, and J. W. Lloyd. 2006. Multiple
professional identities: Examining differences in identification across work-related
CHAPTER 2: PERFORMANCE REPORTING TRANSPARENCY, GROUP IDENTITY AND
EMPLOYEE PERFORMANCE
64
targets. Journal of Applied Psychology, 91(2): 498–506.
Luckett, P. F., and I. R. Eggleton. 1991. Feedback and management accounting: a review of
research into behavioral consequences. Accounting, Organizations and Society 16(4):
371–394.
Luft, J. 2016. Cooperation and competition among employees: Experimental evidence on the
role of management control systems. Management Accounting Research.
doi:10.1016/j.mar.2016.02.00
Maas, V. S., and M. Van Rinsum. 2013. How control system design influences performance
misreporting. Journal of Accounting Research 51(5): 1159–1186.
Mael, F., and B. E. Ashforth. 1992. Alumni and their alma mater: A partial test of the
reformulated model of organizational identification. Journal of Organizational Behavior
13(2): 103–123.
Nordstrom, R., P. Lorenzi, and R. V. Hall. 1991. A review of public posting of performance
feedback in work settings. Journal of Organizational Behavior Management 11(2): 101–
124.
Rich, B. L., J. A. Lepine, and E. R. Crawford. 2010. Job engagement: Antecedents and effects
on job performance. Academy of Management Journal 53(3): 617–635.
Shamir, B., and Kark, R. 2004. A single-item graphic scale for the measurement of
organizational identification. Journal of Occupational and Organizational Psychology
77(1): 115–123.
Simon, H. A. 1959. Theories of decision-making in economics and behavioral science. The
American Economic Review 49(3): 253–283.
Smith, R. H. 2000. Assimilative and contrastive emotional reactions to upward and downward
social comparisons. In Handbook of Social Comparison: Theory and Research, edited by
J. Suls and L. Wheeler, 173–200. New York, NY: Kluwer Academic/Plenum Publishers.
Smith, W. P., and G. B. Arnkelsson. 2000. Stability of related attributes and the in reference of
ability through social comparison. In Handbook of Social Comparison: Theory and
Research, edited by J. Suls and L. Wheeler, 173–200. New York, NY: Kluwer
Academic/Plenum Publishers.
Steelman, L. A., and K. A. Rutkowski. 2004. Moderators of employee reactions to negative
feedback. Journal of Managerial Psychology 19(1): 6–18.
Suls, J., and L. Wheeler. 2000. Handbook of Social Comparison: Theory and Research. New
York, NY: Kluwer Academic/Plenum Publishers.
Tafkov, I. D. 2012. Private and public relative performance information under different
compensation contracts. The Accounting Review 88(1): 327–350.
Tajfel, H. 1974. Social identity and intergroup behaviour. Information (International Social
Science Council) 13(2): 65–93.
Tajfel, H. 1982. Social psychology of intergroup relations. Annual Review of Psychology 33(1):
1–39.
Taylor, P. J., and J. L. Pierce. 1999. Effects of introducing a performance management system
on employees’ subsequent attitudes and effort. Public Personnel Management 28(3):
423–452.
Terry, D. J., M. A. Hogg, and K. M. White. 1999. The theory of planned behavior: Self-identity,
social identity and group norms. British Journal of Social Psychology 38(3): 225–244.
Towry, K. L. 2003. Control in a teamwork environment—The impact of social ties on the
effectiveness of mutual monitoring contracts. The Accounting Review 78(4): 1069–1095.
Turner, J. C. 1975. Social comparison and social identity: Some prospects for intergroup
behaviour. European Journal of Social Psychology 5(1): 1–34.
Turner, J. C. 1991. Social Influence. Pacific Grove, CA: Brooks/Cole.
CHAPTER 2: PERFORMANCE REPORTING TRANSPARENCY, GROUP IDENTITY AND
EMPLOYEE PERFORMANCE
65
Van Dick, R., D. Van Knippenberg, R. Kerschreiter, G. Hertel, and J. Wieseke. 2008. Interactive
effects of work group and organizational identification on job satisfaction and extra-role
behavior. Journal of Vocational Behavior 72(3): 388–399.
Van Knippenberg, D. 2000. Work motivation and performance: A social identity perspective.
Applied Psychology 49(3): 357–371.
Vecchio, R. P. 2000. Negative emotion in the workplace: Employee jealousy and envy.
International Journal of Stress Management 7(3): 161–179.
Wenzel, M. 2005a. Motivation or rationalization? Causal relations between ethics, norms and
tax compliance. Journal of Economic Psychology 26(4): 491–508.
Wenzel, M. 2005b. Misperceptions of social norms about tax compliance: from theory to
intervention. Journal of Economic Psychology 26(6): 862–883.
Wright, T. A., and D. G. Bonett. 2002. The moderating effects of employee tenure on the
relation between organizational commitment and job performance: A meta-analysis.
Journal of Applied Psychology 87(6): 1183–1190.
Yun, S., R. Takeuchi, and W. Liu. 2007. Employee self-enhancement motives and job
performance behaviors: Investigating the moderating effects of employee role ambiguity
and managerial perceptions of employee commitment. Journal of Applied Psychology
92(3): 745–756.
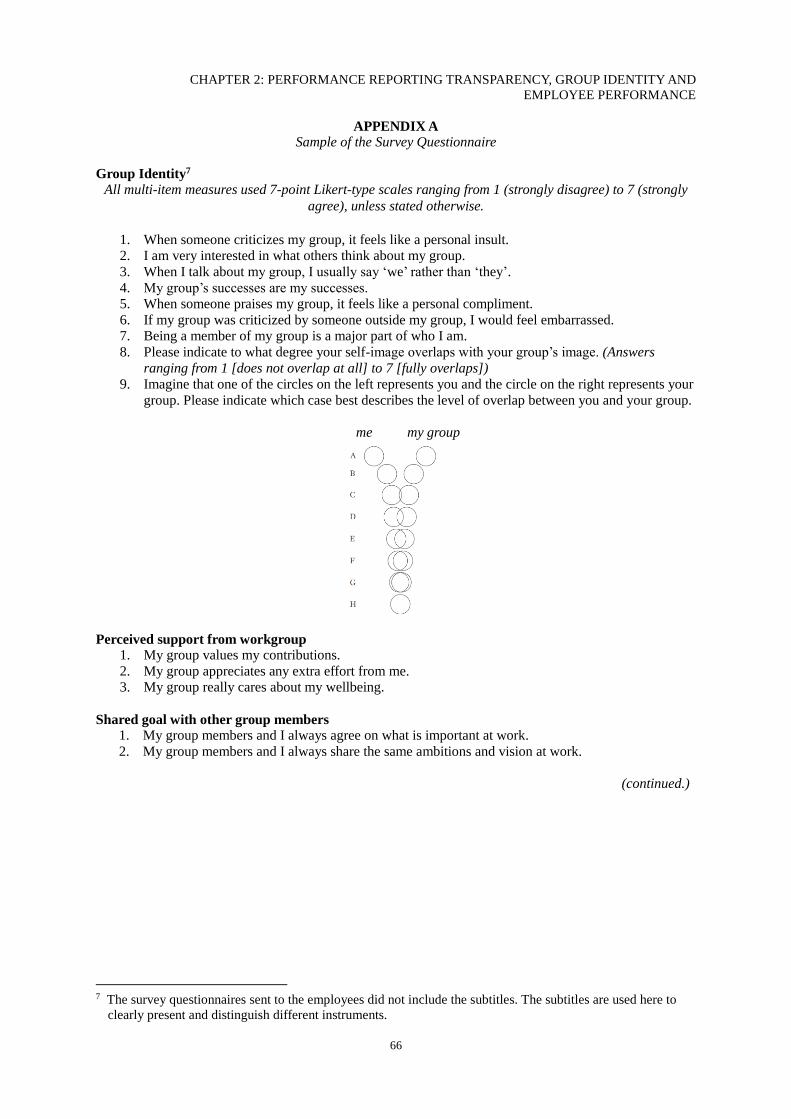
CHAPTER 2: PERFORMANCE REPORTING TRANSPARENCY, GROUP IDENTITY AND
EMPLOYEE PERFORMANCE
66
APPENDIX A Sample of the Survey Questionnaire
Group Identity7
All multi-item measures used 7-point Likert-type scales ranging from 1 (strongly disagree) to 7 (strongly
agree), unless stated otherwise.
1. When someone criticizes my group, it feels like a personal insult.
2. I am very interested in what others think about my group.
3. When I talk about my group, I usually say ‘we’ rather than ‘they’.
4. My group’s successes are my successes.
5. When someone praises my group, it feels like a personal compliment.
6. If my group was criticized by someone outside my group, I would feel embarrassed.
7. Being a member of my group is a major part of who I am.
8. Please indicate to what degree your self-image overlaps with your group’s image. (Answers
ranging from 1 [does not overlap at all] to 7 [fully overlaps])
9. Imagine that one of the circles on the left represents you and the circle on the right represents your
group. Please indicate which case best describes the level of overlap between you and your group.
me my group
Perceived support from workgroup 1. My group values my contributions.
2. My group appreciates any extra effort from me.
3. My group really cares about my wellbeing.
Shared goal with other group members 1. My group members and I always agree on what is important at work.
2. My group members and I always share the same ambitions and vision at work.
(continued.)
7 The survey questionnaires sent to the employees did not include the subtitles. The subtitles are used here to
clearly present and distinguish different instruments.
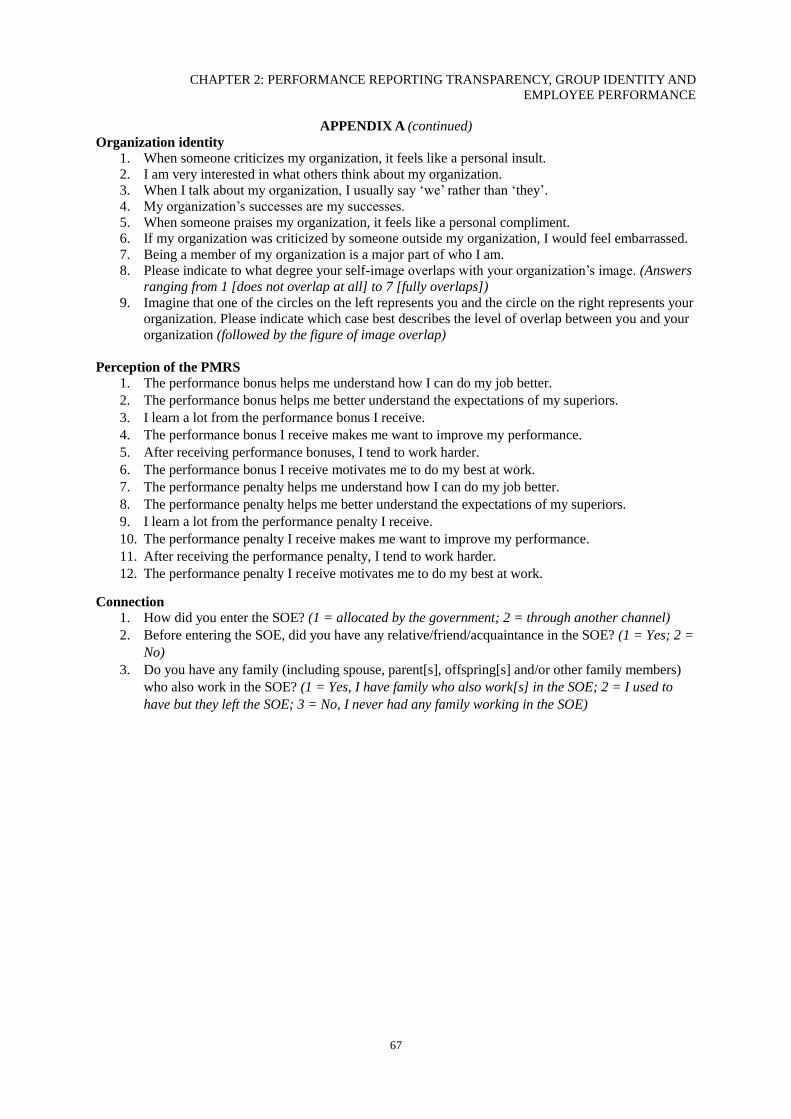
CHAPTER 2: PERFORMANCE REPORTING TRANSPARENCY, GROUP IDENTITY AND
EMPLOYEE PERFORMANCE
67
APPENDIX A (continued)
Organization identity
1. When someone criticizes my organization, it feels like a personal insult.
2. I am very interested in what others think about my organization.
3. When I talk about my organization, I usually say ‘we’ rather than ‘they’.
4. My organization’s successes are my successes.
5. When someone praises my organization, it feels like a personal compliment.
6. If my organization was criticized by someone outside my organization, I would feel embarrassed.
7. Being a member of my organization is a major part of who I am.
8. Please indicate to what degree your self-image overlaps with your organization’s image. (Answers
ranging from 1 [does not overlap at all] to 7 [fully overlaps])
9. Imagine that one of the circles on the left represents you and the circle on the right represents your
organization. Please indicate which case best describes the level of overlap between you and your
organization (followed by the figure of image overlap)
Perception of the PMRS
1. The performance bonus helps me understand how I can do my job better.
2. The performance bonus helps me better understand the expectations of my superiors.
3. I learn a lot from the performance bonus I receive.
4. The performance bonus I receive makes me want to improve my performance.
5. After receiving performance bonuses, I tend to work harder.
6. The performance bonus I receive motivates me to do my best at work.
7. The performance penalty helps me understand how I can do my job better.
8. The performance penalty helps me better understand the expectations of my superiors.
9. I learn a lot from the performance penalty I receive.
10. The performance penalty I receive makes me want to improve my performance.
11. After receiving the performance penalty, I tend to work harder.
12. The performance penalty I receive motivates me to do my best at work.
Connection
1. How did you enter the SOE? (1 = allocated by the government; 2 = through another channel)
2. Before entering the SOE, did you have any relative/friend/acquaintance in the SOE? (1 = Yes; 2 =
No)
3. Do you have any family (including spouse, parent[s], offspring[s] and/or other family members)
who also work in the SOE? (1 = Yes, I have family who also work[s] in the SOE; 2 = I used to
have but they left the SOE; 3 = No, I never had any family working in the SOE)
CHAPTER 2: PERFORMANCE REPORTING TRANSPARENCY, GROUP IDENTITY AND
EMPLOYEE PERFORMANCE
68
APPENDIX B Variable Definitions
Performance
Performance scores that employees receive at the end of every month for their
operational actions and outcomes; objectively measured by department
managers through checking the system records and the status of the
equipment, and recorded in the computer system of the SOE. Because of the
nature of the task and the performance measurement designed by the SOE, the
highest (lowest) performance score that an employee can receive in a month
is 130 (−160).
group_identity Employees’ workgroup identity, measured by nine survey questions
(presented in Appendix A).
public
1 for observations in groups with public reporting (i.e., employees can see
their own performance scores and those of others in their workgroup), or 0 for
observations in groups with private reporting (i.e., employees can only see
their own, but not their peers’, performance scores).
level
Employees’ skill level; assessed by the SOE through exams. Every three
years, the SOE holds an exam to assess employees’ operational skills, and
assigns skill levels to employees based on their exam results. There are four
skill levels: 0 (none), 1 (low), 2 (medium), and 3 (high). To achieve a
particular level, employees must achieve a certain score in the exam. In this
study, the variable level is the skill level assigned by the SOE at the end of
2012.
age Employee i’s age; calculated by employee i’s date of birth and the dates that i
received his or her performance score.
tenure Number of years that employee i has been working in the SOE, calculated by
the dates that i received his or her performance score.
horizon Equal to 1 for male workers over 49, and female workers over 44 (i.e., 5 years
before retirement), or 0 otherwise.
gender 1 for employees who are female, 0 otherwise.
home 1 for employees recruited from the local area, 0 for employees recruited from
other regions of China.
edu
Education level of an employee, taking the value 0 for junior high school or
equivalent, 1 for senior high school or equivalent, 2 for undergraduate degree,
or 3 for postgraduate degree and higher.
CCP 1 for employees who are members of the Chinese Communist Party, 0
otherwise.
family 1 for employees with family members who also work in the SOE, 0 otherwise;
measured by one survey question presented in Appendix A.
referral
The proxy for employees who entered into the SOE through the
recommendation of existing employees. Measured by two survey questions
presented in Appendix A. Equal to 1 for employees who were not allocated
by the government and had connections with existing employees before
entering the SOE, 0 otherwise.
support Employees’ perception of the support they received in their workgroup,
measured by three survey questions, presented in Appendix A.
shared_goal Employees’ perception of the shared goals with other employees in their
workgroup, measured by two survey questions, presented Appendix A.
system Employees’ perception of the PMRS, measured by two survey questions,
presented in Appendix A.
organization_identity Employees’ organization identity, measured by nine survey questions,
presented in Appendix A.
size_large 1 for groups with more than 19 employees, and 0 for the groups with 10–15 employees. The SOE only has these two types of groups.
CHAPTER 3: WORK NORMS AS A CONTROL MECHANISM – IMPLICATIONS FOR
EMPLOYEE PERFORMANCE
CHAPTER III
WORK NORMS AS A CONTROL MECHANISM: IMPLICATIONS
FOR EMPLOYEE PERFORMANCE
ABSTRACT
This study examines one mechanism that can be used as part of an organization’s management
control system, namely managers’ promotion of work norms. I investigate whether managers
can motivate employees by promoting work norms that contribute to the desired organizational
outcomes. On the one hand, the effect of work norms may be overruled by the financial
incentives used in organizations. On the other hand, work norms may complement financial
incentives by guiding and motivating employees to perform their tasks in the right ways. I
conducted this study using performance and personnel data from a large department within a
Chinese state-owned enterprise, where employees are responsible for multiple tasks and are
divided into five workgroups. Group leaders in two of the five workgroups have taken actions
to promote the desired work norms within their groups. The results indicate that managers’
promotion of work norms has a significant and positive effect on employee performance on
both tasks that can be precisely measured and tasks that cannot be precisely measured by the
organization. These findings contribute to the accounting literature and managerial practice by
demonstrating that work norms can operate as an effective control mechanism.
CHAPTER 3: WORK NORMS AS A CONTROL MECHANISM – IMPLICATIONS FOR
EMPLOYEE PERFORMANCE
70
3.1 Introduction
Management controls play an important role in motivating employee performance. To achieve
desired organizational outcomes, it is important for managers to motivate employees to perform
their tasks in the right ways (i.e., the ways aligned with the goal and strategy of the
organization). Financial incentives are one commonly used control mechanism for achieving
this. Although previous research suggests that financial incentives can be effective in
motivating employee performance (Bonner and Sprinkle 2002; Sprinkle 2000), the use of
financial incentives is subject to the following limitations. First, it leads to high monetary costs
and is subject to the budget of organizations. Second, when employee performance on some
tasks cannot be precisely measured, financial incentives can motivate employees to exert less
effort on these tasks (Holmstrom and Milgrom 1991; Roberts 2010). This study investigates
whether a control mechanism—namely managers’ promotion of work norms—can
complement financial incentives by motivating employee performance across different tasks.
Norms are the informal rules or standards that guide the behaviors of group members without
the force of laws (Cialdini and Trost 1989). In social or work groups, norms may be specified
by group leaders or develop from the practices of group members (Cialdini and Trost 1998;
Cialdini, Kallgren, and Reno 1990, 1991). Psychology studies find that focusing individuals’
attention on a social norm (such as “do not litter”) leads to individuals’ adoption of the norm
(Cialdini et al. 1990, 1991). This study examines whether managers can motivate employee
performance by deliberately promoting the work norms that contribute to the desired
organizational outcomes. What types of work norms are desirable to organizations depends on
different settings. In order to examine the research question, I focus on a multi-task setting,
where managers can precisely measure employees’ performance on some tasks, but cannot
precisely measure their performance on the other tasks. Managers in a multi-task setting need
CHAPTER 3: WORK NORMS AS A CONTROL MECHANISM – IMPLICATIONS FOR
EMPLOYEE PERFORMANCE
71
to solve a basic control problem—motivating employee performance on both types of tasks. A
solution to this problem is to cultivate a work norm of exhibiting high performance on both
types of tasks. Using financial incentives only is often not sufficient to achieve this goal, as
financial incentives can be costly, and it is difficult for managers to incentivize employees
based on their performance on tasks that cannot be precisely measured (Brüggen and Moers
2007; Roberts 2010). This study examines whether managers can motivate employee
performance on both types of tasks by deliberately promoting the work norm. Managers can
promote the work norm by directly communicating this work norm to employees, and focusing
employees on the work norm using feedback and recognition.
Whether mangers’ promotion of work norms is effective in motivating employee performance
is an empirical question. On the one hand, experimental evidence indicates that other control
mechanisms used in organizations, such as financial incentives, may overrule the effect of
work norms (Ariely et al. 2006; Gneezy and Rustichini 2000; Taylor and Bloomfield 2010).
On the other hand, in a multi-task setting where the use of financial incentives is subject to
monetary costs and imprecise performance measurement, work norms may guide and motivate
employees to work hard on both types of tasks. Adopting the work norms not only helps
employees earn higher financial incentives from the tasks that can be precisely measured, but
also promotes their self-image as group members (Akerlof and Kranton 2000, 2003; Ashforth
and Meal 1989; Hogg and Terry 2000). Therefore, I expect that managers’ promotion of work
norms is positively associated with employees’ performance on tasks that can be precisely
measured and tasks that cannot be precisely measured.
I conducted this study using performance and personnel data from a large department within a
state-owned enterprise (SOE) in China. Employees in the department choose their actions to
CHAPTER 3: WORK NORMS AS A CONTROL MECHANISM – IMPLICATIONS FOR
EMPLOYEE PERFORMANCE
72
inspect, operate, and maintain the equipment. This is a useful setting to examine the research
question, as some actions of employees can be precisely measured by machines and the
organization’s computer system, while other actions of employees are unobservable to
managers. Both measured and unmeasured actions of employees affect the status of the
equipment. The control problem in this setting is how to motivate employees to work hard and
choose the appropriate actions. Using financial incentives is not enough to alleviate this
problem, as the upper level management team strictly controls the amount of the financial
incentives, and some actions of employees cannot be precisely measured.
From 2008 to 2014, three events occurred in this department provide an opportunity to
investigate whether managers’ promotion of work norms can function as an effective control
mechanism. In particular, the department manager divides employees into five workgroups to
make the daily management more efficient. Group leaders in two of the five workgroups
(Groups 3 and 4) have taken actions to promote the work norms within their groups. In
particular, the two group leaders have posted a range of behavioral principles within their
workgroups since 2009 and 2011, respectively. The behavioral principles suggest that it is
employees’ responsibility to exert high effort on all of their tasks; and employees who have
worked hard on both measured and unmeasured tasks shall be recognized by their group leader,
even though their actions may not be recognized by the performance measurement system
adopted by the organization. In addition to posting the behavioral principles publicly in their
workshops, the two group leaders tried to focus employee attentions on these principles by
using informal feedback and symbolic rewards. These behavioral principles were aimed to
guide employee to perform their tasks in “the right ways” without implementing formal rules
or regulations. Therefore, the group leaders’ promotion of these behavioral principles can be
used as a proxy for the promotion of work norms. Comparing the groups with and without
CHAPTER 3: WORK NORMS AS A CONTROL MECHANISM – IMPLICATIONS FOR
EMPLOYEE PERFORMANCE
73
these principles allows me to examine how employees react to managers’ promotion of the
work norms. Additionally, by the end of 2011, the leader of Group 3 retired. The new group
leader arrived on January 2012 and has strictly followed the formal rules and requirements
specified by the SOE, without promoting the behavioral principles. This event provides an
opportunity to examine how employees react to the removal of the work norms.
I examine how the promotion and removal of the work norms affects employee performance.
The SOE uses electronic tools to objectively measure employees’ operational procedures and
outcomes. I extracted the monthly performance data from the database of the SOE, and
examine how it changed after the introduction and the removal of the work norms. The results
indicate that the group leaders’ promotion of work norms functions as an effective control
mechanism. It is associated with a significant increase in desirable employee actions that can
be precisely measured, as well as those that cannot be precisely measured in both Group 3 and
4. Additionally, after the new group leader arrived in Group 3 and stopped promoting the work
norms, employee performance on actions that can be precisely measured declined. However,
employee performance on actions that cannot be precisely measured did not change
significantly. This may be because for tasks that cannot be precisely measured, work norms
provide employees with the guidelines, and frame their beliefs about how they should perform
these tasks. Overall, the results suggest that the promotion of work norms is effective in
motivating employee performance, especially for tasks that cannot be precisely measured.
This study contributes to the literature on management control mechanisms and employee
performance. The existing literature suggests that financial incentives are effective in
motivating employee performance (Bonner and Sprinkle 2002; Kachelmeier, Reichert, and
Williamson 2008; Sprinkle 2000); but the use of financial incentives is subject to high
CHAPTER 3: WORK NORMS AS A CONTROL MECHANISM – IMPLICATIONS FOR
EMPLOYEE PERFORMANCE
74
monetary costs and potential unintended consequences (Holmstrom and Milgrom 1991;
Roberts 2010). This study finds that an informal control mechanism—namely managers’
promotion of work norms—can complement financial incentives by motivating desirable
employee actions. Using performance and personnel data from a field site, this study finds a
significant increase in employee performance across different tasks in the groups where
managers have taken action to promote the work norms that require employees to work hard
on all of their tasks.
This study also contributes to a broader literature on the role of work norms as an integral part
of an organization’s control system. Recent studies find that work norms in organizations can
be shaped by control mechanisms such as employee selection (Abernethy, Dekker, and Schultz
2015; Campbell 2012), performance reporting (Maas and Van Rinsum 2013), and performance
measures (Gibbons and Kaplan 2015; Kachelmeier et al. 2008). Psychology studies find that
focusing individuals’ attention on a particular norm leads to compliance toward the norm. This
study shows that this approach functions as an effective control mechanism in organizations.
In other words, managers can shape work norms in organizations by deliberately promoting
the work norms that contribute to the desired organization outcomes.
Finally, this study has practical implications. Corporate culture is critical to organization
success, and one of the most important functions of corporate culture is to encourage employee
actions that are aligned with the strategy and goal of the organization (Coleman 2013). Using
multi-period data from a field site, this study shows how managers’ promotion of work norms
helps encourage desirable employee actions. The findings help managers understand how their
practices affect the way that employees perform their tasks.
CHAPTER 3: WORK NORMS AS A CONTROL MECHANISM – IMPLICATIONS FOR
EMPLOYEE PERFORMANCE
75
The remainder of this paper is organized as follows. The next section discusses the relevant
literature and develops the hypotheses. I then describe the setting and research method, before
presenting and discussing the results. The final section provides the concluding remarks.
3.2 Literature and Hypothesis Development
“Norms” are the informal rules or standards that guide and/or constrain the behavior of group
members without the force of laws (Cialdini and Trost 1989). Norms can be specified by the
leader(s) of a group or develop out of the practices of group members (Cialdini and Trost 1998;
Cialdini et al. 1990, 1991). Psychology studies find that individuals are motivated to follow the
norms of their social or work group in order to maintain positive self-image (Cialdini et al.
1991; Cialdini and Goldstein 2004; Cialdini and Trost 1998). Using laboratory settings,
Cialdini et al. (1990, 1991) find that taking procedures that focus individuals on the norm
against littering can significantly reduce littering rates. The procedures they took include
sending flyers to individuals and making them read a relevant article. This study examines
whether this approach can function as an effective control mechanism in a multi-task
organizational setting. In other words, this study investigates whether managers can motivate
employee performance by deliberately promoting the work norms that contribute to the
organizational outcomes.
In organizations with multiple tasks, managers can focus employee attentions on the work
norms (i.e., working hard on both tasks that can be precisely measured and tasks cannot be
precisely measured) by explicitly communicating the work norms to employees. Managers can
also provide employees with feedback and/or recognitions to emphasize the importance of the
work norms. Whether such procedures are effective in motivating employee performance is an
empirical question. On the one hand, the use of financial incentives may “crowd out” the effects
CHAPTER 3: WORK NORMS AS A CONTROL MECHANISM – IMPLICATIONS FOR
EMPLOYEE PERFORMANCE
76
of the work norms, because financial incentives lead employees to frame their behaviors as a
way of maximizing their wealth and motivating employees to act in their self-interest (Ariely
et al. 2006; Gneezy and Rustichini 2000; Taylor and Bloomfield 2010). It may thus overrule
employees’ intrinsic motivation to follow the work norms promoted by their managers. In the
economic literature, Gneezy and Rustichini (2000) find that, in a day-care center, financial
penalties lead parents to frame the pickup of their children in a strategic way, thus encouraging
late pickups. Ariely et al. (2006) find that financial incentives lead individuals to frame an
activity (e.g., listening to their professor reading poetry) as one that they would need to be paid
to suffer through, and thus overrules their intrinsic motivation to engage in the activity. In the
accounting literature, Taylor and Bloomfield (2010) experimentally find that formal controls,
including monitoring and financial penalties, lead individuals to frame their contribution to a
public good as a mean to maximize their own interests, and thus crowd out their intrinsic
motivation to contribute. Other studies also find that financial incentives lead employees to
frame their relationship with their employers in a strategic way and overrule the effects of
reciprocity and trust (e.g., Chen and Sandino 2012; Christ, Sedatole, and Towry 2012; Hannan,
Hoffman, and Moser 2005). Based on these studies, the use of financial incentives may crowd
out the performance effects of the work norms promoted by managers.
On the other hand, work norms may complement financial incentives in motivating employee
performance. In a multi-task setting where the use of financial incentives is subject to monetary
costs and imprecise performance measurement, work norms provide employees with the
guidelines about how they should perform their tasks. By promoting the work norms that
employees should work hard on both tasks that can be precisely measured and tasks that cannot
be precisely measured, managers communicate the desired behavioral principle to employees
and motivate employees to follow the principle. Specifically, economic theory suggests that
CHAPTER 3: WORK NORMS AS A CONTROL MECHANISM – IMPLICATIONS FOR
EMPLOYEE PERFORMANCE
77
employees tend to lose utility if they fail to follow the norms in their workgroup (Akerlof and
Kranton 2000, 2003, 2010). Management theories also posit that following the norms of one’s
organization or workgroup enhances the employee’s self-concept as a participant of the
organization or workgroup (Ashforth and Meal 1989; Hogg and Terry 2000). Based on
economic and management theories, managers’ promotion of the work norms may function as
an effective control mechanism by motivating employee performance on both types of tasks in
a multi-task setting. Following the work norms not only helps employees earn higher financial
incentives from the tasks that can be precisely measured, but also promote their self-image as
group members. In other words, the effects of work norms may not be overruled by financial
incentives. Therefore, I expect that managers’ promotion of work norms is positively related
to employee performance on tasks that can be precisely measured and tasks that cannot be
precisely measured. Figure 1 illustrates the motivation and research question of this study,
while Figure 2 presents the theoretical links that this study aims to examine.
H1: Managers’ promotion of work norms is positively associated with employee performance
on tasks that can be precisely measured by the organization.
H2: Managers’ promotion of work norms is positively associated with employee performance
on tasks that cannot be precisely measured by the organization.
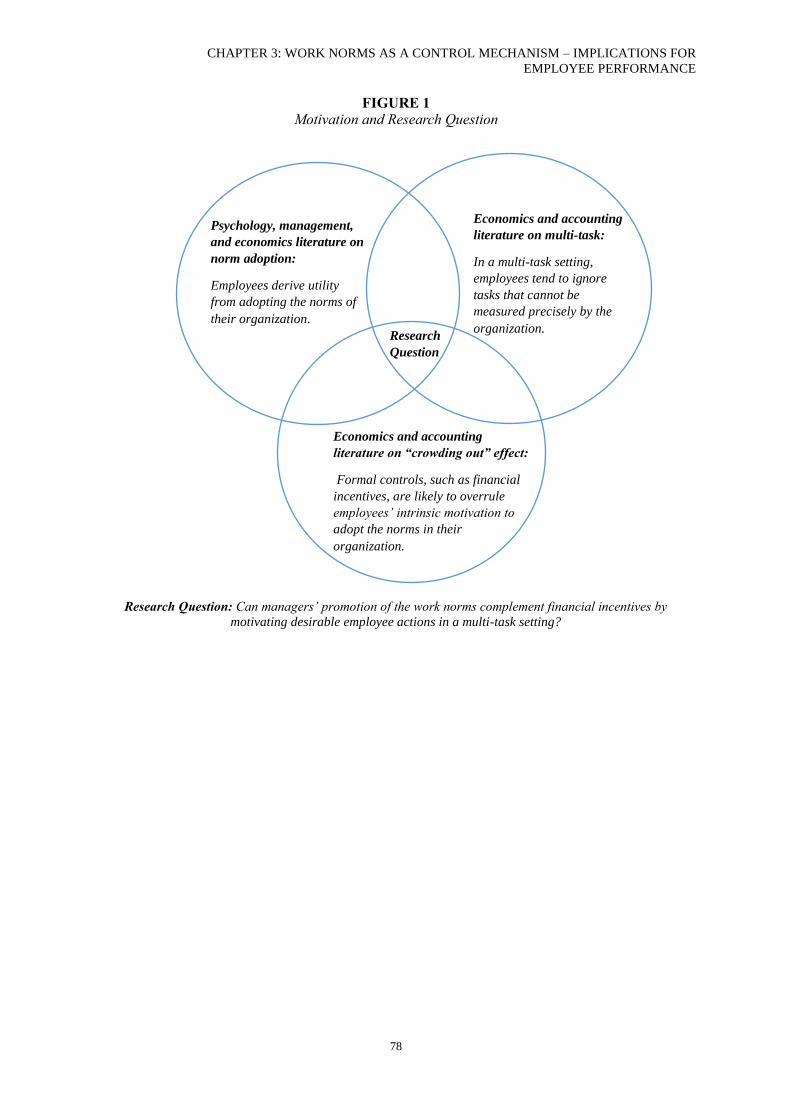
CHAPTER 3: WORK NORMS AS A CONTROL MECHANISM – IMPLICATIONS FOR
EMPLOYEE PERFORMANCE
78
FIGURE 1
Motivation and Research Question
Research Question: Can managers’ promotion of the work norms complement financial incentives by
motivating desirable employee actions in a multi-task setting?
Psychology, management,
and economics literature on
norm adoption:
Employees derive utility
from adopting the norms of
their organization.
Economics and accounting
literature on multi-task:
In a multi-task setting,
employees tend to ignore
tasks that cannot be
measured precisely by the
organization.
Economics and accounting
literature on “crowding out” effect:
Formal controls, such as financial
incentives, are likely to overrule
employees’ intrinsic motivation to
adopt the norms in their
organization.
Research
Question
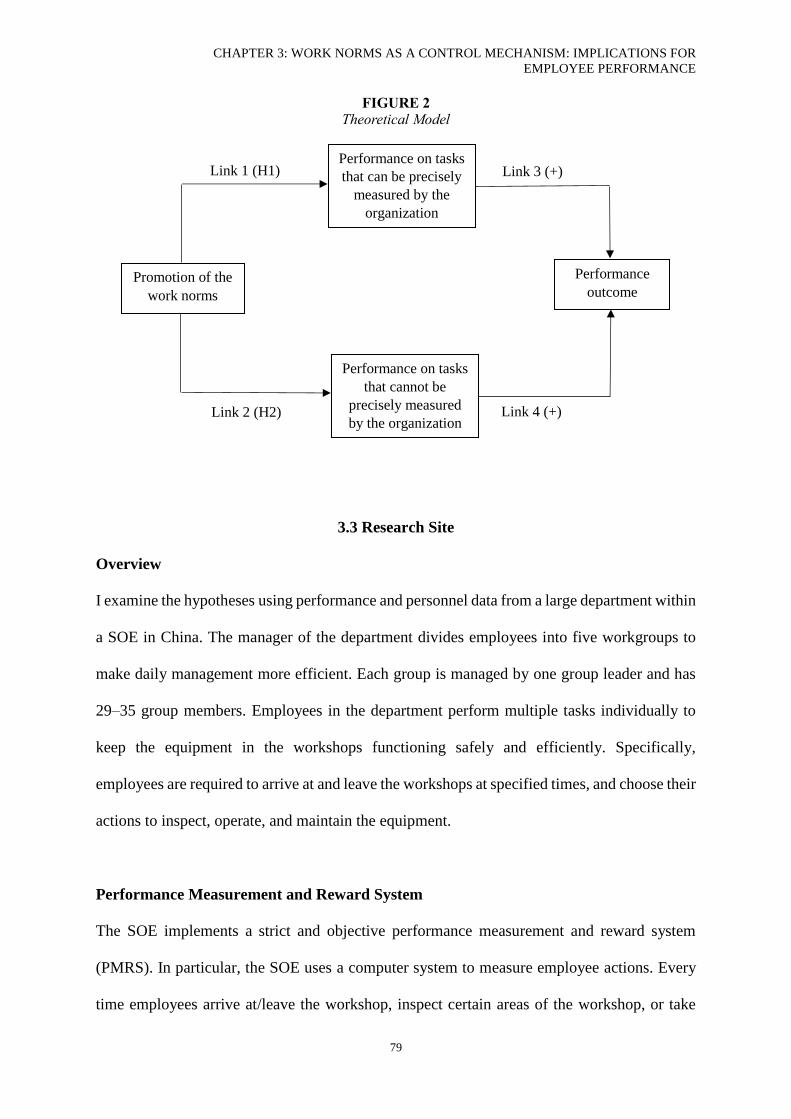
CHAPTER 3: WORK NORMS AS A CONTROL MECHANISM: IMPLICATIONS FOR
EMPLOYEE PERFORMANCE
79
FIGURE 2
Theoretical Model
3.3 Research Site
Overview
I examine the hypotheses using performance and personnel data from a large department within
a SOE in China. The manager of the department divides employees into five workgroups to
make daily management more efficient. Each group is managed by one group leader and has
29–35 group members. Employees in the department perform multiple tasks individually to
keep the equipment in the workshops functioning safely and efficiently. Specifically,
employees are required to arrive at and leave the workshops at specified times, and choose their
actions to inspect, operate, and maintain the equipment.
Performance Measurement and Reward System
The SOE implements a strict and objective performance measurement and reward system
(PMRS). In particular, the SOE uses a computer system to measure employee actions. Every
time employees arrive at/leave the workshop, inspect certain areas of the workshop, or take
Promotion of the
work norms
Performance on tasks
that can be precisely
measured by the
organization
Performance on tasks
that cannot be
precisely measured
by the organization
Performance
outcome
Link 3 (+)
Link 4 (+)
Link 1 (H1)
Link 2 (H2)
CHAPTER 3: WORK NORMS AS A CONTROL MECHANISM: IMPLICATIONS FOR
EMPLOYEE PERFORMANCE
80
certain actions to operate the equipment, they must tap their identification card on the machines
located in different areas of the workshops. The system then makes a record of their actions.
The department manager assesses employee performance by checking the records kept by the
system, and then assigns employees with performance scores based on their actions. By the
end of every month, each employee receives a fixed payment and financial incentive. The
amount of the financial incentive is calculated based on the performance scores that employees
received in the past month. Financial incentives make a relatively small proportion of the
overall compensation received by employees (approximately 0–8%). The performance
measurement, performance score allocation, and compensation method are pre-specified by the
upper-level management of the SOE, and requires little judgment from the department manager
or group leaders.
Control Problem
The system adopted by the SOE can only capture some key actions of employees, but cannot
capture all the actions taken by employees. For example, the computer system can record
whether employees have conducted routine inspections in certain areas as required. However,
it cannot measure the exact actions that employees engage in when inspecting the equipment.
Therefore, employees may tap their cards without inspecting the equipment carefully.
As the compensation structure is strictly specified by the upper-level management, the
department manager and group leaders cannot manipulate compensation to motivate employee
performance. Employees tend to have low motivation because of small financial incentives and
the imprecise measurement of their performance. That is, the department faces a problem
typical to multi-task settings—motivating employees to engage in desirable actions that can be
precisely measured and those that cannot be precisely measured by the organization.
CHAPTER 3: WORK NORMS AS A CONTROL MECHANISM: IMPLICATIONS FOR
EMPLOYEE PERFORMANCE
81
Promotion of Work Norms
From 2008 to 2014, two events that occurred at the research site provide an opportunity to
investigate how managers’ promotion of work norms affects employee performance.
Specifically, leaders of Groups 3 and 4 have taken actions to promote work norms within their
groups since 2009 and 2011, respectively. The work norms that the two managers have
promoted require their group members to “work hard and responsibly, focus on the details
without overlooking any steps or tiny issues in the daily operation, try to avoid any mistake
and detect any hidden risk”. The aim is to “improve employees’ sense of responsibility and
working quality, improve the safety and efficiency of the operation, and create a good working
environment for everyone”. Employees who have conducted these work norms “will be
recognized, even when their actions are not recognized by the PMRS of the organization”1.
Group leaders at the research site post performance requirements in their workshops. The
performance requirements are pre-specified by the SOE, and illustrate the actions that
employees should take and the performance score linked to each of the actions. The two group
leaders (Groups 3 and 4) add the work norms to the performance requirements disclosed within
their workgroups, so everyone in their groups can see these norms. They also focus employees
on these norms by providing informal feedback and recognition. An example of the
performance requirements disclosed in different workgroups is illustrated in Appendix A.
In addition to the promotion of work norms, at the end of 2011, the leader of Group 3 retired.
The new group leader arrived on January 2012, and strictly followed the performance
requirements specified by the SOE without promoting the work norms. This event provides an
1 These quotes were extracted directly from the performance requirements disclosed by the group leaders in
their workshops, and were translated from Chinese into English.
CHAPTER 3: WORK NORMS AS A CONTROL MECHANISM: IMPLICATIONS FOR
EMPLOYEE PERFORMANCE
82
opportunity to investigate how employees in Group 3 reacted when work norms were removed.
According to the group leaders and the documents in the department, there was no other major
event which occurred during the periods that work norms were introduced or removed.
3.4 Method
Quasi-natural Experiments
Based on the events at the research site, I construct quasi-natural experiments to examine the
hypotheses. The term “quasi-natural experiment” describes a naturally-occurring contrast
between a treatment and a control condition, where the assignment of the condition is not
random (Shadish, Cook, and Cambell 2002). In the research site, the change (i.e., promotion
or removal of work norms) occurs naturally in some workgroups (i.e., Groups 3 and 4), but not
others. The five workgroups were divided to make the shifts and the daily operation more
manageable, so theoretically the allocation of employees should be random. However, in a field
site, the assumption of random allocation may not hold strictly. Therefore, the events in the
research site satisfy the definition of quasi-natural experiment.
I construct two quasi-natural experiments to examine how employees reacted to the group
leaders’ promotion of work norms. Specifically, the treatment in quasi-natural experiment 1 (2)
is Group 3 (Group 4), the leader of which started to promote work norms since January 2009
(January 2011). I examine how employees reacted to the promotion of work norms, using those
from the other three groups (Group 1, 2, and 5) as control. Figure 3 shows the timeline of the
events and the groups in the research site.
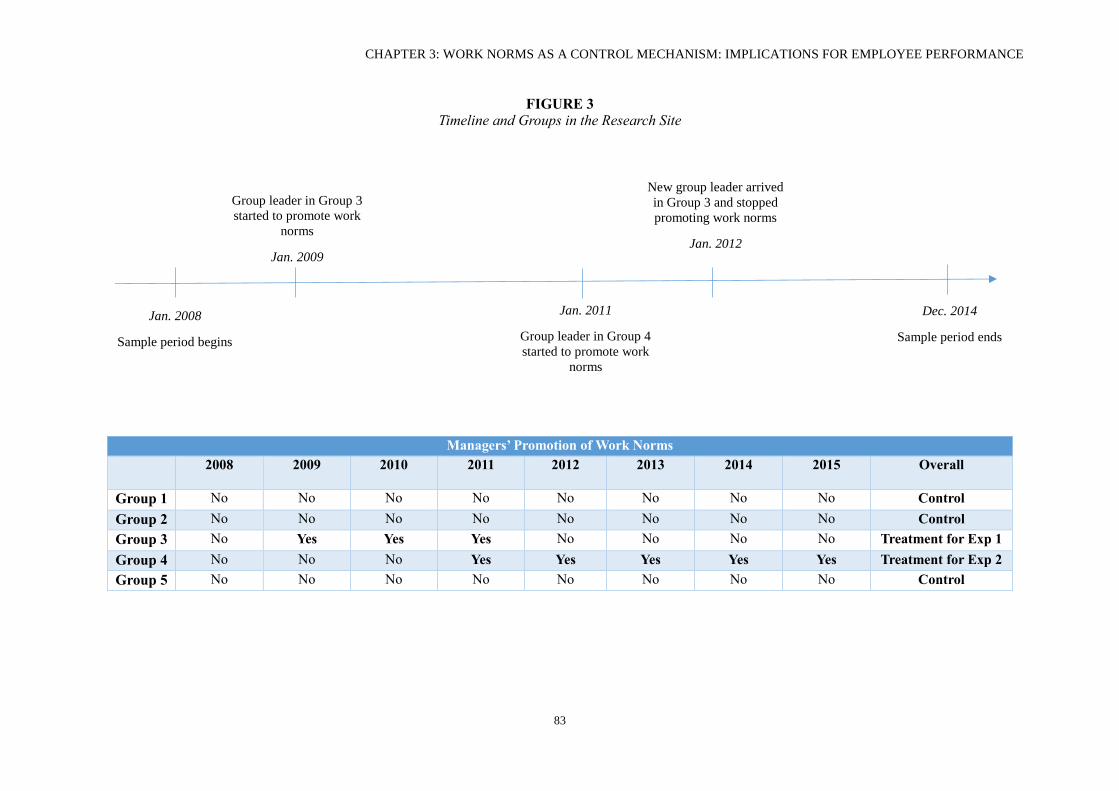
CHAPTER 3: WORK NORMS AS A CONTROL MECHANISM: IMPLICATIONS FOR EMPLOYEE PERFORMANCE
83
FIGURE 3
Timeline and Groups in the Research Site
Managers’ Promotion of Work Norms
2008 2009 2010 2011 2012 2013 2014 2015 Overall
Group 1 No No No No No No No No Control
Group 2 No No No No No No No No Control
Group 3 No Yes Yes Yes No No No No Treatment for Exp 1
Group 4 No No No Yes Yes Yes Yes Yes Treatment for Exp 2
Group 5 No No No No No No No No Control
Jan. 2008
Sample period begins
Dec. 2014
Sample period ends
New group leader arrived
in Group 3 and stopped
promoting work norms
Jan. 2012
Jan. 2011
Group leader in Group 4
started to promote work
norms
Group leader in Group 3
started to promote work
norms
Jan. 2009
CHAPTER 3: WORK NORMS AS A CONTROL MECHANISM: IMPLICATIONS FOR
EMPLOYEE PERFORMANCE
84
Data and Sample
I collected performance and personnel data to examine the hypotheses. I first extracted
performance data from the database of the SOE. In the research site, individual performance is
measured by the department manager at a monthly basis. The original sample includes
performance observations from January 2008 to December 2014 (i.e., 92 months). I then
obtained the information of employees’ ability and demographic information from the
personnel files of the SOE. Employees’ ability and demographic characteristic are time-
invariant.
Panel A of Table 1 reports the sample selection process. During the sample periods of quasi-
natural experiment 1 and 2, some employees were absent from their groups for one or more
months, for such reasons as sick leave. Some employees left their group permanently during
the sample periods because of retirement. I excluded these employees from the sample and
only kept those who had worked in their group for the whole sample period. Specifically, the
sample period of quasi-natural experiment 1 is from January 2008 to December 2011, as the
treatment (Group 3) started to promote the work norms since January 2009, and removed the
work norms at the end of 2011. The purpose of quasi-natural experiment 1 is to examine how
employees in the treatment (Group 3) reacted to the promotion of the work norms. There are
97 employees who worked for all the months during the sample period (72 from control and
25 from treatment). The 97 employees correspond with 4,656 performance observations in the
sample period (3,456 from control and 1,200 from treatment). For experiment 2, the sample
period is from January 2008 to December 2014, as the treatment (Group 4) started to promote
work norms since January 2011. The purpose of quasi-natural experiment 2 is to examine how
employees in the treatment reacted to the promotion of the work norms. After excluding those
who did not work in their group for the whole sample period, there are 72 employees (52 from
CHAPTER 3: WORK NORMS AS A CONTROL MECHANISM: IMPLICATIONS FOR
EMPLOYEE PERFORMANCE
85
control and 20 from treatment) and 6,048 performance observations (4,368 from control and
1,860 from treatment) in the final sample.
Panel B of Table 1 presents the demographic characteristics of employees, and compares the
treatment and control conditions. For experiment 1, the average age of employees in the
treatment condition is 40.38 years old by the end of 2011. The average tenure of employees is
21.63 years by that time. It means that most employees in this department joined the company
during the late 1980s and early 1990s. The small difference between their age and tenure (about
19 years) suggests that most employees entered the company immediately after they graduated
from high school or vocational school, and chose to stay in the company until retirement. Four
percent of employees had a short horizon (i.e., five years or less to retire) by the end of 2011.
The average skill level of employees is about 1.8, which is between 1 (low) and 2 (medium).
In the treatment condition, 28% of the employees are female, and 84% of the employees came
from the city where the SOE is located. Most employees graduated from senior high school or
vocational school. In the treatment condition, 20% of the employees have joined the Chinese
Communist Party. The sample structure of experiment 2 is similar to the structure of
experiment 1. As the end of the sample period of experiment 2 is December 2014, the average
age and tenure of employees increases by four years and the percentage of employees with
short horizon increases to 25%. In both experiments, employees in the treatment condition are
not significantly different from those in the control condition. The variables are explained in
detail in the following subsections and in Appendix B.
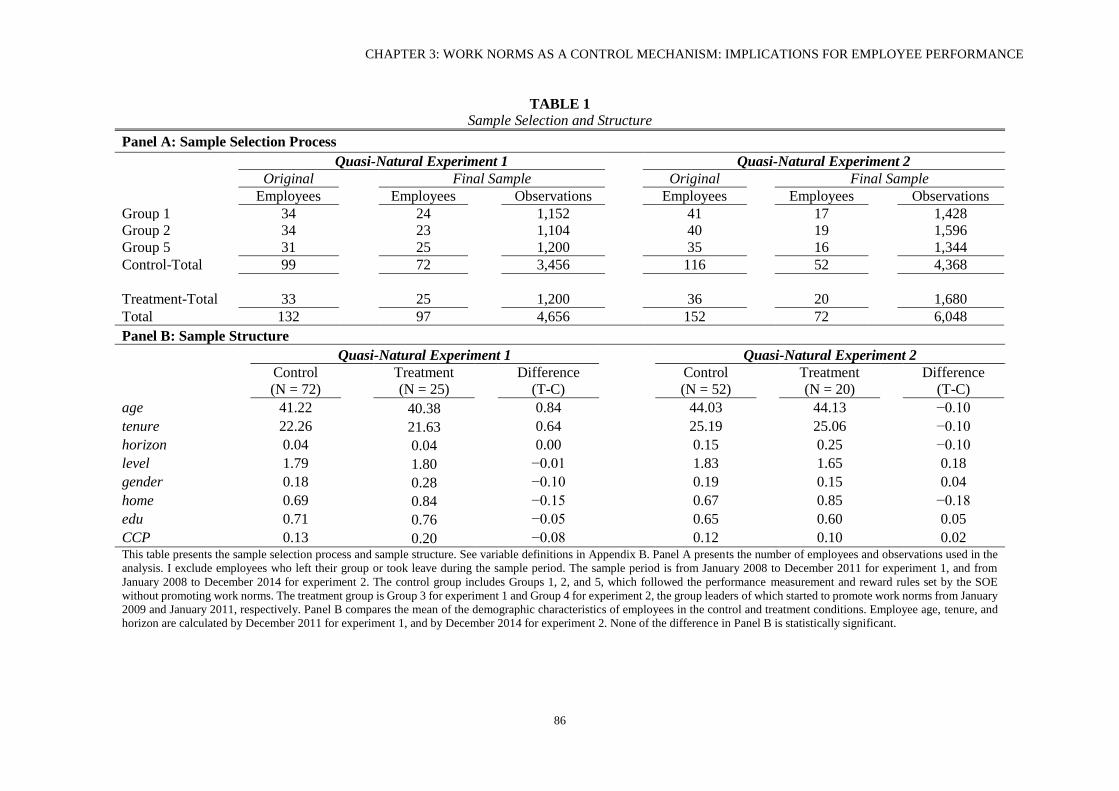
CHAPTER 3: WORK NORMS AS A CONTROL MECHANISM: IMPLICATIONS FOR EMPLOYEE PERFORMANCE
86
TABLE 1
Sample Selection and Structure
Panel A: Sample Selection Process Quasi-Natural Experiment 1 Quasi-Natural Experiment 2 Original Final Sample Original Final Sample
Employees Employees Observations Employees Employees Observations
Group 1 34 24 1,152 41 17 1,428
Group 2 34 23 1,104 40 19 1,596
Group 5 31 25 1,200 35 16 1,344
Control-Total 99 72 3,456 116 52 4,368
Treatment-Total 33 25 1,200 36 20 1,680
Total 132 97 4,656 152 72 6,048
Panel B: Sample Structure
Quasi-Natural Experiment 1 Quasi-Natural Experiment 2
Control
(N = 72) Treatment
(N = 25) Difference
(T-C) Control
(N = 52) Treatment
(N = 20) Difference
(T-C)
age 41.22 40.38 0.84 44.03 44.13 −0.10
tenure 22.26 21.63 0.64 25.19 25.06 −0.10
horizon 0.04 0.04 0.00 0.15 0.25 −0.10
level 1.79 1.80 −0.01 1.83 1.65 0.18
gender 0.18 0.28 −0.10 0.19 0.15 0.04
home 0.69 0.84 −0.15 0.67 0.85 −0.18
edu 0.71 0.76 −0.05 0.65 0.60 0.05
CCP 0.13 0.20 −0.08 0.12 0.10 0.02 This table presents the sample selection process and sample structure. See variable definitions in Appendix B. Panel A presents the number of employees and observations used in the
analysis. I exclude employees who left their group or took leave during the sample period. The sample period is from January 2008 to December 2011 for experiment 1, and from
January 2008 to December 2014 for experiment 2. The control group includes Groups 1, 2, and 5, which followed the performance measurement and reward rules set by the SOE
without promoting work norms. The treatment group is Group 3 for experiment 1 and Group 4 for experiment 2, the group leaders of which started to promote work norms from January
2009 and January 2011, respectively. Panel B compares the mean of the demographic characteristics of employees in the control and treatment conditions. Employee age, tenure, and
horizon are calculated by December 2011 for experiment 1, and by December 2014 for experiment 2. None of the difference in Panel B is statistically significant.
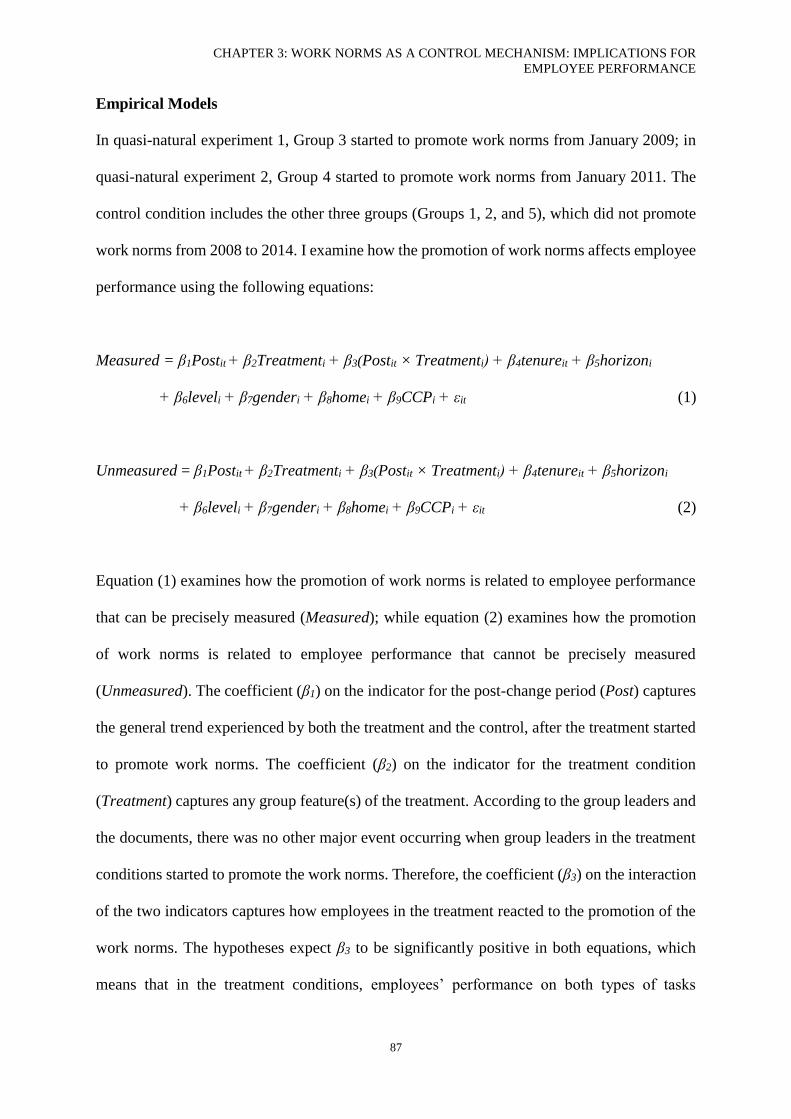
CHAPTER 3: WORK NORMS AS A CONTROL MECHANISM: IMPLICATIONS FOR
EMPLOYEE PERFORMANCE
87
Empirical Models
In quasi-natural experiment 1, Group 3 started to promote work norms from January 2009; in
quasi-natural experiment 2, Group 4 started to promote work norms from January 2011. The
control condition includes the other three groups (Groups 1, 2, and 5), which did not promote
work norms from 2008 to 2014. I examine how the promotion of work norms affects employee
performance using the following equations:
Measured = β1Postit + β2Treatmenti + β3(Postit × Treatmenti) + β4tenureit + β5horizoni
+ β6leveli + β7genderi + β8homei + β9CCPi + εit (1)
Unmeasured = β1Postit + β2Treatmenti + β3(Postit × Treatmenti) + β4tenureit + β5horizoni
+ β6leveli + β7genderi + β8homei + β9CCPi + εit (2)
Equation (1) examines how the promotion of work norms is related to employee performance
that can be precisely measured (Measured); while equation (2) examines how the promotion
of work norms is related to employee performance that cannot be precisely measured
(Unmeasured). The coefficient (β1) on the indicator for the post-change period (Post) captures
the general trend experienced by both the treatment and the control, after the treatment started
to promote work norms. The coefficient (β2) on the indicator for the treatment condition
(Treatment) captures any group feature(s) of the treatment. According to the group leaders and
the documents, there was no other major event occurring when group leaders in the treatment
conditions started to promote the work norms. Therefore, the coefficient (β3) on the interaction
of the two indicators captures how employees in the treatment reacted to the promotion of the
work norms. The hypotheses expect β3 to be significantly positive in both equations, which
means that in the treatment conditions, employees’ performance on both types of tasks
CHAPTER 3: WORK NORMS AS A CONTROL MECHANISM: IMPLICATIONS FOR
EMPLOYEE PERFORMANCE
88
increased significantly after the promotion of work norms. The details of the variables are
presented as follow.
Variables
Dependent variables: The first dependent variable (Measured) is employee actions which are
measured by the organization on a monthly basis. Measured is the performance score that
employees received for their attendance and operational actions, which are measured by the
organization. In terms of attendance, employees lose scores if they are absent from the
workshop during their shift, including coming later and leaving earlier than the specified time.
The lowest score that an employee can earn for attendance is −160, which means the employee
is absent for the whole month and lost all of his/her financial incentives. Employees earn scores
if they come earlier than the specified time of their shift. The highest score that an employee
can earn for attendance is 10.
In terms of operational actions, employees’ tasks include inspecting, operating, and
maintaining equipment. Employees lose scores if they fail to follow certain pre-specified
operational procedures, and earn scores if they follow certain pre-specified procedures.
Employees can lose scores for some procedures and earn scores for others. The lowest score
that an employee can earn for operational actions is −10, which means the employee fails to
follow any of the pre-specified procedures. The highest score that an employee can earn for
operational actions is 90. This means that in the past month, the employee has followed all pre-
specified procedures that are optimal to the conditions of the equipment without overlooking
any step or making any mistake. Employees need to use both their effort and judgment to
analyze the exact condition of the equipment and take the appropriate actions.
CHAPTER 3: WORK NORMS AS A CONTROL MECHANISM: IMPLICATIONS FOR
EMPLOYEE PERFORMANCE
89
The second dependent variable, Unmeasured, is a noisy measure for employee actions that are
not directly measured by the organization, which is constructed using the following equation:
Figureit = β0 + β1Measuredit + εit
Figure is the performance score that employees receive for their operational outcomes.
Employees’ operational actions (both measured and unmeasured actions) affect the status and
efficiency of the equipment, including temperature and pressure, the electricity consumed by
the equipment, and the waste generated by the equipment. These figures are captured by
specialized machines and recorded in the organization’s computer system. The organization
assigns performance scores to employees by comparing the figures in employees’ shifts with
the optimal ranges of these figures. The highest (lowest) score that employees can earn for
these figures is 40 (−15). However, the performance scores usually earned by employees for
these figures is between −2 and +2, as the fluctuations of the figures are usually small. Figure
is affected by both the measured and unmeasured actions of employees, as well as external
factors such as the weather and the quality of fuel. The residual (ε) of the equation thus captures
the unmeasured actions of employees and the random errors. I use the residual as a noisy proxy
for employees’ unmeasured actions, which is denoted by Unmeasured.
Independent variables: To examine how the group leader’s promotion of work norms affects
employee performance, I construct a difference-in-difference design. The treatment indicator
is Treatment, which is 1 for observations in the group that promoted work norms, and 0 for
observation in the control condition. For experiment 1, Treatment is 1 for observations in
Group 3, which started to promote work norms since January 2009; and 0 for observations in
Groups 1, 2, 5, which did not promote work norms. For experiment 2, Treatment is 1 for
CHAPTER 3: WORK NORMS AS A CONTROL MECHANISM: IMPLICATIONS FOR
EMPLOYEE PERFORMANCE
90
observations in Group 4, which started to promote work norms since January 2011; and 0 for
observations in Groups 1, 2, 5. The time indicator is Post. For experiment 1, the sample period
is from 2008 to 2011. Post indicates periods (i.e., months) in and after 2009, as the treatment
(i.e., Group 3) started to promote work norms since January 2009. For experiment 2, the sample
period is from 2008 to 2014. Post indicates periods in and after 2011, as the treatment (i.e.,
Group 4) started to promote work norms since January 2011. The coefficient on the interaction
between Post and Treatment thus captures how employees in the treatment condition react
toward the promotion of the work norms.
Control variables: To minimize any bias in estimates as a result of omitted variables, I
controlled for employees’ skill level and demographic characteristics. Employees’ skill level
(level), is assessed by the SOE through exams. Every three years, the SOE holds an exam to
assess employees’ ability in analyzing the equipment condition and choosing the appropriate
actions. The SOE assign skill levels to employees based on their examine results. The skill
levels include 0 (none), 1 (low), 2 (medium), and 3 (high). The demographic characteristics
include employees’ tenure (tenure) and horizon (horizon), gender (gender), whether they came
from the city where the SOE is located or other regions of China (home), level of education
(edu), and whether they are members of the Chinese Communist Party (CCP). 2 When
estimating the empirical models, I also control for time (month) and group fixed effects, and
2 I controlled tenure and gender as the tasks involve operating heavy machinery, and employees’ physical
conditions may significantly affect their performance. I controlled horizon as employees who approach
retirement may have less concern for their reputation in the company, and thus have lower motivation. I
controlled for home, as the SOE is the principal driver of the local economy and employees from the local area
may be motivated to work hard and contribute to the economy in their hometown. Further, I controlled for edu,
as employees with higher education levels may have received more training and have higher ability to perform
their tasks. CCP is controlled as previous research indicates that when the goals and beliefs of employees are
congruent with those of their organizations, employees tend to have higher motivation and better performance
(Rich et al. 2010). As the research site is state-owned, the political beliefs of employees may affect their
motivation and performance. I did not control employees’ age (age), as it is highly correlated with tenure.
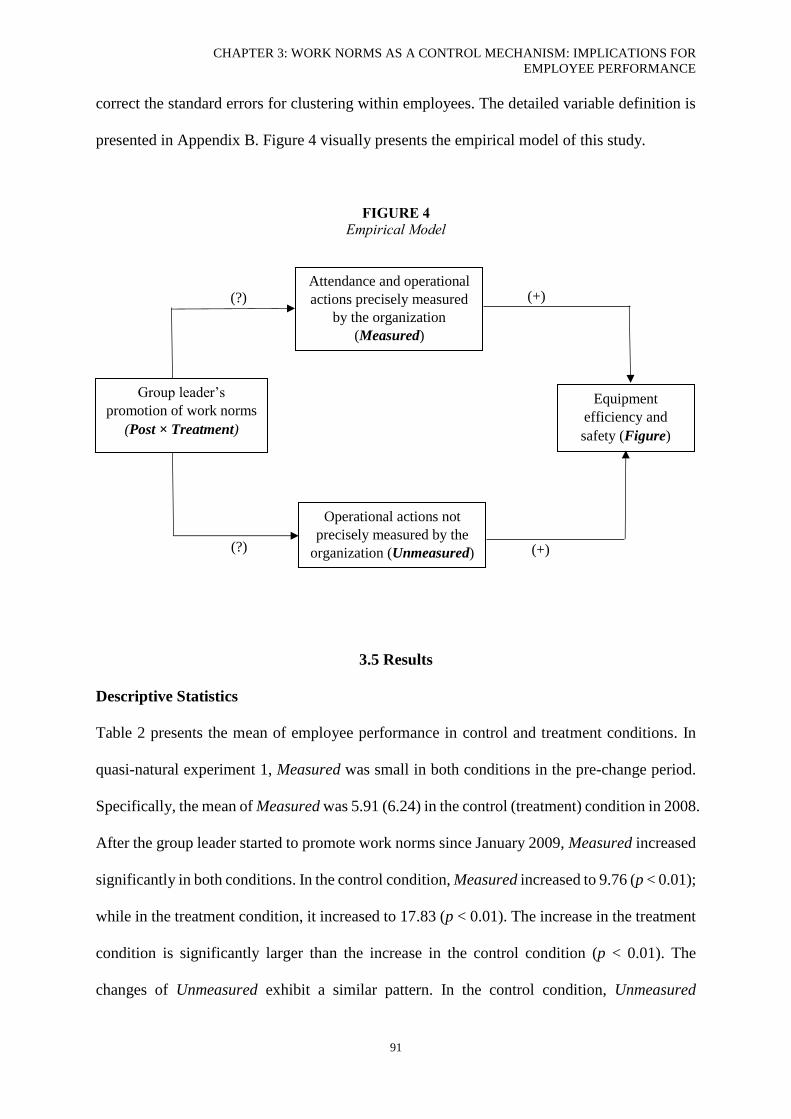
CHAPTER 3: WORK NORMS AS A CONTROL MECHANISM: IMPLICATIONS FOR
EMPLOYEE PERFORMANCE
91
correct the standard errors for clustering within employees. The detailed variable definition is
presented in Appendix B. Figure 4 visually presents the empirical model of this study.
FIGURE 4
Empirical Model
3.5 Results
Descriptive Statistics
Table 2 presents the mean of employee performance in control and treatment conditions. In
quasi-natural experiment 1, Measured was small in both conditions in the pre-change period.
Specifically, the mean of Measured was 5.91 (6.24) in the control (treatment) condition in 2008.
After the group leader started to promote work norms since January 2009, Measured increased
significantly in both conditions. In the control condition, Measured increased to 9.76 (p < 0.01);
while in the treatment condition, it increased to 17.83 (p < 0.01). The increase in the treatment
condition is significantly larger than the increase in the control condition (p < 0.01). The
changes of Unmeasured exhibit a similar pattern. In the control condition, Unmeasured
Group leader’s
promotion of work norms
(Post × Treatment)
Attendance and operational
actions precisely measured
by the organization
(Measured)
Operational actions not
precisely measured by the
organization (Unmeasured)
Equipment
efficiency and
safety (Figure)
(+)
(+)
(?)
(?)
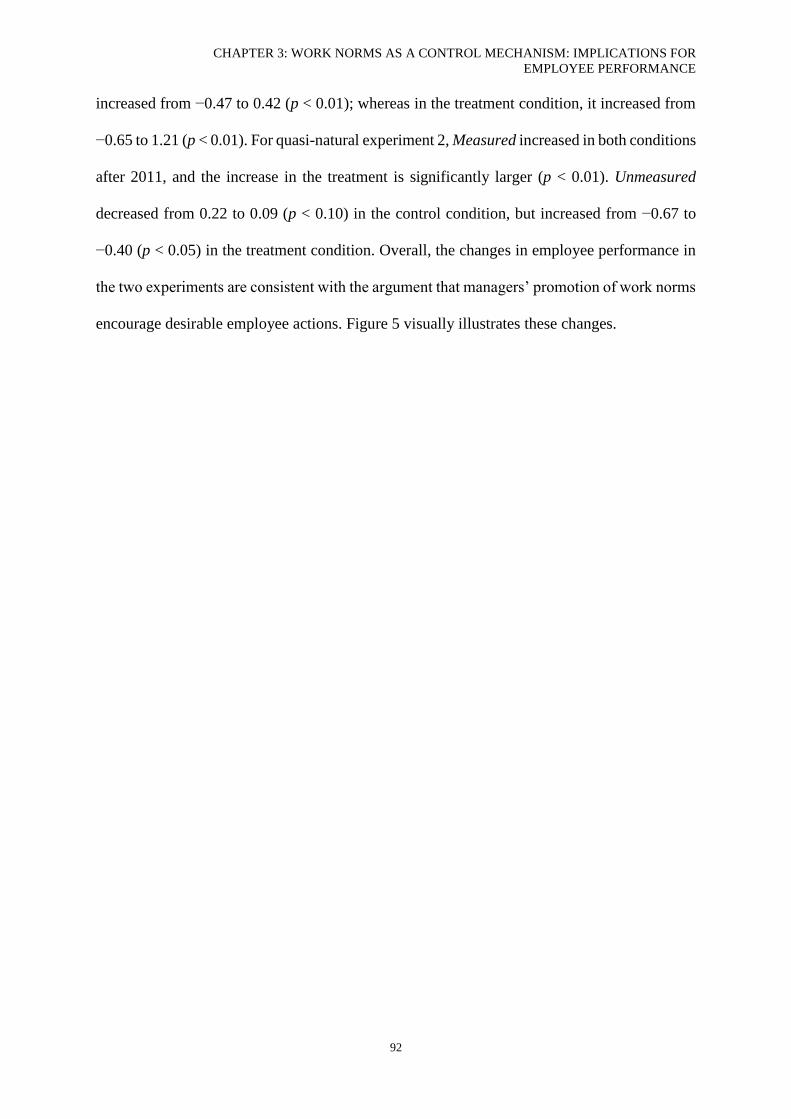
CHAPTER 3: WORK NORMS AS A CONTROL MECHANISM: IMPLICATIONS FOR
EMPLOYEE PERFORMANCE
92
increased from −0.47 to 0.42 (p < 0.01); whereas in the treatment condition, it increased from
−0.65 to 1.21 (p < 0.01). For quasi-natural experiment 2, Measured increased in both conditions
after 2011, and the increase in the treatment is significantly larger (p < 0.01). Unmeasured
decreased from 0.22 to 0.09 (p < 0.10) in the control condition, but increased from −0.67 to
−0.40 (p < 0.05) in the treatment condition. Overall, the changes in employee performance in
the two experiments are consistent with the argument that managers’ promotion of work norms
encourage desirable employee actions. Figure 5 visually illustrates these changes.
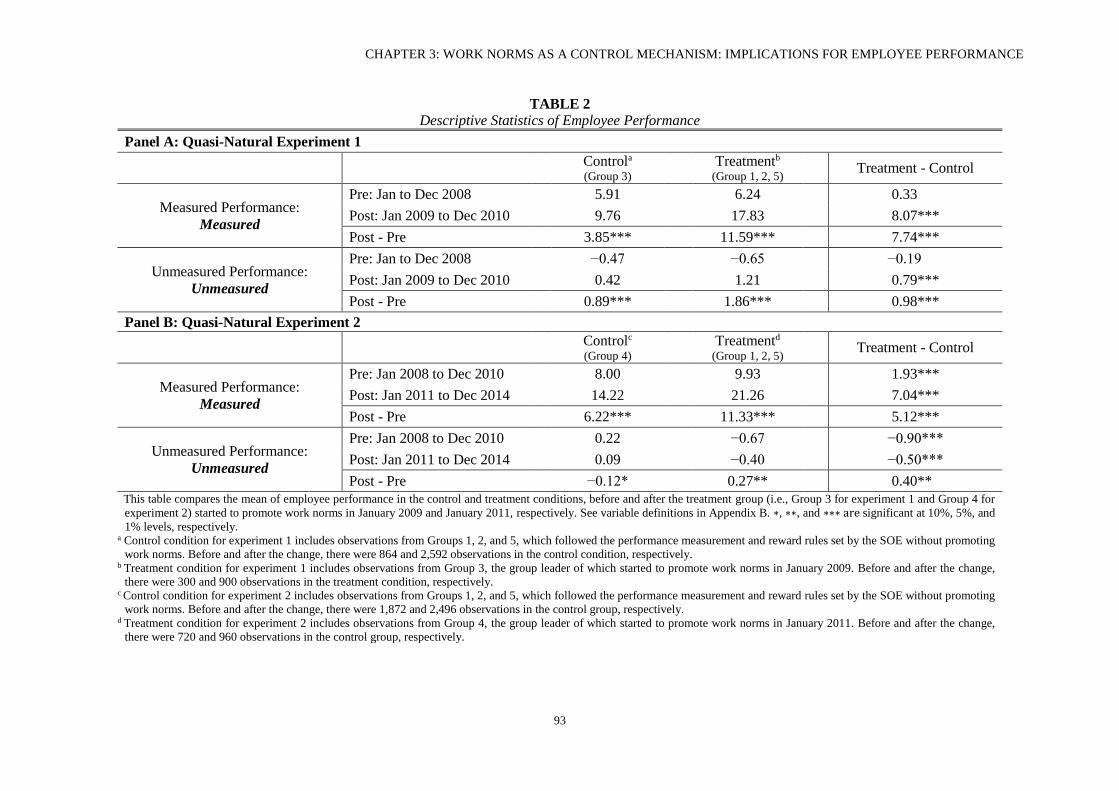
CHAPTER 3: WORK NORMS AS A CONTROL MECHANISM: IMPLICATIONS FOR EMPLOYEE PERFORMANCE
93
TABLE 2
Descriptive Statistics of Employee Performance
Panel A: Quasi-Natural Experiment 1
Controla
(Group 3) Treatmentb
(Group 1, 2, 5) Treatment - Control
Measured Performance:
Measured
Pre: Jan to Dec 2008 5.91 6.24 0.33***
Post: Jan 2009 to Dec 2010 9.76 17.83 8.07***
Post - Pre 3.85*** 11.59*** 7.74***
Unmeasured Performance:
Unmeasured
Pre: Jan to Dec 2008 −0.47 −0.65 −0.19***
Post: Jan 2009 to Dec 2010 0.42 1.21 0.79***
Post - Pre 0.89*** 1.86*** 0.98***
Panel B: Quasi-Natural Experiment 2
Controlc
(Group 4)
Treatmentd
(Group 1, 2, 5) Treatment - Control
Measured Performance:
Measured
Pre: Jan 2008 to Dec 2010 8.00 9.93 1.93***
Post: Jan 2011 to Dec 2014 14.22 21.26 7.04***
Post - Pre 6.22*** 11.33*** 5.12***
Unmeasured Performance:
Unmeasured
Pre: Jan 2008 to Dec 2010 0.22 −0.67 −0.90***
Post: Jan 2011 to Dec 2014 0.09 −0.40 −0.50***
Post - Pre −0.12* 0.27** 0.40***
This table compares the mean of employee performance in the control and treatment conditions, before and after the treatment group (i.e., Group 3 for experiment 1 and Group 4 for
experiment 2) started to promote work norms in January 2009 and January 2011, respectively. See variable definitions in Appendix B. ∗, ∗∗, and ∗∗∗ are significant at 10%, 5%, and
1% levels, respectively. a Control condition for experiment 1 includes observations from Groups 1, 2, and 5, which followed the performance measurement and reward rules set by the SOE without promoting
work norms. Before and after the change, there were 864 and 2,592 observations in the control condition, respectively. b Treatment condition for experiment 1 includes observations from Group 3, the group leader of which started to promote work norms in January 2009. Before and after the change,
there were 300 and 900 observations in the treatment condition, respectively. c Control condition for experiment 2 includes observations from Groups 1, 2, and 5, which followed the performance measurement and reward rules set by the SOE without promoting
work norms. Before and after the change, there were 1,872 and 2,496 observations in the control group, respectively. d Treatment condition for experiment 2 includes observations from Group 4, the group leader of which started to promote work norms in January 2011. Before and after the change,
there were 720 and 960 observations in the control group, respectively.
CHAPTER 3: WORK NORMS AS A CONTROL MECHANISM: IMPLICATIONS FOR EMPLOYEE PERFORMANCE
94
FIGURE 5
Promotion of Work Norms and Employee Performance
Quasi-Natural Experiment 1 Quasi-Natural Experiment 2
Control: Groups 1, 2, 5, which did not promote work norms; Control: Group 1, 2, 5, which did not promote work norms;
Treatment: Group 3, which started to promote work norms in 2009 Treatment: Group 4, which started to promote work norms since 2011
CHAPTER 3: WORK NORMS AS A CONTROL MECHANISM: IMPLICATIONS FOR
EMPLOYEE PERFORMANCE
95
Correlations among Variables
Table 3 presents the Pearson correlations for both experiments. Panel A shows the correlations
for experiment 1. Specifically, both Measured and Unmeasured are positively correlated with
age, level, and home. It indicates that older employees, employees with high skill level, and
those recruited from the local area tend to perform better than the other employees. Both
Measured and Unmeasured are negatively related to horizon, which is consistent with the
expectation that employees who approach retirement tend to have lower motivation.
Additionally, Measured is also positively related to tenure, edu, and CCP, which suggests that
employees with longer tenure, high education, and who joined the Communist Party tend to
engage in more desirable actions that can be precisely measured by the organizations. Panel B
presents the correlations for experiment 2. It shows that Measured and Unmeasured are
negatively correlated. This may be because if employees exert higher effort in one type of
action, they would give less effort for another type of action. Similar to experiment 1, Measured
is positively related to age, tenure, level, and home. It is also negatively related to edu and
gender. As the tasks in the research site require manual labor, it may limit the performance of
female employees. As for the negative correlation with edu, this may be because employees
with higher education (especially an undergraduate degree or higher) tend to be younger and
less experienced than other employees. Similar to experiment 1, Unmeasured is positively
related to home and level, and negatively related to horizon. In both experiments, most of the
control variables are significantly correlated with each other. I use variance inflation tests (VIFs)
to ensure the estimations are not subject to a multicollinearity problem.
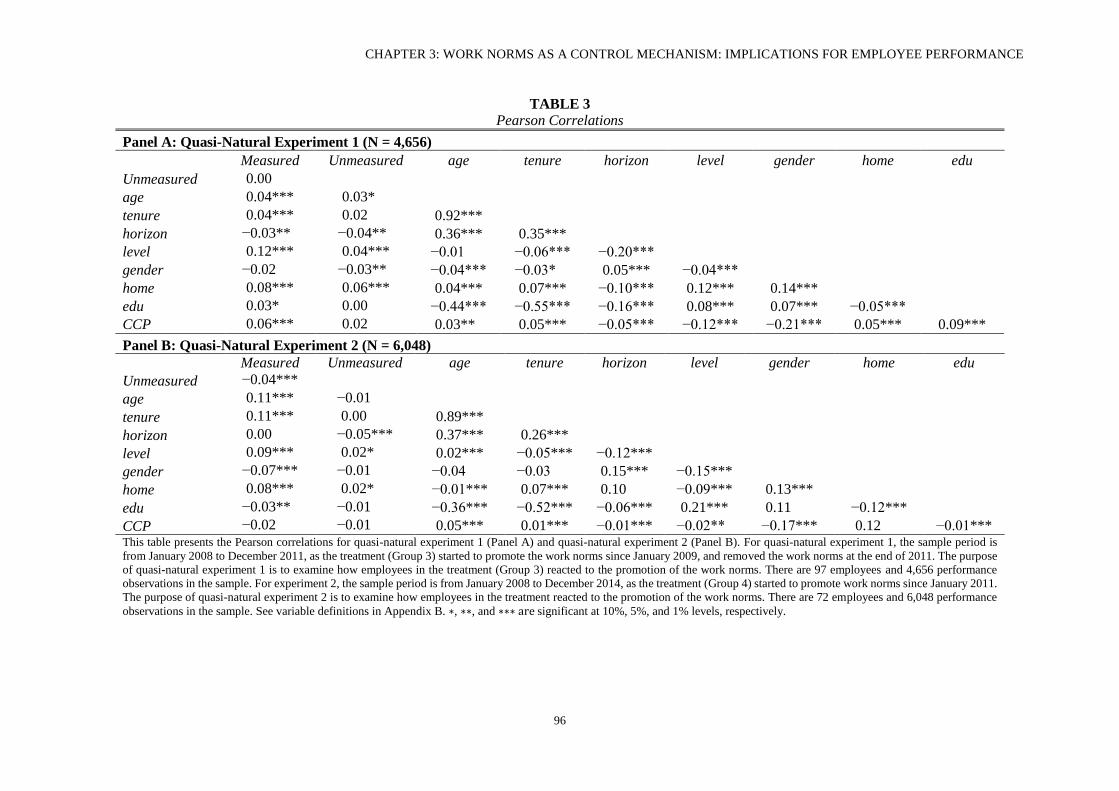
CHAPTER 3: WORK NORMS AS A CONTROL MECHANISM: IMPLICATIONS FOR EMPLOYEE PERFORMANCE
96
TABLE 3
Pearson Correlations
Panel A: Quasi-Natural Experiment 1 (N = 4,656)
Measured Unmeasured age tenure horizon level gender home edu
Unmeasured 0.00***
age 0.04*** 0.03***
tenure 0.04*** 0.02*** 0.92***
horizon −0.03*** −0.04*** 0.36*** 0.35***
level 0.12*** 0.04*** −0.01*** −0.06*** −0.20***
gender −0.02*** −0.03*** −0.04*** −0.03*** 0.05*** −0.04***
home 0.08*** 0.06*** 0.04*** 0.07*** −0.10*** 0.12*** 0.14***
edu 0.03*** 0.00*** −0.44*** −0.55*** −0.16*** 0.08*** 0.07*** −0.05***
CCP 0.06*** 0.02*** 0.03*** 0.05*** −0.05*** −0.12*** −0.21*** 0.05*** 0.09***
Panel B: Quasi-Natural Experiment 2 (N = 6,048)
Measured Unmeasured age tenure horizon level gender home edu
Unmeasured −0.04***
age 0.11*** −0.01***
tenure 0.11*** 0.00*** 0.89***
horizon 0.00*** −0.05*** 0.37*** 0.26***
level 0.09*** 0.02*** 0.02*** −0.05*** −0.12***
gender −0.07*** −0.01*** −0.04*** −0.03*** 0.15*** −0.15***
home 0.08*** 0.02*** −0.01*** 0.07*** 0.10*** −0.09*** 0.13***
edu −0.03*** −0.01*** −0.36*** −0.52*** −0.06*** 0.21*** 0.11*** −0.12***
CCP −0.02*** −0.01*** 0.05*** 0.01*** −0.01*** −0.02*** −0.17*** 0.12*** −0.01*** This table presents the Pearson correlations for quasi-natural experiment 1 (Panel A) and quasi-natural experiment 2 (Panel B). For quasi-natural experiment 1, the sample period is
from January 2008 to December 2011, as the treatment (Group 3) started to promote the work norms since January 2009, and removed the work norms at the end of 2011. The purpose
of quasi-natural experiment 1 is to examine how employees in the treatment (Group 3) reacted to the promotion of the work norms. There are 97 employees and 4,656 performance
observations in the sample. For experiment 2, the sample period is from January 2008 to December 2014, as the treatment (Group 4) started to promote work norms since January 2011.
The purpose of quasi-natural experiment 2 is to examine how employees in the treatment reacted to the promotion of the work norms. There are 72 employees and 6,048 performance
observations in the sample. See variable definitions in Appendix B. ∗, ∗∗, and ∗∗∗ are significant at 10%, 5%, and 1% levels, respectively.
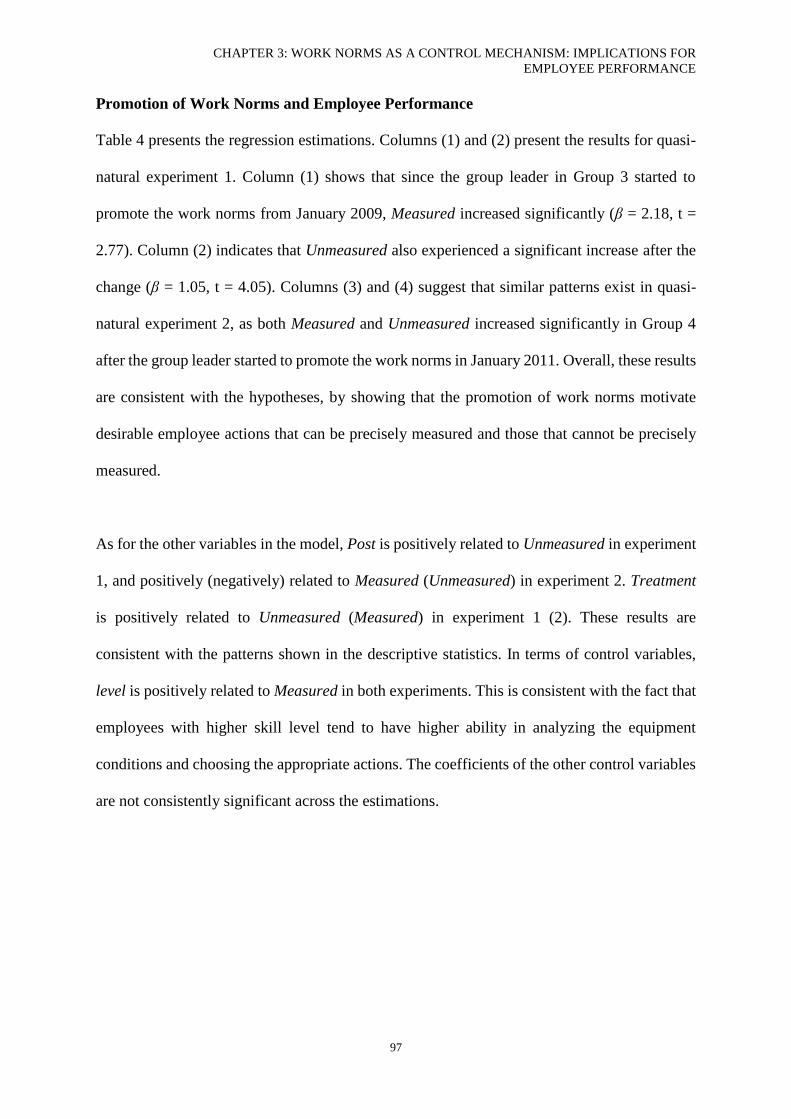
CHAPTER 3: WORK NORMS AS A CONTROL MECHANISM: IMPLICATIONS FOR
EMPLOYEE PERFORMANCE
97
Promotion of Work Norms and Employee Performance
Table 4 presents the regression estimations. Columns (1) and (2) present the results for quasi-
natural experiment 1. Column (1) shows that since the group leader in Group 3 started to
promote the work norms from January 2009, Measured increased significantly (β = 2.18, t =
2.77). Column (2) indicates that Unmeasured also experienced a significant increase after the
change (β = 1.05, t = 4.05). Columns (3) and (4) suggest that similar patterns exist in quasi-
natural experiment 2, as both Measured and Unmeasured increased significantly in Group 4
after the group leader started to promote the work norms in January 2011. Overall, these results
are consistent with the hypotheses, by showing that the promotion of work norms motivate
desirable employee actions that can be precisely measured and those that cannot be precisely
measured.
As for the other variables in the model, Post is positively related to Unmeasured in experiment
1, and positively (negatively) related to Measured (Unmeasured) in experiment 2. Treatment
is positively related to Unmeasured (Measured) in experiment 1 (2). These results are
consistent with the patterns shown in the descriptive statistics. In terms of control variables,
level is positively related to Measured in both experiments. This is consistent with the fact that
employees with higher skill level tend to have higher ability in analyzing the equipment
conditions and choosing the appropriate actions. The coefficients of the other control variables
are not consistently significant across the estimations.
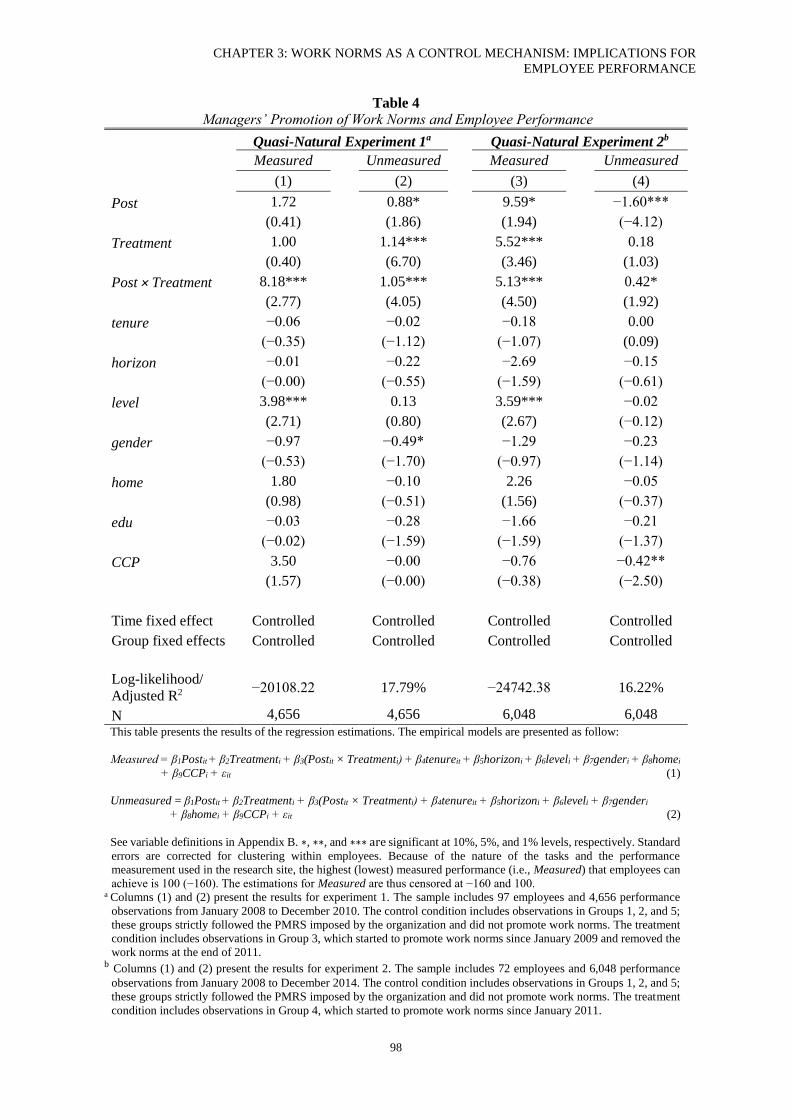
CHAPTER 3: WORK NORMS AS A CONTROL MECHANISM: IMPLICATIONS FOR
EMPLOYEE PERFORMANCE
98
Table 4
Managers’ Promotion of Work Norms and Employee Performance
Quasi-Natural Experiment 1a Quasi-Natural Experiment 2b
Measured Unmeasured Measured Unmeasured
(1) (2) (3) (4)
Post 1.72 0.88* 9.59* −1.60***
(0.41) (1.86) (1.94) (−4.12)
Treatment 1.00 1.14*** 5.52*** 0.18
(0.40) (6.70) (3.46) (1.03)
Post × Treatment 8.18*** 1.05*** 5.13*** 0.42*
(2.77) (4.05) (4.50) (1.92)
tenure −0.06 −0.02 −0.18 0.00
(−0.35) (−1.12) (−1.07) (0.09)
horizon −0.01 −0.22 −2.69 −0.15
(−0.00) (−0.55) (−1.59) (−0.61)
level 3.98*** 0.13 3.59*** −0.02
(2.71) (0.80) (2.67) (−0.12)
gender −0.97 −0.49* −1.29 −0.23
(−0.53) (−1.70) (−0.97) (−1.14)
home 1.80 −0.10 2.26 −0.05
(0.98) (−0.51) (1.56) (−0.37)
edu −0.03 −0.28 −1.66 −0.21
(−0.02) (−1.59) (−1.59) (−1.37)
CCP 3.50 −0.00 −0.76 −0.42**
(1.57) (−0.00) (−0.38) (−2.50)
Time fixed effect Controlled Controlled Controlled Controlled
Group fixed effects Controlled Controlled Controlled Controlled
Log-likelihood/
Adjusted R2 −20108.22 17.79% −24742.38 16.22%
N 4,656 4,656 6,048 6,048
This table presents the results of the regression estimations. The empirical models are presented as follow:
Measured = β1Postit + β2Treatmenti + β3(Postit × Treatmenti) + β4tenureit + β5horizoni + β6leveli + β7genderi + β8homei
+ β9CCPi + εit (1)
Unmeasured = β1Postit + β2Treatmenti + β3(Postit × Treatmenti) + β4tenureit + β5horizoni + β6leveli + β7genderi
+ β8homei + β9CCPi + εit (2)
See variable definitions in Appendix B. ∗, ∗∗, and ∗∗∗ are significant at 10%, 5%, and 1% levels, respectively. Standard
errors are corrected for clustering within employees. Because of the nature of the tasks and the performance
measurement used in the research site, the highest (lowest) measured performance (i.e., Measured) that employees can
achieve is 100 (−160). The estimations for Measured are thus censored at −160 and 100. a Columns (1) and (2) present the results for experiment 1. The sample includes 97 employees and 4,656 performance
observations from January 2008 to December 2010. The control condition includes observations in Groups 1, 2, and 5;
these groups strictly followed the PMRS imposed by the organization and did not promote work norms. The treatment
condition includes observations in Group 3, which started to promote work norms since January 2009 and removed the
work norms at the end of 2011. b Columns (1) and (2) present the results for experiment 2. The sample includes 72 employees and 6,048 performance
observations from January 2008 to December 2014. The control condition includes observations in Groups 1, 2, and 5;
these groups strictly followed the PMRS imposed by the organization and did not promote work norms. The treatment
condition includes observations in Group 4, which started to promote work norms since January 2011.
CHAPTER 3: WORK NORMS AS A CONTROL MECHANISM: IMPLICATIONS FOR
EMPLOYEE PERFORMANCE
99
Further, I check whether the association between work norms and employee performance
varies across different types of employee. I divide employees into different subsamples based
on their demographic characteristics. The coefficients on the interaction between Post and
Treatment estimated using different demographic groups are presented in Table 5. In both
experiments, female employees, employees with lower education level, and Communist Party
members tend to be less reactive toward the promotion of work norms. As the tasks in the
research site require judgment, it may limit the performance of those with lower education level.
Additionally, the tasks in the research site also require manual labor, which may limit the
performance of female employees. That party members tend to have insignificant reactions
may be because the small number of party members in the research site reduces the significance
of the results, or because political affiliation plays some role in moderating employee reactions.
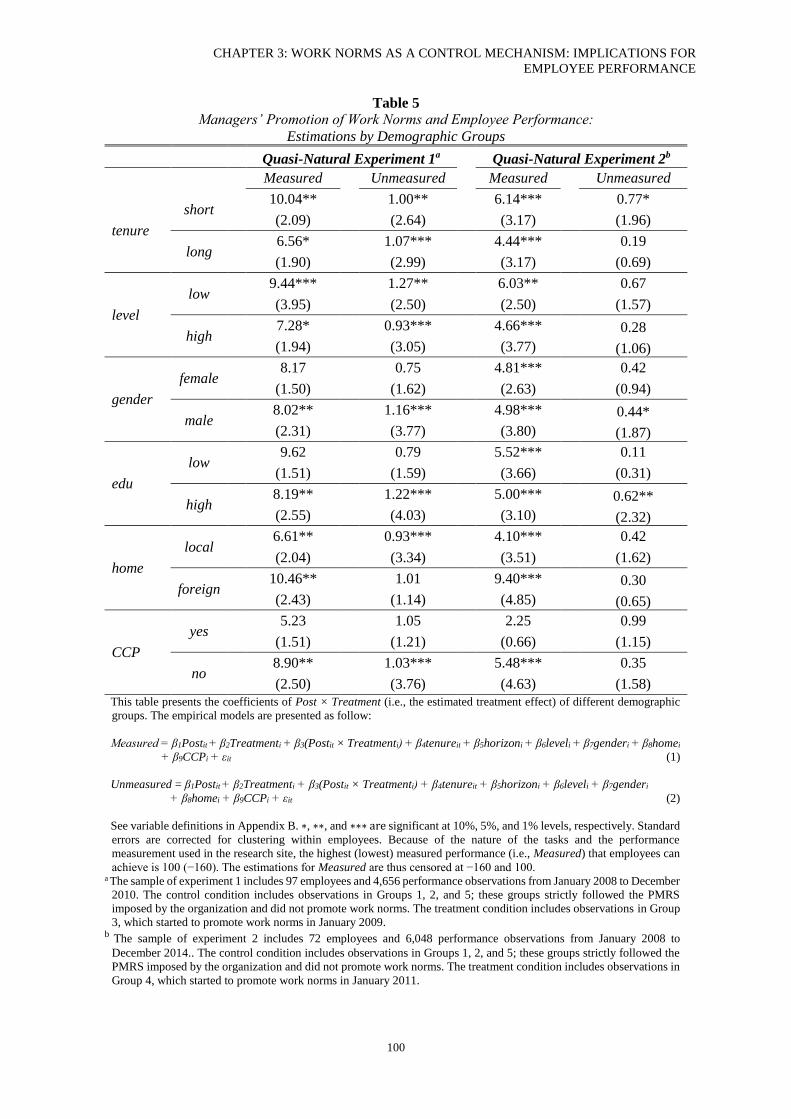
CHAPTER 3: WORK NORMS AS A CONTROL MECHANISM: IMPLICATIONS FOR
EMPLOYEE PERFORMANCE
100
Table 5
Managers’ Promotion of Work Norms and Employee Performance:
Estimations by Demographic Groups
Quasi-Natural Experiment 1a Quasi-Natural Experiment 2b
Measured Unmeasured Measured Unmeasured
tenure
short 10.04** 1.00** 6.14*** 0.77*
(2.09) (2.64) (3.17) (1.96)
long 6.56* 1.07*** 4.44*** 0.19
(1.90) (2.99) (3.17) (0.69)
level
low 9.44*** 1.27** 6.03** 0.67
(3.95) (2.50) (2.50) (1.57)
high 7.28* 0.93*** 4.66*** 0.28
(1.94) (3.05) (3.77) (1.06)
gender
female 8.17 0.75 4.81*** 0.42
(1.50) (1.62) (2.63) (0.94)
male 8.02** 1.16*** 4.98*** 0.44*
(2.31) (3.77) (3.80) (1.87)
edu
low 9.62 0.79 5.52*** 0.11
(1.51) (1.59) (3.66) (0.31)
high 8.19** 1.22*** 5.00*** 0.62**
(2.55) (4.03) (3.10) (2.32)
home
local 6.61** 0.93*** 4.10*** 0.42
(2.04) (3.34) (3.51) (1.62)
foreign 10.46** 1.01 9.40*** 0.30
(2.43) (1.14) (4.85) (0.65)
CCP
yes 5.23 1.05 2.25 0.99
(1.51) (1.21) (0.66) (1.15)
no 8.90** 1.03*** 5.48*** 0.35
(2.50) (3.76) (4.63) (1.58)
This table presents the coefficients of Post × Treatment (i.e., the estimated treatment effect) of different demographic
groups. The empirical models are presented as follow:
Measured = β1Postit + β2Treatmenti + β3(Postit × Treatmenti) + β4tenureit + β5horizoni + β6leveli + β7genderi + β8homei
+ β9CCPi + εit (1)
Unmeasured = β1Postit + β2Treatmenti + β3(Postit × Treatmenti) + β4tenureit + β5horizoni + β6leveli + β7genderi
+ β8homei + β9CCPi + εit (2)
See variable definitions in Appendix B. ∗, ∗∗, and ∗∗∗ are significant at 10%, 5%, and 1% levels, respectively. Standard
errors are corrected for clustering within employees. Because of the nature of the tasks and the performance
measurement used in the research site, the highest (lowest) measured performance (i.e., Measured) that employees can
achieve is 100 (−160). The estimations for Measured are thus censored at −160 and 100. a The sample of experiment 1 includes 97 employees and 4,656 performance observations from January 2008 to December
2010. The control condition includes observations in Groups 1, 2, and 5; these groups strictly followed the PMRS
imposed by the organization and did not promote work norms. The treatment condition includes observations in Group
3, which started to promote work norms in January 2009. b The sample of experiment 2 includes 72 employees and 6,048 performance observations from January 2008 to
December 2014.. The control condition includes observations in Groups 1, 2, and 5; these groups strictly followed the
PMRS imposed by the organization and did not promote work norms. The treatment condition includes observations in
Group 4, which started to promote work norms in January 2011.
CHAPTER 3: WORK NORMS AS A CONTROL MECHANISM: IMPLICATIONS FOR
EMPLOYEE PERFORMANCE
101
Removal of Work Norms and Employee Performance
The third event in the research site is that the group leader in Group 3 retired in December 2011.
The new group leader arrived in January 2012 and did not continue to promote the work norms.
I use employee performance data from 2009 to 2014 (i.e., 72 months) to examine how
employees in Group 3 reacted to the removal of the work norms, with employees from Groups
1, 2, and 5 as control. Table 6 presents the results. Panel A shows how employee performance
changed in both the control and the treatment conditions (Figure 6 visually illustrates these
changes). After 2012, Measured increased from 10.97 to 14.30 in the control condition, and
decreased from 17.90 to 12.41 in the treatment condition. The difference between the treatment
and the control changed from 6.92 (p < 0.01) to −1.89 (p < 0.01). Unmeasured decreased in
both conditions, and the difference between the decreases in the two conditions is not
significant. Panel B of Table 6 presents the regression estimations, which indicate that after the
removal of the work norms, Measured in the treatment condition decreased significantly (t =
−6.15). Unmeasured also decreased, but the decrease is not statistically significant (t = −0.45).
Overall, the results presented in Table 6 indicate that, for tasks that can be precisely measured,
the performance impact of work norms only persists when managers keep taking actions to
promote them. In comparison, for tasks that cannot be precisely measured, the performance
impact of work norms does not decline even when managers stop taking actions to promote
these norms. This may be because for tasks that cannot be precisely measured, work norms
provide employees with the guidelines, and frame their beliefs about how they should perform
these tasks. These results further demonstrate that managers’ promotion of work norms can
function as an effective control mechanism, especially for tasks that cannot be precisely
measured.
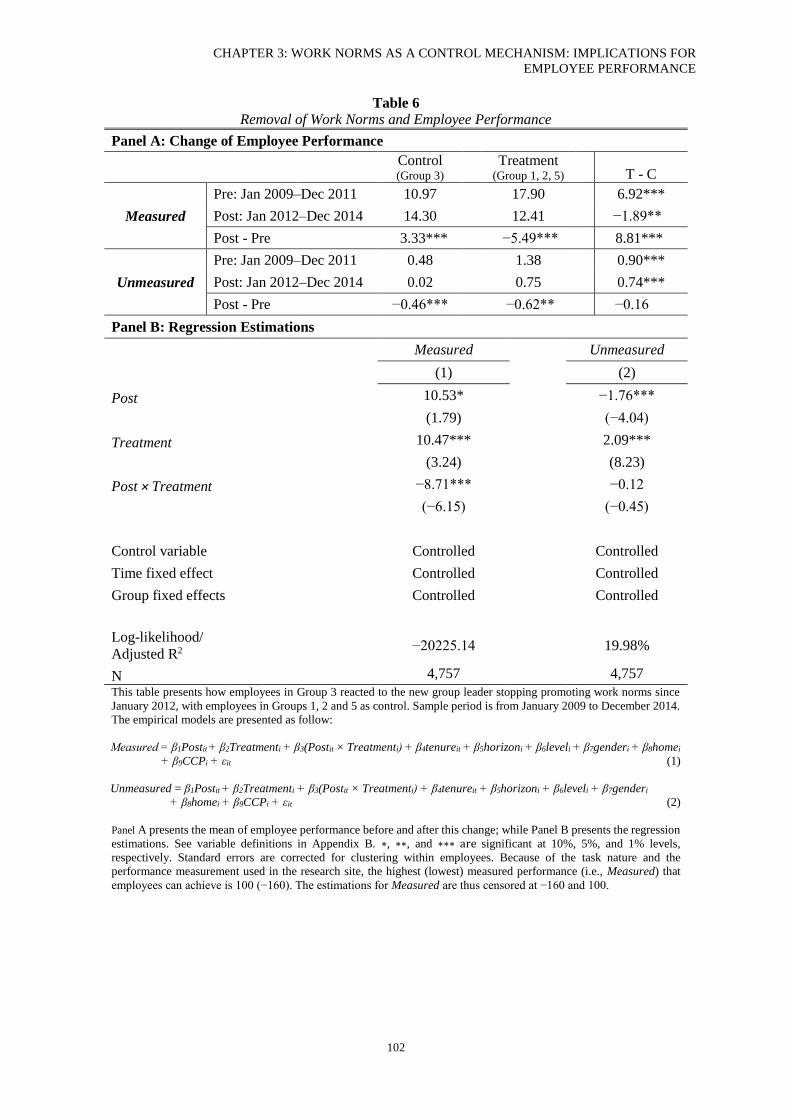
CHAPTER 3: WORK NORMS AS A CONTROL MECHANISM: IMPLICATIONS FOR
EMPLOYEE PERFORMANCE
102
Table 6
Removal of Work Norms and Employee Performance
Panel A: Change of Employee Performance
Control (Group 3)
Treatment (Group 1, 2, 5) T - C
Measured
Pre: Jan 2009–Dec 2011 10.97 17.90 6.92***
Post: Jan 2012–Dec 2014 14.30 12.41 −1.89***
Post - Pre 3.33*** −5.49*** 8.81***
Unmeasured
Pre: Jan 2009–Dec 2011 0.48 1.38 0.90***
Post: Jan 2012–Dec 2014 0.02 0.75 0.74***
Post - Pre −0.46*** −0.62** −0.16***
Panel B: Regression Estimations
Measured Unmeasured
(1) (2)
Post 10.53* −1.76***
(1.79) (−4.04)
Treatment 10.47*** 2.09***
(3.24) (8.23)
Post × Treatment −8.71*** −0.12
(−6.15) (−0.45)
Control variable Controlled Controlled
Time fixed effect Controlled Controlled
Group fixed effects
Controlled Controlled
Log-likelihood/
Adjusted R2 −20225.14
19.98%
N 4,757 4,757
This table presents how employees in Group 3 reacted to the new group leader stopping promoting work norms since
January 2012, with employees in Groups 1, 2 and 5 as control. Sample period is from January 2009 to December 2014.
The empirical models are presented as follow:
Measured = β1Postit + β2Treatmenti + β3(Postit × Treatmenti) + β4tenureit + β5horizoni + β6leveli + β7genderi + β8homei
+ β9CCPi + εit (1)
Unmeasured = β1Postit + β2Treatmenti + β3(Postit × Treatmenti) + β4tenureit + β5horizoni + β6leveli + β7genderi
+ β8homei + β9CCPi + εit (2)
Panel A presents the mean of employee performance before and after this change; while Panel B presents the regression
estimations. See variable definitions in Appendix B. ∗, ∗∗, and ∗∗∗ are significant at 10%, 5%, and 1% levels,
respectively. Standard errors are corrected for clustering within employees. Because of the task nature and the
performance measurement used in the research site, the highest (lowest) measured performance (i.e., Measured) that
employees can achieve is 100 (−160). The estimations for Measured are thus censored at −160 and 100.
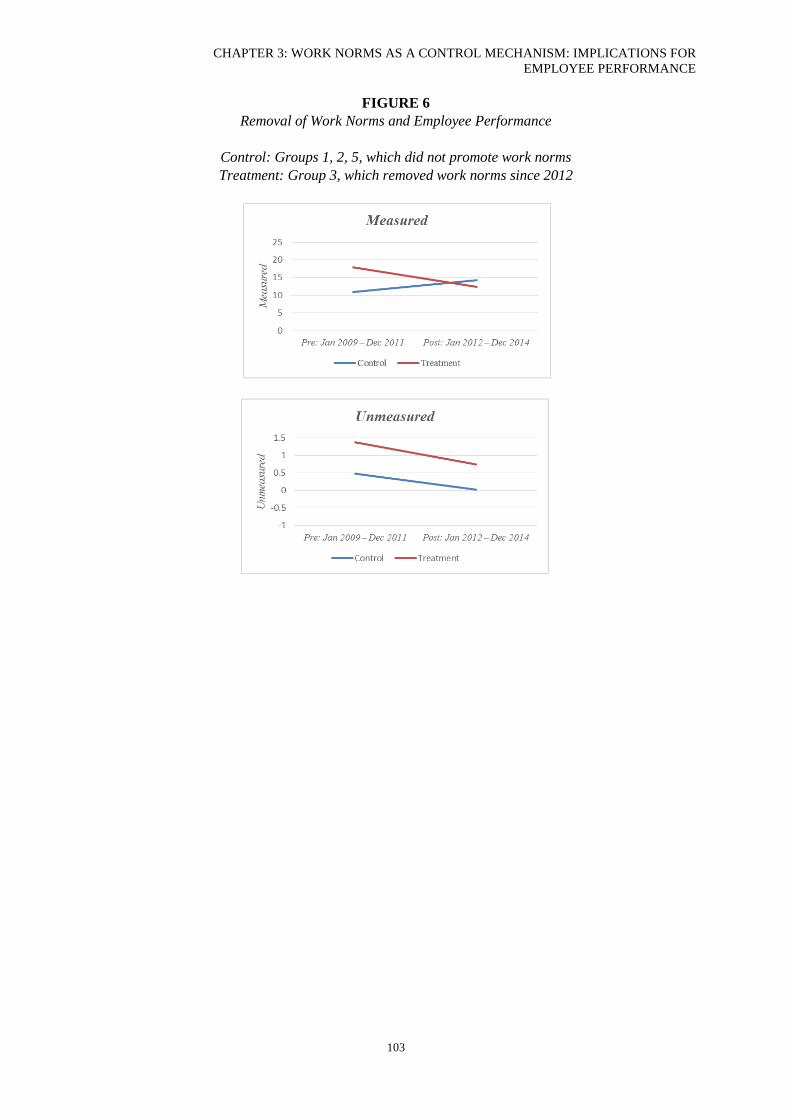
CHAPTER 3: WORK NORMS AS A CONTROL MECHANISM: IMPLICATIONS FOR
EMPLOYEE PERFORMANCE
103
FIGURE 6
Removal of Work Norms and Employee Performance
Control: Groups 1, 2, 5, which did not promote work norms
Treatment: Group 3, which removed work norms since 2012
CHAPTER 3: WORK NORMS AS A CONTROL MECHANISM: IMPLICATIONS FOR
EMPLOYEE PERFORMANCE
104
Robustness Checks
In the robustness tests, I first winsorize Performance at 5% and 1% to ensure that the results
are not distorted by the extreme values in employee performance. Further, as the dataset in this
study involves multiple periods, I include time-series variables in the models to check the
robustness of the results. After including the lag of Performance in the estimations, the
coefficients on some demographic variables lose significance. The coefficients on the lag
Performance are significantly positive, suggesting that employee performance persists over
time. Some control variables lose significance, while conclusions remain the same. Moreover,
I include control variables in the model used to estimating Unmeasured. The control variables
include employees’ skill level, demographic characteristics, as well as group and time fixed
effects. Controlling these variables in the estimation of Unmeasured does not change the
conclusions.
3.6 Concluding Remarks
This study investigates whether managers’ promotion of work norms functions as an effective
control mechanism in a multi-task setting. Psychology studies find that focusing individuals on
a particular norm motivate individuals to follow the norm (Cialdini et al. 1990, 1991). This
study examines whether this approach can motivate employee performance in a multi-task
setting, where the use of financial incentives is subject to high monetary costs and imprecise
performance measurement. On the one hand, the use of financial incentives may overrule
employees’ motivation to adopt work norms (Gneezy and Rustichini 2000; Taylor and
Bloomfield 2010). On the other hand, work norms may complement financial incentives by
guiding and motivating employees to perform their tasks in the right ways. Following work
norms promoted by managers not only help employees earn higher financial incentives from
the tasks that can be precisely measured, but also promotes their self-image as group
CHAPTER 3: WORK NORMS AS A CONTROL MECHANISM: IMPLICATIONS FOR
EMPLOYEE PERFORMANCE
105
participants (Akerlof and Kranton 2000, 2003; Ashforth and Meal 1989; Hogg and Terry 2000).
Therefore, it is an empirical question whether managers can motivate employee performance
by deliberately promoting work norms that contribute to the desired organizational outcome.
This study examines this question using performance and personnel data from a large
department within a Chinese SOE. The department has five workgroups and faces a typical,
salient control problem, which is motivating employee performance across multiple tasks. The
use of financial incentives is not sufficient to alleviate this problem, as the upper-level
management strictly controls the amount of financial incentive and some employee actions
cannot be precisely measured. Leaders in two of the five workgroups have taken actions to
promote the work norms, which require employees to engage in the desirable actions that can
be precisely measured by the organization, as well as those that cannot. I compare employee
performance before and after the promotion of the works norms, with employees in the other
three groups as control. The results indicate that the promotion of work norms motivates high
employee performance in both tasks that can and cannot be precisely measured by
organizations. One of the groups stopped promoting the work norms in 2012 because of a
change in leader. Employees’ performance on tasks that can be precisely measured dropped
significantly, while their performance on tasks that cannot be precisely measured does not
changed significantly afterwards. These findings indicate that managers’ promotion of work
norms functions as an effective control mechanism, especially for tasks that cannot be precisely
measured.
The contribution of this study is threefold. First, it contributes to the literature on management
controls and employee performance by documenting managers’ promotion of work norms as
an effective control mechanism. The existing literature suggests that financial incentives are
CHAPTER 3: WORK NORMS AS A CONTROL MECHANISM: IMPLICATIONS FOR
EMPLOYEE PERFORMANCE
106
effective in motivating employee performance (Bonner and Sprinkle 2002; Kachelmeier et al.
2008; Sprinkle 2000). However, the use of financial incentives is subject to high monetary cost
and potential unintended consequences (Holmstrom and Milgrom 1991; Roberts 2010). This
study documents that managers’ promotion of work norms can complement financial
incentives by motivating employees’ desirable actions. Further, this study also contributes to
the broader literature on work norms (Abernethy et al. 2015; Campbell 2012; Gibbons and
Kaplan 2015; Kachelmeier et al. 2008; Maas and Van Rinsum 2013) by showing that managers
can shape work norms in organizations by focusing employees’ attention on the behavioral
principles that contribute to desired organizational outcomes. Finally, this study has practical
implications. It helps managers better understand how to encourage employees to perform their
tasks in ways that are aligned with the strategy and goal of their organizations.
As for the limitations of this study, it is an open question to what extent we can generalize the
findings from a single research site. This study adopted a field site where motivating employee
performance across different tasks is a salient problem, and the promotion of work norms is
used by managers as a control mechanism. The findings might not generalize directly to other
firms with different tasks, incentives, and employees. Future research could replicate and
extend this study in different settings. Further, using archival and personnel data from a field
site, this study cannot, and does not, attempt to demonstrate the causal chain underlying the
association between work norms and employee behavior. Future studies may extend this study
by exploring the mechanisms that drive the association.
CHAPTER 3: WORK NORMS AS A CONTROL MECHANISM: IMPLICATIONS FOR
EMPLOYEE PERFORMANCE
107
REFERENCES
Abernethy, M. A., H. C. Dekker, and A. Schultz. 2015. Are employee selection and incentive
contracts complements or substitutes? Journal of Accounting Research 53(4): 633–668.
Akerlof, G. A., and R. E. Kranton. 2000. Economics and identity. Quarterly Journal of
Economics 115(3): 715–753.
Akerlof, G. A., and R. E. Kranton. 2003. Identity and the economics of organizations. Journal
of Economic Perspectives 19(1): 9–32.
Akerlof, G. A., and R. E. Kranton. 2008. Identity, supervision, and work groups. The American
Economic Review 98(2): 212–217.
Akerlof, G. A., and R. E. Kranton. 2010. Identity Economics: How Our Identities Shape Our
Work, Wages, and Well-Being. Princeton, NJ: Princeton University Press.
Ariely, D., G. Loewenstein, and D. Prelec. 2006. Tom Sawyer and the construction of value.
Journal of Economic Behavior and Organization 60(1): 1–10.
Ashforth, B. E., and F. Mael. 1989. Social identity theory and the organization. Academy of
Management Review 14(1): 20–39.
Bonner, S. E., and G. B. Sprinkle. 2002. The effects of monetary incentives on effort and task
performance: Theories, evidence, and a framework for research. Accounting,
Organizations and Society 27(4): 303–345.
Bonner, S. E., R. Hastie, G. B. Sprinkle, and S. M. Young. 2000. A review of the effects of
financial incentives on performance in laboratory tasks: Implications for management
accounting. Journal of Management Accounting Research 12(1): 19–64.
Brüggen, A., and F. Moers. 2007. The role of financial incentives and social incentives in multi-
task settings. Journal of Management Accounting Research 19(1): 25–50.
Campbell, D. 2012. Employee selection as a control system. Journal of Accounting Research
50(4): 931–966.
Cardinaels, E., and H. Yin. 2015. Think twice before going for incentives: Social norms and
the principal’s decision on compensation contracts. Journal of Accounting Research
53(5): 985–1015.
Chen, C. X., and T. Sandino. 2012. Can wages buy honesty? The relationship between relative
wages and employee theft. Journal of Accounting Research 50(4): 967–1000.
Christ, M. H., K. L. Sedatole, and K. L. Towry. 2012. Sticks and carrots: The effect of contracts
frame on effort in incomplete contracts. The Accounting Review 87(6): 1913–1938.
Cialdini, R. B., and M. R. Trost. 1998. Social influence: Social norms, conformity, and
compliance. In The Handbook of Social Psychology, Volume II, edited by D. T. Gilbert,
S. T. Fiske, and G. Lindzey, 151–192. New York, NY: Oxford University.
Cialdini, R. B., and N. J. Goldstein. 2004. Social influence: compliance and conformity. Annual
Review of Psychology 55: 591–621.
Cialdini, R. B., C. A. Kallgren, and R. R. Reno. 1990. A focus theory of normative conduct:
recycling the concept of norms to reduce littering in public places. Journal of Personality
and Social Psychology 58(6): 1015–1026.
Cialdini, R. B., C. A. Kallgren, and R. R. Reno. 1991. A focus theory of normative conduct: A
theoretical refinement and re-evaluation of the role of norms in human behavior.
Advances in Experimental Social Psychology 24: 201–234.
Coleman, J. 2013. Six components of a great corporate culture. Harvard Business Review.
Available at: https://hbr.org/2013/05/six-components-of-culture [Accessed on 31 May
2017]
Gibbons, R., and R. S. Kaplan. 2015. Formal measures in informal management: Can a
balanced scorecard change a culture? American Economic Review: Papers and
Proceedings 105(5): 447–451.
CHAPTER 3: WORK NORMS AS A CONTROL MECHANISM: IMPLICATIONS FOR
EMPLOYEE PERFORMANCE
108
Gneezy, U., and A. Rustichini. 2000. A fine is a price. Journal of Legal Studies 29: 1–17.
Grabner, I., and F. Moers. 2013. Managers’ choices of performance measures in promotion
decisions: An analysis of alternative job assignments. Journal of Accounting Research
51(5): 1187–1220.
Hannan, R. L., V. B. Hoffman, and D. V. Moser. 2005. Bonus versus penalty: Does the contracts
frame affect employee effort? In Experimental Business Research, edited by R. Zwick
and A. Rapoport, Vol. 2: 151–169. Boston, MA: Kluwer.
Hogg, M. A., and D. I. Terry. 2000. Social identity and self-categorization processes in
organizational contexts. Academy of Management Review 25(1): 121–140.
Holmstrom, B., and P. Milgrom, P. 1991. Multitask principal-agent analyses: Incentive
contracts, asset ownership, and job design. Journal of Law, Economics, and Organization
7: 24–52.
Jensen, M. C., and W. H. Meckling. 1976. Theory of the firm: Managerial behavior, agency
costs and ownership structure. Journal of Financial Economics 3(4): 305–360.
Kachelmeier, S. J., B. E. Reichert, and M. G. Williamson. 2008. Measuring and motivating
quantity, creativity, or both. Journal of Accounting Research 46(2): 341–373.
Maas, V. S., and M. Van Rinsum. 2013. How control system design influences performance
misreporting. Journal of Accounting Research 51(5): 1159–1186.
Malmi, T., and D. A. Brown. 2008. Management control systems as a package—Opportunities,
challenges and research directions. Management Accounting Research 19(4): 287–300.
Roberts, J. 2010. Designing incentives in organizations. Journal of Institutional Economics
6(1): 125–132.
Ryan, R. M., and E. L. Deci. 2000. Self-determination theory and the facilitation of intrinsic
motivation, social development, and well-being. American Psychologist 55(1): 68–78.
Shadish, W. R., T. D. Cook, and D. T. Cambell. 2002. Experimental and quasi-experimental
designs for generalized causal inference. Boston, MA: Houghton Mifflin.
Sprinkle, G. B. 2000. The effect of incentive contracts on learning and performance. The
Accounting Review 75(3):299–326.
Tayler, W. B., and R. J. Bloomfield. 2011. Norms, conformity, and controls. Journal of
Accounting Research 49(3): 753–790.
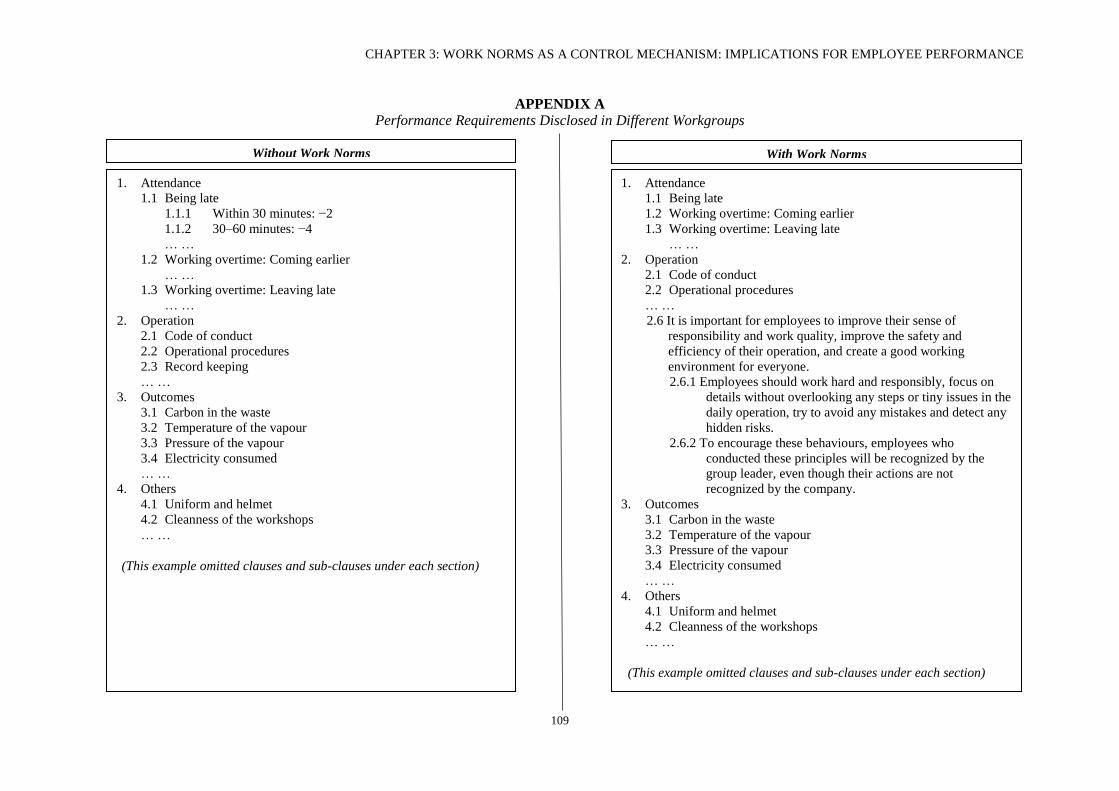
CHAPTER 3: WORK NORMS AS A CONTROL MECHANISM: IMPLICATIONS FOR EMPLOYEE PERFORMANCE
109
APPENDIX A
Performance Requirements Disclosed in Different Workgroups
Without Work Norms With Work Norms
1. Attendance
1.1 Being late
1.1.1 Within 30 minutes: −2
1.1.2 30–60 minutes: −4
… …
1.2 Working overtime: Coming earlier
… …
1.3 Working overtime: Leaving late
… …
2. Operation
2.1 Code of conduct
2.2 Operational procedures
2.3 Record keeping
… …
3. Outcomes
3.1 Carbon in the waste
3.2 Temperature of the vapour
3.3 Pressure of the vapour
3.4 Electricity consumed
… …
4. Others
4.1 Uniform and helmet
4.2 Cleanness of the workshops
… …
(This example omitted clauses and sub-clauses under each section)
1. Attendance
1.1 Being late
1.2 Working overtime: Coming earlier
1.3 Working overtime: Leaving late
… …
2. Operation
2.1 Code of conduct
2.2 Operational procedures
… …
2.6 It is important for employees to improve their sense of
responsibility and work quality, improve the safety and
efficiency of their operation, and create a good working
environment for everyone.
2.6.1 Employees should work hard and responsibly, focus on
details without overlooking any steps or tiny issues in the
daily operation, try to avoid any mistakes and detect any
hidden risks.
2.6.2 To encourage these behaviours, employees who
conducted these principles will be recognized by the
group leader, even though their actions are not
recognized by the company.
3. Outcomes
3.1 Carbon in the waste
3.2 Temperature of the vapour
3.3 Pressure of the vapour
3.4 Electricity consumed
… …
4. Others
4.1 Uniform and helmet
4.2 Cleanness of the workshops
… …
(This example omitted clauses and sub-clauses under each section)
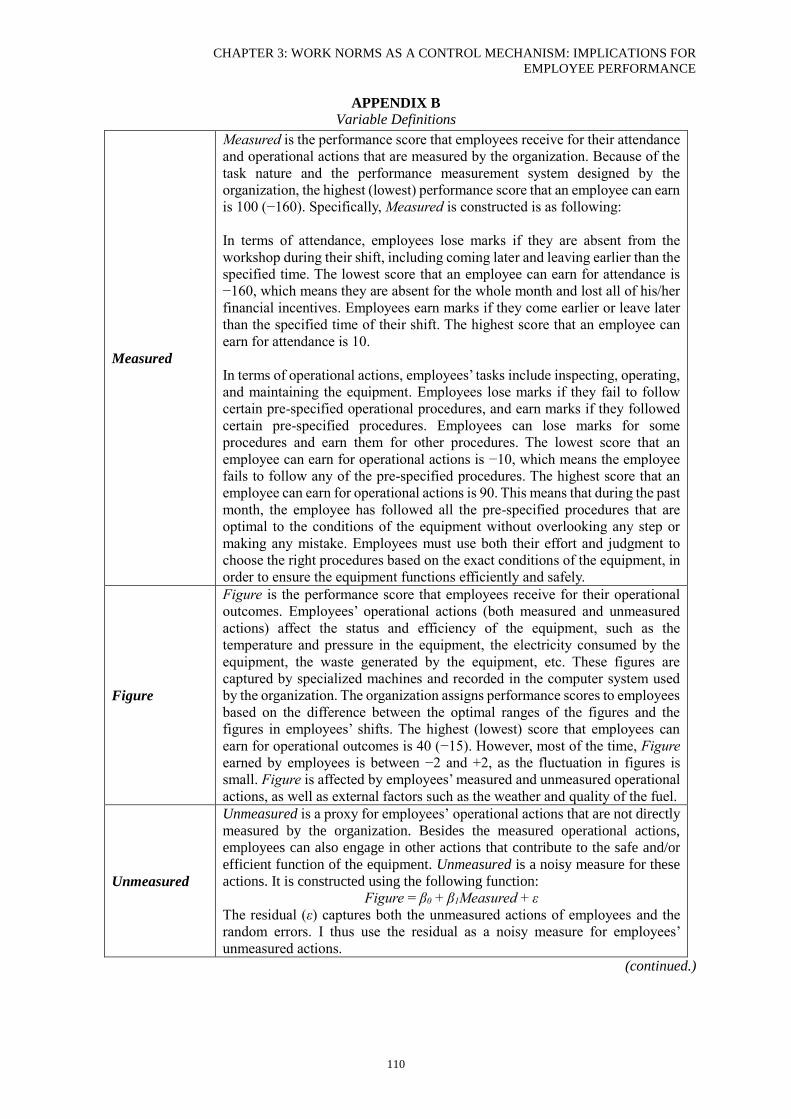
CHAPTER 3: WORK NORMS AS A CONTROL MECHANISM: IMPLICATIONS FOR
EMPLOYEE PERFORMANCE
110
APPENDIX B
Variable Definitions
Measured
Measured is the performance score that employees receive for their attendance
and operational actions that are measured by the organization. Because of the
task nature and the performance measurement system designed by the
organization, the highest (lowest) performance score that an employee can earn
is 100 (−160). Specifically, Measured is constructed is as following:
In terms of attendance, employees lose marks if they are absent from the
workshop during their shift, including coming later and leaving earlier than the
specified time. The lowest score that an employee can earn for attendance is
−160, which means they are absent for the whole month and lost all of his/her
financial incentives. Employees earn marks if they come earlier or leave later
than the specified time of their shift. The highest score that an employee can
earn for attendance is 10.
In terms of operational actions, employees’ tasks include inspecting, operating,
and maintaining the equipment. Employees lose marks if they fail to follow
certain pre-specified operational procedures, and earn marks if they followed
certain pre-specified procedures. Employees can lose marks for some
procedures and earn them for other procedures. The lowest score that an
employee can earn for operational actions is −10, which means the employee
fails to follow any of the pre-specified procedures. The highest score that an
employee can earn for operational actions is 90. This means that during the past
month, the employee has followed all the pre-specified procedures that are
optimal to the conditions of the equipment without overlooking any step or
making any mistake. Employees must use both their effort and judgment to
choose the right procedures based on the exact conditions of the equipment, in
order to ensure the equipment functions efficiently and safely.
Figure
Figure is the performance score that employees receive for their operational
outcomes. Employees’ operational actions (both measured and unmeasured
actions) affect the status and efficiency of the equipment, such as the
temperature and pressure in the equipment, the electricity consumed by the
equipment, the waste generated by the equipment, etc. These figures are
captured by specialized machines and recorded in the computer system used
by the organization. The organization assigns performance scores to employees
based on the difference between the optimal ranges of the figures and the
figures in employees’ shifts. The highest (lowest) score that employees can
earn for operational outcomes is 40 (−15). However, most of the time, Figure
earned by employees is between −2 and +2, as the fluctuation in figures is
small. Figure is affected by employees’ measured and unmeasured operational
actions, as well as external factors such as the weather and quality of the fuel.
Unmeasured
Unmeasured is a proxy for employees’ operational actions that are not directly
measured by the organization. Besides the measured operational actions,
employees can also engage in other actions that contribute to the safe and/or
efficient function of the equipment. Unmeasured is a noisy measure for these
actions. It is constructed using the following function:
Figure = β0 + β1Measured + ε
The residual (ε) captures both the unmeasured actions of employees and the
random errors. I thus use the residual as a noisy measure for employees’
unmeasured actions.
(continued.)
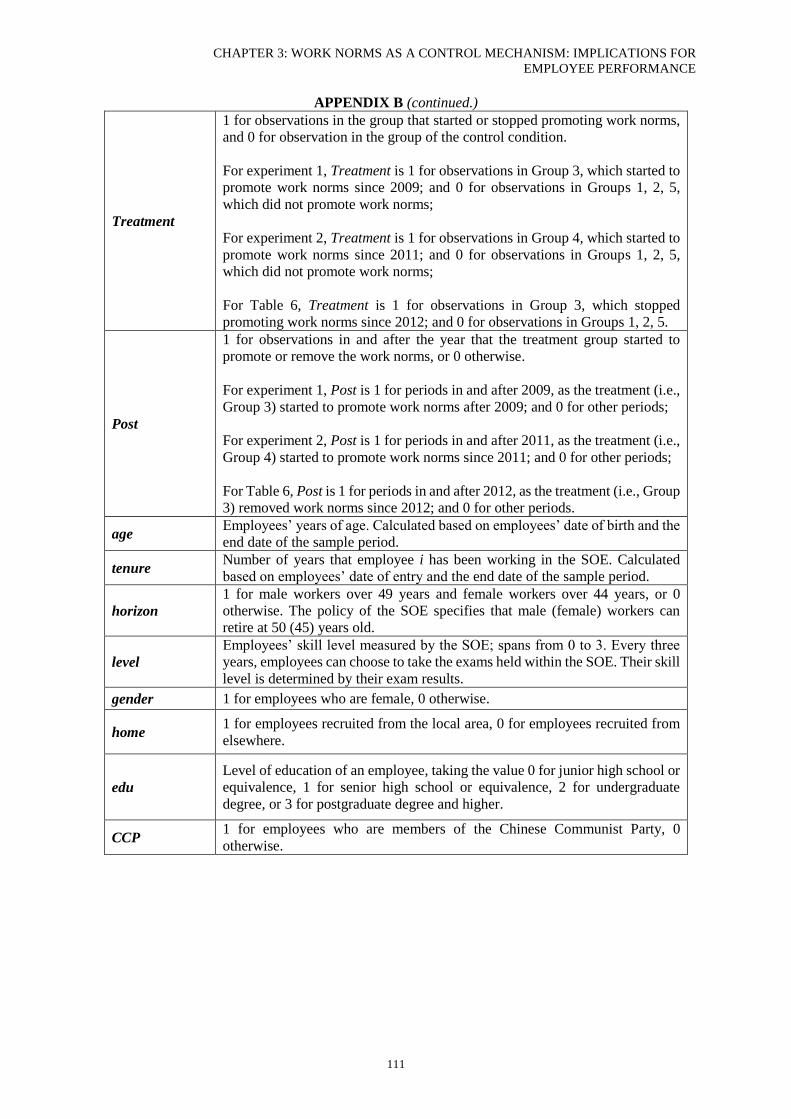
CHAPTER 3: WORK NORMS AS A CONTROL MECHANISM: IMPLICATIONS FOR
EMPLOYEE PERFORMANCE
111
APPENDIX B (continued.)
Treatment
1 for observations in the group that started or stopped promoting work norms,
and 0 for observation in the group of the control condition.
For experiment 1, Treatment is 1 for observations in Group 3, which started to
promote work norms since 2009; and 0 for observations in Groups 1, 2, 5,
which did not promote work norms;
For experiment 2, Treatment is 1 for observations in Group 4, which started to
promote work norms since 2011; and 0 for observations in Groups 1, 2, 5,
which did not promote work norms;
For Table 6, Treatment is 1 for observations in Group 3, which stopped
promoting work norms since 2012; and 0 for observations in Groups 1, 2, 5.
Post
1 for observations in and after the year that the treatment group started to
promote or remove the work norms, or 0 otherwise.
For experiment 1, Post is 1 for periods in and after 2009, as the treatment (i.e.,
Group 3) started to promote work norms after 2009; and 0 for other periods;
For experiment 2, Post is 1 for periods in and after 2011, as the treatment (i.e.,
Group 4) started to promote work norms since 2011; and 0 for other periods;
For Table 6, Post is 1 for periods in and after 2012, as the treatment (i.e., Group
3) removed work norms since 2012; and 0 for other periods.
age Employees’ years of age. Calculated based on employees’ date of birth and the
end date of the sample period.
tenure Number of years that employee i has been working in the SOE. Calculated
based on employees’ date of entry and the end date of the sample period.
horizon
1 for male workers over 49 years and female workers over 44 years, or 0
otherwise. The policy of the SOE specifies that male (female) workers can
retire at 50 (45) years old.
level
Employees’ skill level measured by the SOE; spans from 0 to 3. Every three
years, employees can choose to take the exams held within the SOE. Their skill
level is determined by their exam results.
gender 1 for employees who are female, 0 otherwise.
home 1 for employees recruited from the local area, 0 for employees recruited from
elsewhere.
edu
Level of education of an employee, taking the value 0 for junior high school or
equivalence, 1 for senior high school or equivalence, 2 for undergraduate
degree, or 3 for postgraduate degree and higher.
CCP 1 for employees who are members of the Chinese Communist Party, 0
otherwise.
CHAPTER 4: INTERNAL REPORTING, PERSONAL CONNECTIONS AND
EMPLOYEE PERFORMANCE
CHAPTER IV
INTERNAL REPORTING, PERSONAL CONNECTIONS, AND
EMPLOYEE PERFORMANCE
ABSTRACT
This study examines how personal connections affect the relation between internal reporting
and employee performance. Previous studies find that public reporting (i.e., reporting employee
performance publicly within organizations) motivates employees to demonstrate high
performance to maintain a positive self-image in the workplace. In this study, I examine
whether the personal connections that employees have in the workplace influence the
performance effect of public reporting. I focus on the referrer–referral connection and the
family connection, which are common in organizations and can be important to managers’
decisions about employee selection. Based on the social psychology literature, personal
connections increase employees’ concern for their own image and that of their referrers or
family members, and are thus likely to enhance the positive effect of public reporting. Using
archival and survey data from five workgroups in a Chinese state-owned enterprise, I find that
public reporting has a significant and positive effect on the performance of employees with
personal connections. However, it has no significant performance effect on employees without
personal connections. These findings not only contribute to the literature on internal
performance reporting and employee selection, but also have important practical implications.
CHAPTER 4: INTERNAL REPORTING, PERSONAL CONNECTIONS AND
EMPLOYEE PERFORMANCE
113
4.1 Introduction
This study examines how internal reporting and personal connections jointly affect employee
performance. Previous studies have documented a positive relation between public reporting
(i.e., reporting employee performance publicly in the workplace) and employee performance
(Hannan, McPhee, Newman, and Tafkov 2013; Tafkov 2012). In this study, I extend the
existing literature by examining whether the relation between public reporting and employee
performance is affected by the personal connections that employees have in the workplace.
Social comparison theory (Festinger 1954; Suls and Wheeler 2000) posits that individuals have
an innate drive to compare themselves with others in order to evaluate their own abilities. The
social comparison process motivates individuals to adjust their behavior to maintain a positive
self-image (i.e., how individuals believe others think of them) in their social or work group.
Existing studies find that internal reporting facilitates social comparison in the workplace and
functions as an effective control mechanism in motivating employee performance (Azmat and
Iriberri 2010; Frederickson 1992; Hannan, Krishnan, and Newman 2008; Hannan et al. 2013;
Maas and Van Rinsum 2013; Tafkov 2012). Using controlled experiments, previous studies
find that reporting employee performance publicly in the workplace increases employees’
concern for their self-image and motivates them to demonstrate high performance to “look
good” in front of their peers (Hannan et al. 2013; Tafkov 2012). However, in real-world
organizations, different types of employees may have different image concerns and different
reactions to public reporting. This study examines whether the performance effect of public
reporting varies between employees with and without personal connections in the workplace.
I refer to “personal connections” as the connections between employees that are outside the
formal working relations that co-workers have as a part of their job. Personal connections in
CHAPTER 4: INTERNAL REPORTING, PERSONAL CONNECTIONS AND
EMPLOYEE PERFORMANCE
114
organizations vary from friendships to family connections to intimate relations. In this study, I
focus on two types of personal connections: the referrer–referral connection and the family
connection. Both types of connections are common in organizations and are important to
managers’ decision-making regarding employee selection. As for the referrer–referral
connection, there is widespread use of referrals in the labor market (Brown, Setren, and Topa
2016; LinkedIn 2015). Academics and business practitioners are interested in how the referrer–
referral connection affects employee performance and organizational outcomes (Beaman and
Magruder 2012; Brown et al. 2016; Campbell 2012). As for family connections, whether
organizations should hire the family members of existing employees receives extensive
attention, and constitutes an important part of the hiring policy of many organizations
(Encyclopedia of Management 2009; Stinson and Wignall 2014).
Based on the social psychology literature, both types of connections are likely to increase
employees’ image concern and affect their reactions to public reporting. Specifically, public
reporting increases performance transparency in the workplace and motivates employees to
increase their performance in order to be perceived positively by their peers (Hannan et al.
2013; Tafkov 2012). Employees with referrer–referral and/or family connections may have
higher concern for their image, as they tend to consider not only how their peers perceive them,
but also how their referrers and/or family members do. Further, the social psychology literature
indicates that one’s behavior not only affects one’s own image, but also affects the image of
those with whom one is connected (Cupach and Metts 1994; Goffman 1979; Tedeschi 2013).
Therefore, public reporting may also lead employees with personal connections to consider
how their performance affects the image of their referrers and/or family members in the
workplace. Overall, personal connections in the workplace may enhance the positive relation
between public reporting and employee performance.
CHAPTER 4: INTERNAL REPORTING, PERSONAL CONNECTIONS AND
EMPLOYEE PERFORMANCE
115
Given the importance and the potential influence of personal connections, this study
empirically examines whether these connections affect employees’ reaction to public reporting.
I conduct this study using performance and personnel data from a large department within a
state-owned enterprise (SOE) in China. In this department, employee tasks include operating
and maintaining equipment. The department manager divides employees into five workgroups
to improve the efficiency of daily management. Several features of this department make it an
ideal setting for this study. First, although the SOE has implemented a strict and objective
performance measurement and reward system, group leaders have discretion to make internal
reporting choices. Two of the five group leaders choose to report employees’ individual
performance publicly within their workshops at the end of every month, while the other three
choose to communicate each employee’s performance to him or her privately. Second,
referrer–referral and family connections are common in this department. Employees with
family members and/or referrers tend to have stronger personal connections than those without
these relationships. It thus provides me with an opportunity to examine how personal
connections may affect employee performance in the organization. Third, the operating
environment of the organization is stable and most employees stay in the same department and
workgroup for years. Therefore, employees are likely to have a salient concern for their own
image and those of their colleagues.
Using archival data on employee performance and survey data on personal connections, I find
that personal connections enhance the positive performance effect of public reporting. The
results suggest that public reporting has a significant and positive performance effect on
employees with personal connections. However, public reporting has no significant effect on
the performance of employees who have no personal connections in the organization. The
contribution of these findings is threefold. First, it contributes to the literature on internal
CHAPTER 4: INTERNAL REPORTING, PERSONAL CONNECTIONS AND
EMPLOYEE PERFORMANCE
116
performance reporting (Hannan et al. 2013; Luft 2016; Maas and Van Rinsum 2013; Tafkov
2013), by demonstrating that the performance effect of public reporting is contingent on the
saliency of employees’ image concern. The findings indicate that personal connections in the
workplace, as a factor that is likely to increase employees’ image concern, significantly
enhances the performance effect of public reporting. Second, this study adds to the literature
on employee selection. Existing studies in accounting and economics suggest that employee
selection functions as an effective control mechanism (Abernethy, Dekker, and Schultz 2015;
Campbell 2012). Examining the role of personal connections provides insight into how
employment channels (i.e., referrals and non-referrals) and criteria (i.e., with or without family
connections) affect the performance effect of public reporting. Finally, this study has practical
implications. The findings could help managers better understand the performance effect of
internal performance reporting, and suggest that managers need to consider internal
performance reporting and employee selection as an integrated system.
This paper is organized as follows. I review the existing literature and develop hypotheses in
the next section. I then describe the research site, before explaining the method and discussing
the results. Concluding remarks are offered in the final section.
4.2 Literature and Hypothesis Development
Internal Reporting and Employee Performance
Social comparison theory posits that individuals have an innate desire to compare themselves
with others in order to evaluate their own abilities (Festinger 1954; Suls and Wheeler 2000).
The social comparison process motivates individuals to adjust their behavior to maintain a
positive self-image (i.e., how individuals believe others think of them). Individuals prefer to
“look better”, or at least not “look worse”, than others in their social or work groups. Drawing
CHAPTER 4: INTERNAL REPORTING, PERSONAL CONNECTIONS AND
EMPLOYEE PERFORMANCE
117
on the social comparison theory, previous studies find that employee performance is affected
by whether and how performance information is reported in the workplace. Specifically,
Frederickson (1992) experimentally find that providing employees with information on their
own performance relative to the performance of their peers (i.e., relative performance
information, or RPI) motivates them to exhibit higher effort. This finding is consistent with the
findings obtained by Azmat and Iriberri (2010) using a natural experiment in a high school.
Further, Hannan et al. (2008) find that the performance impact of RPI is conditional on the
incentive contract (i.e., tournament or individual compensation) as well as the precision of the
RPI information. Later studies also find that providing employees with RPI may motivate
undesirable behaviors in employees, such as sabotaging the work of peers (Charness, Masclet,
and Villeval 2013) or misreporting the budget (Brown, Fisher, Sooy, and Sprinkle 2014).
Recent studies have examined whether making performance information public in the
workplace affects employee behaviors. In particular, Tafkov (2012) experimentally find that
public RPI (i.e., when the performance ranking of each employee in a group is provided to all
group members) is more effective in motivating employee performance than private RPI (i.e.,
each employee knows his or her own rank only). Hannan et al. (2013) also find that compared
to private RPI, public PRI is more effective in motivating employees to exert high effort in a
multi-task setting. Additionally, Maas and Van Rinsum (2013) find that publicly disclosing
managers’ self-reported performance in the workplace motivates them to report their
performance honestly, in order to maintain a positive self-image in front of their peers. These
studies suggest that public reporting increases employees’ concern for their self-image.
Demonstrating a positive (e.g., competent or honest) self-image enhances employees’ self-
esteem and improves their feelings about self (Beach and Tesser 2000). It also prevents
employees from being looked down on by their peers, and increases employees’ status in the
CHAPTER 4: INTERNAL REPORTING, PERSONAL CONNECTIONS AND
EMPLOYEE PERFORMANCE
118
workplace (Smith 2000). To create and/or maintain a positive self-image, employees are
motivated to adjust their behavior, such as demonstrating higher performance (Hannan et al.
2013; Tafkov 2012) or reporting their performance honestly (Maas and Van Rinsum 2013).
Personal Connections in the Workplace
In real-world organizations, different employees may have different image concerns and react
differently to public reporting. In this study, I examine whether the relation between public
reporting and employee performance is affected by personal connections, a factor that is likely
to affect employees’ image concern. I refer to personal connections as the connections between
employees that are outside formal working relationships that co-workers have as a part of their
job. Personal connections in organizations vary from friendships to family connections to
intimate relations. In this study, I focus on two types of personal connections: the connection
between referrer and referral, and the connection between family members.
Both types of connection are common in organizations and are important to managers’
decisions regarding employee selection. Specifically, referrals made by existing employees is
one of the most important employment channels in the labor market (Brown et al. 2016;
LinkedIn 2015). Whether and how the referrer–referral connection affects employee
performance is important to managers’ decisions regarding employee selection channels
(Beaman and Magruder 2012; Brown et al. 2016; Campbell 2012). Whether organizations
should hire family members of existing employees is also important to managers, and
constitutes an important part of hiring rules in many organizations (Encyclopedia of
Management 2009; Stinson and Wignall 2014). Based on the social psychological literature,
both types of connections are likely to increase employees’ image concern and affect the way
that employees react to public reporting. Drawing on the social psychological theories, I
CHAPTER 4: INTERNAL REPORTING, PERSONAL CONNECTIONS AND
EMPLOYEE PERFORMANCE
119
develop a theoretical framework predicting that the positive effect of public reporting is
enhanced by the personal connections of employees. The theoretical framework is presented in
Figure 11.
1 This figure has been inspired by the figure used to describe the theoretical framework in Tafkov (2012).
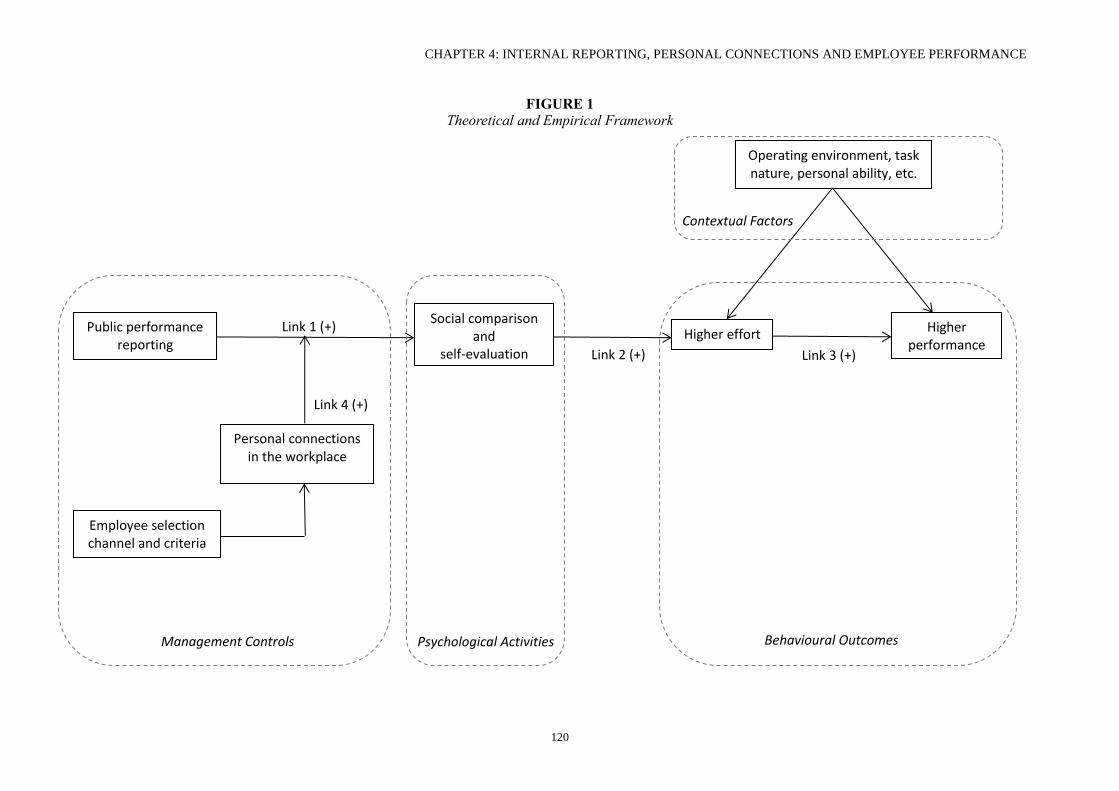
CHAPTER 4: INTERNAL REPORTING, PERSONAL CONNECTIONS AND EMPLOYEE PERFORMANCE
120
FIGURE 1
Theoretical and Empirical Framework
Public performance reporting
Social comparison and
self-evaluation
Higher effort Higher performance
Employee selection channel and criteria
Personal connections in the workplace
Management Controls Psychological Activities Behavioural Outcomes
Operating environment, task nature, personal ability, etc.
Contextual Factors
Link 1 (+)
Link 2 (+) Link 3 (+)
Link 4 (+)
CHAPTER 4: INTERNAL REPORTING, PERSONAL CONNECTIONS AND
EMPLOYEE PERFORMANCE
121
The framework first describes how public reporting affect employees’ task performance. Social
comparison theory posits that individuals have an innate desire to compare themselves with
others and adjust their behaviors to maintain a positive self-image (Festinger 1954; Suls and
Wheeler 2000). Public reporting provides employees with information on their own and their
peers’ performance, and exposes employees’ performance to their peers. It enables employees
to compare themselves with their peers (Link 1), and motivates employees to exert higher effort
(Link 2) to demonstrate higher performance (Link 3) so that they will look better, or at least
not worse, than their peers (Hannan et al. 2013; Luft 2016; Tafkov 2012). The relation between
motivation and effort (Link 2) and between effort and performance (Link 3) may be moderated
by contextual factors, including but not limited to task nature, employees’ abilities, and the
operating environment.
The framework next describes how personal connections interact with public reporting,
increasing employees’ image concern and ultimately affecting their effort and performance.
Personal connections affect employees’ concern for their own image, as well as their concern
for the image of their referrers or family members. Specifically, public reporting increases
performance transparency within organizations. Employees without personal connections only
need to consider how their peers think of them, and this concern affects the way they evaluate
themselves and their subsequent performance. In comparison, employees with personal
connections may consider not only how their peers perceive them, but also how their referrers
or family members perceive them. Therefore, under public reporting, employees with personal
connections may have a stronger motivation to demonstrate high performance in order to be
perceived positively by their referrers or family members.
CHAPTER 4: INTERNAL REPORTING, PERSONAL CONNECTIONS AND
EMPLOYEE PERFORMANCE
122
Further, one’s behavior not only affects one’s own image, but also affects the image of those
with whom one is connected (Cupach and Metts 1994; Goffman 1979; Giacalone and
Rosenfeld 2013; Tedeschi 2013). Based on psychology theory, if observers evaluate individual
A positively and perceive a positive connection between individual A and individual B, then
in order to keep their cognitive systems in balance, observers would have to positively evaluate
individual B as well (Cialdini 2013). If a referrer–referral connection exists and the referral
demonstrates low performance, it may negatively affect the image of the referrer, as other
employees may believe that the referrer has made an unfavorable recommendation to the
organization. Similarly, the social psychology literature suggests that individuals in a close
relationship present a “unified” image in public. When one individual in the relationship
engages in behavior that negatively affects his/her image, these behaviors also affect the image
of the other individual negatively (Cupach and Metts 1994; Goffman 1979). That is, if an
employee has a family member(s) in the workplace and demonstrates low performance, others
may perceive the family member(s) negatively. Therefore, under public reporting, employees
with personal connections may have a stronger motivation to demonstrate high performance in
order to protect the image of their referrers or family members.
Public reporting increases performance transparency in the workplace, and motivates
employees to demonstrate high performance to maintain their self-image. Personal connections
increase employees’ concern for their own image as well as the image of their referrers or
family members, and motivates employees to demonstrate higher performance under public
reporting. Therefore, I hypothesize that the positive relation between public reporting and
employee performance is enhanced by the personal connections that employees have in the
workplace:
CHAPTER 4: INTERNAL REPORTING, PERSONAL CONNECTIONS AND
EMPLOYEE PERFORMANCE
123
Hypothesis: Personal connections enhance the positive relation between public reporting and
employee performance.
The referrer–referral connection and family connection may overlap with each other. For
example, it is possible that an employee is recommended by a family member who also works
in the same organization; it is also possible that an employee is recommended by a family
member or friend, and has another family member(s) working in the same organization. In the
first case, the employee has two types of connections with the same person; in the second case,
the employee has two types of connections with two or more different people. In either case,
the employee has stronger personal connections in the workplace than those with only one type
of connection and those without any connection. Previous studies do not posit the performance
effect of the type or strength of personal connections. This study explores this question in the
additional analyses.
4.3 Research Site
Overview
The research site is a department within a Chinese state-owned enterprise (SOE). The SOE is
the largest organization in the city where it is located. It has been the principal driver of the
local economy, and has its own schools, hospitals, media, and communities. It comprises 34
factories, plants, and institutions. This study focuses on one department in a power plant in the
SOE. Employees in the department are responsible for equipment operation, inspection, and
maintenance. Employees’ tasks include inspecting and operating the equipment, identifying
and solving hidden issues, and keeping records of the condition of the equipment. The purpose
of these tasks is to ensure the equipment functions normally and safely, to prolong the usable
life of the equipment, and reduce the risk of operational disasters. Employees perform their
CHAPTER 4: INTERNAL REPORTING, PERSONAL CONNECTIONS AND
EMPLOYEE PERFORMANCE
124
tasks individually, and each employee’s tasks and responsibilities are clearly specified by the
SOE.
As the equipment functions 24/7, employees take shifts. The department head divides
employees into five workgroups, to make the shifts more manageable. Employees in the same
group work on the same shifts. During each shift, employees work individually in different
areas of the workshop. Employees cannot directly observe the operational actions of their peers.
Once allocated in a group, employees usually stay in the same group; changing groups rarely
happens. Each group is managed by a group leader and has 18–25 group members.
Performance Measurement and Reward System
The SOE uses performance measures and financial incentives to motivate employee effort. By
the end of every month, employees receive performance scores based on the operational actions
that they took and the performance outcomes that they achieved over the past month. Employee
actions include the procedures and steps that employees take to inspect, operate, and maintain
the equipment. Performance outcomes include a range of parameters on the equipment, such
as temperature and pressure, which reflect the status of the equipment. The organization has
specified a series of performance requirements for the actions and outcomes that employees
should take and achieve. It has also specified rules about how to allocate performance scores
to employees based on the extent to which their actions and outcomes meet performance
requirements. Engaging in some of the actions and achieving some of the outcomes allows
employees to earn performance scores. In comparison, failing to engaging in some of the
actions or achieving some of the outcomes causes employees to lose performance scores.
Employees may earn scores for some actions and/or outcomes and lose scores for others.
Taking a certain set of actions that keep the equipment functioning normally allows employees
CHAPTER 4: INTERNAL REPORTING, PERSONAL CONNECTIONS AND
EMPLOYEE PERFORMANCE
125
to earn a reasonable overall performance score. In comparison, inspecting the equipment more
carefully, identifying and solving more hidden issues, or choosing the optimal operational
actions based on the exact conditions helps employees earn higher performance scores.
The department manager measures employee performance objectively. In particular, the
department manager assesses employee performance by checking the operational records and
the status of the equipment. The operational records are kept by the machines and the computer
system employed by the organization. When taking actions to inspect, operate, and maintain
the equipment, employees need to tap their identification cards on the machines located in
different areas of the workshops. The system then records that the employees have taken certain
actions in certain areas of the workshop. The department manager measures employee actions
using the information kept by the system. Additionally, the department manager measures
employees’ performance outcomes by checking the parameters on the equipment during each
shift, which is also kept by the system. At the end of every month, each employee receives
performance scores based on the objective measurement of their operational actions and
performance outcomes.
At the end of every month, employees receive a fixed payment and financial incentives. The
financial incentives are calculated as 10 times the total performance scores that each employee
received for the month. The financial incentives account for approximately 0–10% of the
overall salary received by each employee. The performance measurement, score allocation, and
compensation structure are pre-specified by the organization and require little judgment from
the department manager or the group leader.
CHAPTER 4: INTERNAL REPORTING, PERSONAL CONNECTIONS AND
EMPLOYEE PERFORMANCE
126
Internal Reporting Structure
The SOE requires each of its subunits to provide employees with the feedback on their
performance. However, it does not impose any rules on the performance reporting practices of
the department manager or group leaders. In the department of this study, two types of
performance reporting practices have coexisted for years. In one of the five workgroups (Group
5), the group leader prints the names and the performance of all group members on a table, and
distributes this performance table to the group members at the end of every month. Each
employee in the group can see their own performance, as well as the performance of their peers
(i.e., public reporting). In the other four groups, the group leaders prepare the same information
but print the information of each employee’s performance on a separate note, and provide each
employee only with the note regarding his or her own performance. Employees can only see
their own performance, but cannot see the performance of their peers (i.e., private reporting).
One of the four groups (Group 3) switched from private to public reporting by the end of 2013,
because the group leader retired and the SOE appointed a new group leader. The old group
leader used to print employee performance on A4 paper, cut the paper into pieces, and provide
each employee with the piece containing his or her performance only. The new group leader
asks employees to pass the paper around the group without cutting it. To sum up, three of the
five groups (Groups 1, 2, and 4) in the department have adopted private reporting, one (Group
5) has adopted public reporting, and one (Group 3) has switched from private reporting to
public reporting2. Figure 2 illustrates the two types of performance reporting practices.
2 Most employees in the department entered into the organization in the late 1980s or early 1990s. Employees
were allocated into different groups by the department head when they first entered into the organization. The
reporting choice was made by the group leaders in later years. Therefore, the possibility that employees choose
to be allocated into certain reporting structure is very low.
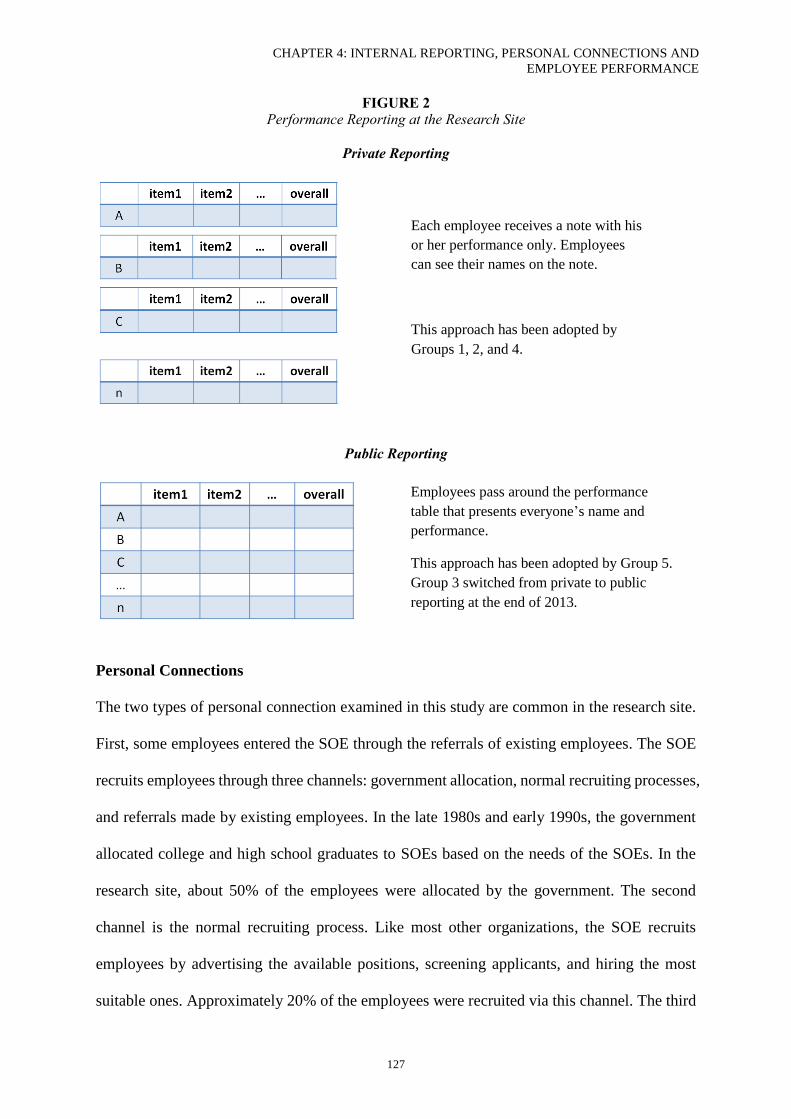
CHAPTER 4: INTERNAL REPORTING, PERSONAL CONNECTIONS AND
EMPLOYEE PERFORMANCE
127
FIGURE 2
Performance Reporting at the Research Site
Private Reporting
Public Reporting
Personal Connections
The two types of personal connection examined in this study are common in the research site.
First, some employees entered the SOE through the referrals of existing employees. The SOE
recruits employees through three channels: government allocation, normal recruiting processes,
and referrals made by existing employees. In the late 1980s and early 1990s, the government
allocated college and high school graduates to SOEs based on the needs of the SOEs. In the
research site, about 50% of the employees were allocated by the government. The second
channel is the normal recruiting process. Like most other organizations, the SOE recruits
employees by advertising the available positions, screening applicants, and hiring the most
suitable ones. Approximately 20% of the employees were recruited via this channel. The third
Each employee receives a note with his
or her performance only. Employees
can see their names on the note.
This approach has been adopted by
Groups 1, 2, and 4.
Employees pass around the performance
table that presents everyone’s name and
performance.
This approach has been adopted by Group 5.
Group 3 switched from private to public
reporting at the end of 2013.
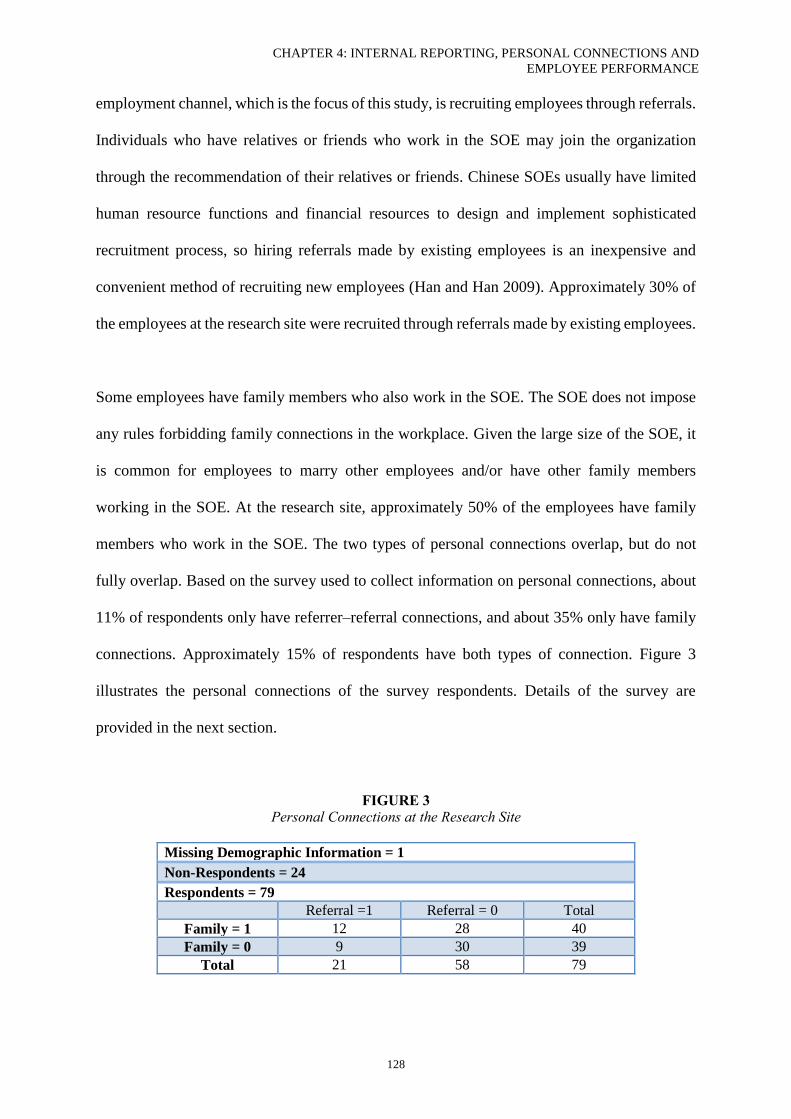
CHAPTER 4: INTERNAL REPORTING, PERSONAL CONNECTIONS AND
EMPLOYEE PERFORMANCE
128
employment channel, which is the focus of this study, is recruiting employees through referrals.
Individuals who have relatives or friends who work in the SOE may join the organization
through the recommendation of their relatives or friends. Chinese SOEs usually have limited
human resource functions and financial resources to design and implement sophisticated
recruitment process, so hiring referrals made by existing employees is an inexpensive and
convenient method of recruiting new employees (Han and Han 2009). Approximately 30% of
the employees at the research site were recruited through referrals made by existing employees.
Some employees have family members who also work in the SOE. The SOE does not impose
any rules forbidding family connections in the workplace. Given the large size of the SOE, it
is common for employees to marry other employees and/or have other family members
working in the SOE. At the research site, approximately 50% of the employees have family
members who work in the SOE. The two types of personal connections overlap, but do not
fully overlap. Based on the survey used to collect information on personal connections, about
11% of respondents only have referrer–referral connections, and about 35% only have family
connections. Approximately 15% of respondents have both types of connection. Figure 3
illustrates the personal connections of the survey respondents. Details of the survey are
provided in the next section.
FIGURE 3
Personal Connections at the Research Site
Missing Demographic Information = 1
Non-Respondents = 24
Respondents = 79
Referral =1 Referral = 0 Total
Family = 1 12 28 40
Family = 0 9 30 39
Total 21 58 79
CHAPTER 4: INTERNAL REPORTING, PERSONAL CONNECTIONS AND
EMPLOYEE PERFORMANCE
129
4.4 Method
Data and Sample
I collected archival and survey data to examine the research question. First, I extracted the
performance data from the database of the SOE. The SOE measures the individual performance
of employees at a monthly basis. The sample includes 146 employees and 5,422 performance
observations from January 2011 to July 2015. Second, I collected the demographic information
of the 146 employees from the personnel files of the SOE, including the employees’ gender,
birthday, hometown, education, political affiliation, and recruitment date. Employees’
demographic characteristics are time-invariant. Third, I administered a survey on May 2015 to
measure employees’ personal connections in the workplace. Panel A of Table 1 presents the
sample selection process. Among the 146 employees in the department, 79 responded to the
survey (54%), corresponding with 3,069 performance observations. Panel B compares the
demographic characteristics of respondents and non-respondents, and shows that respondents
and non-respondents are not significantly different.
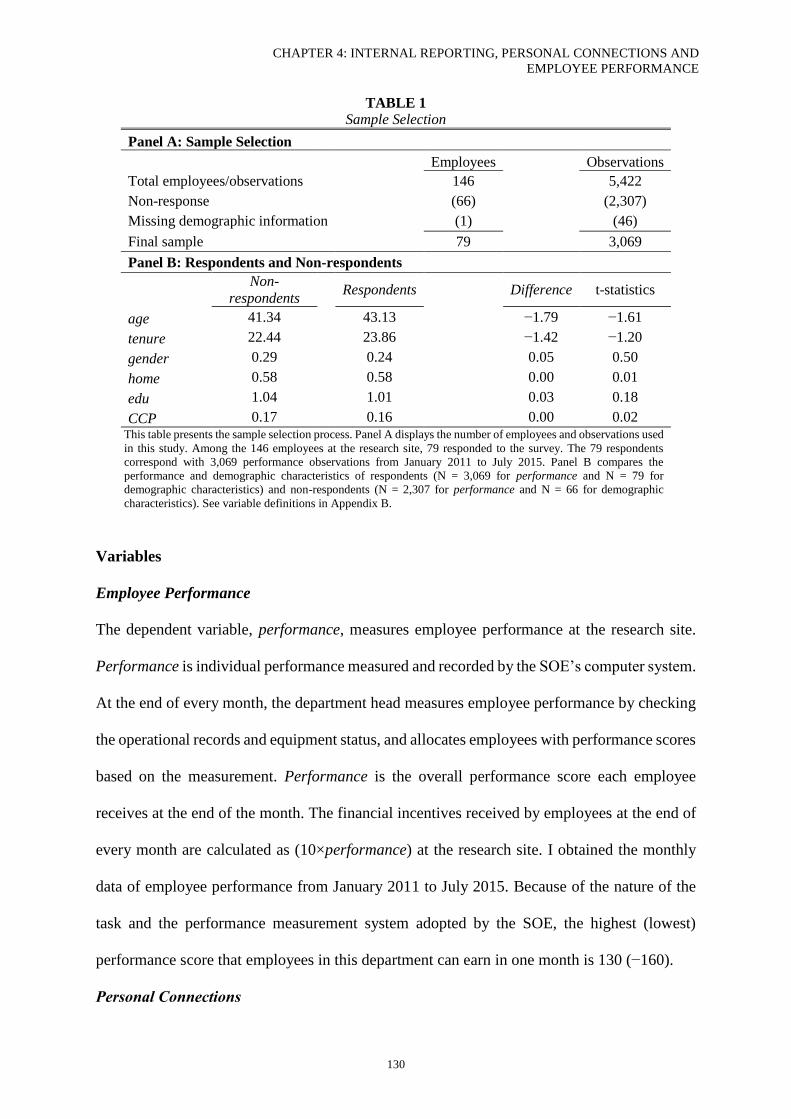
CHAPTER 4: INTERNAL REPORTING, PERSONAL CONNECTIONS AND
EMPLOYEE PERFORMANCE
130
TABLE 1
Sample Selection
Panel A: Sample Selection
Employees Observations
Total employees/observations 146 5,422
Non-response (66) (2,307)
Missing demographic information (1) (46)
Final sample 79 3,069
Panel B: Respondents and Non-respondents
Non-
respondents Respondents Difference t-statistics
age 41.34 43.13 −1.79 −1.61
tenure 22.44 23.86 −1.42 −1.20
gender 0.29 0.24 0.05 0.50
home 0.58 0.58 0.00 0.01
edu 1.04 1.01 0.03 0.18
CCP 0.17 0.16 0.00 0.02 This table presents the sample selection process. Panel A displays the number of employees and observations used
in this study. Among the 146 employees at the research site, 79 responded to the survey. The 79 respondents
correspond with 3,069 performance observations from January 2011 to July 2015. Panel B compares the
performance and demographic characteristics of respondents (N = 3,069 for performance and N = 79 for
demographic characteristics) and non-respondents (N = 2,307 for performance and N = 66 for demographic
characteristics). See variable definitions in Appendix B.
Variables
Employee Performance
The dependent variable, performance, measures employee performance at the research site.
Performance is individual performance measured and recorded by the SOE’s computer system.
At the end of every month, the department head measures employee performance by checking
the operational records and equipment status, and allocates employees with performance scores
based on the measurement. Performance is the overall performance score each employee
receives at the end of the month. The financial incentives received by employees at the end of
every month are calculated as (10×performance) at the research site. I obtained the monthly
data of employee performance from January 2011 to July 2015. Because of the nature of the
task and the performance measurement system adopted by the SOE, the highest (lowest)
performance score that employees in this department can earn in one month is 130 (−160).
Personal Connections
CHAPTER 4: INTERNAL REPORTING, PERSONAL CONNECTIONS AND
EMPLOYEE PERFORMANCE
131
I use survey questions to capture the personal connections in the research site. The survey
collects information of employees’ group identity as well as background information, such as
how they entered into the SOE and whether they have any personal connections in the SOE.
The survey questions are presented in Appendix A.
I construct an indicator, connection, to indicate employees who have personal connections in
the SOE. Connection equals 1 for employees who have referrals or/and family members in the
SOE, and 0 for employees without any of these connections. The referrer–referral connection,
referral, is measured using two questions in the survey: “How did you enter into the SOE? (1
= through government allocation = 1; 2 = through another channel)” and “Did you know any
existing employee(s) in the SOE before your entry? (1 = Yes; 2 = No)”. Referral equals 1 if
employees’ answer to the first question is 2 and their answer to the second question is 1; and 0
otherwise. In other words, referral indicates respondents who were not allocated by the
government and had connections with existing employees prior to their entry. It is a noisy proxy
for the referral–referrer connection, as some employees might have personal connections but
entered the SOE through the normal recruitment process instead of their personal connections.
The reason I measure this variable indirectly using the two questions is because, according to
the managers of the SOE, it is too sensitive to ask employees whether they were introduced
into the organization by existing employees. Because of the Chinese social norms (Luo 2007),
referrals usually give their referrers material gifts to return the favor and show their thanks.
The referrals may be reluctant to directly tell a third party that they entered the organization
through personal connections, to avoid being perceived as unethical and/or incompetent. To
increase the response rate and the accuracy of the responses, I use the two questions to
indirectly capture the referral–referrer connection of the respondents.
CHAPTER 4: INTERNAL REPORTING, PERSONAL CONNECTIONS AND
EMPLOYEE PERFORMANCE
132
The family connection, family, is an indicator for employees with family members who also
worked in the SOE at the time the survey was administered. Information for this variable is
captured by one question in the survey: “Do you have family members who also work in the
SOE (1 = YES, I do have a family member[s] who also works in the SOE; 2 = I used to have a
family member[s] who worked in the SOE, but they have retired or left; 3 = I have never had
any family member who works in the SOE)”. Family equals 1 for respondents whose answer
is 1, or 0 otherwise.
Internal Performance Reporting
I first examine how public reporting is related to the performance of employees with and
without personal connections using cross-sectional analysis. I measure the internal
performance reporting choice in the research site using reporting. Reporting is an indicator for
observations in groups with public reporting. That is, reporting equals 1 for observations in
Group 3 after 2013 and all observations in Group 5, and 0 for all other observations. Previous
studies find that public reporting motivates employees to demonstrate high performance to
maintain a positive self-image, which means a positive association between reporting and
performance (Hannan et al. 2013; Tafkov 2012). I examine whether this link is enhanced by
employees’ personal connections.
I also conduct change analysis by examining how employees in Group 3 react to the change
from private to public reporting. This change occurred at the end of 2013. Therefore, I use
post2013 to indicate observations after the change, and use Group3 to indicate employees in
Group 3. The interaction between the two indicators (post2013×Group3) thus captures any
change experienced by employees in Group 3, with employees in the other groups as control.
CHAPTER 4: INTERNAL REPORTING, PERSONAL CONNECTIONS AND
EMPLOYEE PERFORMANCE
133
I expect that, after controlling for the group fixed effects and time fixed effects, the relation
between performance and post2013×Group3 will be more positive for employees with personal
connections than for those without.
Control Variables
To minimize any bias in estimates as a result of omitted variables, I control for the following
variables that may affect employee performance. The first control variable is level, which is a
proxy for employee ability. Every three years, the SOE holds an exam testing employees’
operational skills. The exam is compulsory for employees, and their exam results are used by
the SOE to determine their skill level (0 = none, 1 = low, 2 = medium, 3 = high). I also control
for tenure, which is the number of years that employees have been working in the SOE.
Previous research finds that tenure may affect employee performance through work
experiences and organization commitment (Wright and Bonett 2002). 3 The next control
variable is horizon, which equals 1 for male workers over 49 and female workers over 44. The
SOE’s policy specifies that male (female) workers can retire at 50 (45). Employees may have
lower motivation when approaching retirement. Further, I also control for gender, an indicator
for female employees. As the tasks at the research site involve operating heavy machine and
most employees in the research site are male, gender may affect employee performance both
physically and psychologically (Gardiner and Tiggemann 1999). The next control variable is
home, which is 1 for employees who came from the city where the SOE is located, or 0 for
those who came from elsewhere. As the SOE is the principal driver of the local economy,
employees from the local area may be motivated to work hard and contribute to the economy
of their hometown. I also control for the level of education that employees received (edu).
3 The Variance Inflation Factor (VIF) test indicates that the time that employees have been working in the SOE
(tenure) is highly correlated with their age (age) and is likely to introduce the multicollinearity problem into the
regression estimations. Therefore, I use Age to describe the sample but drop it in the empirical models.
CHAPTER 4: INTERNAL REPORTING, PERSONAL CONNECTIONS AND
EMPLOYEE PERFORMANCE
134
Employees with a higher education level may have received more training and have a higher
ability to perform their tasks. The next control variable is CCP, which is a dummy variable
indicating employees who have joined the Chinese Communist Party. Previous research
indicates that when the goals and beliefs of employees are congruent with those of their
organizations, employees tend to have higher motivation and better performance (Rich, Lepine,
and Crawford 2010). As the research site is state-owned, the political affiliation of employees
may affect their motivation and performance. Finally, I control for employees’ group identity
(identity), the extent to which employees consider themselves part of their group (Akerlof and
Kranton 2003, 2010; Bergami and Bagozzi 2000; Boivie, Lange, McDonald, and Westphal
2011; Mael and Ashforth 1992). As found in the first essay of this dissertation, group identity
affects the way employees evaluate themselves and their reaction to internal performance
reporting. Appendix B provides definitions for the variables.
When estimating the empirical models, I also control for the time fixed effects and the group
fixed effects. The time fixed effects captured any unobservable effects that influence all
employees during the sample period, and the group fixed effects capture the effects of any
unobservable group features. I also correct standard errors for clustering at employee level in
all estimations.
Empirical Models
Cross-sectional Analysis
As explained in the research site section, three of the groups adopt private reporting while the
other two adopt public reporting. The cross-sectional analysis uses performance observations
of all five groups, during the period from January 2011 to July 2015. I examine the joint effects
of reporting and connection on employee performance using the following equation:
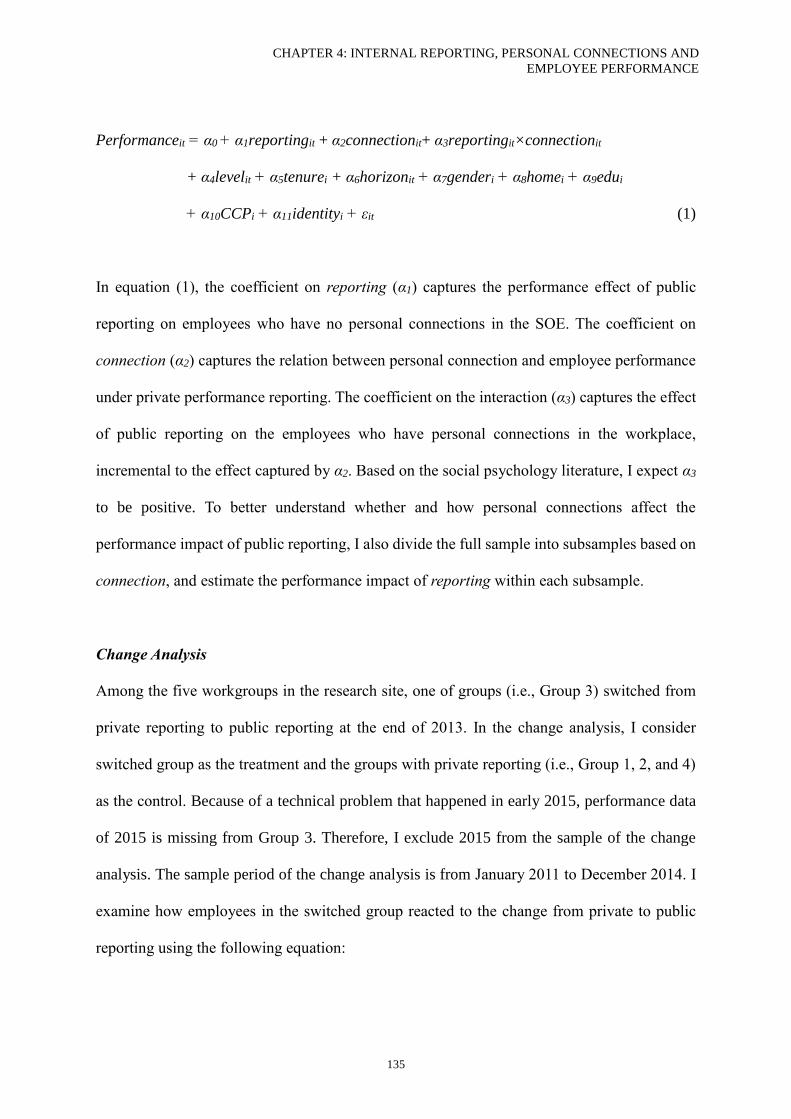
CHAPTER 4: INTERNAL REPORTING, PERSONAL CONNECTIONS AND
EMPLOYEE PERFORMANCE
135
Performanceit = α0 + α1reportingit + α2connectionit+ α3reportingit×connectionit
+ α4levelit + α5tenurei + α6horizonit + α7genderi + α8homei + α9edui
+ α10CCPi + α11identityi + εit (1)
In equation (1), the coefficient on reporting (α1) captures the performance effect of public
reporting on employees who have no personal connections in the SOE. The coefficient on
connection (α2) captures the relation between personal connection and employee performance
under private performance reporting. The coefficient on the interaction (α3) captures the effect
of public reporting on the employees who have personal connections in the workplace,
incremental to the effect captured by α2. Based on the social psychology literature, I expect α3
to be positive. To better understand whether and how personal connections affect the
performance impact of public reporting, I also divide the full sample into subsamples based on
connection, and estimate the performance impact of reporting within each subsample.
Change Analysis
Among the five workgroups in the research site, one of groups (i.e., Group 3) switched from
private reporting to public reporting at the end of 2013. In the change analysis, I consider
switched group as the treatment and the groups with private reporting (i.e., Group 1, 2, and 4)
as the control. Because of a technical problem that happened in early 2015, performance data
of 2015 is missing from Group 3. Therefore, I exclude 2015 from the sample of the change
analysis. The sample period of the change analysis is from January 2011 to December 2014. I
examine how employees in the switched group reacted to the change from private to public
reporting using the following equation:
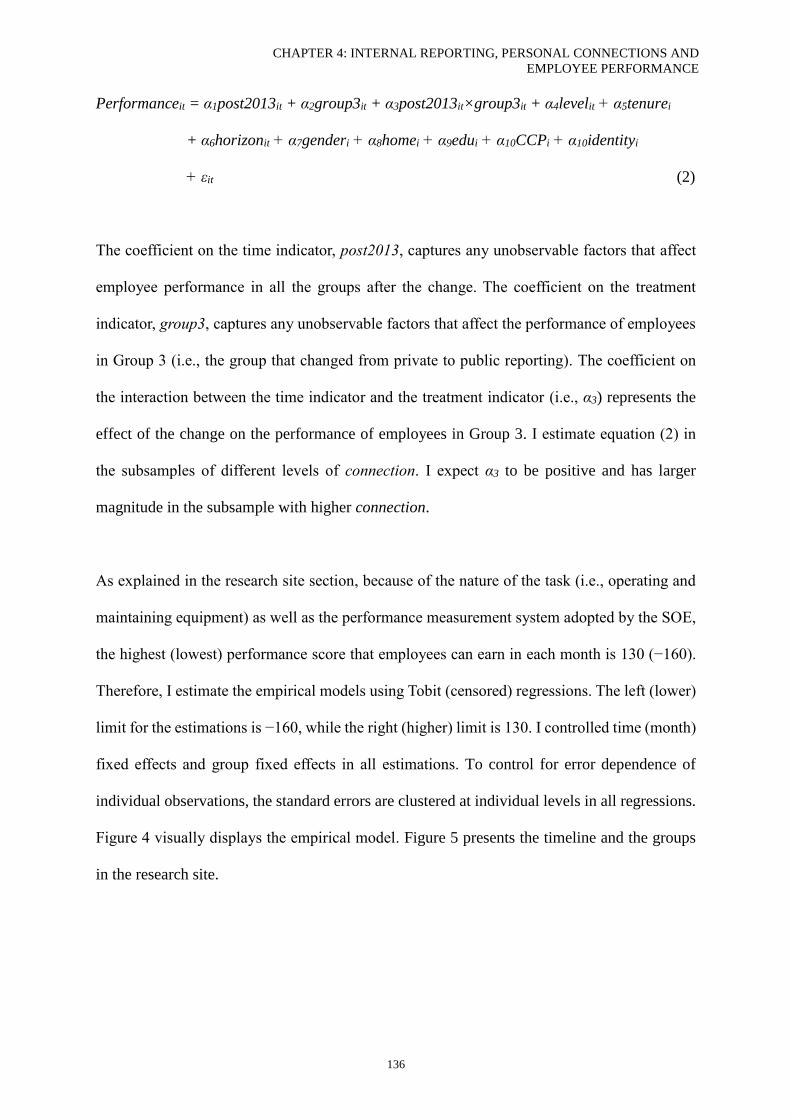
CHAPTER 4: INTERNAL REPORTING, PERSONAL CONNECTIONS AND
EMPLOYEE PERFORMANCE
136
Performanceit = α1post2013it + α2group3it + α3post2013it×group3it + α4levelit + α5tenurei
+ α6horizonit + α7genderi + α8homei + α9edui + α10CCPi + α10identityi
+ εit (2)
The coefficient on the time indicator, post2013, captures any unobservable factors that affect
employee performance in all the groups after the change. The coefficient on the treatment
indicator, group3, captures any unobservable factors that affect the performance of employees
in Group 3 (i.e., the group that changed from private to public reporting). The coefficient on
the interaction between the time indicator and the treatment indicator (i.e., α3) represents the
effect of the change on the performance of employees in Group 3. I estimate equation (2) in
the subsamples of different levels of connection. I expect α3 to be positive and has larger
magnitude in the subsample with higher connection.
As explained in the research site section, because of the nature of the task (i.e., operating and
maintaining equipment) as well as the performance measurement system adopted by the SOE,
the highest (lowest) performance score that employees can earn in each month is 130 (−160).
Therefore, I estimate the empirical models using Tobit (censored) regressions. The left (lower)
limit for the estimations is −160, while the right (higher) limit is 130. I controlled time (month)
fixed effects and group fixed effects in all estimations. To control for error dependence of
individual observations, the standard errors are clustered at individual levels in all regressions.
Figure 4 visually displays the empirical model. Figure 5 presents the timeline and the groups
in the research site.
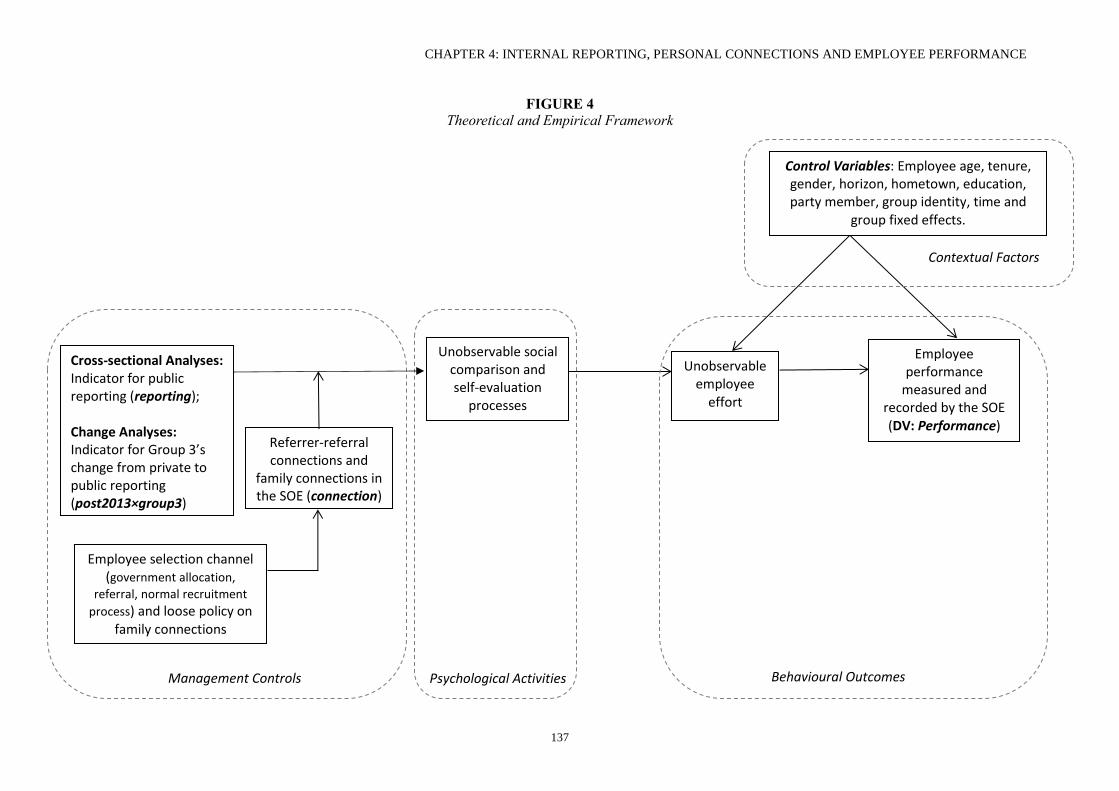
CHAPTER 4: INTERNAL REPORTING, PERSONAL CONNECTIONS AND EMPLOYEE PERFORMANCE
137
FIGURE 4
Theoretical and Empirical Framework
Cross-sectional Analyses: Indicator for public reporting (reporting); Change Analyses: Indicator for Group 3’s change from private to public reporting (post2013×group3)
Unobservable social comparison and self-evaluation
processes
Unobservable employee
effort
Employee performance
measured and recorded by the SOE (DV: Performance)
Employee selection channel (government allocation,
referral, normal recruitment
process) and loose policy on family connections
Referrer-referral connections and
family connections in the SOE (connection)
Control Variables: Employee age, tenure, gender, horizon, hometown, education, party member, group identity, time and
group fixed effects.
Contextual Factors
Management Controls Psychological Activities Behavioural Outcomes
CHAPTER 4: INTERNAL REPORTING, PERSONAL CONNECTIONS AND EMPLOYEE PERFORMANCE
138
FIGURE 5
Timeline and Groups
Groups in the Research Site
Performance Reporting Transparency
Department of this
study
(146 employees, 79
responded the survey)
2011 2012 2013 2014 2015 Overall
Group 1 private private private private private Private
Group 2 private private private private private Private
Group 3 private private private public public Switched
Group 4 private private private private private Private
Group 5 public public public public public Public
Jan. 2011
Sample period begins
Private reporting used in
Groups 1, 2, 3, and 4;
Public reporting used in
Group 5.
Jul. 2015
Sample period ends
Private reporting used in
Groups 1, 2, and 4;
Public reporting used in
Groups 3 and 5.
Deadline of Survey
Response
01-Jun-2015
1 May 2015
Survey sent
Dec. 2013
Group 3 changed from private
to public reporting
CHAPTER 4: INTERNAL REPORTING, PERSONAL CONNECTIONS AND
EMPLOYEE PERFORMANCE
139
4.5 Results
Descriptive Statistics
Table 2 presents the descriptive statistics of employee performance and demographic
characteristics. Specifically, the mean of performance is 25.70, meaning that, on average, the
performance score received by employees is 25.70 and the financial incentives they received
is 257.0 Chinese yuan. The maximum (minimum) score that employees received during the
sample period is 115.50 (−111.90), and the standard deviation is 19.90. The mean of connection
is 0.62. Based on Figure 3, 38% of employees (N = 30) have no referrers or family members
in the SOE; 47% of employees have either referrers (N = 9) or family members (N = 28) in the
SOE. The remaining 15% (N = 12) have both referrers and family members.
By July 2015, the average skill level of employees is 1.68, which is between the low (= 1) and
medium (= 2) levels set by the SOE. The mean (median) age of the employees is 43.13 (43.51)
years old, and the mean (median) of tenure is 23.86 (25.39) years. The age and tenure indicate
that most employees entered the SOE during the late 1980s and early 1990s. The difference
between the average age and the average tenure is only 19 years, because most employees
entered the company immediately after graduating from high school or vocational school, and
they choose to stay in the company until retirement. In the sample, 24% of the employees are
female, and 58% came from the city in which the SOE is located. Most employees graduated
from senior high school or vocational school, and 16% have joined the Chinese Communist
Party. Twenty-seven percent of employees entered the SOE through their personal connections,
and 51% have family connections in the SOE. Employees’ group identity (i.e. identity) is a
latent variable generated using nine survey questions (Bergami and Bagozzi 2000; Boivie et al.
2011; Mael and Ashforth 1992). The mean (median) of identity is 0.10, while the minimum
(maximum) is −1.51 (1.54).
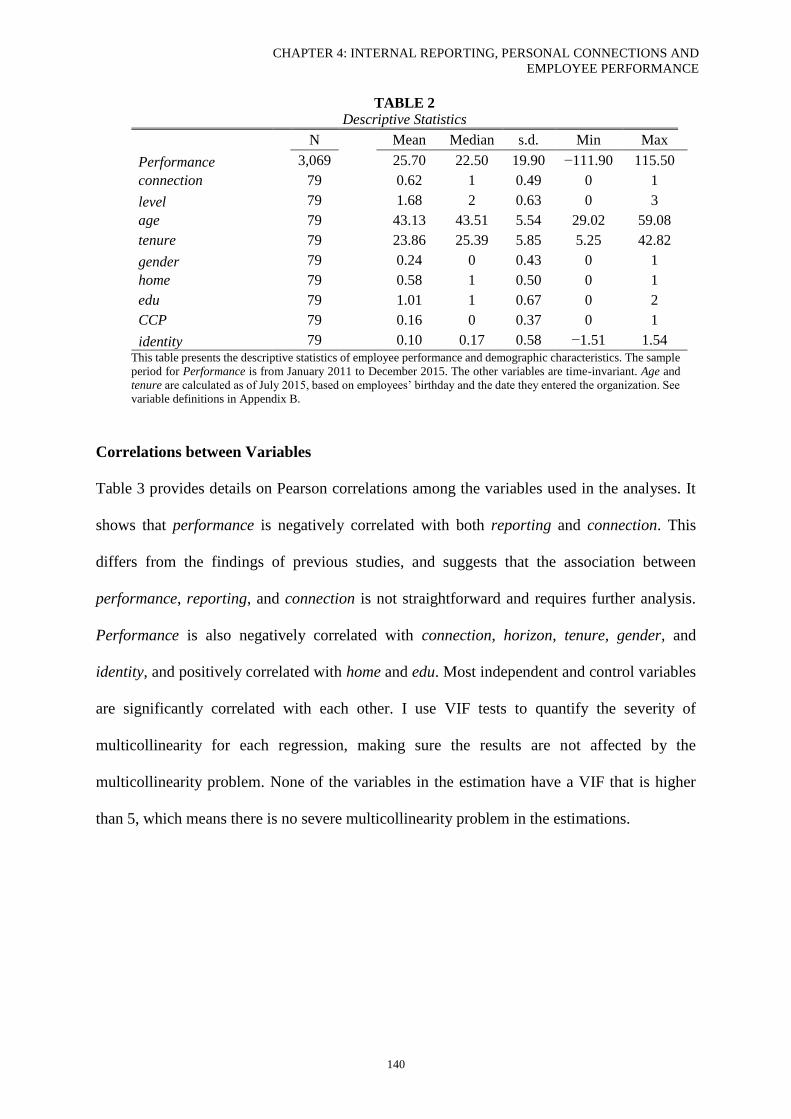
CHAPTER 4: INTERNAL REPORTING, PERSONAL CONNECTIONS AND
EMPLOYEE PERFORMANCE
140
TABLE 2
Descriptive Statistics
N Mean Median s.d. Min Max
Performance 3,069 25.70 22.50 19.90 −111.90 115.50
connection 79 0.62 1 0.49 0 1
level 79 1.68 2 0.63 0 3
age 79 43.13 43.51 5.54 29.02 59.08
tenure 79 23.86 25.39 5.85 5.25 42.82
gender 79 0.24 0 0.43 0 1
home 79 0.58 1 0.50 0 1
edu 79 1.01 1 0.67 0 2
CCP 79 0.16 0 0.37 0 1
identity 79 0.10 0.17 0.58 −1.51 1.54
This table presents the descriptive statistics of employee performance and demographic characteristics. The sample
period for Performance is from January 2011 to December 2015. The other variables are time-invariant. Age and
tenure are calculated as of July 2015, based on employees’ birthday and the date they entered the organization. See
variable definitions in Appendix B.
Correlations between Variables
Table 3 provides details on Pearson correlations among the variables used in the analyses. It
shows that performance is negatively correlated with both reporting and connection. This
differs from the findings of previous studies, and suggests that the association between
performance, reporting, and connection is not straightforward and requires further analysis.
Performance is also negatively correlated with connection, horizon, tenure, gender, and
identity, and positively correlated with home and edu. Most independent and control variables
are significantly correlated with each other. I use VIF tests to quantify the severity of
multicollinearity for each regression, making sure the results are not affected by the
multicollinearity problem. None of the variables in the estimation have a VIF that is higher
than 5, which means there is no severe multicollinearity problem in the estimations.
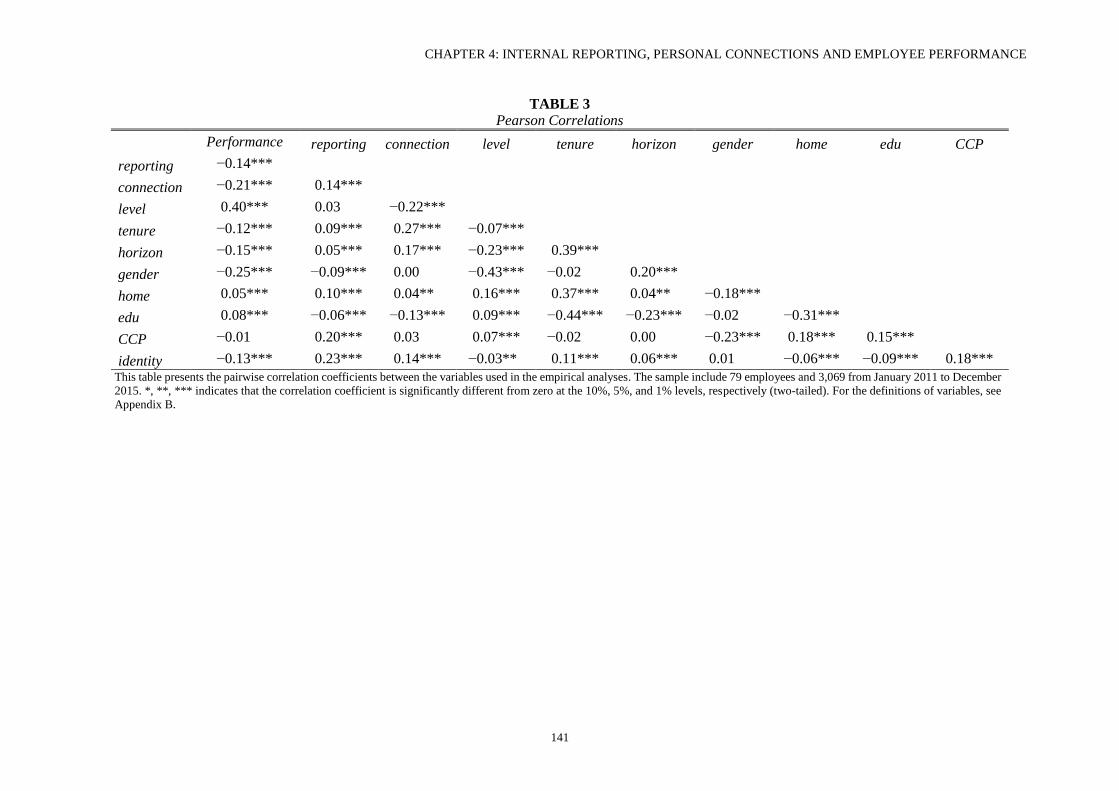
CHAPTER 4: INTERNAL REPORTING, PERSONAL CONNECTIONS AND EMPLOYEE PERFORMANCE
141
TABLE 3
Pearson Correlations
Performance reporting connection level tenure horizon gender home edu CCP
reporting −0.14***
connection −0.21*** 0.14***
level 0.40*** 0.03*** −0.22***
tenure −0.12*** 0.09*** 0.27*** −0.07***
horizon −0.15*** 0.05*** 0.17*** −0.23*** 0.39***
gender −0.25*** −0.09*** 0.00*** −0.43*** −0.02*** 0.20***
home 0.05*** 0.10*** 0.04*** 0.16*** 0.37*** 0.04*** −0.18***
edu 0.08*** −0.06*** −0.13*** 0.09*** −0.44*** −0.23*** −0.02*** −0.31***
CCP −0.01*** 0.20*** 0.03*** 0.07*** −0.02*** 0.00*** −0.23*** 0.18*** 0.15***
identity −0.13*** 0.23*** 0.14*** −0.03*** 0.11*** 0.06*** 0.01*** −0.06*** −0.09*** 0.18***
This table presents the pairwise correlation coefficients between the variables used in the empirical analyses. The sample include 79 employees and 3,069 from January 2011 to December
2015. *, **, *** indicates that the correlation coefficient is significantly different from zero at the 10%, 5%, and 1% levels, respectively (two-tailed). For the definitions of variables, see
Appendix B.
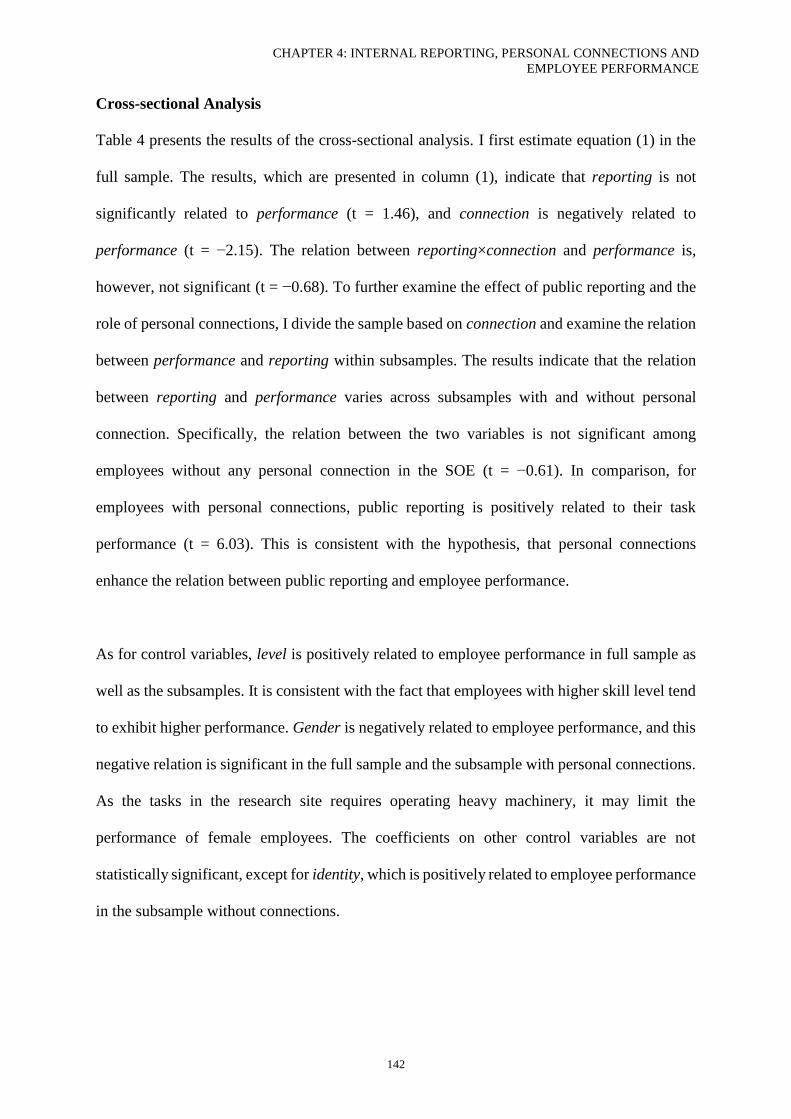
CHAPTER 4: INTERNAL REPORTING, PERSONAL CONNECTIONS AND
EMPLOYEE PERFORMANCE
142
Cross-sectional Analysis
Table 4 presents the results of the cross-sectional analysis. I first estimate equation (1) in the
full sample. The results, which are presented in column (1), indicate that reporting is not
significantly related to performance (t = 1.46), and connection is negatively related to
performance (t = −2.15). The relation between reporting×connection and performance is,
however, not significant (t = −0.68). To further examine the effect of public reporting and the
role of personal connections, I divide the sample based on connection and examine the relation
between performance and reporting within subsamples. The results indicate that the relation
between reporting and performance varies across subsamples with and without personal
connection. Specifically, the relation between the two variables is not significant among
employees without any personal connection in the SOE (t = −0.61). In comparison, for
employees with personal connections, public reporting is positively related to their task
performance (t = 6.03). This is consistent with the hypothesis, that personal connections
enhance the relation between public reporting and employee performance.
As for control variables, level is positively related to employee performance in full sample as
well as the subsamples. It is consistent with the fact that employees with higher skill level tend
to exhibit higher performance. Gender is negatively related to employee performance, and this
negative relation is significant in the full sample and the subsample with personal connections.
As the tasks in the research site requires operating heavy machinery, it may limit the
performance of female employees. The coefficients on other control variables are not
statistically significant, except for identity, which is positively related to employee performance
in the subsample without connections.
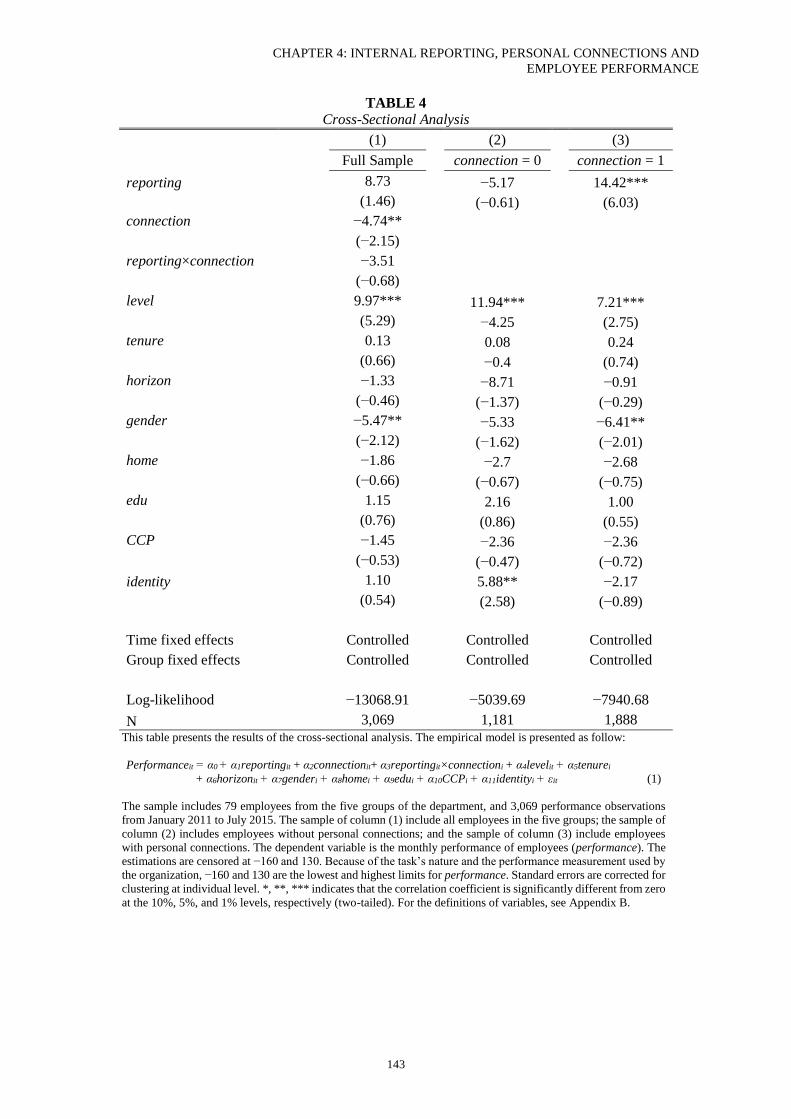
CHAPTER 4: INTERNAL REPORTING, PERSONAL CONNECTIONS AND
EMPLOYEE PERFORMANCE
143
TABLE 4
Cross-Sectional Analysis (1) (2) (3)
Full Sample connection = 0 connection = 1
reporting 8.73 −5.17 14.42*** (1.46) (−0.61) (6.03)
connection −4.74** (−2.15)
reporting×connection −3.51 (−0.68)
level 9.97*** 11.94*** 7.21*** (5.29) −4.25 (2.75)
tenure 0.13 0.08 0.24 (0.66) −0.4 (0.74)
horizon −1.33 −8.71 −0.91 (−0.46) (−1.37) (−0.29)
gender −5.47** −5.33 −6.41** (−2.12) (−1.62) (−2.01)
home −1.86 −2.7 −2.68 (−0.66) (−0.67) (−0.75)
edu 1.15 2.16 1.00 (0.76) (0.86) (0.55)
CCP −1.45 −2.36 −2.36 (−0.53) (−0.47) (−0.72)
identity 1.10 5.88** −2.17
(0.54) (2.58) (−0.89)
Time fixed effects Controlled Controlled Controlled
Group fixed effects Controlled Controlled Controlled
Log-likelihood −13068.91 −5039.69 −7940.68
N 3,069 1,181 1,888
This table presents the results of the cross-sectional analysis. The empirical model is presented as follow:
Performanceit = α0 + α1reportingit + α2connectionit+ α3reportingit×connectioni + α4levelit + α5tenurei
+ α6horizonit + α7genderi + α8homei + α9edui + α10CCPi + α11identityi + εit (1)
The sample includes 79 employees from the five groups of the department, and 3,069 performance observations
from January 2011 to July 2015. The sample of column (1) include all employees in the five groups; the sample of
column (2) includes employees without personal connections; and the sample of column (3) include employees
with personal connections. The dependent variable is the monthly performance of employees (performance). The
estimations are censored at −160 and 130. Because of the task’s nature and the performance measurement used by
the organization, −160 and 130 are the lowest and highest limits for performance. Standard errors are corrected for
clustering at individual level. *, **, *** indicates that the correlation coefficient is significantly different from zero
at the 10%, 5%, and 1% levels, respectively (two-tailed). For the definitions of variables, see Appendix B.
CHAPTER 4: INTERNAL REPORTING, PERSONAL CONNECTIONS AND
EMPLOYEE PERFORMANCE
144
Change Analysis
Table 5 presents the results of the change analysis, which are consistent with the results of the
cross-sectional analysis. Specifically, Group 3’s change from private reporting to public
reporting has no significant effect on employee performance in the full sample (t = 0.92). After
dividing the sample based on connection, I find that the change has a significant and positive
effect on employees with personal connections (t = 4.44). However, it has no significant effect
on employees without personal connections (t = −0.57).
In terms of control variables, level is positively related to employee performance in full sample
as well as the subsamples. It is consistent with the fact that employees with higher skill level
tend to exhibit higher performance. Gender is negatively related to employee performance, and
this negative relation is significant in the full sample and the subsample with personal
connections. As the tasks in the research site requires operating heavy machinery, it may limit
the performance of female employees. The coefficients on the other control variables are not
consistently significant across the estimations.
CHAPTER 4: INTERNAL REPORTING, PERSONAL CONNECTIONS AND
EMPLOYEE PERFORMANCE
145
TABLE 5
Change Analysis
(1) (2) (3)
Full Sample connection=0 connection=1
post2013 5.70* 6.51 4.77
(1.72) (1.01) (1.40)
group3 −1.00 4.96 −0.08
(−0.19) (0.38) (−0.01)
post2013×group3 4.04 −6.30 10.89*** (0.92) (−0.57) (4.44)
level 12.10*** 14.27*** 5.99** (4.86) (5.50) (2.07)
tenure −0.05 0.25 −0.12
(−0.24) (1.15) (−0.41)
horizon −3.55 −17.34 −0.04 (−0.97) (−1.41) (−0.01)
gender −1.96 −2.32 −3.55 (−0.78) (−0.83) (−1.12)
home −2.96 −7.66* 0.98 (−0.91) (−1.91) (0.31)
edu 0.52 −0.02 2.54 (0.32) (−0.01) (1.21)
CCP 1.92 2.15 0.69 (0.56) (0.22) (0.30)
identity 1.51 9.16** 0.65
(0.54) (2.15) (0.25)
Time fixed effects* Controlled Controlled Controlled
Group fixed effects* Controlled Controlled Controlled
Log-likelihood −7914.97 −3312.01 −4471.92
N 1,896 782 1,114
This table presents the results of the change analysis. The empirical model is presented as follow:
Performanceit = α1post2013it + α2group3it + α3post2013it×group3it + α4levelit + α5tenurei + α6horizonit
+ α7genderi + α8homei + α9edui + α10CCPi + α10identityi + εit (2)
The sample period is from January 2011 to December 2014, as the performance data of 2015 is missing in Group
3. Group 3 changed from private to public reporting at the end of 2013. The sample includes observations of
Group 3 (i.e., treatment) and observations of Groups 1, 2, and 4 (i.e., control). The sample of column (1) include
all employees in control and treatment; the sample of column (2) includes employees without personal
connections; and the sample of column (3) include employees with personal connections. The dependent variable
is the monthly performance of employees (i.e., performance). The estimations are censored at −160 and 130, as a
result of the task nature and the performance measurement used by the organization. Standard errors are clustered
at individual level. *, **, *** indicates that the correlation coefficient is significantly different from zero at the
10%, 5%, and 1% levels, respectively (two-tailed). For the definitions of variables, see Appendix B.
* Some of the time and group indicators were dropped because of collinearity, as the model has already included
the indictor for the post-change period (post2013) and the indicator for the change group (group3).
CHAPTER 4: INTERNAL REPORTING, PERSONAL CONNECTIONS AND
EMPLOYEE PERFORMANCE
146
Overall, the results presented in Tables 4 and 5 indicate that public reporting positively affects
the performance of employees with personal connections in the workplace. However, it has no
significant effect on employees without personal connections. These results are consistent with
the argument that personal connections enhance the performance effect of public reporting. To
better interpret these findings, I conduct additional analyses on high and low performers, as
well as different types of connection.
Additional Analyses
High and Low Performers
In the additional analyses, I first examine whether public reporting affects high and low
performers differently. High and low performers may have different concerns for their self-
image: low performers may be more concerned about their self-image and work harder to avoid
“looking worse” than their peers. Low performers also have more “room” to improve their
performance than high performers do and may thus react more positively to public reporting,
which may confound with the effect of personal connections. As connection is negatively
related to performance in the Pearson correlations and the main tests, employees with personal
connections are more likely to be low performers. The reason that they react more positively
to public reporting may be because they are low performers, but not because they have personal
connections. Examining high and low performers separately helps clarify this issue and
facilitates better understanding of the main results.
I classify employees as high and low performers based on the skill level of employees. The
SOE holds a skill exam every three years to assess the operational skills of employees, and
assigns each employee a skill level based on their exam results. The skill level spans from 0 to
CHAPTER 4: INTERNAL REPORTING, PERSONAL CONNECTIONS AND
EMPLOYEE PERFORMANCE
147
3 (0 = none, 1 = low, 2 = medium, 3 = high). The skill level reflects employees’ ability in
choosing the appropriate actions in different conditions, and is positively related to employee
performance (as shown in Tables 4 and 5). In this study, I classify employees as low performers
if their skill level equals 0 or 1, and as high performers if their skill level equals 2 or 3.
The results of the cross-sectional analysis are presented in Panel A of Table 6. It shows that
public reporting positively affects low performers, regardless of their personal connections.
Specifically, public reporting has a significant and positive performance effect on low
performers without personal connections (t = 3.90), as well as low performers with personal
connections (t = 5.29). As for high performers, public reporting has no significant effect on
those without personal connections (t = −0.37). However, it positively affects high performers
with personal connections (t = 4.29).
The change analysis demonstrates similar results. Panel B of Table 6 indicates that the change
from private to public reporting in Group 3 is positively associated with the performance of
low performers, regardless of their personal connections. In comparison, for high performers,
the change is only positively associated with the performance of those with personal
connections (t = 2.60), but not significantly related to the performance of those without
personal connections (t = −0.37). Overall, the analyses of high and low performers indicate that
public reporting is positively associated with the performance of employees who have personal
connections in the workplace, regardless of whether they are low or high performers. These
results further support the hypothesis that personal connections enhance the performance effect
of public reporting.
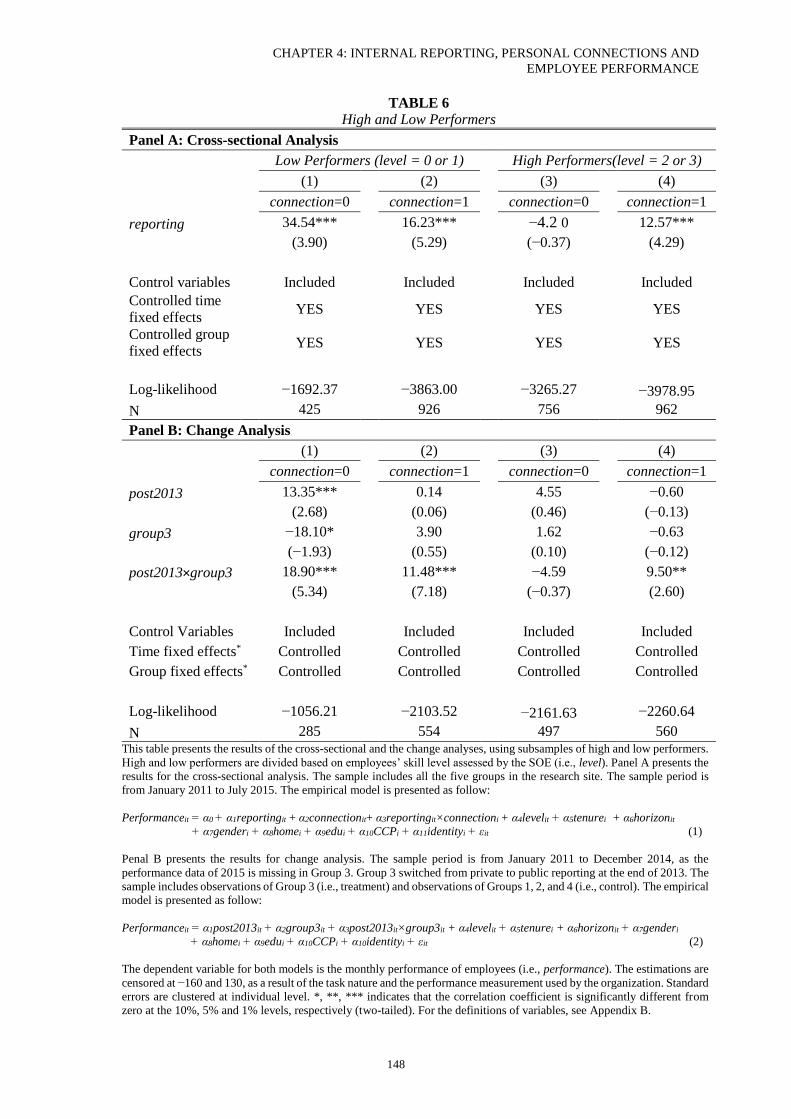
CHAPTER 4: INTERNAL REPORTING, PERSONAL CONNECTIONS AND
EMPLOYEE PERFORMANCE
148
TABLE 6
High and Low Performers
Panel A: Cross-sectional Analysis Low Performers (level = 0 or 1) High Performers(level = 2 or 3)
(1) (2) (3) (4)
connection=0 connection=1 connection=0 connection=1
reporting 34.54*** 16.23*** −4.2 0 12.57*** (3.90) (5.29) (−0.37) (4.29)
Control variables Included Included Included Included
Controlled time
fixed effects YES YES YES
YES
Controlled group
fixed effects YES YES YES
YES
Log-likelihood −1692.37 −3863.00 −3265.27 −3978.95
N 425 926 756 962
Panel B: Change Analysis
(1) (2) (3) (4)
connection=0 connection=1 connection=0 connection=1
post2013 13.35*** 0.14 4.55 −0.60
(2.68) (0.06) (0.46) (−0.13)
group3 −18.10* 3.90 1.62 −0.63
(−1.93) (0.55) (0.10) (−0.12)
post2013×group3 18.90*** 11.48*** −4.59 9.50** (5.34) (7.18) (−0.37) (2.60)
Control Variables Included Included Included Included
Time fixed effects* Controlled Controlled Controlled Controlled
Group fixed effects* Controlled Controlled Controlled Controlled
Log-likelihood −1056.21 −2103.52 −2161.63 −2260.64
N 285 554 497 560 This table presents the results of the cross-sectional and the change analyses, using subsamples of high and low performers.
High and low performers are divided based on employees’ skill level assessed by the SOE (i.e., level). Panel A presents the
results for the cross-sectional analysis. The sample includes all the five groups in the research site. The sample period is
from January 2011 to July 2015. The empirical model is presented as follow:
Performanceit = α0 + α1reportingit + α2connectionit+ α3reportingit×connectioni + α4levelit + α5tenurei + α6horizonit
+ α7genderi + α8homei + α9edui + α10CCPi + α11identityi + εit (1)
Penal B presents the results for change analysis. The sample period is from January 2011 to December 2014, as the
performance data of 2015 is missing in Group 3. Group 3 switched from private to public reporting at the end of 2013. The
sample includes observations of Group 3 (i.e., treatment) and observations of Groups 1, 2, and 4 (i.e., control). The empirical
model is presented as follow:
Performanceit = α1post2013it + α2group3it + α3post2013it×group3it + α4levelit + α5tenurei + α6horizonit + α7genderi
+ α8homei + α9edui + α10CCPi + α10identityi + εit (2)
The dependent variable for both models is the monthly performance of employees (i.e., performance). The estimations are
censored at −160 and 130, as a result of the task nature and the performance measurement used by the organization. Standard
errors are clustered at individual level. *, **, *** indicates that the correlation coefficient is significantly different from
zero at the 10%, 5% and 1% levels, respectively (two-tailed). For the definitions of variables, see Appendix B.
CHAPTER 4: INTERNAL REPORTING, PERSONAL CONNECTIONS AND
EMPLOYEE PERFORMANCE
149
* Some of the time and group indicators were dropped because of collinearity, as the model has already included the indictor
for the post-change period (post2013) and the indicator for the change group (group3).
Types of Connections
In Table 7, I examine the referrer–referral connection and the family connection separately. In
particular, I examine the relation between public reporting and employee performance in three
subsamples: employees with referrer–referral connection only, employees with family
connection only, and employees with both types of connections. Panel A presents the results
of the cross-sectional analysis. Columns (1)–(3) indicate that the relation between public
reporting and employee performance is significantly positive in all three subsamples. However,
this relation is less positive in the subsample with only family connection than in the other two
subsamples. The change analysis documents similar results, which are presented in Panel B. It
shows that the change from private to public reporting is positively associated with the
performance of those with referrer–referral connections and with both types of connections.
However, it is not significantly associated with the performance of the employees with family
connections only. Overall, the results presented in Table 7 indicate that the referrer–referral
connection is more effective in enhancing the relation between public reporting and
performance than the family connection.
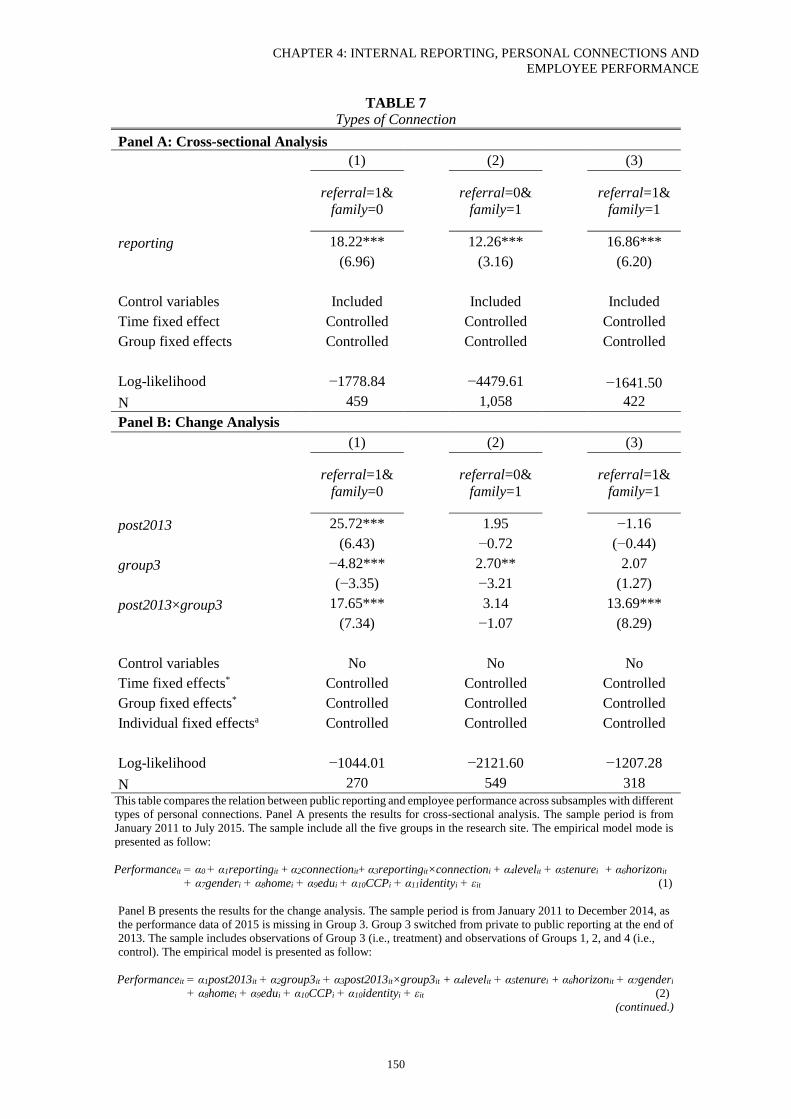
CHAPTER 4: INTERNAL REPORTING, PERSONAL CONNECTIONS AND
EMPLOYEE PERFORMANCE
150
TABLE 7
Types of Connection
Panel A: Cross-sectional Analysis (1) (2) (3)
referral=1&
family=0 referral=0&
family=1
referral=1&
family=1
reporting 18.22*** 12.26*** 16.86*** (6.96) (3.16) (6.20)
Control variables Included Included Included
Time fixed effect Controlled Controlled Controlled
Group fixed effects Controlled Controlled Controlled
Log-likelihood −1778.84 −4479.61 −1641.50
N 459 1,058 422
Panel B: Change Analysis (1) (2) (3)
referral=1&
family=0 referral=0&
family=1
referral=1&
family=1
post2013 25.72*** 1.95 −1.16
(6.43) −0.72 (−0.44)
group3 −4.82*** 2.70** 2.07
(−3.35) −3.21 (1.27)
post2013×group3 17.65*** 3.14 13.69*** (7.34) −1.07 (8.29)
Control variables No No No
Time fixed effects* Controlled Controlled Controlled
Group fixed effects* Controlled Controlled Controlled
Individual fixed effectsa Controlled Controlled Controlled
Log-likelihood −1044.01 −2121.60 −1207.28
N 270 549 318
This table compares the relation between public reporting and employee performance across subsamples with different
types of personal connections. Panel A presents the results for cross-sectional analysis. The sample period is from
January 2011 to July 2015. The sample include all the five groups in the research site. The empirical model mode is
presented as follow:
Performanceit = α0 + α1reportingit + α2connectionit+ α3reportingit×connectioni + α4levelit + α5tenurei + α6horizonit
+ α7genderi + α8homei + α9edui + α10CCPi + α11identityi + εit (1)
Panel B presents the results for the change analysis. The sample period is from January 2011 to December 2014, as
the performance data of 2015 is missing in Group 3. Group 3 switched from private to public reporting at the end of
2013. The sample includes observations of Group 3 (i.e., treatment) and observations of Groups 1, 2, and 4 (i.e.,
control). The empirical model is presented as follow:
Performanceit = α1post2013it + α2group3it + α3post2013it×group3it + α4levelit + α5tenurei + α6horizonit + α7genderi
+ α8homei + α9edui + α10CCPi + α10identityi + εit (2)
(continued.)
CHAPTER 4: INTERNAL REPORTING, PERSONAL CONNECTIONS AND
EMPLOYEE PERFORMANCE
151
TABLE 7 (cont.)
The dependent variable for both models is the monthly performance of employees (i.e., performance). The
estimations are censored at −160 and 130, as a result of the task nature and the performance measurement used by
the organization. Standard errors are clustered at individual level. *, **, *** indicates that the correlation coefficient
is significantly different from zero at the 10%, 5% and 1% levels, respectively (two-tailed). For the definitions of
variables, see Appendix B.
a Including control variables leads to a multicollinearity problem in the change analysis. I therefore control for the
individual fixed effects and exclude the control variables.
* Some of the time and group indicators were dropped because of collinearity, as the model has already included the
indictor for the post-change period (post2013) and the indicator for the change group (group3).
Robustness Checks
In the robustness tests, I first winsorize performance at 5% and 1% to ensure the results are not
distorted by the extreme values in employee performance. Second, as the dataset in this study
involves multiple periods, I include time-series variables into the models to check the
robustness of the results. After including the lag of performance in the estimations, the
coefficients on some demographic variables lose significance. The coefficients on the lag
performance are significantly positive, suggesting employee performance is persistent
throughout time. The conclusions remain the same. Further, performance information of some
employees is missing from certain months because of external factors (such as extreme
weather), technical problems (such as system breakdown), or sick leave. Excluding the months
with missing observations does not change the conclusion. Finally, I also use ordinary least
square (OLS) instead of the censored model. The adjusted R2 of the estimations are around 60%
and the conclusions remain the same.
4.6 Concluding Remarks
This study examines how personal connections, including referral–referrer connection and
family connection, affect the relation between public reporting and employee performance.
Drawing on the social psychology literature, I expect that personal connections in the
workplace enhance the positive relation between public reporting and employee performance.
Using archival and survey data from a Chinese SOE, I find that public reporting is positively
CHAPTER 4: INTERNAL REPORTING, PERSONAL CONNECTIONS AND
EMPLOYEE PERFORMANCE
152
associated with the performance of employees with personal connections, but not significantly
associated with the performance of those without personal connections. Based on the social
psychology literature, employees’ image concern is increased by the personal connections they
have in the workplace (Cupach and Metts 1994; Goffman 1979; Festinger 1954; Suls and
Wheeler 2000; Tedeschi 2013). The findings of this study suggest that the positive relation
between public reporting and employee performance is only significant when employees’
image concern is salient.
This study contributes to the accounting literature in two ways. First, previous studies
experimentally find that public reporting is positively related to employee performance
(Hannan et al. 2013; Maas and Van Rinsum 2013; Tafkov 2012). This study adds to the existing
literature by documenting that the performance effect of public reporting is conditional on
employees’ image concern. Using data from a field site, this study shows that personal
connections, as a factor that increases employees’ image concern, significantly enhances the
performance impact of public reporting. This study also contributes to the literature on
employee selection (Abernethy et al. 2015; Campbell 2012), by showing that employee
selection channel (i.e., referral) and criteria (i.e., family connections) can affect the
performance effect of the internal reporting choices made by managers. Finally, the findings
of this study have practical implications by showing that managers should consider internal
reporting and employee selection as an integrated system.
This study is not without limitations. First, it is an open question that to what extent we can
generalize the findings from a single company to other settings. The primary aim of this study
is to examine whether the performance effect of public reporting is affected by personal
connections. Examining this research question requires a setting with private and public
CHAPTER 4: INTERNAL REPORTING, PERSONAL CONNECTIONS AND
EMPLOYEE PERFORMANCE
153
reporting, personal connections of employees, and detailed data on employee performance and
background. Future studies may examine whether the findings of this study can be replicated
in other countries and/or other types of organizations. Further, using archival and survey data,
this study cannot and does not attempt to demonstrate the causal chain underlying the
associations between performance reporting, personal connections, and employee performance.
Future studies may extend this study by exploring the mechanisms that drive these associations.
CHAPTER 4: INTERNAL REPORTING, PERSONAL CONNECTIONS AND
EMPLOYEE PERFORMANCE
154
REFERENCES
Abernethy, M. A., H. C. Dekker, and A. Schultz. 2015. Are employee selection and incentive
contracts complements or substitutes? Journal of Accounting Research 53(4): 633–668.
Akerlof, G. A., and R. E. Kranton. 2000. Economics and identity. Quarterly Journal of
Economics 115(3): 715–753.
Akerlof, G. A., and R. E. Kranton. 2003. Identity and the economics of organizations. The
Journal of Economic Perspectives 19(1): 9–32.
Akerlof, G. A., and R. E. Kranton. 2010. Identity Economics: How Our Identities Shape Our
Work, Wages, and Well-Being. Princeton, NJ: Princeton University Press.
Ashforth, B. E., and F. Mael. 1989. Social identity theory and the organization. Academy of
Management Review 14(1): 20–39.
Azmat, G., and N. Iriberri. 2010. The importance of relative performance feedback
information: Evidence from a natural experiment using high school students. Journal of
Public Economics 94(7): 435–452.
Beaman, L., and J. Magruder, J. 2012. Who gets the job referral? Evidence from a social
networks experiment. The American Economic Review 102(7): 3574–3593.
Bergami, M., and R. P. Bagozzi. 2000. Self-categorization, affective commitment and group
self-esteem as distinct aspects of social identity in the organization. British Journal of
Social Psychology 39(4): 555–577.
Boivie, S., D. Lange, M. L McDonald, and J. D. Westphal. 2011. Me or we: The effects of
CEO organizational identification on agency costs. Academy of Management Journal
54(3): 551–576.
Brown, J. L., J. G. Fisher, M. Sooy, and G. B. Sprinkle. 2014. The effect of rankings on
honesty in budget reporting. Accounting, Organizations and Society 39(4): 237–246.
Brown, M., E. Setren, and G. Topa. 2016. Do informal referrals lead to better matches?
Evidence from a firm’s employee referral system. Journal of Labor Economics 34(1):
161–209.
Campbell, D. 2012. Employee selection as a control system. Journal of Accounting Research
50(4): 931–966.
Charness, G., D. Masclet, and M. C. Villeval. 2013. The dark side of competition for status.
Management Science 60(1): 38–55.
Cupach, W. R., and S. Metts. 1994. Facework. Thousand Oaks, CA: Sage Publications.
Encyclopedia of Management. 2009. Nepotism. Available at:
http://www.encyclopedia.com/social-sciences-and-law/economics-business-and-
labor/businesses-and-occupations/nepotism. Last viewed 4 April, 2017.
Festinger, L. 1954. A theory of social comparison processes. Human Relations 7(2): 117–
140.
Frederickson, J. R. 1992. Relative performance information: The effects of common
uncertainty and contract type on agent effort. The Accounting Review 67(4): 647–669.
Gardiner, M., and M. Tiggemann. 1999. Gender differences in leadership style, job stress and
mental health in male and female dominated industries. Journal of Occupational and
Organizational Psychology 72(3): 301–315.
CHAPTER 4: INTERNAL REPORTING, PERSONAL CONNECTIONS AND
EMPLOYEE PERFORMANCE
155
Giacalone, R. A., and P. Rosenfeld. 2013. Impression Management in the Organization.
Hillsdale, NJ: L. Erlbaum Associates.
Goffman, E. 1979. The Presentation of Self in Everyday Life. Harmondsworth: Penguin.
Han, J., and J. Han. 2009. Network-based recruiting and applicant attraction in China:
Insights from both organizational and individual perspectives. The International
Journal of Human Resource Management 20(11): 2228–2249.
Hannan, R. L., R. Krishnan, and A. H. Newman. 2008. The effects of disseminating relative
performance feedback in tournament and individual performance compensation plans.
The Accounting Review 83(4): 893–913.
Hannan, R. L., G. P. McPhee, A. H. Newman, and I. D. Tafkov. 2013. The effect of relative
performance information on performance and effort allocation in a multi-task
environment. The Accounting Review 88(2): 553–575.
Jobvite. 2017. Jobvite Index. Available at: http://www.jobvite.com/resources/jobvite-index.
Last viewed 29 March, 2017.
LinkedIn. 2015. The ultimate list of hiring statistics for hiring managers, HR professionals,
and recruiters. Available at: https://business.linkedin.com/content/dam/business/talent-
solutions/global/en_us/c/pdfs/Ultimate-List-of-Hiring-Stats-v02.04.pdf. Last viewed 29
March, 2017.
Luft, J. 2016. Cooperation and competition among employees: Experimental evidence on the
role of management control systems. Management Accounting Research.
doi:10.1016/j.mar.2016.02.00
Luo, Y. 2007. Guanxi and Business. Singapore: World Scientific Publishing Company.
Maas, V. S., and M. Van Rinsum. 2013. How control system design influences performance
misreporting. Journal of Accounting Research 51(5): 1159–1186.
Mael, F., and B. E. Ashforth. 1992. Alumni and their alma mater: A partial test of the
reformulated model of organizational identification. Journal of Organizational
Behavior 13(2): 103–123.
Rich, B. L., J. A. Lepine, and E. R. Crawford. 2010. Job engagement: Antecedents and
effects on job performance. Academy of Management Journal 53(3): 617–635.
Stinson, M., and C. Wignall. 2014. Fathers, children and the inter-generational transmission
of employers. Working paper, U.S. Census Bureau.
Tafkov, I. D. 2012. Private and public relative performance information under different
compensation contracts. The Accounting Review 88(1): 327–350.
Tedeschi, J. T. 2013. Impression Management Theory and Social Psychological Research.
New York NY: Academic Press.
Wright, T. A., and D. G. Bonett. 2002. The moderating effects of employee tenure on the
relation between organizational commitment and job performance: A meta-analysis.
Journal of Applied Psychology 87(6): 1183–1190.
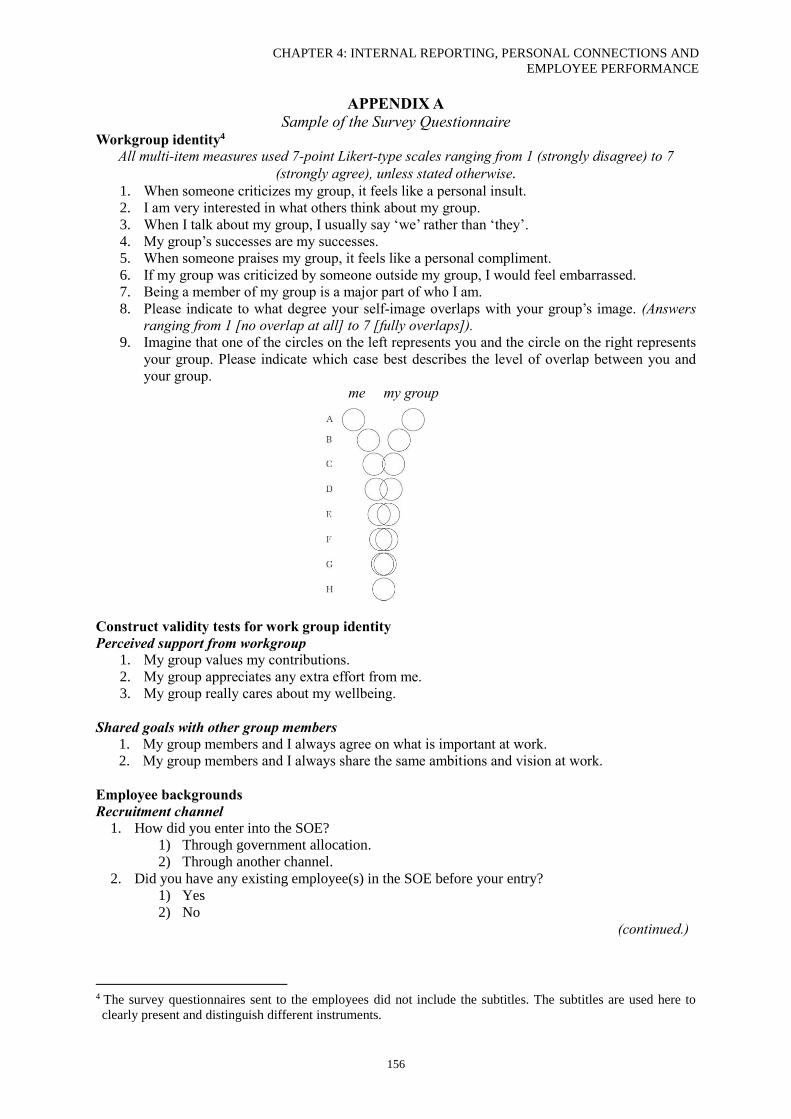
CHAPTER 4: INTERNAL REPORTING, PERSONAL CONNECTIONS AND
EMPLOYEE PERFORMANCE
156
APPENDIX A
Sample of the Survey Questionnaire Workgroup identity4
All multi-item measures used 7-point Likert-type scales ranging from 1 (strongly disagree) to 7
(strongly agree), unless stated otherwise. 1. When someone criticizes my group, it feels like a personal insult.
2. I am very interested in what others think about my group.
3. When I talk about my group, I usually say ‘we’ rather than ‘they’.
4. My group’s successes are my successes.
5. When someone praises my group, it feels like a personal compliment.
6. If my group was criticized by someone outside my group, I would feel embarrassed.
7. Being a member of my group is a major part of who I am.
8. Please indicate to what degree your self-image overlaps with your group’s image. (Answers
ranging from 1 [no overlap at all] to 7 [fully overlaps]).
9. Imagine that one of the circles on the left represents you and the circle on the right represents
your group. Please indicate which case best describes the level of overlap between you and
your group.
me my group
Construct validity tests for work group identity
Perceived support from workgroup
1. My group values my contributions.
2. My group appreciates any extra effort from me.
3. My group really cares about my wellbeing.
Shared goals with other group members
1. My group members and I always agree on what is important at work.
2. My group members and I always share the same ambitions and vision at work.
Employee backgrounds
Recruitment channel
1. How did you enter into the SOE?
1) Through government allocation.
2) Through another channel.
2. Did you have any existing employee(s) in the SOE before your entry?
1) Yes
2) No
(continued.)
4 The survey questionnaires sent to the employees did not include the subtitles. The subtitles are used here to
clearly present and distinguish different instruments.
CHAPTER 4: INTERNAL REPORTING, PERSONAL CONNECTIONS AND
EMPLOYEE PERFORMANCE
157
APPENDIX A (continued)
Family connection
Do you have family members who also work in the SOE?
1) YES, I do have family member(s) who also work in the SOE.
2) I used to have family members who worked in the SOE, but they have retired or left.
3) No, I have never had any family member who also works in the SOE.
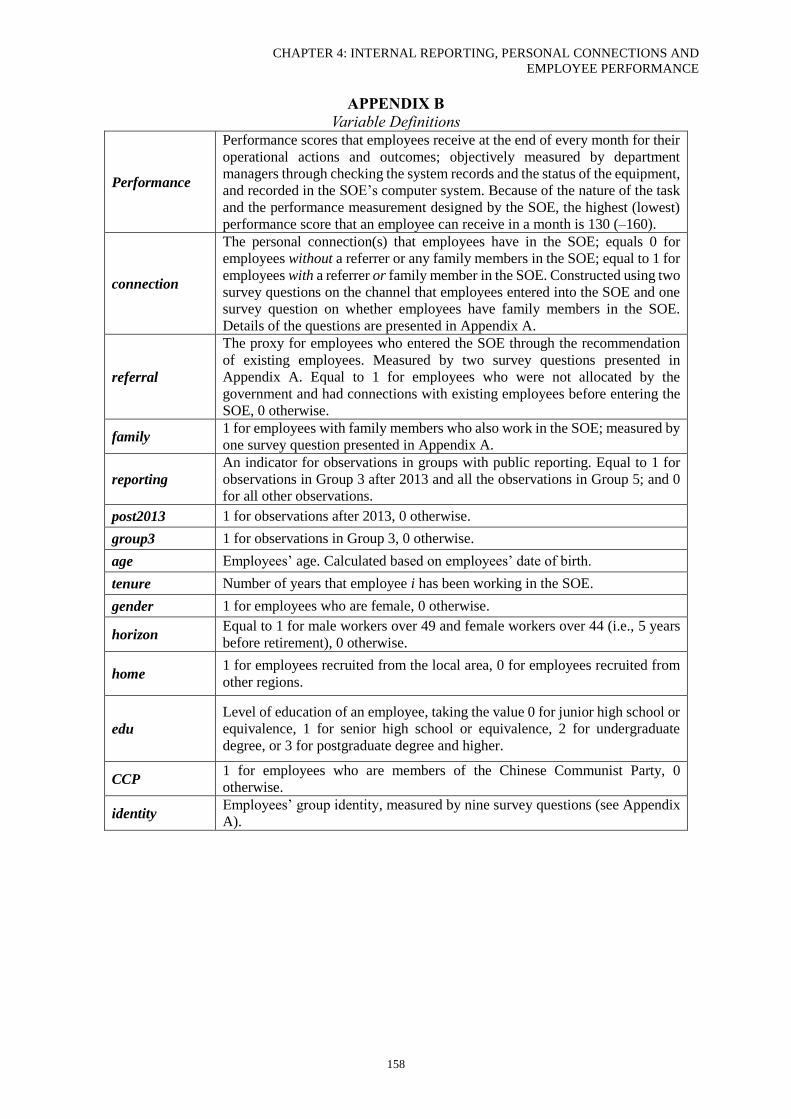
CHAPTER 4: INTERNAL REPORTING, PERSONAL CONNECTIONS AND
EMPLOYEE PERFORMANCE
158
APPENDIX B
Variable Definitions
Performance
Performance scores that employees receive at the end of every month for their
operational actions and outcomes; objectively measured by department
managers through checking the system records and the status of the equipment,
and recorded in the SOE’s computer system. Because of the nature of the task
and the performance measurement designed by the SOE, the highest (lowest)
performance score that an employee can receive in a month is 130 (–160).
connection
The personal connection(s) that employees have in the SOE; equals 0 for
employees without a referrer or any family members in the SOE; equal to 1 for
employees with a referrer or family member in the SOE. Constructed using two
survey questions on the channel that employees entered into the SOE and one
survey question on whether employees have family members in the SOE.
Details of the questions are presented in Appendix A.
referral
The proxy for employees who entered the SOE through the recommendation
of existing employees. Measured by two survey questions presented in
Appendix A. Equal to 1 for employees who were not allocated by the
government and had connections with existing employees before entering the
SOE, 0 otherwise.
family 1 for employees with family members who also work in the SOE; measured by
one survey question presented in Appendix A.
reporting
An indicator for observations in groups with public reporting. Equal to 1 for
observations in Group 3 after 2013 and all the observations in Group 5; and 0
for all other observations.
post2013 1 for observations after 2013, 0 otherwise.
group3 1 for observations in Group 3, 0 otherwise.
age Employees’ age. Calculated based on employees’ date of birth.
tenure Number of years that employee i has been working in the SOE.
gender 1 for employees who are female, 0 otherwise.
horizon Equal to 1 for male workers over 49 and female workers over 44 (i.e., 5 years
before retirement), 0 otherwise.
home 1 for employees recruited from the local area, 0 for employees recruited from
other regions.
edu
Level of education of an employee, taking the value 0 for junior high school or
equivalence, 1 for senior high school or equivalence, 2 for undergraduate
degree, or 3 for postgraduate degree and higher.
CCP 1 for employees who are members of the Chinese Communist Party, 0
otherwise.
identity Employees’ group identity, measured by nine survey questions (see Appendix
A).
CHAPTER 5: CONCLUSION
159
CHAPTER V
CONCLUSION
5.1 Summary
The three essays in this thesis examine how formal and informal controls jointly affect the task
performance of lower-level employees. The first essay finds that under private reporting, group
identity is positively related to employee performance. In comparison, under public reporting,
group identity is negatively (positively) related to the performance of employees with high
(low) ability. These findings suggest that the relation between group identity and employee
performance is conditional on managers’ choice regarding performance reporting transparency.
The second essay suggests that in multi-task settings where employee performance in some
task(s) cannot be precisely measured, managers can motivate employee performance through
promoting work norms that contribute to the desired organizational outcomes. However, the
effects of the work norms only persist if managers keep taking actions to promote them. The
third essay documents a positive relation between public reporting and employee performance.
However, this relation is only salient among employees who have personal connections in the
workplace.
5.2 Contributions
All three essays contribute to the literature on management controls and employee performance.
In particular, the first and the third essay contribute to the literature on internal performance
reporting (Azmat and Iriberri 2010; Frederickson 1992; Hannan, Krishnan, and Newman 2008;
Hannan, McPhee, Newman, and Tafkov 2013; Maas and Van Rinsum 2013; Tafkov 2012), by
demonstrating how public reporting affects employee performance through group identity and
CHAPTER 5: CONCLUSION
160
employees’ image concern. Further, the first essay also contributes to the growing literature on
employees’ group identity (Abernethy, Bouwens, and Kroos 2017; Empson 2004; Heinle,
Hofmann, and Kunz 2012; Towry 2003), by documenting that the behavioral effect of group
identity is conditional on the information environment within groups as well as the ability of
employees. Additionally, the second essay contributes to the broader literature on the role of
work norms as an integral part of an organization’s control system (Abernethy, Dekker, and
Schultz 2015; Campbell 2012; Gibbons and Kaplan 2015; Kachelmeier, Reichert, and
Williamson 2008; Maas and Van Rinsum 2013), by showing that managers can shape the work
norms in organizations by deliberately promoting the work norms that contribute to the desired
organizational outcomes. Moreover, the third essay contributes to the growing literature on
employee selection (Abernethy et al. 2015; Campbell 2012) by documenting how employment
channels (i.e., referrals and non-referrals) and criteria (i.e., with or without family connections)
affect the performance impact of internal performance reporting.
Taken together, the three essays in this thesis add to the management accounting literature by
demonstrating how different formal and informal controls jointly affect the performance of
lower-level employees. The findings also suggest that managers need to consider different
controls as an integrated system when designing and implementing management control
systems (MCSs).
5.3 Limitations and Future Research
As discussed in each of the three essays, the findings of this thesis are subject to several
limitations. First, to examine the research questions, I used data from a field site where there
are variations in the formal control mechanisms, and where the effects of the informal controls
are salient. It is an open question to what extent we can generalize the findings from a single
CHAPTER 5: CONCLUSION
161
research site. Future research could replicate and extend the studies in this thesis in different
settings. Second, although this study documents the relation between employee performance
and different management controls, I cannot examine which underlying mechanisms are
driving these relations, and thus do not attempt to demonstrate the causal chain that explains
these relations. Future research may examine the mechanisms underlying the findings of this
thesis using controlled experiments. Finally, this study employs long time-series data from a
real-world setting, which makes it difficult to rule out alternative explanations for the findings.
However, given that the context is controlled for and the research subjects have long tenures
in this setting, this does not pose a significant threat.
CHAPTER 5: CONCLUSION
162
REFERENCES
Abernethy, M., J. Bouwens, and P. Kroos. 2017. Organization identity and earnings
manipulation. Accounting, Organizations and Society. Available at:
http://www.sciencedirect.com/science/article/pii/S0361368217300193 [Accessed 31
May 2017]
Abernethy, M. A., H. C. Dekker, and A. Schultz. 2015. Are employee selection and incentive
contracts complements or substitutes? Journal of Accounting Research 53(4): 633–668.
Azmat, G., and N. Iriberri. 2010. The importance of relative performance feedback
information: Evidence from a natural experiment using high school students. Journal of
Public Economics 94(7): 435–452
Campbell, D. 2012. Employee selection as a control system. Journal of Accounting Research
50(4): 931–966.
Empson, L. 2004. Organizational identity change: Managerial regulation and member
identification in an accounting firm acquisition. Accounting, Organizations and Society
29(8): 759–781.
Frederickson, J. R. 1992. Relative performance information: The effects of common
uncertainty and contract type on agent effort. The Accounting Review 67(4): 647–669.
Gibbons, R., and R. S. Kaplan. 2015. Formal measures in informal management: Can a
balanced scorecard change a culture? American Economic Review: Papers and
Proceedings 105(5): 447–451.
Hannan, R. L., G. P. McPhee, A. H. Newman, and I. D. Tafkov. 2013. The effect of relative
performance information on performance and effort allocation in a multi-task
environment. The Accounting Review 88(2): 553–575.
Hannan, R. L., R. Krishnan, and A. H. Newman. 2008. The effects of disseminating relative
performance feedback in tournament and individual performance compensation plans.
The Accounting Review 83(4): 893–913.
Heinle, M. S., C. Hofmann, and A. H. Kunz. 2012. Identity, incentives, and the value of
information. The Accounting Review 87(4): 1309–1334.
Kachelmeier, S. J., B. E. Reichert, and M. G. Williamson. 2008. Measuring and motivating
quantity, creativity, or both. Journal of Accounting Research 46(2): 341–373.
Maas, V. S., and M. Van Rinsum. 2013. How control system design influences performance
misreporting. Journal of Accounting Research 51(5): 1159–1186.
Tafkov, I. D. 2012. Private and public relative performance information under different
compensation contracts. The Accounting Review 88(1): 327–350.
Towry, K. L. 2003. Control in a teamwork environment—The impact of social ties on the
effectiveness of mutual monitoring contracts. The Accounting Review 78(4): 1069–1095.
Minerva Access is the Institutional Repository of The University of Melbourne
Author/s:
SHANG, RUIDI
Title:
The influence of formal and informal controls on employee performance: three essays
Date:
2017
Persistent Link:
http://hdl.handle.net/11343/192943
File Description:
The Influence of Formal and Informal Controls on Employee Performance: Three Essays
Terms and Conditions:
Terms and Conditions: Copyright in works deposited in Minerva Access is retained by the
copyright owner. The work may not be altered without permission from the copyright owner.
Readers may only download, print and save electronic copies of whole works for their own
personal non-commercial use. Any use that exceeds these limits requires permission from
the copyright owner. Attribution is essential when quoting or paraphrasing from these works.