Embed Size (px)
Citation preview
The Influence of Domestic Firms on Foreign Direct Investment Liberalization*
Anusha Chari Nandini Gupta
University of Michigan Indiana University
November 2005
Abstract
This paper investigates the influence of incumbent firms on the decision to allow foreign direct investment into an industry. Based on data from India’s economic reforms, the results suggest that firms in concentrated industries are more successful at preventing foreign entry, that state-owned firms are more successful at stopping foreign entry than similarly placed private firms, and that profitable state-owned firms are more successful at stopping foreign entry than unprofitable state-owned firms. These results continue to hold when we control for industry characteristics such as the presence of natural monopolies and the size of the workforce. When foreign entry is allowed in an industry, incumbent firms experience a significant decline in market share and profits. The pattern of foreign entry liberalization supports the private interest view of policy implementation.
* Contact Information: * Anusha Chari, Assistant Professor of Finance, Ross School of Business at the University of Michigan, 701 Tappan Street, Ann Arbor, MI 48109. Internet: [email protected]. ** Nandini Gupta, Assistant Professor of Finance, Kelley School of Business Indiana University 1309 East 10th Street Bloomington, IN 47405. Internet: [email protected]. We thank Utpal Bhattacharya, Mara Faccio, Peter Henry, Simon Johnson, Randy Kroszner, Enrico Perotti, and Francisco Perez Gonzalez for helpful comments. This paper also benefited from the comments of participants at the Indiana and Michigan finance department workshops, the NBER International Financial Markets Meeting, 2005, and the 6th International Conference on Financial Market Development in Emerging and Transition Economies, Moscow 2005. Chari thanks the Mitsui Life Financial Research Center for financial support.
2
I. Introduction
Many countries restrict the inflow of foreign direct investment despite evidence that such
investment can increase economic growth. Why do governments postpone or fail to liberalize capital
flows that can benefit the economy? Recent evidence suggests that incumbent firms oppose financial
market reforms that threaten their favored status (Kroszner and Strahan, 1999; Feijen and Perotti, 2005).1
Rajan and Zingales (2003a,b) and Stulz (2005), in his presidential address, argue that entrenched
incumbent firms have an incentive to oppose the liberalization of international capital flows as
liberalization limits their ability to extract monopoly rents. In this paper we provide the first test of the
hypothesis that incumbent firms influence the policy decision to liberalize foreign direct investment.
To do so, we consider the Indian government’s decision to selectively reduce barriers to foreign
direct investment in a subset of industries after a balance of payments crisis in 1991. The Indian
corporate sector, much like the rest of the world, is characterized by the concentrated control of assets by
state-owned and family-owned firms (La Porta et. al, 1999; Bertrand, Johnson, Samphantharak, and
Schoar, 2004). In this study we ask the following questions: Did incumbent firms influence the state’s
decision to liberalize foreign direct investment in some industries and not others? And if so, which types
of firms were most successful and under what conditions?
To answer these questions we use a rich firm-level dataset that provides detailed balance sheet
and ownership information for about 2,187 firms that account for more than 70 percent of India’s
industrial output. A major advantage of this data is that the ownership information permits an
investigation of whether certain types of incumbent firms in an industry influence the decision to
liberalize.
From a public interest perspective, the government ought to liberalize industries according to
efficiency and social welfare criteria, without concern for political influence. For instance, the
1 The evidence suggests that (i) banking deregulation is delayed in U.S. states where incumbent banks have the most to lose from entry (Kroszner and Strahan, 1999); (ii) entrenched firms lobby to restrict access to credit after a crisis, forcing poorer entrepreneurs to exit (Feijen and Perotti, 2005) and; (iii) Post 1500, Western European countries with monarchies opposed free entry in profitable industries (Acemoglu, Johnson, and Robinson, 2005).

3
government should liberalize foreign entry into concentrated industries since deadweight losses are likely
to be higher (Pigou, 1938). In contrast, the private interest view of economic regulation characterizes the
policy process as one of interest group competition where policies reflect the incentives of interest groups
and their ability to successfully organize. From this perspective liberalization of concentrated industries
is less likely since incumbent firms in such industries have an incentive to protect their profits (Stigler,
1971) and since concentrated industries are better able to overcome the free-rider problem and
successfully organize to lobby the government (Olson, 1965; Stigler, 1971; Peltzman, 1976; Becker,
1983; and Grossman and Helpman, 2001).
Politicians may also be more receptive to the private interests of some incumbent firms over
others. For example, in the case of state-owned firms the state is itself an incumbent. State-owned firms
occupy a prominent position in countries across the world (Megginson, 2005) and they can be
disproportionately influential because their earnings accrue directly to the government or because
politicians obtain private benefits from controlling these firms (Shleifer and Vishny, 1998). If allowing
foreign direct investment in an industry contributes to the decline of state-owned firms, the state may
have an incentive to protect the industry from foreign competition.
Moreover, in many countries, business groups or family-owned firms also tend to be large and
politically influential incumbents (Morck, et al., 2005). Indian business groups are controlled by
members of the same family, and are typically the largest non-state-owned firms in an industry.
However, since business groups are typically diversified across different sectors, and are more efficient
than their state-owned counterparts, they may have favored an easing of restrictions on foreign direct
investment. Indeed in the years immediately following liberalization foreign direct investment in India
occurred primarily through joint ventures with group-owned firms.
The results suggest that the likelihood of barriers to foreign entry being reduced in an industry is
inversely related to its concentration. For example, the least concentrated industry in the sample with a
Herfindahl index of 0.025 faces on average an 80% chance of being opened to foreign entry. In contrast,
for a monopoly the probability of foreign entry liberalization is on average just 9.6%. Consistent with the
4
private interest hypothesis that firms in concentrated industries seek to protect monopoly profits, the
results suggest that the likelihood of foreign entry liberalization is significantly lower for more profitable
concentrated industries. Since geographic concentration may also determine the pattern of liberalization,
we exploit regional variation in firm location and find a significant negative relationship between regional
industrial concentration and the likelihood of foreign entry liberalization.
The results also show that the state is more responsive to the interests of certain incumbent firms.
In particular, the state is significantly more likely to retain foreign entry barriers in industries with
significant state-owned firm presence. For example, while industries with state-owned monopolies face a
13% chance of being liberalized, the probability of entry liberalization is more than twice as high at 27%
for industries with group-owned monopolies, and 52% for industries with no state-owned firms. The
results also suggest that the state is more likely to protect profitable rather than declining state-owned
firms. On the other hand, it appears that group-owned firms were not opposed to deregulating foreign
entry. These results are robust to industry size, concentration, and workforce.
Our data has the advantage that before 1991, restrictions on foreign entry were uniformly applied
across industries. By focusing on a discrete policy change rather than changes to a continuous measure of
protection, we avoid the causality problem that industry characteristics have evolved endogenously in
response to existing differences in barriers to foreign entry across industries.2 In other words, industry
and firm characteristics are not a direct outcome of cross-industry differences in barriers to foreign direct
investment.3
Our results identify concentrated industries and state-owned firms as politically influential
incumbents who affect the pattern of foreign direct investment liberalization. However, another potential
source of endogeneity is that these industry and firm characteristics may be the result of past protection
2Another issue is whether foreign direct investment is a proxy for contemporaneous reforms such as trade liberalization. However, trade liberalization occurred in a much larger group of industries. Import restrictions were removed in all industries except consumer products, and tariffs were reduced for almost all capital goods (Ahluwalia, 1995). In contrast, foreign direct investment was liberalized in just 46 of 97 three digit industrial categories. 3 In studies that examine the political economy of trade in the U.S. there is a concern that industry characteristics are an endogenous outcome of differences in tariff barriers across industries (Gawande and Krishna, 2004).
5
from domestic competition extended to politically effective firms. In this case, is the state continuing to
protect industries that were protected in the past, or does current industry concentration and state-
ownership contribute to the ability of these firms to keep out foreign competition? While concentration
and ownership may have evolved in response to past protection, our results suggest that consistent with
Rajan and Zingales (2003a,b) entrenched incumbent firms also use their current market power to oppose
foreign entry.
To capture influence arising out of underlying political effectiveness, we use “excess
concentration”, the difference between Indian concentration and U.S. concentration in the same
industries. This variable measures market power over and above the “natural” level of concentration in a
well-developed financial market such as the U.S. We find that the likelihood of liberalization is
negatively correlated with excess industry concentration, suggesting that underlying political
effectiveness is a factor in the decision to allow foreign entry. However, the results also show that
profitable, concentrated industries and profitable state-owned firms are more likely to oppose foreign
entry. Since firms with market power are more likely to earn monopoly profits, these firms have an
incentive to oppose foreign entry. This suggests that the decision to selectively retain barriers in some
industries is not simply a function of past protection, but that existing market power and connections to
the state contribute to the influence of incumbents on financial market reforms.
An alternative explanation for the above pattern of selective liberalization is that industry
concentration proxies for natural monopolies or industries of strategic importance. We find that industry
concentration continues to be significantly negatively correlated with the probability of liberalization after
excluding industries that can be classified as natural monopolies and industries on the government’s
strategic list. Another interpretation of our results is that the state protects profitable industries that are
engines of future growth or “winners” associated with positive spillovers. The results show that industry
concentration is not significantly correlated with future sales growth in industries that retained barriers.
6
The finding suggests that profitable industries that are protected owe their profitability to the lack of
competition rather than their growth potential.4
The paper also contributes to the literature that documents the relationship between financial
constraints and product market competition (Chevalier and Scharfstein, 1995, 1996; Bertrand, Schoar, and
Thesmar, 2004; and Cetorelli and Strahan, 2005), and the relationship between financial market
development and economic growth (Rajan and Zingales, 1998; and Bekaert, Harvey, and Lundblad,
2005). Given the widely documented inefficiency of state-owned enterprises (Gupta, 2005; and
Megginson, 2005), and the deadweight loss associated with industry concentration, selective entry
liberalization to protect these incumbent firms may inhibit economic growth. Since entrenched state-
owned firms are likely to hinder financial market reforms, a policy implication of our results is that it may
be necessary to reduce the influence of these firms, for example through privatization, in order to
optimally implement reforms.
We do not observe voting records in parliament or lobbying contributions that are often used to
measure political activity. Detailed parliamentary records for the liberalization measure studied in this
paper are not available, and corporate lobbying contributions are illegal in India. A potential concern
with using data on lobbying contributions, if available, is that the political activities of incumbents and
the policy positions of politicians may be simultaneously determined. It is, however, harder to make a
similar claim for the ex-ante stake of incumbent firms that lies at the core of the identification strategy in
this paper.
An alternative approach is to investigate the impact of foreign entry liberalization on incumbent
firms. If reducing foreign entry barriers contributes to a decline in market shares and profit margins,
incumbent firms may be more likely to lobby against liberalization. Descriptive statistics confirm this
hypothesis.
4 Moreover, high growth sectors such as information technology and biotechnology were opened up to foreign direct investment in 1991.
7
In Section 2 we provide testable hypotheses and describe our methodology. In Section 3 we
discuss the economic reforms and industrial structure in India. Section 4 describes the data. Section 5
discusses the relationship between industry characteristics and the likelihood of foreign direct investment
liberalization. Section 6 describes the relationship between the likelihood of liberalization and the
ownership of incumbent firms in that industry. Section 7 provides summary statistics describing the
effects of foreign entry liberalization on incumbent firms. In Section 8 we provide additional robustness
checks and Section 9 concludes.
2. Hypotheses and Methodology
The private interest view holds that interest groups such as incumbent firms may influence the
government to enact policies that benefit them. In contrast, the public interest view assumes a welfare-
maximizing government. Below we contrast the two views to generate testable hypotheses about industry
characteristics that are likely to influence the decision to remove barriers to foreign investment in an
industry.
2A. Concentrated Industries
Firms in concentrated industries are more likely to earn monopoly profits (Tirole, 1988) and
therefore have an incentive to oppose entry liberalization if an increase in competition leads to a decline
in these profits (Stigler, 1971). Models of collective action also suggest that concentrated industries are
better able to overcome the free-rider problem and successfully organize to lobby the government (Olson,
1965; Stigler, 1971; and Peltzman, 1976). The private interest perspective yields the following
prediction:
Prediction 1a: Under the private interest hypothesis entry barriers are more likely to
be retained in concentrated industries because these incumbents have both an
incentive to oppose entry liberalization and the ability to successfully influence the
government.
8
However, concentrated industries are also associated with greater deadweight losses compared to
competitive industries (Pigou, 1938; Becker, 1983). Therefore, from a public interest perspective the
government should enact policies to promote competition by removing entry barriers in more
concentrated industries:5
Prediction 1b: Under the public interest hypothesis entry barriers are less likely to be retained
in concentrated industries because entry will improve welfare by reducing the deadweight loss in
these industries.
We use the Herfindahl index and the four-firm concentration ratios for the relative sales share and the
relative asset share of the four largest firms in an industry to measure industry concentration.
2B. Profitable and Declining Industries
Incumbent firms have an incentive to oppose liberalization if entry causes a decline in profits
(Stigler, 1971). However, while firms in industries with declining growth rates and profitability may
have an incentive to oppose entry liberalization, they may lack the ability to influence the government
(Kroszner and Strahan, 1998). Conversely, cash-rich incumbent firms in high growth or profitable
industries may be more influential.
Prediction 2a: Under the private interest hypothesis the pattern of liberalization will depend on
the relative lobbying strength of incumbent firms in growing industries versus incumbent firms in
declining industries.
According to the public interest hypothesis a welfare-maximizing government should liberalize
entry in uncompetitive industries. Therefore, a potential avenue of distinguishing between the private and
public interest hypotheses is to investigate whether profitability is positively correlated with industry
concentration. Under the private interest hypothesis profitable, concentrated industries are less likely to
5 The empirical estimations control for other government objectives such as protecting strategic industries or natural monopolies that may also be highly concentrated.
9
be liberalized while the public interest hypothesis predicts the opposite — industries where firms earn
higher profits because of the lack of competition ought to be liberalized.
Prediction 2b: Under the public interest hypothesis, by allowing competition, entry liberalization
in both profitable and unprofitable industries may be efficiency enhancing, but profitable,
concentrated industries should be liberalized.
We use growth in future sales (a proxy for growth expectations) and several measures of
profitability such as return on sales and revenues per worker to test this hypothesis.
2C. High Employment Industries
Labor groups may be opposed to foreign investment if it threatens existing employment and wage
levels (Olson, 1983, Galiani and Sturzenegger, 2005). If entry liberalization adversely affects the workers
of incumbent firms, the private interest hypothesis predicts that industries that employ more workers have
an incentive to oppose this policy. The incentive to oppose foreign entry will also be greater the higher
the rents or wages earned from protection. Thus, the private interest view yields the following prediction:
Prediction 3a: Under the private interest hypothesis the likelihood of entry liberalization should
be negatively related to the number of employees and the wages per worker in an industry.
From a public interest perspective, governments have an incentive to reduce income inequality by
protecting the living standards of the lowest income groups (Ball, 1967). Hence, the likelihood of entry
liberalization will be lower in industries that employ low-income, unskilled workers. Since the
proportion of unskilled workers is likely to be proportional to the total number of workers in an industry,
the public interest hypothesis yields a similar prediction as the private interest hypothesis. A potential
avenue for distinguishing between the two hypotheses is by considering averages wages. Since wages per
worker are likely to be lower in industries that employ a large number of unskilled workers we obtain the
following prediction:
10
Prediction 3b: The public interest theory predicts that the likelihood of entry
liberalization should be negatively related to the number of employees and positively
related to wages per worker in that industry.
To investigate the potential influence of labor groups we use data on aggregate employment,
wages, wages per worker, and the capital-labor ratio.
2D. State-Owned Enterprises
In the U.S., special interest politics are usually modeled as interest groups lobbying the
government where the politician benefits indirectly, for example through campaign contributions, but is
not an explicit stakeholder in the policy outcome.
However, the presence of state-owned firms gives the government an explicit stake in the
outcome of the policy. Politicians enjoy rents from controlling state-owned firms. For example, this
could be a result of the status associated with being in charge of the largest petroleum company in the
country, or the power to secure employment for one’s supporters, or in the case of corrupt politicians,
siphoning funds from the company. Also, since the earnings of state-owned firms accrue to the
government if deregulating an industry contributes to the decline of a state-owned firm then government
revenues will be adversely affected. If private benefits to politicians and revenues that accrue to the
government are proportional to firm size, the influence of state-owned enterprises on the decision to allow
foreign investment in an industry is likely to depend on their relative stake in that industry.
Prediction 4a: Under the private interest hypothesis, the likelihood of entry liberalization
should be inversely related to the relative stake of state-owned enterprises in that
industry.
From a public interest perspective, it is not obvious why the presence of these firms should have
any influence on policy. One argument is that if state-owned firms employ more unskilled workers, the
government may choose to protect workers in these firms, which yields the following prediction:
11
Prediction 4b: Under the public interest hypothesis, controlling for employment, the
likelihood of entry liberalization should not be related to the presence of state-owned
enterprises in that industry.
To test this hypothesis we use the share of industry output, assets, employment, and wages
produced by state-owned firms.
2E. The Role of Business Groups
Indian family-owned firms or business groups have historically enjoyed a close relationship with
the government (Khanna and Palepu, 2004), and may have opposed foreign investment for the same
reasons as other incumbent groups. However, there are also reasons why group-owned firms may have
been in favor of this policy. First, under the state-led industrialization efforts following 1947, the private
sector was relegated to a secondary role in the economy. While the state-owned sector reaped the benefits
of preferential access to credit and entry, business groups were subject to a complicated system of quotas
that severely restricted their ability to participate in industrial production.6 For example, the Monopoly
and Restrictive Trade Practices Act of 1969 required that “all applications for a license from companies
belonging to a list of big business houses … were to be referred to a ‘MRTP Commission’ which invited
objections and held public hearings before granting a license for production” (see Table A1.)
Ex ante, business groups may have favored foreign entry under the premise that they would
emerge as winners if state-owned presence in the economy declined. Second, business groups were more
efficient than their state-owned counterparts and therefore less likely to be adversely affected by entry. In
fact, business groups may have been in favor of foreign investment because of the potential for forming
joint ventures with foreign firms.7 Third, business groups were well diversified and may not have
opposed entry liberalization if they had a minor presence in any given industry. The private interest
6 Rodrik and Subrahmanian (2004) argue that a pro-business climate did not prevail in India until late in the reform process because of the large state-owned presence in the economy. 7 While many business groups entered into joint ventures with foreign firms, few state-owned enterprises did.
12
hypothesis therefore does not yield a clear prediction about the influence of business groups on the
likelihood of entry liberalization.
3. Reforms and Industrial Structure
In this section we discuss the economic reforms undertaken by the Indian government in 1991
and the foreign direct investment liberalization measure studied in this paper. We also describe the
policies governing the evolution of India’s industrial structure prior to the 1991 reforms. Lastly, we
compare concentration ratios in Indian industries with concentration ratios of the same industries in the
U.S. as a benchmark.
3A. Liberalizing Foreign Entry in India
In competitive markets ownership patterns and industrial concentration are determined by the
interaction between technological characteristics and the competitive process in an industry. Before
1991, ownership and industry concentration patterns in India were an outcome of state-led
industrialization policies rather than of market forces. Table A1 presents a chronology of industrial
reforms that confirm that the evolution of India’s industrial structure was in large part determined by
state-led industrialization policies that restricted the participation of private and foreign firms in the
economy. For example, the Industrial Policy Resolution of 1956 reserved certain industries for state-
owned firms, prohibiting the entry of all private firms in these sectors. In addition, a draconian regulatory
framework, popularly known as the "License Raj," required government approval for the entry of new
firms and even the expansion of existing establishments.
Before 1991, government approval was also required for foreign direct investment in all
industries. The complex system of controls severely restricted foreign direct investment flows. To
illustrate, in 1991 total foreign direct investment flows into India were $73.5 million. In contrast, China
received $4.4 billion in foreign direct investment that year (World Development Indicators, The World
Bank, 1991).
13
In response to a balance of payments crisis in 1991 India undertook sweeping economic reforms.
A key reform involved reducing restrictions on foreign direct investment in a subset of industries.
According to the Industrial Policy Resolution of 1991 (Office of the Economic Advisor, 2001), which
outlined the reforms, automatic approval was granted to foreign direct investment of up to 51% in 46 of
97 three-digit industrial categories. Government approval was also no longer required for the expansion
and diversification of foreign firms in these industries. In the remaining 51 industries the state continued
to require that foreign investors obtain approval for any investment.
The liberalization of foreign direct investment has had a notable impact on gross capital
formation in India. In 1991, foreign direct investment as a fraction of gross capital formation was close to
zero. Ten years later, in 2001, foreign direct investment accounted for four percent of gross capital
formation in the Indian economy (World Development Indicators, The World Bank, 1991).
3B. Comparing Industry Concentration between the United States and India
To investigate whether in the pre-reform period India’s industrial structure was similar to that of
other economies, we compare industrial concentration for the same industries in India and the United
States. As an economy with well-functioning financial markets and fewer regulations than most
countries, the U.S. offers a benchmark of industry characteristics that represent underlying technologies
rather than institutional constraints (Rajan and Zingales, 1998).
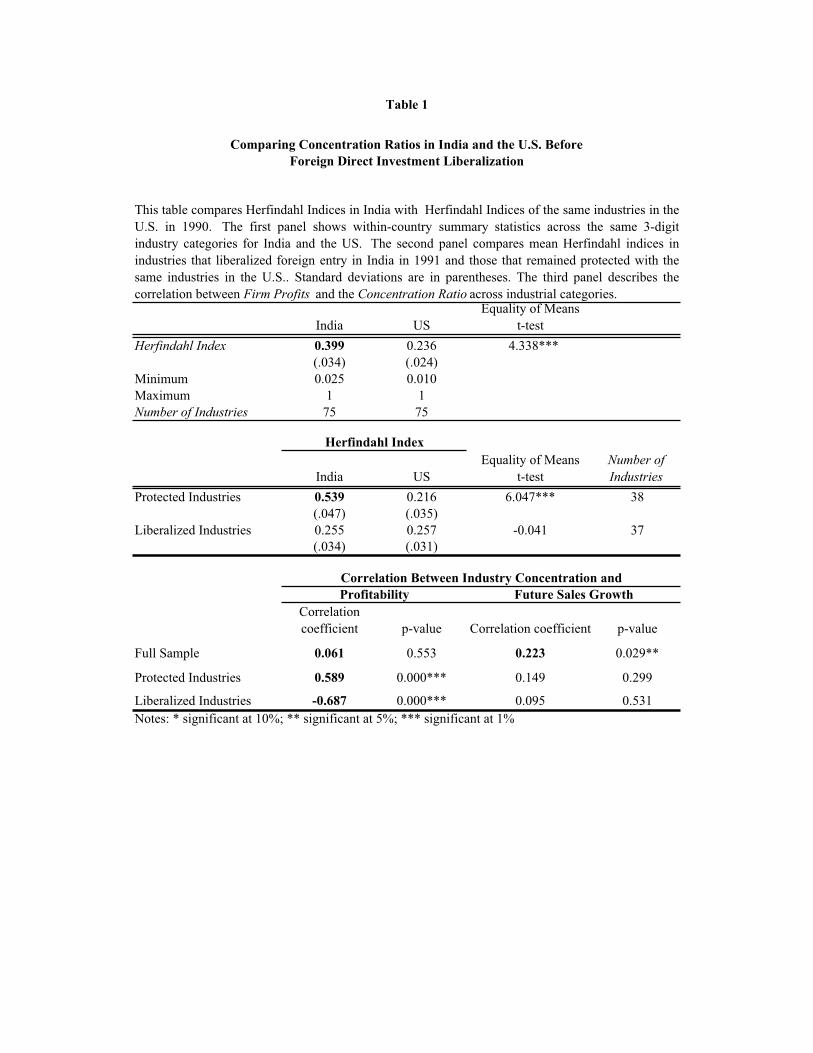
From Table 1 we see that in 1990, a year prior to the reforms in India, average industry
concentration, measured by the Herfindahl Index, in the U.S. was significantly lower at about 24%,
compared to 40% in the same 3-digit SIC level industries located in India.8 Note that the average
Herfindahl index in Indian industries that retained barriers to foreign direct investment was significantly
higher at 54% compared to 22% for the same industries in the United States. Equality-of-means tests
show that both differences are statistically significant at the 1% level.
8 Effective concentration in local markets is likely to be even higher in India due to an underdeveloped transportation infrastructure.
14
Given that average industry concentration is significantly lower in the U.S., the statistical
comparison suggests that Indian industries were more concentrated due to barriers to entry, rather than
technological factors that determine scale. Moreover, since Indian industries that retained barriers to
foreign direct investment are significantly more concentrated than their U.S. counterparts, the comparison
also suggests that removing entry barriers is likely to reduce the market power of incumbent firms in
these industries.
4. The Data
We use firm-level data from the Prowess database collected by the Centre for Monitoring the
Indian Economy from company balance sheets and income statements. The data provide information on a
range of variables such as sales, profitability, employment, and assets for about 2,187 firms.9 The
companies covered account for more than 70 percent of industrial output. For all the variables used in the
estimations we construct averages for the three fiscal years, 1988-1990, preceding the liberalization of
foreign entry in 1991.
The main advantage of firm-level data is that detailed balance sheet and ownership information
permit an investigation of whether the presence of certain types of incumbent firms in an industry affects
the probability of liberalization. In contrast, industry-level databases usually do not provide information
about sales, assets, profits, and employment by different ownership categories. The firms in the data
belong to three main ownership categories: state-owned firms, business group (family-owned) firms, and
unaffiliated private firms.
The Industrial Policy Resolution of 1991 (Office of the Economic Advisor, 2001) provides
information about the list of industries in which the state liberalized foreign entry. The firms in the
sample belong to 97 three-digit industrial categories, of which foreign entry restrictions were reduced in
46 industries. The Indian National Industrial Classification (1998) system is used to classify firms in the
9 Since firms are not required to report employment information in their annual reports, we observe employment data for only 241 firms. To avoid attrition bias the estimations do not require that the data be balanced.
15
Prowess dataset into industries. The data include firms from a wide range of industries including mining,
basic manufacturing, financial and real estate services, and energy distribution.
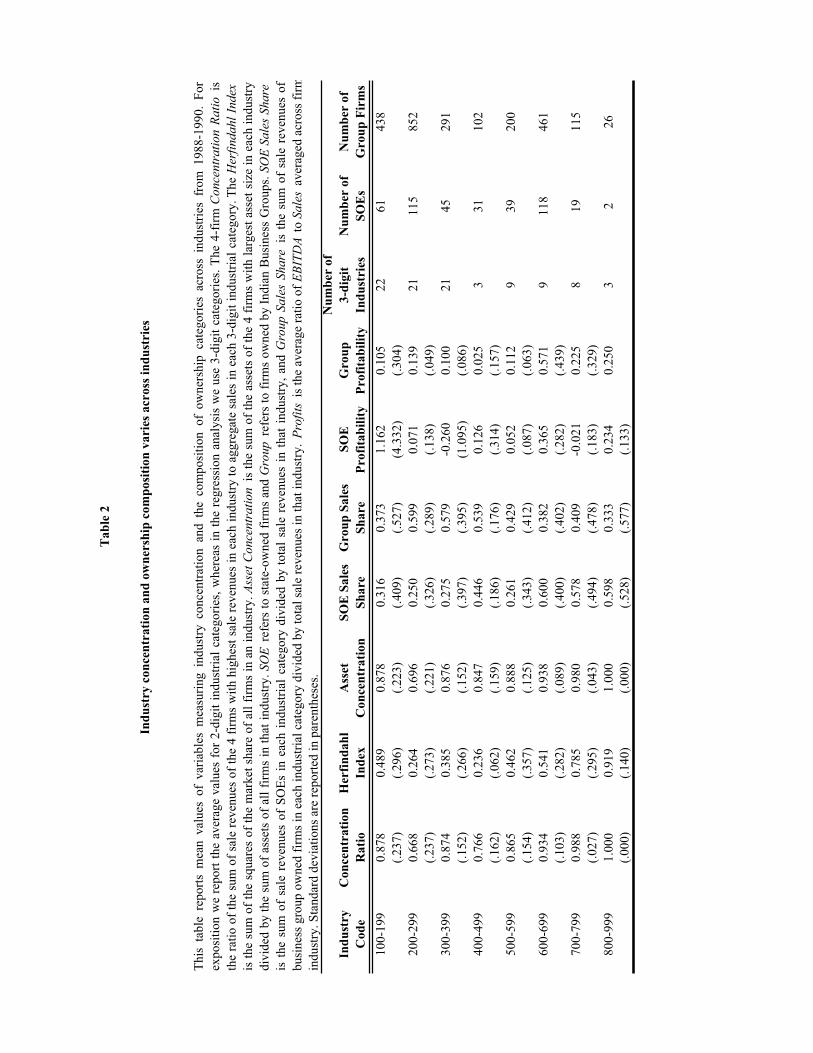
Table 2 reports average values of the concentration measures and the stakes of the two main
ownership groups (state-owned firms and business groups) across industrial categories. For expositional
purposes the table collapses the 3-digit industrial categories used in the empirical analysis into 2-digit
industrial categories. The regression analysis employs the 3-digit classification.
The concentration ratio describes the market share of the four largest firms in an industrial
category. The Herfindahl index is the sum of the squares of the market shares of all the firms in an
industry. From Table 2 note that the proportion of output produced by state-owned firms compared to
business groups varies across the different industrial categories. In five of the eight 2-digit industrial
categories, state-owned firms do not produce the largest share of output. The cross-sectional variation in
market share across ownership categories allows us to identify the relative effects of size and ownership.
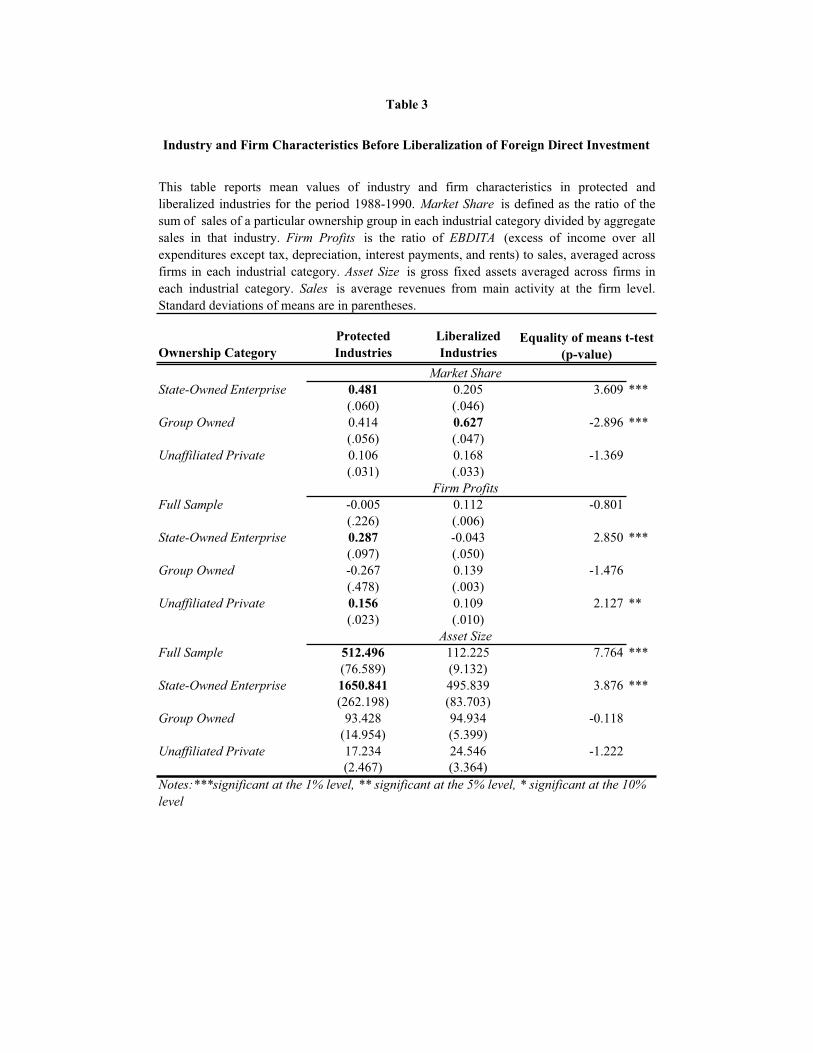
Table 3 reports results from univariate tests comparing industries that remove barriers to foreign
entry with industries that do not. First, state-owned firms have a higher market share and control a larger
share of fixed assets in industries which retain entry barriers, compared to state-owned firms in liberalized
industries. Second, state-owned firms appear to be significantly more profitable in industries where
foreign entry barriers were retained. Third, barring market share, group-owned firms do not vary
significantly in terms of size and profitability across liberalized and protected industries. In contrast to
state-owned firms, the market share of group-owned firms is significantly lower in industries that retained
barriers to foreign direct investment.
In summary, the univariate analysis suggests that there are significant differences between firms
in the industries where barriers to foreign investment were removed relative to the industries that were
kept off-limits. The regression analysis below investigates the role of incumbents in a multivariate
regression framework, which permits the inclusion of other factors that may affect liberalization.
16
5. Do Concentrated Industries Influence the Pattern of Foreign Direct Investment
Liberalization?
This section addresses the following question: Does the strength of incumbents measured by
industry concentration affect the probability that barriers to foreign direct investment will be removed in
an industry? We begin with the following specification:
)()1Pr( 210 jjjj XionConcentrattionLiberalizaEntry (1)
where represents the standard normal cumulative distribution, j indicates the industry,
and jX represents a matrix of firm and industry level characteristics. The main analysis uses the
Herfindahl index (sum of the squares of the market share) to measure industry concentration. A probit
model is estimated and marginal effects are reported for each coefficient. All the specifications correct
for heteroskedasticity using the Huber-White estimator of variance, and the standard errors are corrected
for clustering at the 3-digit industry level.
Consistent with the private interest hypothesis, the results reported in Table 4 suggest that the
state is significantly less likely to remove foreign entry barriers in concentrated industries. This result is
robust to a wide range of industry characteristics including size, profitability, productivity, and
employment measures. From the specification reported in column (1) we estimate that while the
probability of entry liberalization is 9.6% in the case of a monopoly, the least concentrated industry in the
sample with a Herfindahl index of 0.025 faces an 80.3% chance of being liberalized, where the remaining
covariates are evaluated at their mean values.
To investigate whether industry concentration is a proxy for natural monopolies and strategic
industries we conduct additional robustness checks in Section 8 below. We also use alternative measures
of industry concentration including “excess concentration”, measured by the difference between Indian
concentration and U.S. concentration by industry, and the 4-firm sales and asset concentration ratios.
The finding that entry barriers are more likely to be retained in concentrated industries leads to the
question of why incumbent firms in these industries oppose the liberalization of foreign direct investment.
17
In particular, is the government more likely to protect profitable or declining industries? The next
subsection addresses this question.
5A. Why do Incumbent Firms Oppose Foreign Entry Liberalization?
Foreign entry could reduce the monopoly profits of incumbent firms in concentrated industries,
which according to the private interest hypothesis gives them an incentive to oppose liberalization.
Alternatively, unprofitable industries also have an incentive to oppose foreign entry because they may be
unable to compete with foreign firms.
From the results reported in columns (2) - (4) of Table 4 it appears that the state is more likely to
retain foreign entry barriers in more profitable and productive industries, measured as the ratio of
EBITDA to sales for the four firms with the highest sales in an industry (Profit of 4 Largest Firms); the
ratio of EBITDA to sales for all firms (Firm Profits); and output per worker (Average Product),
respectively. The remaining specifications in Table 4 all include the variable Profit of 4 Largest Firms,
except the specification with Firm Profits because the two variables are highly correlated. The results
reported in columns (5) and (6) suggest that entry barriers are significantly less likely to be removed in
industries that have higher contemporaneous growth rates (Sales Growth) and also face better future
growth opportunities (Future Sales Growth). The latter variable is measured as the growth rate of sales
between 1992 and 1994. Hence, declining industries appear to face a higher probability of being opened
up. These results are consistent with the private interest hypothesis that industries with profitable, cash-
rich firms have more bargaining power than firms in declining industries (Kroszner and Strahan, 1999).
However, protecting profitable industries is also consistent with the efficiency-maximizing
objective of increasing competition in less efficient industries. One way of distinguishing between the
private and public interest hypotheses is to investigate the relationship between profitability and
concentration. If profitable industries are also more concentrated then from a public interest perspective,
the state should liberalize these industries. In Table 1 we show that industry concentration and
profitability are highly positively correlated in industries that retained barriers to entry. To investigate
18
this issue further we include the interaction between the Herfindahl index and firm profits (ratio of
EBDITA to Sales) and the Herfindahl index and future sales growth in equation (1).
Distinct from a linear regression specification, the coefficient of the interaction term in a probit
specification may not give the correct interaction effect. The conditional mean of the dependent variable
is given by the following equation:
(2))(
)(],|[ 12210
uF
HerfHerfFHerftionLiberalizaEntryE jjjjjjj
where F represents the standard normal cumulative distribution and u is the index. The interaction effect
is the change in the predicted probability that Entry Liberalization = 1 for a change in both the Herfindahl
index and the industry-level profitability measure, j ,
2
, 1 121 12 1 12 2 1 1
( )
[( ) ( )]( ) (( ) ) - ( )
i j
j j
j j
F u
x Herf f uf f Herf (3)
where f (u) = F’(u). Note that even if the coefficient of the interaction term, 12 , is equal to zero, the
interaction effect may not be zero. Since the marginal effect of the dprobit routine in Stata will not
provide the true marginal effect of the interaction term, equation (2) is estimated using the interaction
effects routine developed by Norton, Wang, and Ai (2004). The results are reported graphically in
Figures 1 and 2.
In a non-linear probit specification the mean interaction effect will vary over the distribution.
Figures 1a and 2a graph the coefficient of the correct mean interaction effect, represented by the dotted
line, over the distribution of the dependent variable for Firm Profits and Future Sales Growth,
respectively. Figures 1b and 2b graph the z-statistic of the coefficient of the correct mean interaction
effect over the distribution of the dependent variable, also represented by the dotted line. The graphs
show that the coefficients of the interaction terms between industry concentration and the profitability and
growth opportunity variables are negative and highly statistically significant over a considerable range of
19
the distribution. In industries with similar levels of concentration, higher profitability and higher future
sales growth appears to reduce the likelihood of entry liberalization.
The industry level results support a private interest story: Barriers to foreign entry are more likely
to be retained in industries with a few, profitable firms that seek to protect their monopoly profits. The
ownership analysis below further explores the role of profitability by ownership category on the
likelihood of entry liberalization.
5B. Does Labor Influence Foreign Entry Liberalization?
To investigate if the Herfindahl index is a proxy for other sources of interest group influence, such as
organized labor, the regressions include the total employment and wages by industry. From the results
reported in columns (7) - (9) of Table 4, it appears that neither total employment nor average wages have
a significant impact, and that capital-intensive rather than labor-intensive industries are more likely to be
protected. This need not imply that organized labor has no influence. For example, part of the influence
of the largest firms may arise from the fact that they are also the largest employers in an industry. Below
we show that the influence of labor may depend on the ownership of the incumbent firms. Also, since
firms are not required to report employment in annual reports, we observe employment for a smaller
subset of firms. Another institutional issue is that the majority of manufacturing sector workers are
employed in the “small-scale industry” sector, which includes firms with 50 or fewer employees.
Industries in this category are primarily in the textile sectors and are protected from both domestic and
foreign entry. Since we do not observe firms of this size in our data, we may be underestimating the
impact of employment on the decision to liberalize entry.
6. Does the Influence of Incumbent Firms by Vary by Ownership Category?
6A. State-Owned Firms
We begin by estimating the following probit specification to include the role of different
ownership groups:
20
)()1Pr( 210 jjjj XStakeSOEtionLiberalizaEntry , (4)
where F represents the standard normal cumulative distribution, j represents the industry with a total of
i=1…I firms, a subset of which are state-owned firms. The SOE Stake variables measure the relative stake
of state-owned firms in an industry. These include the ratio of total sales, assets, employment and wages
produced by state-owned firms in an industry to aggregate sales, assets, employment, and wages in that
industry, respectively. We also include the profitability of state-owned firms in an industry. The jX
vector includes the Herfindahl index, industry sales, assets, wages, and employment. A heteroskedasticity
adjustment is done using the Huber-White estimator for variance and the standard errors are clustered at
the 3-digit industry level. The results are presented in columns (1) - (7) of Table 5.
From column (1) of Table 5 note that the greater the proportion of an industry’s output produced
by state-owned firms, the lower the probability of entry liberalization. The same result holds for the share
of assets controlled by state-owned enterprises. These results are robust to industry concentration, size,
and wages.
The effect of state-owned firms on the probability of foreign entry liberalization is also
economically significant. From the specification reported in column (1) we estimate that industries with
state-owned monopolies face a 13% chance of being liberalized while the probability of entry
liberalization is four times as high at 52% for industries with no state-owned firms, where the remaining
covariates are evaluated at their mean values.
Does the government protect state-owned firms from foreign direct investment because of the
monopoly profits they earn, or because the firms are inefficient? The results in columns (3) and (4) for
returns to sales and output per worker in state-owned firms suggest the former - industries with profitable
and productive state-owned enterprises are more likely to be protected.
The results also suggest that state-owned firm workers may be more influential than employees of
private firms. The probability of foreign entry liberalization is significantly lower the greater the
proportion of an industry’s workers employed in state-owned firms and the higher the share of total
21
industry wages paid by state-owned firms (columns (5) and (6)). However, industries with higher average
wages per worker are significantly less likely to be liberalized, which is consistent with the private
interest hypothesis that workers earning high wages are more likely to seek protection.
6B. Family-Owned Firms
To look at the potential influence of incumbent firms owned by Indian business groups we
estimate the probit specification below:
)()1Pr( 210 jjjj XStakeGrouptionLiberalizaEntry (5)
where the Group Stake variables measure the proportion of industry sales, assets, employment, and wages
produced by group-owned firms, and the remaining variables are the same as defined above.
In Columns (8) – (14) of Table 5 the coefficients on the variables measuring group-owned firm
presence are positive and statistically significant only for the shares of assets, wages and labor. From the
specification in column (8) the probability of entry liberalization is estimated as 27% for a group-owned
monopoly, more than double that of 13% for a state-owned monopoly as reported above. Compared to
state-owned firms, either family-owned firms were in favor of foreign entry liberalization, or they did not
lobby the state to prevent it.
The ownership analysis suggests that family-owned firms did not oppose foreign entry. These
firms may have sought to reduce the influence of the state, or to gain access to capital and technology
from foreign entrants.
6C. Does Geographic Concentration Explain the Pattern of Liberalization?
One advantage of Indian data is the considerable regional variation in industrial, demographic,
and political characteristics across the different Indian states. We can use this variation to investigate
whether the decision to liberalize is influenced by the location of the incumbent firms likely to be affected
by this policy. Using data on 26 states and 96 industries we estimate the following specification:
22
(6))
()1Pr(
,,4
,3,2,10
kjkj
kjkjkjj
X
ShareSOEionConcentratShareIndustrytionLiberalizaEntry
where represents the standard normal cumulative distribution, j indicates the industry, and k the
state. The Industry Share variables measure the proportion of output (workers, assets, and wages)
produced by each 3-digit industrial category in each state as a share of total output (workers, assets, and
wages) across all industries in that state. This captures the relative importance of a particular industry
in each state. The Concentration and SOE Share variables capture the geographic concentration and
stake of state-owned enterprises in each state by industry. Lastly, jkX represents a matrix of industry
and state-level characteristics in each state, including industry profitability and size, and state per capita
income.
From the results reported in Table 6 we note that the probability of entry liberalization is
negatively correlated with the share of total state industrial output produced by an industry. The same
result is obtained for the share of assets, wages, and employment. We also find that the coefficients of
the Herfindahl Index, industry profitability, and the stake of state-owned enterprises in each state by
industry, are negative and highly significant. These results suggest that the influence of incumbent
firms may depend on their location – if an industry is a significant employer and producer in a state, it
is less likely to be liberalized. One interpretation of these results is that politicians seeking reelection
may have a greater incentive to cater to the interests of incumbent firms and to preserve private benefits
from state-owned firms, such as securing employment for supporters, in their state.
7. How Does Foreign Entry Affect Incumbent Firms?
Thus far the results suggest that particular incumbent firms and industries have more influence on
the pattern of foreign direct investment liberalization. However, we do not observe direct evidence of
incumbent influence such as corporate lobbying contributions, which are illegal in India. Another
approach is to investigate whether incumbent firms have an incentive to oppose foreign entry by

23
considering the impact of this reform on the market share and profitability of firms in industries in which
barriers to foreign investment are removed.
Since our results suggest that the decision to relax foreign entry barriers in some industries may
depend on incumbent firm characteristics, this rules out a “difference-in-difference” regression analysis
with a control group of industries which retain barriers to foreign entry. Instead, we consider the “before-
after” impact of foreign entry liberalization on incumbent firms in industries in which barriers to foreign
entry were removed. We restrict our sample to two years of pre-liberalization performance (1989 and
1990) and two years of post-liberalization performance (1992 and 1993) so as to reduce the confounding
impact of other economic reforms undertaken in subsequent years.
From the results described in Table 7 it appears that firms have an incentive to oppose foreign
entry liberalization because the market share of incumbent firms and industry concentration decline
significantly following the policy change. However, closer examination reveals that while the market
share of all firms falls following foreign entry liberalization, firm profits fall significantly only for state-
owned firms in liberalized industries. Firm profits for family-owned firms remain unaffected by foreign
entry liberalization. This is consistent with the hypothesis that group-owned firms may not have opposed
foreign entry.
We do not claim that the decline in market share and profitability is entirely due to foreign entry
liberalization. To establish a causal impact of liberalization on the market share and profitability of firms
we would need to address the potential endogenous timing of this reform, and the impact of
contemporaneous economic reforms.
8. Additional Robustness Checks
Thus far, our results identify concentrated industries and state-owned firms as politically
influential incumbents who affect the pattern of financial market reforms. Given the history of state-led
industrialization, do our results simply reflect the fact that the state is protecting industries that were
24
protected in the past, or does the ability of these firms to keep out foreign competition also depend on
their market power and ownership?
To capture influence arising out of market power rather than underlying political effectiveness,
we use industry concentration in the U.S. as an instrumental variable for industry concentration in India.
The results (not reported) suggest that industry concentration in the U.S. cannot explain foreign direct
investment liberalization in India. However, U.S. and Indian industry concentration are not significantly
correlated, suggesting that the former is not an effective instrument for the latter.
Another approach is to use “excess concentration”, the difference between Indian concentration
and U.S. concentration in the same industries, which measures market power over and above the “natural”
level of concentration in a well-developed financial market, such as the U.S. This variable may capture
the underlying political effectiveness of these industries. Columns (1) and (2) of Table 9 examine
whether excess concentration has explanatory power in determining the pattern of liberalization in India.
The results confirm that the greater the excess concentration in India, the less likely that an industry will
be liberalized, suggesting that underlying political effectiveness is a factor in the decision to allow foreign
entry.
However, note that the results in Sections 5A and 6A suggest that profitable, concentrated
industries and profitable state-owned firms are more likely to oppose foreign entry. Taken together the
evidence suggests that the decision to selectively retain barriers in some industries is not simply a
function of past protection, but that the market power and ownership of incumbent firms contribute to
their influence on the decision to liberalize foreign investment.
Table 9 also uses the 4-firm sales concentration ratio and the 4-firm asset concentration ratio as
alternative measures of industry concentration. The results are very similar to the ones described above:
The coefficients on the 4-firm sales and the 4-firm asset concentration ratios are negative and statistically
significant in all the specifications.
Finally, it may also be the case that the state does not reduce entry restrictions in some
concentrated industries because they are natural monopolies or of strategic national interest. As an
25
additional robustness check, we investigate the effect of concentration on the likelihood of entry
liberalization after excluding industries that belong to these categories. Specifically, the estimations
exclude firms belonging to the electric, gas, and water utility companies, financial services industries, and
industries on the government’s strategic list. The results reported in Table 8 show that industry
concentration continues to have a significant and negative impact on the probability of entry liberalization
when natural monopolies and strategic industries are excluded.
9. Concluding Remarks
In this paper we investigate the influence of incumbent firms on the selective removal of barriers
to foreign direct investment in a subset of industries in India. Our results suggest that both the
concentrated control of industrial assets and output by a few firms as well as the identity of incumbent
firms has a significant influence on the pattern of entry liberalization. Specifically, the state is
significantly more likely to retain foreign entry barriers in concentrated industries and in industries with
significant state-owned presence. The results also suggest that incumbent firms seek to protect monopoly
profits because the likelihood of foreign entry liberalization is significantly lower in concentrated
industries that are profitable, and in industries with profitable state-owned firms.
In the last decade, many economies have implemented economic and financial sector reforms,
including stock market liberalization, privatization, and the liberalization of foreign direct investment.
There is a large literature that evaluates the effects of these reforms on firm performance and economic
growth. Thus, the question arises whether these reforms are random, as assumed by much of the
literature, or are an outcome of incumbent firm characteristics as shown in this paper.
26
References
Acemoglu, Daron, Simon Johnson, and James Robinson, 2005. “The Rise of Europe: Atlantic Trade, Institutional Change, and Economic Growth,” American Economic Review 95(3), 546-579.
Ahluwalia, Montek S., 1995. “India’s Economic Reforms,” in Robert Cassen and Vijay Joshi eds. India:
The Future of Economic Reform, Oxford University Press: Oxford, United Kingdom.
Ball D. S., 1967. “United States Effective Tariffs and Labor’s Share,” Journal of Political Economy,
7, 183-187.
Bekaert, Geert, Christian Lundblad and Campbell Harvey, 2005. “Does Financial Liberalization Spur Growth,” Journal of Financial Economics 77, 3-56.
Bertrand, Marianne, Simon Johnson, Krislert Samphantharak, and Antoinette Schoar, 2004. “Mixing Family With Business: A Study of Thai Business Groups and the Families Behind Them,” MIT Working Paper.
Bertrand, Marianne, Antoinette Schoar, and David Thesmar, 2005. “Banking Deregulation and Industry Structure: Evidence from the 1985 French Banking Act,” working paper Massachusetts Institute of Technology.
Cetorelli, Nicola and Philip E. Strahan, 2005. “Finance as a Barrier to Entry: Bank Competition and Industry Structure in Local US Markets,” forthcoming Journal of Finance.
Chevalier, Judith, and David Scharfstein, 1996. “Capital-market imperfections and countercyclical markups: Theory and evidence,” American Economic Review 86, 703-725.
Chevalier, Judith, and David Scharfstein, 1995. "Liquidity Constraints and the Cyclical Behavior of Markups," American Economic Review, 85, 390-96.
Feijen, Erik and Enrico Perotti, 2005. “Lobbying on Exit: The Political Economy of Financial Fragility,” working paper, University of Amsterdam.
Galiani, Sebastian and Federico Sturzenegger, 2005. “Job Displacement in a Privatization Experience: The Case of YPF,” mimeo Kennedy School, Harvard University.
Gawande, Kishore and Pravin Krishna, 2004. “The Political Economy of Trade Policy: Empirical Approaches,” in E K Choi and James Harrigan (eds.), Handbook of International Trade, Blackwell Publishing.
Grossman, Gene, M. and Elhanan Helpman, 2001. Special Interest Politics,” MIT Press: Cambridge, MA.
Gupta, Nandini, 2005. “Partial Privatization and Firm Performance,” Journal of Finance, 60(2), 987- 1015.
Khanna, Tarun and Krishna Palepu, 2004. “The Evolution of Concentrated Ownership in India: Broad Patterns and a History of the Indian Software Industry,” NBER Working Paper No. 10613.
27
Kroszner, Randall S. and Philip E. Strahan, 1999. “What Drives Deregulation? Economics And Politics Of The Relaxation Of Bank Branching Restrictions,” The Quarterly Journal of Economics, 114 (4), 1437-1467.
La Porta, Rafael, Florencio Lopez-de-Silanes, Andrei Shleifer and Robert Vishny, 1999. “Corporate Ownership around the World,” Journal of Finance, 54 (2), 471-517.
Megginson, William L., 2005. The Financial Economics of Privatization, Oxford University Press: New York, NY.
Morck, Randall, Daniel Wolfenzon, and Bernard Yeung, 2005. “Corporate Governance, Economic
Entrenchment and Growth,” forthcoming, Journal of Economic Literature.
Norton, E.C., H. Wang, and C. Ai, 2004. “Computing Interaction Effects and Standard Errors in Logit and Probit Models,” The Stata Journal 4(2), 103 116.
Office of the Economic Advisor, 2001. Handbook of Industrial Policy and Statistics, Government of India: New Delhi, India.
Olson, Mancur, 1965. The Logic of Collective Action: Public Goods and the Theory of Groups, Harvard University Press: Cambridge, MA.
Peltzman, Sam, 1976. “Toward a More General Theory of Regulation,” Journal of Law and Economics, 19, 109-148.
Pigou, Alfred, 1938. The Economics of Welfare, 4th ed., Macmillan: London, U.K.
Rajan, Raghuram and Luigi Zingales, 1998. “Financial Dependence and Growth,” American Economic
Review 88, 559-586.
Rajan, Raghuram and Luigi Zingales, 2003a. “The Great Reversals: The Politics of Financial Development in the Twentieth Century,” Journal of Financial Economics, 69, 5-50.
Rajan, Raghuram and Luigi Zingales, 2003b. Saving Capitalism from the Capitalists, Random House: New York, NY.
Rodrik, Dani and Arvind Subrahmanian, 2004. “From Hindu Growth to Productivity Surge: The Mystery of the Indian Growth Transition,” NBER Working Paper No. 10376.
Shleifer, Andrei, and Robert Vishny, 1998. The Grabbing Hand: State Pathologies and their Cures,
Harvard University Press: Cambridge, MA.
Sivadasan, Jagadeesh, 2004. “Barriers to Entry and Productivity: Micro-evidence from Indian Manufacturing Sector Reforms,” mimeo, University of Michigan.
Stigler, George J., 1971. “The Theory of Economic Regulation,” Bell Journal of Economics, Rand, 2(1), 3-21.
Stulz, René M., 2005. “Presidential address: The Limits of Financial Globalization,” Journal of Finance,
60, 1595-1638.
28
The World Bank, 1991. World Development Indicators Database, World Bank: Washington, DC.
Tirole, Jean, 1988. The Theory of Industrial Organization, MIT Press: Cambridge, MA.
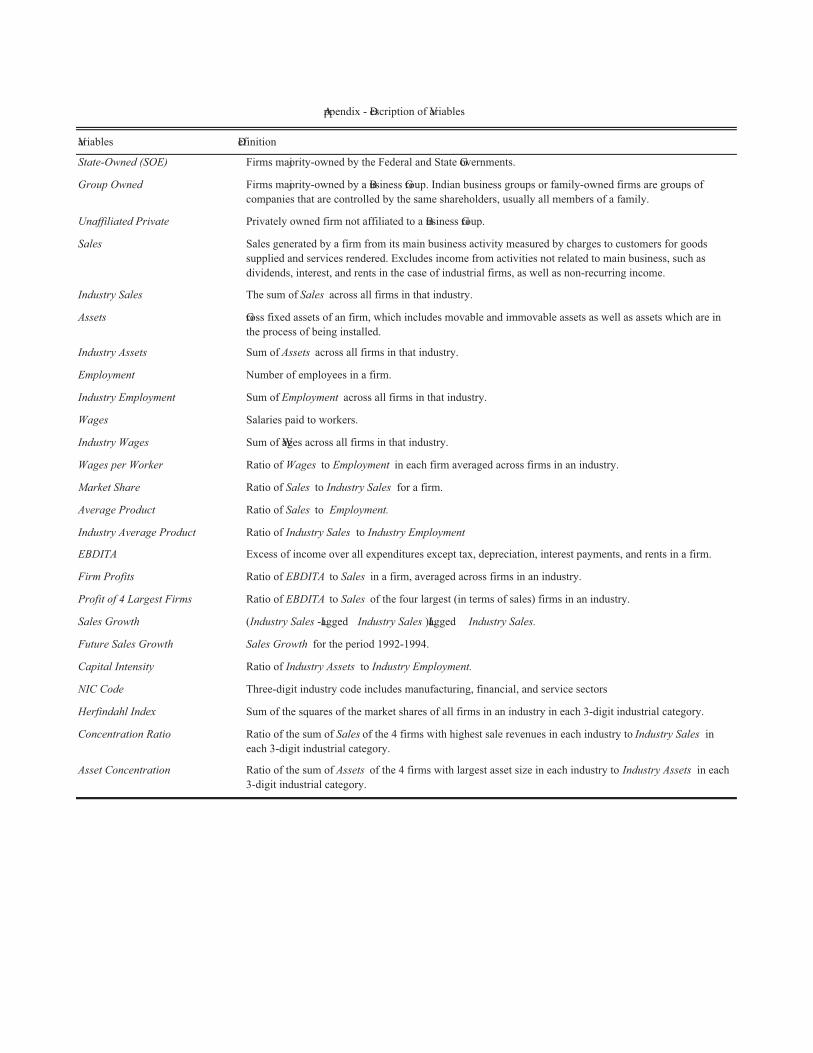
Variables Definition
State-Owned (SOE) Firms majority-owned by the Federal and State Governments.
Group Owned Firms majority-owned by a Business Group. Indian business groups or family-owned firms are groups of
companies that are controlled by the same shareholders, usually all members of a family.
Unaffiliated Private Privately owned firm not affiliated to a Business Group.
Sales Sales generated by a firm from its main business activity measured by charges to customers for goods
supplied and services rendered. Excludes income from activities not related to main business, such as
dividends, interest, and rents in the case of industrial firms, as well as non-recurring income.
Industry Sales The sum of Sales across all firms in that industry.
Assets Gross fixed assets of an firm, which includes movable and immovable assets as well as assets which are in
the process of being installed.
Industry Assets Sum of Assets across all firms in that industry.
Employment Number of employees in a firm.
Industry Employment Sum of Employment across all firms in that industry.
Wages Salaries paid to workers.
Industry Wages Sum of Wages across all firms in that industry.
Wages per Worker Ratio of Wages to Employment in each firm averaged across firms in an industry.
Market Share Ratio of Sales to Industry Sales for a firm.
Average Product Ratio of Sales to Employment.
Industry Average Product Ratio of Industry Sales to Industry Employment
EBDITA Excess of income over all expenditures except tax, depreciation, interest payments, and rents in a firm.
Firm Profits Ratio of EBDITA to Sales in a firm, averaged across firms in an industry.
Profit of 4 Largest Firms Ratio of EBDITA to Sales of the four largest (in terms of sales) firms in an industry.
Sales Growth (Industry Sales -Lagged Industry Sales )/Lagged Industry Sales.
Future Sales Growth Sales Growth for the period 1992-1994.
Capital Intensity Ratio of Industry Assets to Industry Employment.
NIC Code Three-digit industry code includes manufacturing, financial, and service sectors
Herfindahl Index Sum of the squares of the market shares of all firms in an industry in each 3-digit industrial category.
Concentration Ratio Ratio of the sum of Sales of the 4 firms with highest sale revenues in each industry to Industry Sales in
each 3-digit industrial category.
Asset Concentration Ratio of the sum of Assets of the 4 firms with largest asset size in each industry to Industry Assets in each
3-digit industrial category.
Appendix - Description of Variables
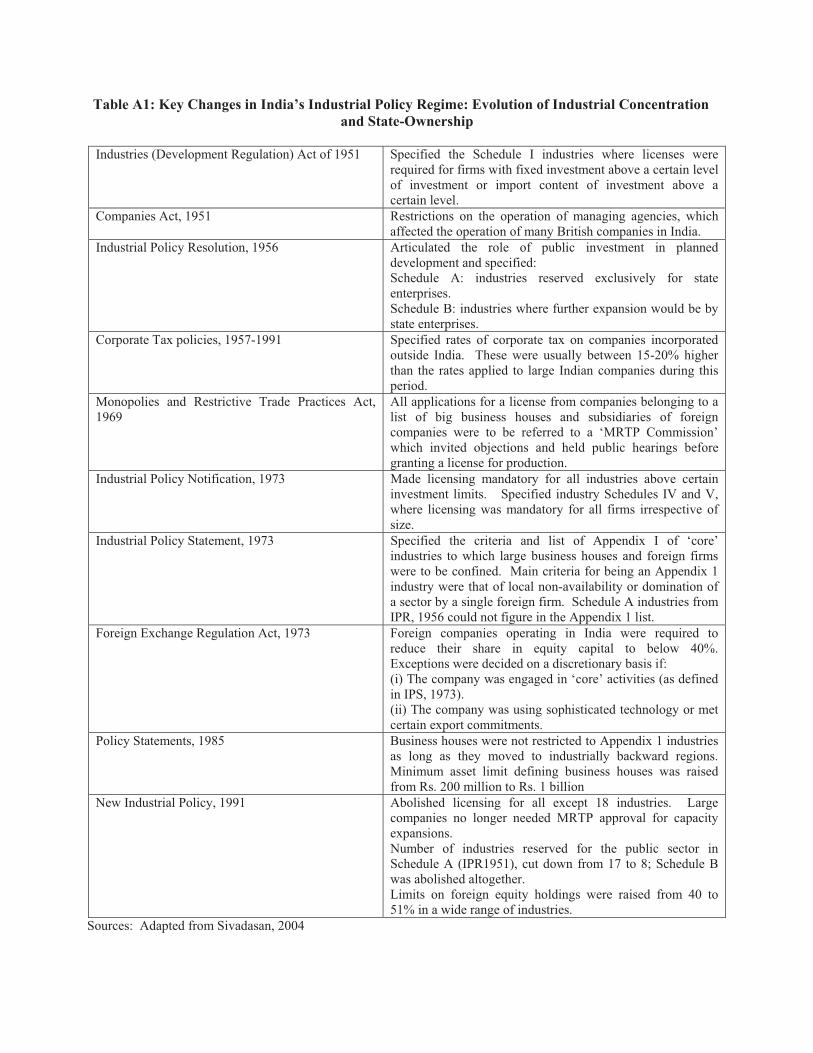
Table A1: Key Changes in India’s Industrial Policy Regime: Evolution of Industrial Concentration
and State-Ownership
Industries (Development Regulation) Act of 1951 Specified the Schedule I industries where licenses were required for firms with fixed investment above a certain level of investment or import content of investment above a certain level.
Companies Act, 1951 Restrictions on the operation of managing agencies, which affected the operation of many British companies in India.
Industrial Policy Resolution, 1956 Articulated the role of public investment in planned development and specified: Schedule A: industries reserved exclusively for state enterprises. Schedule B: industries where further expansion would be by state enterprises.
Corporate Tax policies, 1957-1991 Specified rates of corporate tax on companies incorporated outside India. These were usually between 15-20% higher than the rates applied to large Indian companies during this period.
Monopolies and Restrictive Trade Practices Act, 1969
All applications for a license from companies belonging to a list of big business houses and subsidiaries of foreign companies were to be referred to a ‘MRTP Commission’ which invited objections and held public hearings before granting a license for production.
Industrial Policy Notification, 1973 Made licensing mandatory for all industries above certain investment limits. Specified industry Schedules IV and V, where licensing was mandatory for all firms irrespective of size.
Industrial Policy Statement, 1973 Specified the criteria and list of Appendix I of ‘core’ industries to which large business houses and foreign firms were to be confined. Main criteria for being an Appendix 1 industry were that of local non-availability or domination of a sector by a single foreign firm. Schedule A industries from IPR, 1956 could not figure in the Appendix 1 list.
Foreign Exchange Regulation Act, 1973 Foreign companies operating in India were required to reduce their share in equity capital to below 40%. Exceptions were decided on a discretionary basis if: (i) The company was engaged in ‘core’ activities (as defined in IPS, 1973). (ii) The company was using sophisticated technology or met certain export commitments.
Policy Statements, 1985 Business houses were not restricted to Appendix 1 industries as long as they moved to industrially backward regions. Minimum asset limit defining business houses was raised from Rs. 200 million to Rs. 1 billion
New Industrial Policy, 1991 Abolished licensing for all except 18 industries. Large companies no longer needed MRTP approval for capacity expansions. Number of industries reserved for the public sector in Schedule A (IPR1951), cut down from 17 to 8; Schedule B was abolished altogether. Limits on foreign equity holdings were raised from 40 to 51% in a wide range of industries.
Sources: Adapted from Sivadasan, 2004
India US
Equality of Means
t-test
Herfindahl Index 0.399 0.236 4.338***
(.034) (.024)
Minimum 0.025 0.010
Maximum 1 1
Number of Industries 75 75
India US
Equality of Means
t-test
Number of
Industries
Protected Industries 0.539 0.216 6.047*** 38
(.047) (.035)
Liberalized Industries 0.255 0.257 -0.041 37
(.034) (.031)
Correlation
coefficient p-value Correlation coefficient p-value
Full Sample 0.061 0.553 0.223 0.029**
Protected Industries 0.589 0.000*** 0.149 0.299
Liberalized Industries -0.687 0.000*** 0.095 0.531
Notes: * significant at 10%; ** significant at 5%; *** significant at 1%
Table 1
Herfindahl Index
Foreign Direct Investment Liberalization
Correlation Between Industry Concentration and
Profitability Future Sales Growth
This table compares Herfindahl Indices in India with Herfindahl Indices of the same industries in the
U.S. in 1990. The first panel shows within-country summary statistics across the same 3-digit
industry categories for India and the US. The second panel compares mean Herfindahl indices in
industries that liberalized foreign entry in India in 1991 and those that remained protected with the
same industries in the U.S.. Standard deviations are in parentheses. The third panel describes the
correlation between Firm Profits and the Concentration Ratio across industrial categories.
Comparing Concentration Ratios in India and the U.S. Before
Ind
ust
ry
Co
de
Co
nce
ntr
ati
on
Ra
tio
Her
fin
da
hl
Ind
ex
Ass
et
Con
cen
trati
on
SO
E S
ale
s
Sh
are
Gro
up
Sale
s
Sh
are
SO
E
Pro
fita
bil
ity
Gro
up
Pro
fita
bil
ity
Nu
mb
er o
f
3-d
igit
Ind
ust
ries
Nu
mb
er o
f
SO
Es
Nu
mb
er o
f
Gro
up
Fir
ms
10
0-1
99
0.8
78
0.4
89
0.8
78
0.3
16
0.3
73
1.1
62
0.1
05
22
61
438
(.2
37
)(.
29
6)
(.223)
(.409)
(.527)
(4.3
32)
(.304)
20
0-2
99
0.6
68
0.2
64
0.6
96
0.2
50
0.5
99
0.0
71
0.1
39
21
115
852
(.2
37
)(.
27
3)
(.221)
(.326)
(.289)
(.138)
(.049)
30
0-3
99
0.8
74
0.3
85
0.8
76
0.2
75
0.5
79
-0.2
60
0.1
00
21
45
291
(.1
52
)(.
26
6)
(.152)
(.397)
(.395)
(1.0
95)
(.086)
40
0-4
99
0.7
66
0.2
36
0.8
47
0.4
46
0.5
39
0.1
26
0.0
25
331
102
(.1
62
)(.
06
2)
(.159)
(.186)
(.176)
(.314)
(.157)
50
0-5
99
0.8
65
0.4
62
0.8
88
0.2
61
0.4
29
0.0
52
0.1
12
939
200
(.1
54
)(.
35
7)
(.125)
(.343)
(.412)
(.087)
(.063)
60
0-6
99
0.9
34
0.5
41
0.9
38
0.6
00
0.3
82
0.3
65
0.5
71
9118
461
(.1
03
)(.
28
2)
(.089)
(.400)
(.402)
(.282)
(.439)
70
0-7
99
0.9
88
0.7
85
0.9
80
0.5
78
0.4
09
-0.0
21
0.2
25
819
115
(.0
27
)(.
29
5)
(.043)
(.494)
(.478)
(.183)
(.329)
80
0-9
99
1.0
00
0.9
19
1.0
00
0.5
98
0.3
33
0.2
34
0.2
50
32
26
(.0
00
)(.
14
0)
(.000)
(.528)
(.577)
(.133)
Tab
le 2
Ind
ust
ry c
on
cen
trati
on
an
d o
wn
ersh
ip c
om
posi
tion
vari
es a
cross
in
du
stri
es
Th
ista
ble
rep
ort
sm
ean
val
ues
of
var
iab
les
mea
suri
ng
indust
ryco
nce
ntr
atio
nan
dth
eco
mposi
tion
of
ow
ner
ship
cate
gori
esac
ross
indust
ries
from
1988-1
990.
For
exp
osi
tio
nw
ere
po
rtth
eav
erag
ev
alu
esfo
r2
-dig
itin
dust
rial
cate
gori
es,
wher
eas
inth
ere
gre
ssio
nan
alysi
sw
euse
3-d
igit
cate
gori
es.
The
4-f
irm
Conce
ntr
ati
on
Rati
ois
the
rati
oo
fth
esu
mo
fsa
lere
ven
ues
of
the
4fi
rms
wit
hhig
hes
tsa
lere
ven
ues
inea
chin
dust
ryto
aggre
gat
esa
les
inea
ch3-d
igit
indust
rial
cate
gory
.T
he
Her
findahl
Index
isth
esu
mo
fth
esq
uar
eso
fth
em
ark
etsh
are
of
all
firm
sin
anin
dust
ry.
Ass
etC
once
ntr
ati
on
isth
esu
mof
the
asse
tsof
the
4fi
rms
wit
hla
rges
tas
set
size
inea
chin
dust
ry
div
ided
by
the
sum
of
asse
tso
fal
lfi
rms
inth
atin
dust
ry.
SO
Ere
fers
tost
ate-
ow
ned
firm
san
dG
roup
refe
rsto
firm
sow
ned
by
India
nB
usi
nes
sG
roups.
SO
ESale
sShare
isth
esu
mo
fsa
lere
ven
ues
of
SO
Es
inea
chin
dust
rial
cate
gory
div
ided
by
tota
lsa
lere
ven
ues
inth
atin
dust
ry,
and
Gro
up
Sale
sShare
isth
esu
mof
sale
reven
ues
of
bu
sin
ess
gro
up
ow
ned
fir
ms
in e
ach
in
du
stri
al c
ateg
ory
div
ided
by t
ota
l sa
le r
even
ues
in t
hat
indust
ry.
Pro
fits
is
the
aver
age
rati
o o
f E
BIT
DA
to S
ale
sav
erag
ed a
cross
fir
m
ind
ust
ry.
Sta
nd
ard
dev
iati
on
s ar
e re
po
rted
in
par
enth
eses
.
Ownership Category
Protected
Industries
Liberalized
Industries
State-Owned Enterprise 0.481 0.205 3.609 ***
(.060) (.046)
Group Owned 0.414 0.627 -2.896 ***
(.056) (.047)
Unaffiliated Private 0.106 0.168 -1.369
(.031) (.033)
Full Sample -0.005 0.112 -0.801
(.226) (.006)
State-Owned Enterprise 0.287 -0.043 2.850 ***
(.097) (.050)
Group Owned -0.267 0.139 -1.476
(.478) (.003)
Unaffiliated Private 0.156 0.109 2.127 **
(.023) (.010)
Full Sample 512.496 112.225 7.764 ***
(76.589) (9.132)
State-Owned Enterprise 1650.841 495.839 3.876 ***
(262.198) (83.703)
Group Owned 93.428 94.934 -0.118
(14.954) (5.399)
Unaffiliated Private 17.234 24.546 -1.222
(2.467) (3.364)
Notes:***significant at the 1% level, ** significant at the 5% level, * significant at the 10%
level
Market Share
Firm Profits
Asset Size
Table 3
Industry and Firm Characteristics Before Liberalization of Foreign Direct Investment
This table reports mean values of industry and firm characteristics in protected and
liberalized industries for the period 1988-1990. Market Share is defined as the ratio of the
sum of sales of a particular ownership group in each industrial category divided by aggregate
sales in that industry. Firm Profits is the ratio of EBDITA (excess of income over all
expenditures except tax, depreciation, interest payments, and rents) to sales, averaged across
firms in each industrial category. Asset Size is gross fixed assets averaged across firms in
each industrial category. Sales is average revenues from main activity at the firm level.
Standard deviations of means are in parentheses.
Equality of means t-test
(p-value)
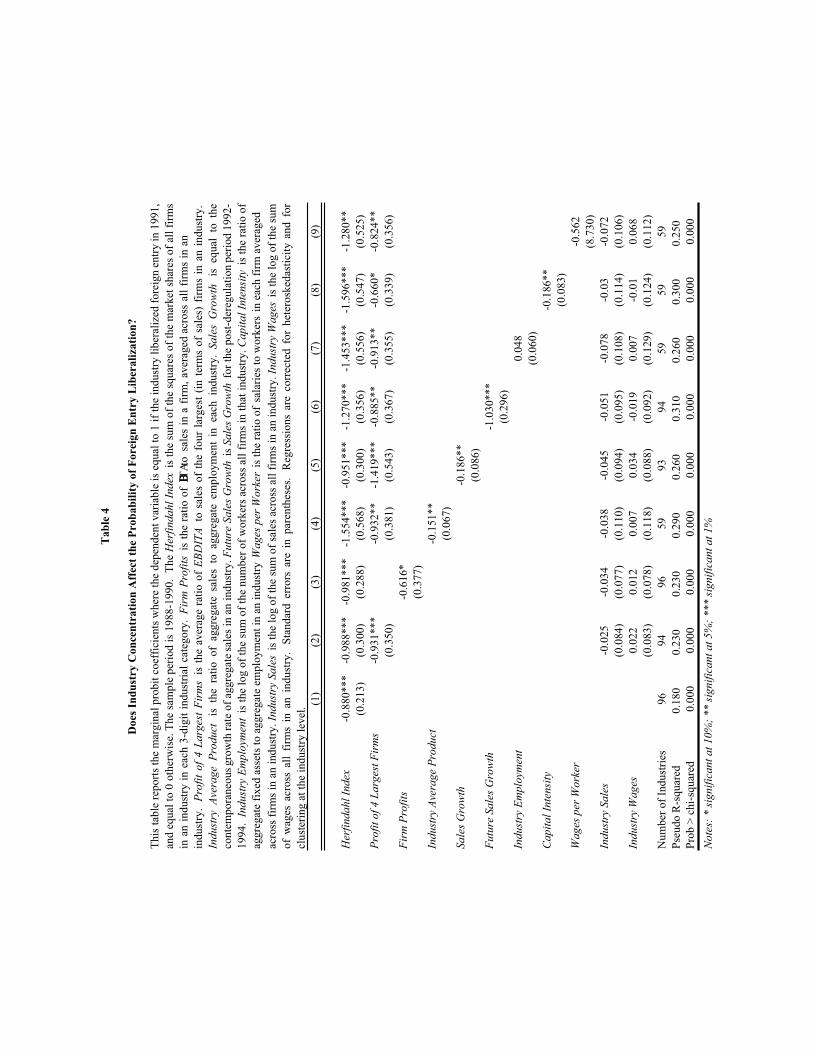
(1)
(2)
(3)
(4)
(5)
(6)
(7)
(8)
(9)
Her
fin
da
hl
Ind
ex-0
.88
0*
**
-0.9
88
**
*-0
.98
1*
**
-1.5
54
**
*-0
.95
1*
**
-1.2
70
**
*-1
.45
3*
**
-1.5
96
**
*-1
.28
0*
*
(0.2
13
)(0
.30
0)
(0.2
88
)(0
.56
8)
(0.3
00
)(0
.35
6)
(0.5
56
)(0
.54
7)
(0.5
25
)
Pro
fit
of
4 L
arg
est
Fir
ms
-0.9
31
**
*-0
.93
2*
*-1
.41
9*
**
-0.8
85
**
-0.9
13
**
-0.6
60
*-0
.82
4*
*
(0.3
50
)(0
.38
1)
(0.5
43
)(0
.36
7)
(0.3
55
)(0
.33
9)
(0.3
56
)
Fir
m P
rofi
ts-0
.61
6*
(0.3
77
)
Ind
ust
ry A
vera
ge
Pro
du
ct-0
.15
1*
*
(0.0
67
)
Sa
les
Gro
wth
-0.1
86
**
(0.0
86
)
Fu
ture
Sa
les
Gro
wth
-1.0
30
**
*
(0.2
96
)
Ind
ust
ry E
mp
loym
ent
0.0
48
(0.0
60
)
Ca
pit
al
Inte
nsi
ty-0
.18
6*
*
(0.0
83
)
Wa
ges
per
Wo
rker
-0.5
62
(8.7
30
)
Ind
ust
ry S
ale
s-0
.02
5-0
.03
4-0
.03
8-0
.04
5-0
.05
1-0
.07
8-0
.03
-0.0
72
(0.0
84
)(0
.07
7)
(0.1
10
)(0
.09
4)
(0.0
95
)(0
.10
8)
(0.1
14
)(0
.10
6)
Ind
ust
ry W
ag
es0
.02
20
.01
20
.00
70
.03
4-0
.01
90
.00
7-0
.01
0.0
68
(0.0
83
)(0
.07
8)
(0.1
18
)(0
.08
8)
(0.0
92
)(0
.12
9)
(0.1
24
)(0
.11
2)
Nu
mb
er o
f In
du
stri
es9
69
49
65
99
39
45
95
95
9
Pse
ud
o R
-sq
uar
ed0
.18
00
.23
00
.23
00
.29
00
.26
00
.31
00
.26
00
.30
00
.25
0
Pro
b >
ch
i-sq
uar
ed0
.00
00
.00
00
.00
00
.00
00
.00
00
.00
00
.00
00
.00
00
.00
0
No
tes:
* s
ign
ific
an
t a
t 1
0%
; **
sig
nif
ica
nt
at
5%
; *
**
sig
nif
ica
nt
at
1%
Ta
ble
4
Do
es I
nd
ust
ry C
on
cen
tra
tio
n A
ffec
t th
e P
rob
ab
ilit
y o
f F
ore
ign
En
try
Lib
era
liza
tio
n?
Th
ista
ble
rep
ort
sth
em
arg
inal
pro
bit
coef
fici
ents
wh
ere
the
dep
end
ent
var
iab
leis
equ
alto
1if
the
ind
ust
ryli
ber
aliz
edfo
reig
nen
try
in1
99
1,
and
equ
alto
0o
ther
wis
e.T
he
sam
ple
per
iod
is1
98
8-1
99
0.
Th
eH
erfi
nd
ah
lIn
dex
isth
esu
mo
fth
esq
uar
eso
fth
em
ark
etsh
ares
of
all
firm
s
inan
ind
ust
ryin
each
3-d
igit
ind
ust
rial
cate
go
ry.
Fir
mP
rofi
tsis
the
rati
oo
fEBDIT
Ato
sale
sin
afi
rm,
aver
aged
acro
ssal
lfi
rms
inan
ind
ust
ry.
Pro
fit
of
4L
arg
est
Fir
ms
isth
eav
erag
era
tio
of
EB
DIT
Ato
sale
so
fth
efo
ur
larg
est
(in
term
so
fsa
les)
firm
sin
anin
du
stry
.
Ind
ust
ryA
vera
ge
Pro
du
ctis
the
rati
oo
fag
gre
gat
esa
les
toag
gre
gat
eem
plo
ym
ent
inea
chin
du
stry
.S
ale
sG
row
this
equ
alto
the
con
tem
po
ran
eou
sg
row
thra
teo
fag
gre
gat
esa
les
inan
ind
ust
ry.F
utu
reS
ale
sG
row
this
Sa
les
Gro
wth
for
the
po
st-d
ereg
ula
tio
np
erio
d1
99
2-
19
94
.In
du
stry
Em
plo
ymen
tis
the
log
of
the
sum
of
the
nu
mb
ero
fw
ork
ers
acro
ssal
lfi
rms
inth
atin
du
stry
.C
ap
ita
lIn
ten
sity
isth
era
tio
of
agg
reg
ate
fix
ed a
sset
s to
ag
gre
gat
e em
plo
ym
ent
in a
n i
nd
ust
ry.
Wa
ges
per
Wo
rker
is
the
rati
o o
fsa
lari
es t
o w
ork
ers
in e
ach
fir
m a
ver
aged
acro
ssfi
rms
inan
ind
ust
ry.In
du
stry
Sa
les
isth
elo
go
fth
esu
mo
fsa
les
acro
ssal
lfi
rms
inan
ind
ust
ry.In
du
stry
Wa
ges
isth
elo
go
fth
esu
m
of
wag
esac
ross
all
firm
sin
anin
du
stry
.S
tan
dar
der
rors
are
inp
aren
thes
es.
Reg
ress
ion
sar
eco
rrec
ted
for
het
ero
sked
asti
city
and
for
clu
ster
ing
at
the
ind
ust
ry l
evel
.
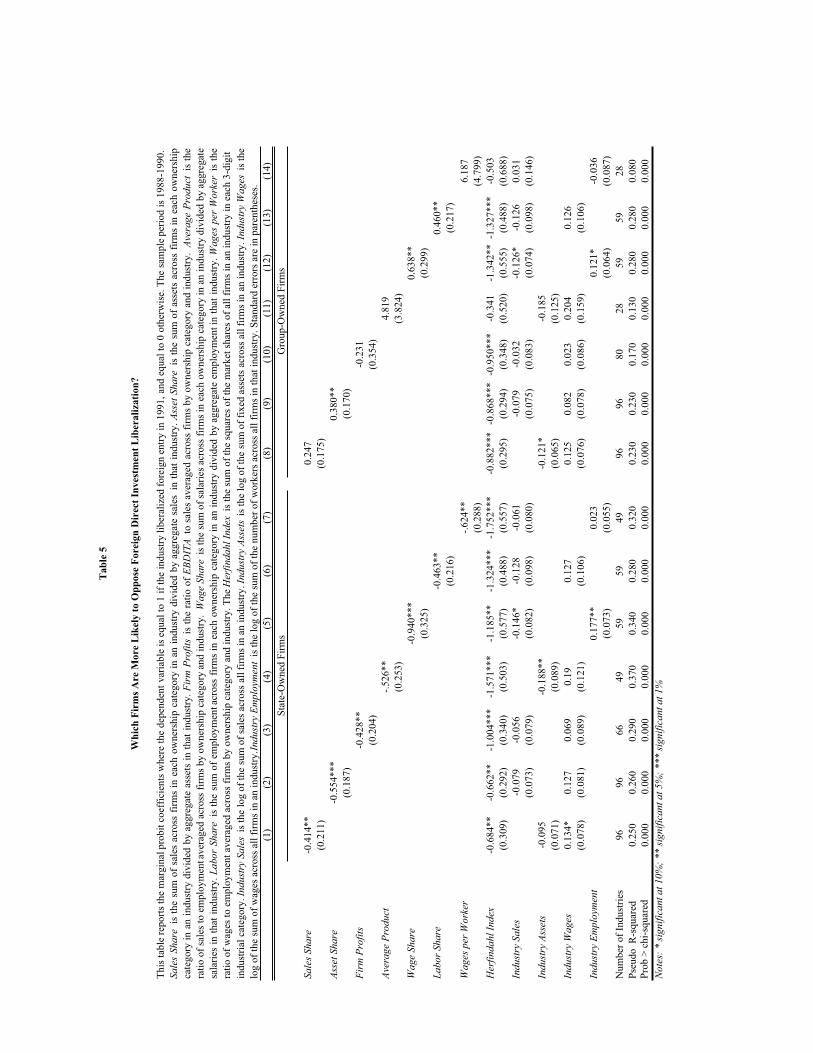
(1)
(2)
(3)
(4)
(5)
(6)
(7)
(8)
(9)
(10
)(1
1)
(12
)(1
3)
(14
)
Sa
les
Sh
are
-0.4
14**
0.2
47
(0.2
11)
(0.1
75)
Ass
et S
ha
re-0
.554***
0.3
80**
(0.1
87)
(0.1
70)
Fir
m P
rofi
ts-0
.428**
-0.2
31
(0.2
04)
(0.3
54
)
Ave
rag
e P
rod
uct
-.526**
4.8
19
(0.2
53)
(3.8
24
)
Wa
ge
Sh
are
-0.9
40***
0.6
38
**
(0.3
25)
(0.2
99
)
La
bo
r S
ha
re-0
.463**
0.4
60
**
(0.2
16)
(0.2
17
)
Wa
ges
per
Wo
rker
-.624**
6.1
87
(0.2
88)
(4.7
99
)
Her
fin
da
hl
Ind
ex-0
.684**
-0.6
62**
-1.0
04***
-1.5
71***
-1.1
85**
-1.3
24***
-1.7
52***
-0.8
82***
-0.8
68***
-0.9
50
**
*-0
.34
1-1
.34
2*
*-1
.32
7*
**
-0.5
03
(0.3
09)
(0.2
92)
(0.3
40)
(0.5
03)
(0.5
77)
(0.4
88)
(0.5
57)
(0.2
95)
(0.2
94)
(0.3
48
)(0
.52
0)
(0.5
55
)(0
.48
8)
(0.6
88
)
Ind
ust
ry S
ale
s-0
.079
-0.0
56
-0.1
46*
-0.1
28
-0.0
61
-0.0
79
-0.0
32
-0.1
26
*-0
.12
60
.03
1
(0.0
73)
(0.0
79)
(0.0
82)
(0.0
98)
(0.0
80)
(0.0
75)
(0.0
83
)(0
.07
4)
(0.0
98
)(0
.14
6)
Ind
ust
ry A
sset
s-0
.095
-0.1
88**
-0.1
21*
-0.1
85
(0.0
71)
(0.0
89)
(0.0
65)
(0.1
25
)
Ind
ust
ry W
ag
es0.1
34*
0.1
27
0.0
69
0.1
90.1
27
0.1
25
0.0
82
0.0
23
0.2
04
0.1
26
(0.0
78)
(0.0
81)
(0.0
89)
(0.1
21)
(0.1
06)
(0.0
76)
(0.0
78)
(0.0
86
)(0
.15
9)
(0.1
06
)
Ind
ust
ry E
mp
loym
ent
0.1
77**
0.0
23
0.1
21
*-0
.03
6
(0.0
73)
(0.0
55)
(0.0
64
)(0
.08
7)
Nu
mb
er o
f In
du
stri
es96
96
66
49
59
59
49
96
96
80
28
59
59
28
Pse
ud
o R
-sq
uar
e d0.2
50
0.2
60
0.2
90
0.3
70
0.3
40
0.2
80
0.3
20
0.2
30
0.2
30
0.1
70
0.1
30
0.2
80
0.2
80
0.0
80
Pro
b >
ch
i-sq
uar
ed0.0
00
0.0
00
0.0
00
0.0
00
0.0
00
0.0
00
0.0
00
0.0
00
0.0
00
0.0
00
0.0
00
0.0
00
0.0
00
0.0
00
No
tes:
* s
ign
ific
an
t a
t 10%
; ** s
ignif
icant
at
5%
; *** s
ignif
icant
at
1%
Tab
le 5
Wh
ich
Fir
ms
Are
More
Lik
ely t
o O
pp
ose
Fore
ign
Dir
ect
Inves
tmen
t L
iber
ali
zati
on
?
Sta
te-O
wned
Fir
ms
Gro
up
-Ow
ned
Fir
ms
Th
ista
ble
rep
ort
sth
em
argin
alpro
bit
coef
fici
ents
wher
eth
edep
enden
tvar
iable
iseq
ual
to1
ifth
ein
dust
ryli
ber
aliz
edfo
reig
nen
try
in1991,
and
equ
alto
0o
ther
wis
e.T
he
sam
ple
per
iod
is1
98
8-1
99
0.
Sa
les
Sh
are
isth
esu
mof
sale
sac
ross
firm
sin
each
ow
ner
ship
cate
gory
inan
indust
rydiv
ided
by
aggre
gat
esa
les
inth
atin
dust
ry.
Ass
etShare
isth
esu
mo
fas
sets
acro
ssfi
rms
inea
cho
wn
ersh
ip
cate
go
ryin
anin
du
stry
div
ided
by
aggre
gat
eas
sets
inth
atin
dust
ry.
Fir
mP
rofi
tsis
the
rati
oof
EB
DIT
Ato
sale
sav
erag
edac
ross
firm
sby
ow
ner
ship
cate
go
ryan
din
du
stry
.A
vera
ge
Pro
du
ctis
the
rati
oo
fsa
les
toem
plo
ym
enta
ver
aged
acro
ssfi
rms
by
ow
ner
ship
cate
gory
and
indust
ry.
Wage
Share
isth
esu
mof
sala
ries
acro
ssfi
rms
inea
chow
ner
ship
cate
go
ryin
anin
du
stry
div
ided
by
agg
reg
ate
sala
ries
inth
atin
du
stry
.L
abor
Share
isth
esu
mof
emplo
ym
entac
ross
firm
sin
each
ow
ner
ship
cate
gory
inan
indust
rydiv
ided
by
aggre
gat
eem
plo
ym
entin
that
ind
ust
ry.
Wa
ges
per
Wo
rker
isth
e
rati
o o
f w
ages
to
em
plo
ym
ent
aver
aged
acr
oss
fir
ms
by o
wner
ship
cat
egory
and i
ndust
ry.
The
Her
findahl
Index
is
the
sum
of
the
squar
es o
f th
e m
ark
et s
har
es o
f al
l fi
rms
in a
n i
nd
ust
ry i
n e
ach
3-d
igit
indu
stri
alca
teg
ory
.In
dust
rySale
sis
the
log
of
the
sum
of
sale
sac
ross
allfi
rms
inan
indust
ry.In
dust
ryA
sset
sis
the
log
of
the
sum
of
fixed
asse
tsac
ross
all
firm
sin
anin
du
stry
.In
du
stry
Wa
ges
isth
e
log o
f th
e su
m o
f w
ages
acr
oss
all
fir
ms
in a
n i
ndust
ry. I
ndust
ry E
mplo
ymen
t is
the
log o
f th
e su
m o
f th
e num
ber
of
work
ers
acro
ss a
ll f
irm
s in
that
in
du
stry
. S
tan
dar
d e
rro
rs a
re i
n p
aren
thes
es.
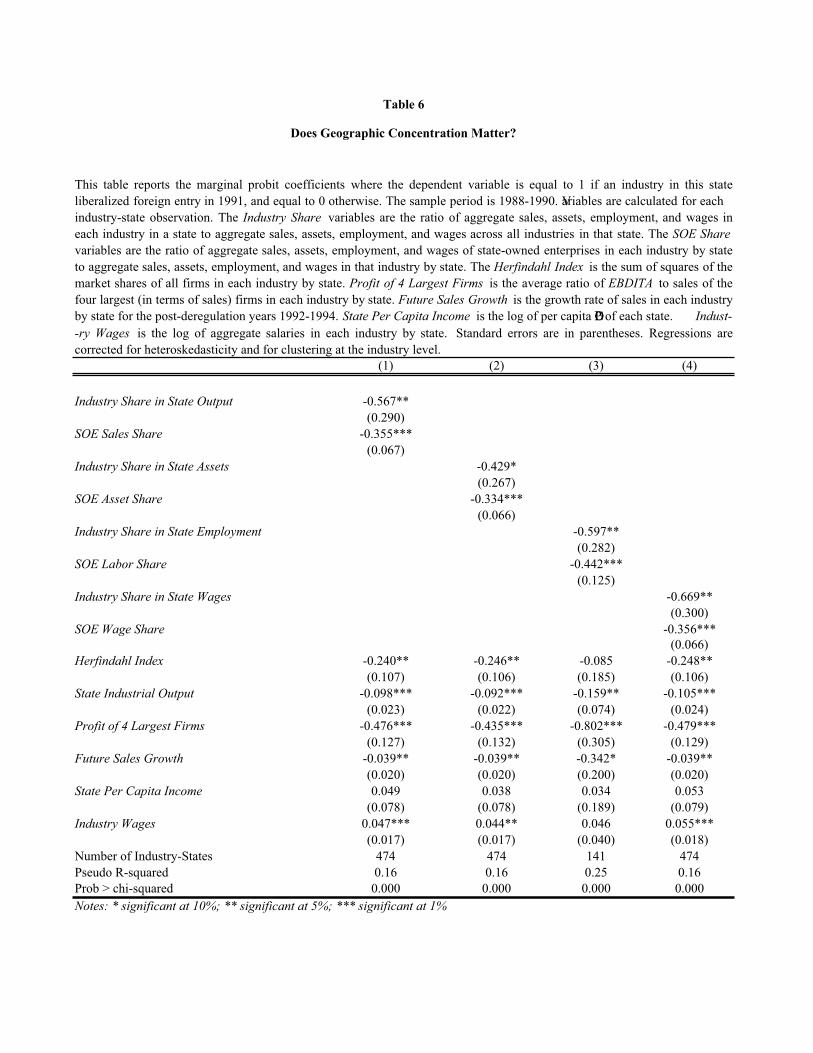
(1) (2) (3) (4)
Industry Share in State Output -0.567**
(0.290)
SOE Sales Share -0.355***
(0.067)
Industry Share in State Assets -0.429*
(0.267)
SOE Asset Share -0.334***
(0.066)
Industry Share in State Employment -0.597**
(0.282)
SOE Labor Share -0.442***
(0.125)
Industry Share in State Wages -0.669**
(0.300)
SOE Wage Share -0.356***
(0.066)
Herfindahl Index -0.240** -0.246** -0.085 -0.248**
(0.107) (0.106) (0.185) (0.106)
State Industrial Output -0.098*** -0.092*** -0.159** -0.105***
(0.023) (0.022) (0.074) (0.024)
Profit of 4 Largest Firms -0.476*** -0.435*** -0.802*** -0.479***
(0.127) (0.132) (0.305) (0.129)
Future Sales Growth -0.039** -0.039** -0.342* -0.039**
(0.020) (0.020) (0.200) (0.020)
State Per Capita Income 0.049 0.038 0.034 0.053
(0.078) (0.078) (0.189) (0.079)
Industry Wages 0.047*** 0.044** 0.046 0.055***
(0.017) (0.017) (0.040) (0.018)
Number of Industry-States 474 474 141 474
Pseudo R-squared 0.16 0.16 0.25 0.16
Prob > chi-squared 0.000 0.000 0.000 0.000
Notes: * significant at 10%; ** significant at 5%; *** significant at 1%
Does Geographic Concentration Matter?
Table 6
This table reports the marginal probit coefficients where the dependent variable is equal to 1 if an industry in this state
liberalized foreign entry in 1991, and equal to 0 otherwise. The sample period is 1988-1990. Variables are calculated for each
industry-state observation. The Industry Share variables are the ratio of aggregate sales, assets, employment, and wages in
each industry in a state to aggregate sales, assets, employment, and wages across all industries in that state. The SOE Share
variables are the ratio of aggregate sales, assets, employment, and wages of state-owned enterprises in each industry by state
to aggregate sales, assets, employment, and wages in that industry by state. The Herfindahl Index is the sum of squares of the
market shares of all firms in each industry by state. Profit of 4 Largest Firms is the average ratio of EBDITA to sales of the
four largest (in terms of sales) firms in each industry by state. Future Sales Growth is the growth rate of sales in each industry
by state for the post-deregulation years 1992-1994. State Per Capita Income is the log of per capita GDP of each state. Indust-
-ry Wages is the log of aggregate salaries in each industry by state. Standard errors are in parentheses. Regressions are
corrected for heteroskedasticity and for clustering at the industry level.
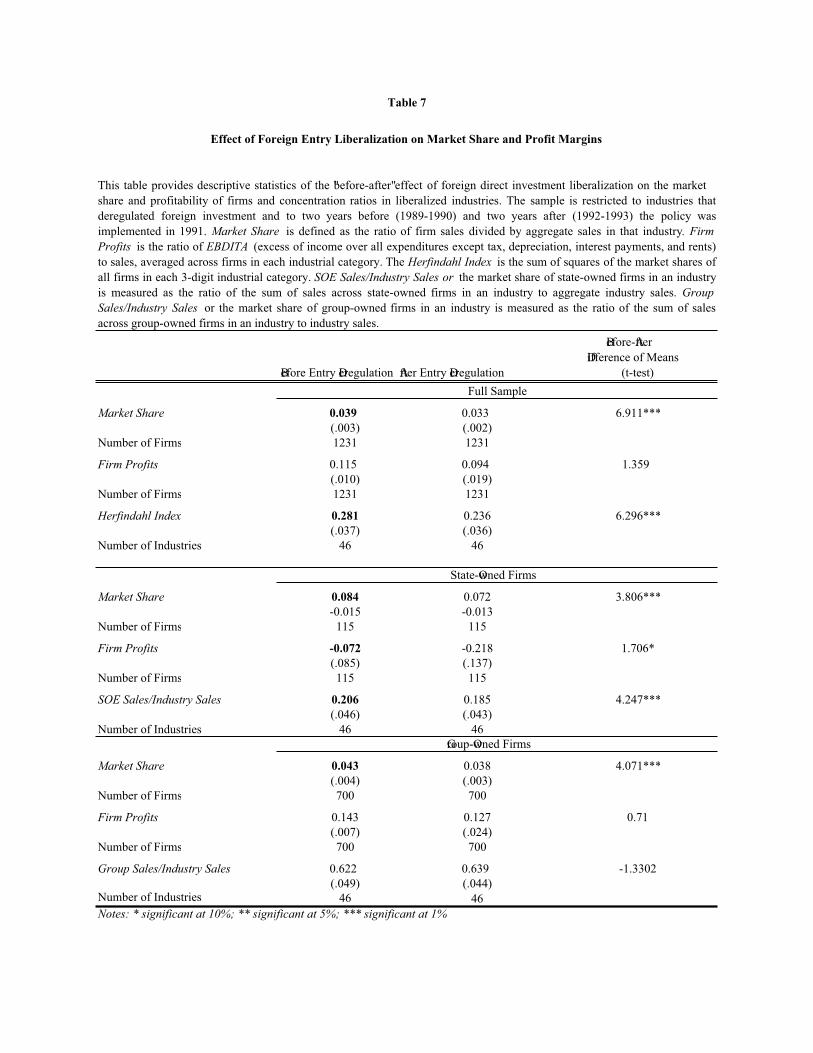
Before Entry Deregulation After Entry Deregulation
Before-After
Difference of Means
(t-test)
Market Share 0.039 0.033 6.911***
(.003) (.002)
Number of Firms 1231 1231
Firm Profits 0.115 0.094 1.359
(.010) (.019)
Number of Firms 1231 1231
Herfindahl Index 0.281 0.236 6.296***
(.037) (.036)
Number of Industries 46 46
Market Share 0.084 0.072 3.806***
-0.015 -0.013
Number of Firms 115 115
Firm Profits -0.072 -0.218 1.706*
(.085) (.137)
Number of Firms 115 115
SOE Sales/Industry Sales 0.206 0.185 4.247***
(.046) (.043)
Number of Industries 46 46
Market Share 0.043 0.038 4.071***
(.004) (.003)
Number of Firms 700 700
Firm Profits 0.143 0.127 0.71
(.007) (.024)
Number of Firms 700 700
Group Sales/Industry Sales 0.622 0.639 -1.3302
(.049) (.044)Number of Industries 46 46
This table provides descriptive statistics of the "before-after"effect of foreign direct investment liberalization on the market
share and profitability of firms and concentration ratios in liberalized industries. The sample is restricted to industries that
deregulated foreign investment and to two years before (1989-1990) and two years after (1992-1993) the policy was
implemented in 1991. Market Share is defined as the ratio of firm sales divided by aggregate sales in that industry. Firm
Profits is the ratio of EBDITA (excess of income over all expenditures except tax, depreciation, interest payments, and rents)
to sales, averaged across firms in each industrial category. The Herfindahl Index is the sum of squares of the market shares of
all firms in each 3-digit industrial category. SOE Sales/Industry Sales or the market share of state-owned firms in an industry
is measured as the ratio of the sum of sales across state-owned firms in an industry to aggregate industry sales. Group
Sales/Industry Sales or the market share of group-owned firms in an industry is measured as the ratio of the sum of sales
across group-owned firms in an industry to industry sales.
Effect of Foreign Entry Liberalization on Market Share and Profit Margins
Table 7
Notes: * significant at 10%; ** significant at 5%; *** significant at 1%
Full Sample
State-Owned Firms
Group-Owned Firms
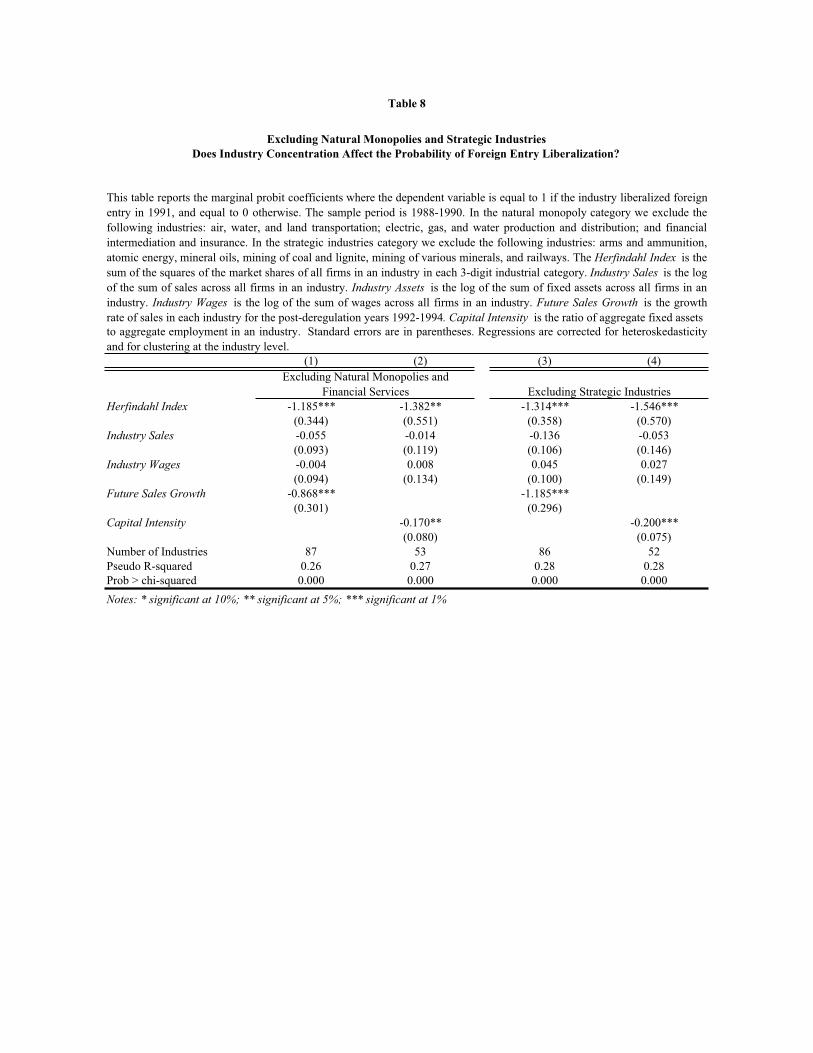
(1) (2) (3) (4)
Herfindahl Index -1.185*** -1.382** -1.314*** -1.546***
(0.344) (0.551) (0.358) (0.570)
Industry Sales -0.055 -0.014 -0.136 -0.053
(0.093) (0.119) (0.106) (0.146)
Industry Wages -0.004 0.008 0.045 0.027
(0.094) (0.134) (0.100) (0.149)
Future Sales Growth -0.868*** -1.185***
(0.301) (0.296)
Capital Intensity -0.170** -0.200***
(0.080) (0.075)
Number of Industries 87 53 86 52
Pseudo R-squared 0.26 0.27 0.28 0.28
Prob > chi-squared 0.000 0.000 0.000 0.000
Notes: * significant at 10%; ** significant at 5%; *** significant at 1%
Excluding Natural Monopolies and
Financial Services Excluding Strategic Industries
to aggregate employment in an industry. Standard errors are in parentheses. Regressions are corrected for heteroskedasticity
and for clustering at the industry level.
Table 8
Excluding Natural Monopolies and Strategic Industries
This table reports the marginal probit coefficients where the dependent variable is equal to 1 if the industry liberalized foreign
entry in 1991, and equal to 0 otherwise. The sample period is 1988-1990. In the natural monopoly category we exclude the
following industries: air, water, and land transportation; electric, gas, and water production and distribution; and financial
intermediation and insurance. In the strategic industries category we exclude the following industries: arms and ammunition,
atomic energy, mineral oils, mining of coal and lignite, mining of various minerals, and railways. The Herfindahl Index is the
sum of the squares of the market shares of all firms in an industry in each 3-digit industrial category. Industry Sales is the log
of the sum of sales across all firms in an industry. Industry Assets is the log of the sum of fixed assets across all firms in an
industry. Industry Wages is the log of the sum of wages across all firms in an industry. Future Sales Growth is the growth
rate of sales in each industry for the post-deregulation years 1992-1994. Capital Intensity is the ratio of aggregate fixed assets
Does Industry Concentration Affect the Probability of Foreign Entry Liberalization?
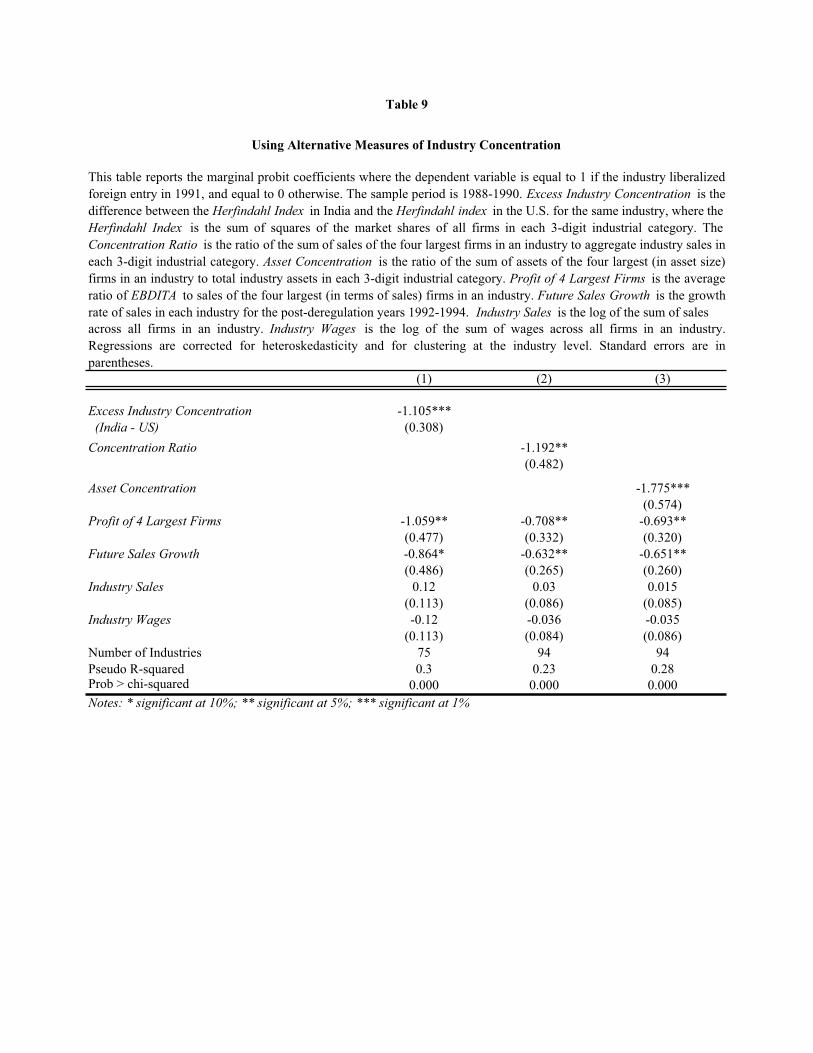
(1) (2) (3)
Excess Industry Concentration -1.105***
(India - US) (0.308)
Concentration Ratio -1.192**
(0.482)
Asset Concentration -1.775***
(0.574)
Profit of 4 Largest Firms -1.059** -0.708** -0.693**
(0.477) (0.332) (0.320)
Future Sales Growth -0.864* -0.632** -0.651**
(0.486) (0.265) (0.260)
Industry Sales 0.12 0.03 0.015
(0.113) (0.086) (0.085)
Industry Wages -0.12 -0.036 -0.035
(0.113) (0.084) (0.086)
Number of Industries 75 94 94
Pseudo R-squared 0.3 0.23 0.28Prob > chi-squared 0.000 0.000 0.000
Notes: * significant at 10%; ** significant at 5%; *** significant at 1%
This table reports the marginal probit coefficients where the dependent variable is equal to 1 if the industry liberalized
foreign entry in 1991, and equal to 0 otherwise. The sample period is 1988-1990. Excess Industry Concentration is the
difference between the Herfindahl Index in India and the Herfindahl index in the U.S. for the same industry, where the
Herfindahl Index is the sum of squares of the market shares of all firms in each 3-digit industrial category. The
Concentration Ratio is the ratio of the sum of sales of the four largest firms in an industry to aggregate industry sales in
each 3-digit industrial category. Asset Concentration is the ratio of the sum of assets of the four largest (in asset size)
firms in an industry to total industry assets in each 3-digit industrial category. Profit of 4 Largest Firms is the average
ratio of EBDITA to sales of the four largest (in terms of sales) firms in an industry. Future Sales Growth is the growth
rate of sales in each industry for the post-deregulation years 1992-1994. Industry Sales is the log of the sum of sales
across all firms in an industry. Industry Wages is the log of the sum of wages across all firms in an industry.
Regressions are corrected for heteroskedasticity and for clustering at the industry level. Standard errors are in
parentheses.
Using Alternative Measures of Industry Concentration
Table 9
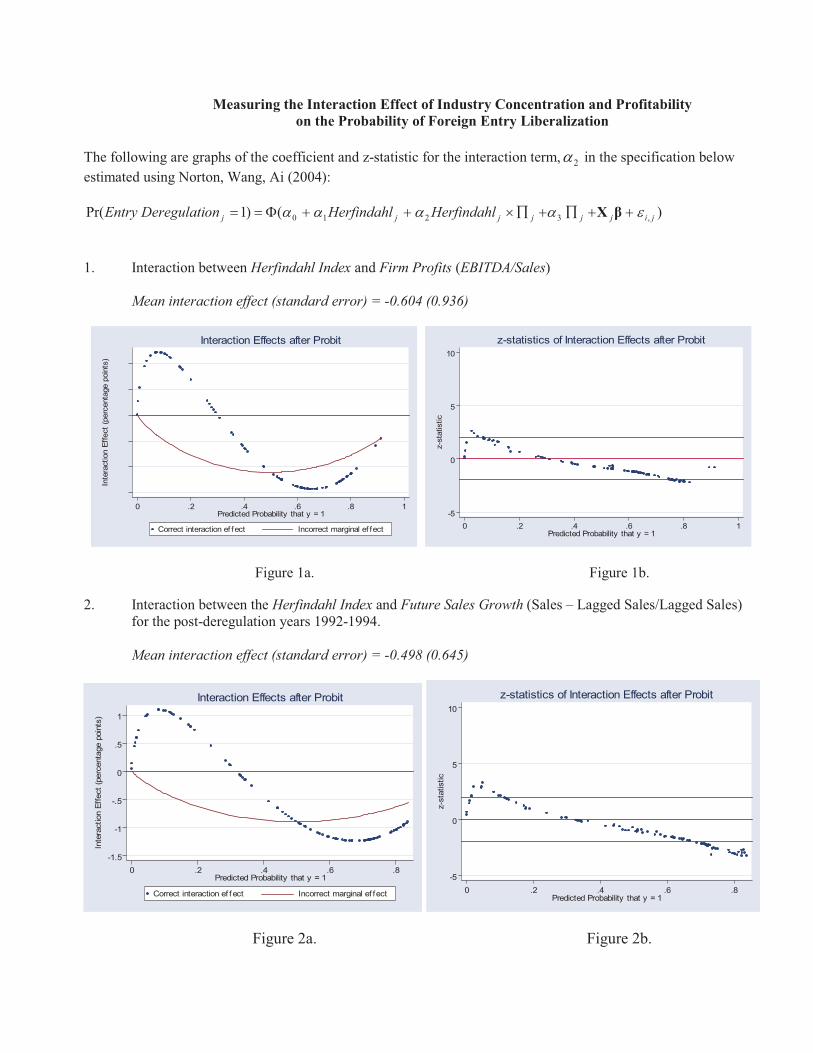
Measuring the Interaction Effect of Industry Concentration and Profitability
on the Probability of Foreign Entry Liberalization
The following are graphs of the coefficient and z-statistic for the interaction term, 2 in the specification below
estimated using Norton, Wang, Ai (2004):
)()1Pr( ,3210 jijjjjjj HerfindahlHerfindahlonDeregulatiEntry X
1. Interaction between Herfindahl Index and Firm Profits (EBITDA/Sales)
Mean interaction effect (standard error) = -0.604 (0.936)
Inte
raction E
ffect
(perc
enta
ge p
oin
ts)
0 .2 .4 .6 .8 1Predicted Probability that y = 1
Correct interaction ef fect Incorrect marginal ef fect
Interaction Effects after Probit
-5
0
5
10
z-s
tatistic
0 .2 .4 .6 .8 1Predicted Probability that y = 1
z-statistics of Interaction Effects after Probit
Figure 1a. Figure 1b.
2. Interaction between the Herfindahl Index and Future Sales Growth (Sales – Lagged Sales/Lagged Sales) for the post-deregulation years 1992-1994.
Mean interaction effect (standard error) = -0.498 (0.645)
-1.5
-1
-.5
0
.5
1
Inte
raction E
ffect
(perc
enta
ge p
oin
ts)
0 .2 .4 .6 .8Predicted Probability that y = 1
Correct interaction ef fect Incorrect marginal ef fect
Interaction Effects after Probit
-5
0
5
10
z-s
tatistic
0 .2 .4 .6 .8Predicted Probability that y = 1
z-statistics of Interaction Effects after Probit
Figure 2a. Figure 2b.