Embed Size (px)
Citation preview
i
The influence of cultural dimensions on entrepreneurial intention in Madagascar’s rural areas
Fenosoa A Ratsimanetrimanana
A research report submitted to the Faculty of Commerce, Law and
Management, University of the Witwatersrand, in partial fulfilment of the
requirements for the degree of Master of Management in Entrepreneurship
and New Venture Creation (MMENVC)
Johannesburg, 2014
ii
ABSTRACT
Understanding the triggers of the intention was, is and will be at the heart of
scholars’ preoccupations when dealing with the universe of entrepreneurship.
This unique pioneering research aimed at comparing the Malagasy main ethnic
groups in terms of measures of cultural dimensions and perceived desirability
and examining the effects of this perceived desirability on the relations between
cultural dimensions and entrepreneurial intention.
A non-experimental cross-sectional survey, based on a cluster sampling with
quota approach comprising three sub-samples of ethnic groups and a
structured questionnaire directly administrated by trained interviewers, was the
source of data of the research. The use of relevant robust statistical tests
characterised the data processing of the research, which revealed that there is
no important difference in the measures of cultural dimensions among main
ethnic groups in Madagascar’s rural areas. The level of perceived desirability
and the relationships between cultural dimensions and entrepreneurial intention
are not importantly moderated by perceived desirability among the main ethnic
groups in Madagascar’s rural areas. Furthermore, it has been discovered that to
some extent, Madagascar would not be a country of ethnic diversity and
beginning to understand the Malagasy entrepreneurial profile based on cultural
dimension, perceived desirability and entrepreneurial intention is possible.
Within the context of an unprecedented level of poverty of the population of
Madagascar, which strangles the way to a harmonious and sustainable
development, the findings of the research would make an invaluable
contribution to the setting up or the refining of policies and strategies targeting
the promotion of entrepreneurship in general and self-employment in particular.
It is broadly acknowledged that the key to alleviating poverty is based on the
encouragement of self-employment of all individuals.


iv
DEDICATION
To my beautiful wife and my beloved sons,
with profound respect for my late father
and my always young mother.
God willing, nothing is impossible.
“Overcoming poverty is not a task of charity. It is an act of justice. Like slavery and apartheid, poverty is not natural. It is man-made and it can be overcome and eradicated by the actions of human beings. Sometimes it falls on a generation to be great. YOU can be that great generation. Let your greatness blossom.”
Nelson Mandela

v
ACKNOWLEDGEMENTS
My first words are to thank the Almighty God who gave me health and energy
throughout this exciting and enthralling travel of preparation of the Master’s
degree of Management in Entrepreneurship and New Venture Creation
(MMENVC).
Then, I would like to convey my deep gratitude to Professor Boris Urban for
accepting to supervise this work. His judicious advice was to me an invaluable
contribution to strengthening my steps towards the difficult pathway of capturing
the genuine entrepreneurial mind-set.
But, my humble knowledge with regard to entrepreneurship could never be as
well moulded without that which has been transmitted with true passion by our
eminent professors and valorous contributors. It is the same for my very brave
schoolfellows whose priceless contributions during the various courses were
most appreciated. I will not forget my brother Professor Rijamampianina
Rasoava for his precious time, discussing our country and from which the
subject of this research germinated. All of you will find here the expression of
my insightful recognition.
The administrative staff of Wits Business School also deserves to be
mentioned, their role was the driving belt in the fluxing of the relationship
between students and the administration. Sincerely, I thank you very much.
I cannot hide the remarkable work of the teams on the ground (supervisors and
interviewers), their enthusiasm and professionalism allowed the collection of
invaluable data; which, once processed, constituted the raw material for this
research. It is worth noting that these data could not be collected without the
goodwill of all the interviewed people and the frank collaboration of the relevant
administrative authorities in delivering on time all required authorisations. For all
of you, a thousand thanks.

vi
Last, but not least, I could never have arrived at the end of this prestigious
training program without the deep understanding of my family. Profound
gratitude to my adorable wife for her patience and unwavering support. My high
appreciation also to my beloved sons for not making a great case for the fact
that I was absent at home while being present at school for long months.
Definitely, “I can do everything through him who gives me strength” (Philippians
4: 13). To Him alone would be the endless Glory!
vii
TABLE OF CONTENTS
ABSTRACT ....................................................................................................... ii
DECLARATION ................................................................................................ iii
DEDICATION .................................................................................................... iv
ACKNOWLEDGEMENTS .................................................................................. v
TABLE OF CONTENTS .................................................................................. vii
LIST OF TABLES ........................................................................................... xiv
LIST OF FIGURES ......................................................................................... xvi
CHAPTER 1: INTRODUCTION ......................................................................... 1
1.1 PURPOSE OF THE RESEARCH .................................................................... 1
1.2 CONTEXT OF THE RESEARCH .................................................................... 1
1.3 PROBLEM STATEMENT .............................................................................. 8
1.3.1 MAIN PROBLEM ..................................................................................... 8
1.3.2 SUB-PROBLEM 1 ...................................................................................... 8
1.3.3 SUB-PROBLEM 2 ...................................................................................... 8
1.3.4 SUB-PROBLEM 3 ...................................................................................... 8
1.4 SIGNIFICANCE OF THE RESEARCH .............................................................. 9
1.5 DELIMITATION OF THE RESEARCH ............................................................ 10
1.6 ASSUMPTIONS ....................................................................................... 11
CHAPTER 2: LITERATURE REVIEW ............................................................. 12
2.1 INTRODUCTION ...................................................................................... 12
2.2 BACKGROUND DISCUSSION ..................................................................... 12
2.2.1 ENTREPRENEURSHIP, ENTREPRENEURIAL INTENTION AND PERCEIVED
DESIRABILITY .......................................................................................12
2.2.2 CULTURAL DIMENSION THEORY .............................................................18
2.2.3 CONCEPTS OF ETHNIC GROUP AND ETHNIC IDENTITY ................................22
2.3 CULTURAL DIMENSIONS BY MAIN ETHNIC GROUP IN MADAGASCAR’S RURAL
AREAS .................................................................................................. 23
2.3.1 MALAGASY MAIN ETHNIC GROUPS AND CULTURAL DIMENSIONS ...............23
2.3.2 HYPOTHESIS 1 ....................................................................................25
2.4 PERCEIVED DESIRABILITY BY MAIN ETHNIC GROUP IN MADAGASCAR’S RURAL
AREAS .................................................................................................. 26
2.4.1 MALAGASY MAIN ETHNIC GROUPS AND PERCEIVED DESIRABILITY ............26
2.4.2 HYPOTHESIS 2 ....................................................................................26
viii
2.5 CULTURAL DIMENSIONS, ENTREPRENEURIAL INTENTION AND PERCEIVED
DESIRABILITY IN MADAGASCAR’S RURAL AREAS ........................................ 26
2.5.1 PERCEIVED DESIRABILITY AS A MODERATOR OF THE RELATION BETWEEN
CULTURAL DIMENSIONS AND ENTREPRENEURIAL INTENTION ....................26
2.5.2 HYPOTHESIS 3 ....................................................................................28
2.6 CONCLUSION OF LITERATURE REVIEW ..................................................... 29
CHAPTER 3: RESEARCH METHODOLOGY ................................................. 32
3.1 RESEARCH METHODOLOGY ..................................................................... 32
3.2 RESEARCH DESIGN ................................................................................ 32
3.3 POPULATION AND SAMPLE ...................................................................... 33
3.3.1 POPULATION .......................................................................................33
3.3.2 SAMPLE AND SAMPLING METHOD ..........................................................33
3.4 THE RESEARCH INSTRUMENT .................................................................. 36
3.5 PROCEDURE FOR DATA COLLECTION ....................................................... 41
3.6 DATA ANALYSIS AND INTERPRETATION ..................................................... 41
3.6.1 SCALE RELIABILITY ..............................................................................41
3.6.2 SCALE VALIDITY ...................................................................................43
3.6.3 TESTING OF HYPOTHESES 1 AND 2 ........................................................44
3.6.4 TESTING OF HYPOTHESIS 3 ..................................................................47
3.7 LIMITATION OF THE STUDY ...................................................................... 53
3.8 VALIDITY AND RELIABILITY ...................................................................... 54
3.8.1 EXTERNAL VALIDITY .............................................................................54
3.8.2 INTERNAL VALIDITY ..............................................................................54
3.8.3 RELIABILITY .........................................................................................55
CHAPTER 4: PRESENTATION OF THE RESULTS ....................................... 56
4.1 DEMOGRAPHIC PROFILE OF RESPONDENTS .............................................. 56
4.1.1 COMPLETENESS OF DATA .....................................................................56
4.1.2 GENDER, MAIN ETHNIC GROUPS AND LEVEL OF EDUCATION ....................57
4.1.3 GENDER, MAIN ETHNIC GROUPS AND AGE ..............................................58
4.2 SCALE CHARACTERISTICS ....................................................................... 59
4.2.1 SCALE RELIABILITY ..............................................................................59
4.2.2 SCALE VALIDITY ...................................................................................63
4.3 TESTING OF HYPOTHESIS 1 ..................................................................... 70
4.3.1 HOMOGENEITY OF VARIANCE OF THE MEASURES OF CULTURAL DIMENSIONS
IN MADAGASCAR’S RURAL AREAS ..........................................................70
4.3.2 ONE-WAY ANOVA APPLIED TO CULTURAL DIMENSIONS IN MADAGASCAR’S
RURAL AREAS ......................................................................................70
4.4 TESTING OF HYPOTHESIS 2 ..................................................................... 73
4.4.1 HOMOGENEITY OF VARIANCE OF THE LEVEL OF PERCEIVED DESIRABILITY IN
MADAGASCAR’S RURAL AREAS .............................................................73
4.4.2 ONE-WAY ANOVA APPLIED TO PERCEIVED DESIRABILITY IN
MADAGASCAR’S RURAL AREAS .............................................................74
ix
4.5 TESTING OF HYPOTHESIS 3 ..................................................................... 75
4.5.1 WITH REGARD TO THE RELATIONSHIP BETWEEN THE POWER DISTANCE
DIMENSION AND ENTREPRENEURIAL INTENTION ......................................75
4.5.2 WITH REGARD TO THE RELATIONSHIP BETWEEN THE INDIVIDUALISM
VERSUS COLLECTIVISM DIMENSION AND ENTREPRENEURIAL INTENTION ...76
4.5.3 WITH REGARD TO THE RELATIONSHIP BETWEEN THE UNCERTAINTY
AVOIDANCE DIMENSION AND ENTREPRENEURIAL INTENTION ....................77
4.5.4 WITH REGARD TO THE RELATIONSHIP BETWEEN THE MASCULINITY VERSUS
FEMININITY DIMENSION AND ENTREPRENEURIAL INTENTION.....................78
4.5.5 WITH REGARD TO THE RELATIONSHIP BETWEEN THE LONG-TERM VERSUS
SHORT-TERM ORIENTATION DIMENSION AND ENTREPRENEURIAL INTENTION
..........................................................................................................80
4.5.6 WITH REGARD TO THE RELATIONSHIP BETWEEN THE INDULGENCE VERSUS
RESTRAINT DIMENSION AND ENTREPRENEURIAL INTENTION.....................81
4.6 SUMMARY ............................................................................................. 87
CHAPTER 5: DISCUSSION OF THE RESULTS ............................................. 91
5.1 DISCUSSION PERTAINING TO HYPOTHESIS 1 ............................................. 91
5.2 DISCUSSION PERTAINING TO HYPOTHESIS 2 ............................................. 94
5.3 DISCUSSION PERTAINING TO HYPOTHESIS 3 ............................................. 95
5.4 CONCLUSION ........................................................................................ 97
CHAPTER 6: CONCLUSION AND RECOMMENDATIONS ........................... 99
6.1 CONCLUSION OF THE RESEARCH ............................................................. 99
6.2 RECOMMENDATIONS ............................................................................ 102
6.3 SUGGESTIONS FOR FURTHER RESEARCH ............................................... 103
REFERENCES ............................................................................................... 105
APPENDIX A: RESEARCH INSTRUMENT................................................... 117
APPENDIX B: ADDITIONAL RESULTS TABLES ........................................ 122
TABLE B-1: OWNING RATE OF NON-AGRICULTURAL ENTERPRISE AND
AGRICULTURAL WAGE-EARNING ENTERPRISE BY REGION AND RESIDENCE AREA. 122
TABLE B-2: DISTRIBUTION OF RESPONDENTS WITH REGARD TO GENDER, MAIN
ETHNIC GROUPS AND AGE .............................................................................. 123
TABLE B-3: DESCRIPTIVE STATISTICS RELATED TO CULTURAL DIMENSION SCALES
IN MADAGASCAR’S RURAL AREAS ................................................................... 123
TABLE B-4: POWER DISTANCE SCALE CORRELATION MATRIX ............................ 125
TABLE B-5: INDIVIDUALISM VERSUS COLLECTIVISM SCALE CORRELATION MATRIX ....
........................................................................................................ 125
TABLE B-6: UNCERTAINTY AVOIDANCE SCALE CORRELATION MATRIX ................ 125
TABLE B-7: MASCULINITY VERSUS FEMININITY SCALE CORRELATION MATRIX ..... 125
TABLE B-8: LONG-TERM VERSUS SHORT-TERM ORIENTATION SCALE CORRELATION
MATRIX ........................................................................................................ 125
TABLE B-9: INDULGENCE VERSUS RESTRAINT SCALE CORRELATION MATRIX ...... 126
TABLE B-10: POWER DISTANCE SCALE ANTI-IMAGE CORRELATION MATRIX ........ 126
x
TABLE B-11: INDIVIDUALISM VERSUS COLLECTIVISM SCALE ANTI-IMAGE
CORRELATION MATRIX.................................................................................... 126
TABLE B-12: UNCERTAINTY AVOIDANCE SCALE ANTI-IMAGE CORRELATION MATRIX .
........................................................................................................ 126
TABLE B-13: MASCULINITY VERSUS FEMININITY SCALE ANTI-IMAGE CORRELATION
MATRIX ........................................................................................................ 126
TABLE B-14: LONG-TERM VERSUS SHORT-TERM ORIENTATION SCALE ANTI-IMAGE
CORRELATION MATRIX.................................................................................... 127
TABLE B-15: INDULGENCE VERSUS RESTRAINT SCALE ANTI-IMAGE CORRELATION
MATRIX ........................................................................................................ 127
TABLE B-16: COMMUNALITIES OF POWER DISTANCE SCALE .............................. 127
TABLE B-17: REVISED COMMUNALITIES OF POWER DISTANCE SCALE ................ 127
TABLE B-18: COMMUNALITIES OF INDIVIDUALISM VERSUS COLLECTIVISM SCALE 127
TABLE B-19: COMMUNALITIES OF UNCERTAINTY AVOIDANCE SCALE .................. 128
TABLE B-20: REVISED COMMUNALITIES OF UNCERTAINTY AVOIDANCE SCALE .... 128
TABLE B-21: COMMUNALITIES OF MASCULINITY VERSUS FEMININITY SCALE ....... 128
TABLE B-22: REVISED COMMUNALITIES OF MASCULINITY VERSUS FEMININITY SCALE
........................................................................................................ 128
TABLE B-23: COMMUNALITIES OF LONG-TERM VERSUS SHORT-TERM ORIENTATION
SCALE ........................................................................................................ 128
TABLE B-24: COMMUNALITIES OF INDULGENCE VERSUS RESTRAINT SCALE ....... 128
TABLE B-25: REVISED COMMUNALITIES OF INDULGENCE VERSUS RESTRAINT SCALE
........................................................................................................ 129
TABLE B-26: TOTAL VARIANCE EXPLAINED FOR POWER DISTANCE SCALE .......... 129
TABLE B-27: TOTAL VARIANCE EXPLAINED FOR INDIVIDUALISM VERSUS
COLLECTIVISM SCALE ..................................................................................... 129
TABLE B-28: TOTAL VARIANCE EXPLAINED FOR UNCERTAINTY AVOIDANCE SCALE ...
........................................................................................................ 129
TABLE B-29: TOTAL VARIANCE EXPLAINED FOR MASCULINITY VERSUS FEMININITY
SCALE ........................................................................................................ 130
TABLE B-30: TOTAL VARIANCE EXPLAINED FOR LONG-TERM VERSUS SHORT-TERM
ORIENTATION SCALE ...................................................................................... 130
TABLE B-31: TOTAL VARIANCE EXPLAINED FOR INDULGENCE VERSUS RESTRAINT
SCALE ........................................................................................................ 130
TABLE B-32: MODERATION EFFECT OF THE PERCEIVED DESIRABILITY ON THE
RELATIONSHIP BETWEEN POWER DISTANCE DIMENSION AND ENTREPRENEURIAL
INTENTION WITHIN THE HIGHLANDER GROUP IN MADAGASCAR’S RURAL AREAS (9
CELLS MEANS) ............................................................................................... 131
FIGURE B-1: MODERATION EFFECT OF PERCEIVED DESIRABILITY ON THE
RELATIONSHIP BETWEEN POWER DISTANCE DIMENSION AND ENTREPRENEURIAL
INTENTION AMONG THE HIGHLANDER GROUP ................................................... 131
TABLE B-33: MODERATION EFFECT OF THE PERCEIVED DESIRABILITY ON THE
RELATIONSHIP BETWEEN POWER DISTANCE DIMENSION AND ENTREPRENEURIAL
INTENTION WITHIN THE OVERALL GROUP IN MADAGASCAR’S RURAL AREAS (9 CELLS
MEANS) ........................................................................................................ 132
xi
FIGURE B-2: MODERATION EFFECT OF PERCEIVED DESIRABILITY ON THE
RELATIONSHIP BETWEEN POWER DISTANCE DIMENSION AND ENTREPRENEURIAL
INTENTION WITHIN THE OVERALL GROUP ......................................................... 132
TABLE B-34: MODERATION EFFECT OF THE PERCEIVED DESIRABILITY ON THE
RELATIONSHIP BETWEEN INDIVIDUALISM VERSUS COLLECTIVISM DIMENSION AND
ENTREPRENEURIAL INTENTION WITHIN THE HIGHLANDER GROUP IN MADAGASCAR’S
RURAL AREAS (9 CELLS MEANS) ...................................................................... 133
FIGURE B-3: MODERATION EFFECT OF PERCEIVED DESIRABILITY ON THE
RELATIONSHIP BETWEEN INDIVIDUALISM VERSUS COLLECTIVISM DIMENSION AND
ENTREPRENEURIAL INTENTION AMONG HIGHLANDER GROUP ............................. 133
TABLE B-35: MODERATION EFFECT OF THE PERCEIVED DESIRABILITY ON THE
RELATIONSHIP BETWEEN UNCERTAINTY AVOIDANCE DIMENSION AND
ENTREPRENEURIAL INTENTION WITHIN THE HIGHLANDER GROUP IN MADAGASCAR’S
RURAL AREAS (9 CELLS MEANS) ...................................................................... 134
FIGURE B-4: MODERATION EFFECT OF PERCEIVED DESIRABILITY ON THE
RELATIONSHIP BETWEEN UNCERTAINTY AVOIDANCE DIMENSION AND
ENTREPRENEURIAL INTENTION AMONG HIGHLANDER GROUP ............................. 134
TABLE B-36: MODERATION EFFECT OF THE PERCEIVED DESIRABILITY ON THE
RELATIONSHIP BETWEEN UNCERTAINTY AVOIDANCE DIMENSION AND
ENTREPRENEURIAL INTENTION WITHIN THE OVERALL GROUP IN MADAGASCAR’S
RURAL AREAS (9 CELLS MEANS) ...................................................................... 135
FIGURE B-5: MODERATION EFFECT OF PERCEIVED DESIRABILITY ON THE
RELATIONSHIP BETWEEN UNCERTAINTY AVOIDANCE DIMENSION AND
ENTREPRENEURIAL INTENTION WITHIN THE OVERALL GROUP ............................ 135
TABLE B-37: MODERATION EFFECT OF THE PERCEIVED DESIRABILITY ON THE
RELATIONSHIP BETWEEN MASCULINITY VERSUS FEMININITY DIMENSION AND
ENTREPRENEURIAL INTENTION WITHIN THE COASTAL GROUP IN MADAGASCAR’S
RURAL AREAS (9 CELLS MEANS) ...................................................................... 136
FIGURE B-6: MODERATION EFFECT OF PERCEIVED DESIRABILITY ON THE
RELATIONSHIP BETWEEN MASCULINITY VERSUS FEMININITY DIMENSION AND
ENTREPRENEURIAL INTENTION AMONG COASTAL GROUP .................................. 136
TABLE B-38: MODERATION EFFECT OF THE PERCEIVED DESIRABILITY ON THE
RELATIONSHIP BETWEEN MASCULINITY VERSUS FEMININITY DIMENSION AND
ENTREPRENEURIAL INTENTION WITHIN THE HIGHLANDER GROUP IN MADAGASCAR’S
RURAL AREAS (9 CELLS MEANS) ...................................................................... 137
FIGURE B-7: MODERATION EFFECT OF PERCEIVED DESIRABILITY ON THE
RELATIONSHIP BETWEEN MASCULINITY VERSUS FEMININITY DIMENSION AND
ENTREPRENEURIAL INTENTION AMONG HIGHLANDER GROUP ............................. 137
TABLE B-39: MODERATION EFFECT OF THE PERCEIVED DESIRABILITY ON THE
RELATIONSHIP BETWEEN MASCULINITY VERSUS FEMININITY DIMENSION AND
ENTREPRENEURIAL INTENTION WITHIN THE INTERMEDIARY GROUP IN
MADAGASCAR’S RURAL AREAS (9 CELLS MEANS) ............................................. 138
FIGURE B-8: MODERATION EFFECT OF PERCEIVED DESIRABILITY ON THE
RELATIONSHIP BETWEEN MASCULINITY VERSUS FEMININITY DIMENSION AND
ENTREPRENEURIAL INTENTION AMONG INTERMEDIARY GROUP .......................... 138
xii
TABLE B-40: MODERATION EFFECT OF THE PERCEIVED DESIRABILITY ON THE
RELATIONSHIP BETWEEN MASCULINITY VERSUS FEMININITY DIMENSION AND
ENTREPRENEURIAL INTENTION WITHIN THE OVERALL GROUP IN MADAGASCAR’S
RURAL AREAS (9 CELLS MEANS) ...................................................................... 139
FIGURE B-9: MODERATION EFFECT OF PERCEIVED DESIRABILITY ON THE
RELATIONSHIP BETWEEN MASCULINITY VERSUS FEMININITY DIMENSION AND
ENTREPRENEURIAL INTENTION WITHIN THE OVERALL GROUP ............................ 139
TABLE B-41: MODERATION EFFECT OF THE PERCEIVED DESIRABILITY ON THE
RELATIONSHIP BETWEEN LONG-TERM VERSUS SHORT-TERM ORIENTATION
DIMENSION AND ENTREPRENEURIAL INTENTION WITHIN THE HIGHLANDER GROUP IN
MADAGASCAR’S RURAL AREAS (9 CELLS MEANS) ............................................. 140
FIGURE B-10: MODERATION EFFECT OF PERCEIVED DESIRABILITY ON THE
RELATIONSHIP BETWEEN LONG-TERM VERSUS SHORT-TERM ORIENTATION
DIMENSION AND ENTREPRENEURIAL INTENTION AMONG HIGHLANDER GROUP ..... 140
TABLE B-42: MODERATION EFFECT OF THE PERCEIVED DESIRABILITY ON THE
RELATIONSHIP BETWEEN LONG-TERM VERSUS SHORT-TERM ORIENTATION
DIMENSION AND ENTREPRENEURIAL INTENTION WITHIN THE OVERALL GROUP IN
MADAGASCAR’S RURAL AREAS (9 CELLS MEANS) ............................................. 141
FIGURE B-11: MODERATION EFFECT OF PERCEIVED DESIRABILITY ON THE
RELATIONSHIP BETWEEN LONG-TERM VERSUS SHORT-TERM ORIENTATION
DIMENSION AND ENTREPRENEURIAL INTENTION WITHIN THE OVERALL GROUP .... 141
TABLE B-43: MODERATION EFFECT OF THE PERCEIVED DESIRABILITY ON THE
RELATIONSHIP BETWEEN INDULGENCE VERSUS RESTRAINT DIMENSION AND
ENTREPRENEURIAL INTENTION WITHIN THE COASTAL GROUP IN MADAGASCAR’S
RURAL AREAS (9 CELLS MEANS) ...................................................................... 142
FIGURE B-12: MODERATION EFFECT OF PERCEIVED DESIRABILITY ON THE
RELATIONSHIP BETWEEN INDULGENCE VERSUS RESTRAINT DIMENSION AND
ENTREPRENEURIAL INTENTION AMONG COASTAL GROUP .................................. 142
TABLE B-44: MODERATION EFFECT OF THE PERCEIVED DESIRABILITY ON THE
RELATIONSHIP BETWEEN INDULGENCE VERSUS RESTRAINT DIMENSION AND
ENTREPRENEURIAL INTENTION WITHIN THE HIGHLANDER GROUP IN MADAGASCAR’S
RURAL AREAS (9 CELLS MEANS) ...................................................................... 143
FIGURE B-13: MODERATION EFFECT OF PERCEIVED DESIRABILITY ON THE
RELATIONSHIP BETWEEN INDULGENCE VERSUS RESTRAINT DIMENSION AND
ENTREPRENEURIAL INTENTION AMONG HIGHLANDER GROUP ............................. 143
TABLE B-45: MODERATION EFFECT OF THE PERCEIVED DESIRABILITY ON THE
RELATIONSHIP BETWEEN INDULGENCE VERSUS RESTRAINT DIMENSION AND
ENTREPRENEURIAL INTENTION WITHIN THE INTERMEDIARY GROUP IN
MADAGASCAR’S RURAL AREAS (9 CELLS MEANS) ............................................. 144
FIGURE B-14: MODERATION EFFECT OF PERCEIVED DESIRABILITY ON THE
RELATIONSHIP BETWEEN INDULGENCE VERSUS RESTRAINT DIMENSION AND
ENTREPRENEURIAL INTENTION AMONG INTERMEDIARY GROUP .......................... 144
TABLE B-46: MODERATION EFFECT OF THE PERCEIVED DESIRABILITY ON THE
RELATIONSHIP BETWEEN INDULGENCE VERSUS RESTRAINT DIMENSION AND
ENTREPRENEURIAL INTENTION WITHIN THE OVERALL GROUP IN MADAGASCAR’S
RURAL AREAS (9 CELLS MEANS) ...................................................................... 145
xiii
FIGURE B-15: MODERATION EFFECT OF PERCEIVED DESIRABILITY ON THE
RELATIONSHIP BETWEEN INDULGENCE VERSUS RESTRAINT DIMENSION AND
ENTREPRENEURIAL INTENTION WITHIN THE OVERALL GROUP ............................ 145
TABLE B-47: MEANS AND STANDARD DEVIATIONS OF STUDIED SCALES WITHIN MAIN
ETHNICS GROUPS IN MADAGASCAR’S RURAL AREAS ......................................... 146
TABLE B-48: TRICHROMATIZATION OF MEANS VALUES OF STUDIED SCALES WITHIN
MAIN ETHNICS GROUPS IN MADAGASCAR’S RURAL AREAS ................................. 146
TABLE B-49: HOFSTEDE CULTURAL DIMENSIONS AND DETERMINANTS OF
ENTREPRENEURSHIP ..................................................................................... 147
TABLE B-50: HOFSTEDE CULTURAL DIMENSIONS AND DETERMINANTS OF
ENTREPRENEURSHIP APPLIED TO THE CONTEXT OF MADAGASCAR’S RURAL AREAS .
........................................................................................................ 147
APPENDIX C: CONSISTENCY MATRIX ...................................................... 148
xiv
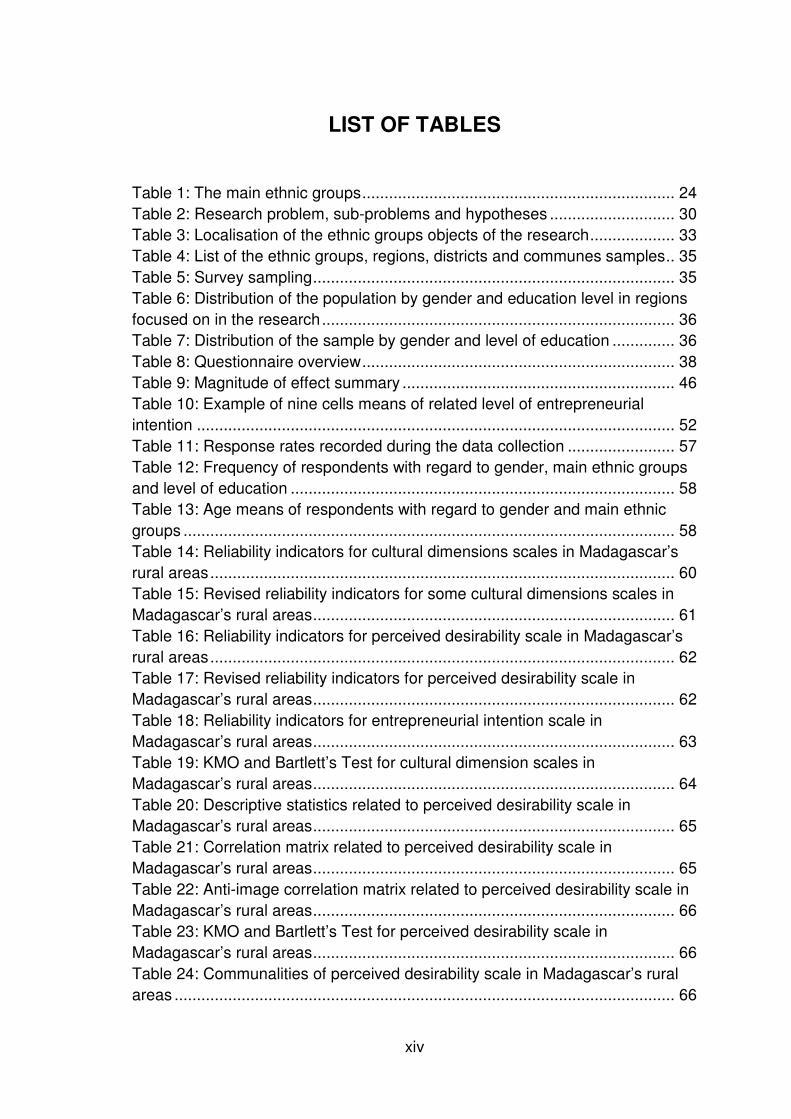
LIST OF TABLES
Table 1: The main ethnic groups ...................................................................... 24
Table 2: Research problem, sub-problems and hypotheses ............................ 30
Table 3: Localisation of the ethnic groups objects of the research ................... 33
Table 4: List of the ethnic groups, regions, districts and communes samples .. 35
Table 5: Survey sampling ................................................................................. 35
Table 6: Distribution of the population by gender and education level in regions
focused on in the research ............................................................................... 36
Table 7: Distribution of the sample by gender and level of education .............. 36
Table 8: Questionnaire overview ...................................................................... 38
Table 9: Magnitude of effect summary ............................................................. 46
Table 10: Example of nine cells means of related level of entrepreneurial
intention ........................................................................................................... 52
Table 11: Response rates recorded during the data collection ........................ 57
Table 12: Frequency of respondents with regard to gender, main ethnic groups
and level of education ...................................................................................... 58
Table 13: Age means of respondents with regard to gender and main ethnic
groups .............................................................................................................. 58
Table 14: Reliability indicators for cultural dimensions scales in Madagascar’s
rural areas ........................................................................................................ 60
Table 15: Revised reliability indicators for some cultural dimensions scales in
Madagascar’s rural areas ................................................................................. 61
Table 16: Reliability indicators for perceived desirability scale in Madagascar’s
rural areas ........................................................................................................ 62
Table 17: Revised reliability indicators for perceived desirability scale in
Madagascar’s rural areas ................................................................................. 62
Table 18: Reliability indicators for entrepreneurial intention scale in
Madagascar’s rural areas ................................................................................. 63
Table 19: KMO and Bartlett’s Test for cultural dimension scales in
Madagascar’s rural areas ................................................................................. 64
Table 20: Descriptive statistics related to perceived desirability scale in
Madagascar’s rural areas ................................................................................. 65
Table 21: Correlation matrix related to perceived desirability scale in
Madagascar’s rural areas ................................................................................. 65
Table 22: Anti-image correlation matrix related to perceived desirability scale in
Madagascar’s rural areas ................................................................................. 66
Table 23: KMO and Bartlett’s Test for perceived desirability scale in
Madagascar’s rural areas ................................................................................. 66
Table 24: Communalities of perceived desirability scale in Madagascar’s rural
areas ................................................................................................................ 66
xv
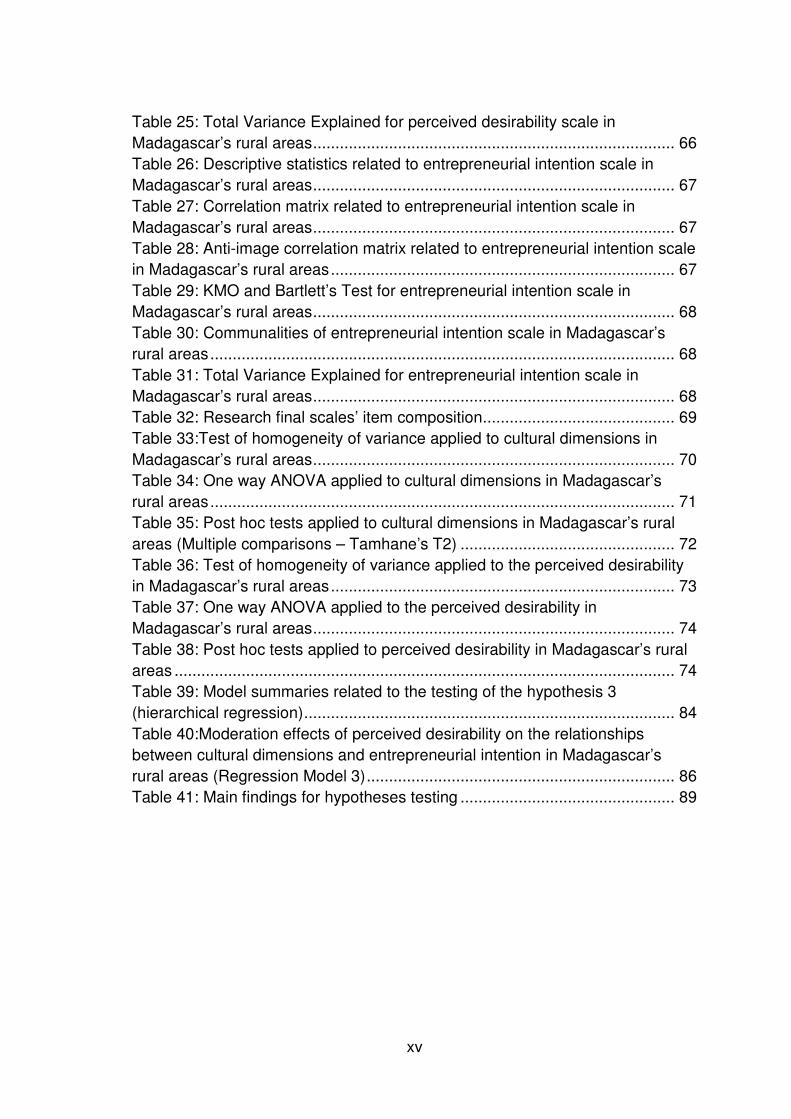
Table 25: Total Variance Explained for perceived desirability scale in
Madagascar’s rural areas ................................................................................. 66
Table 26: Descriptive statistics related to entrepreneurial intention scale in
Madagascar’s rural areas ................................................................................. 67
Table 27: Correlation matrix related to entrepreneurial intention scale in
Madagascar’s rural areas ................................................................................. 67
Table 28: Anti-image correlation matrix related to entrepreneurial intention scale
in Madagascar’s rural areas ............................................................................. 67
Table 29: KMO and Bartlett’s Test for entrepreneurial intention scale in
Madagascar’s rural areas ................................................................................. 68
Table 30: Communalities of entrepreneurial intention scale in Madagascar’s
rural areas ........................................................................................................ 68
Table 31: Total Variance Explained for entrepreneurial intention scale in
Madagascar’s rural areas ................................................................................. 68
Table 32: Research final scales’ item composition ........................................... 69
Table 33:Test of homogeneity of variance applied to cultural dimensions in
Madagascar’s rural areas ................................................................................. 70
Table 34: One way ANOVA applied to cultural dimensions in Madagascar’s
rural areas ........................................................................................................ 71
Table 35: Post hoc tests applied to cultural dimensions in Madagascar’s rural
areas (Multiple comparisons – Tamhane’s T2) ................................................ 72
Table 36: Test of homogeneity of variance applied to the perceived desirability
in Madagascar’s rural areas ............................................................................. 73
Table 37: One way ANOVA applied to the perceived desirability in
Madagascar’s rural areas ................................................................................. 74
Table 38: Post hoc tests applied to perceived desirability in Madagascar’s rural
areas ................................................................................................................ 74
Table 39: Model summaries related to the testing of the hypothesis 3
(hierarchical regression) ................................................................................... 84
Table 40:Moderation effects of perceived desirability on the relationships
between cultural dimensions and entrepreneurial intention in Madagascar’s
rural areas (Regression Model 3) ..................................................................... 86
Table 41: Main findings for hypotheses testing ................................................ 89
xvi
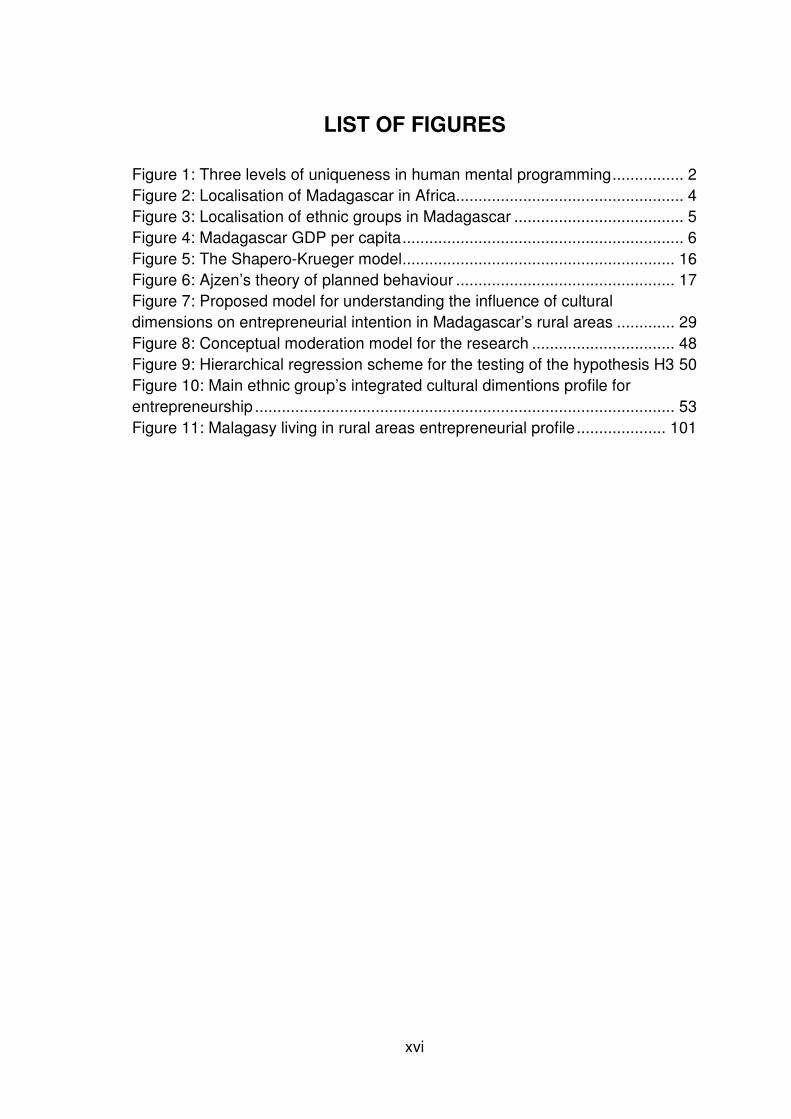
LIST OF FIGURES
Figure 1: Three levels of uniqueness in human mental programming ................ 2
Figure 2: Localisation of Madagascar in Africa................................................... 4
Figure 3: Localisation of ethnic groups in Madagascar ...................................... 5
Figure 4: Madagascar GDP per capita ............................................................... 6
Figure 5: The Shapero-Krueger model ............................................................. 16
Figure 6: Ajzen’s theory of planned behaviour ................................................. 17
Figure 7: Proposed model for understanding the influence of cultural
dimensions on entrepreneurial intention in Madagascar’s rural areas ............. 29
Figure 8: Conceptual moderation model for the research ................................ 48
Figure 9: Hierarchical regression scheme for the testing of the hypothesis H3 50
Figure 10: Main ethnic group’s integrated cultural dimentions profile for
entrepreneurship .............................................................................................. 53
Figure 11: Malagasy living in rural areas entrepreneurial profile .................... 101
1
CHAPTER 1: INTRODUCTION
This chapter describes and explains the purpose of the research as well as its
evolving context and its underpinning problem statement. The significance of
the research articulates among other gaps in related theory. The delimitation of
the research followed by the assumptions of the research close this chapter.
1.1 Purpose of the research
The purpose of this research was to scrutinise the influence of cultural
dimensions on entrepreneurial intention among ethnic groups in Madagascar’s
rural areas.
1.2 Context of the research
Defined as the unit of knowledge, know-how, traditions and habits suitable for a
human group, a civilisation, culture includes very broad aspects of life in
society: manners, morals, lifestyle, system of values, beliefs, religious rites,
organisation of the family and the village communities (Toupictionnaire, 2013).
In other words, culture could be understood as the collective setting of the mind,
which differentiates the members of one community from another (Hofstede,
Hofstede & Minkov, 2010). The collective dimension of culture is especially
because it is shared by individuals who evolved in the same social environment,
the platform where it was inculcated.
Thus, it is worthwhile to note that culture is transmitted socially, from generation
to generation and not by genetic heritage (Hofstede, et al., 2010). Mainly, it
conditions the individual behaviours. At the individual level, culture is all the
knowledge acquired by a human being. However, a clear distinction should be
made between culture, human nature and individual personality as described by
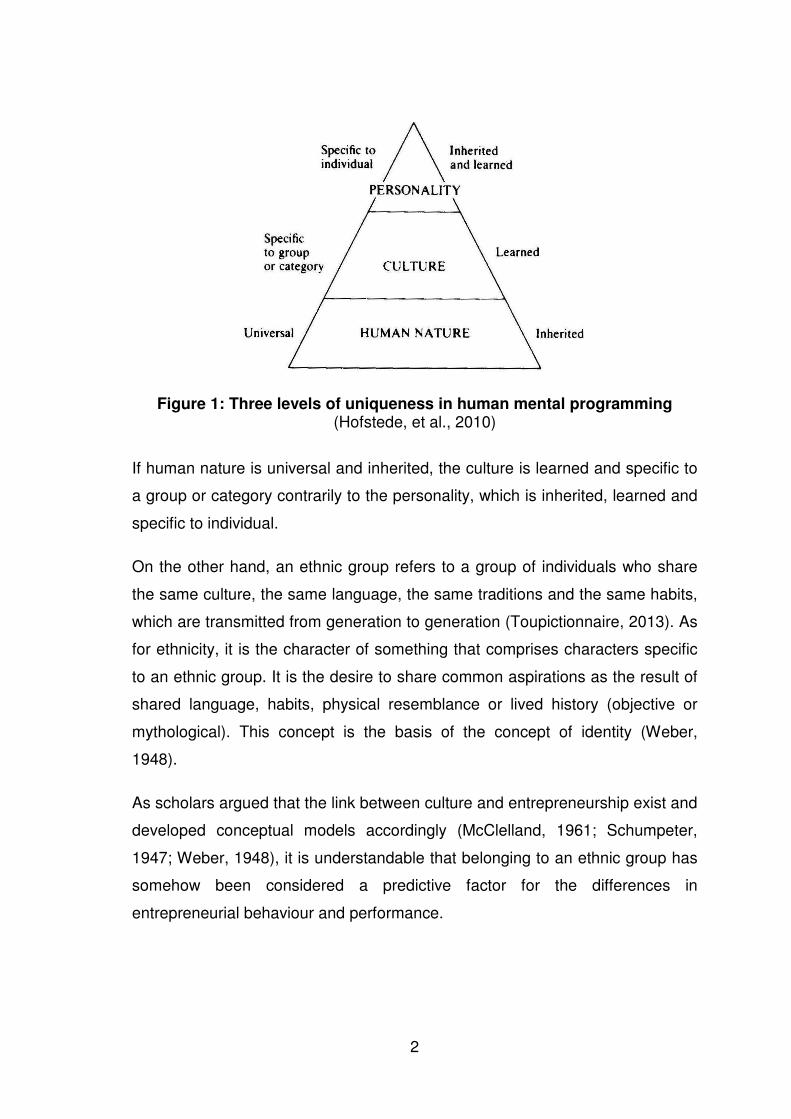
Figure 1:
2
Figure 1: Three levels of uniqueness in human mental programming
(Hofstede, et al., 2010)
If human nature is universal and inherited, the culture is learned and specific to
a group or category contrarily to the personality, which is inherited, learned and
specific to individual.
On the other hand, an ethnic group refers to a group of individuals who share
the same culture, the same language, the same traditions and the same habits,
which are transmitted from generation to generation (Toupictionnaire, 2013). As
for ethnicity, it is the character of something that comprises characters specific
to an ethnic group. It is the desire to share common aspirations as the result of
shared language, habits, physical resemblance or lived history (objective or
mythological). This concept is the basis of the concept of identity (Weber,
1948).
As scholars argued that the link between culture and entrepreneurship exist and
developed conceptual models accordingly (McClelland, 1961; Schumpeter,
1947; Weber, 1948), it is understandable that belonging to an ethnic group has
somehow been considered a predictive factor for the differences in
entrepreneurial behaviour and performance.
3
However, the findings of related research did not always come to the same
conclusions. A study of some ethnic groups in Nigeria showed a difference in
entrepreneurial performance (Harris, 1968 cited by Mungai & Ogot, 2011). In
Kenya no relationship between ethnicity and entrepreneurship was discovered
(Marris & Somerset, 1971 cited by Mungai & Ogot, 2011) but significant
differences in entrepreneurship proclivity and entrepreneurship insights were
demonstrated among four ethnic communities (Mungai & Ogot, 2011).
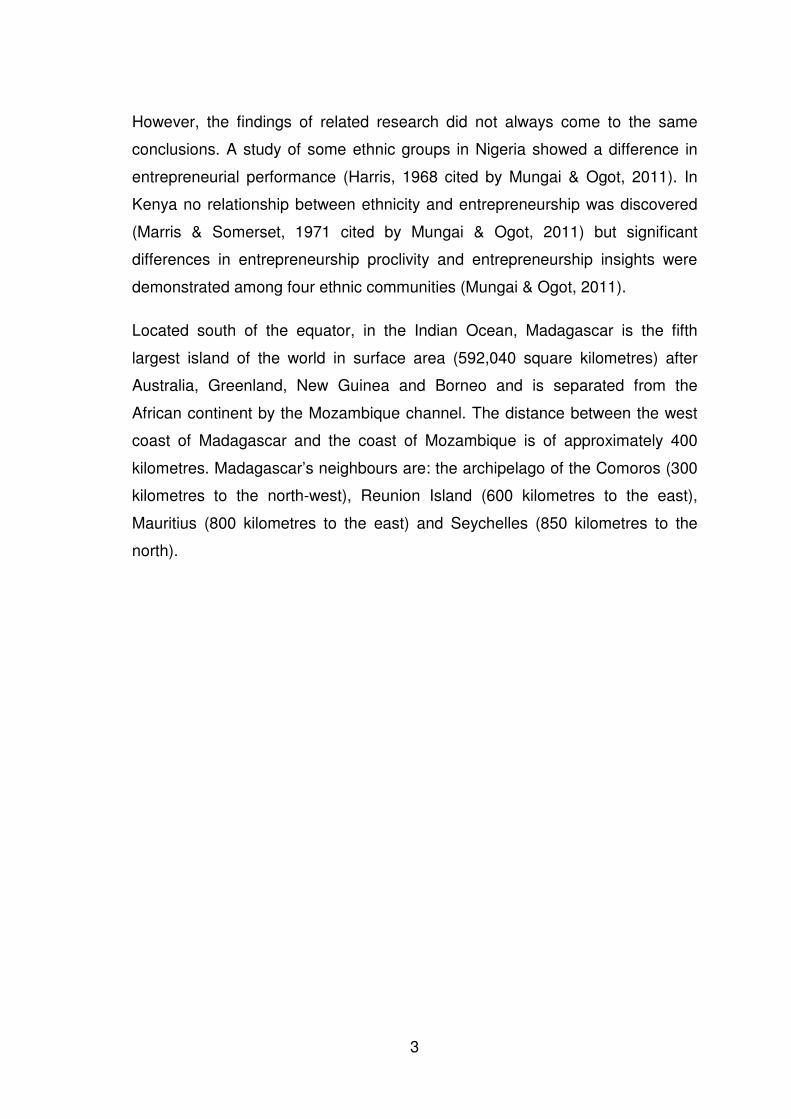
Located south of the equator, in the Indian Ocean, Madagascar is the fifth
largest island of the world in surface area (592,040 square kilometres) after
Australia, Greenland, New Guinea and Borneo and is separated from the
African continent by the Mozambique channel. The distance between the west
coast of Madagascar and the coast of Mozambique is of approximately 400
kilometres. Madagascar’s neighbours are: the archipelago of the Comoros (300
kilometres to the north-west), Reunion Island (600 kilometres to the east),
Mauritius (800 kilometres to the east) and Seychelles (850 kilometres to the
north).
4
Figure 2: Localisation of Madagascar in Africa (World Map Finder, n.d.))
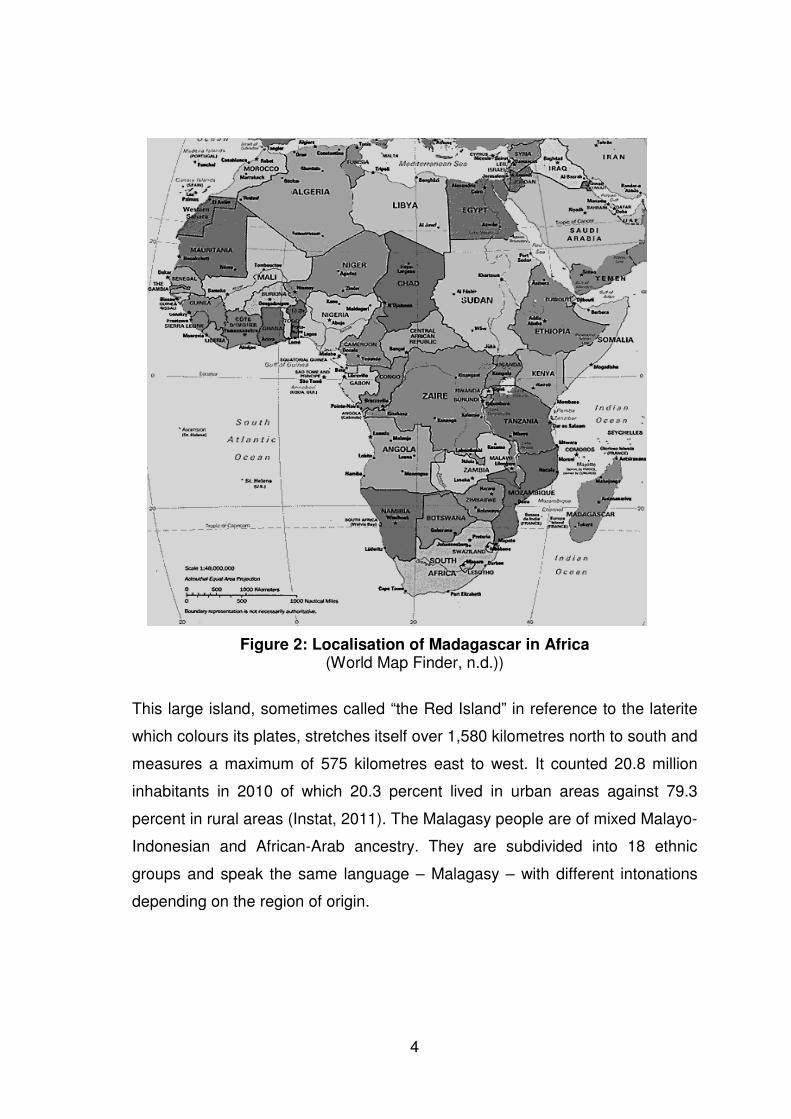
This large island, sometimes called “the Red Island” in reference to the laterite
which colours its plates, stretches itself over 1,580 kilometres north to south and
measures a maximum of 575 kilometres east to west. It counted 20.8 million
inhabitants in 2010 of which 20.3 percent lived in urban areas against 79.3
percent in rural areas (Instat, 2011). The Malagasy people are of mixed Malayo-
Indonesian and African-Arab ancestry. They are subdivided into 18 ethnic
groups and speak the same language – Malagasy – with different intonations
depending on the region of origin.
5
Figure 3: Localisation of ethnic groups in Madagascar (Mussard, n.d.)
As many former colonial countries, Madagascar experienced different political
and economic governance resulting in a deceiving development performance.
Today, the country is on a slow economic growth and an unbelievable political
brain teaser.
Ranked number 151 of 186 countries by the United Nations Development
Programme (UNDP) with regard to human development (UNDP, 2013), 92.6
percent of Madagascar’s population lives on less than USD2 per day and 81.3
percent on less than USD1.25 per day (University of Oxford, 2013). The Gross
Domestic Product (GDP) per capita of Madagascar was USD238.17 in 2012
(Trading Economics, 2013).

6
Equivalent to 2 percent of the world's GDP average, the GDP per capita of
Madagascar was around USD315.44 from 1960 until 2011, attaining a record
high of USD433.78 in 1971 and the lowest value in 2002 of USD219.71.
Figure 4: Madagascar GDP per capita (Trading Economics, n.d.)
Madagascar has displayed a disappointing economic performance for at least
five decades. The economic growth remains too weak and, when it occurs, it is
too unevenly shared to cause a significant reduction of poverty. In other words,
not only are most households on average poorer today than in 1960, but also as
the population grows, so does the number of poor; low economic growth being
insufficient to decisively reduce the number of the poor in the country. Clearly,
poverty continues because the low profits obtained after each period of growth
are neutralized by the eruption of political crises, in particular in the cities, and
by the weak participation of the rural areas in the growth. This is constrained in
particular by poor yields in the agricultural sector and the lack of capacity of the
growth to create remunerative jobs (World Bank, 2013).
Based on this context and considering the broader framework of existing theory
and research related to the set of themes on culture and entrepreneurship such
as the model on national culture distinction developed by Hofstede (2001); a
snapshot of the determinants of entrepreneurship in Madagascar’s rural areas,
which constitute enclaves of ethnic groups, was sought.
7
To survive and to face the current growing poverty, the Malagasy people
compete with entrepreneurial ingenuity. In fact, as the majority of the Malagasy
population live in rural areas and most of them recognise themselves as
farmers; it could be assumed that the households, which have non-agricultural
enterprises or agricultural wage-earning enterprises, are entrepreneurs. Thus,
the owning rate of a non-agricultural enterprise or an agricultural wage-earning
enterprise could be considered a proxy of the entrepreneurial dynamics in
Madagascar’s rural areas.
It is worth noting that according to the definition adopted during the 2010
Household Permanent Survey in Madagascar, the “non-agricultural enterprises”
are production units which exert processing and manufacture, trade, and
service, are managed by particular households, and whose the production
function is strongly related to the consumption function of the owner household
(Instat, 2011).
In addition, the individuals who exert salaried employment and do not have
direct employers are considered and classified as non-agricultural enterprise
managers delivering agricultural services (ploughing, weeding, harvesting) and
their service enterprises are called “agricultural wage-earning enterprises”.
Based on the results (Table B-1), it has been revealed by the Household
Permanent Survey of 2010 (Instat, 2011) that in Madagascar, individuals living
in some regions have more entrepreneurial spirit than others. Thus, the need is
to know if it is empirically the case. In other words, underpinned by cultural
dimensions, does an ethnic group have a certain entrepreneurial ascent on
another one?
Indeed, as the core system of particular values to a specific community, the
culture profiles certain personality traits and stimulates people of this community
to initiate behaviours, which may not have the same extent in other
communities. New venture creation or self-employment initiative may be one of
these behaviours that fluctuate through communities due to the differences in
cultural values and beliefs.
8
Noticeably, many factors supporting entrepreneurial behaviour are shared by
many cultures such as the economic incentives, which are a considerable
catalyst for entrepreneurial initiatives, thus entrepreneurial intention.
Nevertheless, since culture underpins certain personal characteristics and
penalises others, as is the case of cultural dimensions, it would not be
surprising to see that certain cultures present entrepreneurial predispositions
more noticeable than others (Mueller & Thomas, 2001).
1.3 Problem statement
1.3.1 Main problem
Compare the main Malagasy ethnic groups in terms of measures of cultural
dimensions and perceived desirability with respect to entrepreneurship, and
examine the effects of this perceived desirability on the relations between
cultural dimensions and entrepreneurial intention.
1.3.2 Sub-problem 1
The first sub problem is to compare the measures of cultural dimensions of the
main Malagasy ethnic groups.
1.3.3 Sub-problem 2
The second sub problem is to compare the levels of perceived desirability with
respect to entrepreneurship of the main Malagasy ethnic groups.
1.3.4 Sub-problem 3
The third sub problem is to assess the moderation effects of the perceived
desirability on the relationships between cultural dimensions and
entrepreneurial intention among Malagasy main ethnic groups living in rural
areas.
It is worthwhile to note that, in the framework of the research, the perceived
desirability is related to the creation of new ventures.
9
1.4 Significance of the research
This investigation revealed that in the field of entrepreneurship, the following
were studies on Madagascar during the last decade:
•••• Rasolofoson (2001), worked on the logical cultural of entrepreneurial
behaviour in Madagascar;
•••• Razafindrazaka and de la Durantaye (2008), in examining the context of
Madagascar, sought to find out how does the interaction of local
entrepreneurs and the areas influence territorial dynamics;
•••• Rasolonoromalaza (2011), in basing his work on Madagascar’s free zone
entrepreneurs, determined entrepreneur’s behaviour through intercultural
management;
•••• Nordman and Vaillant (2012a) highlighted, among informal
entrepreneurs, the magnitude of the gender performance gap and
investigated the role of sharing norms and gender-differentiated
allocation of time within the household and estimated the effect on
female and male entrepreneurs technical inefficiency;
•••• Nordman and Vaillant (2012b), studied the performance and returns to
production factors of female informal entrepreneurs in Antananarivo, the
main city of Madagascar; and
•••• Andrianirina (2013), considering the agribusiness sector in three regions
of Madagascar, based his study on entrepreneurial culture in economics
and socio-cultural context with a focus on the relationship between
entrepreneurial culture, the entrepreneur and performance;
Based on this observation, it could be advanced that no in-depth study on
cultural dimensions and entrepreneurship has been conducted in Madagascar,
as a tool to guide scholars. Thus, this research appears to be a pioneer in the
matter.
10
Furthermore, the emphasis placed on the investigation of the interrelationships
between cultural dimensions and entrepreneurial intention in the rural areas of
Madagascar, where most of the population of the island live, may be useful to
Malagasy political decision makers in their pursuit of relevant policies and
strategies for the promotion of entrepreneurship in general and self-employment
in particular.
At practical level, as it is broadly acknowledged that “the key to alleviating
poverty is often not the creation of jobs … but rather the encouragement of self-
employment to all individuals” (Yunus, n.d. cited in SASIX, 2008, p. 3), the
findings of this research can also be used by managers in charge of
microfinance institutions, to better structure their policy of funding and their
strategy of enterprise development capacity building. Through this they can
become a powerful catalyst for local economic development as it is an effective
starting point for poverty alleviation (SASIX, 2008). It is evident that micro-
finance enhances the livelihood of poor people, but this impact is not universal
as not all poor people are entrepreneurs. Thus, it would be more useful for
micro-finance initiatives to focus on providing micro-loans to burgeoning
entrepreneurs, instead of supposing that all poor people are potential
entrepreneurs.
1.5 Delimitation of the research
Admittedly, the ideal would have been to be able to study all 18 ethnic groups of
Madagascar. However, due to the practicality of conducting the research under
good conditions while maintaining scientific rigour, the main ethnic groups from
the rural areas of the coastal regions, the rural areas of the highland regions
and the rural areas of the intermediary regions were the focus of the study and
thus a total of six ethnic groups were studied.
11
1.6 Assumptions
The following assumptions have been made with regard to this research:
• Madagascar’s rural areas are mainly ethnic enclaves;
• For each region of Madagascar, the distribution of the population by
gender and by level of education, as per the finding of the Household
Permanent Survey of 2010 (Instat, 2011), can be applied throughout the
administrative pyramid (district, commune, fokontany [village]) of the
region;
• The respondents are able to understand and answer the questions to the
best of their ability;
• The respondents are not offended by the questions related to their
belonging to an ethnic group;
• The respondents give a high response rate;
• The relevant official authorities at all levels of the administrative pyramid
give permission to administer a survey with a question related to
belonging to an ethnic group; and
• The sample respondents are representative of their ethnic groups so that
the results of the comparisons of the study represent valid ethnic
differences.
12
CHAPTER 2: LITERATURE REVIEW
2.1 Introduction
The connection between culture and entrepreneurship used to be the central
theme for a number of very important researchers. However, they presumed the
presence of a national culture, a concept generally vague in Africa where, in
most countries, individuals identify themselves by the cultures of their ethnic
groups. Thus, in-depth research on the possible relations between cultural
dimensions and any other fundamental construct such as entrepreneurial
intention in the context of the ethnic groups finds here its rationale.
2.2 Background discussion
After defining entrepreneurship, entrepreneurial intention and perceived
desirability, this section gives the background of the theories related to cultural
dimensions, ethnic groups and ethnicity as well as their relationships with
regard to the outcomes of individuals possessing these characteristics in their
probability to start a new venture.
2.2.1 Entrepreneurship, entrepreneurial intention and perceived
desirability
The word entrepreneur is of French origin. It can be translated as “between-
taker” or “go-between”. It is important to note that the definition of what it is
evolved over time and in parallel with the evolution of the world’s economy.
Schumpeter (1965) cited by Eroglu and Picak (2011, p. 146) defined the
entrepreneur as an “individual who exploits market opportunity through
technical and/or organizational innovation”, more than 30 years later, Gartner
(1988, p. 26) defined entrepreneurship as “the creation of new organisations”.
13
Admittedly, scholars seem to present contradictory definitions of what
entrepreneurship is, but it can be noticed that these definitions often contain
similar elements such as opportunity recognition, innovation, organisation,
creation and risk taking.
Thus, a definition that could garner most of these important elements and fit
with the context of the research would be the one proposed by Hisrich and
Peters (2002, p. 10) which states that:
“Entrepreneurship is the process of creating something new with
value by devoting the necessary time and effort, assuming the
accompanying financial, psychological, and social risks, and
receiving the resulting rewards of monetary and personal
satisfaction and independence”.
It should be mentioned that the importance of entrepreneurship relies on the
fact that:
•••• It is considered an important leveraging tool for country economic
development (Carree, Stel, Thurik & Wennekers, 2001; Wennekers &
Thurik, 1999;);
•••• It catalyses job creation (Reynolds, Bygrave & Autio, 2004) which may
also be a consequence of increased self-employment, a broadly
recognised alternative for routing out poverty (Bogan & Darity, 2007);
•••• It stimulates competitiveness and triggers personal potential (European
Commission, 2003); and
•••• It is an important method for choosing an occupation based on the
inclination for independence and self-direction (Gelderen, Brand, Praag,
Bodewes, Poutsma & Gils, 2008).
Entrepreneurship is both a complex phenomenon and a source of creative
dimension (Ijaz, Yasin & Zafar, 2012). Consequently, two components have to
be considered when dealing with entrepreneurial process (Ijaz et al., 2012):
14
[1] An event, which has to be understood as the carrying out of an
endeavour (ideas, product or services); and
[2] An agent embodied by the person who dutifully implements the event
process. It represents also, the personal characteristic specific to an
entrepreneur in contrast to a non-entrepreneur. It should be noted that
this later has an important influence on entrepreneurial behaviour.
Entrepreneurial Intention is understood as “a conscious awareness and
conviction by an individual that they intend to set up a new business venture
and plan to do so in the future” (Liñán, Nabi & Krueger, 2013, p. 77).
Accordingly, initiating a new venture implies the existence of a preceding
cognitive representation of the actions to be implemented (Fini, Grimaldi,
Marzocchi & Sobrero, 2009). Indeed, inspiration is at the starting point of an
entrepreneurial idea. However, in order for it to be perceptible, intention is
required (Del Mar & Shane, 2003). In fact, individuals do not decide to run a
new venture spontaneously but voluntarily with conscious intentionality
(Krueger, Reilly & Carsrud, 2000). Thus, formulated in another way, the
entrepreneurial intention refers to the state of mind which directs the attention of
a person towards a specific goal in order to carry out an endeavour. It is worth
noting that identified as a sole prevailing predictor of entrepreneurial behaviour
(Autio, Keeley, Klofsten, Parker & Hay, 2001), intention noticeably constitutes a
remarkable dependent variable (Thompson, 2009).
The understanding of any triggering factors of entrepreneurial intention is at the
heart of the scholars’ quest. In so doing, some intention-based models have
been developed (Liñán, 2004). These models were developed to be used as a
tool for scrutinizing predictors for entrepreneurial initiatives (Krueger et al.,
2000).
15
During the last two decades, many models have been developed (Guerrero,
Rialp & Urbano, 2008; Singh & Prasad, 2012): Entrepreneurial Event Model
(EEM) (Shapero & Sokol, 1982), Theory of Planned Behaviour (TPB) (Ajzen
1991), Krueger and Brazeal’s (1994) Entrepreneurial Potential Model (EPM),
Entrepreneurial Attitude Orientation Model (EAOM) (Robinson, Stimpson,
Huefner & Hunt, 1991), the Entrepreneurial Potential Model and the Davidsson
Model (Davidsson, 1995).
It should be noted that, these different models are basically inspired from two
main models which are: the Entrepreneurial Event Model and the Theory of
Planned Behaviour (Singh & Prasad, 2012).
The Entrepreneurial even model (EEM) is based on Shapero’s (1975) construct
of entrepreneurial events, which explained the link between the intention to start
a business, the credibility of alternative behaviours and the propensity to act
upon opportunities. The EEM is essentially an intention-based model shaped
with the entrepreneurial domain in mind (Singh & Prasad, 2012).
The model considers setting up of a venture as an event that can be explained
as the interaction between initiatives, abilities, management, relative autonomy
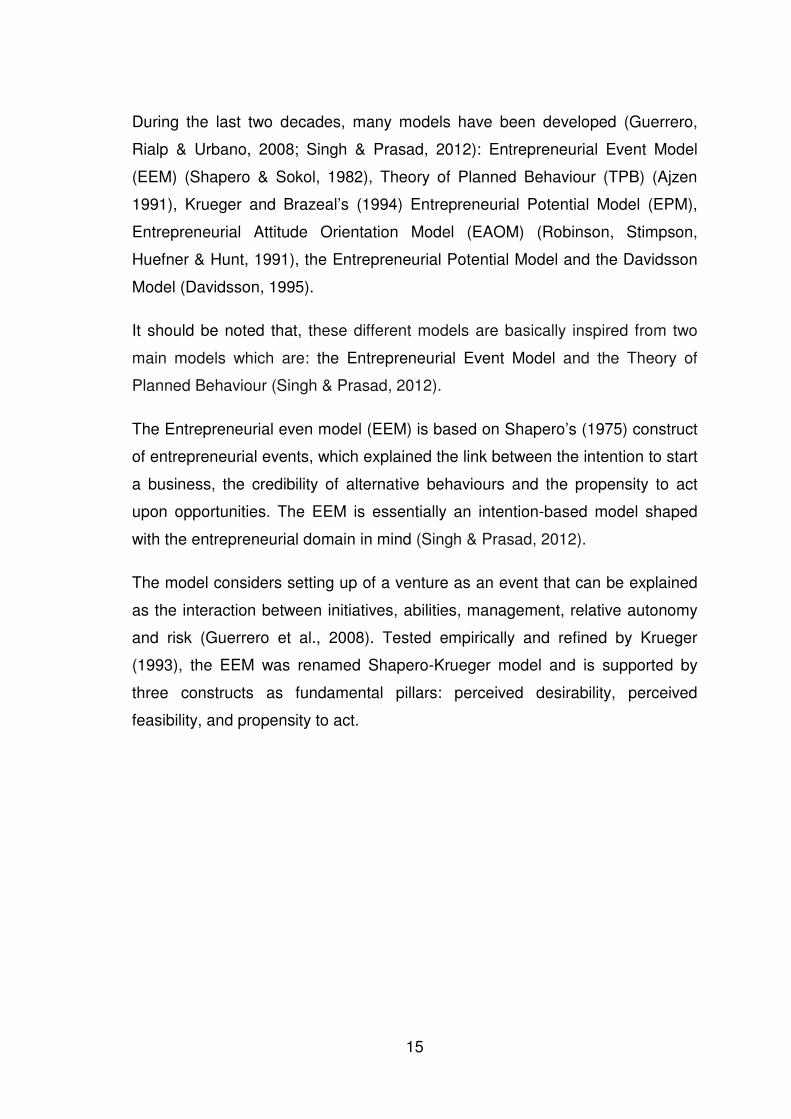
and risk (Guerrero et al., 2008). Tested empirically and refined by Krueger
(1993), the EEM was renamed Shapero-Krueger model and is supported by
three constructs as fundamental pillars: perceived desirability, perceived
feasibility, and propensity to act.
16
Figure 5: The Shapero-Krueger model (Krueger, et al., 2000)
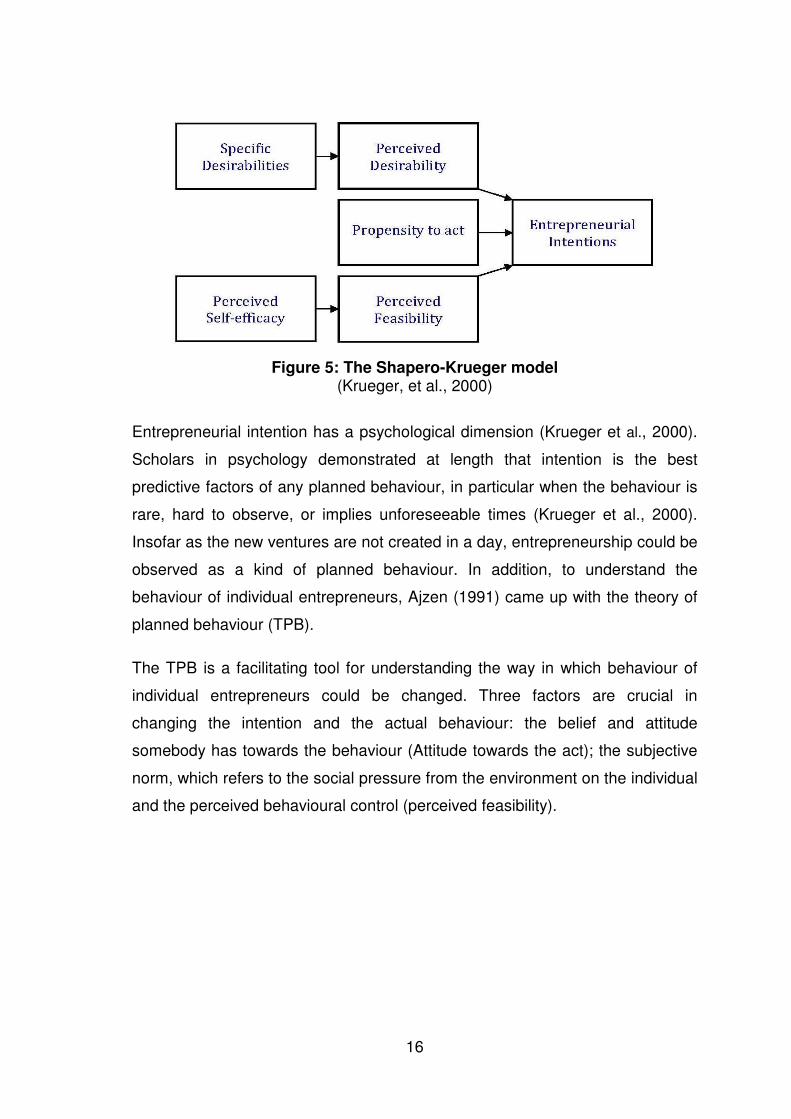
Entrepreneurial intention has a psychological dimension (Krueger et al., 2000).
Scholars in psychology demonstrated at length that intention is the best
predictive factors of any planned behaviour, in particular when the behaviour is
rare, hard to observe, or implies unforeseeable times (Krueger et al., 2000).
Insofar as the new ventures are not created in a day, entrepreneurship could be
observed as a kind of planned behaviour. In addition, to understand the
behaviour of individual entrepreneurs, Ajzen (1991) came up with the theory of
planned behaviour (TPB).
The TPB is a facilitating tool for understanding the way in which behaviour of
individual entrepreneurs could be changed. Three factors are crucial in
changing the intention and the actual behaviour: the belief and attitude
somebody has towards the behaviour (Attitude towards the act); the subjective
norm, which refers to the social pressure from the environment on the individual
and the perceived behavioural control (perceived feasibility).
17
Figure 6: Ajzen’s theory of planned behaviour (Krueger, et al., 2000)
These brief overviews show that the two models (TPB and SEE) are very
important in explaining human behaviour.
However, it is worth noting that the entrepreneurial intention is acknowledged as
the most intriguing and the most elusive when referring to economic analysis
(Baumol, 1968). Urban, Van Vuuren and Owen (2008) underlined that by
stressing the intersection between the TPB and the SEE models, it has been
demonstrated that perceived credibility (perceived feasibility), perceived
desirability and propensity to act are explaining more than half of the variance in
intention toward entrepreneurship as per the findings of Krueger (1993).
Fitzsimmons and Douglas (2011 has highlighted a positive relationship between
entrepreneurial intention, perceived feasibility and perceived desirability.
Notwithstanding the fact that entrepreneurial intention does not necessitate both
perceived feasibility and perceived desirability to be at a high level
(Fitzsimmons & Douglas, 2011).
Within the context of the research, the focus will be on the perceived
desirability, which can be understood as the extent to what the idea of creating
a new venture is attractive.
18
Discovering all the precursors of entrepreneurial intention, and their role in
triggering the entrepreneurial behaviour is not easy and still requires further
research such as deepening the relationships between the construct of
entrepreneurial intention and those of cultural dimensions.
2.2.2 Cultural dimension theory
As mentioned, culture refers to the collective programing of the mind in a
patterned way, which differs from one community to another (Hofstede et al.,
2010). It consists of patterns, values, ideas and symbolic features, which shape
the human behaviour and are transmitted throughout generations (Ijaz et al.,
2012).
One of the first theories that allowed quantification and explanation of observed
differences between cultures, was the cultural dimension theory, developed to
describe the effects of a society's culture on the values of its members and how
these values relate to behaviour, using a structure derived from factor analysis
(Hofstede, 1980, 2001; Hofstede et al., 2010).
The cultural dimension theory is based on the idea according to which the value
can be placed on six dimensions of cultures:
[1] The power distance (PD) dimension, which consists of the acceptance
and the expectation by/from the members of an organisation, institution
or community who have less power, of the fact that the power is
distributed in an unequal manner. This dimension does not measure the
level of distribution of the power in a given culture, but analyses the
people’s related feelings. A low score of the power distance indicates
that a culture expects and accepts that relations between them are
democratic and its members are perceived as equal. A high score means
that community members who have less power accept their condition
and recognise the existence of hierarchical relationships in the
organisation of the community (Hofstede, 1980, 2001; Hofstede et al.,
2010).
19
[2] The individualism versus collectivism (IC) dimension, refers to the degree
by which the individuals are integrated into their groups. In collectivist
setting, the objectives of the group and its wellbeing have more value
than those of the individual. The individualistic cultures give importance
to the realisation of the personal objectives. Moreover, the individual
evolves within two groups: the in-group and the out-group. The in-group
which is the main cradle of individual identity and stability, made up by
close family and friends. Other people in relation to an individual one
could be considered to belong to his or her out-groups. (Hofstede, 1980,
2001; Hofstede et al., 2010).
[3] The uncertainty avoidance (UA) dimension, which deals with the
tolerance of a community for uncertainty and ambiguity, measures the
way in which a community manages unknown situations, unexpected
events and anxiety vis-a-vis the change. The cultures, which have high
uncertainty avoidance are less tolerant to change and tend to minimize
the anxiety of the unknown by setting up rigid rules, regulations and/or
laws. The communities where this index is low are open to change, have
less rules and laws, and have more flexible guidelines (Hofstede, 1980,
2001; Hofstede et al., 2010).
[4] The masculinity versus femininity (MF) dimension, is related to the
distribution of the emotional roles between genders. It measures the level
of significance that a culture attaches to the stereotypical male values
such as insurance, ambition, power and materialism, as with the
stereotypical female values such as the emphasis placed on human
relationships. The cultures whose score is high on the scale of the
masculinity generally presents more obvious differences between
genders and tends to be more competitive and ambitious. The one
whose score is low presents fewer differences between genders and
grants more value to construction of relationships (Hofstede, 1980, 2001;
Hofstede et al., 2010).
20
[5] The long-term versus short-term orientation (LSO) dimension, describes
the temporal horizon of a community. Short-term oriented cultures give
value to the traditional methods, take a considerable time to create
relationships and, in general, perceive time to be circular. This means the
past and the present are inter-connected and that what cannot be done
today can be tomorrow. The opposite is true for the long-term orientation,
which perceives time to be linear and looks to the future rather than the
present or the past. Such a community pursues goals and gives value to
rewards. Linked with uncertainty avoidance dimension, short-term
oriented cultures also demonstrate a bold sense of right and wrong and
embrace those beliefs to be absolute. In contrary, long-term oriented
cultures show display a pragmatic thinking and flexible principles,
adjustable to the context (Hofstede, 1980, 2001; Hofstede et al., 2010).
[6] The indulgence versus restraint (IR) dimension, measures the capacity of
a community to satisfy their immediate needs and the personal desires of
its members. Cultures that value moderation have strict social rules and
standards under which the satisfying of the impulses are controlled and
discouraged (Hofstede et al., 2010).
Through the analysis of national-level cultural values in more than 50 countries,
Hofstede (1980, 2001) and Hofstede et al. (2010) came up with the most
influential instrument of measuring cultural dimensions. The related metric is
widely accepted and applied at country level as well as individual level in cross-
cultural studies.
Yoo, Donthu and Lenartowicz (2011) acknowledged that the cultural dimensions
considered in the metric are focused on major conceptualisation of culture
developed throughout decades. These cultural dimensions were developed on
an empirical basis and found to be the most important typology of culture.
21
Hofstede’s (1980, 2001) work faced its share of pros and cons despite being
widely recognised in the field of culture research. On the positive, scholars
agreed on the relevance, the rigor and the relative accuracy of the study
(Søndergaard, 1994), contrarily some scholars pointed to the issue of relevancy
as argued that the measurement of cultural disparity is not adequately
measured by a survey (Schwartz, 1999). The cultural homogeneity assumed by
Hofstede’s (1980, 2001) study has been also criticized (Nasif, Al-Daeaj,
Ebrahimi & Thibodeaux, 1991; Redpath, 1997) as well as the ignorance of
community importance and the variations of its influences (Dorfman & Howell,
1988; Lindell & Arvonen 1996; Smith 1998). The ‘one company’ approach is
another issue raised by scholars, as it is very difficult to support the notion that
the company surveyed could provide information on the entire cultural system of
the country (Graves, 1986; Olie, 1995; Søndergaard, 1994). Some scholars
stressed the issue of statistical integrity related to the likelihood of sample error
(Dorfman & Howell 1988; Furrer, Liu & Sudharshan, 2000).
However, in the field of entrepreneurship and considering the context of a
country or a community, it should be underlined that culture might influence
entrepreneurship two ways (Liñán, et al., 2012):
[1] The bottom-up method, which is the case of a country or a community
having more individuals with entrepreneurial values and traits, thus more
individuals will become entrepreneurs. In sum, values are aggregated.
The more you have, the more you get.
[2] The top-down method underpinned by the existence of a higher level of
moral endorsement or tangible support toward entrepreneurship activities
in the country or community practices.
Accordingly, whatever the dominant means in a country or a community, trying
to understand the courses of intention development, commend to an in-depth
examination of any factors that serve as anchoring assumptions for
entrepreneurial initiatives. In so doing, cultural dimensions appear to be a key
source of those deep anchoring factors.

22
2.2.3 Concepts of Ethnic group and Ethnic identity
The concept of ethnic groups refers to a community that is identified by a
common culture or to descendants of the members of this community who do
not adhere to this culture but who admits belonging to this ancestral group
(Isajiw, 1992).
Two dimensions have to be considered when dealing with the concept of ethnic
groups. On the one hand, the objective dimensions take into consideration the
existence of community institutions, the centrality of having descendants and
ancestors in the cultural transmission and identity construction and the fact that
there are accepted codes in the form of customs, rituals and preconceptions
that shape cultural behaviour. On the other hand, the subjective dimension is
related to what has been known as ethnic boundaries (internal and external).
The internal boundaries refer to the area of self-inclusion in the group, overlap
with the process of self-identity as well as connection with the feelings of
sympathy and loyalty toward members of the group. The external boundaries
concern the edge of exclusion of membership; it is the delimitation of the space
of those who are strangers to the group (Isajiw, 1992).
In fact, the presence of internal boundaries will lead undoubtedly to the
emergence of external boundaries in a multi-ethnic setting where interaction
and competition give rhythm to the life of different ethnic group members.
Actually, even individuals do not adhere anymore to the culture of an ethnic
group; they will be recognised as belonging to the concerned ethnic group as
long as their filiation to this group can be proven. It is worth to note also that
self-identification is generally triggered by the way in which others identify an
individual and consequently a new form of social organisation may arise (Isajiw,
1992).
The concept of ethnic identity is related to the manner in which “persons, on
account of their ethnic origin, locate themselves psychologically in relation to
one or more social systems, and in which they perceive others as locating them
in relation to those systems” (Isajiw, 1992, p. 8).
23
Here also, two aspects have to be considered. First, the external aspects, which
concern discernible cultural and social behaviours (e.g. speaking an ethnic
language, practising ethnic traditions; participation in ethnic personal networks;
participation in ethnic institutional organisations, participation in ethnic voluntary
associations, and participation in functions sponsored by ethnic organisations).
Second, the internal aspects of ethnic identity which is related to images, self-
image and image of one's group, ideas, attitudes, and feelings, and group
obligations, attachment to the group (Isajiw, 1992).
Thus, within the framework of the research, it can be suggested that to some
extent, belonging to an ethnic group, underpinned by its ethnic identity, may
influence the entrepreneurial intention of an individual in the rural areas of
Madagascar as they are mostly ethnic enclaves.
2.3 Cultural dimensions by main ethnic group in
Madagascar’s rural areas
2.3.1 Malagasy main ethnic groups and cultural dimensions
The people of Madagascar, known as Malagasy, result from successive
immigrations beginning in the fifth century BC. The first discoverers of the island
were seafarers from the south of Borneo. They brought to the island many
plants from South East Asia, like rice, bananas, coconuts, yams, sugar cane
and more. They controlled the metallurgy, including that of iron, and the
weaving of silk (Couleurs du Monde, n.d.). Many years later, Semites and Arabs
developed navigation and the trade in the Indian Ocean, supplanted the
Indonesians and create many counters on the northwestern and northeastern
coast of the island. From these counters, the island exported iron, a little gold,
rice, wood of mangrove (for construction in Arabia), and received, from China
and India, spices, pearls and ceramics. The slave trade on the east coast of
Africa gave rise to African immigration along the west coast and the northwest
of the island (Couleurs du Monde, n.d.).
24
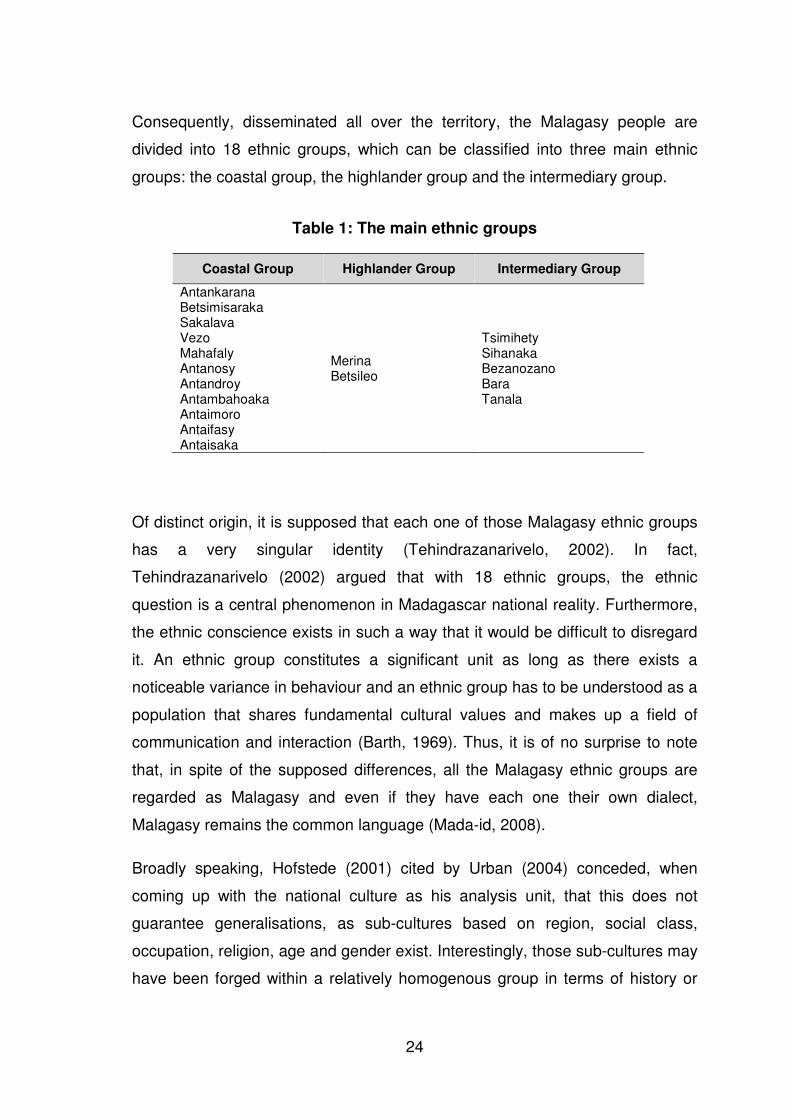
Consequently, disseminated all over the territory, the Malagasy people are
divided into 18 ethnic groups, which can be classified into three main ethnic
groups: the coastal group, the highlander group and the intermediary group.
Table 1: The main ethnic groups
Coastal Group Highlander Group Intermediary Group
Antankarana Betsimisaraka Sakalava Vezo Mahafaly Antanosy Antandroy Antambahoaka Antaimoro Antaifasy Antaisaka
Merina Betsileo
Tsimihety Sihanaka Bezanozano Bara Tanala
Of distinct origin, it is supposed that each one of those Malagasy ethnic groups
has a very singular identity (Tehindrazanarivelo, 2002). In fact,
Tehindrazanarivelo (2002) argued that with 18 ethnic groups, the ethnic
question is a central phenomenon in Madagascar national reality. Furthermore,
the ethnic conscience exists in such a way that it would be difficult to disregard
it. An ethnic group constitutes a significant unit as long as there exists a
noticeable variance in behaviour and an ethnic group has to be understood as a
population that shares fundamental cultural values and makes up a field of
communication and interaction (Barth, 1969). Thus, it is of no surprise to note
that, in spite of the supposed differences, all the Malagasy ethnic groups are
regarded as Malagasy and even if they have each one their own dialect,
Malagasy remains the common language (Mada-id, 2008).
Broadly speaking, Hofstede (2001) cited by Urban (2004) conceded, when
coming up with the national culture as his analysis unit, that this does not
guarantee generalisations, as sub-cultures based on region, social class,
occupation, religion, age and gender exist. Interestingly, those sub-cultures may
have been forged within a relatively homogenous group in terms of history or
25
geography, which experienced events that have influenced the values of the
group (Urban, 2004). In the context of Madagascar’s rural areas, this
homogeneous group can be assimilated with an ethnic group.
Ethnic groups can produce differences in cultural dimensions, which refer to the
effects of the culture of a community on the values of its members and the way
in which these values are linked to behaviour (Hofstede, 1980, 2001; Hofstede
et al., 2010) and even to intention.
2.3.2 Hypothesis 1
There is a difference in the measures of cultural dimensions among the main
ethnic groups in Madagascar’s rural areas. This hypothesis is detailed as
follows:
H1a: There is a difference in the measure of power distance (PD) dimension
among the main ethnic groups in Madagascar’s rural areas.
H1b: There is a difference in the measure of individualism versus collectivism
(IC) dimension among the main ethnic groups in Madagascar’s rural
areas.
H1c: There is a difference in the measure of uncertainty avoidance (UA)
dimension among the main ethnic groups in Madagascar’s rural areas.
H1d: There is a difference in the measure of masculinity versus femininity
(MF) dimension among the main ethnic groups in Madagascar’s rural
areas.
H1e: There is a difference in the measure of long-term versus short-term
orientation (LSO) dimension among the main ethnic groups in
Madagascar’s rural areas.
H1f: There is a difference in the measure of indulgence versus restraint (IR)
dimension among the main ethnic groups in Madagascar’s rural areas.
26
2.4 Perceived desirability by main ethnic group in
Madagascar’s rural areas
2.4.1 Malagasy main ethnic groups and perceived desirability
Comparing individuals and studying culture refers to a comparison of society
(Urban, 2004). After seeking to understand cultural differences among main
ethnic groups in Madagascar, it is interesting to see to what extent there is also
a difference in the level of perceived desirability among those considered to be
main ethnic groups. On one hand, culture reflects particular ethnic, social,
economic, ecological, and political complexities in individuals (Mitchell, Smith,
Seawright & Morse, 2000) and on the other hand, individual ethnicity, forged by
cultural environment (e.g. ethnic group) affects attitude and behaviour
(Baskerville, 2003).
Thus, to some extent, cultural environments (ethnic groups) can trigger
differences in attitude (Baskerville, 2003) as well as in entrepreneurial
behaviour (Shane, 1994); however, not in perceived desirability which explains
over half the variance of entrepreneurial intention?
2.4.2 Hypothesis 2
There is a difference in the level of perceived desirability (PERDES) among the
main ethnic groups in Madagascar’s rural areas.
2.5 Cultural dimensions, entrepreneurial intention and
perceived desirability in Madagascar’s rural areas
2.5.1 Perceived desirability as a moderator of the relation between
cultural dimensions and entrepreneurial intention
It cannot be stressed enough that an entrepreneur can be described as an
independent, nonconformist risk-taker who aligns people and necessary
resources in order to set up new business ventures. To achieve this, it is
paramount that the community in which the entrepreneur evolves have codes of
27
cultural values, which recognise the legitimacy of the entrepreneurial function as
well as the entrepreneurial role (Russell, 2004). Hence, it is argued, that
differences in value systems and cultural orientations affect entrepreneurship
initiatives.
Hofstede (1980) states that culture forms people’s thinking schemes,
programming behavioural patterns, which are consistent with the cultural
context. Furthermore, these thinking schemes, resulting from culture, can be
very helpful for entrepreneurs in their quests to reduce the hesitation in the
decision making process; to facilitate forecasts and predictions about outcomes
and to increase the intention to start a new venture etc. (Busenitz and Lau,
1996).
In fact, scholars have noticed that culture plays an important role in shaping the
personality of individuals. This is the case of Hayton, George and Zahra (2002),
who recognised that cultural dimensions cannot be ignored with regard to
entrepreneurship as they affect the motives, values and beliefs of individuals,
and suggested that the role of culture is to change and supplement the
institutional and economic contexts to influence entrepreneurship.
However, it should be noted that some perceptions and beliefs among
entrepreneurs go beyond cultures and it may also happen that other beliefs and
values are more culture or ethnic group specific (Urban, 2007). On the other
hand, cultural dimensions are only constructs aiming to evaluate the culture
shape of a community and that they do not directly predict the behaviour of
each member of this community (Hofstede et al., 2010). Thus, it makes sense
to consider that the influence of cultural dimensions on entrepreneurial intention
is somehow triggered by factors such as perceived desirability, which is
acknowledged to be one of the fundamental pillars of entrepreneurial intention
(Krueger, 1993).
28
2.5.2 Hypothesis 3
The relationships between cultural dimensions (CD) and entrepreneurial
intention (EI) are moderated by perceived desirability (PERDES) among main
ethnic groups in Madagascar’s rural areas. This hypothesis is detailed as
follows:
H3a: The relationship between the power distance (PD) dimension and
entrepreneurial intention (EI) is moderated by perceived desirability
(PERDES) among the main ethnic groups in Madagascar’s rural areas.
H3b: The relationship between the individualism versus collectivism (IC)
dimension and entrepreneurial intention (EI) is moderated by perceived
desirability (PERDES) among the main ethnic groups in Madagascar’s
rural areas.
H3c: The relationship between the uncertainty avoidance (UA) dimension and
entrepreneurial intention (EI) is moderated by perceived desirability
(PERDES) among the main ethnic groups in Madagascar’s rural areas.
H3d: The relationship between the masculinity versus femininity (MF)
dimension and entrepreneurial intention (EI) is moderated by perceived
desirability (PERDES) among the main ethnic groups in Madagascar’s
rural areas.
H3e: The relationship between the long-term versus short-term orientation
(LSO) dimension and entrepreneurial intention (EI) is moderated by
perceived desirability (PERDES) among the main ethnic groups in
Madagascar’s rural areas.
H3f: The relationship between the indulgence versus restraint (IR) dimension
and entrepreneurial intention (EI) is moderated by perceived desirability
(PERDES) among the main ethnic groups in Madagascar’s rural areas.
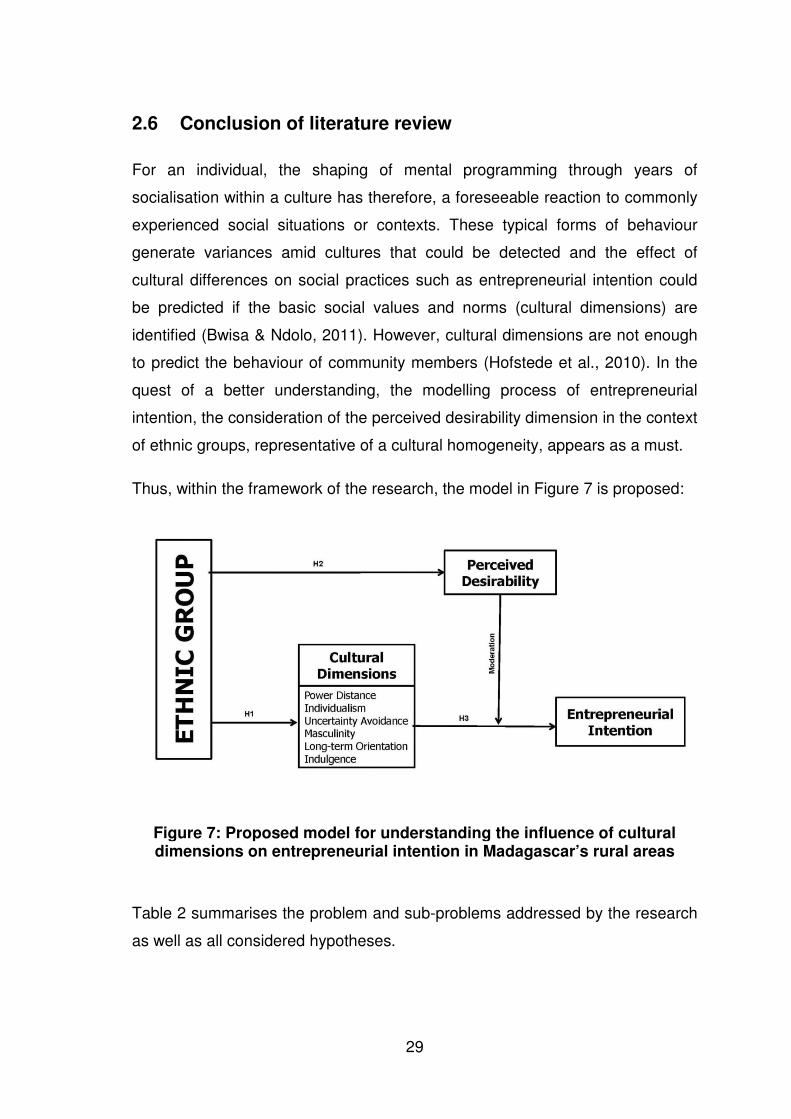
29
2.6 Conclusion of literature review
For an individual, the shaping of mental programming through years of
socialisation within a culture has therefore, a foreseeable reaction to commonly
experienced social situations or contexts. These typical forms of behaviour
generate variances amid cultures that could be detected and the effect of
cultural differences on social practices such as entrepreneurial intention could
be predicted if the basic social values and norms (cultural dimensions) are
identified (Bwisa & Ndolo, 2011). However, cultural dimensions are not enough
to predict the behaviour of community members (Hofstede et al., 2010). In the
quest of a better understanding, the modelling process of entrepreneurial
intention, the consideration of the perceived desirability dimension in the context
of ethnic groups, representative of a cultural homogeneity, appears as a must.
Thus, within the framework of the research, the model in Figure 7 is proposed:
Figure 7: Proposed model for understanding the influence of cultural dimensions on entrepreneurial intention in Madagascar’s rural areas
Table 2 summarises the problem and sub-problems addressed by the research
as well as all considered hypotheses.
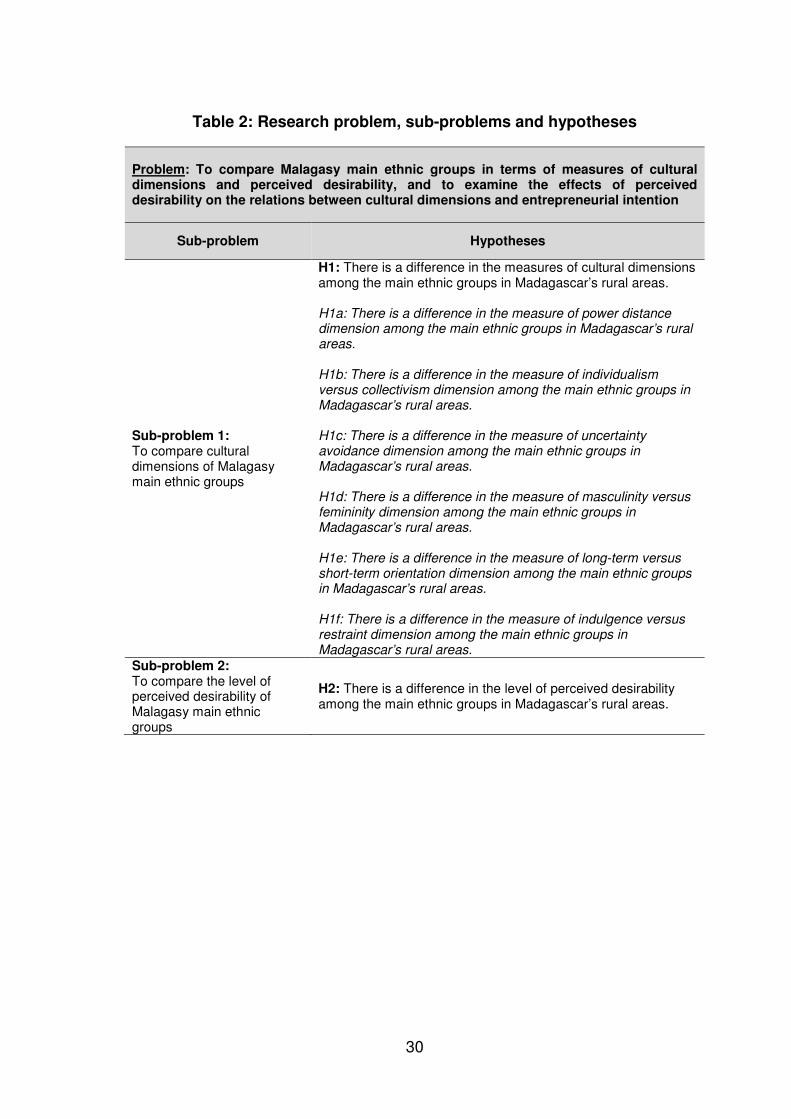
30
Table 2: Research problem, sub-problems and hypotheses
Problem: To compare Malagasy main ethnic groups in terms of measures of cultural dimensions and perceived desirability, and to examine the effects of perceived desirability on the relations between cultural dimensions and entrepreneurial intention
Sub-problem Hypotheses
Sub-problem 1: To compare cultural dimensions of Malagasy main ethnic groups
H1: There is a difference in the measures of cultural dimensions among the main ethnic groups in Madagascar’s rural areas. H1a: There is a difference in the measure of power distance dimension among the main ethnic groups in Madagascar’s rural areas.
H1b: There is a difference in the measure of individualism versus collectivism dimension among the main ethnic groups in Madagascar’s rural areas.
H1c: There is a difference in the measure of uncertainty avoidance dimension among the main ethnic groups in Madagascar’s rural areas.
H1d: There is a difference in the measure of masculinity versus femininity dimension among the main ethnic groups in Madagascar’s rural areas.
H1e: There is a difference in the measure of long-term versus short-term orientation dimension among the main ethnic groups in Madagascar’s rural areas.
H1f: There is a difference in the measure of indulgence versus restraint dimension among the main ethnic groups in Madagascar’s rural areas.
Sub-problem 2: To compare the level of perceived desirability of Malagasy main ethnic groups
H2: There is a difference in the level of perceived desirability among the main ethnic groups in Madagascar’s rural areas.
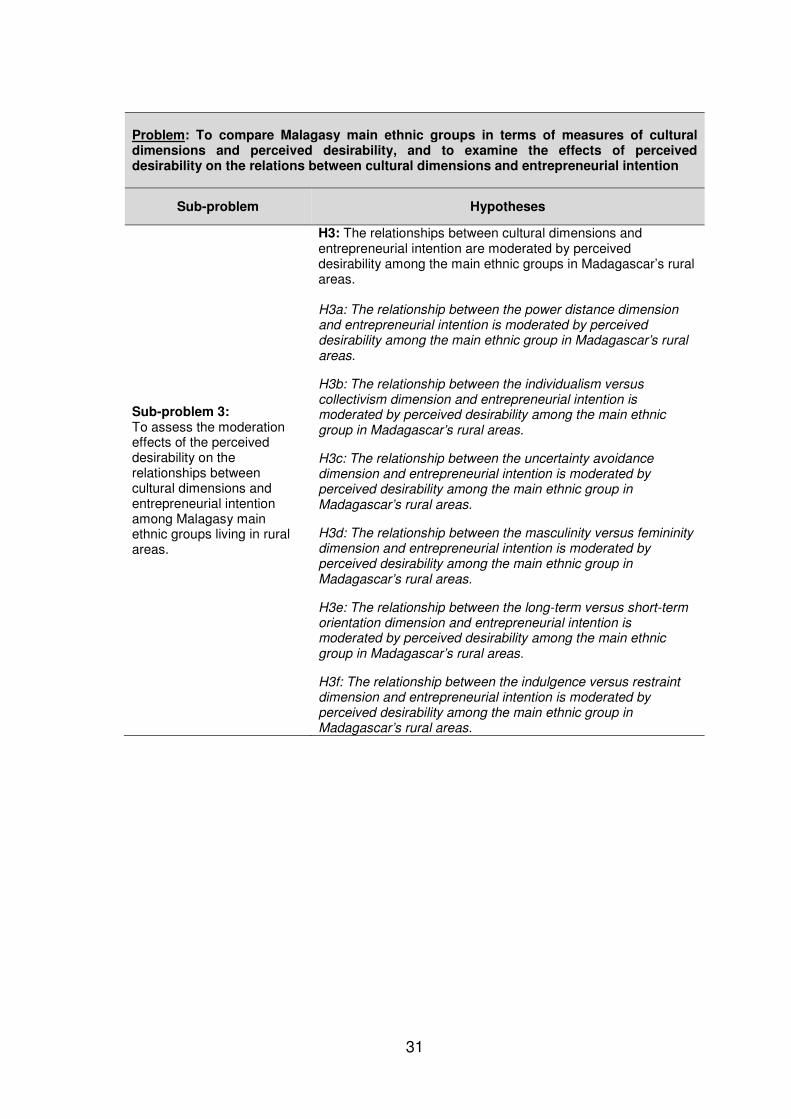
31
Problem: To compare Malagasy main ethnic groups in terms of measures of cultural dimensions and perceived desirability, and to examine the effects of perceived desirability on the relations between cultural dimensions and entrepreneurial intention
Sub-problem Hypotheses
Sub-problem 3: To assess the moderation effects of the perceived desirability on the relationships between cultural dimensions and entrepreneurial intention among Malagasy main ethnic groups living in rural areas.
H3: The relationships between cultural dimensions and entrepreneurial intention are moderated by perceived desirability among the main ethnic groups in Madagascar’s rural areas. H3a: The relationship between the power distance dimension and entrepreneurial intention is moderated by perceived desirability among the main ethnic group in Madagascar’s rural areas.
H3b: The relationship between the individualism versus collectivism dimension and entrepreneurial intention is moderated by perceived desirability among the main ethnic group in Madagascar’s rural areas.
H3c: The relationship between the uncertainty avoidance dimension and entrepreneurial intention is moderated by perceived desirability among the main ethnic group in Madagascar’s rural areas.
H3d: The relationship between the masculinity versus femininity dimension and entrepreneurial intention is moderated by perceived desirability among the main ethnic group in Madagascar’s rural areas.
H3e: The relationship between the long-term versus short-term orientation dimension and entrepreneurial intention is moderated by perceived desirability among the main ethnic group in Madagascar’s rural areas.
H3f: The relationship between the indulgence versus restraint dimension and entrepreneurial intention is moderated by perceived desirability among the main ethnic group in Madagascar’s rural areas.
32
CHAPTER 3: RESEARCH METHODOLOGY
This chapter describes the research methodology adopted for the
implementation of this research.
3.1 Research methodology
Based on its purpose, related problems, sub-problems and all hypotheses
identified and formulated, the research sought to validate evidence and to test
hypotheses and theory. This implies that it was necessary to gather relevant
data and analyse related statistics in order to either accept or reject the
hypotheses (Veal, 1997). To do so, the use of a quantitative approach appeared
to be the most appropriate.
Although some critics think that a quantitative approach may lead to the
denigration of human individuality and ability to think (Walle, 1997), it is very
important to underline that the quantitative researcher generally investigates
impartially and does not express his/her own opinion and interpretation. To do
so, measurement scales and rigorous sampling methods have to be the focus
of the data collection. In fact, quantitative study is also understood as:
“… an investigation into social or human difficulty, based on testing
a theory consisting of variables, measured with numbers and
analysed with statistical measures to be able to decide whether the
predictive generalisations of the theory is realistic” (Creswell, 1994,
cited by Engelbrecht, 2009, p. 99).
3.2 Research design
Considering resource constraints and the type of research that is correlational,
the use of a non-experimental cross-sectional survey research design was
recommended.
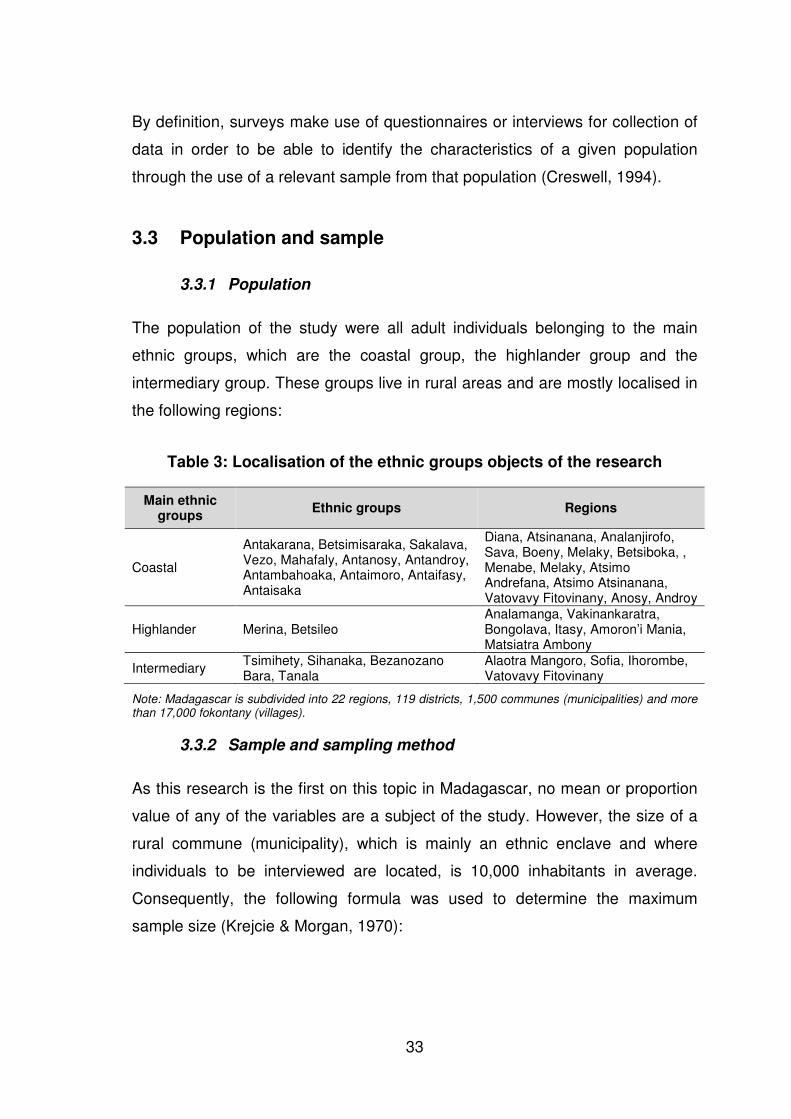
33
By definition, surveys make use of questionnaires or interviews for collection of
data in order to be able to identify the characteristics of a given population
through the use of a relevant sample from that population (Creswell, 1994).
3.3 Population and sample
3.3.1 Population
The population of the study were all adult individuals belonging to the main
ethnic groups, which are the coastal group, the highlander group and the
intermediary group. These groups live in rural areas and are mostly localised in
the following regions:
Table 3: Localisation of the ethnic groups objects of the research
Main ethnic groups
Ethnic groups Regions
Coastal
Antakarana, Betsimisaraka, Sakalava, Vezo, Mahafaly, Antanosy, Antandroy, Antambahoaka, Antaimoro, Antaifasy, Antaisaka
Diana, Atsinanana, Analanjirofo, Sava, Boeny, Melaky, Betsiboka, , Menabe, Melaky, Atsimo Andrefana, Atsimo Atsinanana, Vatovavy Fitovinany, Anosy, Androy
Highlander Merina, Betsileo Analamanga, Vakinankaratra, Bongolava, Itasy, Amoron’i Mania, Matsiatra Ambony
Intermediary Tsimihety, Sihanaka, Bezanozano Bara, Tanala
Alaotra Mangoro, Sofia, Ihorombe, Vatovavy Fitovinany
Note: Madagascar is subdivided into 22 regions, 119 districts, 1,500 communes (municipalities) and more than 17,000 fokontany (villages).
3.3.2 Sample and sampling method
As this research is the first on this topic in Madagascar, no mean or proportion
value of any of the variables are a subject of the study. However, the size of a
rural commune (municipality), which is mainly an ethnic enclave and where
individuals to be interviewed are located, is 10,000 inhabitants in average.
Consequently, the following formula was used to determine the maximum
sample size (Krejcie & Morgan, 1970):
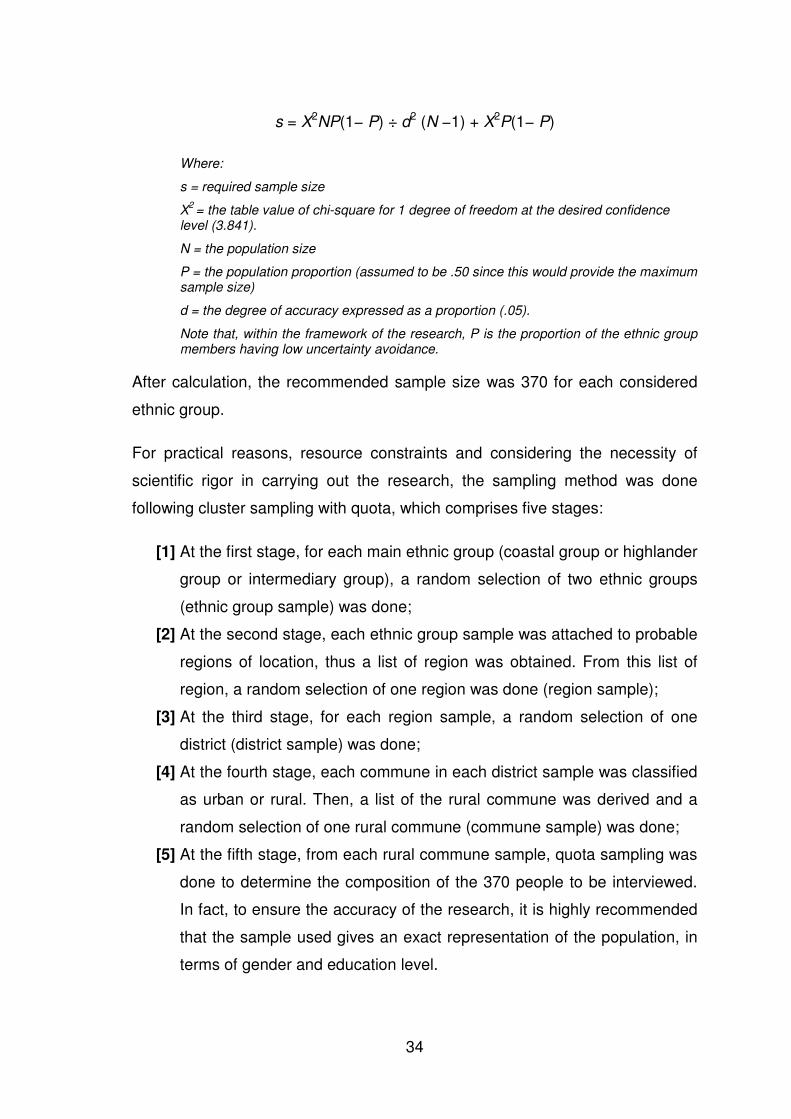
34
s = X2NP(1− P) ÷ d2 (N −1) + X2P(1− P)
Where:
s = required sample size
X2 = the table value of chi-square for 1 degree of freedom at the desired confidence
level (3.841).
N = the population size
P = the population proportion (assumed to be .50 since this would provide the maximum sample size)
d = the degree of accuracy expressed as a proportion (.05).
Note that, within the framework of the research, P is the proportion of the ethnic group members having low uncertainty avoidance.
After calculation, the recommended sample size was 370 for each considered
ethnic group.
For practical reasons, resource constraints and considering the necessity of
scientific rigor in carrying out the research, the sampling method was done
following cluster sampling with quota, which comprises five stages:
[1] At the first stage, for each main ethnic group (coastal group or highlander
group or intermediary group), a random selection of two ethnic groups
(ethnic group sample) was done;
[2] At the second stage, each ethnic group sample was attached to probable
regions of location, thus a list of region was obtained. From this list of
region, a random selection of one region was done (region sample);
[3] At the third stage, for each region sample, a random selection of one
district (district sample) was done;
[4] At the fourth stage, each commune in each district sample was classified
as urban or rural. Then, a list of the rural commune was derived and a
random selection of one rural commune (commune sample) was done;
[5] At the fifth stage, from each rural commune sample, quota sampling was
done to determine the composition of the 370 people to be interviewed.
In fact, to ensure the accuracy of the research, it is highly recommended
that the sample used gives an exact representation of the population, in
terms of gender and education level.
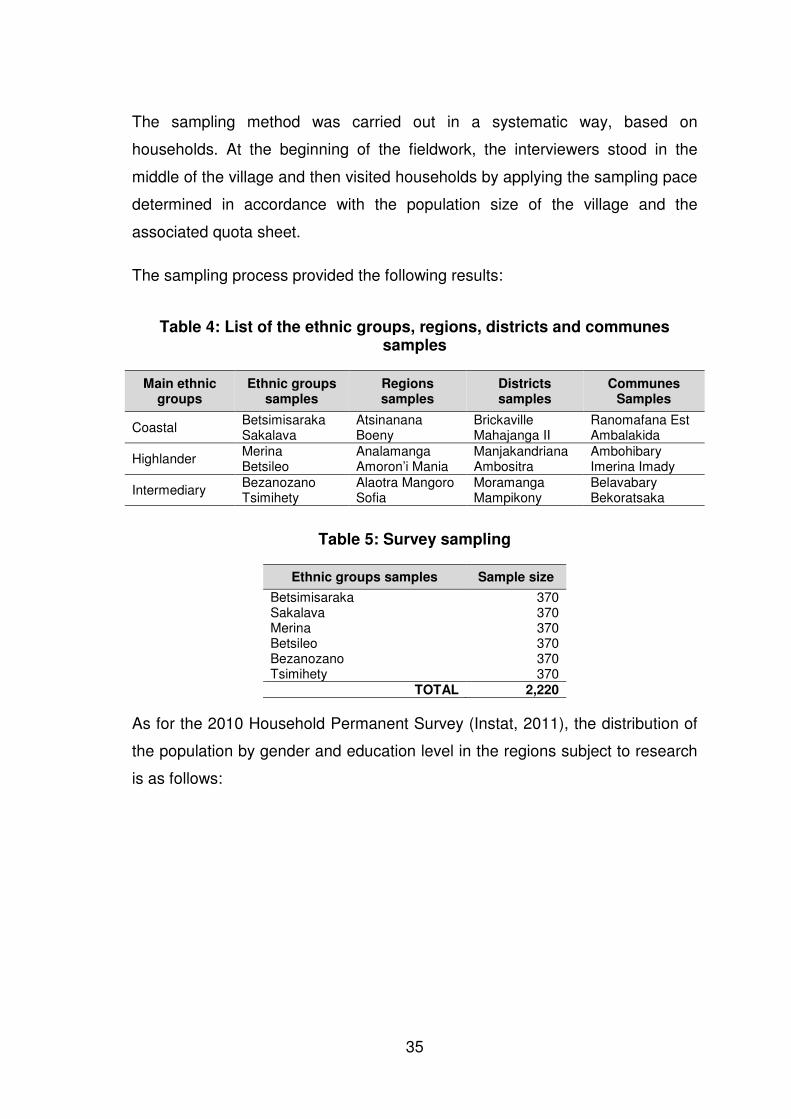
35
The sampling method was carried out in a systematic way, based on
households. At the beginning of the fieldwork, the interviewers stood in the
middle of the village and then visited households by applying the sampling pace
determined in accordance with the population size of the village and the
associated quota sheet.
The sampling process provided the following results:
Table 4: List of the ethnic groups, regions, districts and communes samples
Main ethnic groups
Ethnic groups samples
Regions samples
Districts samples
Communes Samples
Coastal Betsimisaraka Atsinanana Brickaville Ranomafana Est Sakalava Boeny Mahajanga II Ambalakida
Highlander Merina Analamanga Manjakandriana Ambohibary Betsileo Amoron’i Mania Ambositra Imerina Imady
Intermediary Bezanozano Alaotra Mangoro Moramanga Belavabary Tsimihety Sofia Mampikony Bekoratsaka
Table 5: Survey sampling
Ethnic groups samples Sample size
Betsimisaraka 370 Sakalava 370 Merina 370 Betsileo 370 Bezanozano 370 Tsimihety 370
TOTAL 2,220
As for the 2010 Household Permanent Survey (Instat, 2011), the distribution of
the population by gender and education level in the regions subject to research
is as follows:
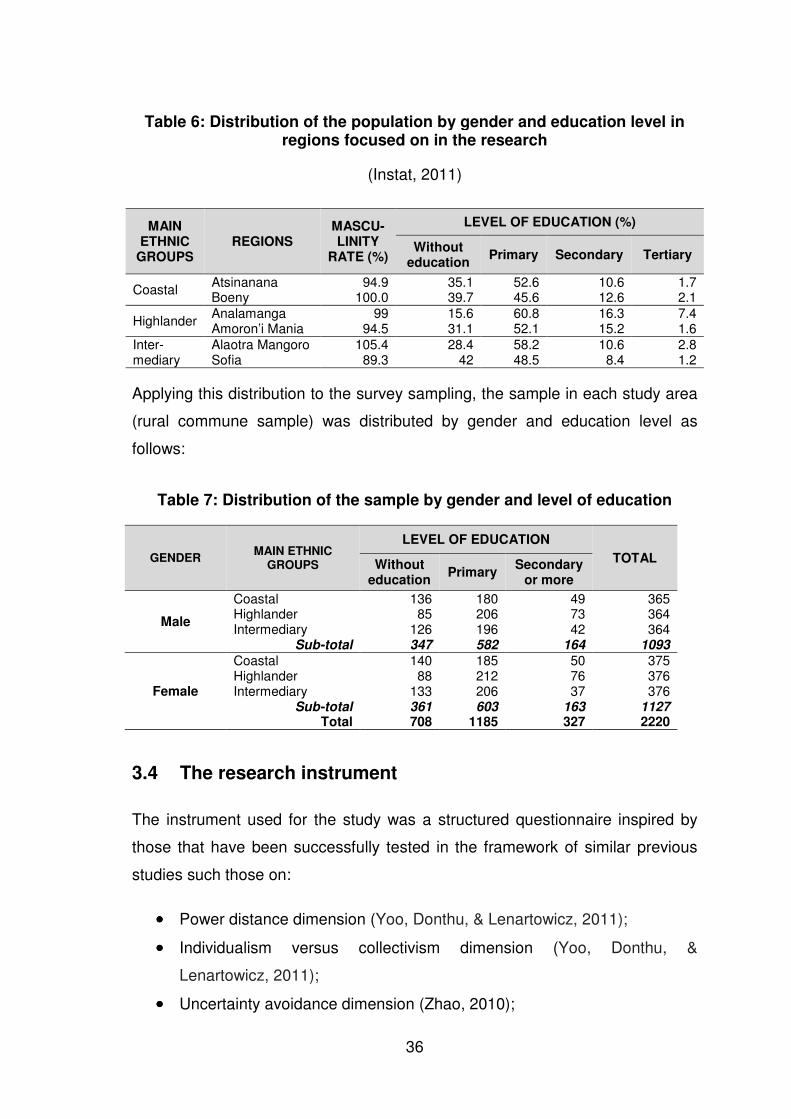
36
Table 6: Distribution of the population by gender and education level in regions focused on in the research
(Instat, 2011)
MAIN ETHNIC
GROUPS REGIONS
MASCU-LINITY
RATE (%)
LEVEL OF EDUCATION (%)
Without education
Primary Secondary Tertiary
Coastal Atsinanana 94.9 35.1 52.6 10.6 1.7 Boeny 100.0 39.7 45.6 12.6 2.1
Highlander Analamanga 99 15.6 60.8 16.3 7.4 Amoron’i Mania 94.5 31.1 52.1 15.2 1.6
Inter-mediary
Alaotra Mangoro 105.4 28.4 58.2 10.6 2.8 Sofia 89.3 42 48.5 8.4 1.2
Applying this distribution to the survey sampling, the sample in each study area
(rural commune sample) was distributed by gender and education level as
follows:
Table 7: Distribution of the sample by gender and level of education
GENDER MAIN ETHNIC
GROUPS
LEVEL OF EDUCATION
TOTAL Without education
Primary Secondary
or more
Male
Coastal 136 180 49 365 Highlander 85 206 73 364 Intermediary 126 196 42 364
Sub-total 347 582 164 1093
Female
Coastal 140 185 50 375 Highlander 88 212 76 376 Intermediary 133 206 37 376
Sub-total 361 603 163 1127 Total 708 1185 327 2220
3.4 The research instrument
The instrument used for the study was a structured questionnaire inspired by
those that have been successfully tested in the framework of similar previous
studies such those on:
•••• Power distance dimension (Yoo, Donthu, & Lenartowicz, 2011);
•••• Individualism versus collectivism dimension (Yoo, Donthu, &
Lenartowicz, 2011);
•••• Uncertainty avoidance dimension (Zhao, 2010);
37
•••• Masculinity versus femininity dimension (Yoo, Donthu, & Lenartowicz,
2011);
•••• Long-term versus short-term orientation dimension (Yoo, Donthu, &
Lenartowicz, 2011);
•••• Indulgence versus restraint dimension (dos Santos Góis Graça, 2011);
•••• Perceived desirability (Kennedy, Drenman, Renfrow & Watson, 2003);
and
•••• Entrepreneurial intention (Liñán & Chen, 2009).
Moreover, the questionnaire was formulated and designed to be administered to
rural adult individuals. The advice of Altermatt (2013) related to questionnaire
and survey design is the basis of the methodological approach of the
questionnaire. More specifically, it was about:
•••• Being focused on the construct to measure to ensure that all items
created are specific to the considered construct and the questionnaire
does not omit any dimension of the construct;
•••• Using of non-controversial language by setting up the answer to each
item as simply and forthrightly as possible;
•••• Avoiding questions that suggest a specific answer, known as leading
questions, and questions that enquire about two distinct concerns but
allow merely one answer, known as double-barrelled questions.
•••• Offering, in a consistent manner, response options to the respondents
by, for example, using a Likert scale.
It is very important to emphasise that the three phases related to the
implementation of the ten scale development steps (Slavec & Drnovsek, 2012),
which deal with the theoretical importance and existence of the construct, the
representativeness and appropriateness of the data collection, the statistical
analysis and statistical evidence of the construct respectively, were
scrupulously followed.
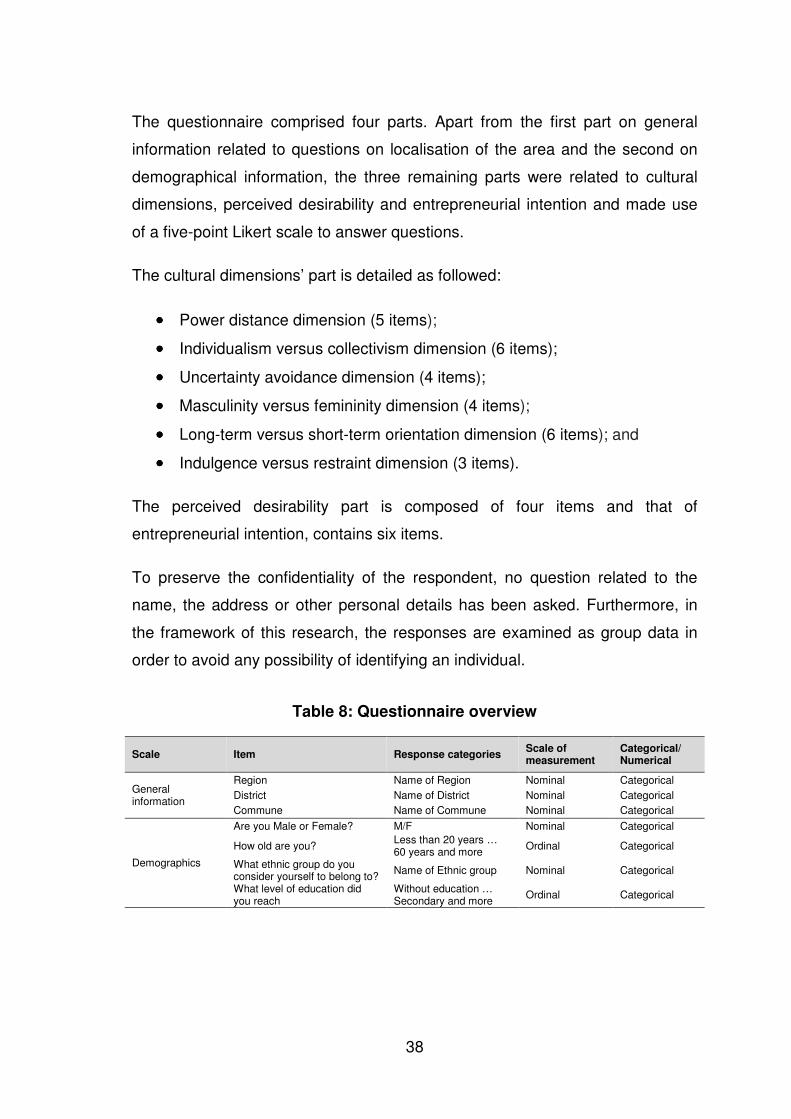
38
The questionnaire comprised four parts. Apart from the first part on general
information related to questions on localisation of the area and the second on
demographical information, the three remaining parts were related to cultural
dimensions, perceived desirability and entrepreneurial intention and made use
of a five-point Likert scale to answer questions.
The cultural dimensions’ part is detailed as followed:
•••• Power distance dimension (5 items);
•••• Individualism versus collectivism dimension (6 items);
•••• Uncertainty avoidance dimension (4 items);
•••• Masculinity versus femininity dimension (4 items);
•••• Long-term versus short-term orientation dimension (6 items); and
•••• Indulgence versus restraint dimension (3 items).
The perceived desirability part is composed of four items and that of
entrepreneurial intention, contains six items.
To preserve the confidentiality of the respondent, no question related to the
name, the address or other personal details has been asked. Furthermore, in
the framework of this research, the responses are examined as group data in
order to avoid any possibility of identifying an individual.
Table 8: Questionnaire overview
Scale Item Response categories Scale of measurement
Categorical/ Numerical
General information
Region Name of Region Nominal Categorical
District Name of District Nominal Categorical
Commune Name of Commune Nominal Categorical
Demographics
Are you Male or Female? M/F Nominal Categorical
How old are you? Less than 20 years … 60 years and more
Ordinal Categorical
What ethnic group do you consider yourself to belong to?
Name of Ethnic group Nominal Categorical
What level of education did you reach
Without education … Secondary and more
Ordinal Categorical
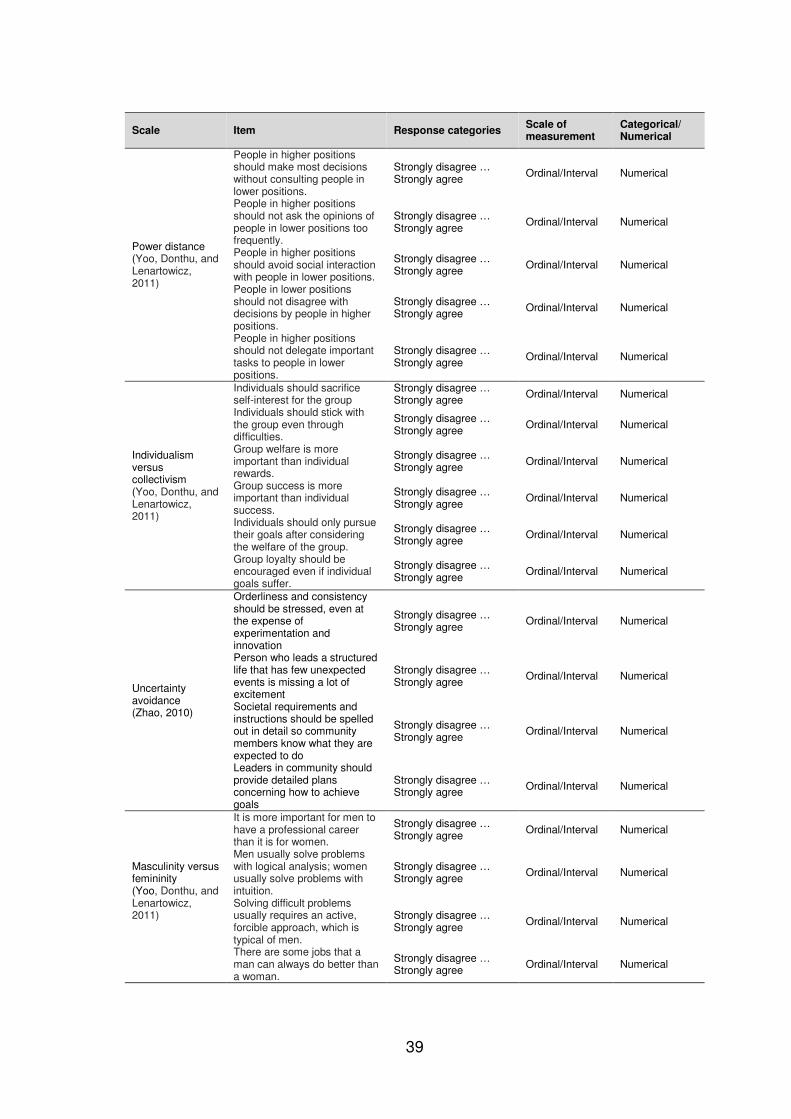
39
Scale Item Response categories Scale of measurement
Categorical/ Numerical
Power distance (Yoo, Donthu, and Lenartowicz, 2011)
People in higher positions should make most decisions without consulting people in lower positions.
Strongly disagree … Strongly agree
Ordinal/Interval Numerical
People in higher positions should not ask the opinions of people in lower positions too frequently.
Strongly disagree … Strongly agree
Ordinal/Interval Numerical
People in higher positions should avoid social interaction with people in lower positions.
Strongly disagree … Strongly agree
Ordinal/Interval Numerical
People in lower positions should not disagree with decisions by people in higher positions.
Strongly disagree … Strongly agree
Ordinal/Interval Numerical
People in higher positions should not delegate important tasks to people in lower positions.
Strongly disagree … Strongly agree
Ordinal/Interval Numerical
Individualism versus collectivism (Yoo, Donthu, and Lenartowicz, 2011)
Individuals should sacrifice self-interest for the group
Strongly disagree … Strongly agree
Ordinal/Interval Numerical
Individuals should stick with the group even through difficulties.
Strongly disagree … Strongly agree
Ordinal/Interval Numerical
Group welfare is more important than individual rewards.
Strongly disagree … Strongly agree
Ordinal/Interval Numerical
Group success is more important than individual success.
Strongly disagree … Strongly agree
Ordinal/Interval Numerical
Individuals should only pursue their goals after considering the welfare of the group.
Strongly disagree … Strongly agree
Ordinal/Interval Numerical
Group loyalty should be encouraged even if individual goals suffer.
Strongly disagree … Strongly agree
Ordinal/Interval Numerical
Uncertainty avoidance (Zhao, 2010)
Orderliness and consistency should be stressed, even at the expense of experimentation and innovation
Strongly disagree … Strongly agree
Ordinal/Interval Numerical
Person who leads a structured life that has few unexpected events is missing a lot of excitement
Strongly disagree … Strongly agree
Ordinal/Interval Numerical
Societal requirements and instructions should be spelled out in detail so community members know what they are expected to do
Strongly disagree … Strongly agree
Ordinal/Interval Numerical
Leaders in community should provide detailed plans concerning how to achieve goals
Strongly disagree … Strongly agree
Ordinal/Interval Numerical
Masculinity versus femininity (Yoo, Donthu, and Lenartowicz, 2011)
It is more important for men to have a professional career than it is for women.
Strongly disagree … Strongly agree
Ordinal/Interval Numerical
Men usually solve problems with logical analysis; women usually solve problems with intuition.
Strongly disagree … Strongly agree
Ordinal/Interval Numerical
Solving difficult problems usually requires an active, forcible approach, which is typical of men.
Strongly disagree … Strongly agree
Ordinal/Interval Numerical
There are some jobs that a man can always do better than a woman.
Strongly disagree … Strongly agree
Ordinal/Interval Numerical
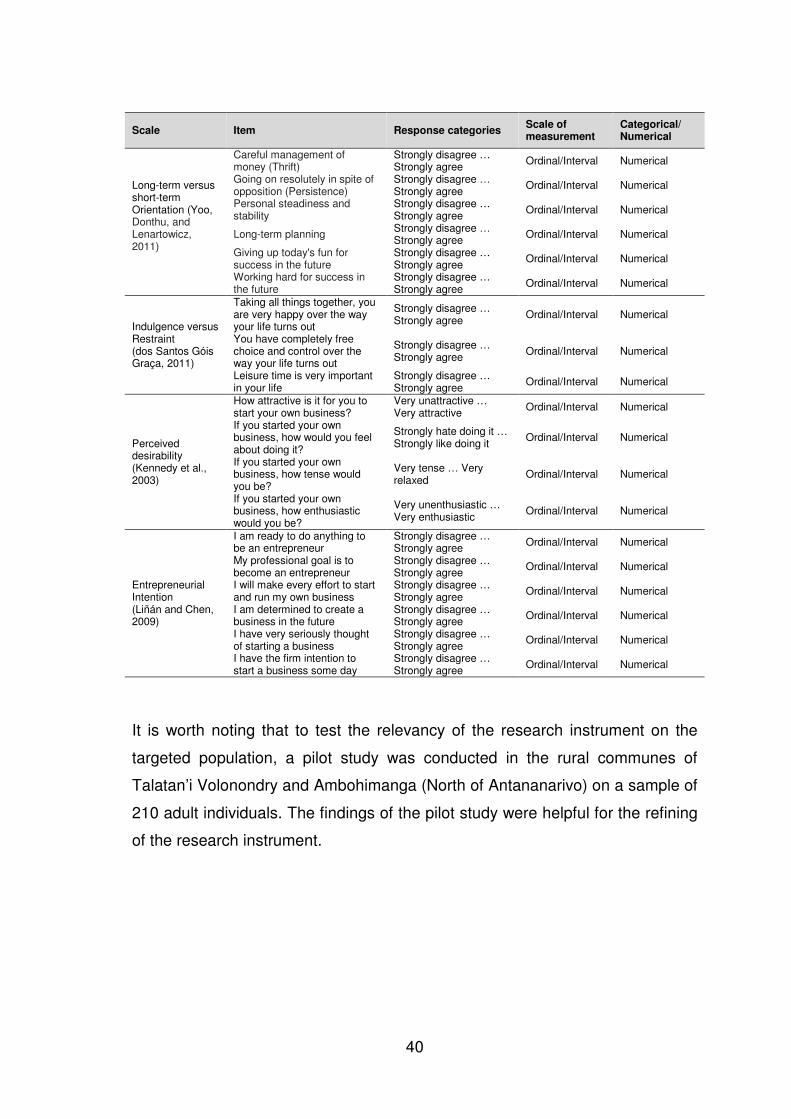
40
Scale Item Response categories Scale of measurement
Categorical/ Numerical
Long-term versus short-term Orientation (Yoo, Donthu, and Lenartowicz, 2011)
Careful management of money (Thrift)
Strongly disagree … Strongly agree
Ordinal/Interval Numerical
Going on resolutely in spite of opposition (Persistence)
Strongly disagree … Strongly agree
Ordinal/Interval Numerical
Personal steadiness and stability
Strongly disagree … Strongly agree
Ordinal/Interval Numerical
Long-term planning Strongly disagree … Strongly agree
Ordinal/Interval Numerical
Giving up today's fun for success in the future
Strongly disagree … Strongly agree
Ordinal/Interval Numerical
Working hard for success in the future
Strongly disagree … Strongly agree
Ordinal/Interval Numerical
Indulgence versus Restraint (dos Santos Góis Graça, 2011)
Taking all things together, you are very happy over the way your life turns out
Strongly disagree … Strongly agree
Ordinal/Interval Numerical
You have completely free choice and control over the way your life turns out
Strongly disagree … Strongly agree
Ordinal/Interval Numerical
Leisure time is very important in your life
Strongly disagree … Strongly agree
Ordinal/Interval Numerical
Perceived desirability (Kennedy et al., 2003)
How attractive is it for you to start your own business?
Very unattractive … Very attractive
Ordinal/Interval Numerical
If you started your own business, how would you feel about doing it?
Strongly hate doing it … Strongly like doing it
Ordinal/Interval Numerical
If you started your own business, how tense would you be?
Very tense … Very relaxed
Ordinal/Interval Numerical
If you started your own business, how enthusiastic would you be?
Very unenthusiastic … Very enthusiastic
Ordinal/Interval Numerical
Entrepreneurial Intention (Liñán and Chen, 2009)
I am ready to do anything to be an entrepreneur
Strongly disagree … Strongly agree
Ordinal/Interval Numerical
My professional goal is to become an entrepreneur
Strongly disagree … Strongly agree
Ordinal/Interval Numerical
I will make every effort to start and run my own business
Strongly disagree … Strongly agree
Ordinal/Interval Numerical
I am determined to create a business in the future
Strongly disagree … Strongly agree
Ordinal/Interval Numerical
I have very seriously thought of starting a business
Strongly disagree … Strongly agree
Ordinal/Interval Numerical
I have the firm intention to start a business some day
Strongly disagree … Strongly agree
Ordinal/Interval Numerical
It is worth noting that to test the relevancy of the research instrument on the
targeted population, a pilot study was conducted in the rural communes of
Talatan’i Volonondry and Ambohimanga (North of Antananarivo) on a sample of
210 adult individuals. The findings of the pilot study were helpful for the refining
of the research instrument.
41
3.5 Procedure for data collection
To carry out the data collection, three teams under the general supervision of
the researcher were set up. Each team was composed of one supervisor and
two interviewers and was responsible for two districts and so, two communes
sample, which means that on average, 740 individuals were interviewed per
team. On a voluntary basis, the questionnaire was administered directly to the
respondent by the interviewer. At the end of each survey day, the supervisor
proceeded to a systematic verification of all completed questionnaires. Each
team remained in the surveyed commune for five days.
3.6 Data analysis and interpretation
The first point of data analysis was the data entry. Given the number of
questionnaires that had to be processed, data entry operators were recruited
and trained. The data entry was done in five days through Google Drive under
the supervision of the researcher. Microsoft Excel was used to provide clear
data.
The first step of the data analysis was the presentation of the demographics of
the respondents: distribution by gender, age, ethnic group and education level.
The second step was the analysis of the scale characteristics which include the
presentation of the summary statistics (means, medians, standard deviations
etc.), measures of the scale reliability and the scale validity.
3.6.1 Scale reliability
Scale reliability is a test carried out in order to determine the accuracy and
precision of the measurement procedure related to a considered scale (Cooper
& Schindler, 2011). It has to do with the scale’s internal consistency and
consequently the extent to which the items within the scale could be
generalised (Welman & Kruger, 2001).
42
In practice, the Cronbach’s coefficient alpha, which measures internal
consistency reliability among a group of items combined to form a single scale,
is used to measure the degree to which the scale items are homogenous and
reflect the same underlying constructs (Cooper & Schindler, 2011). In other
words, this coefficient is a reflection of how well the different items complement
each other in their measurement of different aspects of the considered scale.
Based on George and Mallery’s (2003) rule of thumb, a Cronbach’s coefficient
alpha:
• >.90 is excellent;
• >.80 is good;
• >.70 is acceptable;
• >.60 is questionable;
• >.50 is poor; and
• <.50 is unacceptable.
For a considered scale that is composed of n items, three types of indicators
have to be studied together when dealing with the measurement of internal
consistency in order to determine the final item composition of the scale (De
Vaus, 2002):
[1] The overall Cronbach’s alpha which provides to what extent the internal
consistency among the n items is;
[2] The corrected Item-Total correlation, related to each item, which
assesses internally consistent the item’s score is with composite scores
from all other items that remain. If this correlation is weak (<.30), then
that item should be removed and not used to form a composite score for
the considered scale; and
[3] The Cronbach’s alpha if item deleted, which gives the value of the overall
Cronbach’s alpha if the item in question is removed.
43
3.6.2 Scale validity
The scale validity test seeks to capture the suitability or meaningfulness of the
measurement. In other words, it tries to find out if the instrument accurately
describes the construct to be measured. To do so, it is recommended to
proceed with a factor analysis, which is a set of methods aiming to understand
the influence of underlying constructs on a number of studied variables. There
are two main types of factor analysis, first, exploratory factor analysis (EFA)
which tries to unveil the nature of the constructs influencing a collection of
responses, and second the confirmatory factor analysis (CFA) which measures
if a given collection of constructs is influencing responses in a foreseeable
manner or not (DeCoster & Claypool, 2004).
Within the framework of the research, principle component analysis (PCA),
which is a procedure strongly related to EFA, was performed in choosing a
varimax rotation.
In relation to the appropriateness of factor analysis, the output is detailed as
follows:
• The descriptive statistics table is very helpful in getting a tally of valid
cases. In a PCA, the ratio of cases to variables should be at least five to
one;
• The correlation matrix table is useful in determining the presence of
substantial correlations. In a PCA, it is required that there are some
correlations greater than .30 between the variables included in the
analysis;
• The anti-image matrices are used for checking the sampling adequacy of
individual variables. Here, the focus is put on the anti-image correlation
matrix and specifically on the Kaiser-Meyer-Olkin measure of sampling
adequacy (MSA), which has to be greater than .50 for each individual
variable; and
44
• The KMO and Barlett’s Test table helps in verifying the sampling
adequacy for set variables. In a PCA, the MSA must be greater than .5
for the set of variables. Furthermore, the probability associated with
Barlett’s test of sphericity has to be less than the level of significance
(p<.05) (Beaumont, 2012; DeCoster & Claypool, 2004).
In relations to the number of factors to extract, the output is detailed as follows:
• The communalities table, which presents the proportion of the variance in
the original variables, accounted for in the factor solution. Ideally, the
communality value for each variable should be .60 or higher;
• The total variance explained table which, by using the output from
iteration 1, gives the latent root criterion for number of factors to derive
(eigenvalues greater than 1.0) indicating the number of components to
be extracted for the considered variable. In addition, the column related
to the cumulative proportion of variance criteria allows identifying the
number of components, which satisfy the criterion of explaining 60
percent or more of the total variance (Beaumont, 2012; DeCoster &
Claypool, 2004).
The third step of the data analysis and interpretation phase of the research is
the test of the proposed hypotheses.
3.6.3 Testing of hypotheses 1 and 2
Hypothesis 1 (H1) was formulated as follows: There is a difference in the
measures of cultural dimensions among the main ethnic groups in
Madagascar’s rural areas. It had six sub-hypotheses related to each cultural
dimension.
For hypothesis 1, the dependent variable (DV) was the measures of cultural
dimensions and the independent variable (IV) was the main ethnic group.
Hypothesis 2 (H2) was formulated as follows: There is a difference in the level
of perceived desirability among the main ethnic groups in Madagascar’s rural
areas.
45
For hypothesis 2, the dependent variable (DV) was the perceived desirability
and the independent variable (IV) was the main ethnic group.
Based on this information, it appears that the testing of these hypotheses lead
to the comparison of more than two groups. Thus, the classical t-test cannot be
applied here. The solution is the use of the analysis of variance (ANOVA) which
is a procedure for detecting significant differences among any number of groups
with one test. As only one dependent variable exists within the framework of the
hypothesis, the test procedure to be applied is called a one-way ANOVA
(Meyers, Gamst & Guarino, 2006).
Within the framework of the research, the one-way ANOVA sought to derive
and compare the variance between the main ethnic groups and the variability
that occurs within the main ethnic groups with regard to each cultural dimension
or perceived desirability.
Talking about one-way ANOVA means dealing with the ANOVA test statistic, F
which is the ratio of the between groups variability to the within-groups
variability (Meyers, et al., 2006). The decision to accept or reject a hypothesis
derives from the content of the ANOVA table (produced by SPSS 21) which
comprises the source of the variance, the sum of squares values for each
source, the degrees of freedom for each, the mean square values, the value of
F, the value of p (denoted in the tables as Sig.).
If the value of p is .05 or less, the result is statistically significant, which means
the null hypothesis is rejected in favour of the considered hypothesis. In the
contrary case, the null hypothesis is retained (Meyers, et al., 2006).
It should be underlined that, the one-way ANOVA only helps to discover if there
are significant differences among more than two groups; however, it does not
show which groups are significantly different from which. In the case where the
results in a comparison indicate significance and the related effect size shown
by the partial eta-squared [η2p] gives the magnitude of the this overall difference.
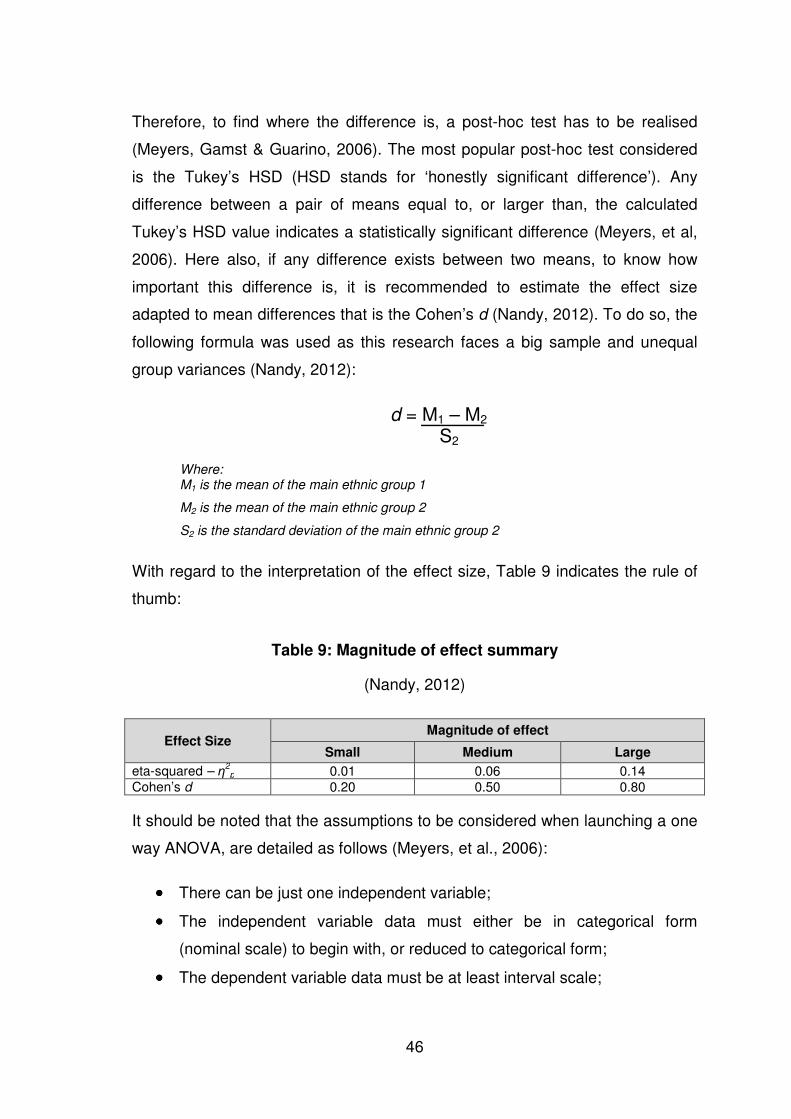
46
Therefore, to find where the difference is, a post-hoc test has to be realised
(Meyers, Gamst & Guarino, 2006). The most popular post-hoc test considered
is the Tukey’s HSD (HSD stands for ‘honestly significant difference’). Any
difference between a pair of means equal to, or larger than, the calculated
Tukey’s HSD value indicates a statistically significant difference (Meyers, et al,
2006). Here also, if any difference exists between two means, to know how
important this difference is, it is recommended to estimate the effect size
adapted to mean differences that is the Cohen’s d (Nandy, 2012). To do so, the
following formula was used as this research faces a big sample and unequal
group variances (Nandy, 2012):
d = M1 – M2
S2 Where: M1 is the mean of the main ethnic group 1
M2 is the mean of the main ethnic group 2
S2 is the standard deviation of the main ethnic group 2
With regard to the interpretation of the effect size, Table 9 indicates the rule of
thumb:
Table 9: Magnitude of effect summary
(Nandy, 2012)
Effect Size Magnitude of effect
Small Medium Large
eta-squared – η2p 0.01 0.06 0.14
Cohen’s d 0.20 0.50 0.80
It should be noted that the assumptions to be considered when launching a one
way ANOVA, are detailed as follows (Meyers, et al., 2006):
•••• There can be just one independent variable;
•••• The independent variable data must either be in categorical form
(nominal scale) to begin with, or reduced to categorical form;
•••• The dependent variable data must be at least interval scale;
47
•••• There are k-samples independently and randomly drawn from the source
population;
•••• The population from which the subjects are drawn is normally distributed;
and
•••• All k-samples are distributed similarly (homogeneity of variance).
However, if the k-samples have the same size, there is no concern about those
above-mentioned warnings as the one-way ANOVA is quite robust i.e. relatively
unperturbed by violations of its assumptions (Bagenda, 2009). The only change
in the process to be checked scrupulously is the fulfilling or not of the
homogeneity assumption.
In fact, within the framework of the research, when it appeared that the k-
samples were not similarly distributed, the post-hoc test launched was the
Tamhane’s T2 reserved for the case of an equal variance not assumed.
As a reminder, it is worthwhile to specify that the most common test of
homogeneity of variance is the Levene’s test. It aims, on an interval dependent,
to test the assumption that each group of one or more categorical independent
variables (the main ethnic groups) has the same variance. If the significance of
the Levene statistic is significant (p<.05), the homogeneity assumption is not
fulfilled (Garson, 2012).
Thus, within the framework of the research, as there were three samples
(coastal group sample, highlander group sample, intermediary group sample)
drawn independently and randomly from the population of Malagasy living in
rural areas and each comprising 740 adult individuals the use of a one-way
ANOVA for testing the hypotheses 2 and 3 was largely justified.
3.6.4 Testing of hypothesis 3
As hypothesis 3 (H3) was about seeking the moderation effect of the perceived
desirability on the relationship between each cultural dimension and the
entrepreneurial intention, the recommended analysis method was a moderation
analysis (Field, 2013).
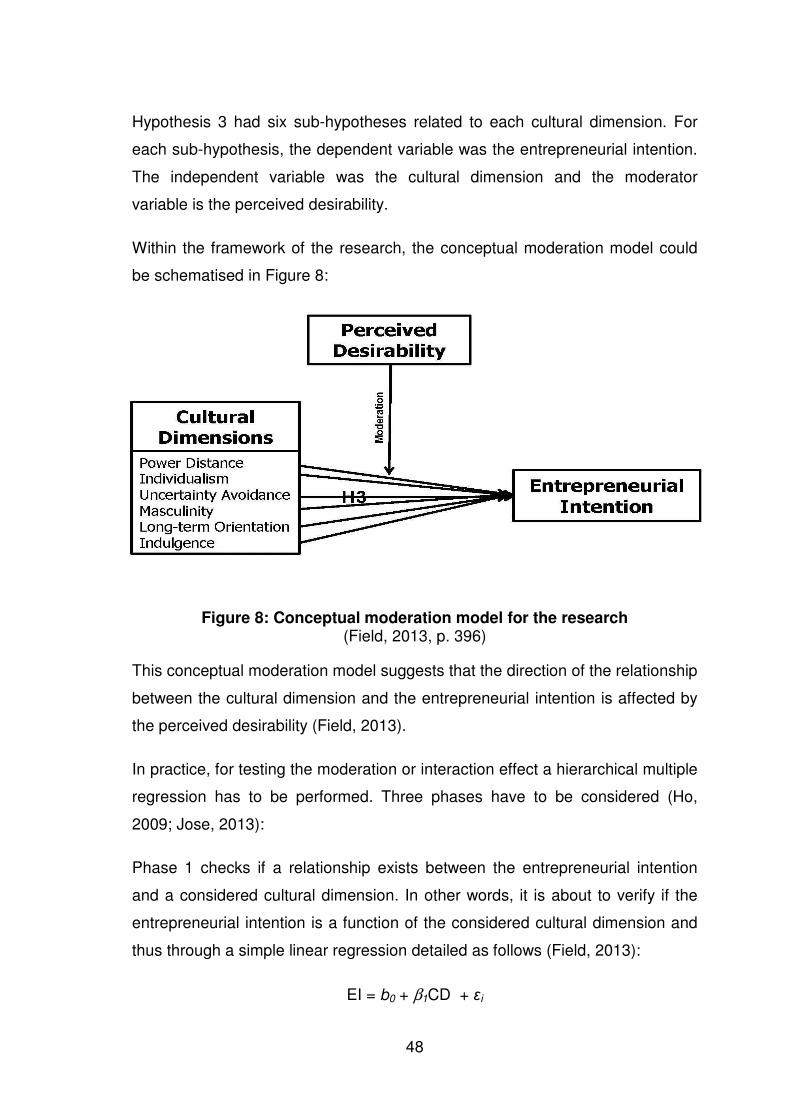
48
Hypothesis 3 had six sub-hypotheses related to each cultural dimension. For
each sub-hypothesis, the dependent variable was the entrepreneurial intention.
The independent variable was the cultural dimension and the moderator
variable is the perceived desirability.
Within the framework of the research, the conceptual moderation model could
be schematised in Figure 8:
Figure 8: Conceptual moderation model for the research (Field, 2013, p. 396)
This conceptual moderation model suggests that the direction of the relationship
between the cultural dimension and the entrepreneurial intention is affected by
the perceived desirability (Field, 2013).
In practice, for testing the moderation or interaction effect a hierarchical multiple
regression has to be performed. Three phases have to be considered (Ho,
2009; Jose, 2013):
Phase 1 checks if a relationship exists between the entrepreneurial intention
and a considered cultural dimension. In other words, it is about to verify if the
entrepreneurial intention is a function of the considered cultural dimension and
thus through a simple linear regression detailed as follows (Field, 2013):
EI = b0 + β1CD + εi
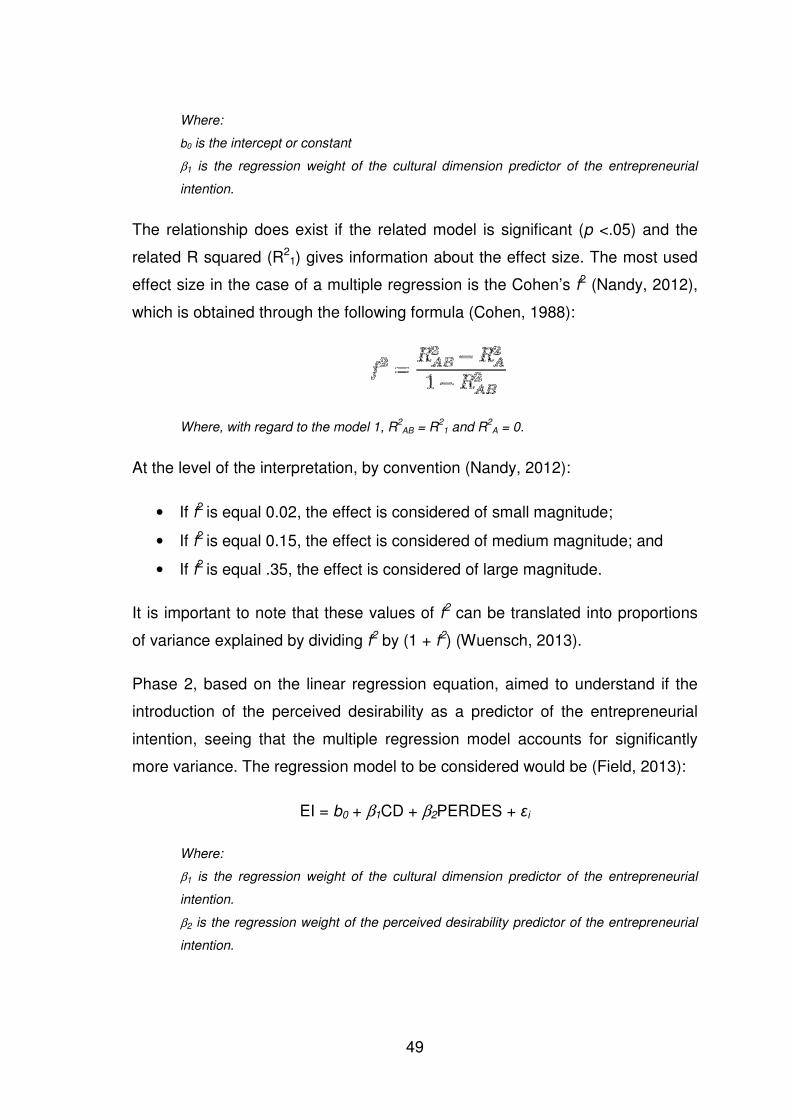
49
Where:
b0 is the intercept or constant
β1 is the regression weight of the cultural dimension predictor of the entrepreneurial
intention.
The relationship does exist if the related model is significant (p <.05) and the
related R squared (R21) gives information about the effect size. The most used
effect size in the case of a multiple regression is the Cohen’s f2 (Nandy, 2012),
which is obtained through the following formula (Cohen, 1988):
Where, with regard to the model 1, R2AB = R
21 and R
2A = 0.
At the level of the interpretation, by convention (Nandy, 2012):
• If f2 is equal 0.02, the effect is considered of small magnitude;
• If f2 is equal 0.15, the effect is considered of medium magnitude; and
• If f2 is equal .35, the effect is considered of large magnitude.
It is important to note that these values of f2 can be translated into proportions
of variance explained by dividing f2 by (1 + f2) (Wuensch, 2013).
Phase 2, based on the linear regression equation, aimed to understand if the
introduction of the perceived desirability as a predictor of the entrepreneurial
intention, seeing that the multiple regression model accounts for significantly
more variance. The regression model to be considered would be (Field, 2013):
EI = b0 + β1CD + β2PERDES + εi
Where:
β1 is the regression weight of the cultural dimension predictor of the entrepreneurial
intention.
β2 is the regression weight of the perceived desirability predictor of the entrepreneurial
intention.
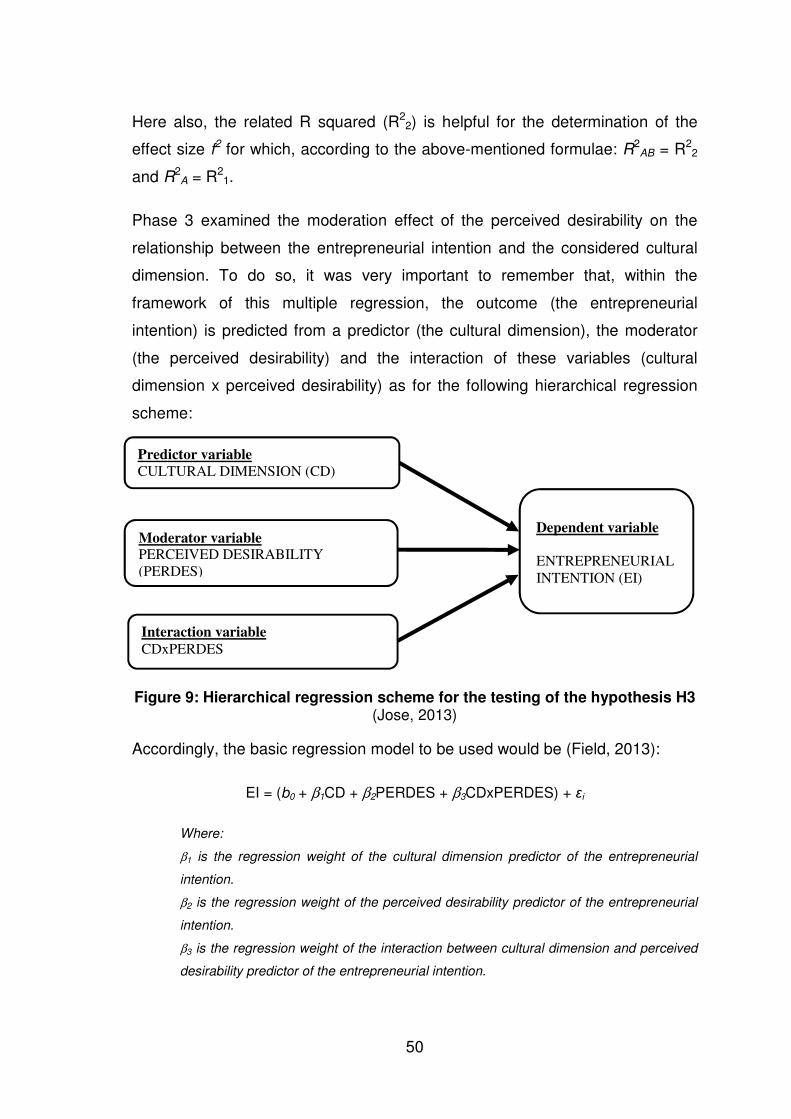
50
Here also, the related R squared (R22) is helpful for the determination of the
effect size f2 for which, according to the above-mentioned formulae: R2AB = R2
2
and R2A = R2
1.
Phase 3 examined the moderation effect of the perceived desirability on the
relationship between the entrepreneurial intention and the considered cultural
dimension. To do so, it was very important to remember that, within the
framework of this multiple regression, the outcome (the entrepreneurial
intention) is predicted from a predictor (the cultural dimension), the moderator
(the perceived desirability) and the interaction of these variables (cultural
dimension x perceived desirability) as for the following hierarchical regression
scheme:
Figure 9: Hierarchical regression scheme for the testing of the hypothesis H3
(Jose, 2013)
Accordingly, the basic regression model to be used would be (Field, 2013):
EI = (b0 + β1CD + β2PERDES + β3CDxPERDES) + εi
Where:
β1 is the regression weight of the cultural dimension predictor of the entrepreneurial
intention.
β2 is the regression weight of the perceived desirability predictor of the entrepreneurial
intention.
β3 is the regression weight of the interaction between cultural dimension and perceived
desirability predictor of the entrepreneurial intention.
Predictor variable
CULTURAL DIMENSION (CD)
Moderator variable PERCEIVED DESIRABILITY
(PERDES)
Interaction variable
CDxPERDES
Dependent variable
ENTREPRENEURIAL
INTENTION (EI)
51
But in order to run this regression model suitably, the centring of the predictors
by using the grand mean as a pivotal point was realised as well as the creation
of the interaction variable, by multiplying the centred predictor variable and the
centred moderator variable together. It is important to note that the centring of
the predictors is supported by the necessity of standardising all variables in
order to easily interpret the results and to avoid multicollinearity (Field, 2013).
The new variable created was integrated within the data and the multiple
regression with interaction (moderation analysis) launched. The output from the
moderation analysis comprises (Field, 2013):
• b-value for each predictors with the associated standard errors;
• Each b-value is compared to zero using a t-test; and
• Confidence interval for the b-value is produced as well as the related p-
value.
If for the interaction variable (centred cultural dimension x centred perceived
desirability) the value of p is less than .05, it could be concluded that the
perceived desirability moderates the relationship between the cultural
dimension and the entrepreneurial intention. Moreover, as for moth regression
equations, the related R squared (R23) provides information about the effect size
f2 for which: R2AB = R2
3 and R2A = R2
2.
Finally, if a moderation effect was noticed, it was judicious to end the analysis
with a simple slopes analysis in order to visualise the relationship between the
cultural dimension and the entrepreneurial intention (Field, 2013). To do so, it is
recommended that the nine cells means be generated for graphing. Both the
measure of cultural dimension and the level of perceived desirability have to be
put in a trichromatic way (high, medium and low) – trichromatisation - and a
cross table, containing as cells the means of related level of entrepreneurial
intention (EIn), set up as per Table 10:
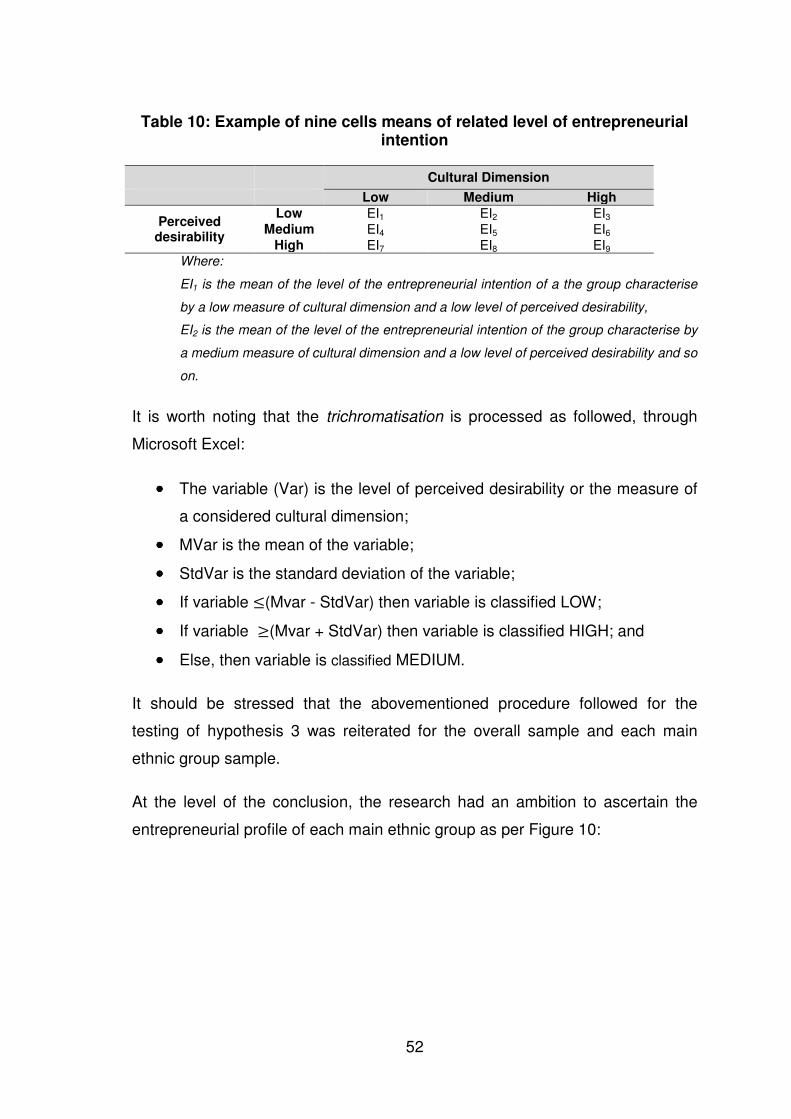
52
Table 10: Example of nine cells means of related level of entrepreneurial intention
Cultural Dimension
Low Medium High
Perceived desirability
Low EI1 EI2 EI3 Medium EI4 EI5 EI6
High EI7 EI8 EI9 Where:
EI1 is the mean of the level of the entrepreneurial intention of a the group characterise
by a low measure of cultural dimension and a low level of perceived desirability,
EI2 is the mean of the level of the entrepreneurial intention of the group characterise by
a medium measure of cultural dimension and a low level of perceived desirability and so
on.
It is worth noting that the trichromatisation is processed as followed, through
Microsoft Excel:
•••• The variable (Var) is the level of perceived desirability or the measure of
a considered cultural dimension;
•••• MVar is the mean of the variable;
•••• StdVar is the standard deviation of the variable;
•••• If variable ≤(Mvar - StdVar) then variable is classified LOW;
•••• If variable ≥(Mvar + StdVar) then variable is classified HIGH; and
•••• Else, then variable is classified MEDIUM.
It should be stressed that the abovementioned procedure followed for the
testing of hypothesis 3 was reiterated for the overall sample and each main
ethnic group sample.
At the level of the conclusion, the research had an ambition to ascertain the
entrepreneurial profile of each main ethnic group as per Figure 10:
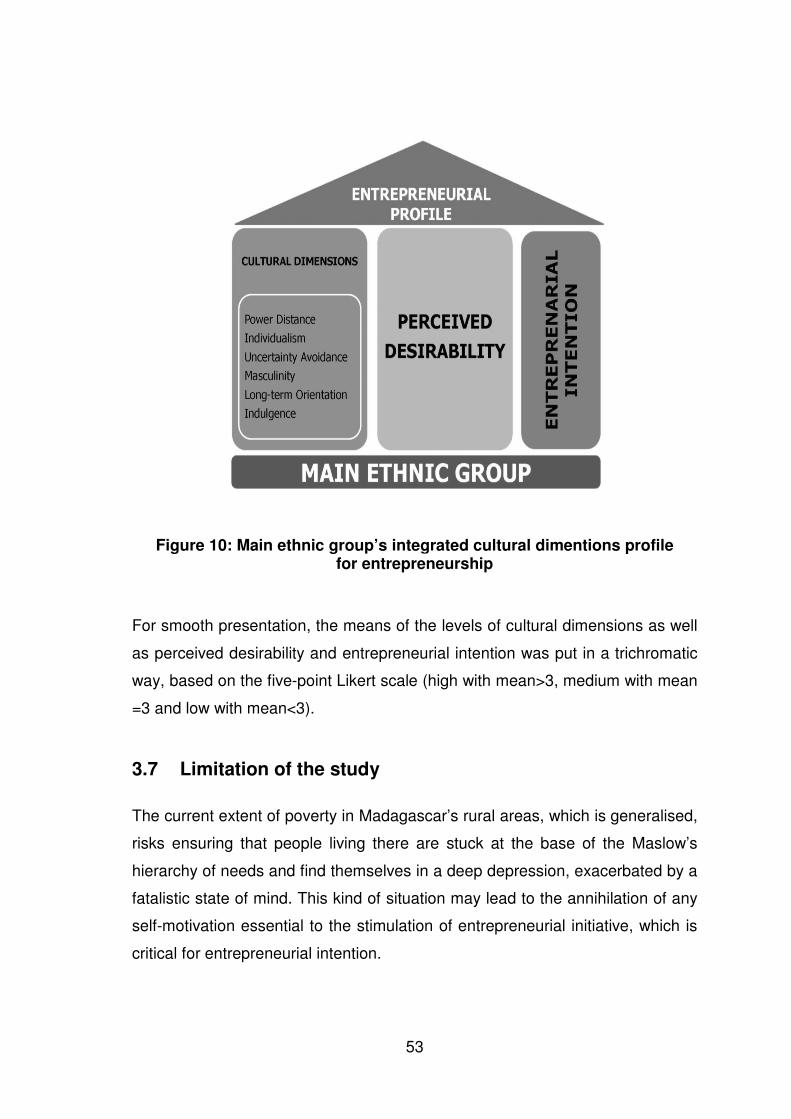
53
Figure 10: Main ethnic group’s integrated cultural dimentions profile for entrepreneurship
For smooth presentation, the means of the levels of cultural dimensions as well
as perceived desirability and entrepreneurial intention was put in a trichromatic
way, based on the five-point Likert scale (high with mean>3, medium with mean
=3 and low with mean<3).
3.7 Limitation of the study
The current extent of poverty in Madagascar’s rural areas, which is generalised,
risks ensuring that people living there are stuck at the base of the Maslow’s
hierarchy of needs and find themselves in a deep depression, exacerbated by a
fatalistic state of mind. This kind of situation may lead to the annihilation of any
self-motivation essential to the stimulation of entrepreneurial initiative, which is
critical for entrepreneurial intention.
54
On the contrary, the need for those people to find reliable sources of income,
can also lead them to want to settle on their own account as self-employed and
thus to have a high level of entrepreneurial intention.
However, in this case as in any other, with regard to the sampling procedure
adopted, the research results accurately reflect the entrepreneurial intention
situation prevailing in Madagascar’s rural areas.
3.8 Validity and reliability
The concepts of validity and reliability related to the research are explained.
3.8.1 External validity
External validity is ensured to verify whether the results of the study may be
valid in other places if generalisation is necessary (Cooper & Schindler, 2011).
In this case, caution should be exercised as the research involved only six of 18
ethnic groups. In addition, the sampling method chosen for reasons of practical
convenience does not guarantee a good representation of the targeted ethnic
groups as the rural communes of settlement of these groups are numerous.
Here, only one rural commune per ethnic group was surveyed.
3.8.2 Internal validity
The internal validity of a concept helps to verify how a question related to this
concept actually measures what it is supposed to (Cooper & Schindler, 2011).
In this context, a coherency matrix was developed to ensure that each question
efficiently addresses a concern of the research.
55
3.8.3 Reliability
The reliability of a research supposes that all the significant findings resulting
from the research must be reproducible under the same conditions of
implementation. In due time, other researchers must be able to carry out the
same experiment exactly and to produce same results. This will also allow
consolidation of the findings to ensure that the majority of the scientific
community accepts the hypothesis (Shuttleworth, 2008).
Accordingly and with regard to the methodological approach adopted for the
realisation of the study (scientific method of sampling, proven questionnaire,
data-collection realised in a professional way and treatment and data analysis
well-structured and very scientific), it can be stated without hesitation that the
research is replicable. This for scrutinizing the influence of cultural dimensions
on entrepreneurial intention among the other twelve ethnic groups living in
Madagascar’s rural areas.
56
CHAPTER 4: PRESENTATION OF THE RESULTS
The statistical analysis was processed through SPSS 21. The interpretation of
any calculated statistical indexes was based on relevant theory reviewed in the
previous chapter. The chapter begins with the presentation of the demographic
profile of respondents followed by the scale characteristics and the results
related to the testing of each hypothesis. A summary closes the chapter.
4.1 Demographic profile of respondents
4.1.1 Completeness of data
With a final sample size of 2,235 adult individuals, the response rates recorded
during the data collection are very good as their values are equal or more than:
• 100 percent per main ethnic group (Coastal group: 100 percent,
Highlander group: 101 percent, Intermediary group: 102 percent);
• 100 percent per gender (Male: 102 percent, Female: 100 percent); and
• 93 percent per level of education (Without education: 93 percent,
Primary: 103 percent, Secondary or more: 111 percent).
Note that values greater than 100 percent are because during the data
collection and the random sampling there were some areas where some
difficulty to fit completely with the quota sheet was experienced. The
interviewers were instructed to complete the questionnaires in accordance with
the information provided by respondents in a given household. Therefore, the
size of the sample, with regard to a considered demographic variable (ethnic
group, gender, level of education), exceeded the predetermined one. However,
this situation did not have any impact on the results of the research, as
demonstrated in the reliability and the validity of the studied scales.
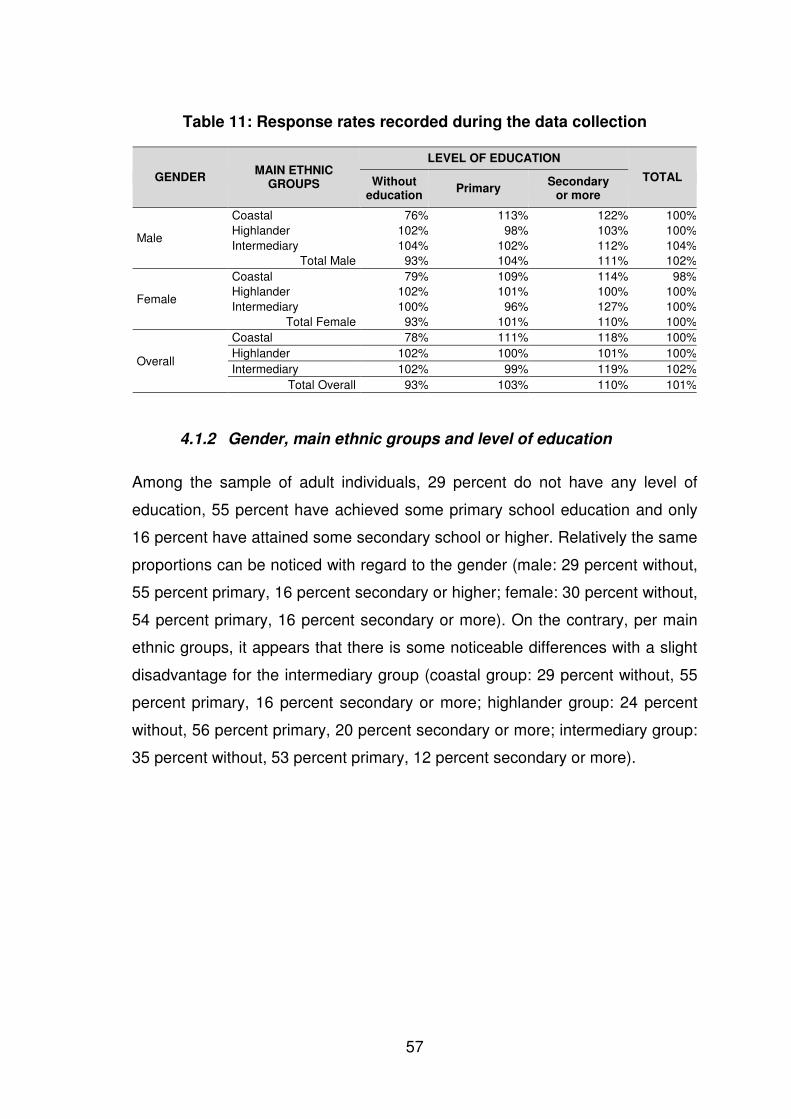
57
Table 11: Response rates recorded during the data collection
GENDER MAIN ETHNIC
GROUPS
LEVEL OF EDUCATION
TOTAL Without education
Primary Secondary
or more
Male
Coastal 76% 113% 122% 100%
Highlander 102% 98% 103% 100%
Intermediary 104% 102% 112% 104%
Total Male 93% 104% 111% 102%
Female
Coastal 79% 109% 114% 98%
Highlander 102% 101% 100% 100%
Intermediary 100% 96% 127% 100%
Total Female 93% 101% 110% 100%
Overall
Coastal 78% 111% 118% 100%
Highlander 102% 100% 101% 100%
Intermediary 102% 99% 119% 102%
Total Overall 93% 103% 110% 101%
4.1.2 Gender, main ethnic groups and level of education
Among the sample of adult individuals, 29 percent do not have any level of
education, 55 percent have achieved some primary school education and only
16 percent have attained some secondary school or higher. Relatively the same
proportions can be noticed with regard to the gender (male: 29 percent without,
55 percent primary, 16 percent secondary or higher; female: 30 percent without,
54 percent primary, 16 percent secondary or more). On the contrary, per main
ethnic groups, it appears that there is some noticeable differences with a slight
disadvantage for the intermediary group (coastal group: 29 percent without, 55
percent primary, 16 percent secondary or more; highlander group: 24 percent
without, 56 percent primary, 20 percent secondary or more; intermediary group:
35 percent without, 53 percent primary, 12 percent secondary or more).

58
Table 12: Frequency of respondents with regard to gender, main ethnic groups and level of education
GENDER MAIN ETHNIC GROUPS
LEVEL OF EDUCATION
TOTAL Sample size
(N) Without education
Primary Secondary
or more
Male
Coastal 28% 56% 16% 100% 367
Highlander 24% 56% 21% 100% 365
Intermediary 35% 53% 12% 100% 378
Total Male 29% 55% 16% 100% 1 110
Female
Coastal 30% 55% 15% 100% 369
Highlander 24% 56% 20% 100% 379
Intermediary 35% 52% 12% 100% 377
Total Female 30% 54% 16% 100% 1 125
Overall
Coastal 29% 55% 16% 100% 736
Highlander 24% 56% 20% 100% 744
Intermediary 35% 53% 12% 100% 755
Total Overall 29% 55% 16% 100% 2235
4.1.3 Gender, main ethnic groups and age
In average, the respondents are 40.3 years old. The respondents from the
intermediary group are oldest with an age mean of 41.8 (coastal group: 39.8
years old, highlander group: 39.4 years old). Apart from the case of the
highlander group, males are slightly older than females (male: 40.7 years old;
female: 40 years old).
Table 13: Age means of respondents with regard to gender and main ethnic groups
GENDER MAIN ETHNIC GROUPS
TOTAL Coastal Highlander Intermediary
Female 39.1 39.6 41.3 40.0 Male 40.5 39.2 42.3 40.7
Overall 39.8 39.4 41.8 40.3
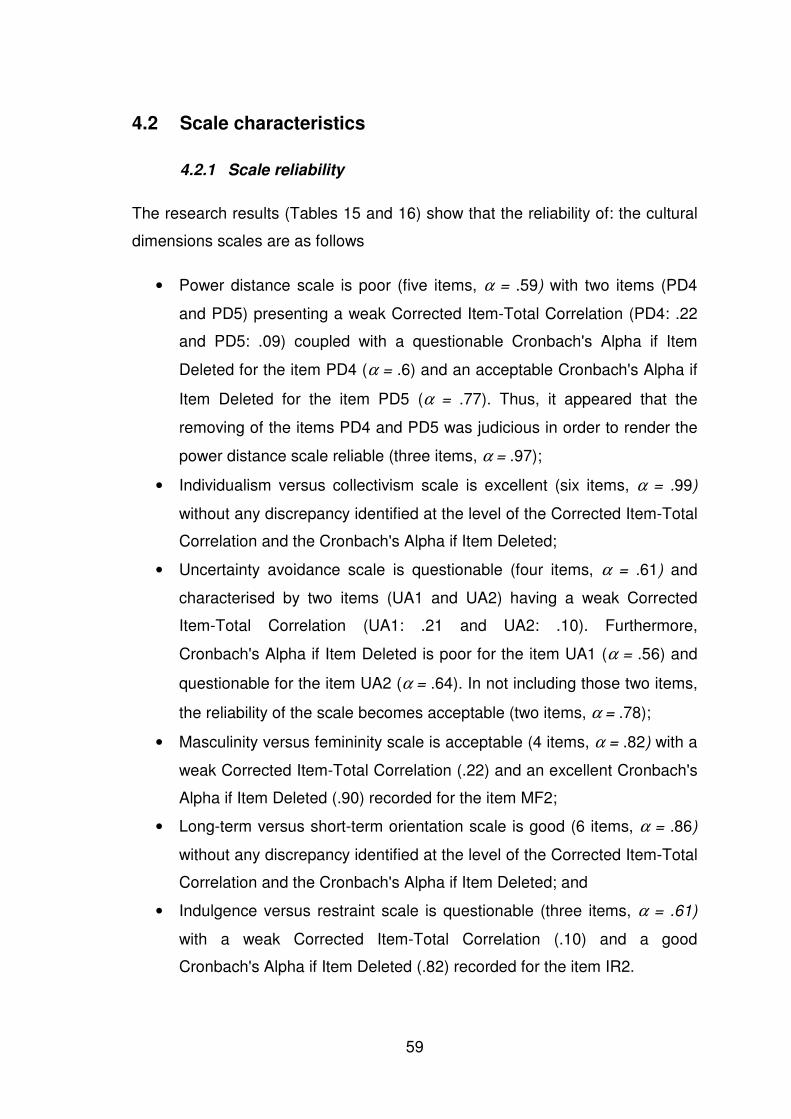
59
4.2 Scale characteristics
4.2.1 Scale reliability
The research results (Tables 15 and 16) show that the reliability of: the cultural
dimensions scales are as follows
• Power distance scale is poor (five items, α = .59) with two items (PD4
and PD5) presenting a weak Corrected Item-Total Correlation (PD4: .22
and PD5: .09) coupled with a questionable Cronbach's Alpha if Item
Deleted for the item PD4 (α = .6) and an acceptable Cronbach's Alpha if
Item Deleted for the item PD5 (α = .77). Thus, it appeared that the
removing of the items PD4 and PD5 was judicious in order to render the
power distance scale reliable (three items, α = .97);
• Individualism versus collectivism scale is excellent (six items, α = .99)
without any discrepancy identified at the level of the Corrected Item-Total
Correlation and the Cronbach's Alpha if Item Deleted;
• Uncertainty avoidance scale is questionable (four items, α = .61) and
characterised by two items (UA1 and UA2) having a weak Corrected
Item-Total Correlation (UA1: .21 and UA2: .10). Furthermore,
Cronbach's Alpha if Item Deleted is poor for the item UA1 (α = .56) and
questionable for the item UA2 (α = .64). In not including those two items,
the reliability of the scale becomes acceptable (two items, α = .78);
• Masculinity versus femininity scale is acceptable (4 items, α = .82) with a
weak Corrected Item-Total Correlation (.22) and an excellent Cronbach's
Alpha if Item Deleted (.90) recorded for the item MF2;
• Long-term versus short-term orientation scale is good (6 items, α = .86)
without any discrepancy identified at the level of the Corrected Item-Total
Correlation and the Cronbach's Alpha if Item Deleted; and
• Indulgence versus restraint scale is questionable (three items, α = .61)
with a weak Corrected Item-Total Correlation (.10) and a good
Cronbach's Alpha if Item Deleted (.82) recorded for the item IR2.
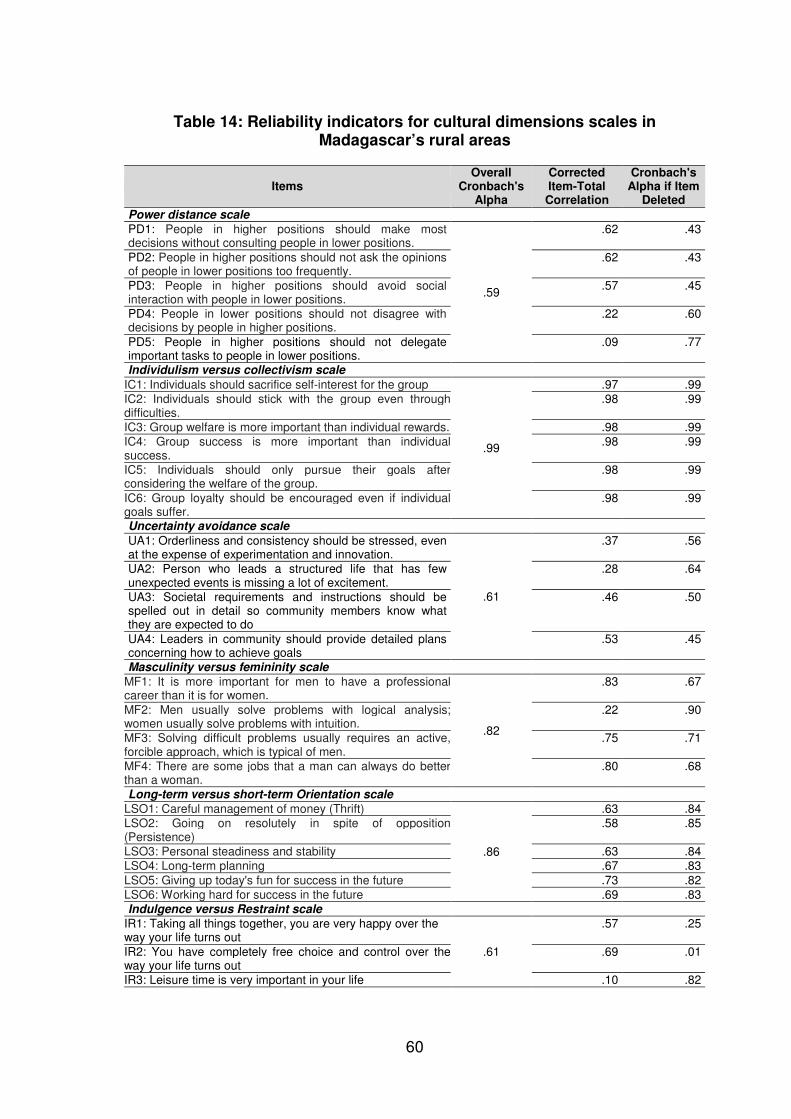
60
Table 14: Reliability indicators for cultural dimensions scales in Madagascar’s rural areas
Items Overall
Cronbach's Alpha
Corrected Item-Total Correlation
Cronbach's Alpha if Item
Deleted
Power distance scale
PD1: People in higher positions should make most decisions without consulting people in lower positions.
.59
.62 .43
PD2: People in higher positions should not ask the opinions of people in lower positions too frequently.
.62 .43
PD3: People in higher positions should avoid social interaction with people in lower positions.
.57 .45
PD4: People in lower positions should not disagree with decisions by people in higher positions.
.22 .60
PD5: People in higher positions should not delegate important tasks to people in lower positions.
.09 .77
Individulism versus collectivism scale
IC1: Individuals should sacrifice self-interest for the group
.99
.97 .99
IC2: Individuals should stick with the group even through difficulties.
.98 .99
IC3: Group welfare is more important than individual rewards. .98 .99
IC4: Group success is more important than individual success.
.98 .99
IC5: Individuals should only pursue their goals after considering the welfare of the group.
.98 .99
IC6: Group loyalty should be encouraged even if individual goals suffer.
.98 .99
Uncertainty avoidance scale
UA1: Orderliness and consistency should be stressed, even at the expense of experimentation and innovation.
.61
.37 .56
UA2: Person who leads a structured life that has few unexpected events is missing a lot of excitement.
.28 .64
UA3: Societal requirements and instructions should be spelled out in detail so community members know what they are expected to do
.46 .50
UA4: Leaders in community should provide detailed plans concerning how to achieve goals
.53 .45
Masculinity versus femininity scale
MF1: It is more important for men to have a professional career than it is for women.
.82
.83 .67
MF2: Men usually solve problems with logical analysis; women usually solve problems with intuition.
.22 .90
MF3: Solving difficult problems usually requires an active, forcible approach, which is typical of men.
.75 .71
MF4: There are some jobs that a man can always do better than a woman.
.80 .68
Long-term versus short-term Orientation scale
LSO1: Careful management of money (Thrift)
.86
.63 .84
LSO2: Going on resolutely in spite of opposition (Persistence)
.58 .85
LSO3: Personal steadiness and stability .63 .84
LSO4: Long-term planning .67 .83
LSO5: Giving up today's fun for success in the future .73 .82
LSO6: Working hard for success in the future .69 .83
Indulgence versus Restraint scale
IR1: Taking all things together, you are very happy over the way your life turns out
.61
.57 .25
IR2: You have completely free choice and control over the way your life turns out
.69 .01
IR3: Leisure time is very important in your life .10 .82
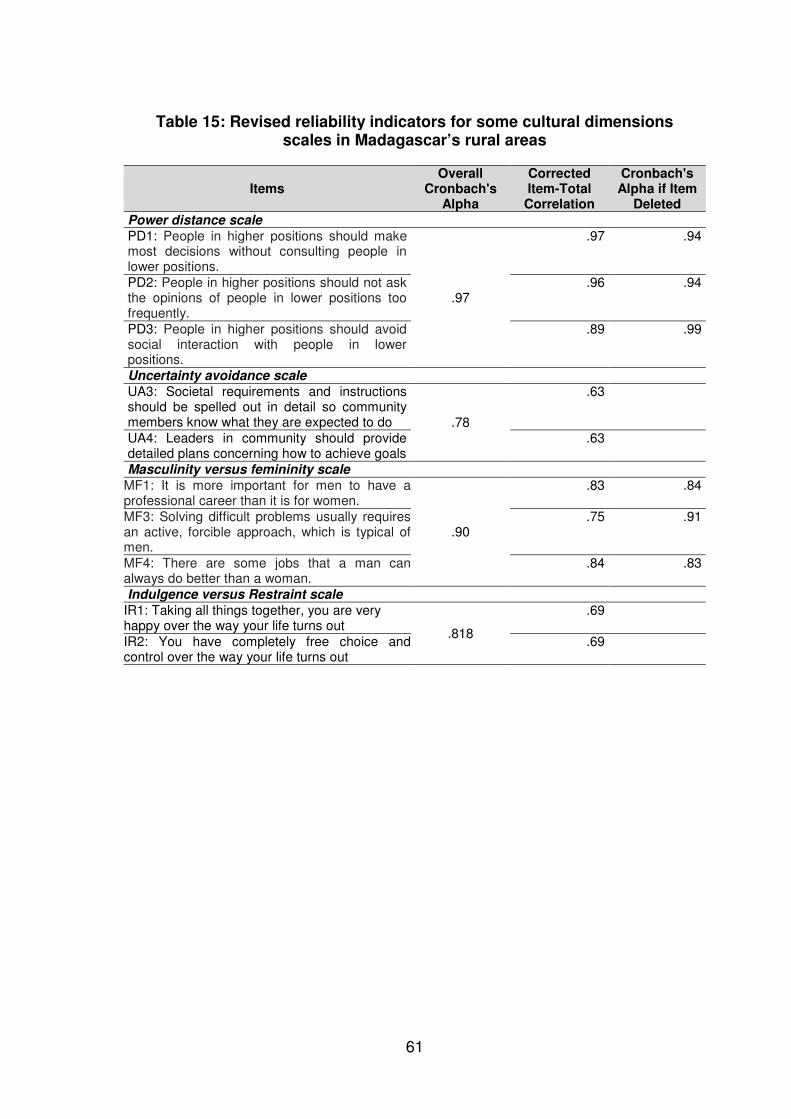
61
Table 15: Revised reliability indicators for some cultural dimensions scales in Madagascar’s rural areas
Items Overall
Cronbach's Alpha
Corrected Item-Total Correlation
Cronbach's Alpha if Item
Deleted Power distance scale
PD1: People in higher positions should make most decisions without consulting people in lower positions.
.97
.97 .94
PD2: People in higher positions should not ask the opinions of people in lower positions too frequently.
.96 .94
PD3: People in higher positions should avoid social interaction with people in lower positions.
.89 .99
Uncertainty avoidance scale
UA3: Societal requirements and instructions should be spelled out in detail so community members know what they are expected to do .78
.63
UA4: Leaders in community should provide detailed plans concerning how to achieve goals
.63
Masculinity versus femininity scale
MF1: It is more important for men to have a professional career than it is for women.
.90
.83 .84
MF3: Solving difficult problems usually requires an active, forcible approach, which is typical of men.
.75 .91
MF4: There are some jobs that a man can always do better than a woman.
.84 .83
Indulgence versus Restraint scale
IR1: Taking all things together, you are very happy over the way your life turns out
.818
.69
IR2: You have completely free choice and control over the way your life turns out
.69
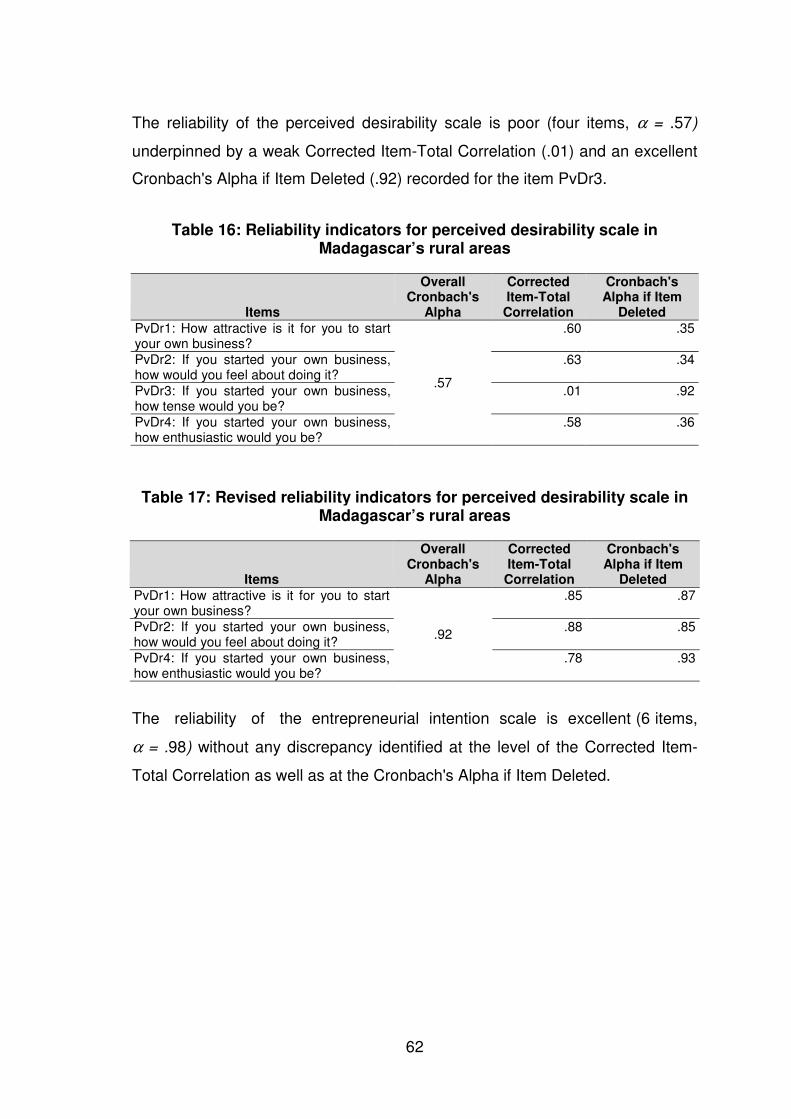
62
The reliability of the perceived desirability scale is poor (four items, α = .57)
underpinned by a weak Corrected Item-Total Correlation (.01) and an excellent
Cronbach's Alpha if Item Deleted (.92) recorded for the item PvDr3.
Table 16: Reliability indicators for perceived desirability scale in Madagascar’s rural areas
Items
Overall Cronbach's
Alpha
Corrected Item-Total Correlation
Cronbach's Alpha if Item
Deleted PvDr1: How attractive is it for you to start your own business?
.57
.60 .35
PvDr2: If you started your own business, how would you feel about doing it?
.63 .34
PvDr3: If you started your own business, how tense would you be?
.01 .92
PvDr4: If you started your own business, how enthusiastic would you be?
.58 .36
Table 17: Revised reliability indicators for perceived desirability scale in Madagascar’s rural areas
Items
Overall Cronbach's
Alpha
Corrected Item-Total Correlation
Cronbach's Alpha if Item
Deleted PvDr1: How attractive is it for you to start your own business?
.92
.85 .87
PvDr2: If you started your own business, how would you feel about doing it?
.88 .85
PvDr4: If you started your own business, how enthusiastic would you be?
.78 .93
The reliability of the entrepreneurial intention scale is excellent (6 items,
α = .98) without any discrepancy identified at the level of the Corrected Item-
Total Correlation as well as at the Cronbach's Alpha if Item Deleted.
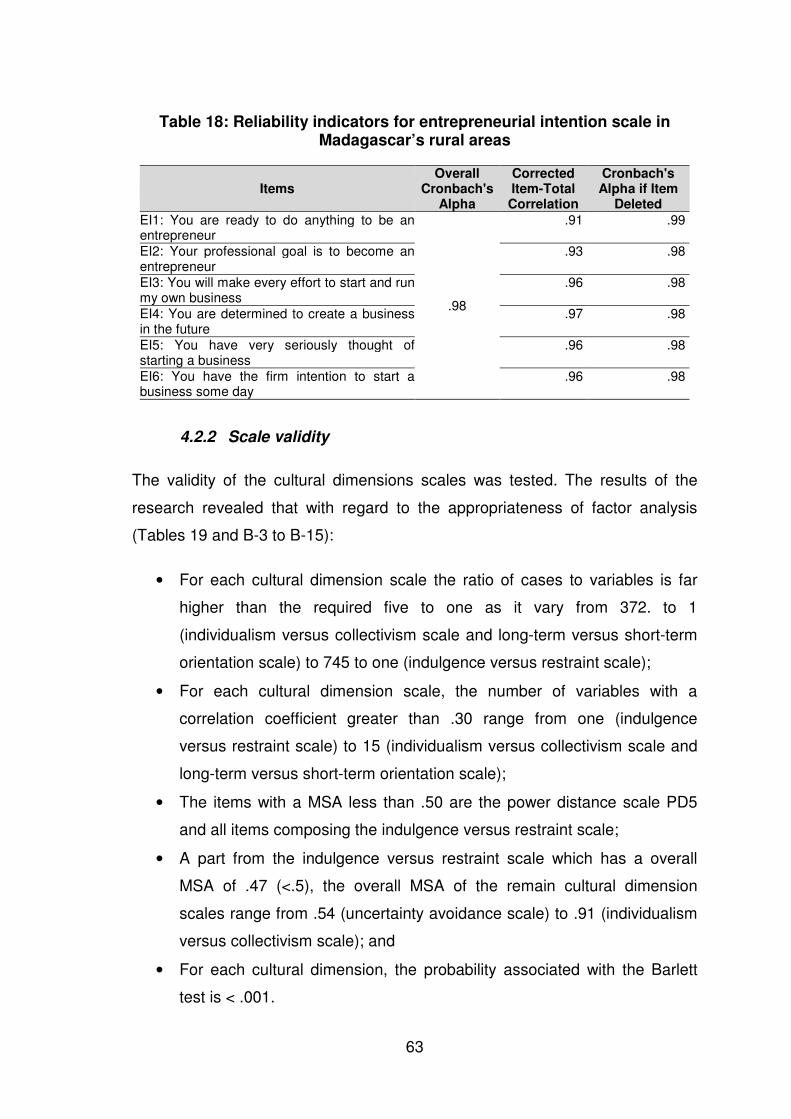
63
Table 18: Reliability indicators for entrepreneurial intention scale in Madagascar’s rural areas
Items Overall
Cronbach's Alpha
Corrected Item-Total Correlation
Cronbach's Alpha if Item
Deleted EI1: You are ready to do anything to be an entrepreneur
.98
.91 .99
EI2: Your professional goal is to become an entrepreneur
.93 .98
EI3: You will make every effort to start and run my own business
.96 .98
EI4: You are determined to create a business in the future
.97 .98
EI5: You have very seriously thought of starting a business
.96 .98
EI6: You have the firm intention to start a business some day
.96 .98
4.2.2 Scale validity
The validity of the cultural dimensions scales was tested. The results of the
research revealed that with regard to the appropriateness of factor analysis
(Tables 19 and B-3 to B-15):
• For each cultural dimension scale the ratio of cases to variables is far
higher than the required five to one as it vary from 372. to 1
(individualism versus collectivism scale and long-term versus short-term
orientation scale) to 745 to one (indulgence versus restraint scale);
• For each cultural dimension scale, the number of variables with a
correlation coefficient greater than .30 range from one (indulgence
versus restraint scale) to 15 (individualism versus collectivism scale and
long-term versus short-term orientation scale);
• The items with a MSA less than .50 are the power distance scale PD5
and all items composing the indulgence versus restraint scale;
• A part from the indulgence versus restraint scale which has a overall
MSA of .47 (<.5), the overall MSA of the remain cultural dimension
scales range from .54 (uncertainty avoidance scale) to .91 (individualism
versus collectivism scale); and
• For each cultural dimension, the probability associated with the Barlett
test is < .001.
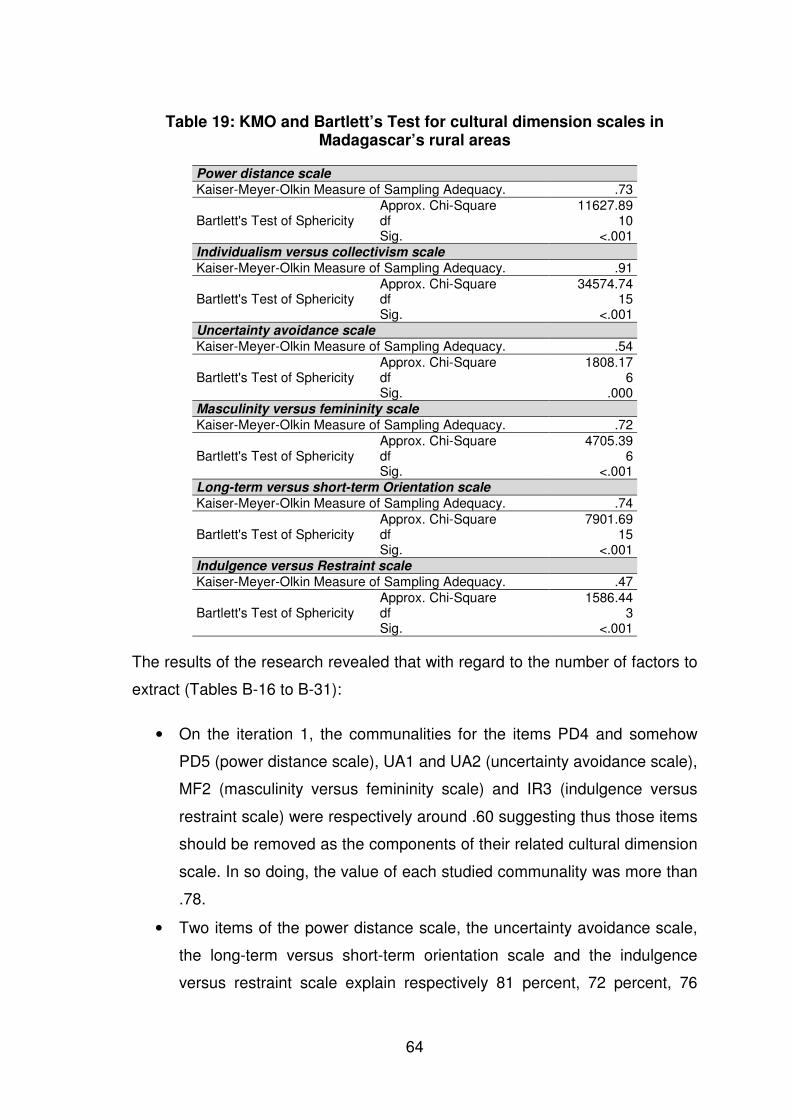
64
Table 19: KMO and Bartlett’s Test for cultural dimension scales in Madagascar’s rural areas
Power distance scale
Kaiser-Meyer-Olkin Measure of Sampling Adequacy. .73
Bartlett's Test of Sphericity Approx. Chi-Square 11627.89 df 10 Sig. <.001
Individualism versus collectivism scale
Kaiser-Meyer-Olkin Measure of Sampling Adequacy. .91
Bartlett's Test of Sphericity Approx. Chi-Square 34574.74 df 15 Sig. <.001
Uncertainty avoidance scale
Kaiser-Meyer-Olkin Measure of Sampling Adequacy. .54
Bartlett's Test of Sphericity Approx. Chi-Square 1808.17 df 6 Sig. .000
Masculinity versus femininity scale
Kaiser-Meyer-Olkin Measure of Sampling Adequacy. .72
Bartlett's Test of Sphericity Approx. Chi-Square 4705.39 df 6 Sig. <.001
Long-term versus short-term Orientation scale
Kaiser-Meyer-Olkin Measure of Sampling Adequacy. .74
Bartlett's Test of Sphericity Approx. Chi-Square 7901.69 df 15 Sig. <.001
Indulgence versus Restraint scale
Kaiser-Meyer-Olkin Measure of Sampling Adequacy. .47
Bartlett's Test of Sphericity Approx. Chi-Square 1586.44 df 3 Sig. <.001
The results of the research revealed that with regard to the number of factors to
extract (Tables B-16 to B-31):
• On the iteration 1, the communalities for the items PD4 and somehow
PD5 (power distance scale), UA1 and UA2 (uncertainty avoidance scale),
MF2 (masculinity versus femininity scale) and IR3 (indulgence versus
restraint scale) were respectively around .60 suggesting thus those items
should be removed as the components of their related cultural dimension
scale. In so doing, the value of each studied communality was more than
.78.
• Two items of the power distance scale, the uncertainty avoidance scale,
the long-term versus short-term orientation scale and the indulgence
versus restraint scale explain respectively 81 percent, 72 percent, 76
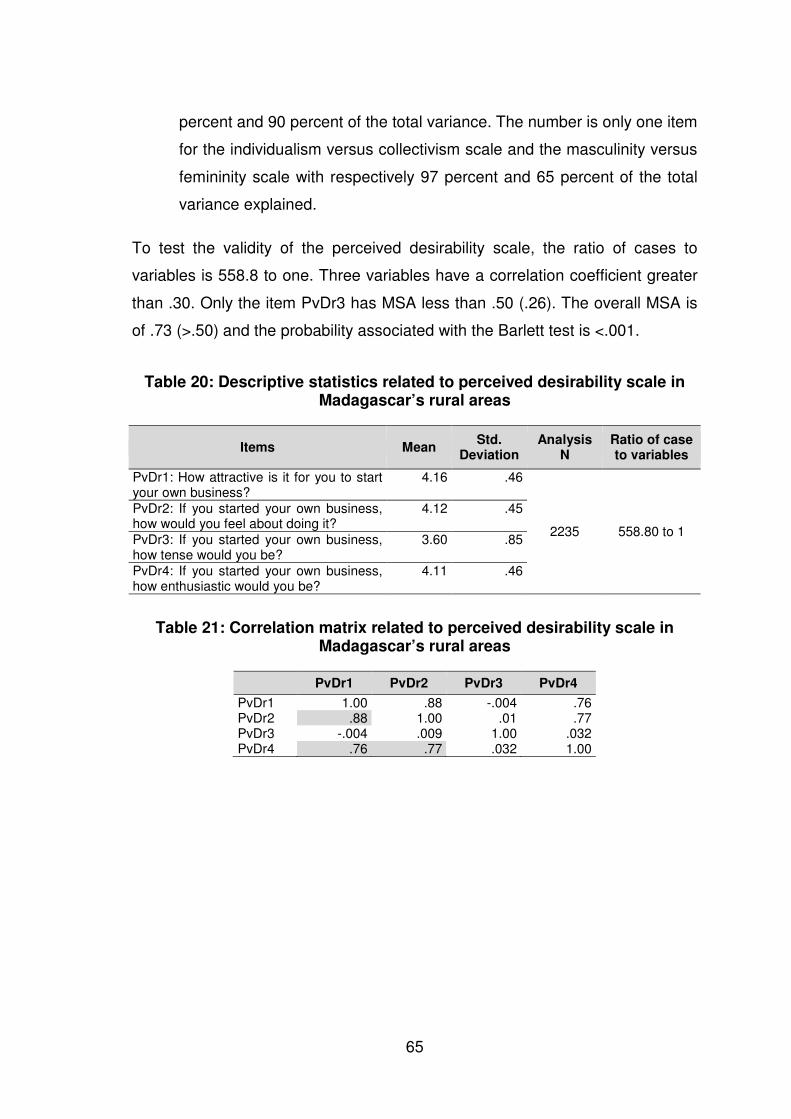
65
percent and 90 percent of the total variance. The number is only one item
for the individualism versus collectivism scale and the masculinity versus
femininity scale with respectively 97 percent and 65 percent of the total
variance explained.
To test the validity of the perceived desirability scale, the ratio of cases to
variables is 558.8 to one. Three variables have a correlation coefficient greater
than .30. Only the item PvDr3 has MSA less than .50 (.26). The overall MSA is
of .73 (>.50) and the probability associated with the Barlett test is <.001.
Table 20: Descriptive statistics related to perceived desirability scale in Madagascar’s rural areas
Items Mean Std.
Deviation Analysis
N Ratio of case to variables
PvDr1: How attractive is it for you to start your own business?
4.16 .46
2235 558.80 to 1
PvDr2: If you started your own business, how would you feel about doing it?
4.12 .45
PvDr3: If you started your own business, how tense would you be?
3.60 .85
PvDr4: If you started your own business, how enthusiastic would you be?
4.11 .46
Table 21: Correlation matrix related to perceived desirability scale in Madagascar’s rural areas
PvDr1 PvDr2 PvDr3 PvDr4
PvDr1 1.00 .88 -.004 .76 PvDr2 .88 1.00 .01 .77 PvDr3 -.004 .009 1.00 .032 PvDr4 .76 .77 .032 1.00

66
Table 22: Anti-image correlation matrix related to perceived desirability scale in Madagascar’s rural areas
PvDr1 PvDr2 PvDr3 PvDr4
PvDr1 .70a -.71 .03 -.20
PvDr2 -.71 .67a -.01 -.39
PvDr3 .03 -.01 .26a -.05
PvDr4 -.20 -.39 -.05 .86a
a. Measures of Sampling Adequacy(MSA)
Table 23: KMO and Bartlett’s Test for perceived desirability scale in Madagascar’s rural areas
Test Score
Kaiser-Meyer-Olkin Measure of Sampling Adequacy. .73
Bartlett's Test of Sphericity Approx. Chi-Square 5349.38 df 6 Sig. <.001
In addition, on the iteration one, all item communalities are more than .60 and
one item explains 65 percent of the total variance.
Table 24: Communalities of perceived desirability scale in Madagascar’s rural areas
Items Extraction
PvDr1: How attractive is it for you to start your own business? .88 PvDr2: If you started your own business, how would you feel about doing it?
.91
PvDr3: If you started your own business, how tense would you be? 1.00 PvDr4: If you started your own business, how enthusiastic would you be?
.80
Table 25: Total Variance Explained for perceived desirability scale in Madagascar’s rural areas
Component
Initial Eigenvalues
Total % of
Variance Cumulative
%
1 2.59 65 65 2 1.00 25 90 3 .29 7 97 4 .12 3 100
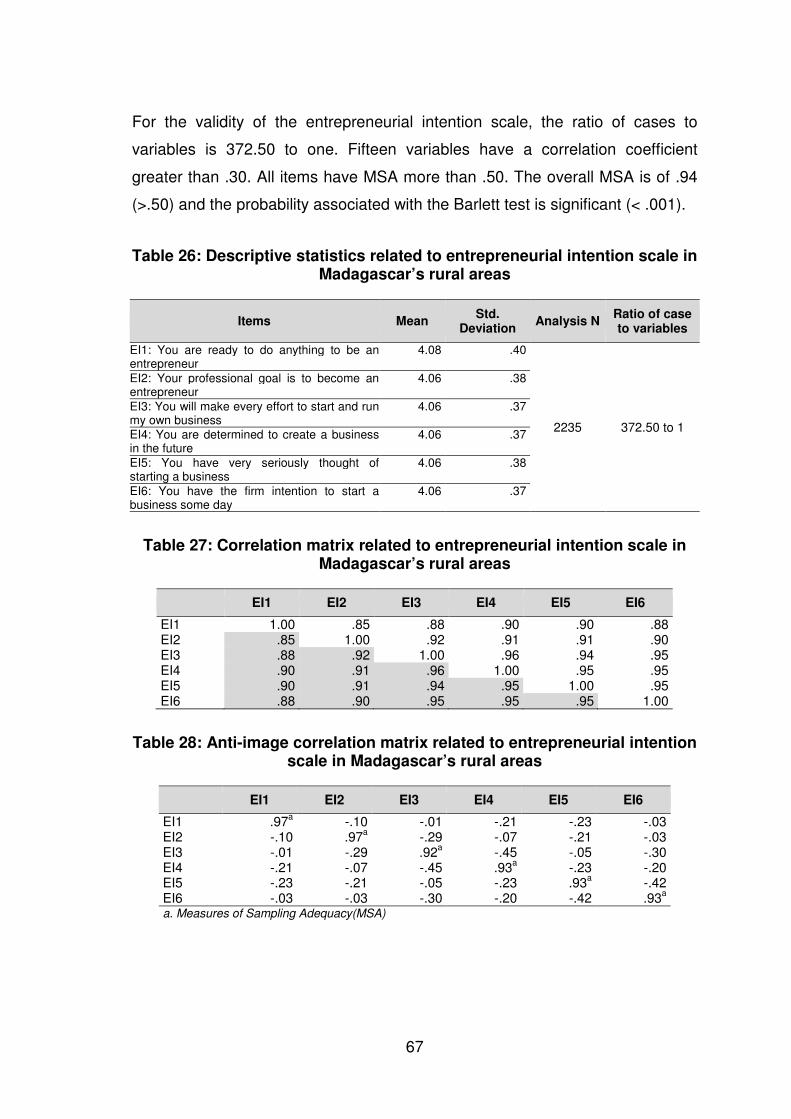
67
For the validity of the entrepreneurial intention scale, the ratio of cases to
variables is 372.50 to one. Fifteen variables have a correlation coefficient
greater than .30. All items have MSA more than .50. The overall MSA is of .94
(>.50) and the probability associated with the Barlett test is significant (< .001).
Table 26: Descriptive statistics related to entrepreneurial intention scale in Madagascar’s rural areas
Items Mean Std.
Deviation Analysis N
Ratio of case to variables
EI1: You are ready to do anything to be an entrepreneur
4.08 .40
2235 372.50 to 1
EI2: Your professional goal is to become an entrepreneur
4.06 .38
EI3: You will make every effort to start and run my own business
4.06 .37
EI4: You are determined to create a business in the future
4.06 .37
EI5: You have very seriously thought of starting a business
4.06 .38
EI6: You have the firm intention to start a business some day
4.06 .37
Table 27: Correlation matrix related to entrepreneurial intention scale in Madagascar’s rural areas
EI1 EI2 EI3 EI4 EI5 EI6
EI1 1.00 .85 .88 .90 .90 .88 EI2 .85 1.00 .92 .91 .91 .90 EI3 .88 .92 1.00 .96 .94 .95 EI4 .90 .91 .96 1.00 .95 .95 EI5 .90 .91 .94 .95 1.00 .95 EI6 .88 .90 .95 .95 .95 1.00
Table 28: Anti-image correlation matrix related to entrepreneurial intention scale in Madagascar’s rural areas
EI1 EI2 EI3 EI4 EI5 EI6
EI1 .97a -.10 -.01 -.21 -.23 -.03
EI2 -.10 .97a -.29 -.07 -.21 -.03
EI3 -.01 -.29 .92a -.45 -.05 -.30
EI4 -.21 -.07 -.45 .93a -.23 -.20
EI5 -.23 -.21 -.05 -.23 .93a -.42
EI6 -.03 -.03 -.30 -.20 -.42 .93a
a. Measures of Sampling Adequacy(MSA)

68
Table 29: KMO and Bartlett’s Test for entrepreneurial intention scale in Madagascar’s rural areas
Test Score
Kaiser-Meyer-Olkin Measure of Sampling Adequacy. .94
Bartlett's Test of Sphericity Approx. Chi-Square 25222.96 df 15 Sig. <.001
Finally, on the iteration one, all item communalities are more than .60 and one
item explains 93 percent of the total variance.
Table 30: Communalities of entrepreneurial intention scale in Madagascar’s rural areas
Items Extraction
EI1: You are ready to do anything to be an entrepreneur .87 EI2: Your professional goal is to become an entrepreneur .90 EI3: You will make every effort to start and run my own business .95 EI4: You are determined to create a business in the future .96 EI5: You have very seriously thought of starting a business .95 EI6: You have the firm intention to start a business some day .95
Table 31: Total Variance Explained for entrepreneurial intention scale in Madagascar’s rural areas
Component Initial Eigenvalues Extraction Sums of Squared Loadings
Total % of Variance Cumulative % Total % of Variance Cumulative %
1 5.58 93 93 5.58 93 93 2 .16 2 95 3 .12 2 97 4 .07 1 98 5 .05 1 99 6 .04 1 100
Based on these results on the reliability and the validity of scales, it could be
adopted that within the framework of the research, the item composition of each
scale is detailed as follows:
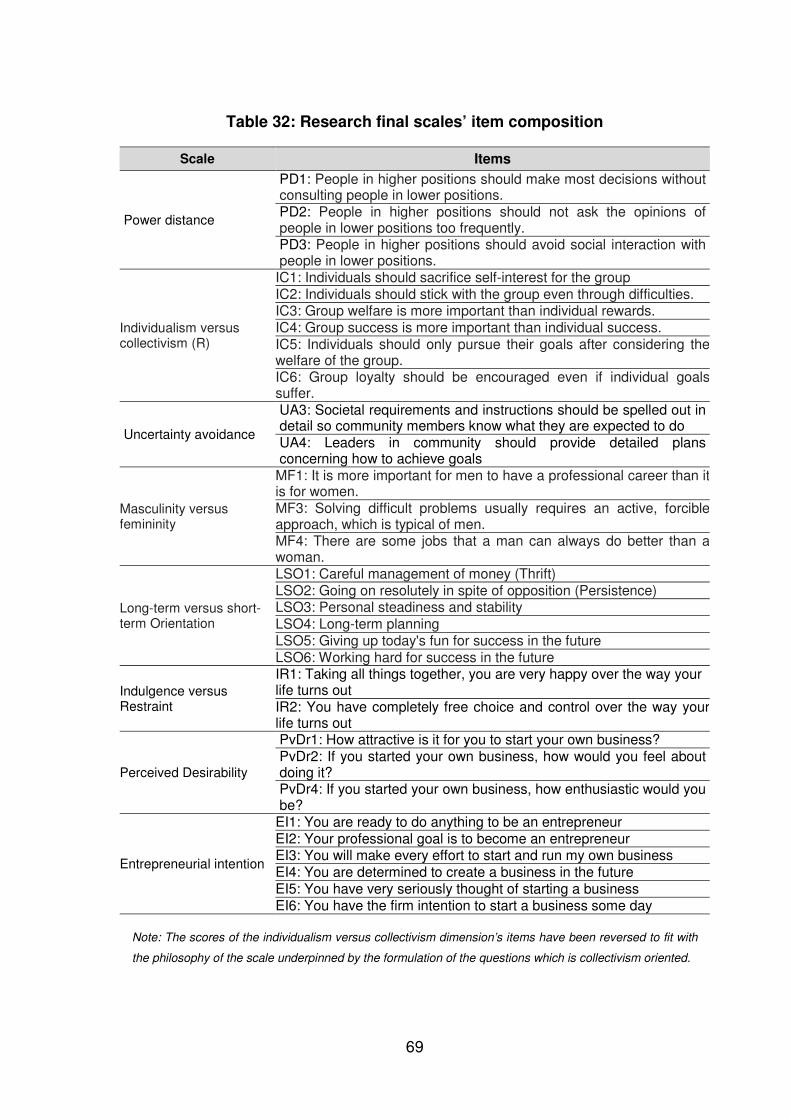
69
Table 32: Research final scales’ item composition
Scale Items
Power distance
PD1: People in higher positions should make most decisions without consulting people in lower positions. PD2: People in higher positions should not ask the opinions of people in lower positions too frequently. PD3: People in higher positions should avoid social interaction with people in lower positions.
Individualism versus collectivism (R)
IC1: Individuals should sacrifice self-interest for the group IC2: Individuals should stick with the group even through difficulties. IC3: Group welfare is more important than individual rewards. IC4: Group success is more important than individual success. IC5: Individuals should only pursue their goals after considering the welfare of the group. IC6: Group loyalty should be encouraged even if individual goals suffer.
Uncertainty avoidance
UA3: Societal requirements and instructions should be spelled out in detail so community members know what they are expected to do UA4: Leaders in community should provide detailed plans concerning how to achieve goals
Masculinity versus femininity
MF1: It is more important for men to have a professional career than it is for women. MF3: Solving difficult problems usually requires an active, forcible approach, which is typical of men. MF4: There are some jobs that a man can always do better than a woman.
Long-term versus short-term Orientation
LSO1: Careful management of money (Thrift) LSO2: Going on resolutely in spite of opposition (Persistence) LSO3: Personal steadiness and stability LSO4: Long-term planning LSO5: Giving up today's fun for success in the future LSO6: Working hard for success in the future
Indulgence versus Restraint
IR1: Taking all things together, you are very happy over the way your life turns out IR2: You have completely free choice and control over the way your life turns out
Perceived Desirability
PvDr1: How attractive is it for you to start your own business? PvDr2: If you started your own business, how would you feel about doing it? PvDr4: If you started your own business, how enthusiastic would you be?
Entrepreneurial intention
EI1: You are ready to do anything to be an entrepreneur EI2: Your professional goal is to become an entrepreneur EI3: You will make every effort to start and run my own business EI4: You are determined to create a business in the future EI5: You have very seriously thought of starting a business EI6: You have the firm intention to start a business some day
Note: The scores of the individualism versus collectivism dimension’s items have been reversed to fit with
the philosophy of the scale underpinned by the formulation of the questions which is collectivism oriented.
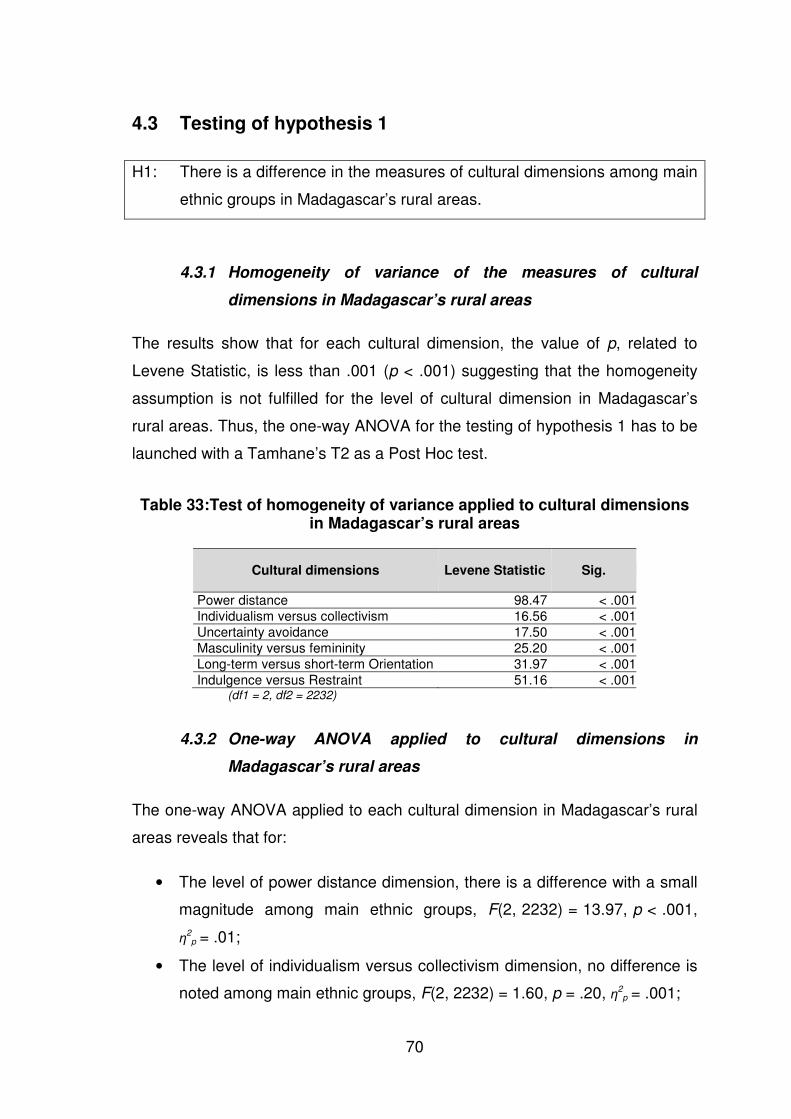
70
4.3 Testing of hypothesis 1
H1: There is a difference in the measures of cultural dimensions among main
ethnic groups in Madagascar’s rural areas.
4.3.1 Homogeneity of variance of the measures of cultural
dimensions in Madagascar’s rural areas
The results show that for each cultural dimension, the value of p, related to
Levene Statistic, is less than .001 (p < .001) suggesting that the homogeneity
assumption is not fulfilled for the level of cultural dimension in Madagascar’s
rural areas. Thus, the one-way ANOVA for the testing of hypothesis 1 has to be
launched with a Tamhane’s T2 as a Post Hoc test.
Table 33:Test of homogeneity of variance applied to cultural dimensions in Madagascar’s rural areas
Cultural dimensions Levene Statistic Sig.
Power distance 98.47 < .001
Individualism versus collectivism 16.56 < .001
Uncertainty avoidance 17.50 < .001
Masculinity versus femininity 25.20 < .001
Long-term versus short-term Orientation 31.97 < .001
Indulgence versus Restraint 51.16 < .001(df1 = 2, df2 = 2232)
4.3.2 One-way ANOVA applied to cultural dimensions in
Madagascar’s rural areas
The one-way ANOVA applied to each cultural dimension in Madagascar’s rural
areas reveals that for:
• The level of power distance dimension, there is a difference with a small
magnitude among main ethnic groups, F(2, 2232) = 13.97, p < .001,
η2p = .01;
• The level of individualism versus collectivism dimension, no difference is
noted among main ethnic groups, F(2, 2232) = 1.60, p = .20, η2p = .001;

71
• The level of uncertainty avoidance dimension, there is no difference
among main ethnic groups, F(2, 2232) = 1.57, p = .21, η2p = .001;
• The level of masculinity versus femininity dimension, a small
effect size underpinned the difference among main ethnic groups,
F(2, 2232) = 10.25, p < .001, η2p = .01;
• The level of long-term versus short-term orientation dimension, with a
small magnitude, a difference exists among main ethnic groups,
F(2, 2232) = 17.01, p < .001, η2p = .02; and
• The level of indulgence versus restraint dimension, there is a noticeable
difference among main ethnic groups, F(2, 2232) = 308.66, p < .001,
η2p = .22.
Table 34: One way ANOVA applied to cultural dimensions in Madagascar’s rural areas
Source df Mean Square F Sig. Partial Eta Squared
H1a: There is a difference in the measure of power distance among main ethnic groups in Madagascar’s rural areas.
ETHNIC GROUP 2 3.22 13.97 <.001 .01 Error 2232 .23
H1b: There is a difference in the measure of individualism versus collectivism among main ethnic groups in Madagascar’s rural areas.
ETHNIC GROUP 2 .36 1.60 .20 .001 Error 2232 .23
H1c: There is a difference in the measure of uncertainty avoidance among main ethnic groups in Madagascar’s rural areas.
ETHNIC GROUP 2 .17 1.57 .21 .001 Error 2232 .11
H1d: There is a difference in the measure of masculinity versus femininity among main ethnic groups in Madagascar’s rural areas.
ETHNIC GROUP 2 7.56 10.25 <.001 .01 Error 2232 .74
H1e: There is a difference in the measure of long-term versus short-term orientation among main ethnic groups in Madagascar’s rural areas.
ETHNIC GROUP 2 1.26 17.01 <.001 .02 Error 2232 .073
H1f: There is a difference in the measure of indulgence versus restraint among main ethnic groups in Madagascar’s rural areas.
ETHNIC GROUP 2 231.17 308.66 <.001 .22 Error 2232 .75
Post hoc tests using Tamhane’s T2 applied to each cultural dimension in
Madagascar’s rural areas, when relevant, indicates that for:
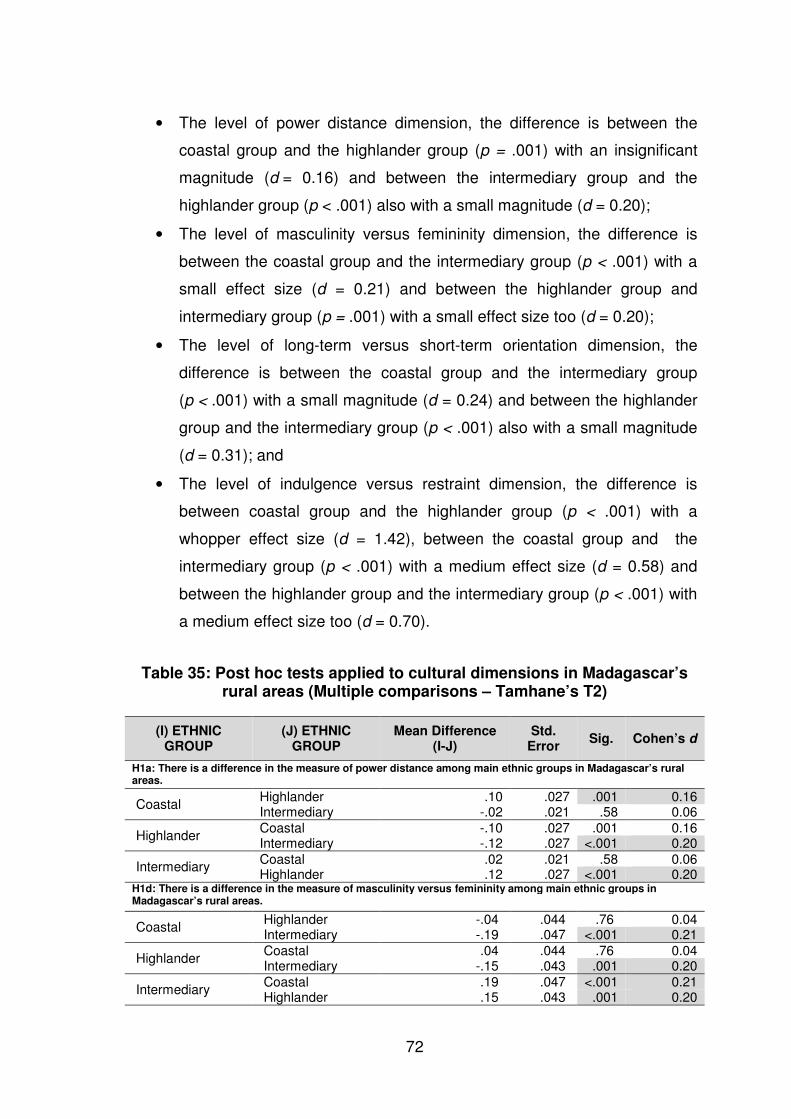
72
• The level of power distance dimension, the difference is between the
coastal group and the highlander group (p = .001) with an insignificant
magnitude (d = 0.16) and between the intermediary group and the
highlander group (p < .001) also with a small magnitude (d = 0.20);
• The level of masculinity versus femininity dimension, the difference is
between the coastal group and the intermediary group (p < .001) with a
small effect size (d = 0.21) and between the highlander group and
intermediary group (p = .001) with a small effect size too (d = 0.20);
• The level of long-term versus short-term orientation dimension, the
difference is between the coastal group and the intermediary group
(p < .001) with a small magnitude (d = 0.24) and between the highlander
group and the intermediary group (p < .001) also with a small magnitude
(d = 0.31); and
• The level of indulgence versus restraint dimension, the difference is
between coastal group and the highlander group (p < .001) with a
whopper effect size (d = 1.42), between the coastal group and the
intermediary group (p < .001) with a medium effect size (d = 0.58) and
between the highlander group and the intermediary group (p < .001) with
a medium effect size too (d = 0.70).
Table 35: Post hoc tests applied to cultural dimensions in Madagascar’s rural areas (Multiple comparisons – Tamhane’s T2)
(I) ETHNIC GROUP
(J) ETHNIC GROUP
Mean Difference (I-J)
Std. Error
Sig. Cohen’s d
H1a: There is a difference in the measure of power distance among main ethnic groups in Madagascar’s rural areas.
Coastal Highlander .10 .027 .001 0.16 Intermediary -.02 .021 .58 0.06
Highlander Coastal -.10 .027 .001 0.16 Intermediary -.12 .027 <.001 0.20
Intermediary Coastal .02 .021 .58 0.06 Highlander .12 .027 <.001 0.20
H1d: There is a difference in the measure of masculinity versus femininity among main ethnic groups in Madagascar’s rural areas.
Coastal Highlander -.04 .044 .76 0.04 Intermediary -.19 .047 <.001 0.21
Highlander Coastal .04 .044 .76 0.04 Intermediary -.15 .043 .001 0.20
Intermediary Coastal .19 .047 <.001 0.21 Highlander .15 .043 .001 0.20
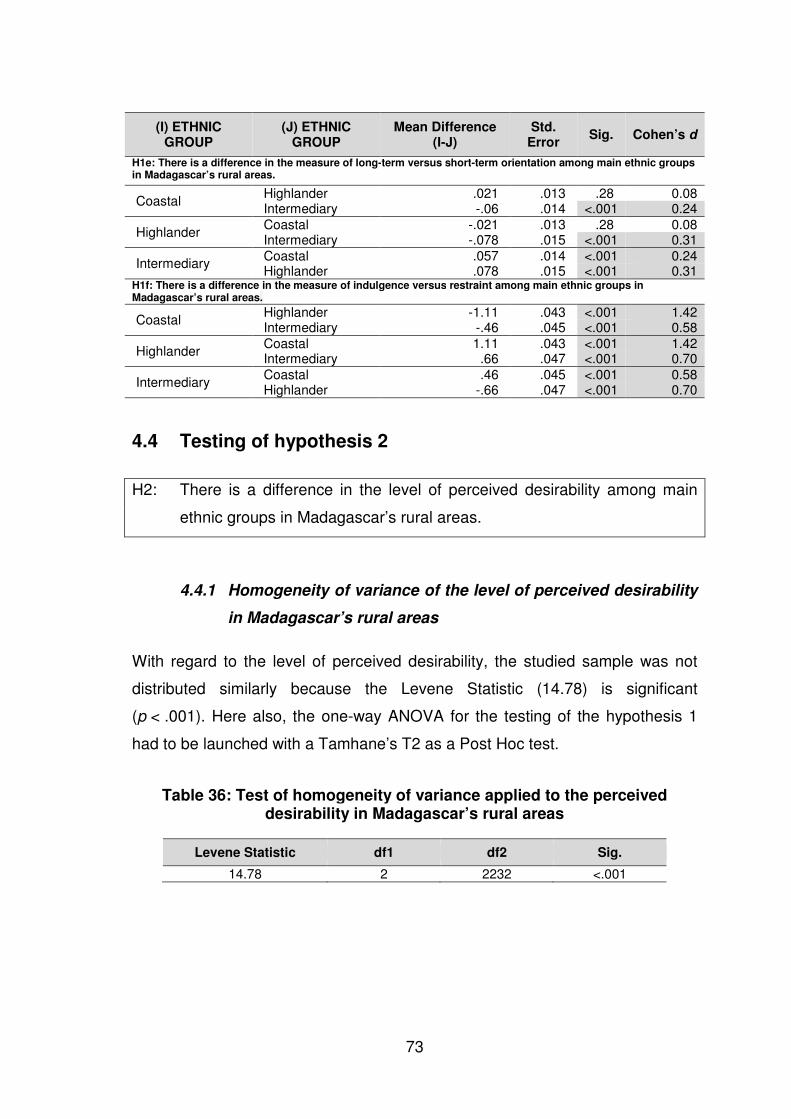
73
(I) ETHNIC GROUP
(J) ETHNIC GROUP
Mean Difference (I-J)
Std. Error
Sig. Cohen’s d
H1e: There is a difference in the measure of long-term versus short-term orientation among main ethnic groups in Madagascar’s rural areas.
Coastal Highlander .021 .013 .28 0.08 Intermediary -.06 .014 <.001 0.24
Highlander Coastal -.021 .013 .28 0.08 Intermediary -.078 .015 <.001 0.31
Intermediary Coastal .057 .014 <.001 0.24 Highlander .078 .015 <.001 0.31
H1f: There is a difference in the measure of indulgence versus restraint among main ethnic groups in Madagascar’s rural areas.
Coastal Highlander -1.11 .043 <.001 1.42 Intermediary -.46 .045 <.001 0.58
Highlander Coastal 1.11 .043 <.001 1.42 Intermediary .66 .047 <.001 0.70
Intermediary Coastal .46 .045 <.001 0.58 Highlander -.66 .047 <.001 0.70
4.4 Testing of hypothesis 2
H2: There is a difference in the level of perceived desirability among main
ethnic groups in Madagascar’s rural areas.
4.4.1 Homogeneity of variance of the level of perceived desirability
in Madagascar’s rural areas
With regard to the level of perceived desirability, the studied sample was not
distributed similarly because the Levene Statistic (14.78) is significant
(p < .001). Here also, the one-way ANOVA for the testing of the hypothesis 1
had to be launched with a Tamhane’s T2 as a Post Hoc test.
Table 36: Test of homogeneity of variance applied to the perceived desirability in Madagascar’s rural areas
Levene Statistic df1 df2 Sig.
14.78 2 2232 <.001
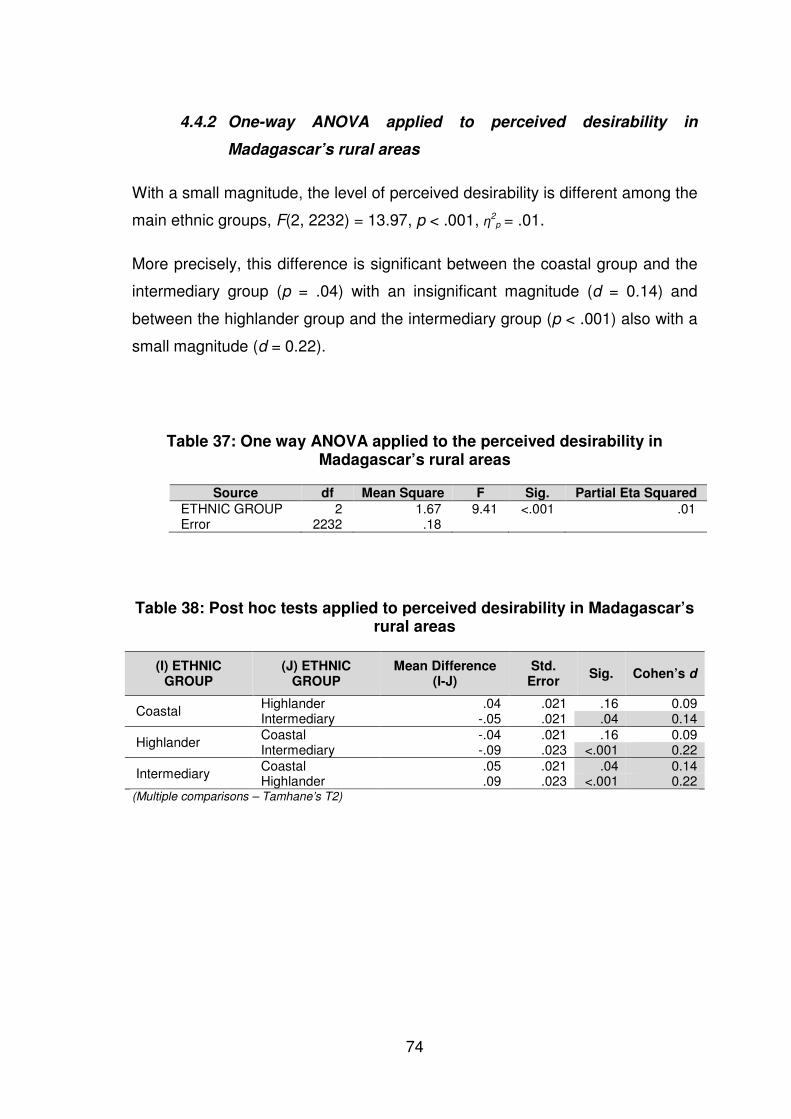
74
4.4.2 One-way ANOVA applied to perceived desirability in
Madagascar’s rural areas
With a small magnitude, the level of perceived desirability is different among the
main ethnic groups, F(2, 2232) = 13.97, p < .001, η2p = .01.
More precisely, this difference is significant between the coastal group and the
intermediary group (p = .04) with an insignificant magnitude (d = 0.14) and
between the highlander group and the intermediary group (p < .001) also with a
small magnitude (d = 0.22).
Table 37: One way ANOVA applied to the perceived desirability in Madagascar’s rural areas
Source df Mean Square F Sig. Partial Eta Squared ETHNIC GROUP 2 1.67 9.41 <.001 .01 Error 2232 .18
Table 38: Post hoc tests applied to perceived desirability in Madagascar’s rural areas
(I) ETHNIC GROUP
(J) ETHNIC GROUP
Mean Difference (I-J)
Std. Error
Sig. Cohen’s d
Coastal Highlander .04 .021 .16 0.09 Intermediary -.05 .021 .04 0.14
Highlander Coastal -.04 .021 .16 0.09 Intermediary -.09 .023 <.001 0.22
Intermediary Coastal .05 .021 .04 0.14 Highlander .09 .023 <.001 0.22
(Multiple comparisons – Tamhane’s T2)
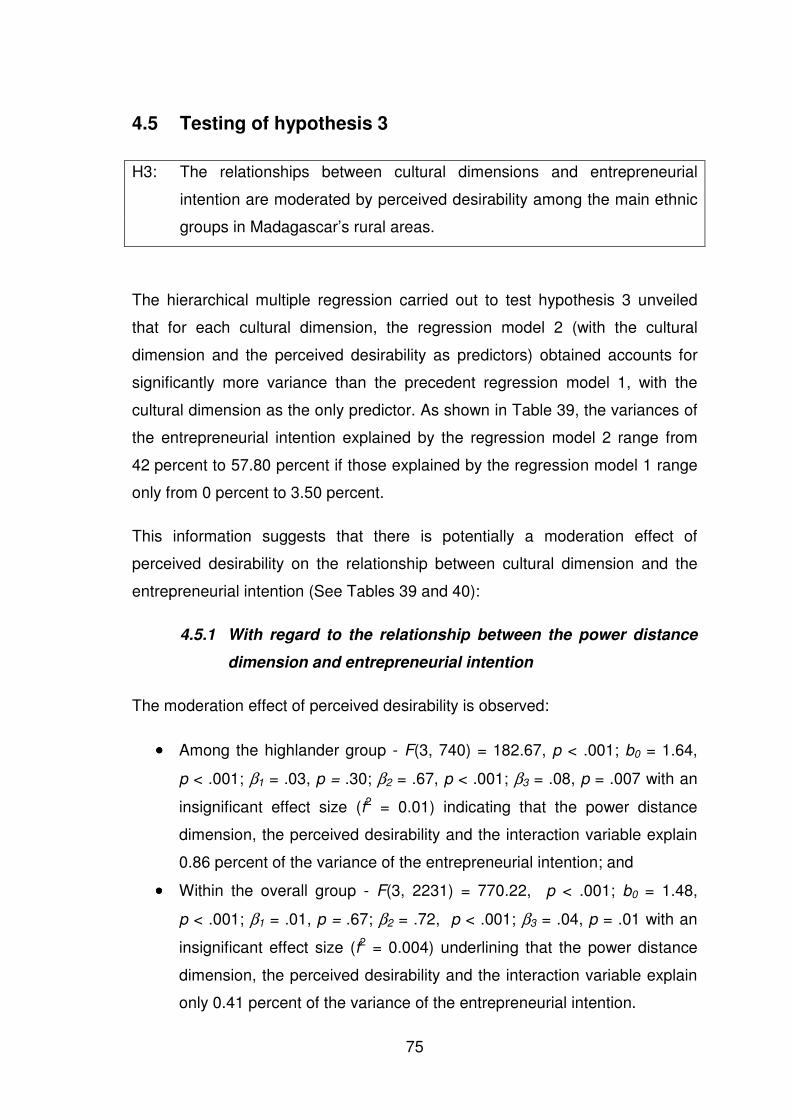
75
4.5 Testing of hypothesis 3
H3: The relationships between cultural dimensions and entrepreneurial
intention are moderated by perceived desirability among the main ethnic
groups in Madagascar’s rural areas.
The hierarchical multiple regression carried out to test hypothesis 3 unveiled
that for each cultural dimension, the regression model 2 (with the cultural
dimension and the perceived desirability as predictors) obtained accounts for
significantly more variance than the precedent regression model 1, with the
cultural dimension as the only predictor. As shown in Table 39, the variances of
the entrepreneurial intention explained by the regression model 2 range from
42 percent to 57.80 percent if those explained by the regression model 1 range
only from 0 percent to 3.50 percent.
This information suggests that there is potentially a moderation effect of
perceived desirability on the relationship between cultural dimension and the
entrepreneurial intention (See Tables 39 and 40):
4.5.1 With regard to the relationship between the power distance
dimension and entrepreneurial intention
The moderation effect of perceived desirability is observed:
•••• Among the highlander group - F(3, 740) = 182.67, p < .001; b0 = 1.64,
p < .001; β1 = .03, p = .30; β2 = .67, p < .001; β3 = .08, p = .007 with an
insignificant effect size (f2 = 0.01) indicating that the power distance
dimension, the perceived desirability and the interaction variable explain
0.86 percent of the variance of the entrepreneurial intention; and
•••• Within the overall group - F(3, 2231) = 770.22, p < .001; b0 = 1.48,
p < .001; β1 = .01, p = .67; β2 = .72, p < .001; β3 = .04, p = .01 with an
insignificant effect size (f2 = 0.004) underlining that the power distance
dimension, the perceived desirability and the interaction variable explain
only 0.41 percent of the variance of the entrepreneurial intention.
76
The slopes analysis does not confirm this observation (see Tables B-32 to B-33
and Figures B-1 to B-2):
• Among the highlander group, when the perceived desirability is medium,
there is a positive relationship, even non-significant, between the power
distance dimension and entrepreneurial intention and at the high value of
perceived desirability, there is also a positive relationship between power
distance dimension and entrepreneurial intention;
• Within the overall group, when the level of the perceived desirability is
low, the power distance dimension and entrepreneurial intention is
negatively related at the low value of the power distance dimension and
positively related at the medium and high values of the power distance
dimension. If the perceived desirability is medium, there is a non-
significant negative relationship between the power distance dimension
and entrepreneurial intention and at the high value of perceived
desirability; there is a positive relationship between power distance
dimension and entrepreneurial intention.
4.5.2 With regard to the relationship between the individualism
versus collectivism dimension and entrepreneurial intention
The perceived desirability moderates with an insignificant effect size
(f2 = 0.01), the relationship between individualism versus collectivism dimension
and entrepreneurial intention among the highlander group - F(3, 740) = 188.34,
p < .001; b0 = 2.01, p < .001; β1 = -.10, p < .001;
β2 = .63, p < .001; β3 = .06, p = .04. Based on the value of the effect size, it
could be concluded that combined, the individualism versus collectivism
dimension, the perceived desirability and the interaction variable explained only
0.53 percent of the variance of the entrepreneurial intention.
Graphic visualisation does not confirm this moderation effect as when the
perceived desirability is at its medium or high value, there is a negative
relationship between individualism vs. collectivism dimension and
entrepreneurial intention (see Table B-34 and Figure B-3).

77
4.5.3 With regard to the relationship between the uncertainty
avoidance dimension and entrepreneurial intention
The moderation effect of perceived desirability is detected:
•••• Within the highlander group - F(3, 740) = 189.56, p < .001; b0 = 1.30,
p < .001; β1 = .09, p = .001; β2 = .62, p < .001; β3 = -.08, p = .01 with an
insignificant effect size (f2 = 0.01) indicating that the uncertainty
avoidance dimension, the perceived desirability and the interaction
variable explain only 1.05 percent of the variance of the entrepreneurial
intention; and
•••• Among the overall group - F(3, 2231) = 774.15, p < .001; b0 = 1.38,
p < .001; β1 = .04, p = .01; β2 = .71, p < .001; β3 = -.05, p = .003 with an
insignificant effect size (f2 = 0.004) specifying that the uncertainty
avoidance dimension, the perceived desirability and the interaction
variable explain only 0.41 percent of the variance of the entrepreneurial
intention.
The slopes analysis does not confirm the moderation effect for the highlander
group as when the perceived desirability is medium or high (see Table B-35 and
Figure B-4). However, the moderation effect is, somewhat, confirmed for the
overall group as when the level of the perceived desirability is low, the
uncertainty avoidance dimension and entrepreneurial intention is positively
related at the low value of the uncertainty avoidance dimension and negatively
related at the medium and high values of the uncertainty dimension. If the
perceived desirability is medium, there is a non-significant positive relationship
between the uncertainty avoidance dimension and entrepreneurial intention and
at the high value of perceived desirability, the uncertainty avoidance dimension
and entrepreneurial intention is negatively related at the low value of the
uncertainty avoidance dimension and positively related at the medium and high
values of the uncertainty dimension (see Table B-36 and Figure B-5).
78
4.5.4 With regard to the relationship between the masculinity
versus femininity dimension and entrepreneurial intention
The perceived desirability moderates the relationship between masculinity
versus femininity dimension and entrepreneurial intention:
• Within the coastal group - F(3, 732) = 298.23, p < .001; b0 = 1.27,
p < .001; β1 = -.05, p = .05; β2 = .84, p < .001; β3 = -.14, p < .001 with a
small effect size (f2 = 0.02) underlining that the masculinity versus
femininity dimension, the perceived desirability and the interaction
variable explain 2.17 percent of the variance of the entrepreneurial
intention;
• Among the highlander group - F(3, 740) = 183.62, p < .001; b0 = 1.70,
p < .001; β1 = .05, p = .07; β2 = .63, p < .001; β3 = -.08, p = .004 with an
insignificant effect size (f2 = 0.01) indicating that the masculinity versus
femininity dimension, the perceived desirability and the interaction
variable explain only 1.21 percent of the variance of the entrepreneurial
intention;
• Among the intermediary group - F(3, 751) = 377.47, p < .001; b0 = 1.23,
p < .001; β1 = -.15, p < .001; β2 = .86, p < .001; β3 = -.18, p < .001 with a
small effect size (f2 = 0.06) indicating that the masculinity versus
femininity dimension, the perceived desirability and the interaction
variable explain 5.45 percent of the variance of the entrepreneurial
intention; and
• Within the overall group - F(3, 2231) = 781.15, p < .001; b0 = 1.49,
p < .001; β1 = -.03, p = .06; β2 = .74, p < .001; β3 = -.07, p < .001 with an
insignificant effect size (f2 = 0.01) specifying that the masculinity versus
femininity dimension, the perceived desirability and the interaction
variable explain 1.01 percent of the variance of the entrepreneurial
intention.
79
Graphic visualisations do not confirm those moderation effects for the coastal
and highlander groups as (See Tables B-37 and B-38 and Figures B-6
and B-7):
•••• Among the coastal group, when the level of the perceived desirability is
low, the masculinity versus femininity dimension and entrepreneurial
intention is positively related at the low value of the masculinity versus
femininity dimension and negatively related at the medium and high
values of the masculinity versus femininity dimension. If the perceived
desirability is medium, there is a non-significant positive relationship
between the masculinity versus femininity dimension and entrepreneurial
intention; and
•••• Among the highlander group, when the level of the perceived desirability
is medium or high, there is a positive relationship between the
masculinity versus femininity dimension and entrepreneurial intention but
non-significant at the low value of the masculinity versus femininity
dimension and significant at its medium and high values.
Nevertheless, for the intermediary and the overall groups, to some degree, the
confirmation through the slopes analysis is detailed as follows ( see Tables B-
39 and B-40 and Figures B-8 and B-9):
•••• Among the intermediary group, when the perceived desirability is
medium, there is a non-significant positive relationship between the
masculinity versus femininity dimension and entrepreneurial intention and
when the perceived desirability is high, there is a negative relationship
between the masculinity versus femininity dimension and entrepreneurial
intention; and
•••• Within the overall group, when the level of the perceived desirability is
medium, there is a flat relationship between the masculinity versus
femininity dimension and entrepreneurial intention. When the perceived
desirability is high, the masculinity versus femininity dimension and
entrepreneurial intention is positively related but non-significant at the low
value of the masculinity versus femininity dimension and negatively
80
related at the medium and high values of the masculinity versus
femininity dimension.
4.5.5 With regard to the relationship between the long-term versus
short-term orientation dimension and entrepreneurial
intention
The moderation effect of perceived desirability is observed:
•••• Among the highlander group - F(3, 740) = 183.51, p < .001; b0 = 1.61,
p < .001; β1 = .02, = .55; β2 = .66, p < .001; β3 = .10, p = .001 with a
small effect size (f2 = 0.02) indicating that the long-term versus short-term
orientation dimension, the perceived desirability and the interaction
variable explain 1.55 percent of the variance of the entrepreneurial
intention; and
•••• Within the overall group - F(3, 2231) = 769.39, p < .001; b0 = 1.38,
p < .001; β1 = .03, p = .10; β2 = .71, p < .001; β3 = -.04, p = .02 with an
insignificant effect size (f2 = 0.002) underlining the long-term versus
short-term orientation dimension, the perceived desirability and the
interaction variable explain only 0.20 percent of the variance of the
entrepreneurial intention.
The slopes analysis confirms somewhat this observation as (see Tables B-41
and B-42 and Figures B-10 and B-11):
•••• Among the highlander group, when the perceived desirability is low, the
long-term versus short-term orientation dimension and entrepreneurial
intention is positively related at the low value and negatively related at
the medium and high values of the long-term versus short-term
orientation dimension. If the perceived desirability is medium, there is a
non-significant positive relationship between the long-term versus short-
term orientation dimension and entrepreneurial intention ; and
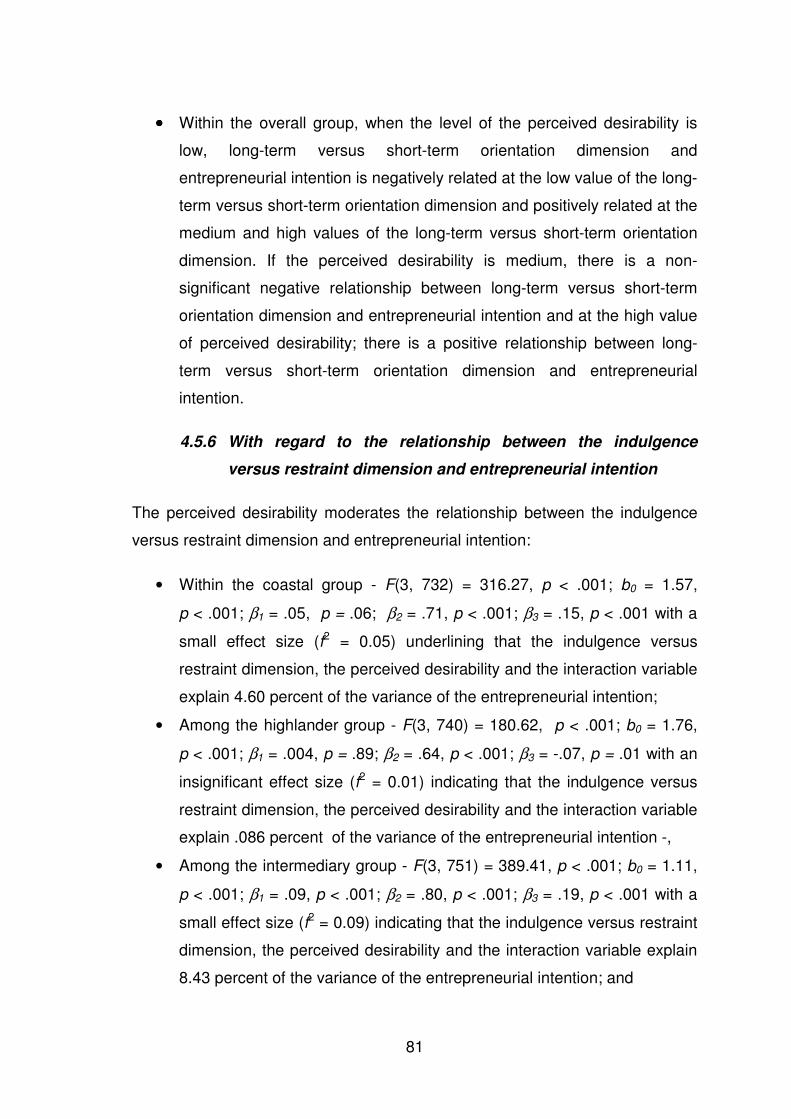
81
•••• Within the overall group, when the level of the perceived desirability is
low, long-term versus short-term orientation dimension and
entrepreneurial intention is negatively related at the low value of the long-
term versus short-term orientation dimension and positively related at the
medium and high values of the long-term versus short-term orientation
dimension. If the perceived desirability is medium, there is a non-
significant negative relationship between long-term versus short-term
orientation dimension and entrepreneurial intention and at the high value
of perceived desirability; there is a positive relationship between long-
term versus short-term orientation dimension and entrepreneurial
intention.
4.5.6 With regard to the relationship between the indulgence
versus restraint dimension and entrepreneurial intention
The perceived desirability moderates the relationship between the indulgence
versus restraint dimension and entrepreneurial intention:
• Within the coastal group - F(3, 732) = 316.27, p < .001; b0 = 1.57,
p < .001; β1 = .05, p = .06; β2 = .71, p < .001; β3 = .15, p < .001 with a
small effect size (f2 = 0.05) underlining that the indulgence versus
restraint dimension, the perceived desirability and the interaction variable
explain 4.60 percent of the variance of the entrepreneurial intention;
• Among the highlander group - F(3, 740) = 180.62, p < .001; b0 = 1.76,
p < .001; β1 = .004, p = .89; β2 = .64, p < .001; β3 = -.07, p = .01 with an
insignificant effect size (f2 = 0.01) indicating that the indulgence versus
restraint dimension, the perceived desirability and the interaction variable
explain .086 percent of the variance of the entrepreneurial intention -,
• Among the intermediary group - F(3, 751) = 389.41, p < .001; b0 = 1.11,
p < .001; β1 = .09, p < .001; β2 = .80, p < .001; β3 = .19, p < .001 with a
small effect size (f2 = 0.09) indicating that the indulgence versus restraint
dimension, the perceived desirability and the interaction variable explain
8.43 percent of the variance of the entrepreneurial intention; and
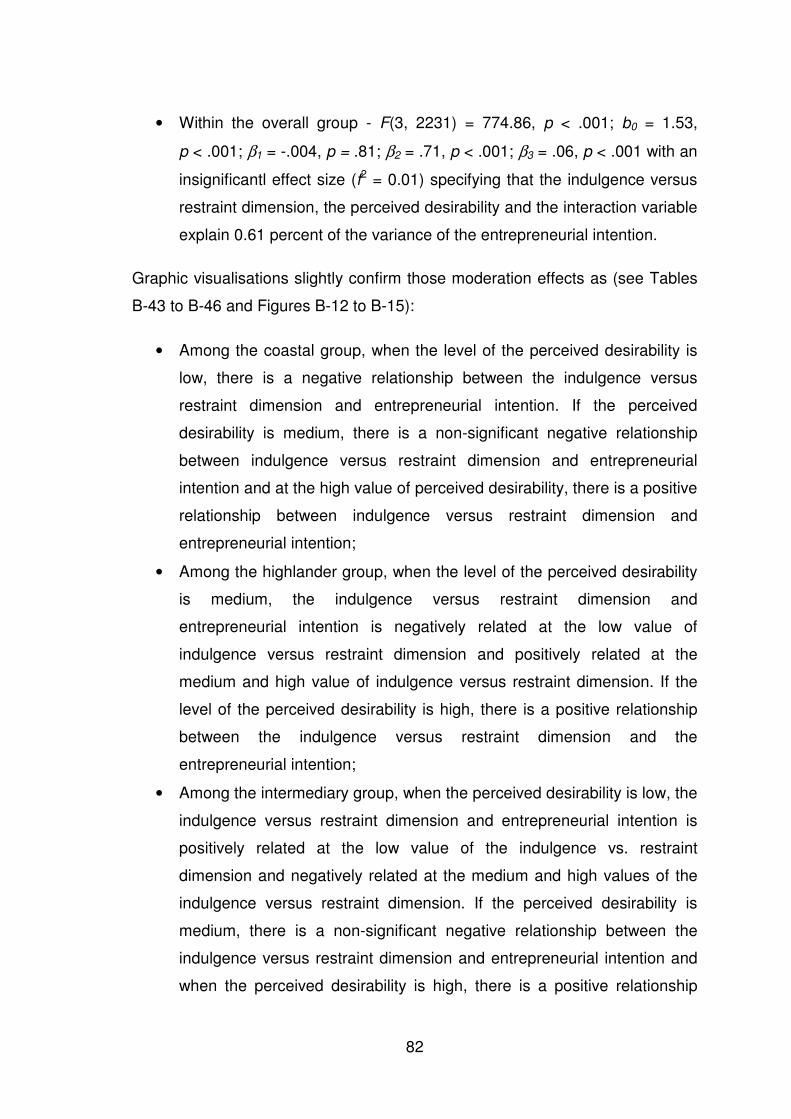
82
• Within the overall group - F(3, 2231) = 774.86, p < .001; b0 = 1.53,
p < .001; β1 = -.004, p = .81; β2 = .71, p < .001; β3 = .06, p < .001 with an
insignificantl effect size (f2 = 0.01) specifying that the indulgence versus
restraint dimension, the perceived desirability and the interaction variable
explain 0.61 percent of the variance of the entrepreneurial intention.
Graphic visualisations slightly confirm those moderation effects as (see Tables
B-43 to B-46 and Figures B-12 to B-15):
• Among the coastal group, when the level of the perceived desirability is
low, there is a negative relationship between the indulgence versus
restraint dimension and entrepreneurial intention. If the perceived
desirability is medium, there is a non-significant negative relationship
between indulgence versus restraint dimension and entrepreneurial
intention and at the high value of perceived desirability, there is a positive
relationship between indulgence versus restraint dimension and
entrepreneurial intention;
• Among the highlander group, when the level of the perceived desirability
is medium, the indulgence versus restraint dimension and
entrepreneurial intention is negatively related at the low value of
indulgence versus restraint dimension and positively related at the
medium and high value of indulgence versus restraint dimension. If the
level of the perceived desirability is high, there is a positive relationship
between the indulgence versus restraint dimension and the
entrepreneurial intention;
• Among the intermediary group, when the perceived desirability is low, the
indulgence versus restraint dimension and entrepreneurial intention is
positively related at the low value of the indulgence vs. restraint
dimension and negatively related at the medium and high values of the
indulgence versus restraint dimension. If the perceived desirability is
medium, there is a non-significant negative relationship between the
indulgence versus restraint dimension and entrepreneurial intention and
when the perceived desirability is high, there is a positive relationship
83
between the indulgence versus restraint dimension and entrepreneurial
intention; and
• Within the overall group, when the level of the perceived desirability is
low, there is a negative relationship between the indulgence versus
restraint dimension and entrepreneurial intention. If the perceived
desirability is medium, there is a non-significant negative relationship
between the indulgence versus restraint dimension and entrepreneurial
intention and when the perceived desirability is high, the indulgence
versus restraint dimension and entrepreneurial intention is positively
related at the low value of the indulgence versus restraint dimension and
negatively related at the medium and high values of the indulgence
versus restraint dimension
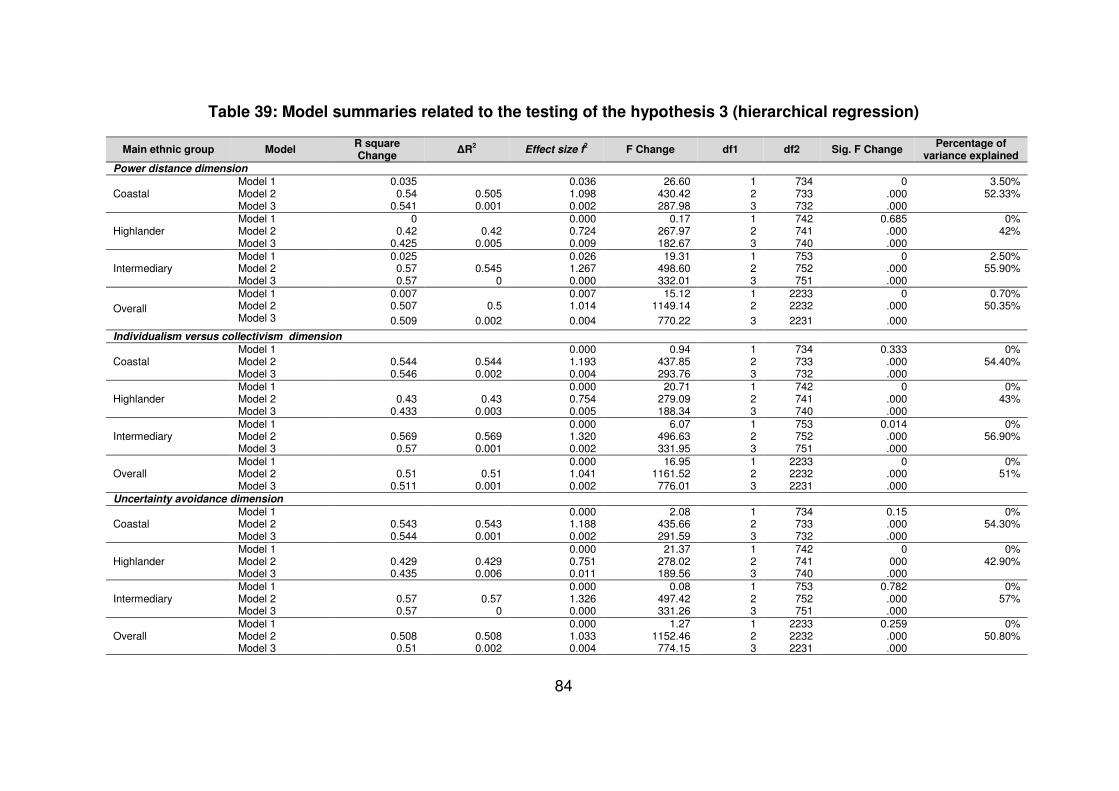
84
Table 39: Model summaries related to the testing of the hypothesis 3 (hierarchical regression)
Main ethnic group Model R square Change
∆R2 Effect size f
2 F Change df1 df2 Sig. F Change
Percentage of variance explained
Power distance dimension
Coastal Model 1 0.035 0.036 26.60 1 734 0 3.50% Model 2 0.54 0.505 1.098 430.42 2 733 .000 52.33% Model 3 0.541 0.001 0.002 287.98 3 732 .000
Highlander Model 1 0 0.000 0.17 1 742 0.685 0% Model 2 0.42 0.42 0.724 267.97 2 741 .000 42% Model 3 0.425 0.005 0.009 182.67 3 740 .000
Intermediary Model 1 0.025 0.026 19.31 1 753 0 2.50% Model 2 0.57 0.545 1.267 498.60 2 752 .000 55.90% Model 3 0.57 0 0.000 332.01 3 751 .000
Overall
Model 1 0.007 0.007 15.12 1 2233 0 0.70% Model 2 0.507 0.5 1.014 1149.14 2 2232 .000 50.35% Model 3 0.509 0.002 0.004 770.22 3 2231 .000
Individualism versus collectivism dimension
Coastal Model 1 0.000 0.94 1 734 0.333 0% Model 2 0.544 0.544 1.193 437.85 2 733 .000 54.40% Model 3 0.546 0.002 0.004 293.76 3 732 .000
Highlander Model 1 0.000 20.71 1 742 0 0% Model 2 0.43 0.43 0.754 279.09 2 741 .000 43% Model 3 0.433 0.003 0.005 188.34 3 740 .000
Intermediary Model 1 0.000 6.07 1 753 0.014 0% Model 2 0.569 0.569 1.320 496.63 2 752 .000 56.90% Model 3 0.57 0.001 0.002 331.95 3 751 .000
Overall Model 1 0.000 16.95 1 2233 0 0% Model 2 0.51 0.51 1.041 1161.52 2 2232 .000 51% Model 3 0.511 0.001 0.002 776.01 3 2231 .000
Uncertainty avoidance dimension
Coastal Model 1 0.000 2.08 1 734 0.15 0% Model 2 0.543 0.543 1.188 435.66 2 733 .000 54.30% Model 3 0.544 0.001 0.002 291.59 3 732 .000
Highlander Model 1 0.000 21.37 1 742 0 0% Model 2 0.429 0.429 0.751 278.02 2 741 000 42.90% Model 3 0.435 0.006 0.011 189.56 3 740 .000
Intermediary Model 1 0.000 0.08 1 753 0.782 0% Model 2 0.57 0.57 1.326 497.42 2 752 .000 57% Model 3 0.57 0 0.000 331.26 3 751 .000
Overall Model 1 0.000 1.27 1 2233 0.259 0% Model 2 0.508 0.508 1.033 1152.46 2 2232 .000 50.80% Model 3 0.51 0.002 0.004 774.15 3 2231 .000
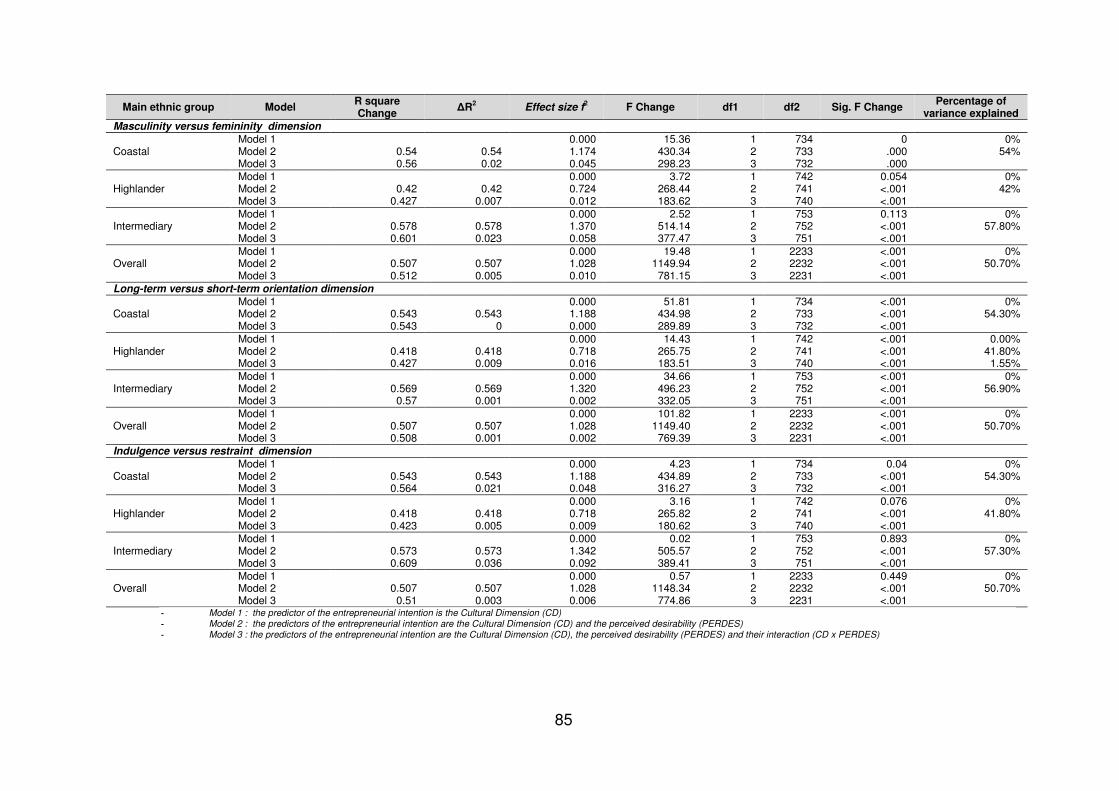
85
Main ethnic group Model R square Change
∆R2 Effect size f
2 F Change df1 df2 Sig. F Change
Percentage of variance explained
Masculinity versus femininity dimension
Coastal Model 1 0.000 15.36 1 734 0 0% Model 2 0.54 0.54 1.174 430.34 2 733 .000 54% Model 3 0.56 0.02 0.045 298.23 3 732 .000
Highlander Model 1 0.000 3.72 1 742 0.054 0% Model 2 0.42 0.42 0.724 268.44 2 741 <.001 42% Model 3 0.427 0.007 0.012 183.62 3 740 <.001
Intermediary Model 1 0.000 2.52 1 753 0.113 0% Model 2 0.578 0.578 1.370 514.14 2 752 <.001 57.80% Model 3 0.601 0.023 0.058 377.47 3 751 <.001
Overall Model 1 0.000 19.48 1 2233 <.001 0% Model 2 0.507 0.507 1.028 1149.94 2 2232 <.001 50.70% Model 3 0.512 0.005 0.010 781.15 3 2231 <.001
Long-term versus short-term orientation dimension
Coastal Model 1 0.000 51.81 1 734 <.001 0% Model 2 0.543 0.543 1.188 434.98 2 733 <.001 54.30% Model 3 0.543 0 0.000 289.89 3 732 <.001
Highlander Model 1 0.000 14.43 1 742 <.001 0.00% Model 2 0.418 0.418 0.718 265.75 2 741 <.001 41.80% Model 3 0.427 0.009 0.016 183.51 3 740 <.001 1.55%
Intermediary Model 1 0.000 34.66 1 753 <.001 0% Model 2 0.569 0.569 1.320 496.23 2 752 <.001 56.90% Model 3 0.57 0.001 0.002 332.05 3 751 <.001
Overall Model 1 0.000 101.82 1 2233 <.001 0% Model 2 0.507 0.507 1.028 1149.40 2 2232 <.001 50.70% Model 3 0.508 0.001 0.002 769.39 3 2231 <.001
Indulgence versus restraint dimension
Coastal Model 1 0.000 4.23 1 734 0.04 0% Model 2 0.543 0.543 1.188 434.89 2 733 <.001 54.30% Model 3 0.564 0.021 0.048 316.27 3 732 <.001
Highlander Model 1 0.000 3.16 1 742 0.076 0% Model 2 0.418 0.418 0.718 265.82 2 741 <.001 41.80% Model 3 0.423 0.005 0.009 180.62 3 740 <.001
Intermediary Model 1 0.000 0.02 1 753 0.893 0% Model 2 0.573 0.573 1.342 505.57 2 752 <.001 57.30% Model 3 0.609 0.036 0.092 389.41 3 751 <.001
Overall Model 1 0.000 0.57 1 2233 0.449 0% Model 2 0.507 0.507 1.028 1148.34 2 2232 <.001 50.70% Model 3 0.51 0.003 0.006 774.86 3 2231 <.001
- Model 1 : the predictor of the entrepreneurial intention is the Cultural Dimension (CD) - Model 2 : the predictors of the entrepreneurial intention are the Cultural Dimension (CD) and the perceived desirability (PERDES) - Model 3 : the predictors of the entrepreneurial intention are the Cultural Dimension (CD), the perceived desirability (PERDES) and their interaction (CD x PERDES)
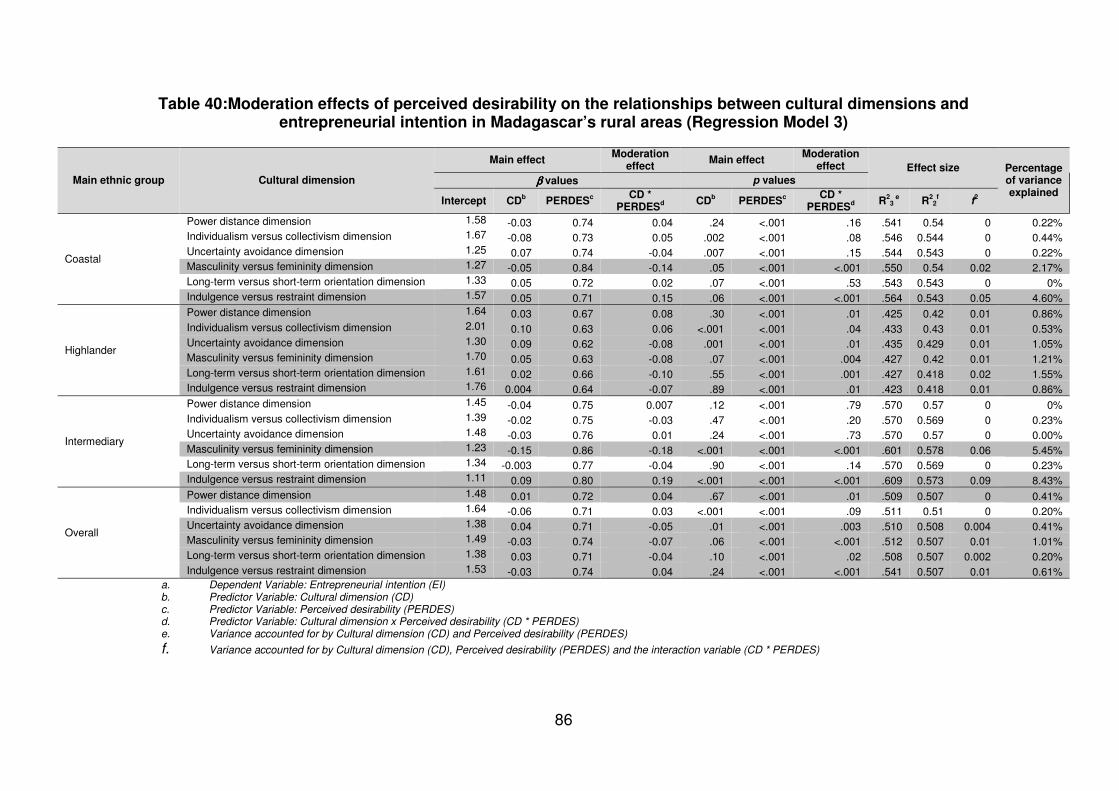
86
Table 40:Moderation effects of perceived desirability on the relationships between cultural dimensions and entrepreneurial intention in Madagascar’s rural areas (Regression Model 3)
Main ethnic group Cultural dimension
Main effect Moderation
effect Main effect
Moderation effect Effect size Percentage
of variance explained
ββββ values p values
Intercept CDb PERDES
c
CD * PERDES
d
CDb PERDES
c
CD * PERDES
d
R23
e R
22f f
2
Coastal
Power distance dimension 1.58 -0.03 0.74 0.04 .24 <.001 .16 .541 0.54 0 0.22%
Individualism versus collectivism dimension 1.67 -0.08 0.73 0.05 .002 <.001 .08 .546 0.544 0 0.44%
Uncertainty avoidance dimension 1.25 0.07 0.74 -0.04 .007 <.001 .15 .544 0.543 0 0.22%
Masculinity versus femininity dimension 1.27 -0.05 0.84 -0.14 .05 <.001 <.001 .550 0.54 0.02 2.17%
Long-term versus short-term orientation dimension 1.33 0.05 0.72 0.02 .07 <.001 .53 .543 0.543 0 0%
Indulgence versus restraint dimension 1.57 0.05 0.71 0.15 .06 <.001 <.001 .564 0.543 0.05 4.60%
Highlander
Power distance dimension 1.64 0.03 0.67 0.08 .30 <.001 .01 .425 0.42 0.01 0.86%
Individualism versus collectivism dimension 2.01 0.10 0.63 0.06 <.001 <.001 .04 .433 0.43 0.01 0.53%
Uncertainty avoidance dimension 1.30 0.09 0.62 -0.08 .001 <.001 .01 .435 0.429 0.01 1.05%
Masculinity versus femininity dimension 1.70 0.05 0.63 -0.08 .07 <.001 .004 .427 0.42 0.01 1.21%
Long-term versus short-term orientation dimension 1.61 0.02 0.66 -0.10 .55 <.001 .001 .427 0.418 0.02 1.55%
Indulgence versus restraint dimension 1.76 0.004 0.64 -0.07 .89 <.001 .01 .423 0.418 0.01 0.86%
Intermediary
Power distance dimension 1.45 -0.04 0.75 0.007 .12 <.001 .79 .570 0.57 0 0%
Individualism versus collectivism dimension 1.39 -0.02 0.75 -0.03 .47 <.001 .20 .570 0.569 0 0.23%
Uncertainty avoidance dimension 1.48 -0.03 0.76 0.01 .24 <.001 .73 .570 0.57 0 0.00%
Masculinity versus femininity dimension 1.23 -0.15 0.86 -0.18 <.001 <.001 <.001 .601 0.578 0.06 5.45%
Long-term versus short-term orientation dimension 1.34 -0.003 0.77 -0.04 .90 <.001 .14 .570 0.569 0 0.23%
Indulgence versus restraint dimension 1.11 0.09 0.80 0.19 <.001 <.001 <.001 .609 0.573 0.09 8.43%
Overall
Power distance dimension 1.48 0.01 0.72 0.04 .67 <.001 .01 .509 0.507 0 0.41%
Individualism versus collectivism dimension 1.64 -0.06 0.71 0.03 <.001 <.001 .09 .511 0.51 0 0.20%
Uncertainty avoidance dimension 1.38 0.04 0.71 -0.05 .01 <.001 .003 .510 0.508 0.004 0.41%
Masculinity versus femininity dimension 1.49 -0.03 0.74 -0.07 .06 <.001 <.001 .512 0.507 0.01 1.01%
Long-term versus short-term orientation dimension 1.38 0.03 0.71 -0.04 .10 <.001 .02 .508 0.507 0.002 0.20%
Indulgence versus restraint dimension 1.53 -0.03 0.74 0.04 .24 <.001 <.001 .541 0.507 0.01 0.61% a. Dependent Variable: Entrepreneurial intention (EI) b. Predictor Variable: Cultural dimension (CD) c. Predictor Variable: Perceived desirability (PERDES) d. Predictor Variable: Cultural dimension x Perceived desirability (CD * PERDES) e. Variance accounted for by Cultural dimension (CD) and Perceived desirability (PERDES)
f. Variance accounted for by Cultural dimension (CD), Perceived desirability (PERDES) and the interaction variable (CD * PERDES)
87
4.6 Summary
With a total sample size of 2,235 adult individuals (1,110 males and 1,125
females), comprising three sub-samples: coastal group (N = 736), highlander
group (N = 744), and intermediary group (N = 755) the response rate was very
good. The sample is characterised by the maturity of its members with the
respondents overall group being 40.3 years on average. Furthermore, 29
percent of respondents do not have any level of education, 55 percent have
attended primary school and only 16 percent have been at secondary school or
more.
After the recommended adjustment operated on four scales out of eight, the
reliability (all α≥ .78) and the validity the studied scales were largely
demonstrated.
Through a meticulous one-way ANOVA test coupled with Tamhane’s T2 Post
Hoc test, it was proved that:
•••• there is no difference between all three main ethnic groups studied with
regard to the individualism versus collectivism dimension and the
uncertainty avoidance dimension;
•••• a difference with an insignificant magnitude is noted between the
highlander group and the coastal group with regard to the measure of the
power distance dimension;
•••• differences with small magnitudes are noted between the highlander
group and the intermediary group relative to the measure fo power
distance dimension and between the intermediary group and the two
others main ethnic groups (the coastal group and the highlander group)
as for the measure of the masculinity versus femininity dimension and
that of long-term versus short-term orientation dimension; and
88
•••• a difference with large magnitude is verified between all studied main
ethnic groups with regard to the indulgence versus restraint dimension.
Considering the perceived desirability, there is a difference with a small effect
size between the intermediary group and the two others main ethnic groups
(coastal group and highlander group).
A multiple regression with interaction in order to highlight a hypothetical
moderation effect of the perceived desirability on the relationship between
cultural dimensions and entrepreneurial intention revealed that:
•••• A moderation effect with either insignificant or a small magnitude for all
studied cultural dimensions is verified only among the highlander group;
•••• For the coastal group and the intermediary group, a moderation effect
with a small magnitude is noted with regard to the relationship between
the masculinity versus femininity dimension and the entrepreneurial
intention, on one hand and the relationship between indulgence versus
restraint and entrepreneurial intention, on the other hand; and
•••• Within the overall group, the moderation effect with an insignificant
magnitude is noted for all relationships between cultural dimensions and
entrepreneurial intention except that which involves the individualism
versus collectivism dimension.
Table 41 consolidates the main findings for the hypotheses testing.
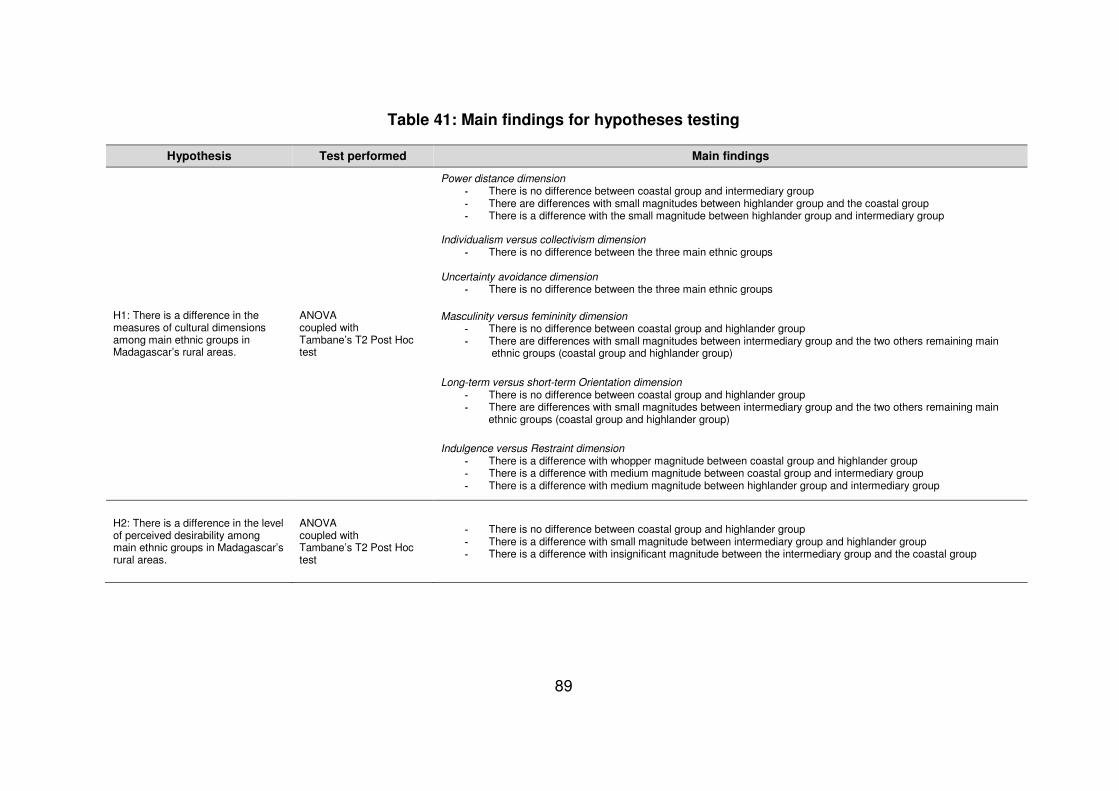
89
Table 41: Main findings for hypotheses testing
Hypothesis Test performed Main findings
H1: There is a difference in the measures of cultural dimensions among main ethnic groups in Madagascar’s rural areas.
ANOVA coupled with Tambane’s T2 Post Hoc test
Power distance dimension - There is no difference between coastal group and intermediary group - There are differences with small magnitudes between highlander group and the coastal group - There is a difference with the small magnitude between highlander group and intermediary group
Individualism versus collectivism dimension - There is no difference between the three main ethnic groups
Uncertainty avoidance dimension - There is no difference between the three main ethnic groups
Masculinity versus femininity dimension - There is no difference between coastal group and highlander group - There are differences with small magnitudes between intermediary group and the two others remaining main ethnic groups (coastal group and highlander group)
Long-term versus short-term Orientation dimension - There is no difference between coastal group and highlander group - There are differences with small magnitudes between intermediary group and the two others remaining main ethnic groups (coastal group and highlander group)
Indulgence versus Restraint dimension - There is a difference with whopper magnitude between coastal group and highlander group - There is a difference with medium magnitude between coastal group and intermediary group - There is a difference with medium magnitude between highlander group and intermediary group
H2: There is a difference in the level of perceived desirability among main ethnic groups in Madagascar’s rural areas.
ANOVA coupled with Tambane’s T2 Post Hoc test
- There is no difference between coastal group and highlander group - There is a difference with small magnitude between intermediary group and highlander group - There is a difference with insignificant magnitude between the intermediary group and the coastal group
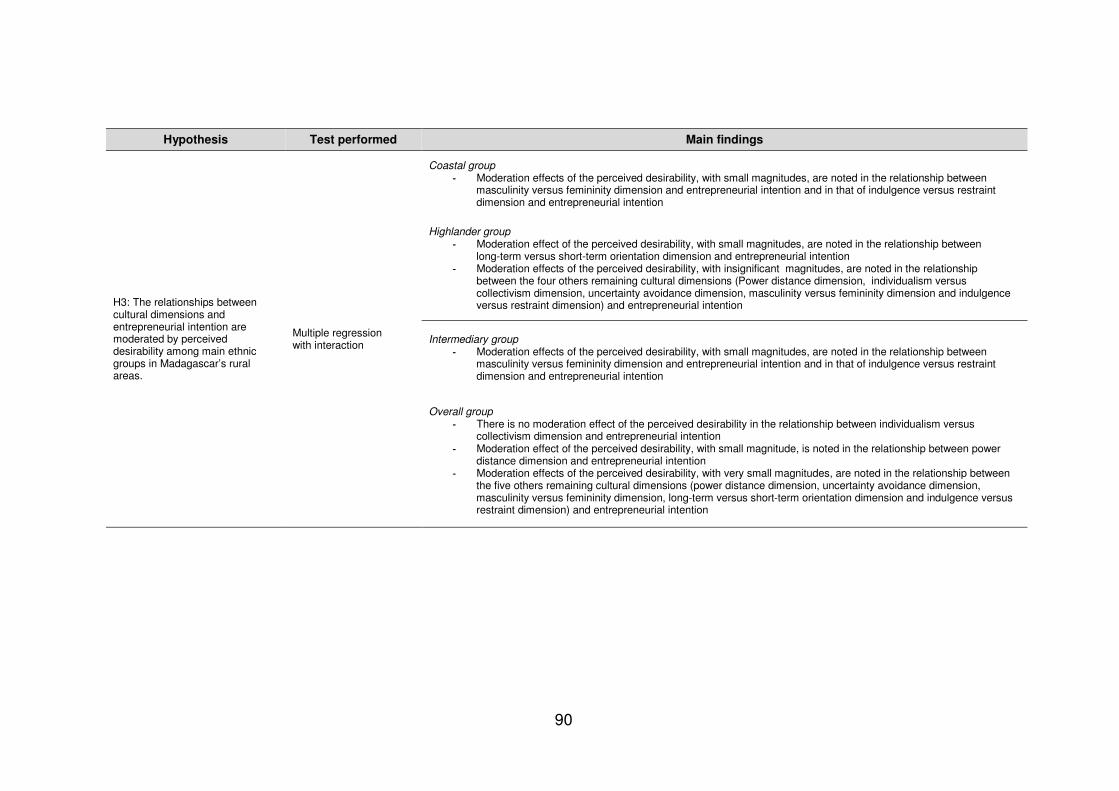
90
Hypothesis Test performed Main findings
H3: The relationships between cultural dimensions and entrepreneurial intention are moderated by perceived desirability among main ethnic groups in Madagascar’s rural areas.
Multiple regression with interaction
Coastal group - Moderation effects of the perceived desirability, with small magnitudes, are noted in the relationship between masculinity versus femininity dimension and entrepreneurial intention and in that of indulgence versus restraint dimension and entrepreneurial intention
Highlander group - Moderation effect of the perceived desirability, with small magnitudes, are noted in the relationship between long-term versus short-term orientation dimension and entrepreneurial intention - Moderation effects of the perceived desirability, with insignificant magnitudes, are noted in the relationship between the four others remaining cultural dimensions (Power distance dimension, individualism versus collectivism dimension, uncertainty avoidance dimension, masculinity versus femininity dimension and indulgence versus restraint dimension) and entrepreneurial intention
Intermediary group - Moderation effects of the perceived desirability, with small magnitudes, are noted in the relationship between masculinity versus femininity dimension and entrepreneurial intention and in that of indulgence versus restraint dimension and entrepreneurial intention
Overall group - There is no moderation effect of the perceived desirability in the relationship between individualism versus collectivism dimension and entrepreneurial intention - Moderation effect of the perceived desirability, with small magnitude, is noted in the relationship between power distance dimension and entrepreneurial intention - Moderation effects of the perceived desirability, with very small magnitudes, are noted in the relationship between the five others remaining cultural dimensions (power distance dimension, uncertainty avoidance dimension, masculinity versus femininity dimension, long-term versus short-term orientation dimension and indulgence versus restraint dimension) and entrepreneurial intention
91
CHAPTER 5: DISCUSSION OF THE RESULTS
The discussion of the results is carried out hypothesis by hypothesis. A
conclusion wraps up the discussion and closes this chapter.
5.1 Discussion pertaining to hypothesis 1
H1: There is a difference in the measures of cultural dimensions among main
ethnic groups in Madagascar’s rural areas.
According to the findings of the research, the three main ethnic groups studied,
present similarities or differences with respect to cultural dimensions, which, to
some extent, encapsulate values, beliefs, norms and behavioural patterns of a
given community (Leung, Bhagat, Buchan, Erez & Gibson, 2005) and influence
diverse aspects of the life of this community, including those relating to
entrepreneurial initiatives. More precisely, the findings put forward that:
• The three main ethnic groups studied are at the same level of measures
with regard to the individualism versus collectivism dimension and the
uncertainty avoidance dimension.
• The three main ethnic groups studied differ noticeably with regard to the
indulgence versus restraint dimension with a clear ascent of the
highlander group on the two others main ethnic groups (the coastal group
and the intermediary group), which also present a slight difference in the
measures of the related cultural dimension.
• The highlander group has a measure of power distance dimension
slightly lower than that of the two others main ethnic groups (the coastal
group and the intermediary group), which are appreciably in the same
range with regard to the considered cultural dimension.
92
• The measure of the masculinity versus femininity dimension and that of
the long-term versus short-term orientation dimension for the
intermediary group is somewhat higher than that of the two other main
ethnic groups (the coastal group and the highlander group).
Thus, at a first glance, it could be seen that the null hypothesis did not enjoy
sufficient support as four of the six cultural dimensions showed no differences.
This, suggested that there was no difference in the measures of cultural
dimensions among the main ethnic groups in Madagascar’s rural areas.
However, it is worthwhile to note that, except the case of the indulgence versus
restraint dimension, which is a new dimension introduced very recently by
Hofstede’s et al. (2010) team and for which scholars are still too close for a
proper view, the magnitude of the differences between the main ethnic groups
studied were small. The values of the means of cultural dimension measures
testified to this observation (Table B-47).
Based on this last consideration, it was suggested that the null hypothesis be
accepted with a minor modification as follows: “there is no important difference
in the measures of cultural dimensions among main ethnic groups in
Madagascar’s rural areas”.
On the basis of a popular Malagasy misconception, taken again by some
scholars, who tend to believe that Malagasy ethnic groups are different from to
each other (Tehindrazanarivelo, 2002), these findings were surprising. They
suggested clearly that in Madagascar’s rural areas, individuals had, to a certain
extent, the same level of measure whatever the cultural dimensions considered.
Madagascar’s rural areas could validly be considered a unit of analysis for any
subject related to cultural dimensions studies (Hofstede, 1981).
This situation would not be possible within the framework of an environment
characterised by a low ethnic diversity as described by Khastar, Kalhorian,
Khalouei and Maleki (2001) when they attempted to find the intermediate
method for the refinement of Hofstede’s (1981) cultural dimensions approach. A
completely plausible assumption if it is accepted that the principal determinants
93
of the culture of a given community comprise inter alia the history, the language
and the religion (Bik, 2010).
Although Malagasy people were distinguished by certain characteristics such as
traditional occupations (farmers, stockbreeders, foresters, fishermen) and
geographical location of its various subgroups, it was largely demonstrated that
Malagasy people have a common cultural background so it is not aberrant to
advance that it would have only one ethnic group: the Malagasy nation
(Ramamonjisoa, 2003).
Furthermore, Malagasy people are characterised by the variety of physical
types, which are the fruit of mixtures, the multiplicity of external influences, the
unit of material habits, same body of beliefs beyond the diversity of the religious
forms, the similarity of the types of social organisation, the structuring of groups
and individuals around the ancestor, the community of language beyond the
variety of intonations and the unity in diversity (Ramamonjisoa, 2003).
When discussing ethnic groups in the context of Malagasy, various communities
could simply be interpreted as a misuse of the concept and the perpetuation of
a colonial bad habit. Amselle and M’Bokolo (1985) argued that if the term ethnic
group or the word tribe, acquired widespread use since the 19th century, to the
detriment of other terms like nation, it is undoubtedly because it was a question
of putting aside some communities in order to deny their specific quality. In fact,
during the colonial era, it was thus advisable to define the Amerindian, African,
Oceanian and some Asian communities as different from each other and
without history, in other words as communities whose members did not take
part in a common humanity identity (Amselle & M’Bokolo, 1985). Unfortunately,
this colonial use of ethnic group terms continues to be the standard by which
most scholars discuss the linguistic and cultural aspects of African, Oceanian or
Amerindian communities and is often recuperated by the main groups when
they speak about their own community. This is precisely what occurred to
Malagasy people when they internalised the concept of a population subdivided
into 18 ethnic groups or tribes, a clear translation of the perfect success of the
sadly famous ‘dividere et imperare’, meaning divide to reign, implemented by
94
General Gallieni, General Governor of Madagascar from 1896 to 1905, during
his mandate (Ratovonasy, 2012).
Lastly, it should be stressed that it is broadly acknowledged that the Malagasy
people, who outwardly show tangible cultural similarities, have been exposed to
a multiplicity of external influences and are in a state of perpetual change or
movement due to the phenomena of globalisation, might have persistent inward
cultural differences (Ghemawat & Reiche, 2011). Accordingly, it is thus
completely understandable to see that ethnic groups present between them
slight differences with regard to some cultural dimensions.
5.2 Discussion pertaining to hypothesis 2
H2: There is a difference in the level of perceived desirability among main
ethnic groups in Madagascar’s rural areas.
Here also, with regard to the level of perceived desirability, the findings of the
research, at a first glance conclude that the null hypothesis, which states that
there is no difference in the level of perceived desirability among the main
ethnic groups in Madagascar’s rural areas, is not supported. The intermediary
group presents a level of perceived desirability slightly higher than those of the
two other main ethnic groups (the coastal group and the highlander group),
which are on the same level of perceived desirability.
Furthermore, those findings corroborate what has been developed by Shapero
and Sokol (1982) within their framework called the entrepreneurial event model
(EEM) and this specifically when they supported that the independent variable,
‘perceived desirability’, is nurtured by:
•••• The family which is paramount in shaping of the desirability of the act;
•••• The peer group is about the influence of the entourage – the more this
entourage is important, the more the member of this group to set up a
new venture or to take over an existing one; and
95
•••• The ethnic group as the belonging to an ethnic group has a strong
influence on the entrepreneurial behaviour.
Nevertheless, the weakness of the magnitude of the difference in the level of
perceived desirability in Madagascar’s rural areas (Table B-47) needs to be
considered in practice. While the argument that, to some extent, Madagascar
could be considered as a one ethnic group country (Ramamonjisoa, 2003), it
makes sense to advance that the null hypothesis could be accepted with a
slight change as followed: “there is no important difference in the level of
perceived desirability among the main ethnic groups in Madagascar’s rural
areas”.
5.3 Discussion pertaining to hypothesis 3
H3: The relationships between cultural dimensions and entrepreneurial
intention are moderated by perceived desirability among main ethnic
groups in Madagascar’s rural areas.
Sub-problem 3 of the research aimed to measure the relationships between
cultural dimensions and entrepreneurial intention and the moderation effects of
the perceived desirability on these relationships. The findings highlight the fact
that, for all cultural dimensions, the moderation effects have been only
demonstrated among the highlander group and to some extent within the overall
group, with an exception made for the individualism versus collectivism
dimension. For the other two main ethnic groups (the coastal group and the
intermediary group), the moderation effects are related to the relationships of
entrepreneurial intention with the masculinity versus femininity dimension and
the indulgence versus restraint dimension respectively.
As seen previously, it could be suggested that the null hypothesis, which
asserts that the relationships between cultural dimensions are not moderated by
perceived desirability among main ethnic groups in Madagascar’s rural areas, is
not wholly verified. However, when observing the magnitude of any
96
demonstrated moderation effects, it appears that, they are so small that they
could be ignored, even for the case of the indulgence versus restraint
dimension. The variance of the entrepreneurial intention explained by the
related model regression 2, with the cultural dimension and the perceived
desirability as predictors, reach no more than 8.43 percent (Table 40).
Thus, it is conceivable to suggest that the null hypothesis related to hypothesis
3 is supported by the results of the research if rephrased as follows: “the
relationships between cultural dimensions and entrepreneurial intention are not
importantly moderated by perceived desirability among the main ethnic groups
in Madagascar’s rural areas”.
It is worthwhile noting that these findings appear to be an interesting new point
of view compared to those of Cristina and Dwayne (2009), when they studied
the comparative strategies among hotels in small developing Caribbean states.
They discovered the relationship among entrepreneurial intention, perceived
desirability and perceived feasibility and suggested that the moderation effect of
culture on this relationship is plausible.
The suggestion supported by Fernandez, Carlson, Stepina and Nicholson
(1997) and George and Prahabu (2000) who argued that national culture
moderates entrepreneurial intention, is another interesting comparison to be
made. Indeed, the research seems to be a seminal one in the field of the
moderation effect of perceived desirability on the relationship between cultural
dimensions and entrepreneurial intention, particularly in the context of
Madagascar.
The variances explained by model 2 of the multiple regression launched, which
has as predictors of the entrepreneurial intention, the cultural dimension and the
perceived desirability, can be compared with those of model 1, which has as
predictor of the entrepreneurial intention, the cultural dimension. The perceived
desirability explained 38.5 percent of the variance of entrepreneurial intention in
Madagascar’s rural areas. This observation confirms that which has been
underlined by Urban et al (2008) in their discussion on the contribution of the
97
perceived feasibility, the perceived desirability and the propensity to act to the
variance of the entrepreneurial intention. It also mirrors the findings of Kennedy
et al. (2003), when they studied a sample of Australian students and found that
the desirability, the social norms and the feasibility explained approximately 53
percent of the intention to create a new venture. Audet (2001) studied a sample
of students in the Administration and Business Faculty at Concordia University;
the results showed that the power of prediction of the desirability is appreciably
more important than that of the feasibility. Thus, seeking the moderation effects
of perceived desirability on the relationships between cultural dimensions and
entrepreneurial intention was sense full.
Lastly, this research revealed that the highlander group is the only main ethnic
group among the three studied to show that the perceived desirability has a
moderation effect on the relationships between cultural dimensions and
entrepreneurial intention, although the magnitudes of these moderation effects
are marginal. In addition, if the indulgence versus restraint dimension is not
considered, the measures of cultural dimensions of the highlander group appear
as the central ones compared to those of the two others main ethnic groups (the
coastal group and the intermediary group) (Table B-47). This observation
suggests, to some degree, that the highlander group could be considered the
‘reference group’ for Madagascar’s rural areas with regard to entrepreneurial
initiatives. This makes sense, if the assumption stating that Madagascar would
be a one ethnic group nation is endorsed (Ramamonjisoa, 2003).
5.4 Conclusion
Taking into consideration the findings of the research with particular emphasis
on the magnitude of the effect size within the framework of the testing of the
hypotheses 1 and 2 on the one hand and the likely demonstrated assumption
that Madagascar would be a one ethnic group nation, on the other hand; it can
be concluded that the related null hypothesis could be accepted if slightly
modified as follows:
98
•••• H0 of the H1: “there is no important difference in the measures of cultural
dimensions among the main ethnic groups in Madagascar’s rural areas”.
•••• H0 of the H2: “there is no important difference in the level of perceived
desirability among the main ethnic groups in Madagascar’s rural areas”.
For hypothesis 3, it was demonstrated that the moderation effects of the
perceived desirability on the relationships between cultural dimensions and
entrepreneurial intention, concern essentially the highlander group and the
overall group, an observation, which reinforces the assumption that
Madagascar would be a one ethnic group nation. Thus, it can be suggested that
the moderation effect of perceived desirability on the relationships between
cultural dimensions and entrepreneurial intention are also not important in
Madagascar’s rural areas.
99
CHAPTER 6: CONCLUSION AND RECOMMENDATIONS
A broad conclusion of the research will open this chapter followed by the
recommendations and closed by the suggestions for further research.
6.1 Conclusion of the research
The research aimed at resolving the main problem related to the comparison of
Malagasy main ethnic groups in terms of measures of cultural dimensions and
perceived desirability with respect to entrepreneurship, and to the examination
of the moderation effects of this perceived desirability on the relations between
cultural dimensions and entrepreneurial intention.
Madagascar is facing a deceiving economic performance characterised by an
high level of poverty in its population and vigorous actions towards the
stimulation of self-employment appears to be the appropriate way to deal with
this situation. The research would be of inestimable help for political decision
makers and relevant institutions supporting local communities in pursuing their
endeavour in this matter, as it is the first of its kind in the country.
To carry out the research, the use of a non-experimental cross-sectional survey
was retained. The studied population was a sample of 2,235 adult individuals
subdivided into three sub-samples: 736 adult individuals for the coastal group,
744 adult individuals for the highlander group and 755 adult individuals for the
intermediary group. The sample was obtained through cluster sampling with a
quota approach. A structured questionnaire directly administrated by trained
interviewers was the source of data.
After entering the data on Google Drive and clearing it through Excel, SPSS 21
software was used for the processing. Then, depending on the characteristic of
the hypothesis, a one-way ANOVA (Hypotheses 1 and 2) or a multiple
regression with interaction (hypothesis 3) was performed. Those tests appeared
very robust with regard to the details of results that have been produced relative
to the main ethnic groups’ samples and the overall sample.
100
As main findings, the research revealed that there is no important difference in
the measures of cultural dimensions among the main ethnic groups in
Madagascar’s rural areas (sub-problem 1) and there is no important difference
in the level of perceived desirability among the main ethnic groups in
Madagascar’s rural areas (sub-problem 2). Finally, the relationship between
cultural dimensions and entrepreneurial intention are not importantly moderated
by perceived desirability among the main ethnic groups in Madagascar’s rural
areas (sub-problem 3).
The findings are comprehensible due to the fact that on one hand, the Malagasy
people, apart from the unicity of language, also has a common cultural
background so that, it could be considered as a country with a low ethnic
diversity even a one ethnic group country. On the other hand, the slight
differences observed in some results related to each main ethnic group were
sustained by the latent inward cultural differences, besides the perceptible
outward cultural similarities.
Moreover, the findings of the research:
•••• are in line with those of Khastar et al (2011) in their attempt to find an
intermediate method for the refinement of the Hofstede’s (1980) cultural
dimensions approach;
•••• verify the findings of Shapero and Sokol (1982) with regard to the
underpinning elements of the perceived desirability;
•••• open new horizons with regard to the moderation effects of the perceived
desirability on the relationships of cultural dimensions and
entrepreneurial intention comparatively to those of Cristina and Dwayne
(2009), Fernandez et al. (1997) and George and Prahabu (2000) who
respectively found that, to some extent, culture or national culture
moderates entrepreneurial intention; and
•••• reveal that, to some extent, the highlander group could be considered as
the ‘reference group’ of Madagascar’s rural areas with regard to
entrepreneurial initiatives.
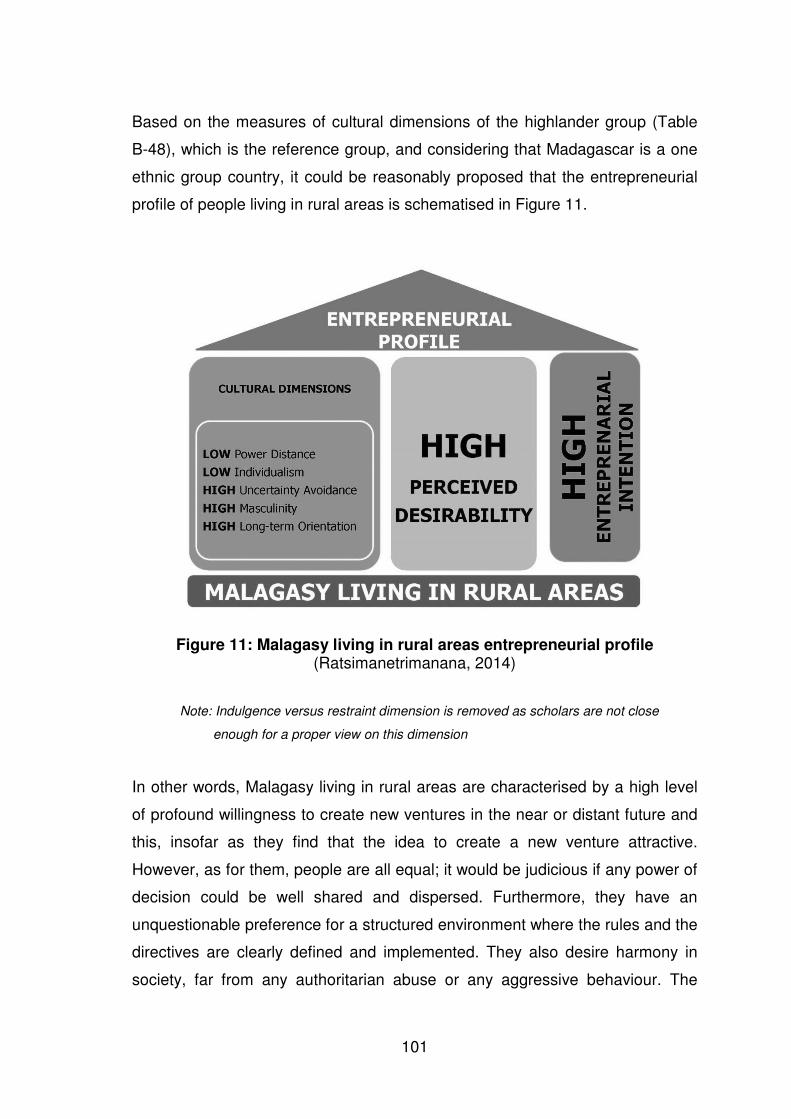
101
Based on the measures of cultural dimensions of the highlander group (Table
B-48), which is the reference group, and considering that Madagascar is a one
ethnic group country, it could be reasonably proposed that the entrepreneurial
profile of people living in rural areas is schematised in Figure 11.
Figure 11: Malagasy living in rural areas entrepreneurial profile (Ratsimanetrimanana, 2014)
Note: Indulgence versus restraint dimension is removed as scholars are not close
enough for a proper view on this dimension
In other words, Malagasy living in rural areas are characterised by a high level
of profound willingness to create new ventures in the near or distant future and
this, insofar as they find that the idea to create a new venture attractive.
However, as for them, people are all equal; it would be judicious if any power of
decision could be well shared and dispersed. Furthermore, they have an
unquestionable preference for a structured environment where the rules and the
directives are clearly defined and implemented. They also desire harmony in
society, far from any authoritarian abuse or any aggressive behaviour. The
102
collective responsibility is their trademark, the traditions their source of
inspiration and no fear of hard work, are in their point of view warranty for a
brighter future (Hofstede, et al., 2010).
On a more practical level, through the use of the table of Hofstede’s et al.
(2010) cultural dimensions and determinants of entrepreneurship (Table B-49)
developed by Bwisa and Ndolo (2011), it could be concluded that Malagasy
living in rural areas are (Table B-50):
•••• less likely to be entrepreneurs when considering the level of the
measures of the power distance dimension, the individualism versus
collectivism dimension and the uncertainty avoidance dimension; and
•••• more likely to be entrepreneurs when considering the levels of the
measures of the masculinity versus femininity dimension and the long-
term versus short-term orientation dimension.
The limitation of the research, identified as the level of poverty of the Malagasy
people that could bias spontaneous answers from the respondents, is not of any
concern. In fact, because the sampling procedure used, the findings of the
research unveil, to some extent, a snapshot of the entrepreneurial intention in
Madagascar’s rural areas.
6.2 Recommendations
As the research is a pioneering one in its kind in the context of Madagascar, it is
obvious that the findings that have been put forward would be useful in order to
clarify some questions relating to entrepreneurial initiatives at this level, as well
at the strategic and operational levels. If it is largely acknowledged that
Malagasy people experience an unacceptable level of poverty, to overcome this
concern, entrepreneurship appears to be a suitable way.
Thus, by taking into account the Malagasy entrepreneurial profile developed
above:
103
• At the strategic level, relevant Malagasy decision makers should re-
examine all strategies that have been developed with regard to the
promotion of self-employment in particular and entrepreneurship in
general. In fact, the consideration of this profile in their approach appears
to be judicious insofar as it gives useful information for the framing of
suitable strategies and thus for avoiding cut and paste strategies usual in
the developing countries whereas it is completely possible to tailor the
strategies with national realities. Moreover, a bottom up approach is
strongly advised, as it appears to be the most suitable in view of the fact
that for Malagasy the power is better when shared and well dispersed.
• At the operational level, the actors of the socio-economic development at
grassroots level, such as microfinance institutions must prioritise the
setting up of a mandatory technical backstopping structure for supporting
micro-funding beneficiaries in their will to become a successful self-
employed person or entrepreneur. Granting micro-funding is a good
starting point but to ensure the success and sustainability of the related
new ventures is more important insofar as on that lies the tangible
inversion of the curve of poverty in Madagascar. To do so, they have to
pay particular attention to the masculine culture and long-term orientation
culture of Malagasy living in rural areas when deciding the type of
enterprise development approach to be implemented for this target
population.
6.3 Suggestions for further research
As a logical continuation of that which has been achieved through this research,
it would be interesting to:
•••• Complete the knowledge of the situation in Madagascar with regard to
the entrepreneurial activities in launching the same research in the urban
areas of the country;
104
•••• Apply the theme of the research in a country characterised by a diversity
of ethnic groups such as South Africa, in order to see to what extent
cultural dimensions may differ between them and the moderation effect
of the perceived desirability on the relationships between cultural
dimensions and entrepreneurial intention;
•••• Deepen the understanding of the antecedents of entrepreneurial
intention, within the context of Madagascar, in order to better identify the
real triggers of the motivation to create new ventures so that the virtuous
circle of ‘from intention to action’ could be duly fulfilled and an adequate
toolkit for Malagasy enterprise incubation be set up.
Definitely, through this research it has been understood that in
entrepreneurship, envisioning a business idea is just the starting point, not the
final destination.
105
REFERENCES
Ajzen, I. (1991). Theory of planned behaviour. Organisational Behaviour and
Human Decision Processes, 50, p. 179-211.
Altermatt, B. (2013). Questionnaire and Survey Design. Retrieved 6 February,
2014 from
http://vault.hanover.edu/~altermattw/methods/assets/Readings/Question
naire_Design.pdf
Amselle, J. L., & M’Bokolo, E. (1985). Au Cœur de l’ethnie. Ethnies, tribalisme
et Etat en Afrique. Annales ESC, novembre – décembre, 6, pp 1407-
1452.
Andrianirina, A. (2013). La culture entrepreneuriale et la performance
industrielle. Cas des industries agroalimentaires à Madagascar. Presses
Académiques Francophones. ISBN-13: 978-3838177656.
Audet, J. (2001). Une étude des aspirations entrepreneuriales d’étudiants
universitaires québécois: seront-ils des entrepreneurs demain ? Cahier
de recherche de l’université du Québec à Trois-Rivières, département de
la science et de la gestion de l’économie, CR-01-13.
Autio, E., Keeley, R. H., Klofsten, M., Parker, G. G. C., & Hay, M. (2001).
Entrepreneurial Intent Among Students in Scandinavia and in the USA.
Enterprise and Innovation Management Studies, 2(2), p. 145-160.
Bagenda, D.,(2009). Non-Parametric Test Kruskal-Wallis. MUSPH 2009.
Retrieved 13 March, 2014 from
http://www.danstan.com/students/Kruskal_Wallis_danstan.pdf
Baskerville, R. F. (2003). Hofstede never studied culture. Accounting,
Organisations and Society, 28(1), p. 1-14.

106
Barth, F. (1969). Ethnic Groups and Boundaries: The Social Organisation of
Culture Difference. Boston: Little, Brown and Company.
Baumol, W. J. (1968). Entrepreneurship in Economic Theory. The American
Economic Review, 58(2), p. 64-71.
Beaumont, R. (2012). An introduction to Principal Component Analysis & Factor
Analysis using SPSS 19 and R (psych package). Retrieved 21 January,
2014 from
http://www.floppybunny.org/robin/web/virtualclassroom/stats/statistics2/p
ca1.pdf
Bik, O. P. G. (2010). The Behavior of Assurance Professionals: a Cross-cultural
Perspective. Groningen, Netherlands: University of Groningen.
Bogan, V., & Darity, W. (2008). Culture and entrepreneurship? African
American and immigrant self-employment in the United States. The
Journal of Socio-Economics, 37, p. 1999-2019.
Busenitz, L. W., & Lau, C. M. (1996). A Cross-Cultural Cognitive Model of New
Venture Creation. Entrepreneurship Theory and Practice. 20, p. 25-40.
Bwisa, H. M., & Ndolo, J. M., (2011). Culture as a Factor in Entrepreneurship
Development: A Case Study of the Kamba Culture of Kenya. Opinion,
1(1), p. 20-29.
Carree, M., Stel, A., Thurik, R., & Wennekers, S. (2001). Economic
development and business ownership: an analysis using data of 23
OECD countries in the period 1976-1996. Small Business Economics,
19(3), p. 271-290.
Creswell, J. W. (1994). Research design: qualitative and quantitative
approaches. Thousand Oaks, CA: Sage Publications.
Cohen, J. (1988). Statistical Power Analysis for the Behavioral Sciences (2nd
ed.). Hillsdale New Jersey: Lawrence Erlbaum Associates.
107
Cooper, D. R., & Schindler, P. S. (2011). Business Research Methods (11th
ed.). Boston: McGraw Hill International Edition.
Couleurs du Monde. (n.d.). Histoire de Madagascar: Les origines du peuple
Malgache. Accessed 27 July, 2013 from
http://couleursdumonde.org/IMG/pdf/MadaPosterHistoire.pdf
Cristina, J., & Dwayne, D. (2009). An exploratory study of competitive strategies
among hotels in small developing Caribbean state. International Journal
of Contemporary Hospitality Management, 21 (4), 491-500.
Davidsson, P. (1995). Culture, structure and regional levels of entrepreneurship,
Entrepreneurship and Regional Development, 7(1), p. 41-62.
DeCoster, J., Claypool, H. M. (2004). Data Analysis in SPSS. Retrieved 16
December, 2013 from: http://www.stat-help.com/notes.html
Del Mar, F., Shane, S., (2003). Does business planning facilitate the
development of new ventures? Strategic Management Journal, 24 (12),
p. 1165–1186.
De Vaus, D. (2002). Survey in Social Research (5th ed.). St. Leonards, NSW:
Allen & Unwin Publisher.
Dorfman, P. W., Howell, J. P. (1988). Dimensions of National Culture and
Effective Leadership Patterns: Hofstede revisited. Advances in
International Comparative Management, 3, p. 127-150.
dos Santos Góis Graça, J. M. M. (2011). Hofstede’s cultured negotiating
agents. Masters’ thesis on Cognitive Science. Universidade de Lisboa,
Lisboa.
Engelbrecht, C. (2009). Determining the construct validity of Udai Pareek’s
Locus of Control inventory. Masters’ Degree of Commerce thesis.
University of Pretoria, South Africa.

108
Eroglu, O. & Picak, M. (2011). Entrepreneurship, National Culture and Turkey.
International Journal of Business and Social Science, 2(16), p. 146-151.
European Commission. (2003). Short-term trends of EU employment growth.
Retrieved 27 July, 2013, from
http://europa.eu.int/comm/employment_social/employment_analysis/shor
t_term_trends_eu_empl_growth.pdf
Field, A. (2013). Discovering statistics using IBM SPSS STATISTICS (4th ed).
Thousand Oaks, CA: Sage Publications.
Fernandez, D. R., Carlson, D. S., Stepina L. P., & Nicholson, J. D. (1997).
Hofstede’s country classification 25 years later. Journal of Social
Psychology, 137(1), p. 43-54.
Fini, R., Grimaldi, R., Marzocchi, G. L., & Sobrero, M. (2009). The Foundation of
Entrepreneurial Intention. Copenhagen: Copenhagen Business School.
Fitzsimmons, J. R., & Douglas, E. J. (2011). Interaction between feasibility and
desirability in the formation of entrepreneurial intentions. Journal of
Business Venturing, 26, p. 431-440.
Furrer, O., Liu, B. S. C., & Sudharshan, D. (2000). The relationships between
culture and service quality perceptions basis for cross-cultural market
segmentation and resource allocation. Journal of service research, 2(4),
p. 355-371.
Gartner, W. B. (1988). Who is an Entrepreneur? Is the Wrong Question.
Entrepreneurship Theory and Practice. University of Baltimore.
Educational foundation.
Garson, G. D. (2012). Testing statistical assumptions. North Carolina State
University School of Public and International Affairs. Statistical
Associates Publishing. Blue Book Series.
109
Gelderen, M., Brand, M., Praag M., Bodewes W., Poutsma, E., & Gils, A.
(2008). Explaining entrepreneurial intention by means of the theory of
planned behaviour. Emerald Career Development International, 13(6), p.
538-559.
George, G., & Prahabu, G. (2000). Developmental financial institutions as
catalysts of entrepreneurship in emerging economies. Academy of
Management Review, 25, p. 620-630.
George, D., & Mallery, P. (2003). SPSS for Windows step by step: A simple
guide and reference. 11.0 update (4th ed.). Boston: Allyn & Bacon.
Ghemawat, P., & Reiche, S. (2011). National Cultural Differences and
Multinational Business. Globalization Note Series. Harvard Business
School
Graves, D. (1986). Corporate Culture - Diagnosis and Change: Auditing and
changing the culture of organisations. London: Frances Printer.
Guerrero, M., Rialp, J. & Urbano, D. (2008). The impact of desirability and
feasibility on entrepreneurial intention: A structural equation model.
International Entrepreneurship Management Journal, 4, p. 35–50.
Hayton, J. C., George, G., & Zahra, S. A. (2002). National Culture and
Entrepreneurship: A Review of Behavioural Research. Entrepreneurship
Theory and Practice, 26(4), p. 33-52.
Hisrich, R. D., & Peters, M.P. (2002). Entrepreneurship (5th Ed.). New York:
McGraw-Hill.
Ho. S. (2009). Multiple Regression. CPSY501. Retrieved 13 March, 2014 from
http://twu.seanho.com/09fall/cpsy501/lectures/05/05-HierRegress.pdf
Hofstede, G. (1980). Cultures consequences. Sage Publications : California.
Hofstede, G. (2001). Cultures consequences. (2nd ed.). Sage Publications:
California.
110
Hofstede, G., Hofstede, G. J., & Minkov, M. (2010). Cultures and Organisations:
Software of the Mind, (3rd ed.). Columbus, OH: McGraw Hill Professional.
Ijaz, M. Yasin, G., & Zafar, M. J. (2012). Cultural Factors Effecting
Entrepreneurial Behaviour Among Entrepreneurs: Case Study of Multan,
Pakistan. International Journal of Asian Social Science, 2(6), p. 908-917.
Instat. (2011). Enquête Permanente auprès des Ménages 2010 – Rapport
Principal. Antananarivo: Institut National de la Statistique.
Isajiw, W. W. (1992, April 2). Definition and dimensions of ethnicity: a theoretical
framework. Published in Challenges of Measuring an Ethnic World:
Science, politics and reality: Proceedings of the Joint Canada-United
States Conference on the Measurement of Ethnicity. Ottawa, Ontario,
Canada.
Jose, P. (2013). Example of Moderation. Retrieved January 22, 2014 from
http://www.victoria.ac.nz/psyc/paul-jose-
files/helpcentre/help5_moderation_example.php
Kennedy, J., Drennan, J., Renfrow, P., & Watson, B. (2003). Situational factors
and entrepreneurial intentions. Ballarat, Australia: University of Ballarat.
Khastar, H., Kalhorian, R., Khalouei, G. A., & Maleki, M. (2011). Levels of
Analysis and Hofstede's Theory of Cultural Differences: The Place of
Ethnic Culture in Organisations. International Conference on Financial
Management and Economics. Retrieved January 22, 2014 from
http://www.ipedr.com/vol11/61-W10017.pdf
Krejcie, R.V. & Morgan, D. W. (1970). Determining sample size for research
activities. Educational and Psychological Measurement, 30, p. 607-610.
Krueger, N.F. (1993). The impact of prior entrepreneurial exposure on
perceptions of new venture feasibility and desirability. Entrepreneurship
Theory and Practice, 5, p. 5-21.
111
Krueger, N.F. & Brazeal, D.V. (1994). Entrepreneurial potential and potential
entrepreneurs. Entrepreneurship Theory & Practice, 18(1), p. 91-104.
Krueger, N.F. Jr., Reilly, M.D., & Carsrud, A.L. (2000). Competing models of
entrepreneurial intention. Journal of Business Venturing, 15, p. 411-432.
Leung, K., Bhagat, R. S., Buchan, N. R., Erez, M., Gibson, C. B., 2005. Culture
and international business: recent advances and their implications for
future research. Journal of International Business Studies, 36(4), p. 357-
378.
Liñán, F. (2004). Intention-based models of entrepreneurship education. Dept.
of Applied Economics (Economía Aplicada I), University of Seville.
Retrieved on January, 22, 2014 from
http://congreso.us.es/gpyde/DOWNLOAD/a9.pdf
Liñán, F., Chen, Y. W. (2009). Development and Cross-Cultural Application of a
Specific Instrument to Measure Entrepreneurial Intention.
Entrepreneurship Theory and Practice. 33(3), p. 593-617.
Liñán, F., Nabi, G., & Krueger, N. (2012). British and Spanish Entrepreneurial
Intentions: A Comparative Study. reviSta de economía mundial, 33, p.
73-103
Lindell, M., & Arvonen, J. (1996). The Nordic management style in a European
context. International Studies of Management and Organisation, 26(3), p.
73-91.
Mada-id. (2008). Les 18 ethnies de Madagascar. Retrieved 18 July, 2013 from
http://www.madagascar-id.com/culture/les-18-ethnies-de-madagascar
McClelland, D. C. (1961). The Achieving Society. New York: Free Press.
Meyers, L. S., Gamst, G., & Guarino, A. J. (2006). Applied multivariate
research: Design and interpretation. Thousand Oaks, CA: Sage
Publications.
112
Mitchell, R. K.; Smith, B., Seawright, K. W., & Morse, E. A. (2000). Cross-
cultural cognitions and venture creation. Academy of Management
Journal, 43, p. 974-993.
Mueller, S. L., & Thomas, A. S. (2001). Culture and Entrepreneurial Potential: A
Nine Country Study of Locus of Control and Innovativeness. Journal of
Business Venturing, 16, p. 51-75.
Mungai, E. N., & Ogot, M. (2011). Ethnicity, Culture and Entrepreneurship in
Kenya. Nairobi: University of Nairobi.
Mussard, P. (n.d.). 18 ethnic Malagasy. Accessed 16 December 2013 from
http://www.patricemussard.fr/Madagascar/Culturel/Ethnies.htm
Nandy, K. (2012). Understanding and Quantifying effect sizes. Retrieved
February, 6, 2014 from
http://nursing.ucla.edu/workfiles/research/Effect%20Size%204-9-
2012.pdf
Nasif, E. G., Al-Daeaj, H., Ebrahimi, B., & Thibodeaux, M. S. (1991).
Methodological Problems in Cross-Cultural Research: An Update.
Management International Review, 31(1), p. 79-91.
Nordman, C. J., & Vaillant, J. (2012a). Inputs, gender roles or sharing norms?
Assessing the gender performance gap among informal entrepreneurs in
Madagascar. Université Paris-Dauphine, IRD, DIAL.
Nordman, C. J., Vaillant, J. (2012b). Why are female informal entrepreneurs
less successful than men? Evidence from Madagascar. Université Paris-
Dauphine, IRD, DIAL.
Olie, R. (1995). The Culture Factor in Personnel and Organisation Policies. In
A. Harzing & A. Pinnington (Eds.). International Human Resource
Management: An integrated approach, (p. 124-143). London, Sage
Publications.
113
Ramamonjisoa, J. (2003). Madagascar: des pseudo-ethnies. Antananarivo:
Université d’Antananarivo.
Rasolofoson, M.T. (2001), Logiques culturelles du comportement
entrepreneurial à Madagascar. Antananarivo: Colloque International
I.N.S.C.A.E.
Rasolonoromalaza, B.Z. (2011). Le rôle de l'entrepreneur dans les pays en
développement : Le cas des zones franches textiles malgaches. PHD
thesis. Université de La Réunion. Saint Denis, La Réunion.
Ratovonasy, M.S.M. (2012). La rivalité entre gens des hauts-plateaux et côtiers
à Madagascar. Retrieved March, 4, 2014 from
http://www.sik.no/article?117&lang=fr
Razafindrazaka, T., & de la Durantaye, C. V. (2008). Dynamique territoriale de
l’entrepreneuriat : approche comparative et cadrage conceptuel. Institut
de Recherche sur les PME. Université du Québec à Trois-Rivières.
Redpath, L. (1997). A comparison of native culture, non-native culture and new
management ideology. Revue Canadienne des Sciences de
l'Administration 14(3), p. 327-339.
Reynolds, P.D., Bygrave, W.D., & Autio, E. (2004). Global Entrepreneurship
Monitor 2003: Executive report. Wellesley, Massachusetts: Babson
College.
Robinson, P.B., Stimpson, D.V., Huefner, J.C., & Hunt, H.K., (1991). An attitude
approach to the prediction of entrepreneurship. Entrepreneurship Theory
and Practice, 15(4), p. 13-32.
Russell, D.R. (2004). The impact of national culture on the emergence of
entrepreneurship. Penn State: Harrisburg.
SASIX. (2008). Enterprise Development. Retrieved 27 July, 2013, from:
www.sasix.co.za/files/sectors/enterprise.pdf
114
Shane, S. (1993). Cultural influences on national rates of innovation, Journal of
Business Venturing, 8(1), p. 59-73.
Shapero, A. (1975). The displaced, uncomfortable entrepreneur. Psychology
Today, 9, p. 83-88.
Shapero, A., & Sokol, L. (1982). The Social Dimensions of Entrepreneurship. In
C. Kent, D. Sexton, & K. H. Vesper (eds.). The Encyclopedia of
Entrepreneurship, (p. 72-90). New Jersey: Englewood Cliffs.
Schumpeter, J.A. (1934). The Theory of Economic Development. Cambridge,
MA: Harvard University Press.
Schumpeter, J.A. (1947). Capitalism, Socialism and Democracy, (2nd ed.). New
York, Harper and Row.
Schumpeter J.A. (1965). Economic Theory and Entrepreneurial History. In:
Aitken, H.G. (Ed), Explorations in enterprise. Cambridge, MA: Harvard
University Press,
Schwartz, S.H. (1999). A Theory of Cultural Values and Some Implications for
Work. Applied Psychology, 48(1), p. 23-47.
Shuttleworth, M. (2008). Validity and Reliability. Retrieved August 06, 2013 from
http://explorable.com/validity-and-reliability
Singh, I., Prasad, T., & Raut, R. D. (2012, January 1-4). Entrepreneurial Intent –
A Review of Literature. Paper presented at the Ninth AIMS International
Conference on Management, Flame, Pune, Maharashtra, India.
Slavec, A., & Drnovesk, M. (2012). A Perspective on Scale Development in
Entrepreneurship Research. Economic and business Review, 14(1), p.
39-62.
Smith, M. (1998). Culture and organisational change. Management Accounting
76(7), p. 60-68.
115
Søndergaard, M. (1994). Hofstede's consequences: A study of reviews,
citations and replications. Organisation Studies, 15(3), p. 447-456.
Tehindrazanarivelo, E.D. (2002). L’Ethnicité a Madagascar: Mouvance et
construction. In La Nation malgache au défi de l’ethnicité – Raison-
Jourde and Randrianja. Paris, France: KHARTALA Editions.
Trading economics (n.d.). Madagascar GDP per capita. Retrieved 13 August
2013, from http://www.tradingeconomics.com/madagascar/gdp-per-
capita
Thompson, E.R. (2009). Individual Entrepreneurial Intent: Construct Clarification
and Development of an International Reliable Metric. Journal of
Entrepreneurship Theory and Practice. 33(3), p. 669-694.
Toupictionnaire (2013). La Toupie. Retrieved 27 July 2013 from
www.toupie.org/Dictionnaire
Urban, B. (2004). Understanding the moderation effect of culture and self-
efficacy on entrepreneurial intention. PHD thesis. University of Pretoria.
Urban, B. (2007). A framework for understanding the role of culture in
entrepreneurship. Acta Commercii. 7, p. 82-95.
Urban, B., Van Vuuren, J.J., & Owen, R.H. (2008). Antecedents to
entrepreneurial intention: Testing for measurement invariance for cultural
values, attitudes and self-efficacy beliefs across ethnic groups. SA
Journal of Human Resource Management. 6(1), p. 1-9.
UNDP. (2013). Human Development Report 2013. The rise of the South:
Human Progress in a Diverse World. New York: UNDP.
University of Oxford. (2013). Country Briefing: Madagascar. Oxford Poverty and
Human Development Initiative (OPHI). Oxford, University of Oxford.
Veal, A. J. (1997). Research methods for leisure and tourism. A practical guide.
London: Pitman.
116
Walle, A. H. (1997). Quantitative versus qualitative tourism research. Annals of
Tourism Research, 21(3), pp. 524-536.
Weber, M. (1948). Essay in Sociology. Translated and Edited by Gerth, H. H., &
Wright Mills, C. London: Routledge.
Welman, C., & Kruger, S. J. (2001). Research Methodology. Oxford Southern
Africa, Cape Town.
Wennekers, S. & Thurik, R. (1999). Linking entrepreneurship and economic
growth. Small Business Economics, 13(1), 27-56.
World Bank. (2013). Madagascar: Pour un dialogue sur les enjeux de
développement. Washington: World Bank
World Map Finder (n.d.). Political Map of Africa. Accessed 26 December 2013
from:
http://www.worldmapfinder.com/Map_Detail.php?MAP=63764&FN=africa
_political.gif&MW=1562&MH=1878&FS=903&FT=gif&WO=0&CE=1&CO
=0&CI=0&IT=0&LC=1&PG=1&CS=utf-
8&FU=http%3A%2F%2Fmapmaker.rutgers.edu%2F355%2Fafrica_politic
al.gif&SU=http%3A%2F%2Fmmm06g.blogspot.com%2F2008%2F12%2
Fnominal-area-choropleth-map.html
Wuensch, K. L. (2013). Standardized Effect Size Estimation: Why and How?
Retrieved on February 9, 2014 from
htpp://core.ecu.edu/psyc/Wuensch/stathelp/stahelp.htm
Yoo, B., Donthu, N., & Lenartowicz, T. (2011). Measuring Hofstede’s Five
Dimension of Culural Values at the individual level: Development and
validation of CVSCALE. Journal of International Consumer Marketing,
23(3-4), p. 193-210.
Zhao, L. (2010). Socio-Cultural Adjustment of International Students as
Expatriates in America. Masters’ Theses & Specialist Projects. Paper
228. Western Kentucky University. Bowling Green, Kentucky.
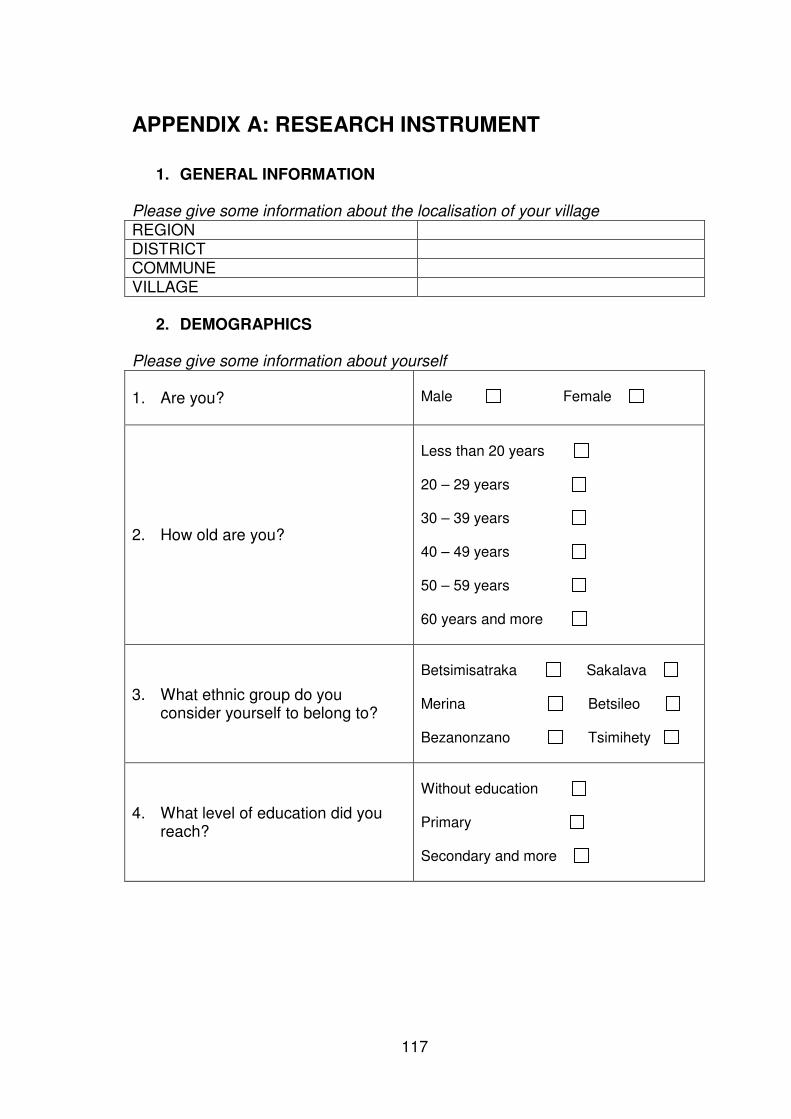
117
APPENDIX A: RESEARCH INSTRUMENT
1. GENERAL INFORMATION
Please give some information about the localisation of your village
REGION DISTRICT COMMUNE VILLAGE
2. DEMOGRAPHICS Please give some information about yourself
1. Are you? Male Female
2. How old are you?
Less than 20 years 20 – 29 years 30 – 39 years 40 – 49 years 50 – 59 years 60 years and more
3. What ethnic group do you consider yourself to belong to?
Betsimisatraka Sakalava Merina Betsileo Bezanonzano Tsimihety
4. What level of education did you reach?
Without education Primary Secondary and more
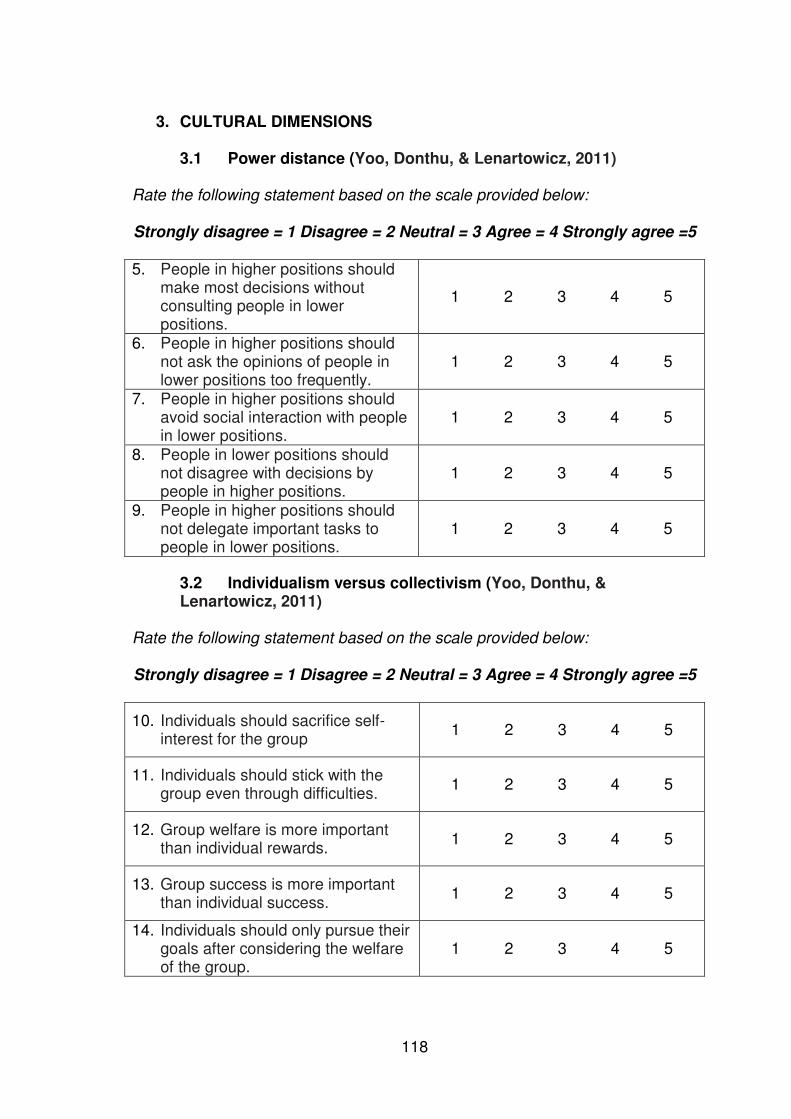
118
3. CULTURAL DIMENSIONS
3.1 Power distance (Yoo, Donthu, & Lenartowicz, 2011)
Rate the following statement based on the scale provided below: Strongly disagree = 1 Disagree = 2 Neutral = 3 Agree = 4 Strongly agree =5
5. People in higher positions should
make most decisions without consulting people in lower positions.
1 2 3 4 5
6. People in higher positions should not ask the opinions of people in lower positions too frequently.
1 2 3 4 5
7. People in higher positions should avoid social interaction with people in lower positions.
1 2 3 4 5
8. People in lower positions should not disagree with decisions by people in higher positions.
1 2 3 4 5
9. People in higher positions should not delegate important tasks to people in lower positions.
1 2 3 4 5
3.2 Individualism versus collectivism (Yoo, Donthu, & Lenartowicz, 2011)
Rate the following statement based on the scale provided below: Strongly disagree = 1 Disagree = 2 Neutral = 3 Agree = 4 Strongly agree =5
10. Individuals should sacrifice self-interest for the group
1 2 3 4 5
11. Individuals should stick with the group even through difficulties.
1 2 3 4 5
12. Group welfare is more important than individual rewards.
1 2 3 4 5
13. Group success is more important than individual success.
1 2 3 4 5
14. Individuals should only pursue their goals after considering the welfare of the group.
1 2 3 4 5
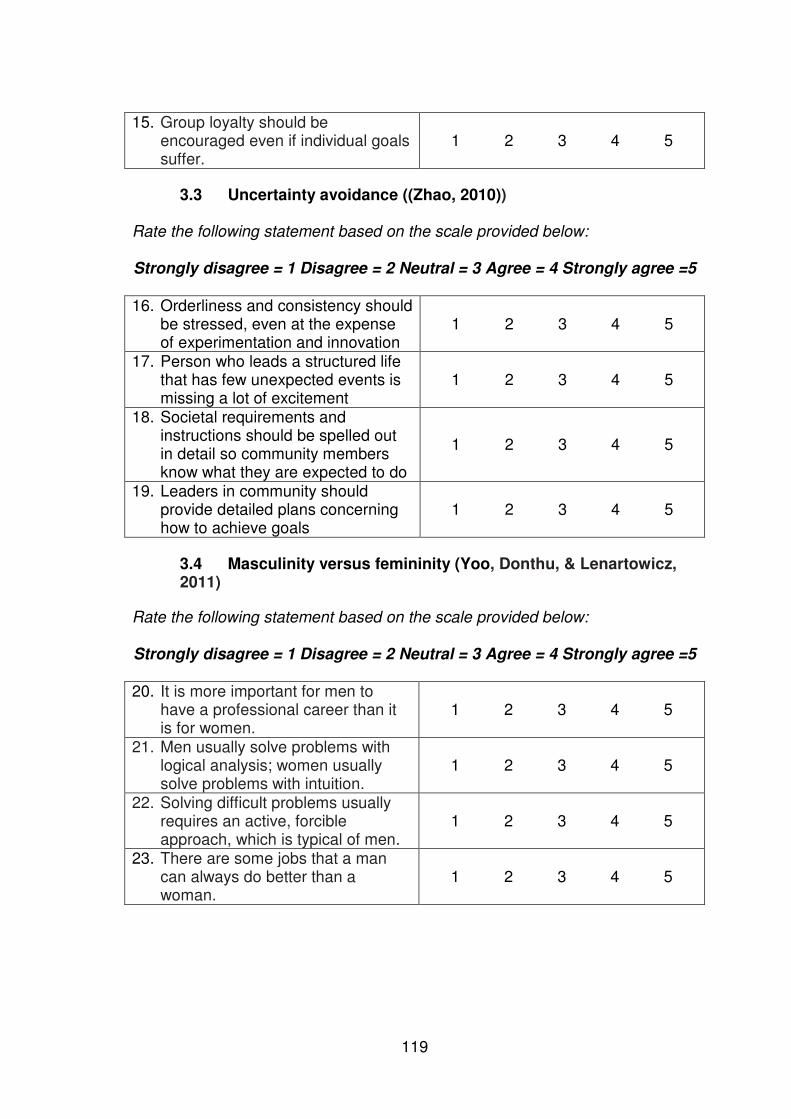
119
15. Group loyalty should be encouraged even if individual goals suffer.
1 2 3 4 5
3.3 Uncertainty avoidance ((Zhao, 2010)) Rate the following statement based on the scale provided below: Strongly disagree = 1 Disagree = 2 Neutral = 3 Agree = 4 Strongly agree =5
16. Orderliness and consistency should be stressed, even at the expense of experimentation and innovation
1 2 3 4 5
17. Person who leads a structured life that has few unexpected events is missing a lot of excitement
1 2 3 4 5
18. Societal requirements and instructions should be spelled out in detail so community members know what they are expected to do
1 2 3 4 5
19. Leaders in community should provide detailed plans concerning how to achieve goals
1 2 3 4 5
3.4 Masculinity versus femininity (Yoo, Donthu, & Lenartowicz, 2011)
Rate the following statement based on the scale provided below: Strongly disagree = 1 Disagree = 2 Neutral = 3 Agree = 4 Strongly agree =5 20. It is more important for men to
have a professional career than it is for women.
1 2 3 4 5
21. Men usually solve problems with logical analysis; women usually solve problems with intuition.
1 2 3 4 5
22. Solving difficult problems usually requires an active, forcible approach, which is typical of men.
1 2 3 4 5
23. There are some jobs that a man can always do better than a woman.
1 2 3 4 5
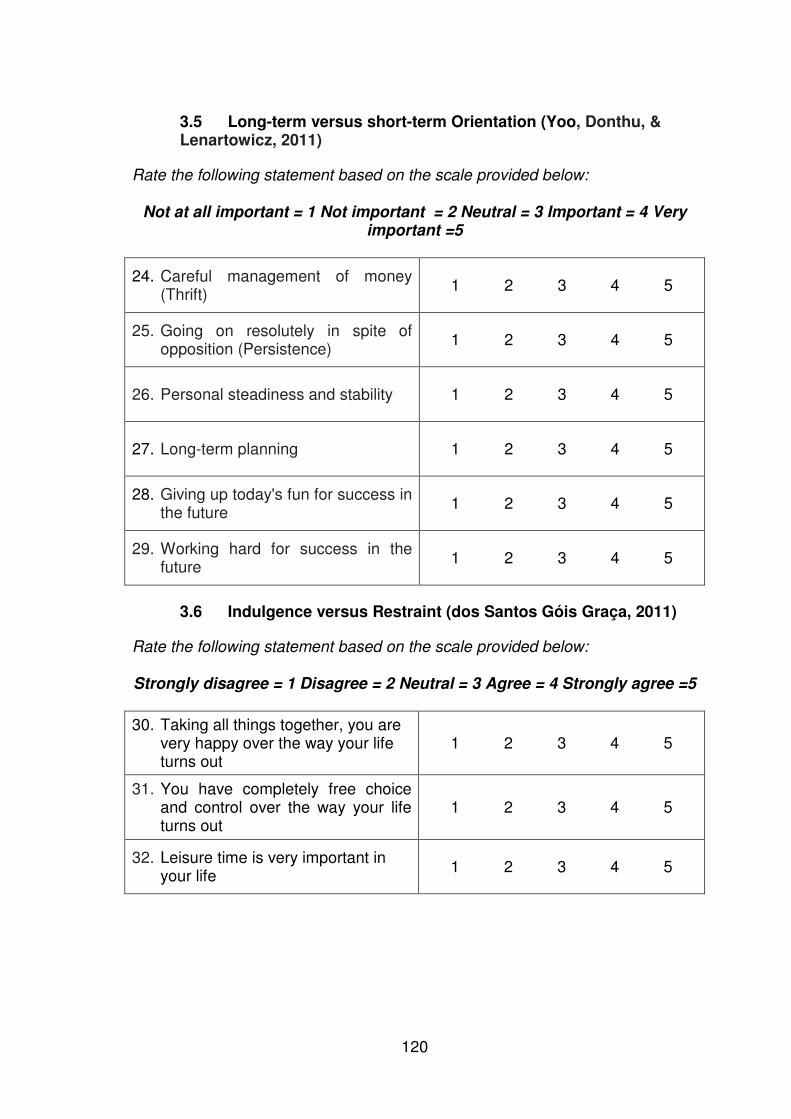
120
3.5 Long-term versus short-term Orientation (Yoo, Donthu, & Lenartowicz, 2011)
Rate the following statement based on the scale provided below:
Not at all important = 1 Not important = 2 Neutral = 3 Important = 4 Very important =5
24. Careful management of money (Thrift)
1 2 3 4 5
25. Going on resolutely in spite of opposition (Persistence)
1 2 3 4 5
26. Personal steadiness and stability 1 2 3 4 5
27. Long-term planning 1 2 3 4 5
28. Giving up today's fun for success in the future
1 2 3 4 5
29. Working hard for success in the future
1 2 3 4 5
3.6 Indulgence versus Restraint (dos Santos Góis Graça, 2011)
Rate the following statement based on the scale provided below: Strongly disagree = 1 Disagree = 2 Neutral = 3 Agree = 4 Strongly agree =5
30. Taking all things together, you are very happy over the way your life turns out
1 2 3 4 5
31. You have completely free choice and control over the way your life turns out
1 2 3 4 5
32. Leisure time is very important in your life
1 2 3 4 5
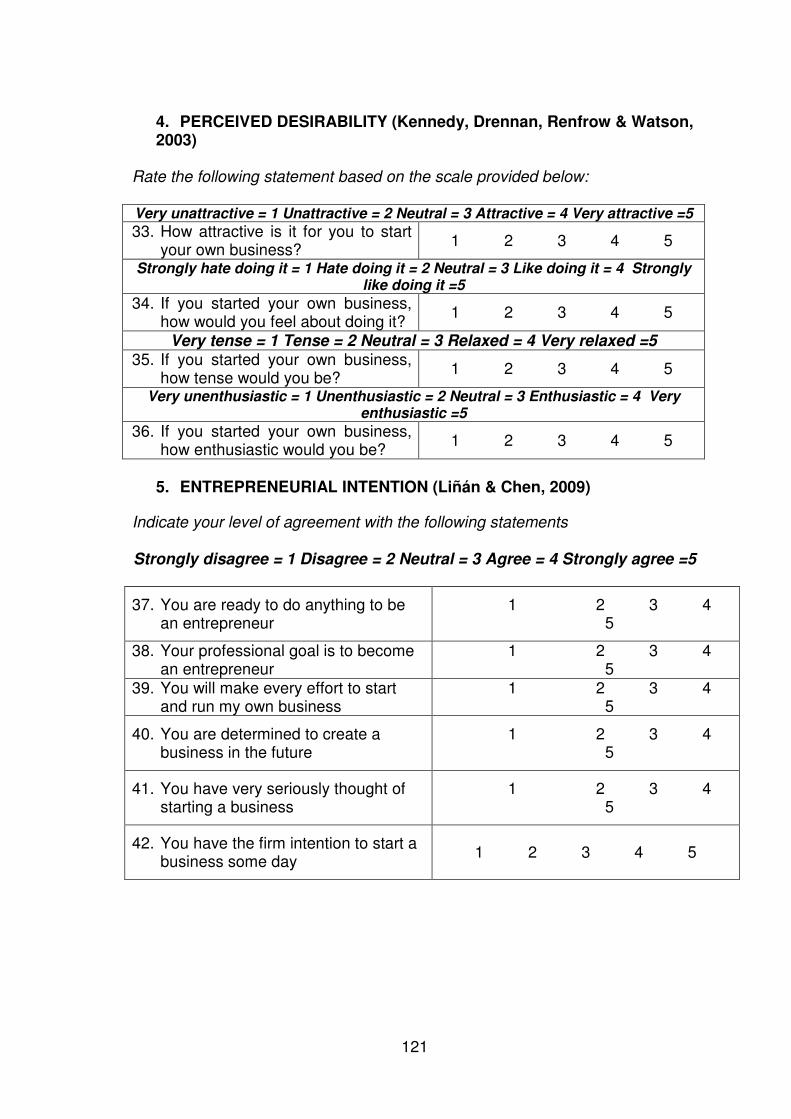
121
4. PERCEIVED DESIRABILITY (Kennedy, Drennan, Renfrow & Watson, 2003)
Rate the following statement based on the scale provided below: Very unattractive = 1 Unattractive = 2 Neutral = 3 Attractive = 4 Very attractive =5
33. How attractive is it for you to start your own business?
1 2 3 4 5
Strongly hate doing it = 1 Hate doing it = 2 Neutral = 3 Like doing it = 4 Strongly like doing it =5
34. If you started your own business, how would you feel about doing it?
1 2 3 4 5
Very tense = 1 Tense = 2 Neutral = 3 Relaxed = 4 Very relaxed =5 35. If you started your own business,
how tense would you be? 1 2 3 4 5
Very unenthusiastic = 1 Unenthusiastic = 2 Neutral = 3 Enthusiastic = 4 Very enthusiastic =5
36. If you started your own business, how enthusiastic would you be?
1 2 3 4 5
5. ENTREPRENEURIAL INTENTION (Liñán & Chen, 2009)
Indicate your level of agreement with the following statements Strongly disagree = 1 Disagree = 2 Neutral = 3 Agree = 4 Strongly agree =5
37. You are ready to do anything to be an entrepreneur
1 2 3 4 5
38. Your professional goal is to become an entrepreneur
1 2 3 4 5
39. You will make every effort to start and run my own business
1 2 3 4 5
40. You are determined to create a business in the future
1 2 3 4 5
41. You have very seriously thought of starting a business
1 2 3 4 5
42. You have the firm intention to start a business some day
1 2 3 4 5
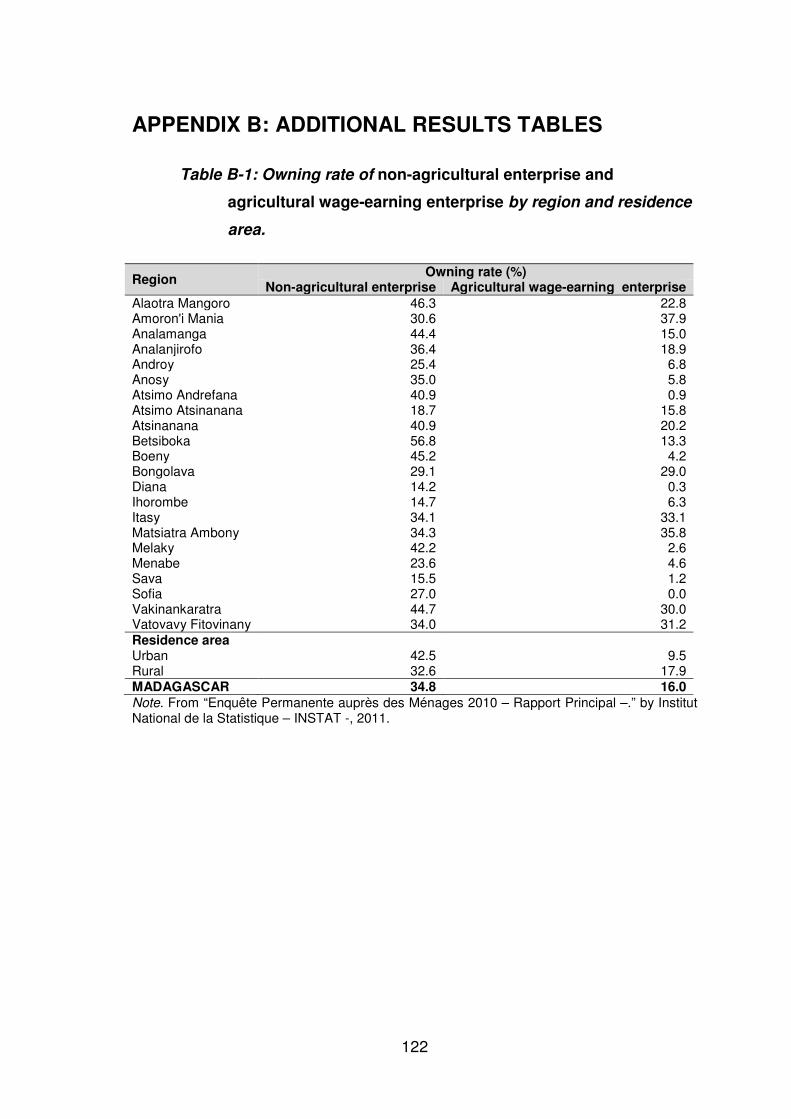
122
APPENDIX B: ADDITIONAL RESULTS TABLES
Table B-1: Owning rate of non-agricultural enterprise and
agricultural wage-earning enterprise by region and residence
area.
Region Owning rate (%)
Non-agricultural enterprise Agricultural wage-earning enterprise Alaotra Mangoro 46.3 22.8 Amoron'i Mania 30.6 37.9 Analamanga 44.4 15.0 Analanjirofo 36.4 18.9 Androy 25.4 6.8 Anosy 35.0 5.8 Atsimo Andrefana 40.9 0.9 Atsimo Atsinanana 18.7 15.8 Atsinanana 40.9 20.2 Betsiboka 56.8 13.3 Boeny 45.2 4.2 Bongolava 29.1 29.0 Diana 14.2 0.3 Ihorombe 14.7 6.3 Itasy 34.1 33.1 Matsiatra Ambony 34.3 35.8 Melaky 42.2 2.6 Menabe 23.6 4.6 Sava 15.5 1.2 Sofia 27.0 0.0 Vakinankaratra 44.7 30.0 Vatovavy Fitovinany 34.0 31.2 Residence area Urban 42.5 9.5 Rural 32.6 17.9 MADAGASCAR 34.8 16.0 Note. From “Enquête Permanente auprès des Ménages 2010 – Rapport Principal –.” by Institut National de la Statistique – INSTAT -, 2011.
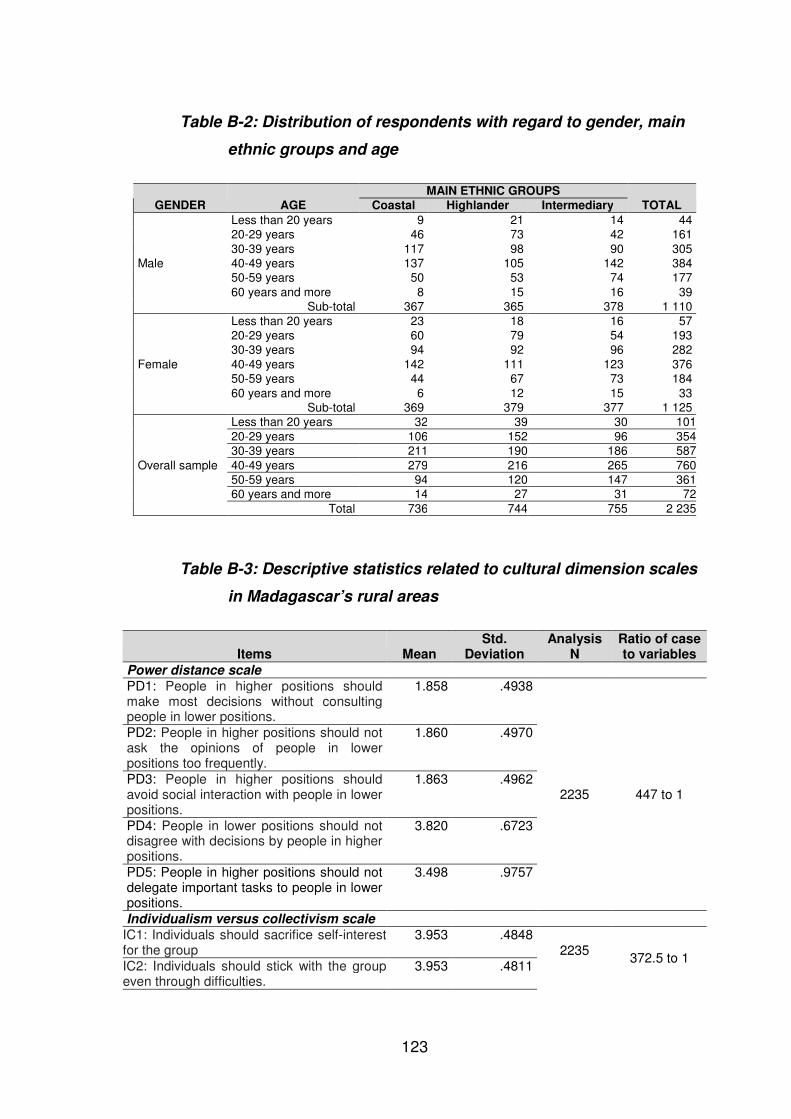
123
Table B-2: Distribution of respondents with regard to gender, main
ethnic groups and age
GENDER AGE MAIN ETHNIC GROUPS
TOTAL Coastal Highlander Intermediary
Male
Less than 20 years 9 21 14 44
20-29 years 46 73 42 161
30-39 years 117 98 90 305
40-49 years 137 105 142 384
50-59 years 50 53 74 177
60 years and more 8 15 16 39
Sub-total 367 365 378 1 110
Female
Less than 20 years 23 18 16 57
20-29 years 60 79 54 193
30-39 years 94 92 96 282
40-49 years 142 111 123 376
50-59 years 44 67 73 184
60 years and more 6 12 15 33
Sub-total 369 379 377 1 125
Overall sample
Less than 20 years 32 39 30 101
20-29 years 106 152 96 354
30-39 years 211 190 186 587
40-49 years 279 216 265 760
50-59 years 94 120 147 361
60 years and more 14 27 31 72
Total 736 744 755 2 235
Table B-3: Descriptive statistics related to cultural dimension scales
in Madagascar’s rural areas
Items Mean Std.
Deviation Analysis
N Ratio of case to variables
Power distance scale
PD1: People in higher positions should make most decisions without consulting people in lower positions.
1.858 .4938
2235 447 to 1
PD2: People in higher positions should not ask the opinions of people in lower positions too frequently.
1.860 .4970
PD3: People in higher positions should avoid social interaction with people in lower positions.
1.863 .4962
PD4: People in lower positions should not disagree with decisions by people in higher positions.
3.820 .6723
PD5: People in higher positions should not delegate important tasks to people in lower positions.
3.498 .9757
Individualism versus collectivism scale
IC1: Individuals should sacrifice self-interest for the group
3.953 .4848 2235
372.5 to 1
IC2: Individuals should stick with the group even through difficulties.
3.953 .4811
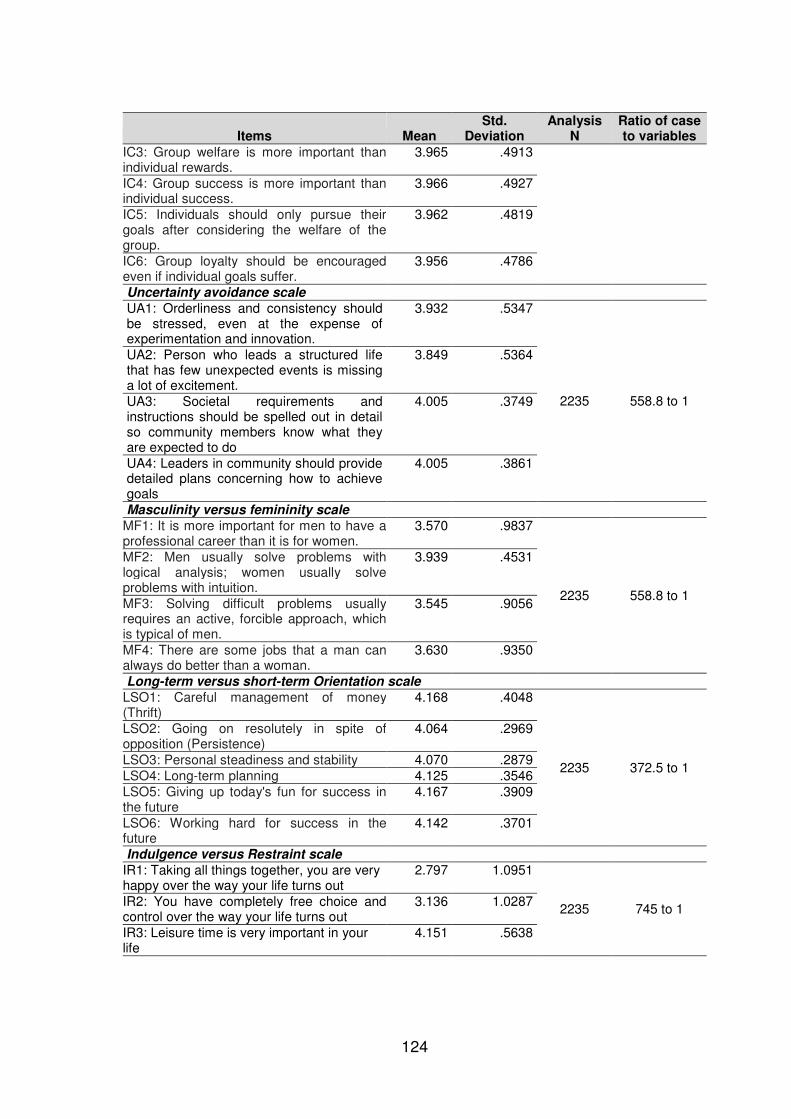
124
Items Mean Std.
Deviation Analysis
N Ratio of case to variables
IC3: Group welfare is more important than individual rewards.
3.965 .4913
IC4: Group success is more important than individual success.
3.966 .4927
IC5: Individuals should only pursue their goals after considering the welfare of the group.
3.962 .4819
IC6: Group loyalty should be encouraged even if individual goals suffer.
3.956 .4786
Uncertainty avoidance scale
UA1: Orderliness and consistency should be stressed, even at the expense of experimentation and innovation.
3.932 .5347
2235 558.8 to 1
UA2: Person who leads a structured life that has few unexpected events is missing a lot of excitement.
3.849 .5364
UA3: Societal requirements and instructions should be spelled out in detail so community members know what they are expected to do
4.005 .3749
UA4: Leaders in community should provide detailed plans concerning how to achieve goals
4.005 .3861
Masculinity versus femininity scale
MF1: It is more important for men to have a professional career than it is for women.
3.570 .9837
2235 558.8 to 1
MF2: Men usually solve problems with logical analysis; women usually solve problems with intuition.
3.939 .4531
MF3: Solving difficult problems usually requires an active, forcible approach, which is typical of men.
3.545 .9056
MF4: There are some jobs that a man can always do better than a woman.
3.630 .9350
Long-term versus short-term Orientation scale
LSO1: Careful management of money (Thrift)
4.168 .4048
2235 372.5 to 1
LSO2: Going on resolutely in spite of opposition (Persistence)
4.064 .2969
LSO3: Personal steadiness and stability 4.070 .2879
LSO4: Long-term planning 4.125 .3546
LSO5: Giving up today's fun for success in the future
4.167 .3909
LSO6: Working hard for success in the future
4.142 .3701
Indulgence versus Restraint scale
IR1: Taking all things together, you are very happy over the way your life turns out
2.797 1.0951
2235 745 to 1 IR2: You have completely free choice and control over the way your life turns out
3.136 1.0287
IR3: Leisure time is very important in your life
4.151 .5638

125
Table B-4: Power distance scale correlation matrix
PD1 PD2 PD3 PD4 PD5
PD1 1.000 .985 .892 .144 .011 PD2 .985 1.000 .888 .137 .008 PD3 .892 .888 1.000 .114 .011 PD4 .144 .137 .114 1.000 .203 PD5 .011 .008 .011 .203 1.000
Table B-5: Individualism versus collectivism scale correlation
matrix
IC1 IC2 IC3 IC4 IC5 IC6
IC1 1.000 .975 .944 .941 .947 .948 IC2 .975 1.000 .957 .952 .958 .959 IC3 .944 .957 1.000 .986 .972 .957 IC4 .941 .952 .986 1.000 .971 .956 IC5 .947 .958 .972 .971 1.000 .975 IC6 .948 .959 .957 .956 .975 1.000
Table B-6: Uncertainty avoidance scale correlation matrix
UA1 UA2 UA3 UA4
UA1 1.000 .233 .194 .407 UA2 .233 1.000 .244 .155 UA3 .194 .244 1.000 .634 UA4 .407 .155 .634 1.000
Table B-7: Masculinity versus femininity scale correlation matrix
MF1 MF2 MF3 MF4
MF1 1.000 .247 .711 .830 MF2 .247 1.000 .223 .129 MF3 .711 .223 1.000 .731 MF4 .830 .129 .731 1.000
Table B-8: Long-term versus short-term orientation scale
correlation matrix
LSO1 LSO2 LSO3 LSO4 LSO5 LSO6
LSO1 1.000 .511 .464 .533 .535 .451 LSO2 .511 1.000 .707 .452 .333 .374 LSO3 .464 .707 1.000 .519 .401 .445 LSO4 .533 .452 .519 1.000 .608 .485 LSO5 .535 .333 .401 .608 1.000 .863 LSO6 .451 .374 .445 .485 .863 1.000
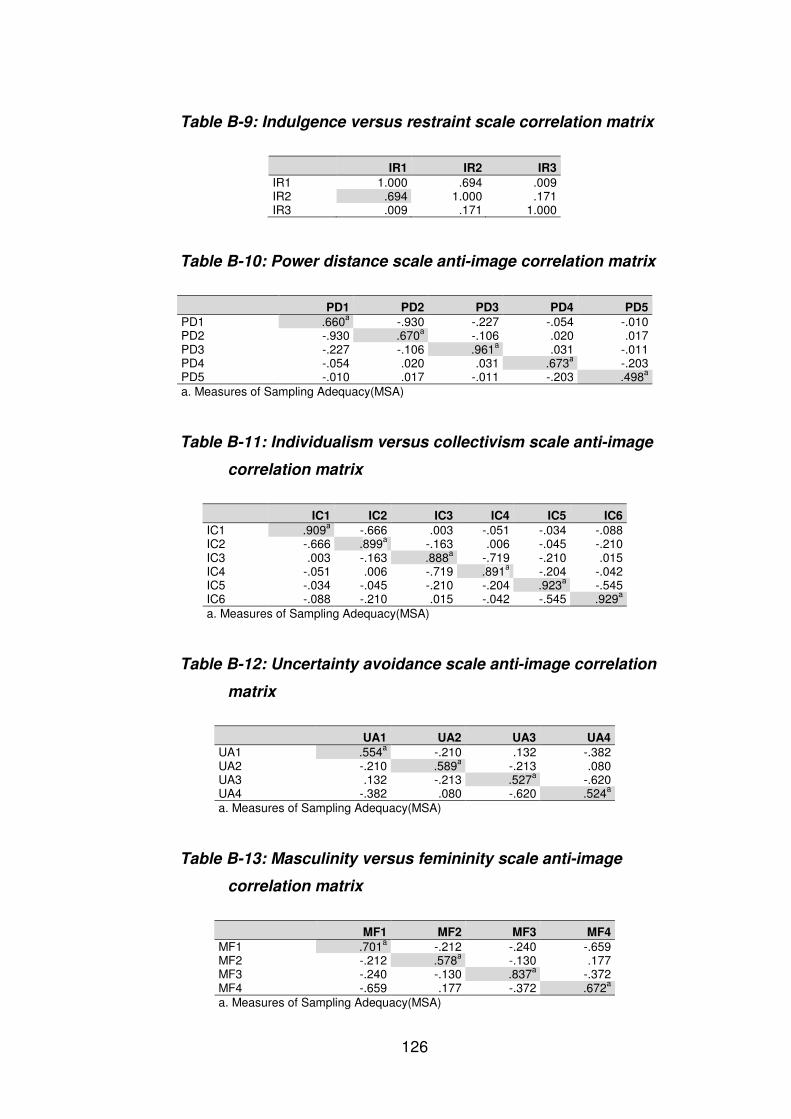
126
Table B-9: Indulgence versus restraint scale correlation matrix
IR1 IR2 IR3
IR1 1.000 .694 .009 IR2 .694 1.000 .171 IR3 .009 .171 1.000
Table B-10: Power distance scale anti-image correlation matrix
PD1 PD2 PD3 PD4 PD5
PD1 .660a -.930 -.227 -.054 -.010
PD2 -.930 .670a -.106 .020 .017
PD3 -.227 -.106 .961a .031 -.011
PD4 -.054 .020 .031 .673a -.203
PD5 -.010 .017 -.011 -.203 .498a
a. Measures of Sampling Adequacy(MSA)
Table B-11: Individualism versus collectivism scale anti-image
correlation matrix
IC1 IC2 IC3 IC4 IC5 IC6
IC1 .909a -.666 .003 -.051 -.034 -.088
IC2 -.666 .899a -.163 .006 -.045 -.210
IC3 .003 -.163 .888a -.719 -.210 .015
IC4 -.051 .006 -.719 .891a -.204 -.042
IC5 -.034 -.045 -.210 -.204 .923a -.545
IC6 -.088 -.210 .015 -.042 -.545 .929a
a. Measures of Sampling Adequacy(MSA)
Table B-12: Uncertainty avoidance scale anti-image correlation
matrix
UA1 UA2 UA3 UA4
UA1 .554a -.210 .132 -.382
UA2 -.210 .589a -.213 .080
UA3 .132 -.213 .527a -.620
UA4 -.382 .080 -.620 .524a
a. Measures of Sampling Adequacy(MSA)
Table B-13: Masculinity versus femininity scale anti-image
correlation matrix
MF1 MF2 MF3 MF4
MF1 .701a -.212 -.240 -.659
MF2 -.212 .578a -.130 .177
MF3 -.240 -.130 .837a -.372
MF4 -.659 .177 -.372 .672a
a. Measures of Sampling Adequacy(MSA)

127
Table B-14: Long-term versus short-term orientation scale anti-
image correlation matrix
LSO1 LSO2 LSO3 LSO4 LSO5 LSO6
LSO1 .876a -.278 -.037 -.169 -.248 .089
LSO2 -.278 .742a -.558 -.077 .129 -.103
LSO3 -.037 -.558 .767a -.240 .091 -.172
LSO4 -.169 -.077 -.240 .830a -.389 .186
LSO5 -.248 .129 .091 -.389 .650a -.814
LSO6 .089 -.103 -.172 .186 -.814 .671a
a. Measures of Sampling Adequacy(MSA)
Table B-15: Indulgence versus restraint scale anti-image correlation
matrix
IR1 IR2 IR3
IR1 .482a -.703 .155
IR2 -.703 .483a -.229
IR3 .155 -.229 .278a
a. Measures of Sampling Adequacy(MSA)
Table B-16: Communalities of power distance scale
Item Extraction
PD1 .971 PD2 .968 PD3 .901 PD4 .585 PD5 .633
Table B-17: Revised communalities of power distance scale
Item Extraction
PD1 .972 PD2 .969 PD3 .904
Table B-18: Communalities of individualism versus collectivism
scale
Item Extraction
IC1 .952 IC2 .967 IC3 .972 IC4 .969 IC5 .974 IC6 .965
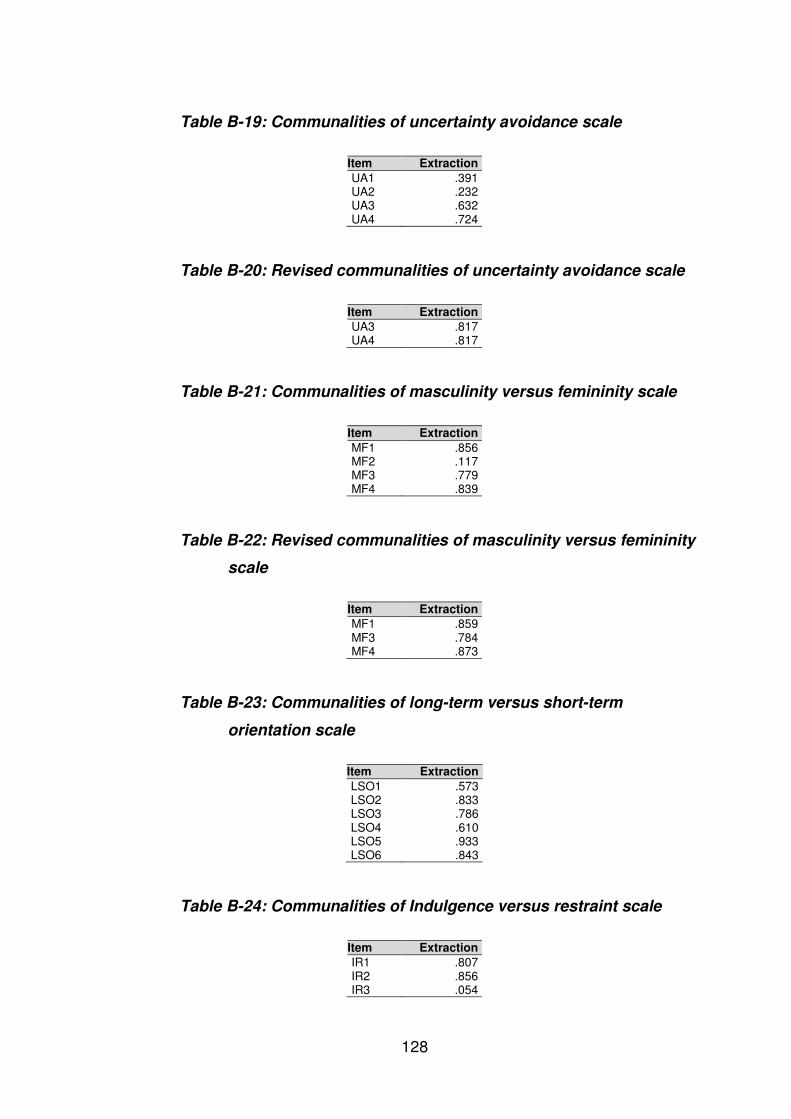
128
Table B-19: Communalities of uncertainty avoidance scale
Item Extraction
UA1 .391 UA2 .232 UA3 .632 UA4 .724
Table B-20: Revised communalities of uncertainty avoidance scale
Item Extraction
UA3 .817 UA4 .817
Table B-21: Communalities of masculinity versus femininity scale
Item Extraction
MF1 .856 MF2 .117 MF3 .779 MF4 .839
Table B-22: Revised communalities of masculinity versus femininity
scale
Item Extraction
MF1 .859 MF3 .784 MF4 .873
Table B-23: Communalities of long-term versus short-term
orientation scale
Item Extraction
LSO1 .573 LSO2 .833 LSO3 .786 LSO4 .610 LSO5 .933 LSO6 .843
Table B-24: Communalities of Indulgence versus restraint scale
Item Extraction
IR1 .807 IR2 .856 IR3 .054
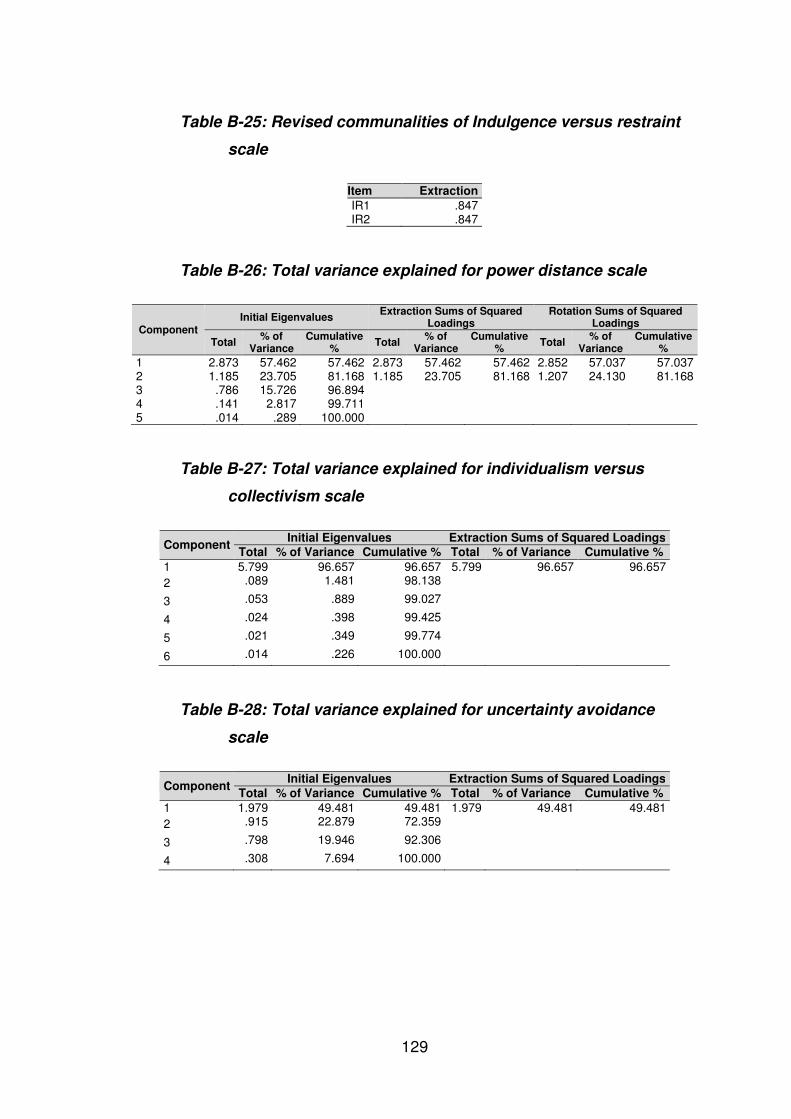
129
Table B-25: Revised communalities of Indulgence versus restraint
scale
Item Extraction
IR1 .847 IR2 .847
Table B-26: Total variance explained for power distance scale
Component Initial Eigenvalues
Extraction Sums of Squared Loadings
Rotation Sums of Squared Loadings
Total % of
Variance Cumulative
% Total
% of Variance
Cumulative %
Total % of
Variance Cumulative
%
1 2.873 57.462 57.462 2.873 57.462 57.462 2.852 57.037 57.037 2 1.185 23.705 81.168 1.185 23.705 81.168 1.207 24.130 81.168 3 .786 15.726 96.894 4 .141 2.817 99.711 5 .014 .289 100.000
Table B-27: Total variance explained for individualism versus
collectivism scale
Component Initial Eigenvalues Extraction Sums of Squared Loadings
Total % of Variance Cumulative % Total % of Variance Cumulative %
1 5.799 96.657 96.657 5.799 96.657 96.657
2 .089 1.481 98.138 3 .053 .889 99.027 4 .024 .398 99.425 5 .021 .349 99.774 6 .014 .226 100.000
Table B-28: Total variance explained for uncertainty avoidance
scale
Component Initial Eigenvalues Extraction Sums of Squared Loadings
Total % of Variance Cumulative % Total % of Variance Cumulative %
1 1.979 49.481 49.481 1.979 49.481 49.481
2 .915 22.879 72.359 3 .798 19.946 92.306 4 .308 7.694 100.000
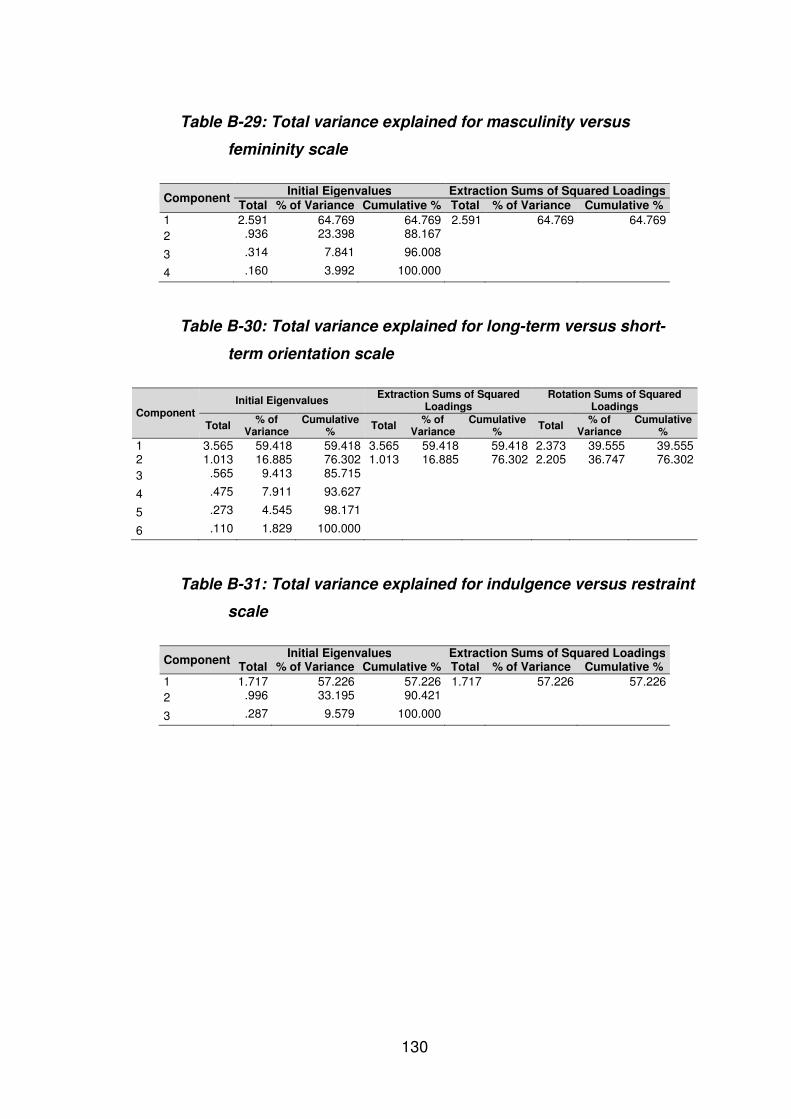
130
Table B-29: Total variance explained for masculinity versus
femininity scale
Component Initial Eigenvalues Extraction Sums of Squared Loadings
Total % of Variance Cumulative % Total % of Variance Cumulative %
1 2.591 64.769 64.769 2.591 64.769 64.769
2 .936 23.398 88.167 3 .314 7.841 96.008 4 .160 3.992 100.000
Table B-30: Total variance explained for long-term versus short-
term orientation scale
Component Initial Eigenvalues
Extraction Sums of Squared Loadings
Rotation Sums of Squared Loadings
Total % of
Variance Cumulative
% Total
% of Variance
Cumulative %
Total % of
Variance Cumulative
%
1 3.565 59.418 59.418 3.565 59.418 59.418 2.373 39.555 39.555 2 1.013 16.885 76.302 1.013 16.885 76.302 2.205 36.747 76.302
3 .565 9.413 85.715 4 .475 7.911 93.627 5 .273 4.545 98.171 6 .110 1.829 100.000
Table B-31: Total variance explained for indulgence versus restraint
scale
Component Initial Eigenvalues Extraction Sums of Squared Loadings
Total % of Variance Cumulative % Total % of Variance Cumulative %
1 1.717 57.226 57.226 1.717 57.226 57.226
2 .996 33.195 90.421 3 .287 9.579 100.000
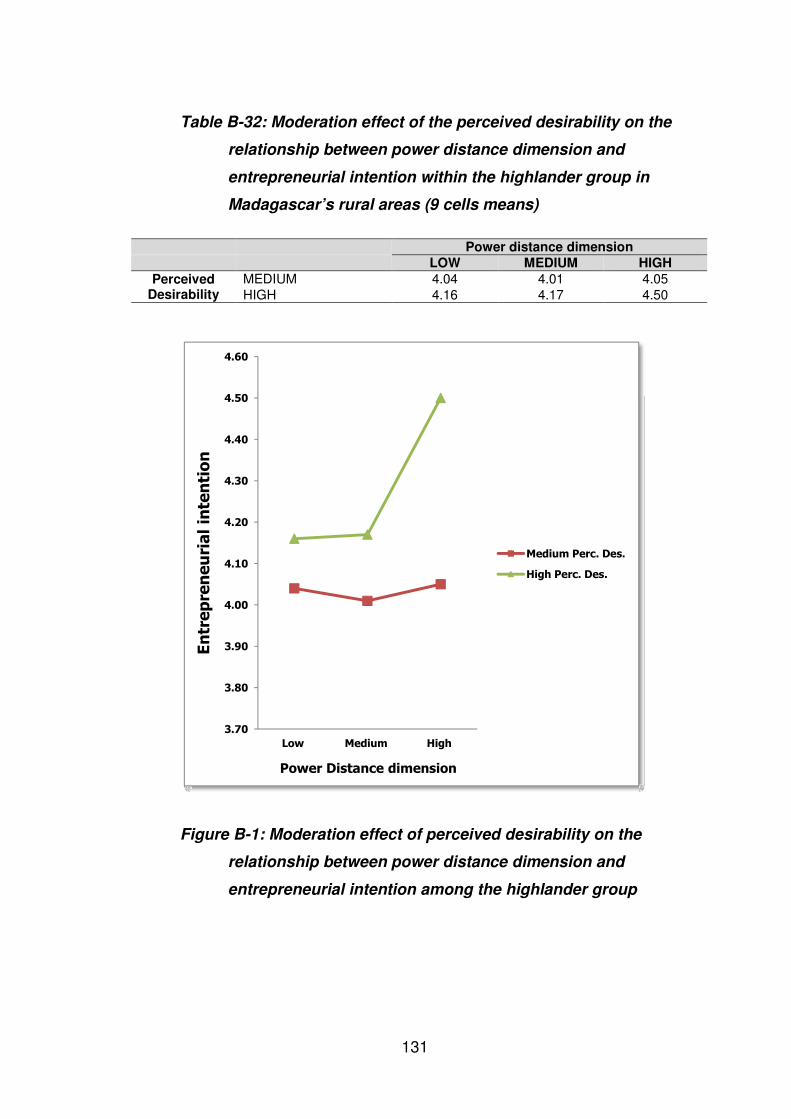
131
Table B-32: Moderation effect of the perceived desirability on the
relationship between power distance dimension and
entrepreneurial intention within the highlander group in
Madagascar’s rural areas (9 cells means)
Power distance dimension
LOW MEDIUM HIGH
Perceived Desirability
MEDIUM 4.04 4.01 4.05
HIGH 4.16 4.17 4.50
Figure B-1: Moderation effect of perceived desirability on the
relationship between power distance dimension and
entrepreneurial intention among the highlander group
3.70
3.80
3.90
4.00
4.10
4.20
4.30
4.40
4.50
4.60
Low Medium High
Entrepreneurial intention
Power Distance dimension
Medium Perc. Des.
High Perc. Des.
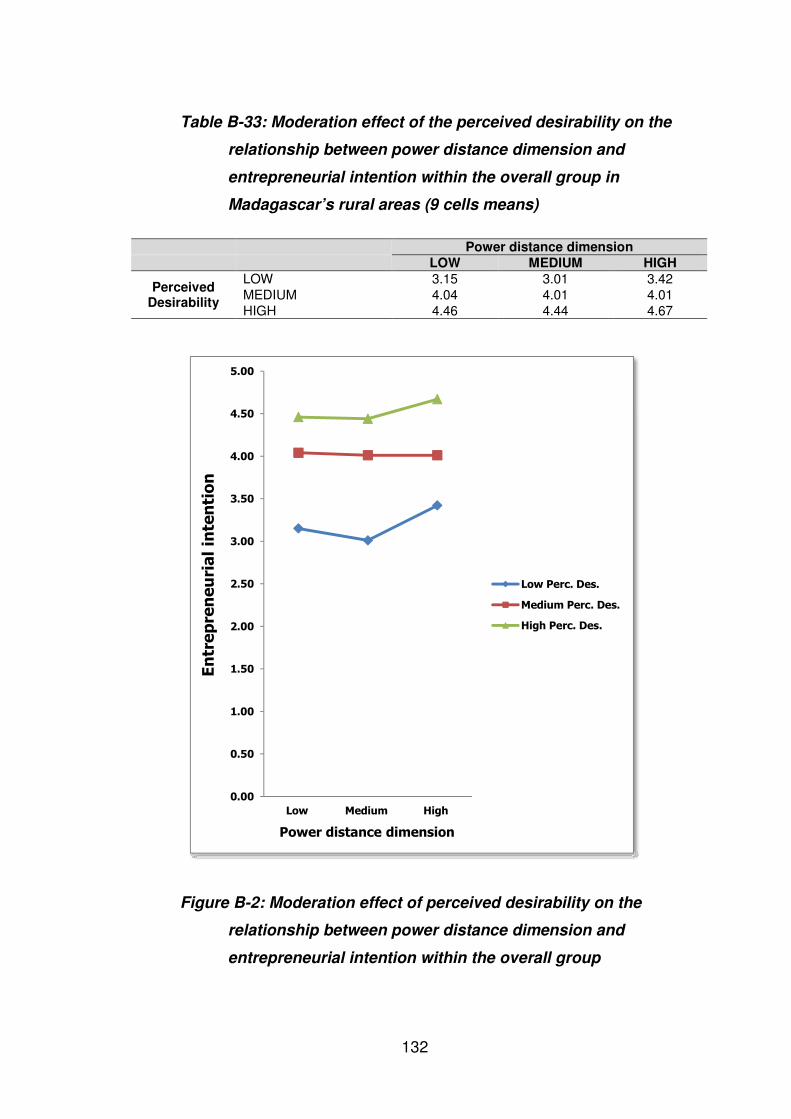
132
Table B-33: Moderation effect of the perceived desirability on the
relationship between power distance dimension and
entrepreneurial intention within the overall group in
Madagascar’s rural areas (9 cells means)
Power distance dimension
LOW MEDIUM HIGH
Perceived Desirability
LOW 3.15 3.01 3.42
MEDIUM 4.04 4.01 4.01
HIGH 4.46 4.44 4.67
Figure B-2: Moderation effect of perceived desirability on the
relationship between power distance dimension and
entrepreneurial intention within the overall group
0.00
0.50
1.00
1.50
2.00
2.50
3.00
3.50
4.00
4.50
5.00
Low Medium High
Entrepreneurial intention
Power distance dimension
Low Perc. Des.
Medium Perc. Des.
High Perc. Des.
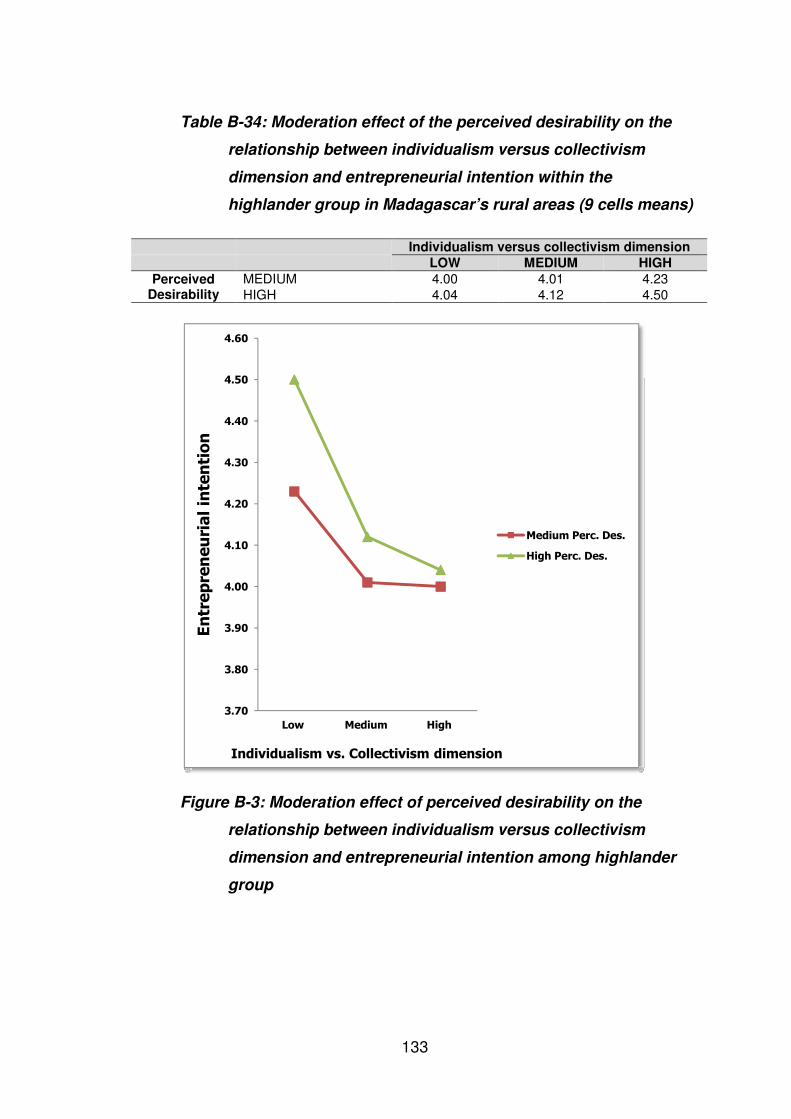
133
Table B-34: Moderation effect of the perceived desirability on the
relationship between individualism versus collectivism
dimension and entrepreneurial intention within the
highlander group in Madagascar’s rural areas (9 cells means)
Individualism versus collectivism dimension
LOW MEDIUM HIGH
Perceived Desirability
MEDIUM 4.00 4.01 4.23
HIGH 4.04 4.12 4.50
Figure B-3: Moderation effect of perceived desirability on the
relationship between individualism versus collectivism
dimension and entrepreneurial intention among highlander
group
3.70
3.80
3.90
4.00
4.10
4.20
4.30
4.40
4.50
4.60
Low Medium High
Entrepreneurial intention
Individualism vs. Collectivism dimension
Medium Perc. Des.
High Perc. Des.
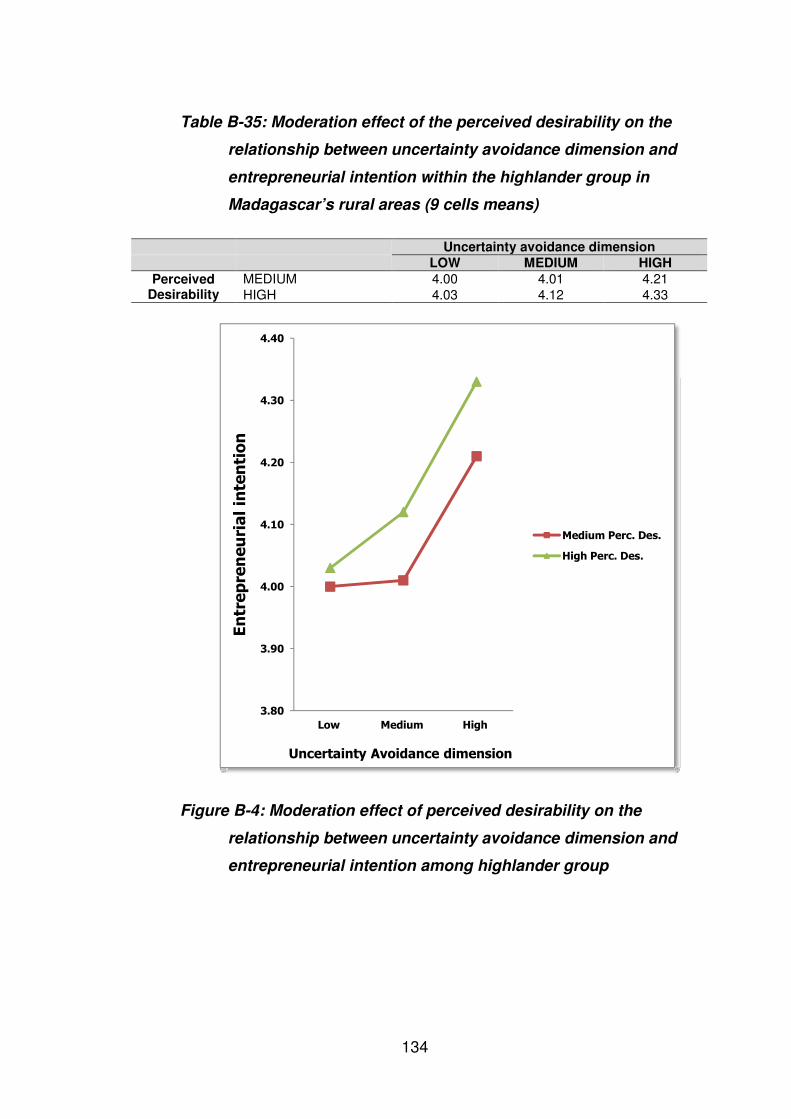
134
Table B-35: Moderation effect of the perceived desirability on the
relationship between uncertainty avoidance dimension and
entrepreneurial intention within the highlander group in
Madagascar’s rural areas (9 cells means)
Uncertainty avoidance dimension
LOW MEDIUM HIGH
Perceived Desirability
MEDIUM 4.00 4.01 4.21
HIGH 4.03 4.12 4.33
Figure B-4: Moderation effect of perceived desirability on the
relationship between uncertainty avoidance dimension and
entrepreneurial intention among highlander group
3.80
3.90
4.00
4.10
4.20
4.30
4.40
Low Medium High
Entrepreneurial intention
Uncertainty Avoidance dimension
Medium Perc. Des.
High Perc. Des.
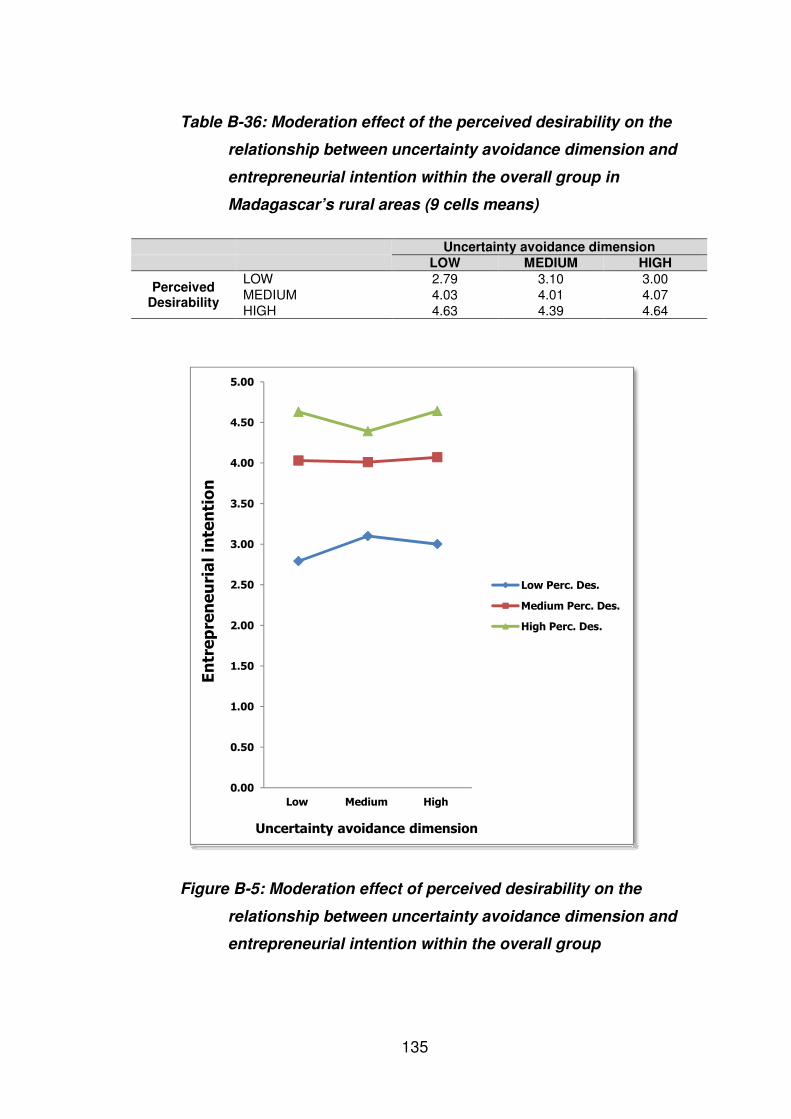
135
Table B-36: Moderation effect of the perceived desirability on the
relationship between uncertainty avoidance dimension and
entrepreneurial intention within the overall group in
Madagascar’s rural areas (9 cells means)
Uncertainty avoidance dimension
LOW MEDIUM HIGH
Perceived Desirability
LOW 2.79 3.10 3.00
MEDIUM 4.03 4.01 4.07
HIGH 4.63 4.39 4.64
Figure B-5: Moderation effect of perceived desirability on the
relationship between uncertainty avoidance dimension and
entrepreneurial intention within the overall group
0.00
0.50
1.00
1.50
2.00
2.50
3.00
3.50
4.00
4.50
5.00
Low Medium High
Entrepreneurial intention
Uncertainty avoidance dimension
Low Perc. Des.
Medium Perc. Des.
High Perc. Des.
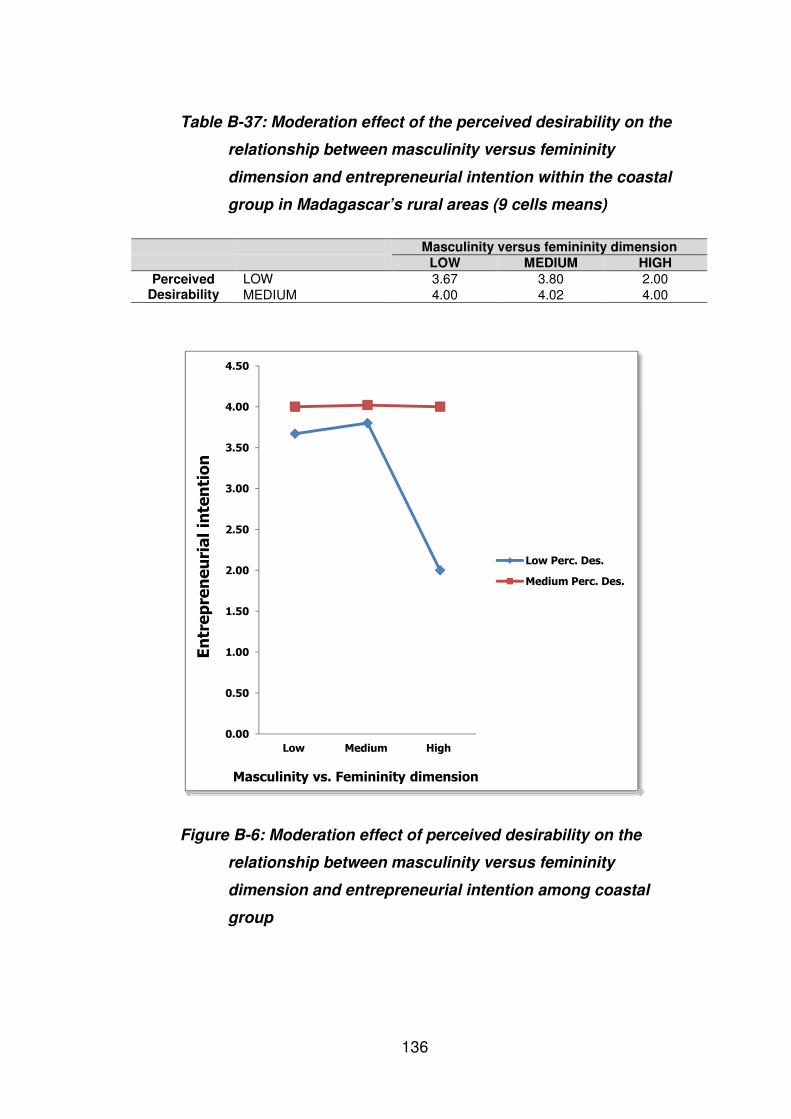
136
Table B-37: Moderation effect of the perceived desirability on the
relationship between masculinity versus femininity
dimension and entrepreneurial intention within the coastal
group in Madagascar’s rural areas (9 cells means)
Masculinity versus femininity dimension
LOW MEDIUM HIGH
Perceived Desirability
LOW 3.67 3.80 2.00
MEDIUM 4.00 4.02 4.00
Figure B-6: Moderation effect of perceived desirability on the
relationship between masculinity versus femininity
dimension and entrepreneurial intention among coastal
group
0.00
0.50
1.00
1.50
2.00
2.50
3.00
3.50
4.00
4.50
Low Medium High
Entrepreneurial intention
Masculinity vs. Femininity dimension
Low Perc. Des.
Medium Perc. Des.
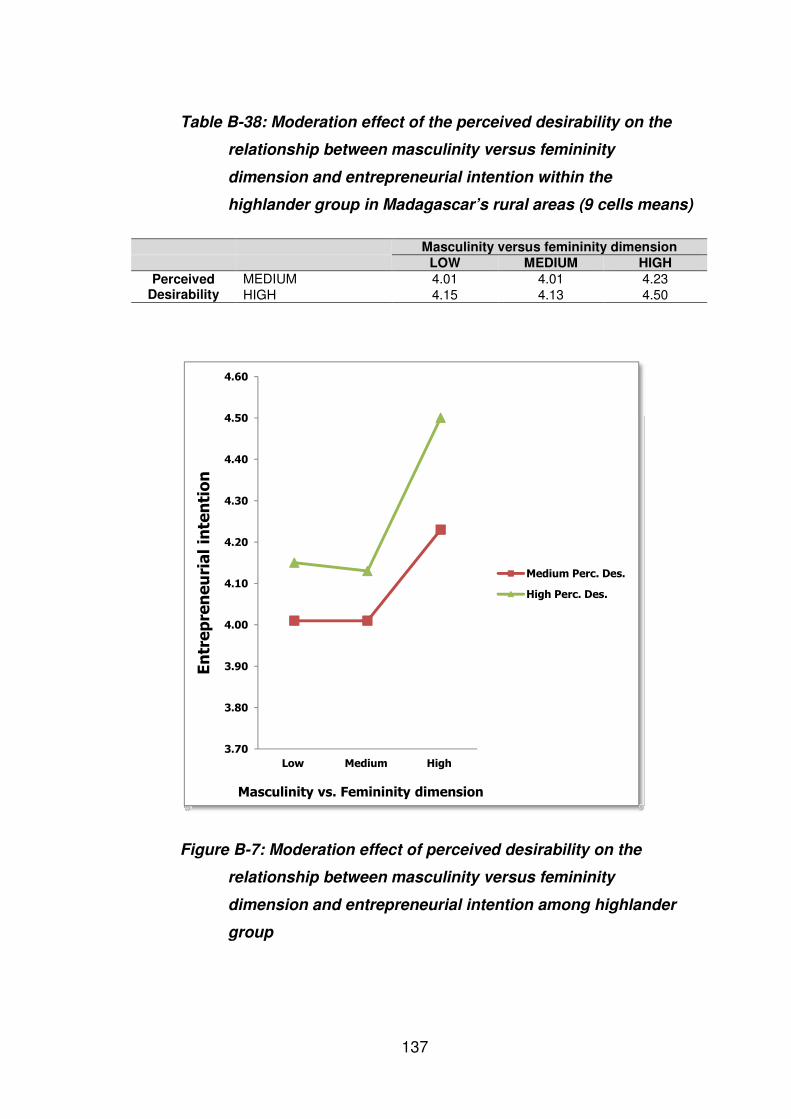
137
Table B-38: Moderation effect of the perceived desirability on the
relationship between masculinity versus femininity
dimension and entrepreneurial intention within the
highlander group in Madagascar’s rural areas (9 cells means)
Masculinity versus femininity dimension
LOW MEDIUM HIGH
Perceived Desirability
MEDIUM 4.01 4.01 4.23
HIGH 4.15 4.13 4.50
Figure B-7: Moderation effect of perceived desirability on the
relationship between masculinity versus femininity
dimension and entrepreneurial intention among highlander
group
3.70
3.80
3.90
4.00
4.10
4.20
4.30
4.40
4.50
4.60
Low Medium High
Entrepreneurial intention
Masculinity vs. Femininity dimension
Medium Perc. Des.
High Perc. Des.
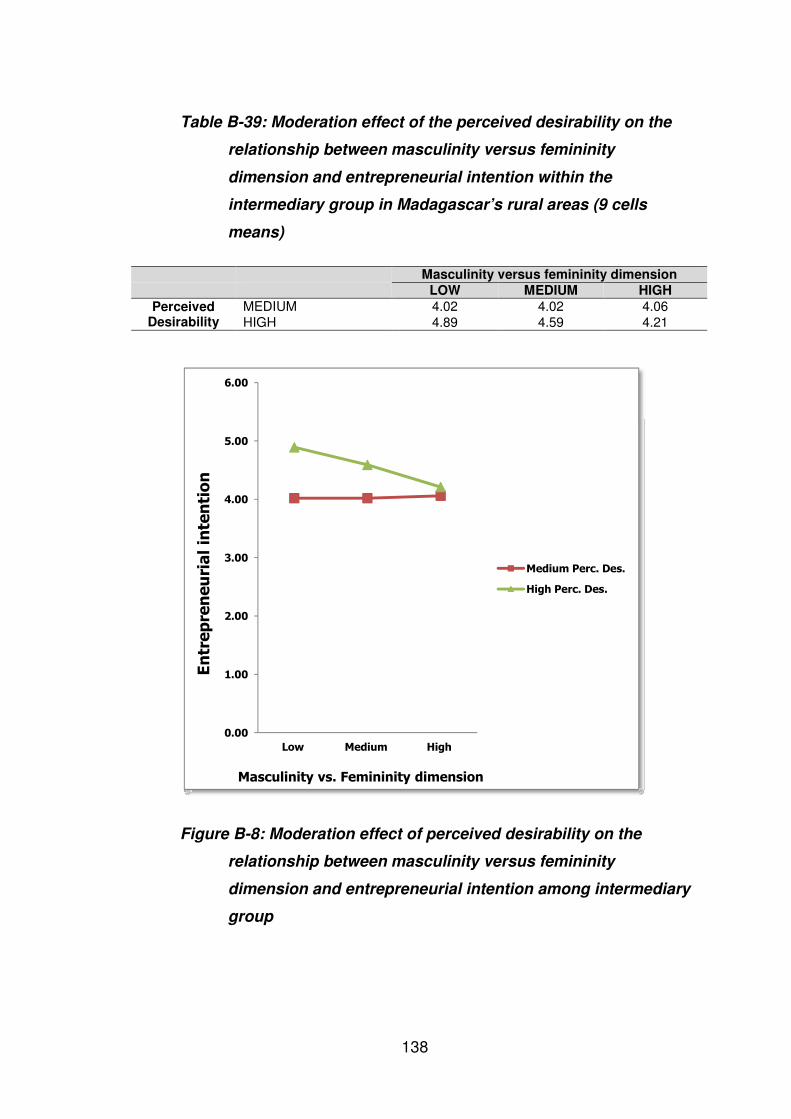
138
Table B-39: Moderation effect of the perceived desirability on the
relationship between masculinity versus femininity
dimension and entrepreneurial intention within the
intermediary group in Madagascar’s rural areas (9 cells
means)
Masculinity versus femininity dimension
LOW MEDIUM HIGH
Perceived Desirability
MEDIUM 4.02 4.02 4.06
HIGH 4.89 4.59 4.21
Figure B-8: Moderation effect of perceived desirability on the
relationship between masculinity versus femininity
dimension and entrepreneurial intention among intermediary
group
0.00
1.00
2.00
3.00
4.00
5.00
6.00
Low Medium High
Entrepreneurial intention
Masculinity vs. Femininity dimension
Medium Perc. Des.
High Perc. Des.
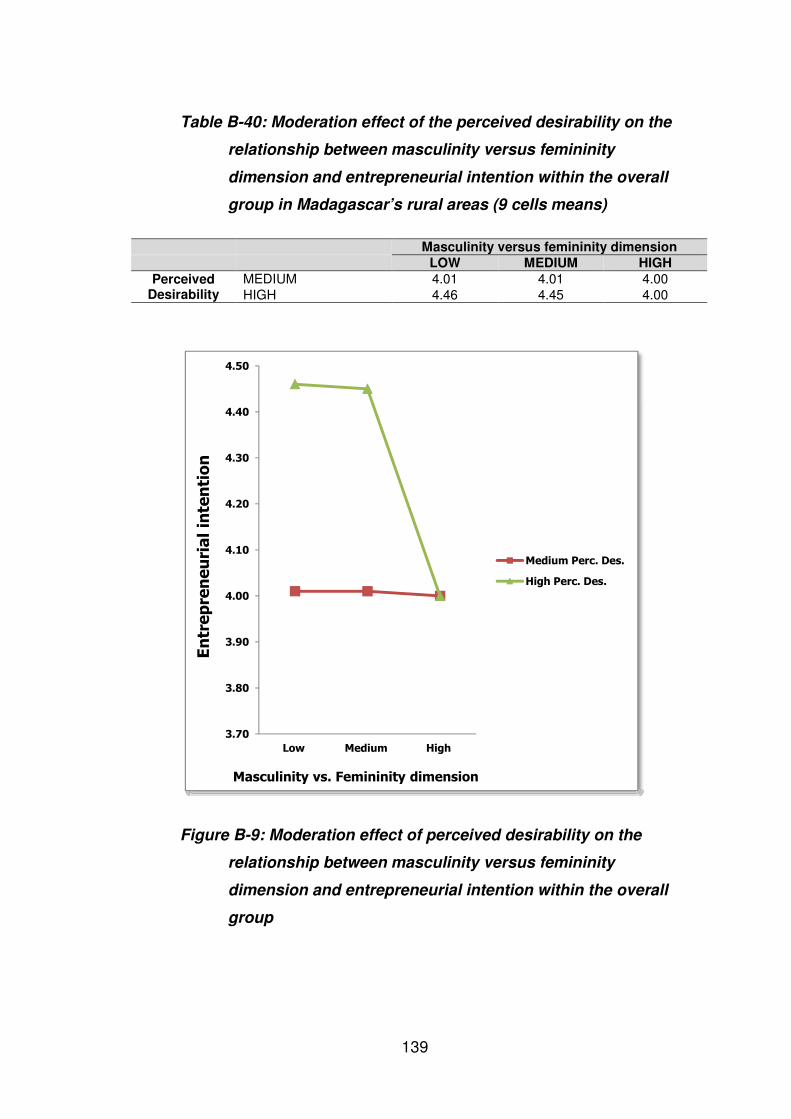
139
Table B-40: Moderation effect of the perceived desirability on the
relationship between masculinity versus femininity
dimension and entrepreneurial intention within the overall
group in Madagascar’s rural areas (9 cells means)
Masculinity versus femininity dimension
LOW MEDIUM HIGH
Perceived Desirability
MEDIUM 4.01 4.01 4.00
HIGH 4.46 4.45 4.00
Figure B-9: Moderation effect of perceived desirability on the
relationship between masculinity versus femininity
dimension and entrepreneurial intention within the overall
group
3.70
3.80
3.90
4.00
4.10
4.20
4.30
4.40
4.50
Low Medium High
Entrepreneurial intention
Masculinity vs. Femininity dimension
Medium Perc. Des.
High Perc. Des.
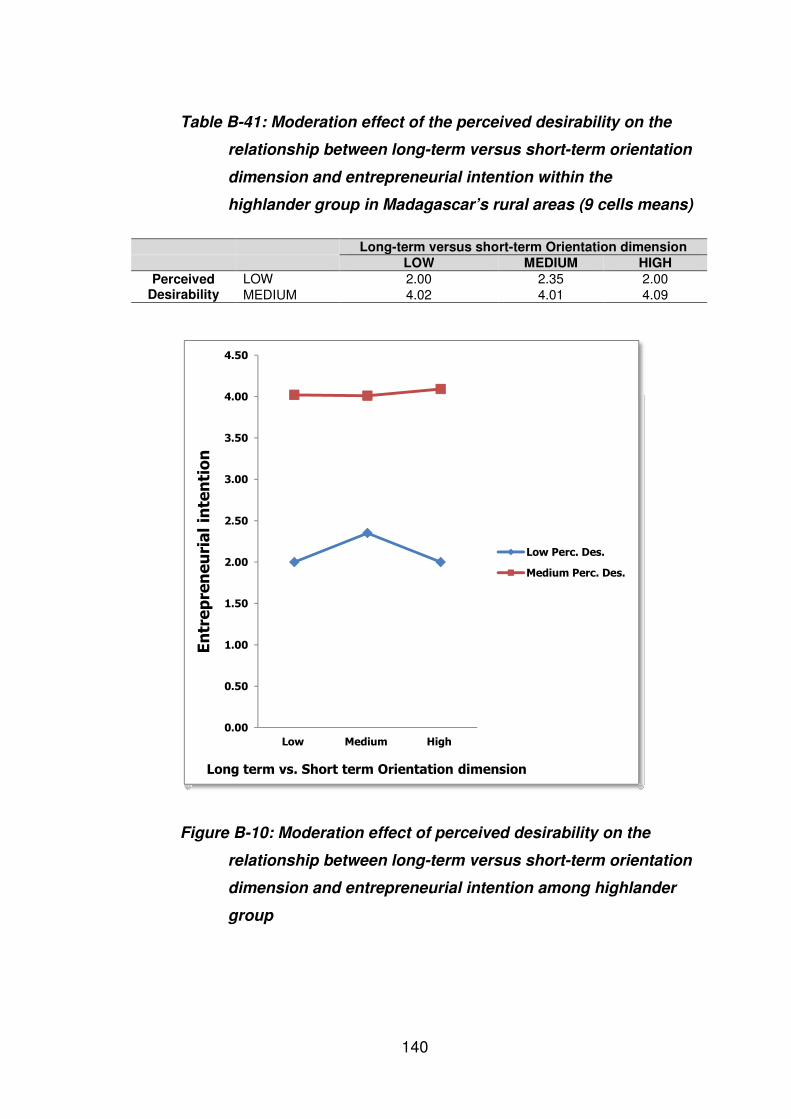
140
Table B-41: Moderation effect of the perceived desirability on the
relationship between long-term versus short-term orientation
dimension and entrepreneurial intention within the
highlander group in Madagascar’s rural areas (9 cells means)
Long-term versus short-term Orientation dimension
LOW MEDIUM HIGH
Perceived Desirability
LOW 2.00 2.35 2.00
MEDIUM 4.02 4.01 4.09
Figure B-10: Moderation effect of perceived desirability on the
relationship between long-term versus short-term orientation
dimension and entrepreneurial intention among highlander
group
0.00
0.50
1.00
1.50
2.00
2.50
3.00
3.50
4.00
4.50
Low Medium High
Entrepreneurial intention
Long term vs. Short term Orientation dimension
Low Perc. Des.
Medium Perc. Des.
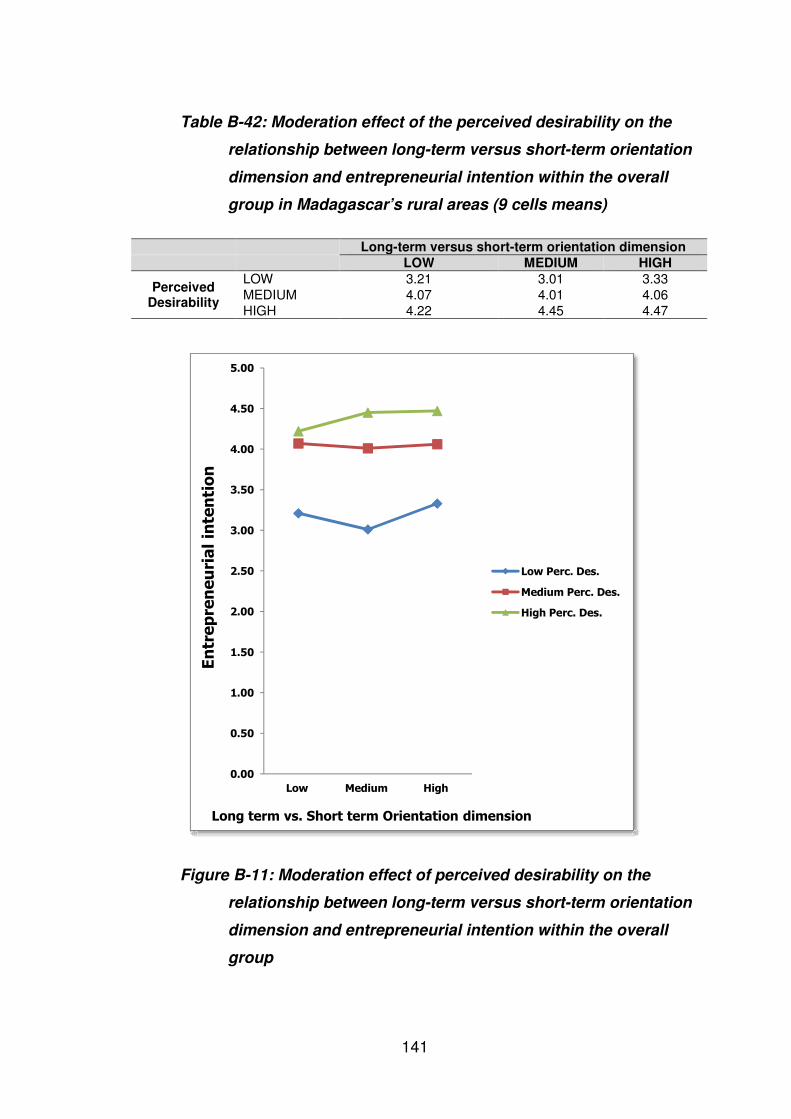
141
Table B-42: Moderation effect of the perceived desirability on the
relationship between long-term versus short-term orientation
dimension and entrepreneurial intention within the overall
group in Madagascar’s rural areas (9 cells means)
Long-term versus short-term orientation dimension
LOW MEDIUM HIGH
Perceived Desirability
LOW 3.21 3.01 3.33
MEDIUM 4.07 4.01 4.06
HIGH 4.22 4.45 4.47
Figure B-11: Moderation effect of perceived desirability on the
relationship between long-term versus short-term orientation
dimension and entrepreneurial intention within the overall
group
0.00
0.50
1.00
1.50
2.00
2.50
3.00
3.50
4.00
4.50
5.00
Low Medium High
Entrepreneurial intention
Long term vs. Short term Orientation dimension
Low Perc. Des.
Medium Perc. Des.
High Perc. Des.
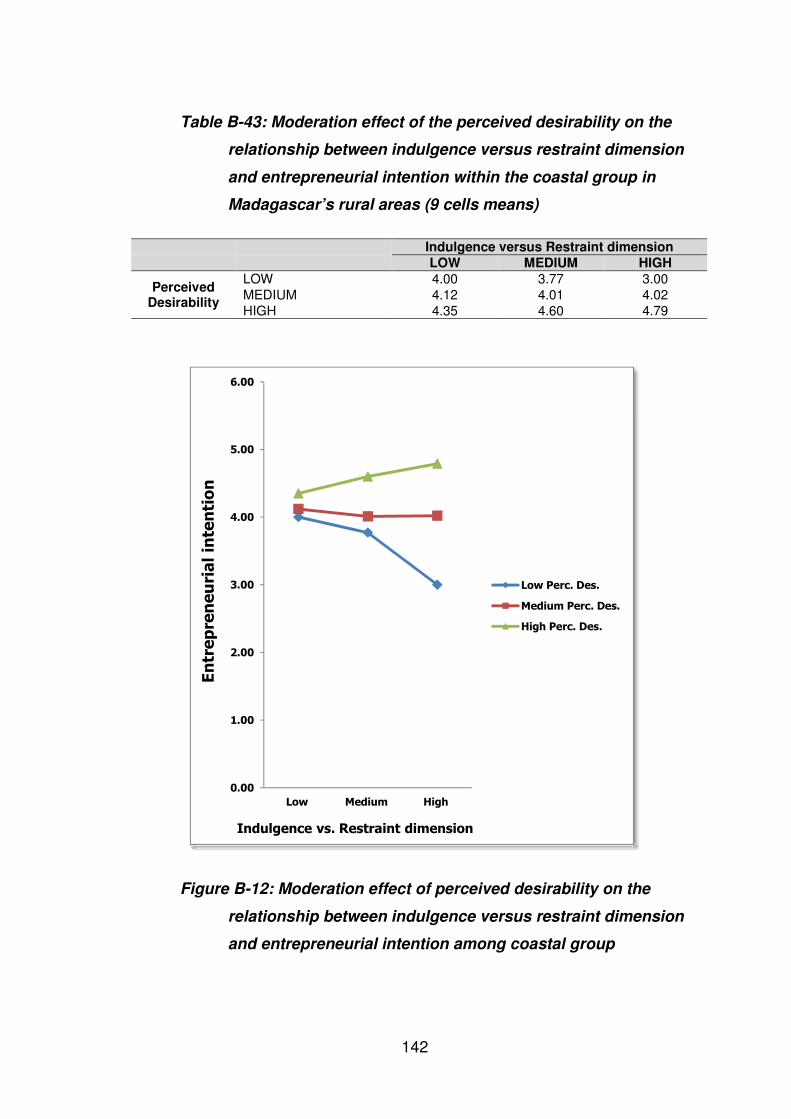
142
Table B-43: Moderation effect of the perceived desirability on the
relationship between indulgence versus restraint dimension
and entrepreneurial intention within the coastal group in
Madagascar’s rural areas (9 cells means)
Indulgence versus Restraint dimension
LOW MEDIUM HIGH
Perceived Desirability
LOW 4.00 3.77 3.00
MEDIUM 4.12 4.01 4.02
HIGH 4.35 4.60 4.79
Figure B-12: Moderation effect of perceived desirability on the
relationship between indulgence versus restraint dimension
and entrepreneurial intention among coastal group
0.00
1.00
2.00
3.00
4.00
5.00
6.00
Low Medium High
Entrepreneurial intention
Indulgence vs. Restraint dimension
Low Perc. Des.
Medium Perc. Des.
High Perc. Des.
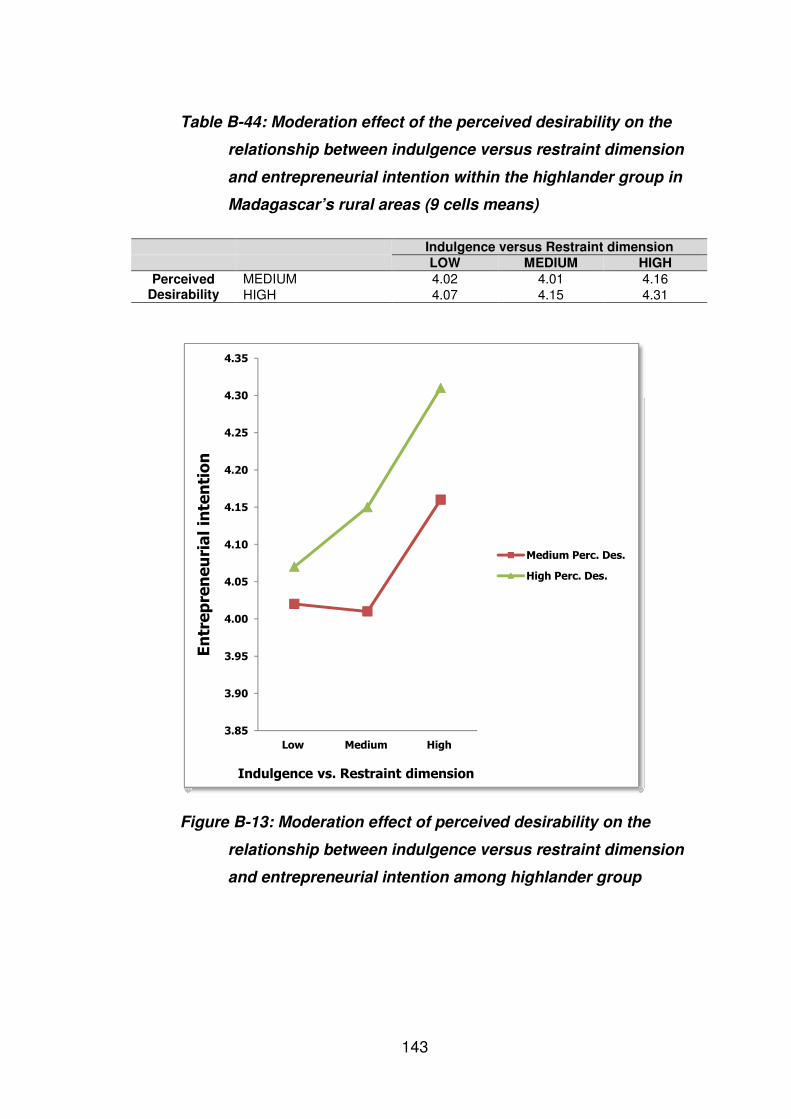
143
Table B-44: Moderation effect of the perceived desirability on the
relationship between indulgence versus restraint dimension
and entrepreneurial intention within the highlander group in
Madagascar’s rural areas (9 cells means)
Indulgence versus Restraint dimension
LOW MEDIUM HIGH
Perceived Desirability
MEDIUM 4.02 4.01 4.16
HIGH 4.07 4.15 4.31
Figure B-13: Moderation effect of perceived desirability on the
relationship between indulgence versus restraint dimension
and entrepreneurial intention among highlander group
3.85
3.90
3.95
4.00
4.05
4.10
4.15
4.20
4.25
4.30
4.35
Low Medium High
Entrepreneurial intention
Indulgence vs. Restraint dimension
Medium Perc. Des.
High Perc. Des.
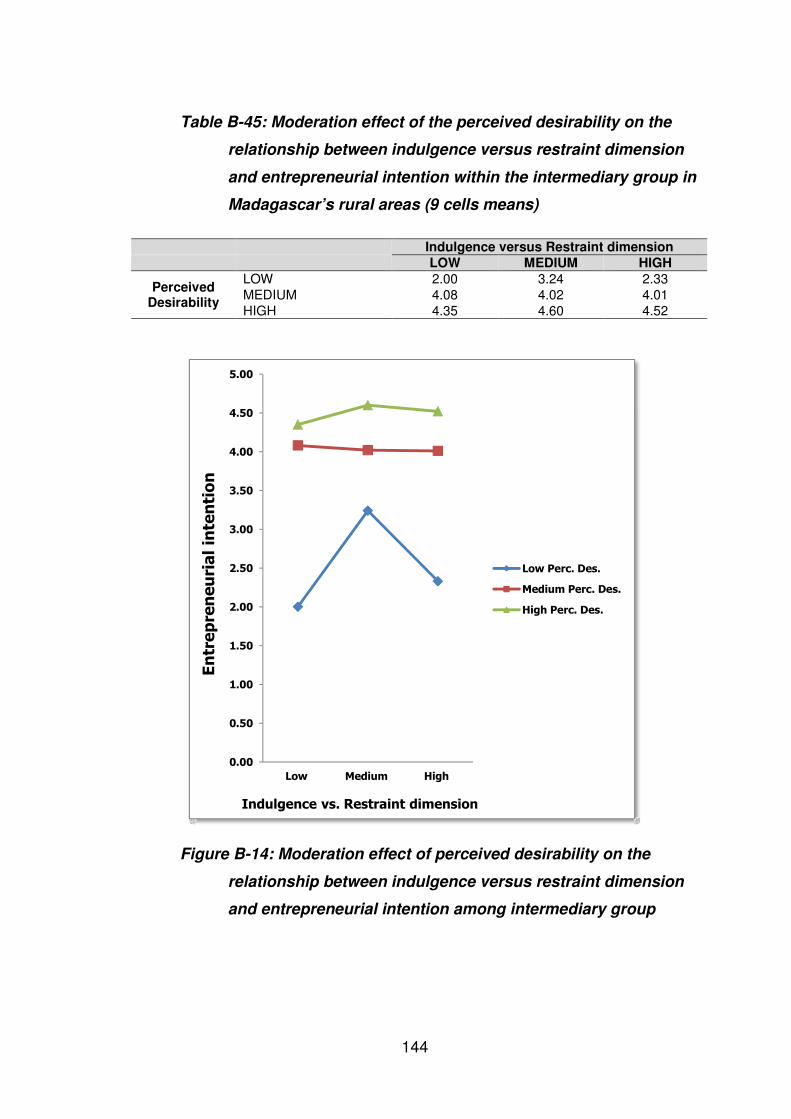
144
Table B-45: Moderation effect of the perceived desirability on the
relationship between indulgence versus restraint dimension
and entrepreneurial intention within the intermediary group in
Madagascar’s rural areas (9 cells means)
Indulgence versus Restraint dimension
LOW MEDIUM HIGH
Perceived Desirability
LOW 2.00 3.24 2.33
MEDIUM 4.08 4.02 4.01
HIGH 4.35 4.60 4.52
Figure B-14: Moderation effect of perceived desirability on the
relationship between indulgence versus restraint dimension
and entrepreneurial intention among intermediary group
0.00
0.50
1.00
1.50
2.00
2.50
3.00
3.50
4.00
4.50
5.00
Low Medium High
Entrepreneurial intention
Indulgence vs. Restraint dimension
Low Perc. Des.
Medium Perc. Des.
High Perc. Des.
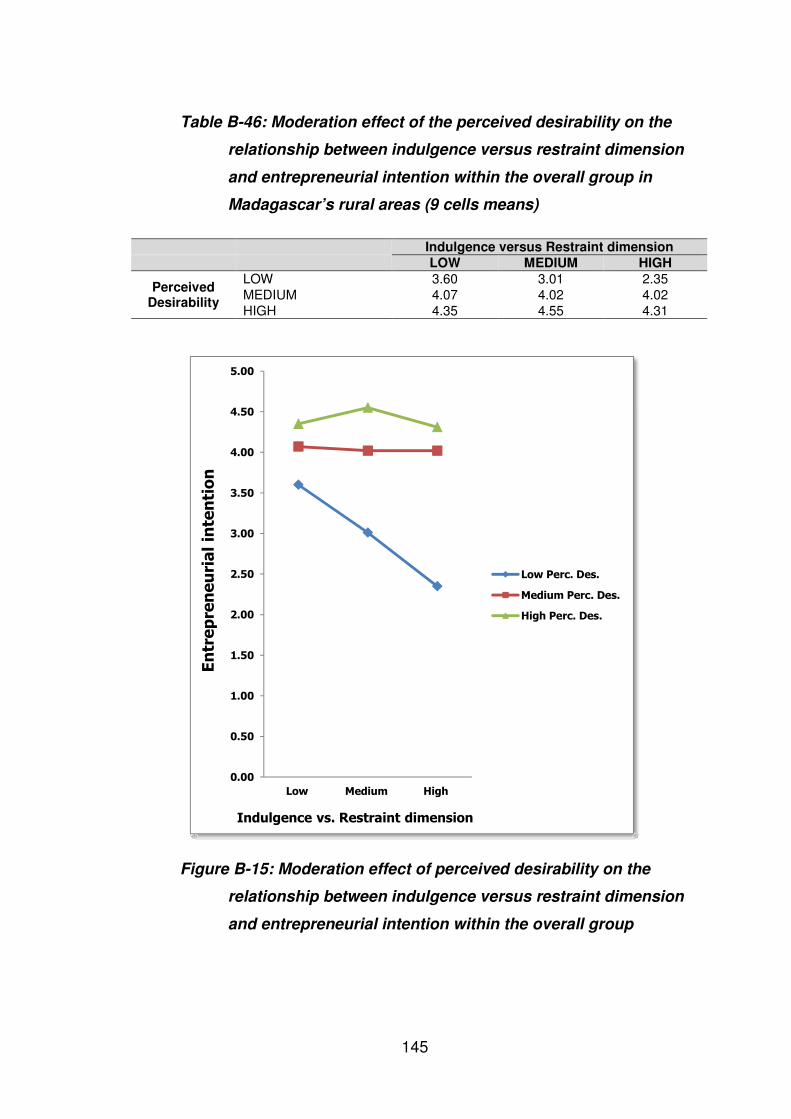
145
Table B-46: Moderation effect of the perceived desirability on the
relationship between indulgence versus restraint dimension
and entrepreneurial intention within the overall group in
Madagascar’s rural areas (9 cells means)
Indulgence versus Restraint dimension
LOW MEDIUM HIGH
Perceived Desirability
LOW 3.60 3.01 2.35
MEDIUM 4.07 4.02 4.02
HIGH 4.35 4.55 4.31
Figure B-15: Moderation effect of perceived desirability on the
relationship between indulgence versus restraint dimension
and entrepreneurial intention within the overall group
0.00
0.50
1.00
1.50
2.00
2.50
3.00
3.50
4.00
4.50
5.00
Low Medium High
Entrepreneurial intention
Indulgence vs. Restraint dimension
Low Perc. Des.
Medium Perc. Des.
High Perc. Des.
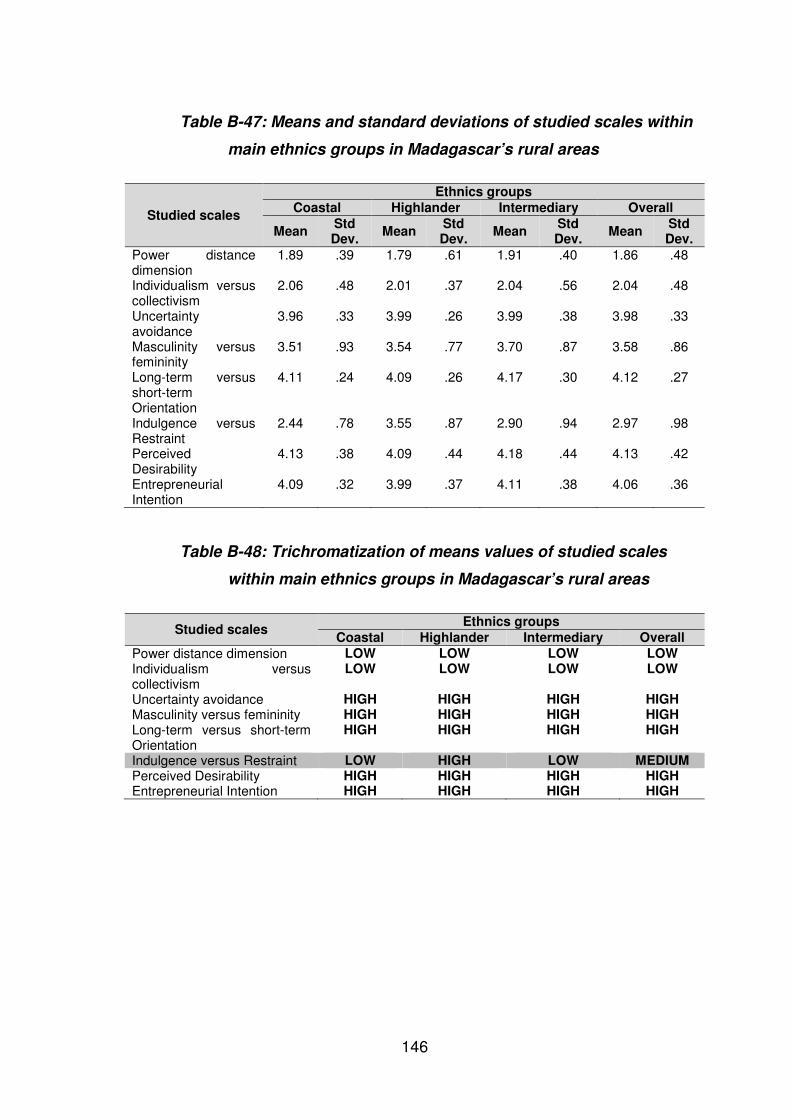
146
Table B-47: Means and standard deviations of studied scales within
main ethnics groups in Madagascar’s rural areas
Studied scales
Ethnics groups Coastal Highlander Intermediary Overall
Mean Std Dev.
Mean Std Dev.
Mean Std Dev.
Mean Std Dev.
Power distance dimension
1.89 .39 1.79 .61 1.91 .40 1.86 .48
Individualism versus collectivism
2.06 .48 2.01 .37 2.04 .56 2.04 .48
Uncertainty avoidance
3.96 .33 3.99 .26 3.99 .38 3.98 .33
Masculinity versus femininity
3.51 .93 3.54 .77 3.70 .87 3.58 .86
Long-term versus short-term Orientation
4.11 .24 4.09 .26 4.17 .30 4.12 .27
Indulgence versus Restraint
2.44 .78 3.55 .87 2.90 .94 2.97 .98
Perceived Desirability
4.13 .38 4.09 .44 4.18 .44 4.13 .42
Entrepreneurial Intention
4.09 .32 3.99 .37 4.11 .38 4.06 .36
Table B-48: Trichromatization of means values of studied scales
within main ethnics groups in Madagascar’s rural areas
Studied scales Ethnics groups
Coastal Highlander Intermediary Overall Power distance dimension LOW LOW LOW LOW Individualism versus collectivism
LOW LOW LOW LOW
Uncertainty avoidance HIGH HIGH HIGH HIGH Masculinity versus femininity HIGH HIGH HIGH HIGH Long-term versus short-term Orientation
HIGH HIGH HIGH HIGH
Indulgence versus Restraint LOW HIGH LOW MEDIUM Perceived Desirability HIGH HIGH HIGH HIGH Entrepreneurial Intention HIGH HIGH HIGH HIGH
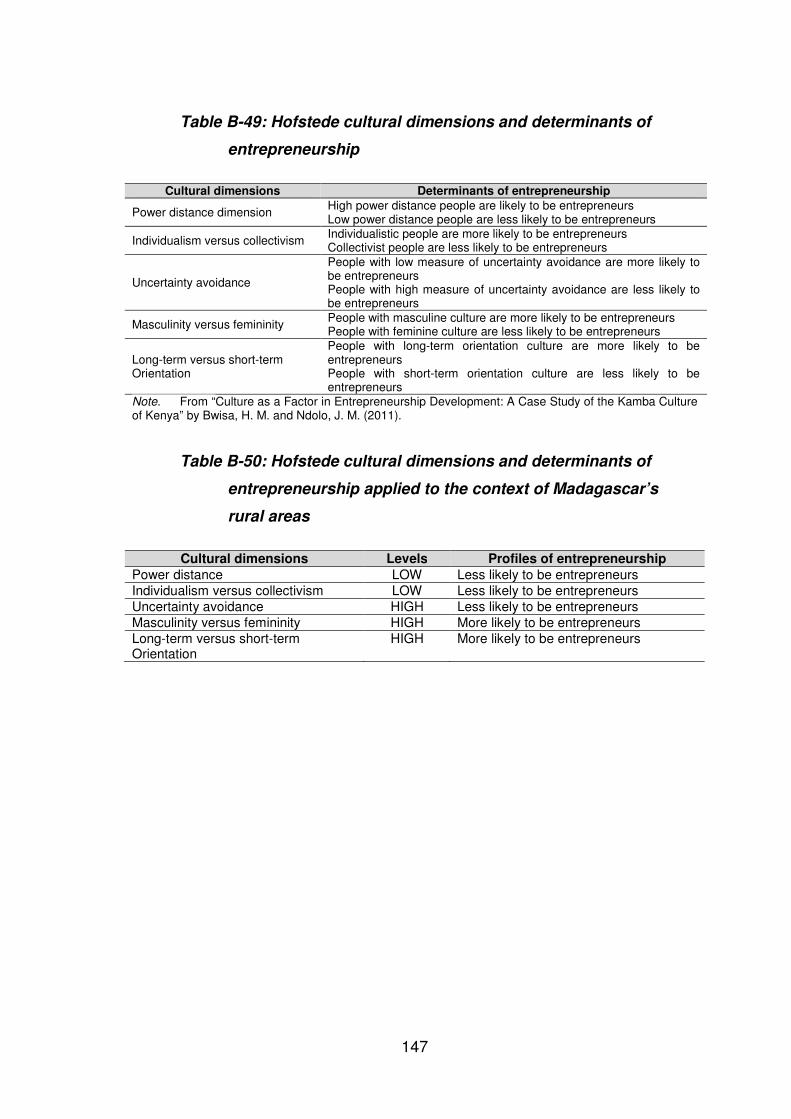
147
Table B-49: Hofstede cultural dimensions and determinants of
entrepreneurship
Cultural dimensions Determinants of entrepreneurship
Power distance dimension High power distance people are likely to be entrepreneurs Low power distance people are less likely to be entrepreneurs
Individualism versus collectivism Individualistic people are more likely to be entrepreneurs Collectivist people are less likely to be entrepreneurs
Uncertainty avoidance
People with low measure of uncertainty avoidance are more likely to be entrepreneurs People with high measure of uncertainty avoidance are less likely to be entrepreneurs
Masculinity versus femininity People with masculine culture are more likely to be entrepreneurs People with feminine culture are less likely to be entrepreneurs
Long-term versus short-term Orientation
People with long-term orientation culture are more likely to be entrepreneurs People with short-term orientation culture are less likely to be entrepreneurs
Note. From “Culture as a Factor in Entrepreneurship Development: A Case Study of the Kamba Culture of Kenya” by Bwisa, H. M. and Ndolo, J. M. (2011).
Table B-50: Hofstede cultural dimensions and determinants of
entrepreneurship applied to the context of Madagascar’s
rural areas
Cultural dimensions Levels Profiles of entrepreneurship Power distance LOW Less likely to be entrepreneurs
Individualism versus collectivism LOW Less likely to be entrepreneurs
Uncertainty avoidance HIGH Less likely to be entrepreneurs
Masculinity versus femininity HIGH More likely to be entrepreneurs
Long-term versus short-term Orientation
HIGH More likely to be entrepreneurs
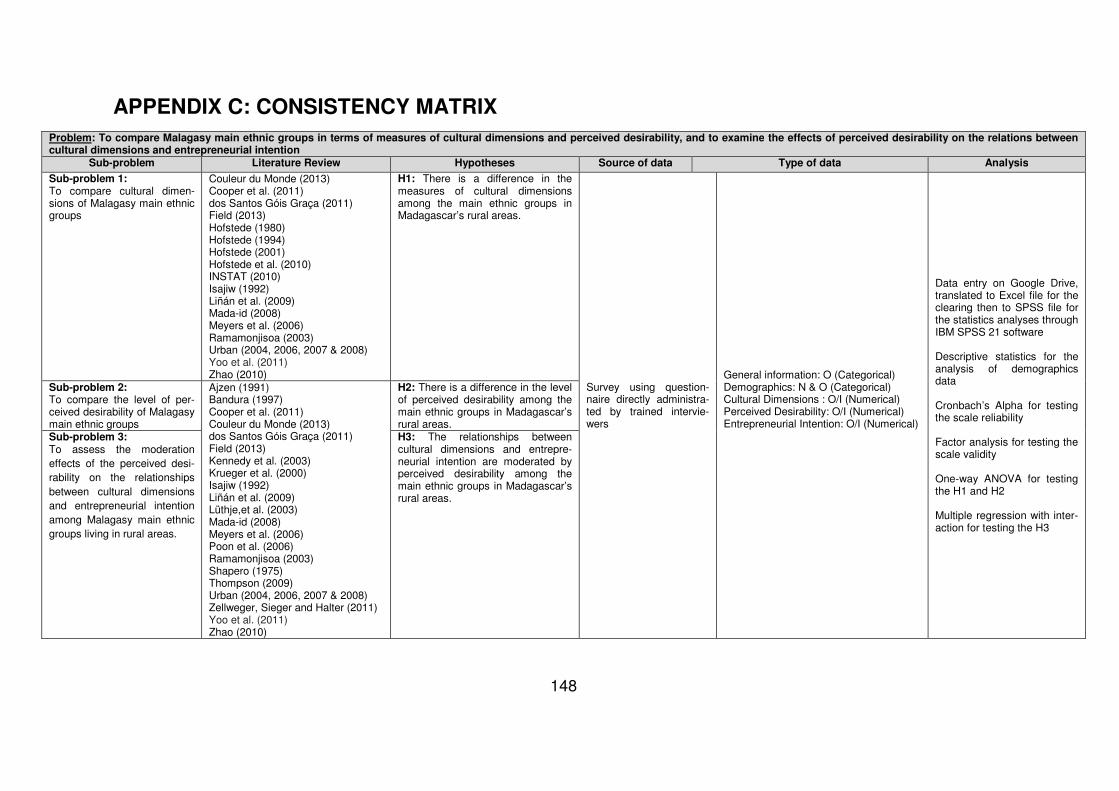
148
APPENDIX C: CONSISTENCY MATRIX
Problem: To compare Malagasy main ethnic groups in terms of measures of cultural dimensions and perceived desirability, and to examine the effects of perceived desirability on the relations between cultural dimensions and entrepreneurial intention
Sub-problem Literature Review Hypotheses Source of data Type of data Analysis
Sub-problem 1: To compare cultural dimen-sions of Malagasy main ethnic groups
Couleur du Monde (2013) Cooper et al. (2011) dos Santos Góis Graça (2011) Field (2013) Hofstede (1980) Hofstede (1994) Hofstede (2001) Hofstede et al. (2010) INSTAT (2010) Isajiw (1992) Liñán et al. (2009) Mada-id (2008) Meyers et al. (2006) Ramamonjisoa (2003) Urban (2004, 2006, 2007 & 2008) Yoo et al. (2011) Zhao (2010)
H1: There is a difference in the measures of cultural dimensions among the main ethnic groups in Madagascar’s rural areas.
Survey using question-naire directly administra-ted by trained intervie-wers
General information: O (Categorical) Demographics: N & O (Categorical) Cultural Dimensions : O/I (Numerical) Perceived Desirability: O/I (Numerical) Entrepreneurial Intention: O/I (Numerical)
Data entry on Google Drive, translated to Excel file for the clearing then to SPSS file for the statistics analyses through IBM SPSS 21 software Descriptive statistics for the analysis of demographics data Cronbach’s Alpha for testing the scale reliability Factor analysis for testing the scale validity One-way ANOVA for testing the H1 and H2 Multiple regression with inter-action for testing the H3
Sub-problem 2: To compare the level of per-ceived desirability of Malagasy main ethnic groups
Ajzen (1991) Bandura (1997) Cooper et al. (2011) Couleur du Monde (2013) dos Santos Góis Graça (2011) Field (2013) Kennedy et al. (2003) Krueger et al. (2000) Isajiw (1992) Liñán et al. (2009) Lüthje,et al. (2003) Mada-id (2008) Meyers et al. (2006) Poon et al. (2006) Ramamonjisoa (2003) Shapero (1975) Thompson (2009) Urban (2004, 2006, 2007 & 2008) Zellweger, Sieger and Halter (2011) Yoo et al. (2011) Zhao (2010)
H2: There is a difference in the level of perceived desirability among the main ethnic groups in Madagascar’s rural areas.
Sub-problem 3: To assess the moderation
effects of the perceived desi-
rability on the relationships
between cultural dimensions
and entrepreneurial intention
among Malagasy main ethnic
groups living in rural areas.
H3: The relationships between cultural dimensions and entrepre-neurial intention are moderated by perceived desirability among the main ethnic groups in Madagascar’s rural areas.