Embed Size (px)
Citation preview
THE INFLUENCE OF CONSUMER QUALITY
PERCEPTION, MOTIVATION AND LIFESTYLE ON
PURCHASE DECISION ON OPPO Smartphone
(Case Study in Cakung Barat Urban Village
Community)
1st Muzhiroh, 2
nd Budiono M.Sc
Management
Indonesian College of Economics
Jakarta, Indonesia
[email protected] ; [email protected]
Abstract - This study aims to determine how much influence
the perception of quality, motivation and lifestyle of
consumers on purchasing decisions for Oppo smartphones
in the community of Cakung Barat Village partially and
simultaneously. The survey method is a research method
with a quantitative approach. The population of this
research is the people of West Cakung Village who have
purchased an Oppo smartphone. Sampling using non-
probability sampling technique of 97 respondents. The
method used in data collection is a questionnaire
(questionnaire). The analysis method used is validity test,
reliability test, partial and multiple determination coefficient
analysis, and hypothesis testing. The results showed that
partially the perception of quality has a significant effect
with a contribution of 46, 78% in influencing the purchase
decision of an Oppo smartphone. Partially, consumer
motivation has no significant effect with a contribution of
28.30% in influencing the purchase decision of an Oppo
smartphone. And the lifestyle of consumers partially has a
significant effect with a contribution of 31.36% in
influencing the purchase decision of an Oppo smartphone.
As well as simultaneously perceptions of quality, motivation
and lifestyle of consumers have a significant effect on
purchasing decisions for Oppo smartphones with a large
effect of 51.69%.
Keywords: perceived quality, motivation, lifestyle,
purchasing decisions.
The Effect of Perceptions of Quality, Motivation and Consumer Lifestyle on Purchase
Decisions….
Indonesian College of Economics - 2020 1
I. Introduction
In the current era of globalization, the development of the business world shows very rapid
progress. It can be seen with the advancement of science and technology, making many companies appear with increasingly fierce competition between products and services. With increasing
competition, the company will continue to improve its quality to get consumers (Nastiti and
Fahlefi, 2019).
The development of communication technology occurs very rapidly. Telephone cellular is a communication tool that continues to develop its function. Starting from a landline that can be used
for conversations with the cable that connects. Until a cellphone that can be taken anywhere to
communicate by sending messages or making calls. Ina Hutasoit, Chair of the All Indonesian Posnsel Association (APSI) said, don't think of
cellphones as luxury goods. According to him, it cannot be said that the rapid penetration of
smartphones from year to year in Indonesia is due to the increasing purchasing power or economy
of the Indonesian people (https://techno.okezone.com April 13, 2020). Increasing public awareness of various needs and desires that are easy and fast, has made
smartphone users increase. For example, today's young people who cannot be separated from social
media, make smartphones as a medium for social interaction. By using various media such as WhatsApp, Facebook, Instagram, and other media, the message you want to convey can be sent in
seconds.
According to Syahril (2017) at this time, smartphone users have been dominated by the world of education, companies, to the wider community and have become a personal need. The
times and the latest trends are the triggers for smartphone users. On the pretext of carrying out and
completing activities easily and quickly, as well as the demands of a lifestyle that requires one to
have a smartphone, of course with high quality, one of the electronics companies whose prestige continues to race against its competitors in the world of cellular communication is Oppo
Electronics Corp. Oppo Mobile Communication is a consumer electronics and cellular
communication company from China and is known for its smart phones, Blu-ray players and other electronic devices.https://id.wikipedia.org March 27, 2020).
Oppo is a smartphone vendor for the middle class that is sought after by consumers because
the features and designs offered are no less competitive with high-end smartphones. With an affordable price, Oppo can be recognized by all levels of society as a luxury smartphone that can
accommodate all user needs, yet remains pocket-friendly. And for the first time, based on a report
from market research institute Canalys for the second quarter of 2019, Oppo has shifted Samsung's
position as king of Indonesia's smartphones. Canalys noted that Oppo's market share in Indonesia in that period reached 26%, growing 54% year over year (YoY). Meanwhile, despite also growing
by 10% YoY, Samsung is now in second place with a share of 24% (https://tekno.kompas.com/
April 14, 2020). There are many factors that can influence consumer behavior in fulfilling needs and deciding
to buy a product. And when making a purchase, consumers will consider several things in their
mind. Perception of quality is a process that involves the entry of messages or information into the
human brain. Motivation is an important factor influencing purchasing decisions that come from consumer psychology. There is a purchase motive behind a person in making a purchase decision.
Motivation becomes a powerful driver in consumers that compels them to take an action. The
power of the urge is the result of a pressure caused by not fulfilling needs, wants and requests. And then consumers will try to reduce this pressure by making buying behavior to meet their needs.
lifestyle is also one of one's personal factors that influence purchasing decisions. The lifestyle of a
society will be different from other societies. And every day it will continue to develop following the changing times. Setiadi (2015: 80) defines lifestyle broadly as a way of life that is identified by
how a person spends their time (activities), what they consider important in their environment
Muzhiroh1 and Budiono2
Indonesian College of Economics - 2020 2
(interest), and what they think about themselves and also the world around them. (opinion). And
when it comes to purchasing decisions for Oppo smartphone products,
Then it can be determined that the objectives of this study are: 1. This is to find out how much the perceived quality of purchasing decisions is.
2. To find out how much motivation consumers have on purchasing decisions.
3. To find out how much lifestyle is on purchasing decisions. 4. This is to find out how much perceived quality, motivation and lifestyle consumers have on
purchasing decisions.
II. LITERATURE REVIEW 2.1. Previous Reviews
The first research was conducted by Saputra, et al (2019). With the aim of examining the
effect of country of origin, perceived quality and brand on smartphone purchasing decisions. Using
survey research methods and data analysis with multiple linear regression. The results of the study are country of origin, perceived quality and brand have a positive and significant effect on
purchasing decisions.
The second research was conducted by Badjamal (2019). With the aim of knowing the influence of lifestyle and brand equity on purchasing decisions for Samsung mobile phones. Using
survey research methods and sampling methods of non-probability sampling. The result of this
research is that brand equity has a significant effect while lifestyle does not have a significant effect
on purchasing decisions. The third research was conducted by Nastiti and Fahlefi (2019). With the aim of knowing the
effect of brand awareness, perceived quality and brand loyalty on purchasing decisions for Vivo
mobile phones. using purposive sampling method and data analysis with multiple linear regression and the coefficient of determination. The results of the study are brand awareness, perceived
quality, and brand loyalty have a significant effect on purchasing decisions.
The fourth research was conducted by Syahril (2017). With the aim to analyze the influence of motivation and lifestyle on purchasing decisions for android mobile phones. Using simple
random sampling method and data analysis with multiple linear regression. The results of the study
were motivation and lifestyle had a very significant effect on purchasing decisions.
The fifth research was conducted by Abdilla and Agus (2020). With the aim to determine the effect of smartphone purchase decisions in terms of needs and lifestyle. Using a survey method,
sampling with proportional sampling and data analysis with linear regression. The results of this
research are the need and lifestyle have a significant effect on purchasing decisions. The sixth study was conducted by Forenbacher, et al (2019). With the aim to analyze the
factors affecting mobile phone ownership in Nigeria. Using random sampling methods and data
analysis with the econometric binary logit model. The result of the research shows that the most
significant determinants of ownership are informal work, education and employment status. The seventh study was conducted by Rahim, et al (2016). With the aim of knowing the
significant influence of product features, brand name, social influence on smartphone purchase
intention among Malaysian students. Using survey and sampling methods with Krejcie and Morgan. The results of the study show that product features have a significant effect on smartphone
purchase intentions and there is a positive relationship between brand name and purchase intention.
The eighth research was conducted by Yunus and Rashid (2016). With the aim of knowing the effect of the country's image, perceived product quality and brand recognition on purchase
intention of Chinese brand cell phones. Using convenience sampling method of sampling and data
analysis with correlational analysis and hypothesis testing. The result of this research is that there is
a significant correlation between the image of the country, the perception of product quality, brand recognition and purchase intention.
The Effect of Perceptions of Quality, Motivation and Consumer Lifestyle on Purchase
Decisions….
Indonesian College of Economics - 2020 3
2.2. Theoretical basis
1. Consumer Behavior
According to Firmansyah (2018: 2) consumer behavior is an activity that is closely related to the process of purchasing a good or service. Consumer behavior is an action that is directly
involved in obtaining, consuming, and spending a product or service, including the decision
process that precedes and follows this action (Setiadi, 2015: 2).
And The American Marketing Association in Kotler (2000) which is translated by Setiadi (2015: 2) defines consumer behavior as a dynamic interaction between affection and cognition,
behavior, and the environment in which humans perform exchange activities in their lives.
From this definition, there are three important ideas, namely: (1) consumer behavior is dynamic; (2) it involves the interaction between affection and cognition, behavior and events
around; and (3) it involves an exchange.
Consumer behavior is dynamic, meaning that the behavior of a consumer, consumer group, or the wider community is always changing and moving all the time. This has implications for the
study of consumer behavior. In terms of the study of consumer behavior, one of the implications is
that generalizations of consumer behavior are usually limited to a certain period of time, products,
and certain individuals or groups. Consumer behavior involves an exchange. That is the last thing that is emphasized in the
definition of consumer behavior, namely the exchange between individuals. This keeps the
definition of consumer behavior consistent with the definition of marketing so far as it also emphasizes exchange. In fact, the role of marketing is to create exchanges with consumers through
the formulation and implementation of marketing strategies.
So consumer behavior can be concluded as things that underlie and make consumers make a purchase decision. Because when deciding to buy a product or service, consumers will first think
about the product to be purchased. Starting from price, quality, function, and others. The activity of
thinking about, considering, and questioning products before buying is included in consumer
behavior.
2. Purchase Decisions
Setiadi (2015: 343) views consumer decision making as a problem solving and assumes that
consumers have goals to be achieved or satisfied. A consumer considers something is a "problem"
because the consequences he wants have not been achieved. Consumers make decisions about
which behavior they want to take to achieve their goals, and thus solve the problem. All aspects of influence and cognition are involved in consumer decision making, including
knowledge, the meaning of memory activated beliefs and the attention and understanding involved
in translating new environments. However, at the core of consumer decision making is an integration process that combines knowledge to evaluate two or more alternative behaviors, and
selects one of them. The result of this integration process is a choice, which is presented
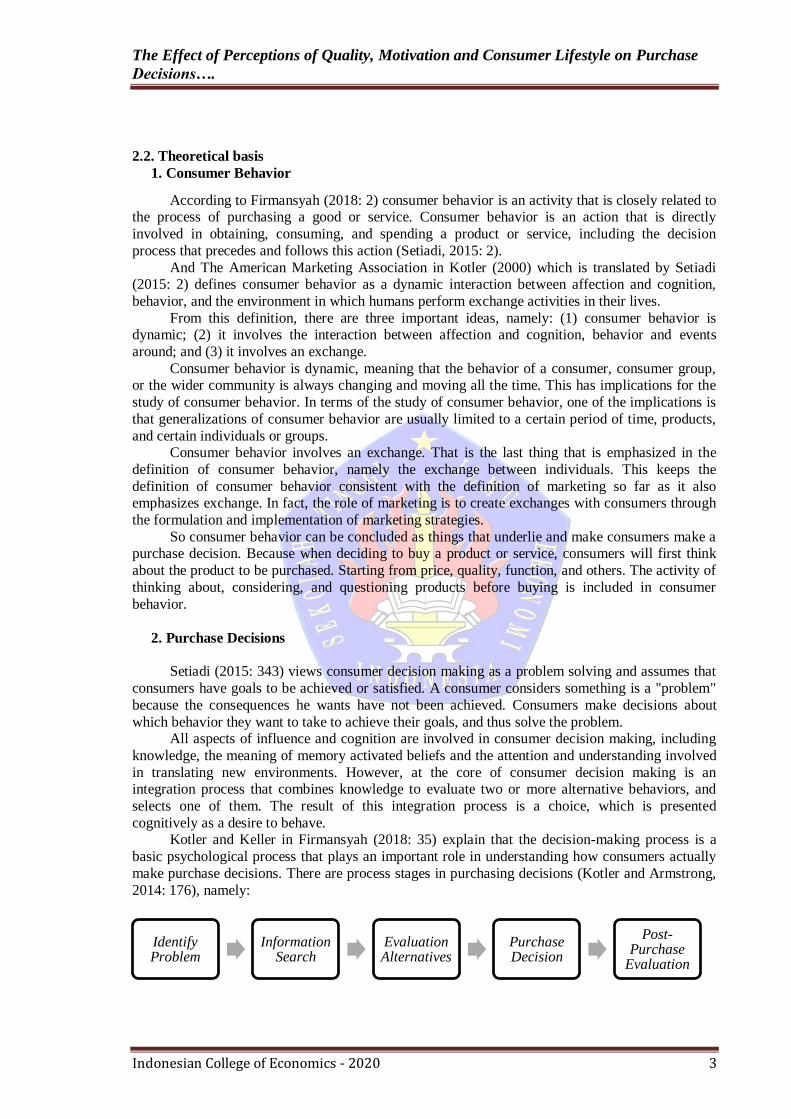
cognitively as a desire to behave. Kotler and Keller in Firmansyah (2018: 35) explain that the decision-making process is a
basic psychological process that plays an important role in understanding how consumers actually
make purchase decisions. There are process stages in purchasing decisions (Kotler and Armstrong,
2014: 176), namely:
Identify Problem
Information Search
Evaluation Alternatives
Purchase Decision
Post-Purchase
Evaluation
Muzhiroh1 and Budiono2
Indonesian College of Economics - 2020 4
Dimensions of purchasing decisions (Kotler and Armstrong, 2016: 188): 1. Product choice 2. Brand choice
3. Purchase channel selection (dealer choice)
4. Determination of the purchase time (purchase timing)
5. Purchase amount
3. Perceived Quality
According to Kartajaya (2010: 73)) perceived quality is a dimension of brand equity.
Consumers will have good or bad perceptions of the quality of a product, and will tend to
give positive or negative responses to the product. The more positive the consumer's
perception of a product, the better the perception of the product brand itself.
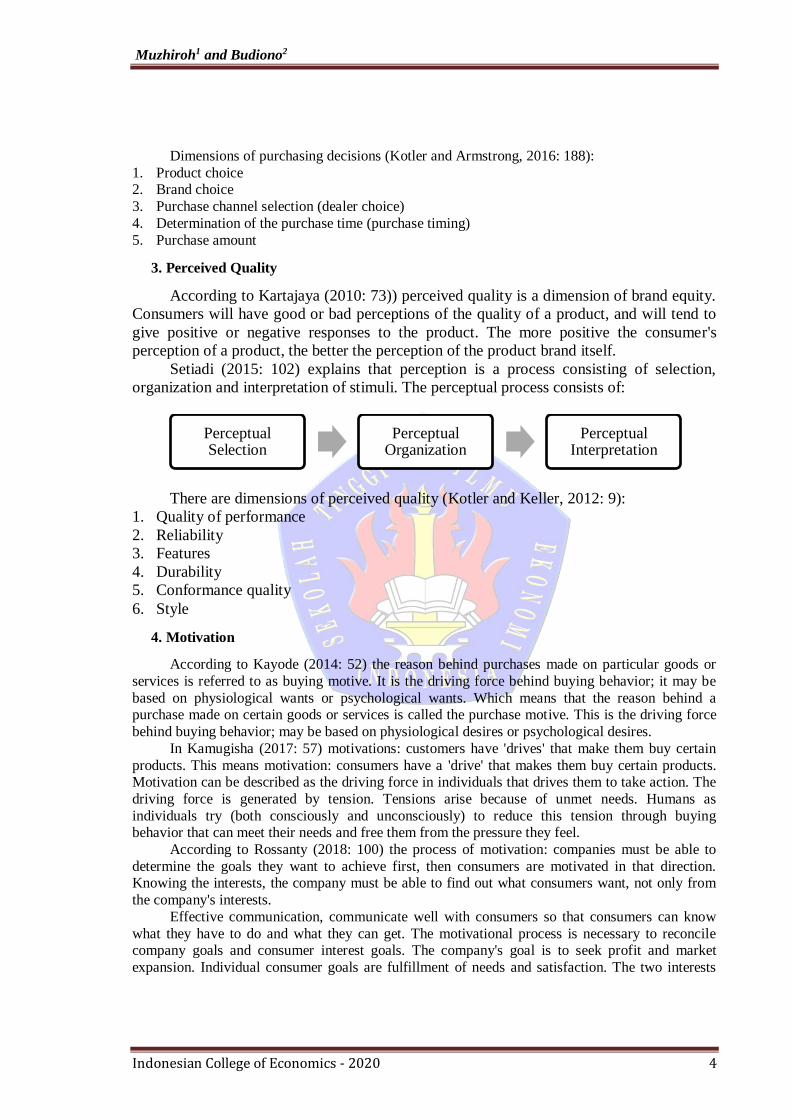
Setiadi (2015: 102) explains that perception is a process consisting of selection,
organization and interpretation of stimuli. The perceptual process consists of:
There are dimensions of perceived quality (Kotler and Keller, 2012: 9):
1. Quality of performance
2. Reliability
3. Features
4. Durability
5. Conformance quality
6. Style
4. Motivation
According to Kayode (2014: 52) the reason behind purchases made on particular goods or
services is referred to as buying motive. It is the driving force behind buying behavior; it may be
based on physiological wants or psychological wants. Which means that the reason behind a purchase made on certain goods or services is called the purchase motive. This is the driving force
behind buying behavior; may be based on physiological desires or psychological desires.
In Kamugisha (2017: 57) motivations: customers have 'drives' that make them buy certain
products. This means motivation: consumers have a 'drive' that makes them buy certain products. Motivation can be described as the driving force in individuals that drives them to take action. The
driving force is generated by tension. Tensions arise because of unmet needs. Humans as
individuals try (both consciously and unconsciously) to reduce this tension through buying behavior that can meet their needs and free them from the pressure they feel.
According to Rossanty (2018: 100) the process of motivation: companies must be able to
determine the goals they want to achieve first, then consumers are motivated in that direction. Knowing the interests, the company must be able to find out what consumers want, not only from
the company's interests.
Effective communication, communicate well with consumers so that consumers can know
what they have to do and what they can get. The motivational process is necessary to reconcile company goals and consumer interest goals. The company's goal is to seek profit and market
expansion. Individual consumer goals are fulfillment of needs and satisfaction. The two interests
Perceptual Selection
Perceptual Organization
Perceptual Interpretation
The Effect of Perceptions of Quality, Motivation and Consumer Lifestyle on Purchase
Decisions….
Indonesian College of Economics - 2020 5
above must be reconciled and it is important to adjust the motivation. The company provides
facilities so that consumers can easily get the goods and services produced by the company. The
dimensions of motivation (Setiadi, 2015: 39): 1. Physiological needs
2. Safety and security needs
3. Social needs 4. Esteem needs
5. Self-actualization needs
5. Lifestyle
In Widjaja (2013: 39) states that lifestyle is part of customer behavior and is defined as
individual behavior which is manifested in the form of activities, interests and views of individuals
to actualize their personalities due to the influence of interactions with their environment. Broadly, Setiadi (2015: 80) defines lifestyle as a way of life that is identified by how a person spends their
time (activities), what they consider important in their environment (interest), and what they think
about themselves and also the world in surroundings (opinion). The lifestyle of a society will be different from other societies. Even from time to time, the lifestyle of a certain individual and
community group will move dynamically. However,
VALS (Value and Lifestyle) is a program developed to measure lifestyle and identify eight
groups of consumers in a society (Setiadi, 2015: 86): 1. Actualizer: someone who has a high income and high self-esteem. They have a wide range of
interests in various fields and are open to change. They buy products to achieve the best in life.
2. Fulfilleds: someone who is high-income, mature, responsible, highly educated in a professional field. Included in practical and value-oriented consumers.
3. Believers: somewhat less rich, and more traditional than fulfilleds. Their life is centered on
family, religion, society and nation.
4. Achiever: a lot of work lacks recreation, career and family focus, avoids change, and is conservative in politics.
5. Striver: a person with values similar to the achiever but less economic, social and
psychological resources. 6. Struggeler: people with the lowest income and too few resources to fit into any consumer
orientation with limitations, they tend to be brand loyal consumers.
7. Experiencer: consumers who are passionate about liking new things.
8. Maker: people who like to influence their environment in a practical way.
Lifestyle is basically a behavior that reflects what problems actually exist in the mind of the
customer which tends to deal with various things related to consumer emotional and psychological
problems. There are dimensions of lifestyle (Setiadi, 2015: 81):
1. Activities 2. Interest (interest)
3. Opinion
2.3. Hypothesis Development
So the hypothesis in this study are:
1. It is suspected that there is a significant influence between perceived quality and purchasing
decisions for Oppo smartphones. 2. It is suspected that there is a significant influence between motivation and the decision to buy
an Oppo smartphone.
Muzhiroh1 and Budiono2
Indonesian College of Economics - 2020 6
3. It is suspected that there is a significant influence between lifestyle and the decision to buy an
Oppo smartphone.
4. It is suspected that there is a simultaneous significant influence between perceptions of quality, motivation and consumer lifestyle with the purchase decision of an Oppo smartphone.
III. RESEARCH METHODS Research Strategy
The research strategy used in this study is causal associative. Sugiyono (2019: 65) also states that causal associative is a formulation of research problems that asks about the relationship
between two or more variables. Causal relationship is a relationship that is causal in nature. In this
study, there are independent variables (affecting) and dependent variables (influenced). Causal associative is used to determine the extent of the causal relationship from the influence of
perceived quality, motivation and consumer lifestyle on purchasing decisions. Where Perception of
Quality as variable X1, Consumer Motivation as variable X2, and Consumer Lifestyle as variable
X3, while Purchase Decision as variable Y. This research strategy uses a survey research method, which is part of quantitative research.
Where the survey method is used to get data from a certain natural place, but researchers do
treatment in data collection, for example by distributing questionnaires, tests, structured interviews, and so on (Sugiyono, 2019: 15).
Research Population
Population according to Sugiyono (2019: 126) is a generalization area consisting of: objects /
subjects that have certain quantities and characteristics that are determined by the researcher to
study and then draw conclusions. The population in this study were the people of Cakung Barat
Village who had purchased an Oppo smartphone.
Research Sample
This study uses a non-probability sampling technique because the population is not known
for the number of members, and with purposive sampling as a technique of determining the sample.
The criteria used in sampling were the people of West Cakung Village and had purchased an Oppo smartphone. Roscoe in Sugiyono (2019: 143) gives suggestions about sample sizes for research:
1. The appropriate sample size in the study is between 30 and 500.
2. If the sample is divided into categories, then the number of sample members for each category
is at least 30. 3. If the research will perform multivariate analysis, for example, correlation or multiple
regression, then the number of sample members is at least 10 times the number of variables
studied. 4. For simple experimental research, which uses an experimental group and a control group, the
number of sample members is 10 to 20 each.
The Effect of Perceptions of Quality, Motivation and Consumer Lifestyle on Purchase
Decisions….
Indonesian College of Economics - 2020 7
The sample size was calculated using the Cochran formula (Sugiyono, 2019: 136):
𝑛 =𝑧2𝑝𝑞
𝑒2
And the results are 96.04 which is a fraction and according to Sugiyono (2019: 143) the
calculations that produce fractions (there are commas) should be rounded up. So that the number of
samples in this study were 97 respondents.
Data Collection Methods
Because the number of respondents is quite large and spread over a wide area, the method
used to collect primary data in this study is to use a questionnaire (questionnaire). In this study,
researchers distributed questionnaires to the people of West Cakung Village who had purchased an Oppo smartphone. And people who are respondents in the study will answer a questionnaire
containing statements related to this research problem. In distributing questionnaires to collect data,
questionnaires are distributed online or electronically using Google Form media to respondents who match the research criteria.
Data Analysis Methods
The data analysis used was descriptive analysis and quantitative analysis which was stated by numbers. The research data obtained were analyzed using statistical tools through the help of the
SPSS (Statistical Product and Service Solutions) program version 26.0.
Validity and reliability tests will be carried out to test the research instrument. And statistical
data analysis in this study uses the analysis of the coefficient of determination (R2) partially and multiple, and hypothesis testing.
IV. RESEARCH RESULT
4.1. Validity test
The validity test is used to measure the validity of a questionnaire. A questionnaire can be said to be valid if the statements contained in the questionnaire are able to reveal something that
will be measured by the questionnaire. The research instrument is declared valid if it has a
validation value of 0.25 or more. Based on the results of data processing, the results per variable
were obtained with a total of 20 statements, as follows:
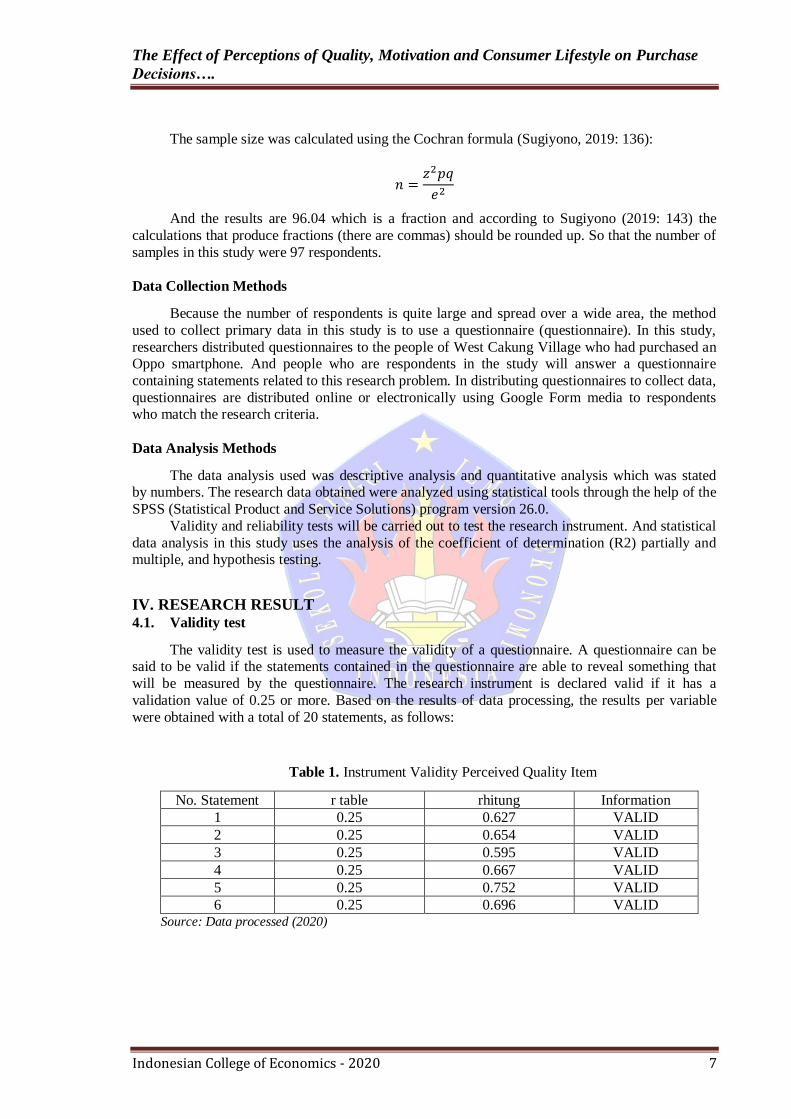
Table 1. Instrument Validity Perceived Quality Item
No. Statement r table rhitung Information
1 0.25 0.627 VALID
2 0.25 0.654 VALID
3 0.25 0.595 VALID
4 0.25 0.667 VALID
5 0.25 0.752 VALID
6 0.25 0.696 VALID Source: Data processed (2020)
Muzhiroh1 and Budiono2
Indonesian College of Economics - 2020 8
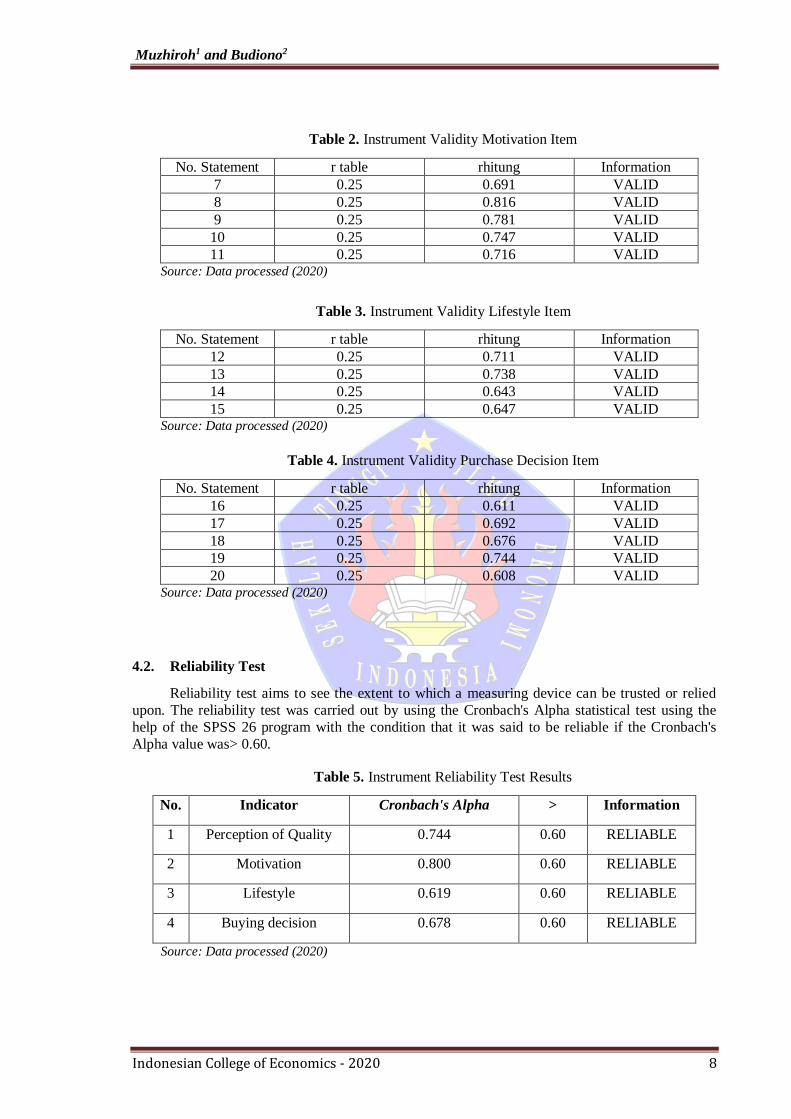
Table 2. Instrument Validity Motivation Item
No. Statement r table rhitung Information
7 0.25 0.691 VALID
8 0.25 0.816 VALID
9 0.25 0.781 VALID
10 0.25 0.747 VALID
11 0.25 0.716 VALID Source: Data processed (2020)
Table 3. Instrument Validity Lifestyle Item
No. Statement r table rhitung Information
12 0.25 0.711 VALID
13 0.25 0.738 VALID
14 0.25 0.643 VALID
15 0.25 0.647 VALID Source: Data processed (2020)
Table 4. Instrument Validity Purchase Decision Item
No. Statement r table rhitung Information
16 0.25 0.611 VALID
17 0.25 0.692 VALID
18 0.25 0.676 VALID
19 0.25 0.744 VALID
20 0.25 0.608 VALID Source: Data processed (2020)
4.2. Reliability Test
Reliability test aims to see the extent to which a measuring device can be trusted or relied
upon. The reliability test was carried out by using the Cronbach's Alpha statistical test using the
help of the SPSS 26 program with the condition that it was said to be reliable if the Cronbach's
Alpha value was> 0.60.
Table 5. Instrument Reliability Test Results
No. Indicator Cronbach's Alpha > Information
1 Perception of Quality 0.744 0.60 RELIABLE
2 Motivation 0.800 0.60 RELIABLE
3 Lifestyle 0.619 0.60 RELIABLE
4 Buying decision 0.678 0.60 RELIABLE
Source: Data processed (2020)
The Effect of Perceptions of Quality, Motivation and Consumer Lifestyle on Purchase
Decisions….
Indonesian College of Economics - 2020 9
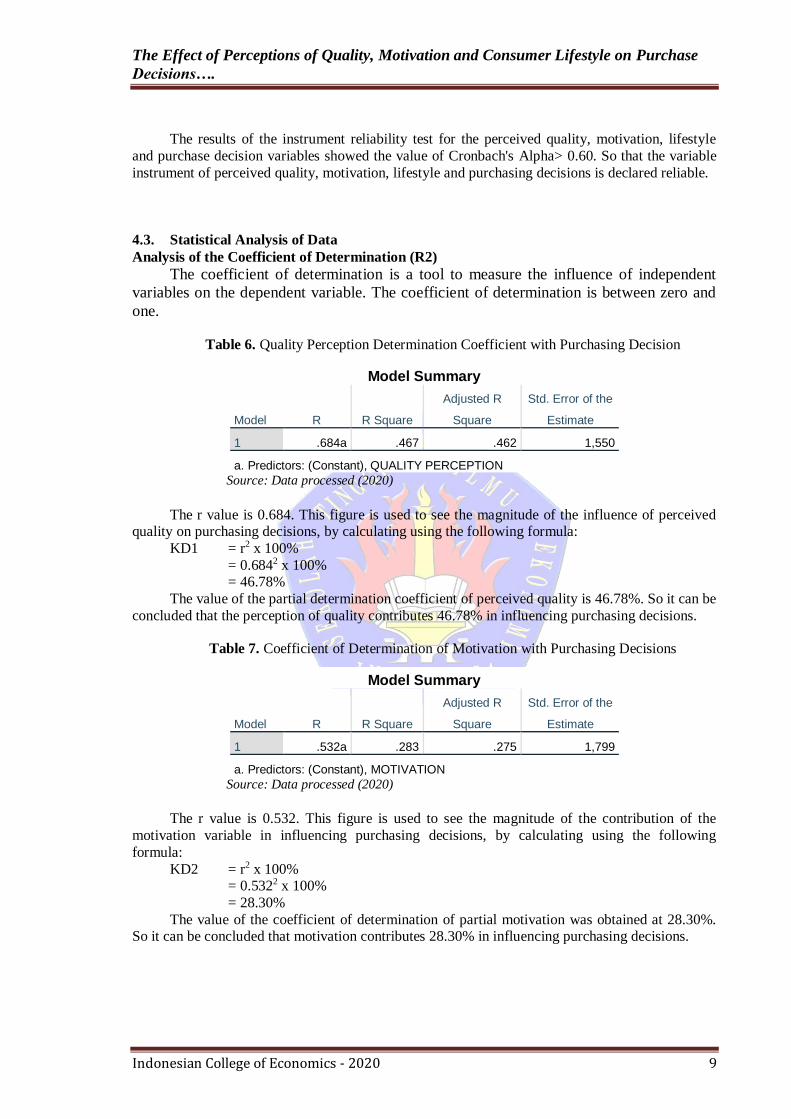
The results of the instrument reliability test for the perceived quality, motivation, lifestyle
and purchase decision variables showed the value of Cronbach's Alpha> 0.60. So that the variable
instrument of perceived quality, motivation, lifestyle and purchasing decisions is declared reliable.
4.3. Statistical Analysis of Data
Analysis of the Coefficient of Determination (R2)
The coefficient of determination is a tool to measure the influence of independent
variables on the dependent variable. The coefficient of determination is between zero and
one.
Table 6. Quality Perception Determination Coefficient with Purchasing Decision
Model Summary
Model R R Square
Adjusted R
Square
Std. Error of the
Estimate
1 .684a .467 .462 1,550
a. Predictors: (Constant), QUALITY PERCEPTION
Source: Data processed (2020)
The r value is 0.684. This figure is used to see the magnitude of the influence of perceived quality on purchasing decisions, by calculating using the following formula:
KD1 = r2 x 100%
= 0.6842 x 100% = 46.78%
The value of the partial determination coefficient of perceived quality is 46.78%. So it can be
concluded that the perception of quality contributes 46.78% in influencing purchasing decisions.
Table 7. Coefficient of Determination of Motivation with Purchasing Decisions
Model Summary
Model R R Square
Adjusted R
Square
Std. Error of the
Estimate
1 .532a .283 .275 1,799
a. Predictors: (Constant), MOTIVATION
Source: Data processed (2020)
The r value is 0.532. This figure is used to see the magnitude of the contribution of the
motivation variable in influencing purchasing decisions, by calculating using the following
formula:
KD2 = r2 x 100% = 0.5322 x 100%
= 28.30%
The value of the coefficient of determination of partial motivation was obtained at 28.30%. So it can be concluded that motivation contributes 28.30% in influencing purchasing decisions.
Muzhiroh1 and Budiono2
Indonesian College of Economics - 2020 10
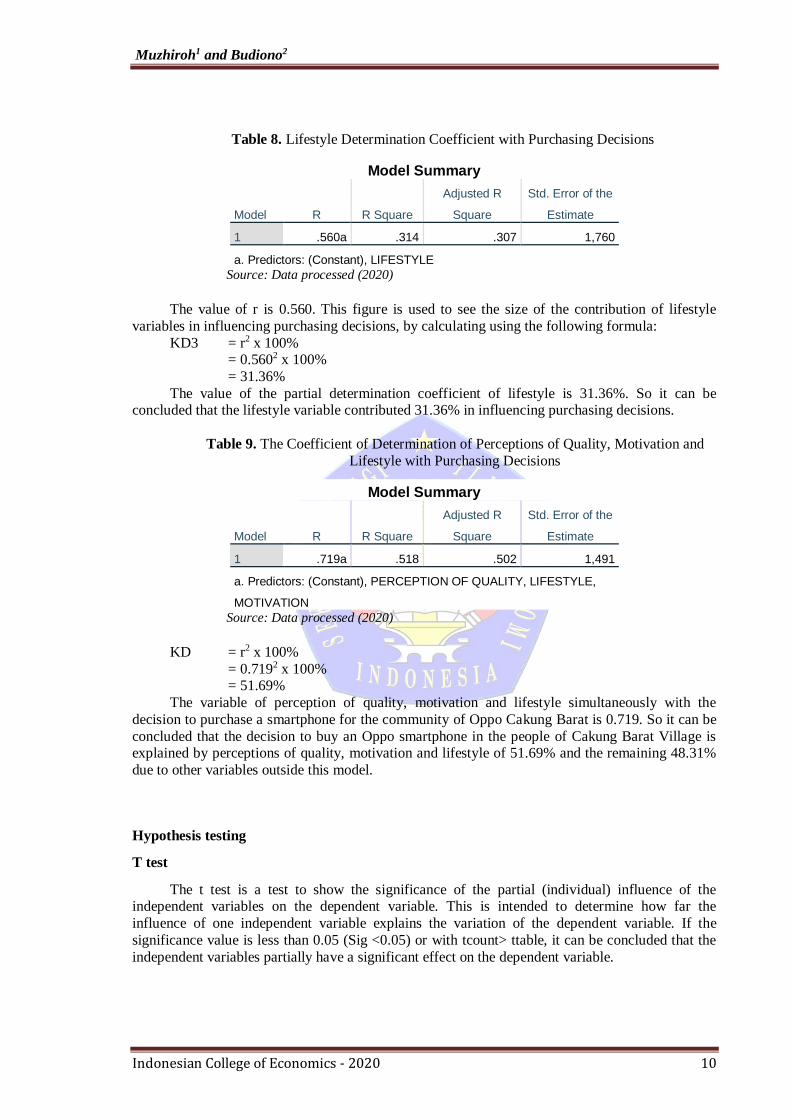
Table 8. Lifestyle Determination Coefficient with Purchasing Decisions
Model Summary
Model R R Square
Adjusted R
Square
Std. Error of the
Estimate
1 .560a .314 .307 1,760
a. Predictors: (Constant), LIFESTYLE
Source: Data processed (2020)
The value of r is 0.560. This figure is used to see the size of the contribution of lifestyle
variables in influencing purchasing decisions, by calculating using the following formula:
KD3 = r2 x 100% = 0.5602 x 100%
= 31.36%
The value of the partial determination coefficient of lifestyle is 31.36%. So it can be concluded that the lifestyle variable contributed 31.36% in influencing purchasing decisions.
Table 9. The Coefficient of Determination of Perceptions of Quality, Motivation and
Lifestyle with Purchasing Decisions
Model Summary
Model R R Square
Adjusted R
Square
Std. Error of the
Estimate
1 .719a .518 .502 1,491
a. Predictors: (Constant), PERCEPTION OF QUALITY, LIFESTYLE,
MOTIVATION
Source: Data processed (2020)
KD = r2 x 100%
= 0.7192 x 100% = 51.69%
The variable of perception of quality, motivation and lifestyle simultaneously with the
decision to purchase a smartphone for the community of Oppo Cakung Barat is 0.719. So it can be
concluded that the decision to buy an Oppo smartphone in the people of Cakung Barat Village is explained by perceptions of quality, motivation and lifestyle of 51.69% and the remaining 48.31%
due to other variables outside this model.
Hypothesis testing
T test
The t test is a test to show the significance of the partial (individual) influence of the independent variables on the dependent variable. This is intended to determine how far the
influence of one independent variable explains the variation of the dependent variable. If the
significance value is less than 0.05 (Sig <0.05) or with tcount> ttable, it can be concluded that the
independent variables partially have a significant effect on the dependent variable.
The Effect of Perceptions of Quality, Motivation and Consumer Lifestyle on Purchase
Decisions….
Indonesian College of Economics - 2020 11
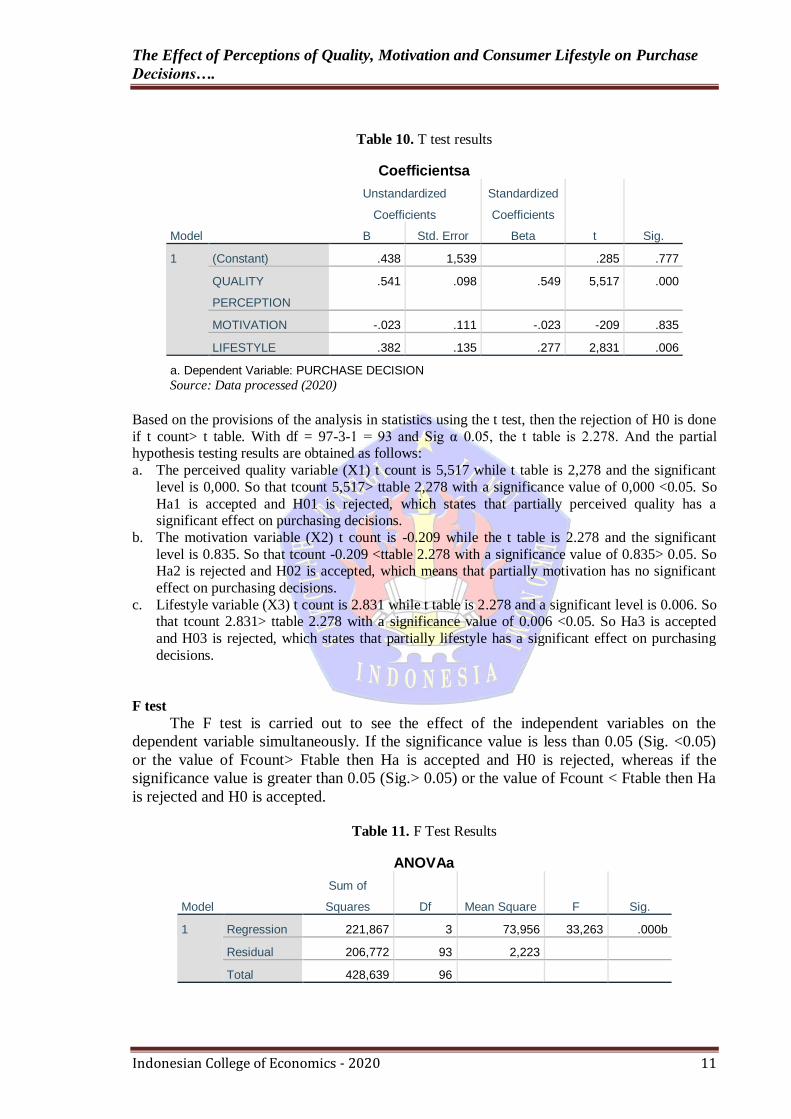
Table 10. T test results
Coefficientsa
Model
Unstandardized
Coefficients
Standardized
Coefficients
t Sig. B Std. Error Beta
1 (Constant) .438 1,539 .285 .777
QUALITY
PERCEPTION
.541 .098 .549 5,517 .000
MOTIVATION -.023 .111 -.023 -209 .835
LIFESTYLE .382 .135 .277 2,831 .006
a. Dependent Variable: PURCHASE DECISION
Source: Data processed (2020)
Based on the provisions of the analysis in statistics using the t test, then the rejection of H0 is done
if t count> t table. With df = 97-3-1 = 93 and Sig α 0.05, the t table is 2.278. And the partial hypothesis testing results are obtained as follows:
a. The perceived quality variable (X1) t count is 5,517 while t table is 2,278 and the significant
level is 0,000. So that tcount 5,517> ttable 2,278 with a significance value of 0,000 <0.05. So
Ha1 is accepted and H01 is rejected, which states that partially perceived quality has a significant effect on purchasing decisions.
b. The motivation variable (X2) t count is -0.209 while the t table is 2.278 and the significant
level is 0.835. So that tcount -0.209 <ttable 2.278 with a significance value of 0.835> 0.05. So Ha2 is rejected and H02 is accepted, which means that partially motivation has no significant
effect on purchasing decisions.
c. Lifestyle variable (X3) t count is 2.831 while t table is 2.278 and a significant level is 0.006. So that tcount 2.831> ttable 2.278 with a significance value of 0.006 <0.05. So Ha3 is accepted
and H03 is rejected, which states that partially lifestyle has a significant effect on purchasing
decisions.
F test
The F test is carried out to see the effect of the independent variables on the
dependent variable simultaneously. If the significance value is less than 0.05 (Sig. <0.05)
or the value of Fcount> Ftable then Ha is accepted and H0 is rejected, whereas if the
significance value is greater than 0.05 (Sig.> 0.05) or the value of Fcount < Ftable then Ha
is rejected and H0 is accepted.
Table 11. F Test Results
ANOVAa
Model
Sum of
Squares Df Mean Square F Sig.
1 Regression 221,867 3 73,956 33,263 .000b
Residual 206,772 93 2,223
Total 428,639 96
Muzhiroh1 and Budiono2
Indonesian College of Economics - 2020 12
a. Dependent Variable: PURCHASE DECISION
b. Predictors: (Constant), PERCEPTION OF QUALITY, LIFESTYLE, MOTIVATION
Source: Data processed (2020)
The Fcount value of 33.263 is greater with a significance value of 0.000 (0.000 <0.05), while the Ftable is 2.701. This means that Fcount> Ftable (33.263> 2.701), so it can be seen that the
perceived variables of quality, motivation and lifestyle have a significant effect simultaneously on
purchasing decisions. So it can be concluded that the variable perceptions of quality, motivation
and lifestyle simultaneously affect the purchasing decision of an Oppo smartphone in the people of Cakung Barat Village. And then Ha is accepted and H0 is rejected.
V. CONCLUSION
Based on the results of the research that has been carried out and the data analysis described
in the previous chapter, it can be concluded that the following are: 1. The results showed that the Cakung Barat people pay attention to the perception of the
quality of the product in making the purchase decision for an Oppo smartphone. The
contribution value for the perception of high quality reflects that consumers have a good
view of the quality of Oppo smartphones and are things that consumers always consider when making purchases.
2. The results showed that the people of Cakung Barat Village were not really considered in
making decisions to buy an Oppo smartphone. The low contribution value of consumer motivation means that the level of needs that need to be met to feel self-satisfaction cannot
be felt by consumers, because consumer satisfaction has not been fulfilled after making a
purchase, so consumer motivation is low. And this can raise doubts for consumers to make repeat purchases in the future.
3. The results showed that the people of Cakung Barat Village paid attention to their lifestyle in
making decisions to buy an Oppo smartphone. This is because the lifestyle of each individual
is different, and Oppo smartphones can reflect the user's lifestyle, namely the people of West Cakung Village which can be seen from their activities, interests and opinions.
4. The results showed that the people of Cakung Barat Village in buying Oppo smartphones
pay attention to the perceived quality, motivation and lifestyle factors that exist in themselves. Good quality, in accordance with the user's lifestyle, and can provide satisfaction
to users can be important things that consumers will consider when making a purchase
decision.
Suggestion
1. From the results of research on quality perceptions of purchasing decisions for Oppo smartphones, it can be suggested that Oppo Corporation should maintain and continue to
improve product quality both in terms of hardware and product software. As well as
continuing to create new innovations and develop existing technology. So that consumers still have a good perception of the quality of Oppo products and will be able to make repeat
purchases in the future. Oppo Corporation can update the Android system regularly so that
there are no bugs in running the application.
2. From the results of research on consumer motivation towards purchasing decisions for Oppo smartphones, it can be suggested to Oppo Corporation to better understand what consumers
need in order to increase purchase satisfaction on the products it produces and to make
consumers make repeat purchases. Like the Oppo corporation, it can improve service to
The Effect of Perceptions of Quality, Motivation and Consumer Lifestyle on Purchase
Decisions….
Indonesian College of Economics - 2020 13
every Oppo user, presenting a variety of premium Oppo smartphones at a cheaper price and
not much different quality.
3. From the results of consumer lifestyle research on Oppo smartphone purchasing decisions. So it can be suggested to Oppo Corporation to continue to innovate by understanding the
lifestyle of consumers by following the times and technology that is more innovative and
interesting by having the advantages of smartphones that are different from competitors. Such as creating or adding product features or an application that can make it easier for users
to connect bluetooth headsets (air buds) which can make it easier for users to listen to music
to help receive calls while on the move.
Limitations and Further Research Development
The method of collecting data in research using a questionnaire, where sometimes the
statements answered by respondents do not correspond to the actual situation. And this research only examines Perceptions of Quality, Motivation and Lifestyle. There are still many other factors
that can influence Purchasing Decisions such as employment, economic conditions, and others. So
it is hoped that further research can examine more deeply the influence of perceived quality,
motivation and lifestyle on purchasing decisions. Because it has been proven that in the results of this study the variables of perceived quality, motivation and lifestyle have an effect of 51.69% on
purchasing decisions. Which means that there are other factors as big as 48.31% that influence
consumer purchasing decisions.
Muzhiroh1 and Budiono2
Indonesian College of Economics - 2020 14
REFERENCE LIST
Abdilla, M. and I. Agus. 2020. Keputusan Pembelian Smartphone Ditinjau dari Kebutuhan dan
Gaya Hidup Mahasiswa Fakultas Ekonomi dan Bisnis Universitas Dharma Andalas. Jurnal Ekonomi dan Bisnis Dharma Andalas, 22 (1). 85-95.
Azis, I. 2019. Oppo Mendominasi Pasar Smartphone Indonesia Pada Q2 2019. Diunduh tanggal
14 April 2020, https://tirto.id/oppo-mendominasi-pasar-smartphone-indonesia-pada-q2-2019-egcV.
Badjamal, F. A. 2019. Pengaruh Gaya Hidup dan Ekuitas Merek Terhadap Keputusan Pembelian Handphone Merek Samsung Di Kota Palu. Jurnal Trend, 7 (2). 1-11.
Firmansyah, M. A. 2018. Perilaku Konsumen (Sikap dan Pemasaran). Yogyakarta: Deepublish.
Forenbacher, I. et. al. 2019. Determinants Of Mobile Phone Ownership in Nigeria. Elsevier
Telecomunication Policy, 43. 1-12.
Guritno, Y. 2020. Sejarah Oppo di Indonesia Hingga Sepopuler Saat ini. Diunduh tanggal 14 April
2020, https://review.bukalapak.com/gadget/sejarah-perkembangan-oppo-di-indonesia-
hingga-sepopuler-saat-ini-2772.
Kamugisha, E. R. T. 2017. The Basics of Business Management – Vol II: Marketing, Logistics,
Procurement and Law. Bookboon.com.
Kamus Besar Bahasa Indonesia Daring. 2016. KBBI Daring. Diunduh tanggal 09 Mei 2020,
https://kbbi.kemindukbud.go.id/entri/motivasi.
Kartajaya, H. 2010. Brand Operation. Jakarta: Erlangga.
Kayode, O. 2014. Marketing Communications 1st edition. Bookboon.com.
Kompas, 2019. Salip Samsung, Oppo Jadi Pabrikan Ponsel Nomor Satu di Indonesia. Diunduh
tanggal 14 April 2020, https:///tekno.kompas.com/read/2019/08/13/10570037/salip-samsung-
oppo-jadi-pabrikan-ponsel-nomor-satu-di-indonesia.
Kotler, P. and G. Amstrong. 2014. Principle Of Marketing 15th edition. New Jersey: Pearson
Prentice Hall.
Kotler, P. and G. Amstrong. 2016. Prinsip-Prinsip Pemasaran Edisi 13 Jilid 1. Jakarta: Erlangga.
Kotler, P. and K. L. Keller. 2012. Manajemen Pemasaran Edisi 12. Jakarta: Erlangga.
Kotler, P. and K. L. Keller. 2013. Manajemen Pemasaran Edisi Ketigabelas Jilid 1. Jakarta: Salemba, PT. Indeks.
Kriyantono, R. 2012. Teknik Praktis Riset Komunikasi. Jakarta: kencana Prenadamedia Group.
The Effect of Perceptions of Quality, Motivation and Consumer Lifestyle on Purchase
Decisions….
Indonesian College of Economics - 2020 15
Kurniawan, D. 2019. Fenomena Penggunaan Ponsel Berdampak pada Perubahan Budaya.
Diunduh tanggal 13 April 2020, https://surabaya.liputan6.com/read/4098250/fenomena-
penggunaan-ponsel-berdampak-pada-perubahan-budaya.
Logo Oppo. Diunduh tanggal 23 Juli 2020, https://www.oppo.com/id/.
Luthfi, A. 2014. Di Indonesia, Smartphone Sudah Menjadi Kebutuhan Utama. Diunduh tanggal 13
April 2020, https://techno.okezone.com/read/2014/05/13/57/984293/di-indonesia-
smartphone-sudah-menjadi-kebutuhan-utama.
Nastiti, A. P. and D. R. Fahlefi. 2019. Pengaruh Kesadaran Merk, Persepsi Kualitas dan Loyalitas
Merk Terhadap Keputusan Pembelian Handphone Vivo Pada Angkasa cell di Kota
Semarang. Jurnal STIE Semarang, 11 (3), 64-77.
Neolaka, A. 2014. Metode Penelitian dan Statistik. Bandung: PT. Remaja Rosdakarya.
Rahim, A. et. al. 2016. Factors Influencing Purchasing Intention of Smartphone Among University Students. Elsevier Procedia Economics and Finance, 37, 245-253.
Rossanty, Y. et. al. 2018. Consumer Behavior in Era Millenial. Medan: Lembaga Penenlitian dan Penulisan Ilmiah Aqli.
Saptutyningsih, E. and E. Setyaningrum. 2019. Penelitian Kuantitatif Metode dan Alat Analisis. Yogyakarta: Gosyen.
Saputra, M. A. et. al. 2019. Negara Asal Produk, Persepsi Kualitas dan Merek: Pengaruhnya
Terhadap Keputusan pembelian Smartphone. Jurnal Samudra Ekonomi dan Bisnis, 10 (1), 12-22.
Setiadi, N. J. 2015. Perilaku Konsumen Perspektif Kontemporer Pada Motif, Tujuan, dan Keinginan Konsumen. Jakarta: Prenamedia Group.
Sugiyono. 2019. Metode Penelitian Kuantitatif, Kualitatif, dan R&D. Bandung: Alfabeta.
Sumarwan, U. 2015. Perilaku Konsumen Teori dan Penerapannya dalam Pemasaran. Bogor:
Ghalia Indonesia.
Syahril, R. 2017. Pengaruh Motivasi dan Gaya Hidup Konsumen Terhadap Keputusan Pembelian
Handphone Android. Jurnal Komunikasi, 8 (3), 192-199.
Tjiptono, F. 2011. Manajemen & Strategi Merek. Yogyakarta: Andi Offset.
Widjaja, B. T. 2013. Lifestyle Marketing. Jakarta: Gramedia Pustaka Utama.
Wikipedia Bahasa Indonesia. 2020. OPPO. Diunduh tanggal 9 April 2020,
https://id.wikipedia.0rg/wiki/OPPO.
Wulandari, D. 2016. Dalam Kurun Lima Tahun, Alasan Konsumen Membeli Ponsel Alami
Pergeseran. Diunduh tanggal 1 Mei 2020, https://mix.co.id/marcomm/brand-
Muzhiroh1 and Budiono2
Indonesian College of Economics - 2020 16
insight/research/dalam-kurun-lima-tahun-alasan-konsumen-membeli-ponsel-alami-
pergeseran/.
Yunus, N.S.N.M. and W.E.W. Rashid. 2016. The Influence of Country-of-origin- on Consumer
Purchase Intention: The Mobile Phones Brand from China. Elsevier Economics and
Finance, 37, 343-349.