Embed Size (px)
Citation preview

Graduate Theses and Dissertations Iowa State University Capstones, Theses andDissertations
2017
The influence of college readiness and institutionalintervention upon intention to persist among GEDcredentialed community college studentsDavid CarsonIowa State University
Follow this and additional works at: https://lib.dr.iastate.edu/etd
Part of the Higher Education Administration Commons, and the Higher Education and TeachingCommons
This Dissertation is brought to you for free and open access by the Iowa State University Capstones, Theses and Dissertations at Iowa State UniversityDigital Repository. It has been accepted for inclusion in Graduate Theses and Dissertations by an authorized administrator of Iowa State UniversityDigital Repository. For more information, please contact [email protected].
Recommended CitationCarson, David, "The influence of college readiness and institutional intervention upon intention to persist among GED credentialedcommunity college students" (2017). Graduate Theses and Dissertations. 15274.https://lib.dr.iastate.edu/etd/15274

The influence of college readiness and institutional intervention upon intention to persist among GED credentialed community college students
by
David Carson
A dissertation submitted to the graduate faculty
in partial fulfillment of the requirements for the degree of
DOCTOR OF PHILOSOPHY
Major: Education (Educational Leadership)
Program of Study Committee: Linda Hagedorn, Major Professor
Lorenzo Dubois Baber Yu (April) Chen Larry H. Ebbers
Steven A. Freeman
The student author and the program of study committee are solely responsible for the content of this dissertation. The Graduate College will ensure this dissertation is globally
accessible and will not permit alterations after a degree is conferred
Iowa State University
Ames, Iowa
2017
Copyright © David Carson, 2017. All rights reserved.

ii
DEDICATION
To my wife, Sylvia, my life dance partner and rock whose love provided me with the
emotional support and encouragement to make this happen. You complete me! Thank you
for your sacrifice these past three years.
I love you with all my heart.

iii
TABLE OF CONTENTS
LIST OF FIGURES ................................................................................................................... vi
LIST OF TABLES ................................................................................................................... vii
ACKNOWLEDGMENTS ...................................................................................................... viii
ABSTRACT ............................................................................................................................... ix
CHAPTER 1. THE PROBLEM AND ITS UNDERLYING FRAMEWORK .......................... 1
Background of the Problem ........................................................................................................ 2
Statement of the Problem ............................................................................................................ 6
Purpose of the Study ................................................................................................................... 8
Research Questions ..................................................................................................................... 9
Hypotheses .................................................................................................................................. 9
Significance of the Problem ...................................................................................................... 10
Conceptual Framework ............................................................................................................. 11
Methodology ............................................................................................................................. 14
Assumptions .............................................................................................................................. 15
Limitations ................................................................................................................................ 15
Delimitations ............................................................................................................................. 15
Definition of Terms................................................................................................................... 16
Organization of the Study ......................................................................................................... 17
CHAPTER 2. REVIEW OF THE LITERATURE .................................................................. 18
The Nature of Adult Learning ................................................................................................... 20
Toward a Definition of the Adult Learner ......................................................................... 20
Theoretical Perspectives of Adult Learner Needs ............................................................. 21
Meeting Adult Learner Campus Needs ............................................................................. 24
Legislative History of Adult Learners in Adult Basic Education Programs ..................... 26
GED: An Expression of Adult Learning Theory ..................................................................... 28
GED Credentialed Student Barriers to Persistence ........................................................... 28
GED Credentialed Students and College Readiness ................................................................. 29
The GED as Predictor of College Readiness ..................................................................... 29

iv
Institutional Intervention: Empowering GED Credentialed Students ..................................... 30
The Nature of Academic Advising .................................................................................... 30
Advising as an Expression of Educational Mission .......................................................... 31
Advising as an Expression of Academic Planning ............................................................ 33
Faculty Course Syllabi Impact Upon Student Persistence ................................................ 33
Faculty Instructional Method’s Impact Upon Student Persistence .................................... 35
Previous Class Experience’s Impact Upon Student Persistence ........................................ 37
Summary ................................................................................................................................... 39
CHAPTER 3. RESEARCH METHODOLOGY ...................................................................... 41
Research Questions ................................................................................................................... 41
Hypothesis................................................................................................................................. 42
Research Design ........................................................................................................................ 42
Survey Instrument .............................................................................................................. 43
Pilot Study ......................................................................................................................... 45
Reliability and Validity ...................................................................................................... 45
Population and Sample ...................................................................................................... 47
Data Collection .................................................................................................................. 48
Conceptual Model ..................................................................................................................... 49
Variables in the Study ............................................................................................................... 50
Dependent (Endogenous) Variable .................................................................................... 50
Independent (Exogenous) Variables .................................................................................. 51
Data Analysis ............................................................................................................................ 52
Descriptive and Comparative Analysis ............................................................................. 53
Factor Analysis (Exploratory and Confirmatory) .............................................................. 53
Comparative Analysis ........................................................................................................ 54
Logistic Regression Analysis ............................................................................................ 55
Missing Data Imputation ................................................................................................... 56
Limitations ................................................................................................................................ 57
Delimitations ............................................................................................................................. 58
Ethical Concerns ....................................................................................................................... 58
Summary ................................................................................................................................... 58

v
CHAPTER 4. FINDINGS ........................................................................................................ 60
Findings Related to Research Question 1 ................................................................................. 60
Findings Related to Research Question 2 ................................................................................. 63
Exploratory Factor Analysis .............................................................................................. 63
Confirmatory Factor Analysis ........................................................................................... 68
Statistical Model Fit Options ............................................................................................. 69
Findings Related to Research Question 3 ................................................................................. 73
Results of independent t-tests ............................................................................................ 73
Findings Related to Research Question 4 ................................................................................. 80
Logistic Regression - Intention to Persist .......................................................................... 81
Summary ................................................................................................................................... 84
CHAPTER 5. DISCUSSION ................................................................................................... 86
Discussion of the Findings ........................................................................................................ 87
Discussion of the Descriptive Analysis Findings .............................................................. 87
Discussion of Factor Analysis Findings ............................................................................ 88
Discussion of Comparative Analysis Findings .................................................................. 89
Discussion of Logistic Regression Analysis Findings ....................................................... 90
Implications............................................................................................................................... 91
Implications for Institutional Practice ............................................................................... 91
Advising Interaction .......................................................................................................... 92
Faculty Interaction ............................................................................................................. 95
Pedagogical considerations (Developmental Education) .................................................. 97
Implications for Future Research ....................................................................................... 98
Conclusions ............................................................................................................................. 100
APPENDIX A: 2014 (SENSE) SURVEY .............................................................................. 101
APPENDIX B: INSITUTITONAL REVIEW BOARD (IRB) STATUS ............................... 109
APPENDIX C: 2014 SENSE SURVEY CODEBOOK .......................................................... 110
APPENDIX D: LOGISTIC REGRESSION COEFFICIENTS .............................................. 130
REFERENCES ....................................................................................................................... 131

vi
LIST OF FIGURES
Figure 3.1 Applying Knowles’ (1980) theory of andragogy…………………..……..………….50
Figure 4.1 First-order CFA model results for GED credentialed students……………………....72
Figure 4.2. Model of College Readiness and Institutional Intervention Upon Intention to
Persist………………………………………………………………………………….....82

vii
LIST OF TABLES
Table 4.1 Frequency for all, high school diploma, and GED credentialed participants………....61
Table 4.2 Exploratory Factor Analysis Results………………...…………………………….….65
Table 4.3 Goodness-of-fit Indices for the Hypothesized Model………………………..…….....70
Table 4.4 CFA Results for GED credentialed students…..…..………………...………………..71
Table 4.5 Means, Standard Deviations, and Independent Samples t-Test Results on Age and HS
Grade………………………………………………………………...……….…………..74
Table 4.6 Means, Standard Deviations, and Independent Samples t-Test Results on Advisor
Support, Faculty Support, College Ready Student Networking, College Ready Skill Sets,
and College Ready Attitude.……………………………………….………………….....75
Table 4.7 Cross-tabulation on Marital Status for Student Groups ……………….……………...76
Table 4.8 Cross-tabulation on Children Living at Home for Student Groups…………………...77
Table 4.9 Cross-tabulation on Enrollment Status for Student Groups…………………………...78
Table 4.10 Cross-tabulation on First Generation Status for Student Groups…..………………...79
Table 4.11 Cross-tabulation on Developmental Classes for Student Groups……………...…..…80
Table 4.12 Logistic Regression Coefficients – Intention to Persist………………………………84

viii
ACKNOWLEDGMENTS
First, to my major professor Dr. Linda Hagedorn, who graciously served as my
committee chair late in the dissertation process. Though like a child stumbling while first
learning to walk, you encouraged me by supplying language to express my passion for students.
Your ability to seamlessly draw out practical application from raw statistical data provided me a
model of living out the role of practitioner–scholar.
I also want to thank my committee members. Dr. Larry Ebbers, who many years ago, in
LINC asked me “so when are you going to get your Ph.D.?” Your belief in me to do what I
thought impossible carried me through some very rough times on this journey. Dr. April Chen,
your patient willingness to communicate statistical inferences using pictorial models was
extremely helpful in my ability to advocate for student funding and program creation. Dr.
Lorenzo Baber, your ability to find value and positively spin any comments I made in class
modeled for me patience needed with my own students. Dr. Steve Freeman, your willingness
to challenge my logic and insistence to elucidate my thoughts and words helped me in this
journey.
I would also like to thank my previous plan of study committee chairpersons, Drs.
Janice Friedel and Soko Starobin. Dr. Friedel, your coursework on community college
governance opened up a new world for me. Dr. Starobin, your belief in me and opportunity to
hone my research skills became real through giving me an opportunity to serve on your
OCCRP research team.
Finally, Dr. Ran Li; first as my statistics graduate assistant, then colleague. As a good
friend, you constantly reminded me “don’t worry.” Your willingness to “pour yourself” into
me was a major reason this journey could be completed. Thank you so much!

ix
ABSTRACT
This study’s purpose is to examine how institutional intervention and college readiness impact
GED (General Education Development) credentialed students’ intent to persist at community
college. Specifically, the study examines a) differences in background information between
students possessing GED credentials vs. traditional high school diploma regarding intent to
persist at community college, b) factors influencing persistence, and c) possession of a GED
credential’s impact upon intention to persist.
Three theories were foundation of this study’s conceptual framework including 1)
Knowles’ (1984) andragogy, Ryan & Deci’s (2000) self-determination, and Ajzen’s (1991)
planned behavior. The theory of andragogy informs institutional representatives regarding adult
learner need. Self-determination theory reveals GED credential students’ life situations and their
need for autonomy resulting in academic persistence. Theory of planned behavior reminds
administrators that control and volition must include learning environments conducive to task
accomplishment.
This study employed a quantitative method using the 2014 SENSE survey. Student
demographics including background, socioeconomic, and enrollment patterns were analyzed
through descriptive statistics. Comparison between students possessing GED credentials and
traditional high diplomas was accomplished using t-test and crosstabulation methods. Logistic
regression analysis was conducted to assess the probability to which college readiness and
institutional intervention predicts students’ intent to persist in community college.
The results indicate a greater percentage of GED credentialed students were non-
traditional aged, married, had children living in the home, had a greater instance of self-

x
reported lower grades, and were first generation students. Results of independent samples t-
tests and cross-tabulation tests indicated statistically significant difference in age, self-
reported high school GPA, college readiness, and institutional intervention, between students
who possessed GED credentials vs. those who earned a traditional high school diploma. The
logistic regression analysis revealed that gender, race/ethnicity, 1st generation enrollment
status, student enrolled in at least one developmental class, advising, and faculty support were
statistically significant factors on GED credentialed students’ intent to persist.
Community college faculty intervention has great impact upon intention to persist for
GED credentialed students. This study demonstrated the importance of syllabi containing clear
student expectations, student-centered pedagogical method, and direction to obtain instructor
assistance. Further research would benefit GED credentialed community college students.

1
CHAPTER 1
THE PROBLEM AND ITS UNDERLYING FRAMEWORK
It is graduation day. Men and women of all ages, wearing traditional academic garb,
nervously wait for their grand entrance among adoring, proud and vocal family members. All at
once, the familiar tune of Pomp and Circumstance begins, all stand and tears begin to flow.
After short speeches from previous and current graduates, the big moment arrives; the calling of
individual names and the proud walk across the stage to be formally recognized for their hard
work. Following the ceremony, family members and graduates hug one another and take
pictures. This is no ordinary graduation though as the graduation ceremony is for those receiving
their General Equivalency Development credential. Armed with this accomplishment and
optimistic they can replicate this feat in college, only 11.8% will earn a credential from a post-
secondary institution (Patterson, Zhang, Song, & Guison-Dowdy, 2010). What accounts for this
sobering reality? More importantly, by considering numerous student variables and reevaluating
policies, can institutional members better serve this often marginalized and forgotten student
population?
Though only 12 percent of United States citizens do not possess a high school or high
school equivalency credential, 58 percent do not possess at least an associate degree (Ryan &
Bauman, 2016). This is troubling, considering the continuing skilled labor shortage in the
United States, whereby nearly half of Americans possess only basic and/or below basic literacy
skills (Kutner, et al., 2007). As business and industry increasingly inhabit global and technical
settings, community colleges have become the obvious place to incorporate career and technical
foci along with the traditional mission of preparing students for university life (National
Association of Colleges and Employers, 2011).

2
In the context of a vast increase in the demand for higher levels of education, the Obama
administration unveiled a plan to empower community colleges to become a major force in
equipping a skilled labor workforce. The proposal included graduating five million new college
graduates by the year 2020, create a new federal funding process incentivized by innovative
efforts to partner with business/industry, upgrade physical community college facilities,
refocusing education to include increased use of technology, and an overhaul of the financial aid
system (The White House, 2009).
As the mission of our community colleges is to educate and empower self-reliant citizens,
this study’s intent is to explore how faculty/advisor intervention and student college readiness
heightens GED credentialed students’ intention to persist in their community college educational
paths.
Background of the Problem
Early Development of the GED (General Education Development)
The GED testing system began in 1942 as a method to empower those who enlisted for
military service prior to completing high school. In addition to measuring cognitive skills for
armed services, the system provided a credential for workforce reentry or continuation of
postsecondary education upon military discharge (Song & Hsu, 2008; Houle, Burr, Hamilton, &
Yale, 1947; Tyler, 2005).
A more progressive form of education regarded the Carnegie system of credits as
redundant. Ralph Tyler (University of Chicago) and E.F. Lindquist (University of Iowa) became
active voices of the Progressive educational movement, whereby general education curricula
including democratic societal principles, work skills, reading, and general mathematics to be the
core of education (Quinn, 2002).
In 1943, the GED was first offered to those soldiers who had not completed high school
due to military enlistment. That same year, the Army contracted the American Council on

3
Education (ACE) to systematize a process of awarding military veterans credit for their service.
Service members who passed the battery of GED examinations would be awarded a credential
asserting equivalent status to a high school diploma (Houle et al., 1947).
Victorious returning veterans, armed with the GED credential and GI Bill found colleges
and universities open to their presence on campus. The ACE asserted that the GED become the
primary measure for college readiness. This would mark the origin of the GED credential used
for high school equivalency purposes (Quinn, 2002).
From Military to Civilian Use – 1942 Test Series
By 1948, 21 states allowed civilians to utilize the GED in lieu of a high school diploma.
This vast increase prompted states to legislate minimum age for test taking to include 18 through
22. By 1959, the number of civilian test takers exceeded those military personnel (Quinn, 2002).
Consequently, the GED Testing Service was born in 1963 (C. A. Allen & Jones, 1992).
By the early 1950s, the American Council on Education initiated research regarding
veteran’s college readiness. Unfortunately, the research conducted by Paul Dressel and
John Schmid (later confirmed by Benjamin Bloom and Ralph Tyler) suggested the 7th
percentile passing standard was too low and be raised to the 50th percentile but ultimately
the ACE chose not to accept any of the research based recommendations (Quinn, 2002).
A Time for Revision – 1978 and 1988 Test Series
The vast growth in the number of GED test takers and test centers during the
1960’s was attributed by societal factors including entrance into the Vietnam War, the
codification of adult basic education in the passage of the Title IIB of the Economic
Opportunity Act of 1964, and the judgment that the GED was a cost-effective method to

4
provide high school credentials for those wishing to pursue postsecondary education
and/or increase employment opportunities (Quinn, 2002; Tyler, 2005).
As manufacturing industries began to be negatively impacted by increased international
competition, out of control energy prices, declining profitability, inflation and unemployment,
educators believed proposed changes in secondary curricula were needed to address this looming
national crisis. As GED understood itself as high school equivalency a new test revision was
formulated moving from fact recall to application of real life concepts. Criticism abounded at
this change suggesting that test-takers could pass this type of assessment simply by being aware
of current events from television, newspapers, and other mass media (Quinn, 2002).
Societal and economic changes in the United States and global economies
prompted major revisions in the GED test in 1978 and 1988. The 1978 changes included
a reduction in the number of reading questions, an increase in life application math
questions and a reduction in testing time from 10 hours to six (Tyler, 2005). The
increasing use of technology in the 1980’s prompted the GED Testing Service to conduct
a five-year study regarding the efficacy of the exam. As society continued to move from
industry to information, the GED testing service in 1988 authorized a major review of its test and
protocols. The test included creation of an essay, demonstration of problem solving skills,
recognition of diversity, sources of major change in society, and demonstration of proficiency in
answering questions contextualized to daily situations. This movement to applied learning was
confirmed by polls revealing about two thirds of test takers did so to pursue credentials in
postsecondary institutions (GED Testing Service, 2015).

5
A Reversal of Sorts - 2002 Series
In 2002, a fourth-generation GED test was released, influenced by content specialists in
math, science, English and the social sciences. Changes included alignment with national
secondary educational standards, specific organization of an essay, scoring rubrics for the writing
portion of the test and the use of a calculator for the math subtest (Ezzelle & Setzer, 2009).
The test battery included five subsets: Language Arts-Writing; Language Arts- Reading;
Social Studies; Science; and Mathematics. The Language Arts-Writing section contained
multiple-choice questions and an essay requiring examples from test-taker’s own experiences
while the reading section required answer of multiple choice questions measuring reading
comprehension. Social Studies and Science required demonstration of correct interpretation of
source materials like charts, graphs or maps through the answering of multiple-choice items. The
Mathematics test requires answers of questions both with and without calculator assistance. The
maximum allotted time to complete the exam was just over seven hours (Ezzelle & Setzer,
2009). Two additional changes included the addition of contextualized questions using business
examples and those taking this exam could not use subset test results from previous exams to be
applied here (Tyler, 2005).
Toward College Readiness – 2014 Series
The fifth generation of GED tests was released in 2014 and these tests are in use at the
time of this writing by the GED Testing Service (GED Testing Service, 2015). The 2014 GED®
test was directly aligned between the 2014 GED® test content areas and critical college and
career readiness standards presented by the U.S. Department of Education Office of Vocational
and Adult Education (OVAE) (GED Testing Service, 2015). Changes include exclusive
computer delivery, same day scoring for all parts of the test, tri-scoring levels (passing score,

6
college readiness, college credit), and examines Language Arts reasoning, Math reasoning,
Science, and Social Studies (GED Testing Service, 2015).
HiSET (High School Equivalency Test)
Though this study was based on data of those completing a GED credential, it should be
noted that in January 2014, states had the option to utilize different assessment programs and
tests (Zinth, 2015). At the time of this study, only 40 states used the General Educational
Development (GED) exclusively. Iowa has contracted with Educational Testing Service (ETS)
for those wishing to secure high school equivalency credentials, to take the High School
Equivalency Test (HiSET).
Statement of the Problem
Students pursuing GED credentials may have had negative experiences such as behavior
problems, truancy, drug/alcohol use, legal issues, lack of family support, financial constraints,
transportation problems, and lack of technological access (Stephens, 2010). Those who left high
school prior to graduation are at a greater disadvantage of having a lack of experience and
confidence in the workings of education. Viewing the process simply as “passing a test”, GED
students may fail to recognize the benefit of post-secondary education and not gain the
wherewithal and confidence regarding college success (Goodall, 2009).
GED credentialed community college students may possess low self-esteem and perceive
past secondary educational failures as predictive of future failures in any kind of continuing
education (Hardin, 2008). Their inability to see community activity as an opportunity puts into
question the relevancy of continuing within the educational process. In a very real sense, this
population of students experiences an identity crisis whereby a sense of being overwhelmed
precedes attrition. To be successful, the GED credentialed community college student, must

7
believe the educational community is a place where their goals can be accomplished (O’Donnell
& Tobbell, 2007; Lott & O’Dell, 2014).
A core foundation of community colleges is to provide human capital to meet individual
and community needs. Our local economies and employers demand self-reliant skilled workers
(Jones & Kelly, 2007). GED graduates, brought up in single-parent low socio-economic homes,
leaving high school for lack of relevancy, poor grades and/or absenteeism, seek opportunities to
acquire skills such as teamwork, leadership, communication skills, problem solving, and work
ethic. Community colleges should design support programs to include at least academic/career
counseling, mandatory orientation, minimal comprehensive services (e.g. childcare,
transportation, housing), student success courses, learning communities, academic goal setting
and respectful faculty committed to building relationships with students (Braskamp, Trautvetter,
& Ward, 2008).
It is easy to overlook the age demographic in this population and assume that most GED
graduates are over the traditional college age. As such, GED credentialed students as young as
16 are an often-overlooked potential source of community college students. Patterson’s (2014)
exhaustive work with this population noted that GED students in the 16-24 age demographic
included over 316 thousand, comprising just under 57% of the total undergraduate population.
She also notes nearly 65% of those passing the GED exam listed pursuit of further education as
the main reason for completing the GED, only 12% earned some sort of postsecondary
credential. In fact, approximately 50% of those passing the GED exam will drop out of their
postsecondary study within the first semester and those who earn postsecondary credentials do so
in extended lengths of time (Patterson, 2014).

8
Purpose of the Study
The purpose of this study is to identify and explore factors that predict persistence of
students possessing GED credentials attending community college. Specifically, the intent is to
examine how institutional intervention (faculty and advisors) connects with college readiness
(academic behaviors and student skills).
Through quantitative analysis of The Survey of Entering Student Engagement (SENSE),
gleaning student first impressions of their college experience was utilized to measure
institutional intervention level and related variables. Using extant literature as a basis, a model
was constructed considering how faculty/advisor intervention and student college readiness
impacted persistence of GED credentialed community college students. Methods of analysis will
include descriptive, comparative, factor, and logistic regression.
As with any sociological phenomena, motivation to drop out of high school is a complex
issue. The most common reasons posited student boredom, truancy, circle of acquaintances who
judge school irrelevant, too much freedom, and poor academic performance (Azzam, 2007).
Those persons who choose to pursue and succeed in earning the GED credential often
face barriers relating to self-perception and education institutional workings. Judging themselves
ill-prepared for the rigors of college, they reject institutional engagement efforts (in and out of
the classroom) needed to succeed. Though successful in passing the GED exam, they quickly
find their lack of skill sets like essay writing, research, study habits and test taking, as
confirmation that college success is unattainable (Kuh, Buckley, Bridges, & Hayek, 2007). With
minimal formal academic experiences, many GED graduates ironically fail to navigate the
labyrinth of services offered as they don’t know how to ask “right questions”. Institutional

9
personnel assume that students understand their needs and are comfortable asking for help.
Laden with self-doubt, disillusioned students quietly walk away from the academy.
Research Questions
1. What are the demographic characteristics of GED credentialed students who have
participated in the 2014 SENSE survey?
2. What intercorrelations exist among variables measuring student college readiness
and institutional intervention in the SENSE survey?
3. Are there statistically significant differences in demographic characteristics (e.g. age,
marital status, children in the home, etc.), college readiness (skills, attitude,
behavior) and institutional intervention (advisor/faculty support) between GED
credentialed and high school diploma community college students?
4. What factors predict GED credentialed community college students’ intention to
persist?
Hypotheses
H01: There are no intercorrelations among variables measuring student college
readiness and institutional intervention in the SENSE survey.
H02: There are no statistically significant differences in demographic characteristics
(e.g. age, marital status, children in the home, etc.), college readiness (skills, attitude,
behavior) and institutional intervention (advisor/faculty support) between GED
credentialed and high school diploma community college students.
H03: There are no factors that predict GED credentialed community college
students’ intention to persist.

10
Significance of the Problem
This study attempts at broadening the knowledge of faculty and advising intervention’s
impact upon GED credentialed community college students. Much has been written regarding
barriers to success for GED credentialed community college students like inadequate
transportation, childcare arrangements, unsympathetic employers, housing, lack of family
support, and stress related illnesses as reasons why managing the college life becomes
impossible (Guison-Dowdy & Patterson, 2011). There exists a literature gap though focused on
how the partnership of particular activities of community college faculty/advisors and student
behavior demonstrating college readiness heightens academic success of those possessing GED
credentials.
This study assists community college administrators to consider the efficacy of specific
student support policies/processes like mandatory new student orientation, and first year
experience courses. Developing processes and programs geared at student unique needs on very
limited budgets is a great challenge for community colleges (Nichols, 2010). A lack of
recognition and action by institutions often becomes the difference GED credentialed students
obtaining a degree or departing the institution.
In addition, data contained in this study will assist community college faculty in
developing and utilizing pedagogical (andragogical) methods that are student-centered. Though
pedagogy/andragogy is influenced by instructor personality, academic discipline, and the balance
of classroom and department responsibilities, faculty are challenged to consider student learning
styles, classroom environment, and variety of students attending community colleges when
developing course materials (Alexander, Karvonen, Ulrich, Davis, & Wade, 2012).

11
Attempting to move GED credentialed students from optimism to actualized academic
success, this study will propose partnership oriented institutional and student actions meant to
both evaluate institutional practice and increase student persistence rates.
Conceptual Framework
The conceptual framework for this study has three theoretical components; andragogy
(Knowles, 1984), self-determination (Ryan & Deci, 2000) and planned behavior (Ajzen, 1991).
Older adult learners differ from young adults in self-concept, understanding prior experience,
greater readiness to learn, learning styles, and motivation to learn.
The Theory of Andragogy
The theory of andragogy consists of five elements: (1) Self-concept: the presence of
adult learners needing to be self-reliant challenges educators to provide respectful learning
contexts; (2) Experiences: as adult learners bring in varied experiences, adult educators are
challenged to individualize and contextualize material for student ease of application; (3)
Readiness to learn: adult students look for relevancy in classroom material to address real life
situations; (4) Learning Style; students recognize their life experiences and believe in potential
growth in self-reliant thinking; (5) Motivations: adult learners positively respond to classroom
methods that look to solve problems.
Adult Learners' Self-Concept: To search for purpose and meaning in one’s life takes a
considerable amount of effort, time and skill. Adult learners are extremely hard workers but
often lack time and experience searching for purpose or meaning in their lives. There must be an
overt willingness to look at one’s life situation and consider personal passions that exist in their
particular sphere of influence. Adult learners wish to be understood as self-reliant. Thus,
educators are challenged to provide learning environments grounded in respect and dignity.

12
Adult Learner’s Experiences: As adult learners arrive in educational institutions with
varied experiences, adult educators are challenged to individualize and contextualize learning
(simulations, case study or problem solving exercises) lesson plans to meet student willingness to
apply their learning. Adult learners judge class time and efforts relevant to their future.
Adult Learner’s Readiness to Learn: Life problems like sickness, family stress and
financial woes become a primary motivation for students showing a willingness to learn. Adult
learners look for practical answers to life problems. They are very interested in the application
of knowledge gained in the classroom.
Adult Learner’s Learning Style: When students understand themselves as adults, the
potential of self-reliant thinking grows. In the classroom, this process must consider affective,
behavioral and cognitive learning. Affective learning focuses on the development of attitudes
while behavioral learning is the completion of problem or receipt of information from an
instructor. These learning styles undergird the typical cognitive classroom activity analyzing and
sharing course content with instructors or fellow students.
Adult Learner’s Motivations: Students enter educational institutions for various reasons.
Some students are externally motivated by greater paychecks or more time off while others are
more internally driven stating their goals as a greater sense of self or even purpose. Andragogical
techniques that are problem-centered rather than content focused have been found efficacious in
motivating adult learners.
The Theory of Self-Determination
The second component of the conceptual framework is self-determination. Self-
determination theory (Ryan & Deci, 2000) considers human motivation in the context of
psychological needs such as relatedness, proficiency and autonomy. Personal needs grow into

13
life aspirations and then are operationalized into performance opportunities like employment,
parenting and education. Ryan and Deci’s work presupposes people are motivated by growth
and the need to be fulfilled. Dichotomizing motivation as either internal (behavior based in
choice) or external (behavior based in money or recognition by others), the theory asserts that
psychologically fulfilled people master skill learning processes, recognize communal belonging
and have the ability to develop/carry out goals. Social support becomes the primary means
persons can become truly autonomous.
Differentiating motivation by external (reward/punishment) and internal (achieving
autonomy) factors, they surprisingly found extrinsic rewards or threats actually reduced the
process of autonomy. When rewards and threats were emphasized, people tended to lose interest
in how personal activities were connected to sense of self and became focused on the rewards or
potential punishments. They further surmised that extrinsic motivation moved on a continuum of
regulation including none, external, introjection, identification, and integration.
Non-regulated persons often live without a sense of purpose and motivation has no overt
foci. Those who typify external regulation consider reward and punishment (salary raises, loss
of employment) as their primary motivation for life decisions. Introjected regulation occurs
when persons recognize the power of gain, fear of reprimand, and shame avoidance without
really owning personal or even institutional values. Identified regulation refers to a recognition
of personal behavior’s impact upon themselves and others around them. Activity has value as it
regulates personal behavior. Finally, in integration, personal behavior becomes an expression of
identity. Ryan and Deci differentiated extrinsic and intrinsic motivation and regulation as the
former was based in the value of the behavior (what’s in it for me?) while latter focuses only on
the behavior. Persons who are intrinsically motivated will enjoy life, recognize the value in

14
supportive community, and able act autonomously. Considering multi-faceted life situations that
students (especially GED credentialed ones) face, the goals of autonomy and sense purpose are
paramount to academic and life persistence.
Theory of Planned Behavior
In addition to college readiness, intention to persist is impacted by choice. Expanding on
the Theory of Reasoned Action (Ajzen & Fishbein, 1977), the Theory of Planned Behavior
(TPB) considers the impact of personal beliefs upon behavior. According to (TPB), beliefs are
categorized as behavioral (likely consequences), normative (other’s expectations), and control
(factors impeding or accentuating behavior). An individual’s perceived control and intention is
an efficacious predictor of individual behavior (Ajzen, 1991).
Intention to behave considers a person’s overall readiness to perform specific actions and
is measured through a Reasoned Action Questionnaire tailored for specific studies. Intention
directly impacts behavior and includes attitudes regarding behavior, subjective norms, and
perceived control to perform. Behavior attitudes is the level that performance of a behavior is
valued (positively or negatively). Subjective norm considers societal pressure to undertake a
particular behavior. Perceived control to perform is a person’s perception to accomplish certain
behaviors or tasks. These perceptions are based one’s situations and experiences. Control is
considered volitional where perceptions must include necessary skills and environment to
accomplish tasks (Fishbein, Ajzen, 2010).
Methodology
This study employed a survey-driven quantitative research methodology. The Survey of
Entering Student Engagement (SENSE), a product from the Center for Community College
Student Engagement (CCSSE), was used to measure variables impacting GED credentialed

15
community college students’ persistence. Anchored by an expansive literature review, this study
constructs an analytical model predicting the impact of faculty/advising intervention and student
college readiness upon student persistence. Data analysis included descriptive analysis, factor
analysis, and logistic regression. SPSS 23.0 was used to conduct descriptive, exploratory factor
analysis (EFA) and logistic regression; and an AMOS add-on to SPSS was used to conduct
confirmatory factor analysis (CFA).
Assumptions
It is assumed that subjects answered the SENSE survey honestly and voluntarily.
Anonymity and confidentiality was preserved as this study used secondary data obtained from
the Center for Community College Student Engagement. No identifiers were included and hence
there was no way to identify any individual survey taker.
Limitations
1. This study is limited to participants who voluntarily agreed to take the SENSE survey.
2. This study’s results and conclusions are based on self-reported data regarding GED
credentialed community college persistence.
3. This study considers faculty andragogy, professional advising practices and student college
readiness as primary factors for development of a predictive model of student persistence.
Delimitations
This study was confined to disaggregated data and included only GED credentialed
students. The focus was on the impact of college readiness, faculty and advising intervention
upon student intention to persist at community college. Only those participants self-identifying
as earning a GED credential were included in the study.

16
Definition of Terms
Adult Basic Education – Instruction designed for those adults who function below that
expected of high school graduates, those who are unable to manage the use of the English
language, and those not possessing basic job skills.
Adult learner – A person who doesn’t meet the generally accepted definition of a
traditional student.
Adult literacy – Adults obtaining basic skills, including English, reading, writing, and
ability to problem-solve to become self-reliant citizens.
Andragogy – The theory of educating adults.
Benchmark – Achievement standards usually regarding achievement performance.
College Readiness - A list of knowledge, skills, and attributes a student should possess to
succeed in entry-level college courses. Examples include reading, writing, oral
communication and critical thinking.
Community college- An open access institution of higher education conferring associate
degrees, diplomas and certificates for the purpose of transferring to a university or
employment setting.
GED/HiSET – General Education Development and High School Equivalency Test are
earned credentials considered equivalent to high school completion for those who pass a
series of standardized exams in content areas.
Pedagogy – Educational theory and practice often in the context of teaching style.
Persistence- Student’s continued behavior leading to student goal achievement.

17
SENSE Survey – Administered to community college students in weeks four and five of
their entering semester. It collects and analyzes data about institutional practices and
student behaviors.
Supplemental Instruction – A program providing student assistance by peer-run sessions
using discussion and processing of course content.
Traditional student – Typically one who enrolls in college immediately after high school
graduation and is often pursuing a full-time course of study.
Organization of the Study
Chapter 1 of the study has presented the introduction, the background of the problem, the
statement of the problem, the purpose of the study, the questions to be answered, the research
hypotheses, the significance of the study, a brief description of the methodology, the
assumptions, limitations, delimitations, and the definitions of terms.
Chapter 2 is a review of relevant literature. It addresses the following topics:
Andragogical (adult learning) method, efficacious professional advising techniques, and student
community college readiness.
Chapter 3 presents the methodology used in the study, including the research design;
population and sampling procedure; and the instruments and their selection or development,
together with information on validity and reliability. Each of these sections concludes with a
rationale, including strengths and limitations of the design elements. The chapter goes on to
describe the procedures for data collection and the plan for data analysis.
Chapter 4 presents the results of the study using various analytical and predictive
modeling techniques. Chapter 5 concludes this dissertation with a discussion of the findings,
providing implication for practitioners and potential future studies for researchers.
18
CHAPTER 2
REVIEW OF THE LITERATURE
The task of educating persons to become self-reliant, productive citizens is a complex
one. For many past generations, access to post-secondary education was an unattainable dream.
During the twentieth century, the advent of community colleges significantly increased college
accessibility. On the surface, this seeming positive sociological phenomena brings to students
and institutions many challenges including, overall college readiness as indicated by the rise in
student need of developmental coursework, coordinating curriculum objectives for transfer
purposes, varying outcome criteria by funders for judgment of institutional effectiveness, and
purposeful partnering with community business leaders to line up curriculum to employment
needs (Cohen, Brawer & Kisker, 2014).
Economic need and flagging retention/persistence rates drew numerous initiatives to
increase success of community college students. A notable initiative was the 2004 initiative,
“Achieving the Dream” that partnered with several organization, including but not limited to the
Lumina foundation, American Association of Community Colleges (AACC), Community
College Leadership Program at the University of Texas-Austin (CCLP), and Community College
Research Center, Teachers College, Columbia University (CCRC). This initiative developed
five criteria to measure performance including, successful completion of developmental course
to move onto college courses, completion of “gatekeeper” (often English) courses, earning
greater than “C” grades, semester to semester persistence, and procurement of marketable
credentials (Brock, et.al, 2007). Achieving the Dream continues its focus on more than 200
community colleges and minimizing achievement gaps by using evidenced-based institutional

19
change with the hope of changing public policy and increasing the recognition of education’s
importance through public engagement.
Connecting a significant motivation for higher education, another nationally known
community college success initiative called Complete College America considered the
importance of obtaining market valued credentials:
Completion is the key when it comes to advanced education. To fully enjoy the benefits
of higher knowledge and skills, one must graduate. Dropping in for a couple of course at
the local campus rarely makes much of a difference for long-term student success.
Therefore, it is vitally important that states ensure that students have the opportunity to
pursue the full range of higher education pathways that not only increase the likelihood of
college completion, but also landing good careers. (Bosworth, 2010, p. i)
It should be noted that neither of these initiatives considers the specific underserved GED
population though “the 2010 U.S. Census has indicated that more than 39 million adults aged 16
and older in the United States lack a high school credential and are not enrolled in any
educational program” (GED Testing Service, 2014). For many, the dream remains unattainable
until years of underemployment motivates courageous persons to face their fears/barriers and
continue their education through the General Education Development (GED) program (Comings,
2007).
Adult basic education programs and service to GED students “may be among the most
personally and economically impactful educational offerings community colleges offer” (Ryder,
& Hagedorn, 2012, p. 29). Seemingly a noble cause, GED courses are generally located in
continuing education departments and considered a community service of many community
colleges. Potential challenges to effective administration of GED programs include funding

20
securement, outcome measurement, validity of educational efforts beyond community service,
and underutilization of current community college faculty (Cohen, et. al., 2014). In other
institutions, GED curriculum is subsumed under the umbrella of adult basic education (ABE).
The adult learner presents many challenges to higher educational institutions. Much has
been written regarding adult learner barriers (Knowles, Holton III, & Swanson, 2015; Compton,
Cox, & Laanan, 2006; Cross, 1981), but there continues to be research gaps concerning the
partnership of institutional intervention (faculty/advising) and college readiness upon the
persistence of GED credentialed community college students. This literature review will consider
the nature of adult learning, earning a GED as an expression of adult learning, college readiness
of GED credentialed students and institutional intervention attempts at increasing persistence for
this student population.
The Nature of Adult Learning
Traditionally, college has been viewed as a time when recently graduated high schoolers
go off to college to acquire skillsets that will make them competitive in their career of choice and
become productive self-reliant citizens. There exists a whole population of citizens who either
chose not to continue their education or for various life situations, postponed post-secondary
education. In fact, future projections as students aged 25 to 34 are projected to increase 20%
and those 35 and older will increase 25% by 2021 (National Center for Educational Statistics
[NCES], 2013). As such, institutions of higher learning are challenged to better understand and
meet the needs of this burgeoning population.
Toward a Definition of the Adult Learner
Much of the literature assumes that adult learners are complex and possess a multi-
dimensionality of learning which defies simple definition. For this literature review, an adult

21
learner is defined as a person who did not enroll immediately after high school graduation,
possess markers (family, employment, etc.) that would societally be understood as adult
characteristics and intend to pursue methodical and continued educational activities (Darkenwald
& Merriam, 1982,). Moving beyond age demarcation, adults as lifelong learners capture the
spirit of Malcolm Knowles early theory of andragogy asserting that “as a person grows and
matures, his self-concept moves from one of total dependency (as is the reality of the infant) to
one of increasing self-directedness” (Knowles, 1973, p. 45). The maturation process of
recognizing tending to family obligations, recognizing personal goals and exploring career
aspirations cannot be accomplished in a vacuum. Rather, for many adult learners, the presence
of community can be the difference between success and failure (O’Keeffe, 2013). Post-
secondary institutions are in the enviable position to provide service to adult learners, often who
are part of the marginalized working class, an exhibition of their missions. From the adult
learner’s perspective, pedagogy and institutional policies alike must become learner-centered
(Sutherland & Crowther, 2008). Colleges and universities must consider their governance
through fiscal accountability, production of societal self-reliant students and ever increasing
interaction with community based business partners (Jongbloed, Enders, & Salerno 2008).
Theoretical Perspectives of Adult Learner Needs
Though the adult learner is often very focused on securing market valued credentials,
serving their needs can be enigmatic. As such, considering only more obvious barriers, such as
financial is not particularly helpful to fully grasp the needs and situation of the adult learner.
Perhaps an under-analyzed barrier to adult learners are psychological needs like general anxiety
caused by an inability to navigate the world of higher education. The development of adult
learner cohorts, faculty professional development, and provision for student to contextualize

22
their learning in their local communities has the potential to address this kind of psychological
barrier (Goto & Martin, 2009). As most adult learners inherently are looking for individual and
societal/cultural relevancy in their studies, the ability to discuss, collaborate, and apply materials
presented in learning situations is extremely important to this student population (Hashim, Tan,
& Rashid, 2015).
Many adult learners arrive on campus with high expectations of themselves (Wodlinger,
2007). Arriving from employment or life situations where success is preceded by hard work,
many of these same persons fail to persist. As the numbers of adult learners continue to grow,
institution of higher education are challenged to consider at least the following; review of
program time lengths, increased experiential pedagogical methods, engagement opportunities
directed at the needs of adult students, and soliciting student opinions during (not at exit) a
student’s college career (Compton, Cox, & Laanan, 2006).
Failure of adult learners’ persistence is arguably multi-faceted. It is reasonable to
understand that adult learners who for example have many years in the employment world would
understand themselves primarily as employees rather than students. Those in the academy
(faculty and administrators) can uncritically assume that complex academic processes fit all
student populations. Thus, adult learners might conclude their previous employment situations
and future aspirations are of little relevance to their academic pursuits (Berker & Horn, 2004).
This would be unfortunate as adult learners often are self-directed and motivated. An adult
learner for instance when confronted by a traditional lecture format might instinctively question
the life application of their course. Classroom methods whereby students are held responsible
for their own learning through discussion, presentations and group projects, give the adult learner
the opportunity to contextualize class materials. Numerous theorists (Brokfield, 1983; Knowles,

23
1984; Merriam, 2001) have posited that adult learners assimilate information differently than
traditionally aged students, crave information presented in contextualized fashion and look to
utilize the new-found information in their sphere of influence.
One such theory having the potential of impacting students is the work of Robert Kegan
(1994) who considered self-directed learning in the context of postsecondary institutions.
Educators are tempted to believe that adult learners will automatically be self-directed and
intuitively participate and learn. Kegan believes the role of the institution is to teach adults to be
self-directed and understand their role in transformative rather than prescriptive terms. He
believes the goal of education is to encourage adult learners to move beyond their current
perspective and engage in the process of meaning-making when they judge themselves as
incapable of completing academic expectations. Ultimately, the institution’s mission is to
transform the student by recognizing their needs, not just instilling skill or behavioral change
(Carnevale & Desrochers, 2003).
As a primary need for the adult learner is self-direction, assistance with goal
accomplishment is paramount. The adult learner assumes an educational institutions’ mission is
to provide them the resources and opportunity to develop applicable goals/objectives for their
personal and professional lives. The challenge is a coherent description of such goal that
incorporates multiple life issues beyond those of monetary nature. This is especially true for
those students in adult basic education programs directed at students who have decided to pursue
post-secondary education. A general understanding of academic planning raises the possibility
of further academic success (Zafft, 2008). Self-directed learning was measured by Guglielmino
(1977) who developed a self-directed learning scale. The Self-directed Learning Readiness
Scale (SDLRS) is a 41-item measure assessed by a 5-point Likert scale. The scale was found to

24
be valid (Long & Agyekum, 1983). Hoban, Lawson, Mazmanian, Best, and Seibel (2005) assert
that efficacious use of self-directed learning scales and literature must move from prescriptive
use of perception to engagement with disciplines such as neurobiology and social psychology
(Hoban, et. al., 2005).
As adult learners’ perceptions and motivations are often influenced by family dynamics
and/or employment expectations, it is vital to connect educational tasks in the classroom with
future aspirations. Adult students thereby gain more self-confidence, complete tasks and press
on to goal attainment (Wigfield & Cambria, 2010). When this population of learners realize
academic success, they more readily see an interconnectedness of classroom and real life
experiences. Increased confidence levels lead to a reevaluation of personal and employment
goals. This change is captured in transformational learning theory, which considers how the
adult learner processes cultural, moral and academic contexts, thereby increasing a sense of
meaning and persistence in their studies (Sandlin, Wright, Clark, 2013).
An examination of theory provides a sense of grounding for adult education programs
and educational administration in general. Those charged with administering adult education
programs will do well to consider the theoretical underpinnings to adult student persistence in the
postsecondary setting.
Meeting Adult Learner Campus Needs
Some adult learner come to postsecondary education with histories of pedagogic methods
and institutional policies which devalued students by failing to take into consideration the
unfamiliarity of college life. Unfortunately, student perception of institutions as uncaring and/or
even punitive is very likely. This judgment may cause adult learners’ reluctance to formal
education settings and consequential delays in entering postsecondary education (Wojecki,

25
2007). The practice of college campuses scheduling activities only during traditional school
hours could leave adult learners devalued and believing they do not matter. (Donaldson &
Townsend, 2007).
Meeting the academic and life needs of the adult learner include creative class
scheduling, online academic advising, and offering of certificates nested within degree programs
(Tate, Klein-Collins, & Steinberg, 2011). The adult learner needs to be made aware of the
institution’s recognition of their unique situations. A promising method is to designate campus
advocates with institutional authority to solve student problems and is among a variety of student
service policies designed to increase retention of adult students (Bailey & Marsh, 2010).
Postsecondary institutions (community colleges in particular), though facing financial
limitations must invest in student lives through the implementation of student engagement
practices. These would include, but are not limited to: academic goal setting, mandatory
orientations first year experiences courses, encouragement to join learning communities that take
into consideration non-traditional student schedules, early alert interventions for struggling
students, and active communication with advising staff McClenney, Marti, & Adkins (2012).
Providing adult learners opportunities to share their struggles managing time has proven very
effective to both address fears and increase planning abilities regarding the amount and times
classes are taken. Overwhelmed adult students need encouragement and advice to manage their
busy and complicated lives (Graham and Gisi 2000).
The financial and institutional impact of adult students upon community college
campuses is inestimable. The levels of enrollment and acquisition of meaningful marketplace
credentials, are the primary ways the needs of the adult student are taken seriously and the

26
United States will continue to be competitive in a global economy (Chaloux, 2008; U.S.
Department of Education, 2006).
Legislative History of Adult Learners in Adult Basic Education Programs
Historically, the adult learning process had been undergirded by the idea of literacy.
Though most today would limit literacy as basic communicative and computational skills, there
existed citizens in past generations who were considered literate in daily activities but wouldn’t
have been able or even willing to try to read from daily newspapers or magazines (Davison,
1962). For clarity in this study, adult literacy will be defined as the process of acquiring the
ability to read, write and solve mathematical problems to function in daily life situations.
Though numerous adult basic education programs exist, few participate. Whether from a
perceived lack of relevancy, simple accessibility, or lack of funding, many eligible Americans
choose not to participate in these remarkable programs. In fact, approximately 39 million of
American citizens cannot read (U.S. Department of Education, 2013). As the need for skilled
labor increases, it becomes apparent that concerted efforts to educate the United States citizenry
is needed. This realization resulted in the creation of the Basic Education Act, first under the
auspices of the Office of Economic Opportunity prior to movement to the Office of Education in
1966. Throughout the 1970’s the act was expanded to include service to persons as young as 16,
Native Americans and those needing bilingual adult education. By the end of the 1970’s there
was expansion of the philosophy that adult basic education is the primary means to achieve
functional ability in one’s personal and professional lives.
The evolution of the Adult Basic Education Act in the 1980’s was revealed in the 1984
and 1988 amendments. The Reagan administration elevated adult literacy to the national
spotlight but for purposes of fiscal responsibility chose not to increase federal appropriations.

27
The administration’s answer was to increase the use of volunteers. The concerns over decreased
funding included disregarding current adult basic education programs, efficacy of volunteers vs.
paid staff, and the increased strain of raising funds from the private sector.
The 1988 amendment included a significant reversal in funding decisions with the federal
government appropriating 200 million dollars to state’s adult basic literacy programs. Funding
to for-profit agencies providing adult literacy services were significantly restricted and a greater
emphasis on English and workplace literacy was made (Rose, 1991)
The 1990’s saw the enactment of the National Literacy Act (1992). This legislation
created the National Institute for Literacy charged with training adult education agencies,
instituting research and publishing results for adult education best practices. In addition,
National Workforce Demonstration programs were created to coordinate services between
education, business and industry. Sorely needed, this act also encouraged states to develop
measurable criteria for efficacious instruction and management of adult literacy programs.
Reminiscent of the original 1966 legislation, was the passage of the Workforce Investment Act.
Title II of this act for the first time considered the impact of providing literacy services to
families. Significant to this act were an increased ability and emphasis on individual agencies
applying for grants and reporting standardized provider statistics.
From 2000 to 2010, federal appropriations to states for adult literacy increased by 19%,
while enrollment also increased by approximately one million over the same period. In 2009,
President Barak Obama announced a goal for every American to commit to obtaining one year of
higher education or career training. It’s been estimated that 93 million adults don’t possess the
ability to be successful in either college or workplace settings. Thus, the need for adult literacy
is greater than ever. (U.S. Department of Education, 2013)

28
GED: An Expression of Adult Learning Theory
GED Credentialed Student Barriers to Persistence
Since 1942, the GED credential has served as the primary vehicle for those who failed to
earn a traditional high school diploma and as second chance to pursue purposeful further
education. Like many non-traditional students, adult learners possessing GED credentials
present challenges to post-secondary institutions. First, in an era of public funding cuts and
increased public scrutiny, colleges and universities are tempted to emulate private sector
business models for their primary means of governance. This reality has the potential of creating
unnecessary layers of administration, increased number of department providing identical
services, a decreased willingness to share important information regarding students, and a move
from protecting institutional rather than student matters (Friedman, 2015). Though
understandable in tenuous times, institution driven policy becomes antithetical to the adult
learners needs.
Another major barrier is non-academic factors for GED credentialed adult learner success
in college. Many adult learners involuntarily reenter the education system because of life events
such as divorce or other potential issues of financial instability. Students struggling with chaotic
life issues, fail to understand themselves as students, question their ability, and wonder if the
pressure of school will be worth the emotional and financial cost (Kasworm, 2008). The
literature details numerous general challenges for adult learners pursuing postsecondary
education with GED credentials. One that is often overlooked by institutional personnel is
emotional difficulties. Even on a small campus managing building and classroom numbers,
academic advising, financial aid, parking, and hours of services such as the library, can be
insurmountable (Brickman & Braun, 1999). Busy adult learners juggle multiple life roles and

29
are forced to make tough decisions when for instance, one’s work schedule changes and going to
work means missing class and risking academic failure. Institutional personnel are challenged
not only to show compassion but also to refer students to others in similar situations as a
potential social network to support students through notetaking, study groups, and childcare
(Lundberg & Creasman, 2008). Finally, in some cases campus architects can forget that
signage’s primary purpose is direction not aesthetic value. Ineffective signage can derail the new
adult community college student’s academic career before it begins (O’Banion, 2013).
GED Credentialed Students and College Readiness
The GED as Predictor of College Readiness
The literature affirms the ambiguity regarding the rigor of the GED program constituting
college readiness. Reder (2007) found non-statistically significant differences in the number of
developmental courses taken by GED credentialed and high school graduates. Contrarily,
problems like aspiring for a passing grade instead of not striving for one’s best on the test,
memorization of test questions rather than understanding content, and a disregard for finding
relevancy in the material exacerbates the ill-preparedness of the GED credentialed community
college student. (Garvey 2011). Students often struggle; with having minimal experience of
natural/physical sciences and math to successfully manage the completion of general education
courses required in transfer programs (Aud, et al.).
Those who are unable to meet college requirements in math, reading and writing through
standardized tests must enroll in remedial coursework. Those students entering college with a
GED credential were more likely than high school graduates to take developmental math and
writing courses (Tokpah, Padak, 2003). Taking remedial coursework and resulting in non-credit
often becomes a primary reason for student attrition (Bailey, 2009).
30
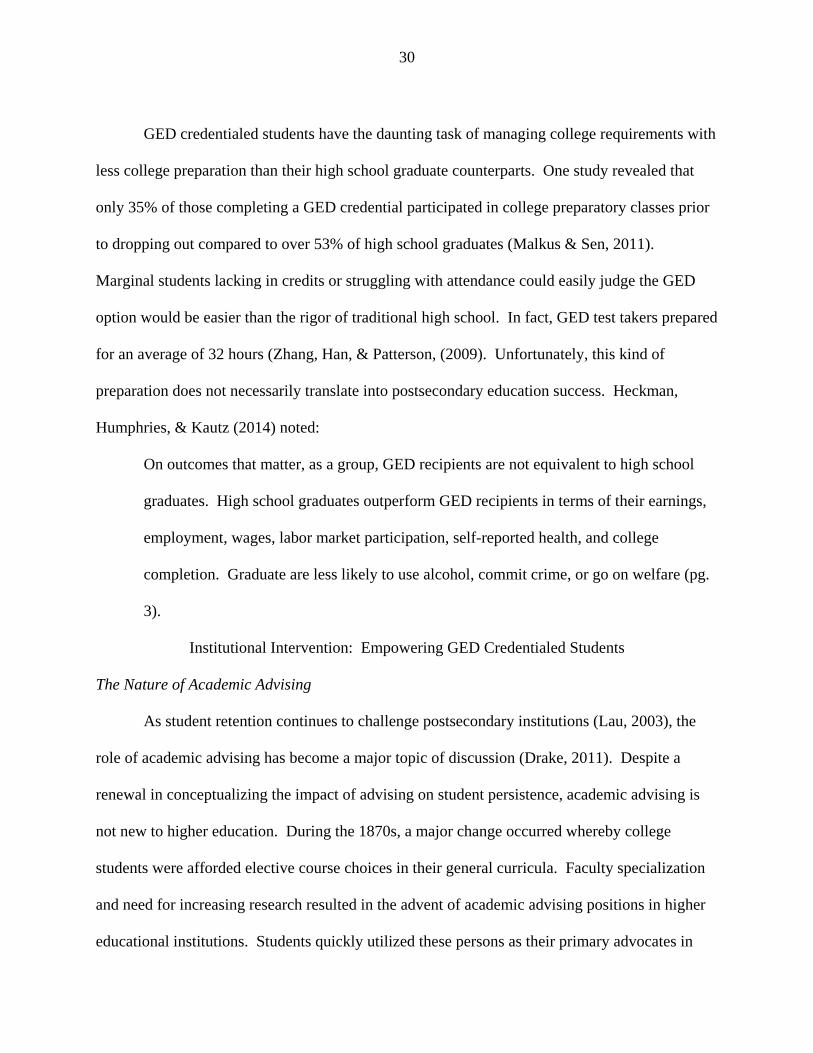
GED credentialed students have the daunting task of managing college requirements with
less college preparation than their high school graduate counterparts. One study revealed that
only 35% of those completing a GED credential participated in college preparatory classes prior
to dropping out compared to over 53% of high school graduates (Malkus & Sen, 2011).
Marginal students lacking in credits or struggling with attendance could easily judge the GED
option would be easier than the rigor of traditional high school. In fact, GED test takers prepared
for an average of 32 hours (Zhang, Han, & Patterson, (2009). Unfortunately, this kind of
preparation does not necessarily translate into postsecondary education success. Heckman,
Humphries, & Kautz (2014) noted:
On outcomes that matter, as a group, GED recipients are not equivalent to high school
graduates. High school graduates outperform GED recipients in terms of their earnings,
employment, wages, labor market participation, self-reported health, and college
completion. Graduate are less likely to use alcohol, commit crime, or go on welfare (pg.
3).
Institutional Intervention: Empowering GED Credentialed Students
The Nature of Academic Advising
As student retention continues to challenge postsecondary institutions (Lau, 2003), the
role of academic advising has become a major topic of discussion (Drake, 2011). Despite a
renewal in conceptualizing the impact of advising on student persistence, academic advising is
not new to higher education. During the 1870s, a major change occurred whereby college
students were afforded elective course choices in their general curricula. Faculty specialization
and need for increasing research resulted in the advent of academic advising positions in higher
educational institutions. Students quickly utilized these persons as their primary advocates in

31
their pursuit of post-secondary education (Gordon, Habley, & Grites 2008). Successful
academic advising proceeds well beyond the perfunctory process of course registration, rather
mentoring relationships with students have proven effective in persistence efforts (Young-Jones,
Burt, Dixon, & Hawthorne, 2013). Results from the 2015-16 Ruffalo Noel-Levitz Student
Satisfaction Inventory report that 80% of students found important that their academic advisor
expressed concern about their success, but only 53% admitted this was their personal experience.
Successful advising must be student driven (Ruffalo Noel Levitz, 2016).
Student persistence is positively correlated with perception of the student advising
process and student loyalty to the postsecondary institution (Vianden, & Barlow, 2015).
Passionate academic advisors understand themselves as a resource for students (Young-Jones et
al., 2013), possess the necessary educational paths to guide students to reach their desired goals
(Robbins, 2012) and understand themselves as a significant force in the student’s academic
success (Young-Jones et al., 2013).
A general goal of postsecondary institutions is the development of self-reliant citizens.
Academic advising is a major process to that end. It must contain clear boundaries for both
student and advisor alike (McClellan, 2013). Fearful, inexperienced students have the potential
to become overly dependent on their academic advisor and cease taking responsibility for their
own academic and life aspirations. Though institutions crave data regarding student satisfaction,
the purposeful academic advisor must consider the task of creating self-reliant citizenry daily
(Christian & Sprinkle, 2013).
Advising as an Expression of Educational Mission
A primary role of academic advising is to teach students how to consider their future
aspirations. Institutions need to acknowledge the importance of the advisor as a necessary link to

32
student classroom experience. A novel approach to help students see advising as educational is
to create a syllabus tool that academic advisors can utilize to remind students of their primary
learning outcome; to fulfill life goals (Trabant, 2006). Student advising contact must be
mandatory prior to registration (Johnson & Morgan, 2005). As postsecondary institutions face
decreased state and federal appropriations, advising case-loads have increased. This reality is
being addressed through a creative use of group advising almost mimicking classroom
environments (Robbins, 2012) and to a lesser extent, virtual advising to reach more students with
less personnel (Thompson & Prieto, 2013).
Another way to connect advising and classroom processes is to expose students to other’s
stories. Considering their lack of understanding of college rubrics, GED credentialed students
question their belongingness and ability to accomplish their academic goals. One approach to
this quandary is to convince this student population that their background can impact their
college experience in both negative and positive ways. Using a panel format, experienced
(traditional and non-traditional) students were given the opportunity to review their past family
situations, obstacles they faced upon college entrance, and coping skills that led to their success.
Likewise, students were given the same opportunity to share. This process benefitted students
for various reasons including, a recognition of the value of their unique situation, motivation to
replicate success strategies in others, and challenge the idea that students must somehow fit
themselves into prescribed academic roles (Stephens, Hamadani & Destin, 2014).
It is vital that adult students recognize the presence and value of campus support services.
Students who believe the institution is not concerned with their needs are less likely to persist
(Park, & Choi 2009). Students must be exposed to purposeful advising throughout their entire
program (Wyatt, 2011) thereby transmitting the message that the institution believes the process

33
is important for their attainment of life aspirations (Braxton, Doyle, Hartley, Hirschy, Jones, &
McLendon, 2014). The above is particularly important for the adult learner entering college with
GED credentials. They will necessarily benefit from the presence of flexible and compassionate
policies and people (Chiang, & Hawley, 2013).
Advising as an Expression of Academic Planning
The temptation of an academic planning process is to limit its context to semester course
sequencing. To serve as a bridge from student to employee, an academic must consider a
student’s inner workings (confidence and propensity to discipline), institutional factors (mission,
applicable services, funding sources), and community employment setting (economic
development) when judging the plan’s efficacy (Lattuca & Stark, 2009).
As advisors are often understood by students as an “expert” in all fields, there might be
the temptation for both student and advisor to quickly agree on registration for general education
courses without reflection on student needs and institutional resources. The literature (Wyatt,
2011; Kuh, et. al., 2007; Trabant, 2006) suggests multiple benefits of developing academic plans
for college students. Whether termed “roadmaps” or “pathways, academic plans must make
sense to the student, connected to documented 4-year institutional transfer guides and market
valued employment credentials, and accepted by faculty. The resulting collaboration between
faculty and student services allows for partnership between the student and institution (Jenkins &
Cho, 2013).
Faculty Course Syllabi Impact Upon Student Persistence
Whether as a student motivator or a simple means to communicate pedagogical
expectations, a well-crafted syllabus serves as a roadmap for student success. This is particularly
important to the GED credentialed student who by nature of their experience would have limited

34
experience with course syllabi (Slattery & Carlson, 2005). As a roadmap, the syllabus must be
detailed enough to provide necessary information like due dates and grading rubrics but a review
of it during the initial and subsequent class periods could provide greater security for otherwise
anxious students (Harrington & Gabert-Quillen 2015).
Another major need for adult (and particularly GED credentialed) students is a clear
presentation regarding grading policies. It is not unusual to consider course grades as an
objective measurement of learning. As simplistic view as this has the potential raise instances of
cheating but also self-depreciating attitude ultimately leading to dropping out (Weimer, 2002).
Possibly using a learner-centered approach to grading by using the term assessment can help
students’ anxiety and potential lack of classroom and institutional engagement. Effective
assessment should include clear (and compassionate) explanation of expectations, timely
instructor feedback, and review of areas of needed growth through an invitation to consult with
the instructor (Angelo & Cross, 1993).
Though fearful, adult learners believe institutions and faculty main responsibility is to
partner with them for purposeful learning situations. This can be accomplished by setting a
positive tone encouraging students to visit instructors not only for course assistance but
relationship building. Students wo believe that their instructors truly care about them and their
craft will more likely have a greater sense of belonging in the class. In addition, faculty who
provide students rationale for and potential approaches for success on assignments, quizzes
and/or exam can reduce overall anxiety. Finally, instructors who transparently disclose their
own academic struggles has the potential for students to see them as advocates rather than cold
purveyors of information (Harnish, et al., 2011).

35
Faculty Instructional Method’s Impact Upon Student Persistence
Student centered faculty interaction tends to result in higher student satisfaction
(Pascarella & Terenzini, 1977, McArthur, 2005). Moving toward this goal, faculty must balance
the needs of the student, institution and the marketplace to ensure students are successful in the
broadest sense of the term. Faculty then serve as mentors to their students (Capps, 2012).
Effective pedagogy, utilizing various teaching methods and encouraging students to
critically think about subject matter, helps students see the overall value in education for their
lives. Pedagogy using reduced reliance upon traditional lecture, requiring individual meetings
with faculty, and using focused small groups designed to allow peers to teach one another, helps
students take greater responsibility in their learning process (Wade, 2011). It is not uncommon
for GED credentialed students to have a minimal scope of reading experiences and might
struggle with textbook makeup. Adult learners sometimes imbued with fear and often facing
financial limitations, but believing education will result in life/employment goals must be given
open and honest information regarding how exactly required textbook reading will increase
student learning experiences. (Kenner, Weinerman, 2011).
Course design and lesson plan development should include surveying student situations
and needs. The development of a cooperative learning environment based in learner interest and
life situations can be formulated through icebreakers. Questions should be tied to course
expectations and outcomes (Eberly Center, 2016). This approach helps students move from
simple remembering content to motivating students to own material in an individual and group
context (Krathwohl, 2002). Students quickly see the value of and can apply the skills learned
regarding teamwork.

36
Adult learners possessing GED credential have the potential to become quickly
overwhelmed with class proceedings they judge as trivial or worse can come in conflict with
other students who have differing opinions. Astute instructors use this potential volatility to give
student opportunities to problem solve (Dirkx, 2008). Active learning results in students
recognizing the applicability in the material for their own situations. Presentations with
disembodied facts and figures and no real-life correlation will be forgotten. Engaging students in
problem-solving can be accomplished through structured games, case studies or hands on
activities. College students have varying learning styles (Harrell & Bower, 2011) and educators
will acknowledge this by using multiple teaching methodologies during class (Russell, 2006).
Failure to do so can cause students to disengage and increase the risk for dropping out. Another
efficacious teaching method is the use of anecdotal information to help students retain class
material and benefit from hearing other’s personal experience. At times, the class environment
can become stale. Reasons like extended time since a break, time of day/night or seemingly
lifeless but required information can all cause this kind of situation. Instructors are challenged to
remember that their very reason for existence is to help students grow as persons (Emerick-
Brown, 2013).
Instructors in student-focused classrooms encourage class members to share their
experience to reaffirm class materials and remind students of their value to the class. Engaged
discussion is encouraged where instructors are enthused by both the material and the students.
Instructors can combat GED credentialed student insecurity by making themselves available
outside of class either through office hours or before and after class (Stes, Gijbels, Van Petegem,
2008).

37
Most GED credentialed students have experienced teaching predominantly in traditional
classroom settings. As such, the physical classroom setting is extremely important for student
engagement. Wherever possible, instructors are encouraged to organize desks, chairs and other
teaching objects to enhance interactive and contextualized learning (Park & Choi, 2014). For
example, desks or chairs could be set up in circular fashion demarcating one group from another
during group activities. Another common technique is to set up desk so all students face each
other rather than the traditional line fashion that GED credentialed students remember from their
high school days. When they are given a voice in the development of classroom environment
GED credentialed students are given an opportunity to build decision making skills and are
reminded of the mission of postsecondary education; to create critical thinking productive
citizens (Veltri, Banning, & Davies, 2006)
By focusing on educational methodology and physical classroom space, learning
opportunities can be enhanced. Students will more likely integrate material into their own lives
and apply it to current and potential work situations. Instructors are challenged to give at least
equal value to people and content to heighten the probability of student success.
Previous Class Experience’s Impact Upon Student Persistence
The GED student often has a history of making bad choices, strained family
relationships, low self-worth and lack of follow through (Heckman, Humphries, & Mader, 2010).
The cumulative effect of bad decisions become negative perceptions of self. Many GED
students who continue into postsecondary education come with negative classroom experiences
including being ridiculed for perceived inadequate oral responses in class and a perception they
lack the necessary cognitive ability to be successful in school. They carry shame, regret, anger,
anxiety and a general judgment that they don’t really belong (Marschall, Davis, 2012). This

38
population of student can be particularly reluctant to speak out. Instructor comments must be
framed positively even if wrong answers might be stated. Considering student fears is
imperative to creating an atmosphere where students will begin to consider classroom content
meaningful and practice the process of critical thinking (Rocca, 2010).
Fear can negatively affect self-efficacy. Some GED credentialed students believe they
are incapable of reaching their goal of earning postsecondary credentials but understand they
must have them to meet life needs. Past failures motivate students to hide any lack of ability for
fear of the cycle repeating itself. (Hsieh, Sullivan, & Guerra, 2007).
A very promising program that addresses pedagogical method and negative student
experiences is the institution of supplemental instruction programs. Students who have
displayed mastery over course material are hired as Supplemental Instruction (SI) leaders. Peer
facilitators are hired and responsible to attend and take notes during regular class meetings, and
schedule supplemental instruction sessions for at least two hours per week. Students are free to
use this optional service to review course material and have answered questions or concerns they
might have. Some instructors, becoming more comfortable with this process, allow SI leaders to
help students quietly during regular class time (Cerna, Platania, & Fong, 2012).
Positive classroom environment where students believe they matter will motivate student
success. GED credentialed students will move beyond their fears and engage in successful
academic behaviors include attendance during voluntary study skills seminars, be able to
articulate importance for particular classes, consult with employers regarding scheduling needs,
finding study areas with less distractions, and making needs known to instructors (Wirth &
Padilla, 2008). These actions become examples of how GED credentialed community college
students take responsibility for their actions and move toward becoming self-reliant citizens.

39
Summary
This literature review began with a consideration of the potential barriers of the adult
learner and a history of the General Education Development (GED) program. The adult learner
cannot be categorized by simple age or any other demographic means. The adult learner is one
who chooses to return to school and finds value in education’s ability to fulfill their goals and
dreams. The GED program originally began as a way that persons who discontinued their high
school experience to militarily serve the United States. The original test has been revised four
times since its inception in 1942. Though heralded by many and maligned by some, the GED
program continues to stand as a primary means in which persons can continue their educational
journey.
This literature review continued by demonstrating the impact of student service advisors,
faculty and college readiness upon persistence of GED credentialed community college students.
Regular communication and satisfaction with student services advisors has proven numerous
times to provide inexperienced and fearful students with the necessary resources to be successful.
The advisor and student must form a team with only one goal; student persistence. Mandatory
meetings, advisor presence in first year experience courses and encouraging students to share life
stories in safe settings are among a few researched based interventions proven to increase student
persistence among GED credentialed community college students.
Next, this chapter considered the impact that faculty pedagogical method, interactive and
purposeful syllabi, and previous student classroom experience have upon GED credentialed
community college student persistence. Instructor use of contextualized learning, flexible class
policies, recognition of adult learners need to balance multiple roles all have proven efficacious
in increasing persistence with this student population. Sensitivity to previous experiences of

40
shame and embarrassment, has the potential to move a student past their fears and recognize the
institution and its personnel have the student’ best interest in mind.
Finally, a review of pertinent literature regarding the importance of student college
readiness upon persistence of GED credentialed students commenced. College readiness, though
somewhat elusive to concrete definition, generally is recognized to be the possession of cognitive
(discipline based) and non-cognitive (wherewithal to manage college life) skill sets to be
successful in the college setting.

41
CHAPTER 3
RESEARCH METHODOLOGY
The purpose of this study is to investigate the impact of college readiness and
institutional intervention upon GED credentialed community college student persistence.
Utilizing a quantitative approach, the Survey of Entering Student Engagement (SENSE) will be
used as the primary resource measuring college readiness, institutional intervention and other
important variables. This chapter will discuss the methodology used throughout the study
including a review of research questions, hypothesis statement, conceptual model, use of
particular statistical techniques, ethical issues and limitations of this study.
Research Questions
Research questions were posed to study factors impacting persistence of students in
community colleges possessing a General Equivalency Development (GED) credential. The
following research questions guided this study:
1. What are the demographic characteristics of GED credentialed students who
have participated in the 2014 SENSE survey?
2. What intercorrelations exist among variables measuring student college
readiness and institutional intervention in the SENSE survey?
3. Are there statistically significant differences in demographic characteristics
(e.g. age, marital status, children in the home, etc.), college readiness (skills,
attitude, behavior) and institutional intervention (advisor/faculty support)
between GED credentialed and high school diploma community college
students?

42
4. What factors predict GED credentialed community college students’ intention
to persist?
Hypothesis
A null and alternative hypothesis form will be utilized to frame applicable research
questions in this study. Only questions two through five will be listed as question one pertains to
descriptive analysis.
H01: There is no intercorrelations among variables measuring student college
readiness and institutional intervention in the SENSE survey.
H02: There are no statistically significant differences in demographic characteristics
(e.g. age, marital status, children in the home, etc.), college readiness (skills, attitude,
behavior) and institutional intervention (advisor/faculty support) between GED
credentialed and high school diploma community college students.
H03: There are no factors that predict GED credentialed community college students’
intention to persist.
Research Design
This study will use a cross-sectional analytic design, where data was collected at a
particular moment in time. This method allows research to be accomplished in an efficient
manner, allowing for analysis of multiple variables regarding attitudes and opinions to be
measured simultaneously. Though cause-and-effect relationships cannot be deduced in this
method, inference and generalization is possible (Creswell, 2015). Specifically, this analytical
cross-sectional design will consider the relationship of the construct of college readiness and the
intention to persist in GED credentialed community college students.

43
Survey Instrument
The Center for Community College Student Engagement serves community colleges by
providing ongoing research through publication and journal articles for purposes of increasing
persistence and graduation rates through student engagement. The center has produced and
annually administers the Community College Survey of Student Engagement (CCSSE), The
Community College Faculty Survey of Student Engagement (CCFSSE), and The Survey of
Entering Student Engagement (SENSE), which considers the earliest college student experiences.
This study utilized a well-recognized large national survey, Survey of Entering Student
Engagement (SENSE), as the means to measure GED credentialed community college students’
college readiness, intention to persist and other crucial variables. The SENSE question bank
focuses on institutional practices and student behaviors during students’ earliest college
experiences. Data once collected is analyzed and member colleges receive regular reports to
utilize data to better understand students and enact improved quality measures. This data
regarding early intervention is useful in improving course completion rates and rates of student
persistence beyond the first term of enrollment. The survey also considers research embedded
institutional practices to support and retain entering students during the earliest part of their
academic careers.
SENSE is administered at member community and technical colleges in weeks four and
five of the fall term. The survey generally takes no longer than 45 minutes for completion.
Member colleges of the (CCCSE) provide a list of courses typically taken in the first semester.
These include developmental writing/math (excluding ESL), first year college-level English, first
year college-level math, and student success/first year experiences courses. CCCSE then

44
randomly samples course sections from member colleges who have agreed to administer the
SENSE survey.
As SENSE is sampled at the classroom level, full-time students will be enrolled in more
classes than part-time students, and thus will be more likely to be sampled. After much study
following the completion of the field test, CCCSE decided this sampling bias would be
addressed by weighting results using Integrated Post-Secondary Education Data System (IPEDS)
data to correct for college size. To assist in this process, the CCCSE web reporting site provides
capability to generate data in either weighted or unweighted formats. The organization also
provides particular rationale to assist institutional researchers in making decisions regarding use
of the data.
Member colleges receive various tools and institutional reports including “Key Findings
(executive summary) and access to the SENSE online reporting system. Reports contain mean
and frequencies for the current cohort and individual colleges, benchmarks, comparisons
between colleges (liked-size colleges), and the option to request custom reports. In addition,
member colleges receive access to a downloadable data file, codebook for institutional use and
multiple print copies of “Key Findings” are made available to community college presidents.
The SENSE survey questions attempt at gathering relevant student information regarding
their first impressions of college processes like admissions, placement testing, orientation,
registration, financial aid, relationships with faculty, advisors and other students, types of
academic behavior, and general sense of supported belonging. The 2014 cohort SENSE survey
instrument contained 38 questions. A copy of the survey is included as appendix A.

45
Pilot Study
In 2007, 22 community colleges administered the SENSE pilot survey and obtained
13,233 usable surveys. Students entering their first semester and returning students responded to
the survey. First year college level English, math, and all developmental education courses
(excluding ESL) course were administered the original survey. The pilot SENSE survey included
a series of core questions with additional specified modules. Goal commitment and student
success courses were two major modules included in this pilot (CCCSE.2007).
In 2008, 89 community colleges volunteered for the SENSE field test survey and obtained
57,547 usable surveys. Like the SENSE pilot, classes were randomly selected from first-year
college English, math and developmental courses (excluding ESL). In addition, colleges were
given the opportunity to administer now three focus modules: student success courses,
commitment and support, and financial aid. Students in the field tests included both first term
and returning (CCCSE, 2008). The first national administration of the SENSE occurred in fall
2009.
Reliability and Validity
Currently there is no official reliability/validity study for the SENSE survey but is due to
be completed in January 2019. Therefore, other studies testing college readiness constructs will
be reviewed here. “When used in connection with tests and measurements, reliability is based on
the consistency and precision of the results of the measurement process.” (Urbina, 2014).
Factors comprised of SENSE question making up the college readiness construct were confirmed
in previous studies. For instance, Le, Casillas, Robbins and Langley (2005) utilized exploratory
and confirmatory factor analysis correlating demographic and achievement score variables to test
the reliability of the Student Readiness Inventory. Similarly, Hoban, Lawson, Mazmanian, Best

46
and Seibel (2005) measured medical students’ willingness to engage in self-directed learning.
They specifically considered the love of learning and utilizing faculty as partners in the learning
process. Finally, Smith, Murphy and Mahoney (2003) tested the reliability of their Readiness for
Online Learning survey that resulted in a satisfactory Cronbach alpha of 0.83. The construct
factors included confidence in academic skills, and willingness to communicate with classmates
and instructors.
According to Cronbach and Meehl, (1955) validity must be discussed through four
categories:
The categories into which the Recommendations divide validity studies are: predictive
validity, concurrent validity, content validity, and construct validity. The first two of
these may be considered together as criterion-oriented validation procedures…The
investigator is primarily interested in some criterion which he wishes to predict…If the
criterion is obtained sometime after the test is given, he is studying predictive validity. If
the test score and criterion score are determined at essentially the same time, he is
studying concurrent validity…Content validity is established by showing that the test
items are a sample of a universe in which the investigator is interested…Construct
validation is involved whenever a test is to be interpreted as a measure of some attribute
or quality which is not operationally defined. (pp. 281-282)
As the validity study for the SENSE survey will not be completed until January 2019 and
SENSE survey items were taken from the CCSSE survey, evidence for validity will be taken
from the CCSSE survey. The CCSSE validation research study considered relationships
between engagement and outcome (GPA, course completion, etc.). Though not primarily an
institutional evaluative tool, the survey provides evidence that can motivate change in

47
institutional policy and procedures. The study’s approach was three-pronged; linking CCSSE
survey results with Florida community colleges (provided by Florida Department of Education),
CCSSE Hispanic Student Success Consortium and 24 of the original Achieving the Dream
participating colleges. The linking of these studies added to the needed community college
specific research base and addressed student diversity. In addition, academic success, early
academic experiences, persistence, completion, and longevity (number of terms enrolled, credit
hours completed, etc.) were measured. The study used statistical methods including correlations,
and multiple and logistic regression, controlled for student academic and demographic
characteristics. Conclusions included strong consistency among the three studies, student
engagement as proxy for student academic achievement, and CCSSE benchmarks
(active/collaborative learning, student effort, academic challenge, student-faculty interaction,
support for learners) were predictably related to student outcomes. The “support for learners”
benchmark (institutional intervention) had the strongest impact on persistence levels.
(McClenney, Marti, & Adkins, 2012).
Population and Sample
Member colleges have the opportunity to participate in on-going research regarding
community college student engagement and success. The SENSE survey is administered during
the fourth and fifth weeks of the fall academic term and is aimed at entering students. Survey
items focus on institutional practices and student behaviors that research has shown to be
correlated with academic success.
“CCSSE utilizes a three-year cohort (2012 through 2014) of participating colleges in all
of its data analyses, including the computation of benchmark scores. This cohort is referred to as

48
the 2014 CCSSE Cohort” (CCSSE, 2016a). This cohort included a total of 106,840 respondents.
The SENSE survey sample obtained by this researcher totaled, 26,204 students from community
colleges nationwide. 1,459 students were identified as General Education Development (GED)
graduates. The criterion for that identification was respondents’ answer to survey question #36
“What is the highest academic certificate or degree you have earned?
Data Collection
The survey data is collected through an in-class paper survey during weeks four and five
of the fall academic term. Each survey came with a pre-printed serial number. Question 39 of
the survey offers students the option to include their student identification number. “Student
identifiers are not included in institutional reports, nor are they stored on any web-connected
server. However, institutional contacts may submit a request for encrypted data files including
student-level identifiers” (CCSSE, 2016b). Using pre-determined procedures, survey
administrators are responsible to maintain regular communication with institutional
administrators and faculty, schedule surveys, provide student assistance (through use of a
CCSSE provided script), ensure smooth completion of and return of the survey.
This researcher contacted the Center for Community College Student Engagement
(CCCSE) who administered the SENSE survey and provided the necessary materials through
the completion of a Data Use Agreement. After approval to utilize the 2014 SENSE survey
dataset, CCSSE research staff emailed this researcher (at no cost) the dataset in .csv format and
data was uploaded into SPSS 23.0

49
Conceptual Model
An analysis of college readiness and resulting intention to persist cannot be separated
from the student’s personal situation and internal belief system. Building upon andragogical
theory, Knowles (1978), Cross (1981) proposed the Characteristics of Adults as Learners (CAL)
to increase an understanding of life-long learners’ unique situations and barriers. The CAL
model dichotomizes variables into either personal or situational characteristics. Personal
characteristics are those which consider the student’s age, physical health, socio-economic status,
language, and maturity level. Situational characteristics consider the conditions in which
learning takes place including family/employment responsibilities, effective support systems and
academic learning settings.
As the adult-learner must manage increased life responsibilities, college readiness isn’t
limited to possession of an unlimited bank of discipline related nor academic classroom skills.
Rather, college readiness requirements are fulfilled in an adult learners’ willingness to find
relevancy in the material for their daily life situation (Chickering, 1981; Knowles, 1980; 1981;
Terrell, 1990).
Adult learner theory presupposes how effective advising and faculty intervention should
take seriously adult learner experience, need for personal development, and andragogy where
student have input regarding class procedures. In addition, this model application was
influenced by Knowles et. al.’s (1998) “andragogy in practice model” which considers the
learner’s thirst for contextualized knowledge, self-understanding, learning experiences, high
motivation to learn, and belief that education will provide personal benefit. This model and
study hypothesize that advisor and faculty support will increase the GED credentialed
community college students’ ability to problem-solve and be self-directed.

50
Figure 3.1. Applying Knowles’ (1980) theory of andragogy. The model was also analyzed through logistic regression, considering the impact of
operationalized latent and observed variables originating from the SENSE survey. Confirmatory
factor analysis (CFA) was utilized to test latent variable structures and overall significance of the
conceptual models’ pathways.
Variables in the Study
Dependent (Endogenous) Variable
Intention to Persist. This study’s dependent variable was the intention to persist at a
community college. Results were contrasted considering differences between GED credentialed
and high school diploma community college students. The original variable AGAINCL was
measured by survey question 25: “When do you plan to take classes at this college again?” The
• Achieve Potential• Advisor Support
• Identify courses• Student Respect
• Class Environment• Faculty Support
• Class Expectation• Faculty Availability
• Active Participation• College Ready Behavior
• Voluntary Groups• Study and Support
• Self-Directed• College Ready Attitude
• I'm Motivated • I'm Prepared
• College Ready Skills• Study• Test-taking
Concept of the learner
Role of learner experience
Orientation to Learning
Readiness to learn
51
original question was assessed using a 4-point Likert scale with the following options (1) “I will
accomplish my goal(s) during this semester/quarter and will not be returning”, (2) “I have no
current plans to return”, (3) “Within the next 12 months”, and (4) “Uncertain”. Through
recoding, the research created a new dichotomous variable “Persist” using a scale of “Not
Persist=0, Persist=1”.
Independent (Exogenous) Variables
Demographics. A group of seven variables captured participants’ demographic
characteristics. These variables included participants’ number of hours working per week, self-
reported high school grades, gender, age, marital status, presence of children in the household,
race/ethnicity, students taking developmental classes, and first generation status. Questions #24b,
#28, #29, #30, #31, #32, #35, and derived SENSE survey codebook demographics was used for
demographic characteristics analysis.
College Readiness. For this study, college readiness was an exploratory factor analysis
construct taken from questions #19 and #21 in the SENSE survey. Question # 19 asked, “During
the first three weeks of your first semester/quarter at this college, about how often did you do the
following?” This question was assessed by a 4-point Likert scale from never (1) to four or more
times (4). Question #21 asked, “Think about your experiences from the time of your decision to
attend this college through the end of the first three weeks of your first semester/quarter. Within
a class, or through another experience at this college…”. This question assessed by a 5-point
Likert scale from strongly disagree (1) to strongly agree (5). Both exploratory and confirmatory
factor analyses will be used examine the college readiness construct in this study.
Advisor Support. Advisor support was an exploratory factor analysis construct taken

52
from 5 items in question 18, pertaining to academic advising. Question 18 required students to
consider the following: “Think about your experiences from the time of your decision to attend
this college through the end of the first three weeks of your first semester/quarter.”
Specifically, it asked whether students were able to meet with an advisor, advisors helped
students select course of study, assistance with academic goals and formal planning was
offered, advisors assisted students in identifying appropriate courses to be taken in the first
semester, and students had someone to review the appropriate number of courses to take
consider outside the class life stressors. Question #18 was measured by a 5-point Likert scale
moving through a continuum of strongly disagree (1) to strongly agree (5).
Faculty Support. Faculty support was an exploratory factor analysis construct taken from
3 items in question 18, pertaining to faculty intervention in the classroom. As previously stated,
Question 18 required students to consider the following: “Think about your experiences from the
time of your decision to attend this college through the end of the first three weeks of your first
semester/quarter.” Specifically, these items addressed; whether faculty clearly explained course
grading policies, explained course syllabi, and whether students had clear direction of how to
contact their faculty. Question #18 was measured by a 5-point Likert scale from strongly
disagree (1) to strongly agree (5).
Data Analysis
A quantitative research approach was utilized for this study. Statistical analytical
methods included, descriptive, comparative and factor analyses. Additionally, logistic regression
was utilized. IBM SPSS 23.0 was used to conduct descriptive, comparative, exploratory factor
and logistic regression analysis; and an AMOS add-on to SPSS was used to conduct
confirmatory factor analysis.

53
Descriptive and Comparative Analysis
Research question #1: What are the demographic characteristics of GED credentialed
students who have participated in the 2014 SENSE survey? RQ 1 was explored through
conducting descriptive statistics. Descriptive statistics is part of a process that characterizes
(Urdan, 2010), and constitutes (Mertler, Vannatta, 2013) data to disclose estimates and
relationships to make reliable inferences (Tabachnick, Fidell, 2013). The purpose of this
question will be to more fully understand the GED credentialed (often adult learner) community
college student. This was accomplished through the use of response frequencies and central
tendencies (means, standard deviations) regarding general demographic characteristics (gender,
age, race/ethnicity), life balance (hours worked per week, marital status, children in the
household) and academic experience (self-reported high school grades).
Factor Analysis (Exploratory and Confirmatory)
Research question 2: What intercorrelations exist among variables measuring student
college readiness and institutional intervention in the SENSE survey? was answered through
exploratory and confirmatory factor analysis. Factor analysis is utilized to reduce the number
and regroup variables into a cluster (construct) to measure commonalities (Mertler, Vannatta,
2013).
The researcher’s goal in exploratory factor analysis is to produce a set of parsimonious
(simple) factors (Tabachnick & Fidell, 2013) that have passed screening for normality, linearity,
and multicollinearity. Statistical criteria for analysis results included eigenvalues greater than
1.0, and >.05 factor loadings (Mertler & Vannatta, 2013). Following statistical program
produced analytical tools like scree plots, correlation matrices commonality in items, those items
that did not meet the previous standard will be left out of the hypothesized constructs. Construct

54
reliability will be accomplished by the use of Cronbach’s alpha coefficient, which measures how
close variables are related as a group. According to Creswell (2014), an alpha value of .7 and
higher is considered acceptable. Two other statistical measures, the Kaiser–Meyer–Olkin
(KMO) and Bartlett’s tests of sphericity are used to judge whether the data is suitable for factor
analysis (Mertler & Vannatta, 2013).
Confirmatory factor analysis (CFA) is the process of testing the relationship between
observed variables and conceptual constructs. Procedurally, CFA includes developing models
informed by empirical studies, and determining a “goodness of fit” that often includes chi-square
(>.90 good fit), root mean square error of approximation (RMSEA) (.05 to .08 close fit), and
comparative fit index (CFI) (Schumaker, Lomax, 2016). For this study, EFA and CFA will be
executed to explore advisor/faculty support, and college readiness constructs. Structural
equation modeling analysis was grounded in the CFA results.
Comparative Analysis
Research question #3: Are there statistically significant differences in demographic
characteristics (e.g. age, marital status, children in the home, etc.), college readiness (skills,
attitude, behavior) and institutional intervention (advisor/faculty support) between GED
credentialed and high school diploma community college students? was answered through a
combination of cross-tabulation with Pearson chi-square, and independent sample t tests to see
whether there existed significant differences.
The analytic method chosen was driven primarily by variable type and assumptions met.
Nonparametric cross-tabulation with Pearson chi-square is used when researchers wish to
analyze nominal variables, and to consider whether demographic variables are dependent upon
membership in groups (Leech, Barrett, Morgan, 2015). Pearson chi-square testing is utilized

55
when comparing expected versus observed results (goodness to fit). Testing the null hypothesis,
researchers determine whether any differences are a result of chance. Small chi-square value
indicates a good fit, thus suggesting independence between variables analyzed. Contrarily, a
large chi-square value shows a poor fit, need to reject the null hypothesis, and relationship
between the two variables (Tabachnick & Fidell, 2013). The following formula is a
mathematical expression of chi-square:
The consideration of variables (demographic, advisor support, faculty support) upon
students with high and low college readiness scores was accomplished through the use of
independent samples t tests. Data samples must be independent, variance of groups being
compared are equal, and the dependent variable must be approximately normally distributed
(Morgan et al., 2013). The following formal is a mathematical expression of a t-score:
Logistic Regression Analysis
Research question 4: What factors predict GED credentialed community college students’
intention to persist? was answered through a logistic regression equation. A logistic regression
analysis was conducted to predict GED credentialed community college intention to persist in
their academic endeavors as the dependent variable and two blocks of independent variables. The
first block of independent variables included demographic characteristics while block two was
rooted in constructs created through exploratory and confirmatory factor analyses. Since the

56
dependent variable, intention to persist for this study is dichotomous, logistic regression was
chosen as the appropriate statistical method (Hosmer &, Lemeshow, 2010).
Missing Data Imputation
Though the SENSE survey is offered in class through a paper format, it is highly probable
that students not recognizing the institutional and personal value, would skip questions and not
complete the survey. Those skipped questions have the potential to negatively impact the
predictive power of the equation. Missing data is generally characterized on an increasing
negative continuum from random to not random.
A number of alternative, albeit problematic methods exist in which to address this
problem. Three common ones are addressed here. The first is a simple deletion of cases and/or
variables. Missing data occurring either infrequently or based in a small number of variables
will have minimal impact. Contrarily, missing data spread throughout the database,
encompassing multiple variables can reduce one’s sample size drastically. Another method,
involves creating equations for the missing values using logistic regression. Though
complicated, this method appeals to some because it can be used in longitudinal data analysis.
Finally, if the missing items are random, the expectation maximization (EM) method would be
warranted. The goal is to eliminate bias in the missing values.
After assuring that missing items is truly random (variance t-tests, Little’s MCAR test),
the expectation (E) step considers parameters such as correlations to find a conditional
expectation. Using log-likelihood, missing observations are imputed through a logistic
regression process. Maximum likelihood estimation is used as there was no missing data. This
process continues until convergence is attained (Tabachnick & Fidell, 2013).

57
After careful consideration of various methods to address missing data, the decision was
made to utilize a listwise deletion method, excluding data from those respondents who didn’t
compete all survey questions within the analyses frame. After the listwise deletion, sufficient
power remained for valid analyses.
Limitations
First, the SENSE dataset was limited only to the 2014 cohort of students thereby limiting
longitudinal interpretation. The second limitation is that the SENSE survey is based in self-
reported data. The need for honest and complete information is key for useful statistical
analysis. Student misinformation regarding potentially embarrassing admission of students
being placed into developmental classes for example, could result in unreliable data.
Correlating institutional data to survey results would ameliorate the situation. The third
limitation is the presence of “yes or no” type questions. By reducing these items to “yes” or
“no” reduces the variability of the data. Rather it would be preferable to assess the likelihood of
each of these responses using a Likert-type scale for the responses. An example is question #37
where students were asked to “indicate whether your goal(s) for attending this college include
the following”. Students had three separate sub-questions, 37a “to complete a degree”, 37b “to
obtain an Associate degree”, and 37c “to transfer to a 4-year college or university”. This is an
error in the survey design. Potentially, a student could answer yes for all three sub-questions
and produce duplicate answer and increase data problems. Positing this question using Likert-
scale method would provide data that was more useful to both the researcher and institution.
Fourth, there were no questions regarding family or friend influence upon the decision to attend
college or find extra-institutional support. Additional questions regarding students’ social

58
capital would provide a more well-rounded picture of student persistence barriers. Finally, the
use of secondary data analysis without institutional persistence data and confined to the
variables provided, resulted in a minimally defined dependent variable “intent to persist”
causing a poor logistic regression model fit.
Delimitations
This study was delimited to colleges willing to pay the fees to become a member. This
study was also delimited to students attending community colleges. Finally, the SENSE was
delimited to students under the age of 18 as question 30 (AGENEW) referred to self-identified
ages of 18 and 19. By implication, full time online students were delimited as the survey was
administered using a paper based format in community college classrooms.
Ethical Concerns
An application to conduct research involving human participants was submitted August
2, 2016 for the Iowa State University Institutional Review Board meeting on August 16, 2016.
As this study uses a secondary data source (SENSE), with no identifiers available to this
researcher, nor any way to identify individuals, there was no ethical issue.
This study utilized secondary data collected from the SENSE survey created by the
Center for Community College Student Engagement. The data was de-identified where all
participant identifiers had been removed prior to the dataset being available to this researcher. In
addition, the data was reported in aggregate fashion to prevent any disclosure of identifying
information.
Summary
This study sought to consider the relationship between institutional intervention and
college readiness and intent to persist in General Educational Development (GED) credentialed
59
community college students. This chapter included an overview of the methodology guiding the
study, including the research questions, hypotheses, research design, survey instrument, pilot
study, population and sample, data collection, conceptual framework, variables in the study, data
analysis, ethical considerations, limitations, and delimitations. The study will utilize a
quantitative research design using a national survey.
The following two chapters will present the results of the study reviewed in this
methodology section and discuss the finding’s significance of the findings and implications for
future research, policy, and practice. The overall goal of this study is to propose data based best
practices regarding intent to persist of GED credentialed community college students.

60
CHAPTER 4
FINDINGS
This chapter provided an overview of the study’s results through the analysis of tables,
figures, and explanations. The first section included descriptive statistics containing
demographic characteristics and other variables related to academic outcomes, life
responsibilities, and intention to persist. The descriptive analysis was conducted for the entire
sample, high school diploma and GED credentialed student groups respectively. Second,
exploratory factor analysis (EFA) outcomes provided possible constructs of college readiness
and other key factors influencing community college student intent to persist, were reported.
Confirmatory factor analysis (CFA) results also produced a reduced and finalized model of latent
variables. Both EFA and CFA were conducted on GED credentialed students. Third, results of
comparative analysis (t-test, cross-tabulation) were reported. Using research question three, the
comparative analysis compared key variables, including college readiness and institutional
intervention between high school diploma and GED credentialed students. Finally, a logistic
regression analysis was conducted to provide a summary of how college readiness and
institutional intervention predicted GED credentialed students’ intention to persist in community
college.
Findings Related to Research Question 1
To describe the characteristics of the sample, a descriptive analysis was conducted on all
students, that included high school diploma, and GED credentialed student groups respectively.
Table 4.1 presents the frequency and percentage of the variables used in this analysis.

61
Table 4.1 Frequency for all, high school diploma, and GED credentialed participants All students
(n=26,203) HS Diploma (n=22,032)
GED Credential (n=1,459)
Variables n % n % n %
Gender
Male 11,2471 42.9 9,851 44.7 628 43.0 Female 14,048 53.6 11,831 53.7 805 55.2 Missing (nonresponse) 908 3.5 350 1.6 26 1.8
Age 18-24 21,844 83.3 20,089 91.2 662 45.4 25-39 2,853 10.9 1,483 6.7 584 40.0 ≥40 991 3.8 432 2.0 212 14.5 Missing (non-response) 515 2.0 28 .1 1 .1
Race/ethnicity Black/African American 4,201 16.0 3,442 15.6 287 19.7
Hispanic, Latino, Spanish 5,558 21.3 4,962 22.5 248 17.0 White 13,078 49.9 11,304 51.3 753 51.6 Other 2,525 9.6 2,089 9.5 145 9.9 Missing (non-response) 368 3.2 235
1.1 26 1.8 Marital Status
Yes 1,909 7.3 1,031 4.7 335 23.0 No 23,730 90.5 20,950 95.1 1,120 76.7 Missing (non-response) 564 2.2 51 .2 4 .3
Children
Yes 3,826 14.6 2,338 10.7 673 46.2 No 21,735 82.9 19,578 88.8 778 53.3 Missing (non-response) 642 2.5 116 .5 8 .5
Hours Worked
Not Working 9,452 36.1 8,086 36.7 619 42.4 1-20 Per Week 7,124 27.2 6,349 28.8 258 17.7 21-30 Per Week 3,975 15.2 3,550 16.1 155 10.6 30+ Per Week 4,060 15.5 3,142 14.3 336 23.1 Missing (non-response) 1,592 6.1 905 4.1 91 6.2
High School GPA A 1,675 6.4 1,458 6.6 36 2.5 A- to B+ 7,694 29.4 6,850 31.1 215 14.7
B 6,085 23.2 5,321 24.2 253 17.3 B- to C+ 6,686 26.2 5,857 26.5 433 29.7

62
Table 4.1 continued
All students (n=26,203)
HS Diploma (n=22,032)
GED Credential (n=1,459)
Variables n % n % n % C 2,299 8.8 1,884 8.6 222 15.2 C- or lower 888 3.4 536 2.4 255 17.5 Missing (non-response) 676 2.6 126 .6 45 3.1
Taking Developmental Courses Yes 15,612 59.6 12,743 57.9 1,102 75.5 No 10,318 39.4 9,088 41.2 335 23.0 Missing (non-response) 273 1.0 201 .9 22 1.5
First Generation Yes 10,989 41.9 8,654 39.3 774 53.1 No 15,214 58.1 13,378 60.7 685 46.9
Intent To Persist Not Persist 7,351 28.0 6,258 28.4 387 26.5 Persist 17,946 68.5 15,422 70.0 1,037 71.1 Missing (non-response) 906 3.5 352 1.6 35 2.4
As indicated in Table 4.1, nearly 54% of the entire sample were female students.
Traditionally aged students (18-24 years old) accounted for over 83% of the total sample
population. As expected, White (51.3%), Hispanics (21.3%), and Black/African-Americans
(16.0%) comprised the three most represented race/ethnicity groups. For all students
(n=26,203), 7.3% and 14.6% of respondents were married and had children respectively.
Regarding employment status, those not working accounted for 36.1 % of the total sample.
Those working 30 or less and greater than 30 weekly hours were 42.4% and 15.5% respectively.
A self-reported GPA grade of B or better accounted for grade or better accounted for 59% of
total sample. With respect to factors impacting academic progress, students taking
developmental courses, first generation students, and intending to persist accounted for 59.6%,
41.9%, and 68.5% respectively.

63
Though distribution of both female (53.7%) and male (44.7%) students were relatively
similar to the total sample, a greater proportion of students aged 18-24 (91.2) existed. White
(51.3%), Hispanics (22.5%), and Black/African-American (15.6) comprised the three most
represented race/ethnicity groups.
The GED credentialed group differed in numerous demographic characteristics. Those
students of non-traditional age (25-39) were considerably larger comprising 40%. Not
surprisingly, more GED credentialed students reported being married (23.0%) and having
children at home (46.2%). Those GED credential students not working comprised 42.4%. This
same group had a relative decreased (34.5) percentage of self-reported GPA of B or above high
school GPA. Finally, 75.5% of GED credentialed students reported being enrolled in
developmental courses.
Findings Related to Research Question 2
Exploratory and confirmatory factor analyses were conducted to establish the constructs
surrounding college readiness and institutional intervention for GED credentialed community
college students. The exploratory factor analysis was run using IBM SPSS 23.0, and the
confirmatory factor analysis was analyzed using AMOS Graphics 24. Both the exploratory and
confirmatory factor analyses were conducted using the SENSE survey dataset of 1,459 self-
reported GED credentialed students.
Exploratory Factor Analysis
Considering only data from the GED student subset, fifteen observed variables were
identified as potential institutional intervention and college readiness items based on a review of
the literature. Five factors, (1) advisor support, (2) faculty support, (3) college readiness skill

64
sets, (4) college readiness student networking, and (5) college readiness attitude were identified.
Necessary assumptions, including sample size to variable ratio was checked. Urdan (2010)
suggests that adequate sample sizes should be at least 30 cases for the first variable and 10 for
each variable thereafter. The sample size of 1,459 cases was adequate to conduct the exploratory
factor analysis. Assumptions of linearity and normality were not enforced as this factor analysis
was exploratory in nature (Mertler & Vannatta, 2013; Tabachnick & Fidell, 2007). Linear
regression analysis and an accepted variance inflation factor (VIF) of less than 3.0 were used to
test the absence of multicolinearity (Mertler & Vannatta, 2013).
Constructs with eigenvalues greater than 1.0 were accepted as constructs of college
readiness and institutional intervention. Items with loadings greater than .70 were accepted as
adequate elements of the construct (Mertler & Vannatta, 2013). The exploratory factor analysis
was conducted using a Varimax rotation. The KMO measure of sampling adequacy was .826 and
Bartlett’s test of sphericity showed a statistical significance p< .001, thus showing adequacy of
conducting a factor analysis. Within the context of principle component extraction, five
constructs with eigenvalues greater than 1 were extracted. All factor loadings exceeded .60.
Factor loadings greater than .63 are considered very good (Comrey & Lee, 1992; Tabachnick &
Fidell, 2013). Constructs producing a Cronbach’s alpha greater or equal to .70 were accepted
(Mertler & Vannatta, 2013; Tabachnick & Fidell, 2013; Urdan, 2010).

65
Table 4.2 Exploratory Factor Analysis Results
Variables Factor loading
College Ready Skill Sets (α = .854)
I learned to understand my academic strengths and weaknesses.
.862 I learned skills and strategies to improve my test-taking ability. .832 I learned to improve my study skills (note-taking, highlighting, etc.). .820
College Ready Student Networking (α = .769)
Participated in a student-initiated (not required) study group outside of class .861 Participate in a required study group outside of class .814 Work with classmates outside of class on class projects or assignments .808
College Ready Attitude (α = .783) I have the motivation to do what it takes to succeed in college. .875 I am prepared academically to succeed in college .844
Advisor Support (α = .844) An advisor helped me to select a course of study, program or major .850 An advisor helped me to identify courses I needed during my 1st semester .826 An advisor helped me to set academic goals and to create an achievement
.812 I was able to meet an advisor at times convenient for me .701
Faculty Support (α = .813) All instructors clearly explained course syllabi .868 All instructors clearly explained course grading policies .842
I knew how to get in touch with my instructors outside of class .734
College Readiness Skill Sets. The College Ready Skill Set construct produced an eigenvalue of
2.102, while explaining 14.2% of the variance. The results of the exploratory factor analysis for
the College Ready Skill Sets construct are displayed in Table 4.2 and in Figure 4.2. The items
in the construct reflected students’ perception of academic skill improvements. The variables
were analyzed using scores from a 5-point Likert-style scale ranging from 1 (strongly disagree)
to 5 (strongly agree). All items of the construct produced loadings greater than .820. The

66
Advisor Support construct included Question 21_b (I learned to understand my academic
strengths and weaknesses, .862), Question 21_c (I learned skills and strategies to improve my
test-taking ability, .832), and Question 21_a (I learned to improve my study skills – listening,
note-taking, highlighting readings, working with others, etc., .830). The reliability analysis
revealed that the College Readiness Skill Sets construct produced an alpha reliability coefficient
(Cronbach’s α = .854). The reliability analysis also revealed that the alpha reliability would not be
improved if any of the items were removed from the construct.
College Readiness Student Networking. The College Ready Student Networking construct
produced an eigenvalue of 1.424, while explaining 9.5% of the variance. The results of the
exploratory factor analysis for the College Readiness Student Networking construct are
displayed in Table 4.2 and in Figure 4.2. The items in the construct reflected students’ action
initiating contact with fellow students for group study purposes. The variables were analyzed
using scores from a 4-point Likert-style scale ranging from 1 (never) to 4 (four or more times).
All items of the construct produced loadings greater than .800. The College Readiness Student
Networking construct included Question 19_j (Participate in a student-initiated (not required)
study group outside of class, .861), Question 19_i (Participate in a required study group outside
of class, .814), and Question 19_h (Work with classmates outside of class on class projects or
assignments, .808). The reliability analysis revealed that the College Readiness Student
Networking construct produced an alpha reliability coefficient (Cronbach’s α = .769). The
reliability analysis also revealed that the alpha reliability would not be improved if any of the
items were removed from the construct.

67
College Readiness Attitude. The College Readiness Attitude construct produced an eigenvalue
of 1.068, while explaining 7.1% of the variance. The results of the exploratory factor analysis for
the College Readiness Attitude construct are displayed in Table 4.2 and in Figure 4.2. The items
in the construct reflected students’ perception they are ready to succeed in the college setting.
The variables were analyzed using scores from a 5-point Likert-style scale ranging from 1
(strongly disagree) to 4 (strongly agree). All items of the construct produced loadings greater
than .840. The College Readiness Attitude construct included Question 18_t (I have the
motivation to do what it takes to succeed in college, .875), and Question 18_u (I am prepared
academically to succeed in college, .844). The reliability analysis revealed that the College
Readiness Attitude construct produced an alpha reliability coefficient (Cronbach’s α = .783).
The reliability analysis also revealed that the alpha reliability would not be improved if any of
the items were removed from the construct.
Faculty Support. The Faculty Support construct produced an eigenvalue of 1.658, while
explaining 11.0% of the variance. The results of the exploratory factor analysis for the Faculty
Support construct are displayed in Table 4.2 and in Figure 4.2. The items in the construct
reflected students’ belief that faculty provided resources to be successful in the classroom. The
variables were analyzed using scores from a 5-point Likert-style scale ranging from 1 (strongly
disagree) to 5 (strongly agree). All items of the construct produced loadings greater than .730:
The Faculty Support construct included Question 18_n (All instructors clearly explained course
syllabi, .868), Question 18_m (All instructors clearly explained course grading policies, .842),
and Question 18_o (I knew how to get in touch with my instructors outside of class, .734). The
reliability analysis revealed that the Faculty Support construct produced an alpha reliability

68
coefficient (Cronbach’s α = .813). The alpha reliability would not be improved if any of the
items were removed from the construct.
Advisor Support. The Advisor Support construct produced an eigenvalue of 4.765, while
explaining 32.8% of the variance. The results of the exploratory factor analysis for the Advisor
Support construct are displayed in Table 4.2 and in Figure 4.2. The items in the construct
reflected student’s perception that academic advisors provided information to make informed
decisions regarding academic programs and considered students’ life responsibilities when
arranging meeting times. The variables were analyzed using scores from a 5-point Likert-style
scale ranging from 1 (strongly disagree) to 5 (strongly agree). All items of the construct
produced loadings greater than .650. The Advisor Support construct included Question 18_e
(An advisor helped me to select a course of study, program, or major, .861), Question 18_g (An
advisor helped me to identify the courses I needed to take during my first semester/quarter, .830),
Question 18_f (An advisor helped me to set academic goals and to create a plan for achieving
them, .820), and Question 18_d (I was able to meet with an academic advisor at times convenient
for me, .657). The reliability analysis revealed that the Advisor Support construct produced an
alpha reliability coefficient (Cronbach’s α = .844). The alpha reliability would not be improved if
any of the items were removed from the construct.
Confirmatory Factor Analysis
The objective of confirmatory factor analysis (CFA) is testing whether there exists an
appropriate data fit to a hypothesized model. Here, a confirmatory factor analysis was
conducted on college readiness’ and institutional intervention’s impact upon the intent to
persist for GED credentialed community college students. The evaluation of the CFA model
fit analyzed modification index values, including the chi-square goodness-of-fit statistic and fit

69
indices values. Due to a relatively large sample size, the model fit was analyzed based on
numerous measures including, Chi square (χ²), CMIN/df (χ²/df), CFI, RMSEA, IFI, NFI, and
TLI.
Confirmatory factor analysis was conducted to confirm the EFA results with the data set
using an AMOS 24 plug-in for SPSS 23.0 version. A model of measurement based on the EFA
results was constructed and fitted on all GED credentialed students. The resulting CFA was
conducted with a data set reduced by listwise deletion. After deletion, the sample contained
1,358 GED credentialed students.
Statistical Model Fit Options
Chi-square goodness-of-fit. Many fit indices are available for examining appropriate
CFA model fit, including chi square goodness-of-fit statistic, RMSEA, CFI and RFI. The model
chi square goodness-of-fit statistic is a conventional test of overall model fit but includes a major
limitation that “the larger the sample size, the more likely a model will fail to fit via using the χ2
goodness of fit test” (Barrett, 2007). It is thereby recommended that researchers utilize
numerous fit indices to determine appropriate model fit.
Root mean square error of approximation measure. The RMSEA has been
recommended as an appropriate fit index by Byrne (2016) for reasons including model
misspecification, satisfactory model quality, and appropriate confidence intervals being built
upon these measures. The RMSEA specifically examines the overall model fit when parameters
are unknown and the population’s covariance matrix were available (Byrne, 2016). Byrne also
suggests that appropriate values are less than .05.
Comparative fit index. A greater than .90 CFI range is acknowledged as an indication
of a well-fitting model (Byrne, 2016). However, Byrne (2016) and Hooper Coughlan, & Mullen

70
(2008) noted that Hu and Bentler (1999) had suggested a value of greater than .95 as a more
appropriate cut off value. This research project utilized chi square model fit statistics, RMSEA,
and CFI, to measure model fit.
Relative fit indices (IFI, TLI, NFI). Relative fit indices consider a comparison between
a baseline (uncorrelated variables) to the tested model. They can either be normed (Normed Fit
Index) or non-normed (Incremental Fit Index, Tucker-Lewis Index). Good fit thresholds include
≥ 0.90 for IFI/TLI, and ≥ 0.95 for NFI (Hooper, et al., 2008).
Results
Reviewing the literature and based on a theoretical framework of andragogy (Knowles,
1984), self-determination (Ryan & Deci, 2000) and planned behavior (Ajzen, 1991), five latent
constructs were specified in a college readiness and institutional intervention model. Factors
from the EFA were brought forward in CFA measuring GED credentialed community college
students.
The specified CFA model consisted of 15 observed variables based in five facets. The fit
of the five-facet model was as follows: CMIN/df = 259.785, df = 80, CFI = .979, RMSEA =
.041. Values for each index indicated a good fit. Goodness-of-fit indicators and item factor
loadings illustrated a parsimonious model are reported in Tables 4.3 and 4.4 respectively. Latent
factor loadings revealed significance (<.001). The CFA model is shown in Figure 4.1.
Table 4.3 Goodness-of-Fit Indicators for Hypothesized Model
Model n χ² df χ²/df CFI RMSEA NFI IFI TLI
Intent to Persist GED 1358 259.785 80 3.247 0.979 0.041 0.969 0.979 0.972

71
Table 4.4 CFA Results for GED credentialed students (n=1,358)
Estimate
Std. Estimate
S.E.
p- value
Advisor Support An advisor helped me to select a course of study, program or major.
1.000
.798***
.032
<.001
An advisor helped me identify courses I needed. .927 .812*** .031 <.001 An advisor helped me to set academic goals. 1.005 .778*** .035 <.001 I met with an advisor at convenient times. .697 .652*** .029 <.001
Faculty Support All instructors clearly explained course syllabi.
1.000
.841***
.020
<.001
All instructors clearly explained course grading policies.
.977
.831***
.034
<.001
I know how to get in touch with my instructors outside of class.
.781
.650***
.033
<.001
College Readiness – Skill Sets
I learned to understand strength/weaknesses 1.000 .837*** .024 <.001 I learned skills to improve test-taking ability. 1.127 .796*** .037 <.001 I learned to improve study skills (listening, note-taking, highlight readings, etc.).
.945
.806***
.031
<.001
College Readiness – Student Networking Participate in student initiated study group outside of class (not required). 1.000 .816*** .018 <.001 Participate in a required study group outside of class. .867 .694*** .042 <.001 Work with classmates outside of class on class projects or assignments. 1.117 .692*** .055 <.001
College Readiness - Attitude I have the motivation to do what it takes to succeed in college.
1.000
.756***
.019
<.001
I am prepared academically to succeed in college.
1.297
.857***
.070
<.001
***p<.001, **p<0.01, *p<0.05

72
Note: Adv. Support=Advisor Support, Fac. Support=Faculty Support, CR_Skill=College Readiness – Skill Sets, CR_Net=College Readiness – Networking, CR_Attitude=College Readiness - Attitude. Figure 4.1. First-order CFA model results for GED credentialed students

73
Findings Related to Research Question 3
Comparative analysis using t-test and cross-tabulation statistical methods was used to
answer the third research question, regarding the presence of statistically significant differences
in demographic variables such as age, HS grade, marital status, children in the home, enrollment
status, developmental classes taken, and first generation student status, college readiness, and
institutional intervention variables between GED credentialed and high school diploma recipient
community college students. Cross-tabulation/Pearson chi-square tests were used for nominal
and dichotomous variables (no implied order and two levels), while independent t-tests were
conducted on those ordinal and scale (rank) variables (Urdan, 2010; Morgan et al, 2013).
Nominal/dichotomous variables analyzed in this study included race/ethnicity, marital status,
children in the home, enrollment status, 1st generation status, and developmental classes taken.
Phi coefficient was utilized 2 x 2 cross tabulations and Cramer’s V for larger cross-tabulations
(Tabachnick & Fidell, 2013). Analysis through t-test method of ordinal and scale variables
included age, self-reported high school grade, advisor support, faculty support, college ready
student networking, college ready skill sets, and college ready attitude. Tables 4.5 through 4.11
highlight results of t-tests and Chi-Square noting only those results containing significant
differences between both groups.
Results of independent t-tests
Analysis through t-test method considered whether statistically significant differences
existed in background characteristics (age, self-reported HS GPA), college readiness (skills,
attitude, and behavior) and institutional intervention (advisor/faculty support) variables between
GED credentialed and high school diploma community college students. Table 4.5 and 4.6
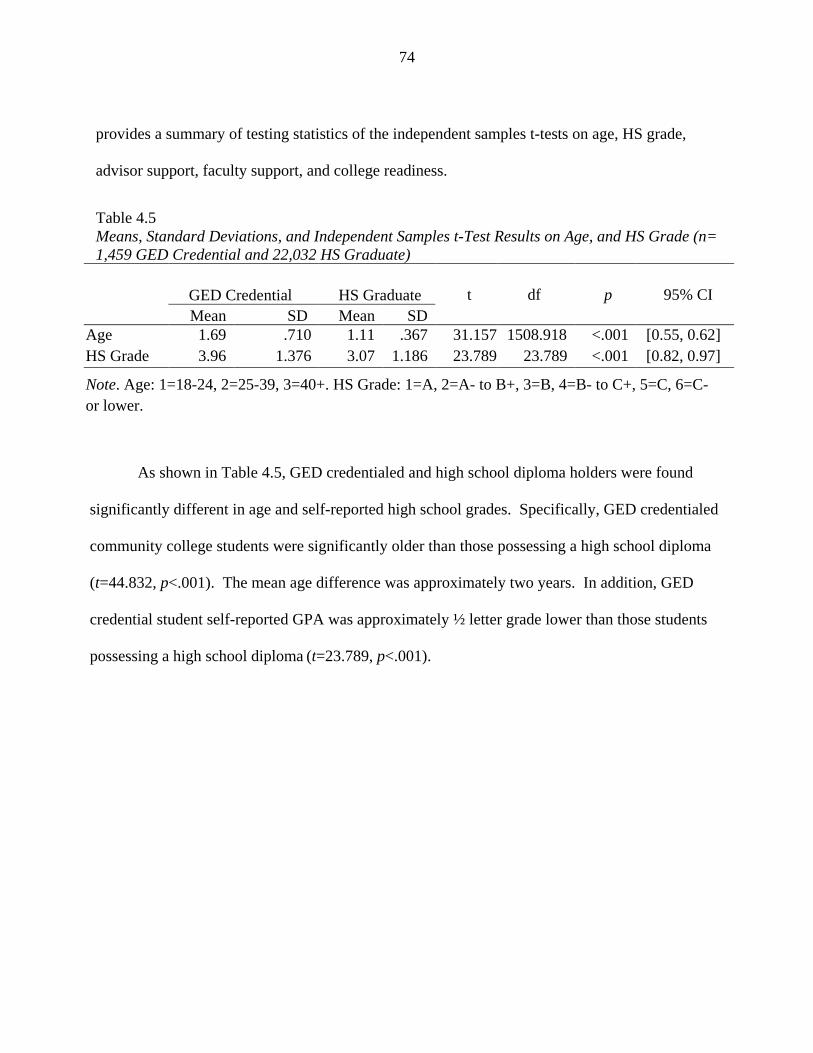
74
provides a summary of testing statistics of the independent samples t-tests on age, HS grade,
advisor support, faculty support, and college readiness.
Table 4.5 Means, Standard Deviations, and Independent Samples t-Test Results on Age, and HS Grade (n= 1,459 GED Credential and 22,032 HS Graduate)
GED Credential HS Graduate t df p 95% CI Mean SD Mean SD
Age 1.69 .710 1.11 .367 31.157 1508.918 <.001 [0.55, 0.62] HS Grade 3.96 1.376 3.07 1.186 23.789 23.789 <.001 [0.82, 0.97]
Note. Age: 1=18-24, 2=25-39, 3=40+. HS Grade: 1=A, 2=A- to B+, 3=B, 4=B- to C+, 5=C, 6=C- or lower.
As shown in Table 4.5, GED credentialed and high school diploma holders were found
significantly different in age and self-reported high school grades. Specifically, GED credentialed
community college students were significantly older than those possessing a high school diploma
(t=44.832, p<.001). The mean age difference was approximately two years. In addition, GED
credential student self-reported GPA was approximately ½ letter grade lower than those students
possessing a high school diploma (t=23.789, p<.001).

75
Table 4.6 Means, Standard Deviations, and Independent Samples t-Test Results on Advisor Support, Faculty Support, College Ready Student Networking, College Ready Skill Sets, and College Ready Attitude (n= 1,459 GED Credential and 22,032 HS Graduate)
GED Credential HS Graduate t df p 95% CI Mean SD Mean SD
Adv. Support 3.75 .934 3.68 .903 3.083 22929 .002 [0.03, 0.13] Fac. Support 4.37 .637 4.32 .633 2.481 23056 .013 [0.01, 0.08] CR Stu. Net. 1.35 .599 1.40 .625 -2.918 1636.241 .004 [-0.08, -0.02] CR Skill Sets 3.99 .826 3.86 .829 5.824 23324 <.001 [0.09, 0.18] CR Attitude 4.40 .685 4.38 .693 1.068 23162 .286 [-0.02, 0.06] Note. Adv. Support: 1=Strongly Agree, 2=Disagree, 3=Neutral, 4=Agree, 5=Strongly Agree. Fac. Support: 1=Strongly Agree, 2=Disagree, 3=Neutral, 4=Agree, 5=Strongly Agree. CR Stu. Net. 1=Never, 2=Once, 3=Two or Three Times, 4=Four or More Times. CR Skill Sets 1=Strongly Agree, 2=Disagree, 3=Neutral, 4=Agree, 5=Strongly Agree. CR Attitude 1=Strongly Agree, 2=Disagree, 3=Neutral, 4=Agree, 5=Strongly Agree.
GED credentialed students had significantly higher faculty support (t=2.964, p=.003),
advisor support (t=3.083, p=.002), and college ready skill set (t=5.824, p<.001) compared to
high school diploma community college students. Faculty/advisor support and college ready
behavior were measured by a seven and five item construct respectively based on the factor
analysis results (see EFA sections for details). GED credentialed students were significantly
lower on college ready behavior (t=-2.918, p=.004) than those students possessing a high school
diploma. College ready attitude was found not to be significantly different between the two
groups.

76
Results of Cross-tabulations
Table 4.7 Cross-tabulation on Marital Status for Student Groups Student Groups Total GED HS Married Yes Count 335 1031 1366
Expected Count 84.8 1281.2 1366.0 % within GEDvsHS 23.0% 4.7% 5.8% No Count 1120 20950 22070 Expected Count 1370.2 20699.8 22070.0 % within GEDvsHS 77.0% 95.3% 94.2%
Total Count 1455 21981 23436 Expected Count 1455.0 21981.0 23436.0 % within GEDvsHS 100.0% 100.0% 100.0%
Note. Phi = .189
Table 4.7 presented the cross-tabulation on marital status. A chi-square test for
association was conducted between marital status and possession of GED or HS credentials. All
expected cell frequencies were greater than five. There was a statistically significant association
between marital status and GED or HS credentials, χ2(1, n=23,436) = 835.677, p <.001. There
was a smaller than typical association (Morgan et al., 2013), between marital status and GED vs
HS credentials, φ = 0.189. Table 4.2 indicates that GED credentialed students (23.0%) were
more likely to be married than those with HS diplomas (4.7%).

77
Table 4.8 Cross-tabulation on Children Living at Home for Student Groups Student Groups Total GED HS Children Yes Count 673 2338 3011
Expected Count 187.0 2824.0 3011.0 % within GEDvsHS 46.4% 10.7% 12.9% No Count 778 19578 20356 Expected Count 1264.0 19092.0 20356.0 % within GEDvsHS 53.6% 89.3% 87.1%
Total Count 1451 21916 23367 Expected Count 1451.0 21916.0 23367.0 % within GEDvsHS 100.0% 100.0% 100.0%
Note. Phi = .257
Table 4.8 presented the cross-tabulation on children living in the home. A chi-square test
for association was conducted between children living in the home and students possessing GED
or HS credentials. All expected cell frequencies were greater than five. There was a statistically
significant association between marital status and GED or HS credentials, χ2(1, n=23,367) =
1546.324, p <.001. There was a smaller than typical association (Morgan et al., 2013), between
children living in the home and GED vs HS credentials, φ = 0.257. Table 4.3 indicates that GED
credentialed students (46.4%) were more likely to have children living in the home than those
with HS diplomas (10.7%).

78
Table 4.9 Cross-tabulation on Enrollment Status for Student Groups Student Groups Total GED HS Enrollment Status Part-time Count 498 5479 5977
Expected Count 371.2 5605.8 5977.0 % within GEDvsHS 34.1% 24.9% 25.4% Full-time Count 961 16553 17514 Expected Count 1087.8 16426.2 17514.0 % within GEDvsHS 65.9% 75.1% 74.6%
Total Count 1459 22032 23491 Expected Count 1459.0 22032.0 23491.0 % within GEDvsHS 100.0% 100.0% 100.0%
Note. Phi = .051
Table 4.9 presented the cross-tabulation on enrollment status. A chi-square test for
association was conducted between enrollment status and students possessing GED vs. HS
credentials. All expected cell frequencies were greater than five. There was a statistically
significant association between enrollment status and GED or HS credentials, χ2(1, n=23,491) =
61.915, p <.001. There was a smaller than typical association (Morgan et al., 2013), between
enrollment status and GED vs HS credentials, φ = 0.051. Table 4.4 indicates that GED
credentialed students (34.1%) were more likely to be enrolled on a part-time basis than those
with HS diplomas (24.9%).

79
Table 4.10 Cross-tabulation on First Generation Status for Student Groups Student Groups Total GED HS First Gen. Yes Count 774 8654 9428
Expected Count 585.6 8842.0 9428.0 % within GEDvsHS 53.1% 39.3% 40.1% No Count 685 13378 14063 Expected Count 873.4 13189.6 14063.0 % within GEDvsHS 46.9% 60.7% 59.9%
Total Count 1459 22032 23491 Expected Count 1459.0 22032.0 23491.0 % within GEDvsHS 100.0% 100.0% 100.0%
Note. Phi = .068
Table 4.10 presented the cross-tabulation on first generation status. A chi-square test for
association was conducted between first generation status and students possessing GED vs. HS
credentials. All expected cell frequencies were greater than five. There was a statistically
significant association between first generation status and GED or HS credentials, χ2(1,
n=23,491) = 108.002, p <.001. There was a smaller than typical association (Morgan et al.,
2013), between first generation status and GED vs HS credentials, φ = 0.068. Table 4.5 indicates
that GED credentialed students (53.1%) were more likely to be first generation students than
those with HS diplomas (39.3%).

80
Table 4.11 Cross-tabulation on Developmental Classes for Student Groups Student Groups Total GED HS Dev. Class Yes Count 1102 12743 13845
Expected Count 855.0 12990.0 13845.0 % within GEDvsHS 76.7% 58.4% 59.5% No Count 335 9088 9423 Expected Count 582.0 8841.0 9423.0 % within GEDvsHS 23.3% 41.6% 40.5%
Total Count 1437 21831 23268 Expected Count 1437.0 21831.0 23268.0 % within GEDvsHS 100.0% 100.0% 100.0%
Note. Phi = .090
Table 4.11 presented the cross-tabulation on developmental classes taken. A chi-square
test for association was conducted between first generation status and students possessing GED
vs. HS credentials. All expected cell frequencies were greater than five. There was a statistically
significant association between developmental classes taken and GED or HS credentials, χ2(1,
n=23,268) = 187.710, p <.001. There was a smaller than typical association (Morgan et al.,
2013), between developmental classes taken and GED vs HS credentials, φ = 0.090. Table 4.6
indicates that GED credentialed students (76.7%) were more likely to have taken a
developmental class than those with HS diplomas (58.4%).
Findings Related to Research Question 4
A 2-block hierarchical logistic regression was conducted to assess the extent to which
identified variables (HS grade, gender, age, marital status, race/ethnicity, enrollment status,
developmental classes taken, number of hours worked for pay weekly, advising support, faculty
support, college readiness skill sets, college readiness attitude, college readiness student
networking; Questions 28, 29, 30, 31, 35, 18d, 18e, 18f, 18g, 18n, 18m, 18o, 18a, 18b, 18c, 18t,

81
18u, 19h, 19i, 19j predicted GED credentialed students’ intention to persist (dependent variable).
To accomplish and justify this statistical analysis, the original dependent variable question posed
“When do you plan to take classes at this college again?” (againcl) was recoded to a
dichotomous variable “Persist” using a scale of “Not Persist=0, Persist=1”. In addition, the use
of logistic regression benefits the researcher as the general assumptions of normality, linearity,
and equal variance resulted are not required (Mertler & Vannatta, 2013).
For this study, the logistic regression focused on the probability of predicting GED
credentialed students’ intention to persist in community college. Goodness-of-fit (χ², df, p, and –
2 log likelihood), model accuracy of classification and description of result variables included in
the model [β, Exp(β)/Odds Ratio, and Wald test] were analyzed and interpreted.
Logistic Regression - Intention to Persist
A 2-block hierarchical logistic regression was chosen to analyze the extent that college
readiness and institutional intervention predicted students’ intention to persist as shown in Figure
4.2. Block one included demographic characteristics, and block two included enrollment status,
student taking at least one developmental course, advising support and faculty support. Thirteen
variables in all were chosen and informed by this study’s conceptual framework comprising of
the theory of andragogy, self-determination, and planned behavior. The logical regression
analysis was accomplished using IBM SPSS 23.0 software. The specific independent variables
included HS grade, gender, age, marital status, race/ethnicity, full or part-time enrollment status,
developmental classes taken, number of hours worked for pay weekly, advising support, faculty
support, college readiness skill sets, college readiness attitude, and college readiness student
networking. Of those, the logistic regression revealed six significant predictors of GED

82
students’ intention to persist, including gender, race/ethnicity (White, Non-Hispanic), first
generation student, students taking at least one developmental course, advisor support, and
faculty support.
According to the Hosmer–Lemeshow test and the –2 log likelihood for goodness of fit,
the results of the logistic regression indicate that the predictors were statistically reliable in
distinguishing between students who intended to persist and those who did not intend to persist
(–2 log likelihood = 1,169.020, χ²(13) = 52.394, p < .001). The model correctly classified
78.2% of the cases. The sensitivity indicated that 99.5% of the students who intend to persist
were correctly identified as having persistence intentions but was not all accurate in predicting
those not intending to persist. The specificity revealed that 3.4% of the students who do not
intend to persist were correctly identified as not intending to persist.
Figure 4.2. Model of college readiness and institutional intervention upon intention to persist
Demographics
• HS Grade• Gender• Age• Marital Status• Race/Ethnicty• Enrollment Status• Development Classes• Weekly Hours Worked
Advisor Support
• An advisor helped me to select a course of study, program or major.
• An advisor helped me identify courses I needed.
• An advisor helped me to set academic goals.
• I met with an advisor at convenient times
Faclty Support
• All instructors clearly explained course syllabi.
• All instructors clearly explained course grading policies.
• I know how to get in touch with my instructors outside of class.
CR Skill Set
• I learned to understand strength/weaknesses
• I learned skills to improve test-taking ability.
• I learned to improve study skills (listening, note-taking, highlight readings, etc.).
CR Attitude
• I have the motivation to do what it takes to succeed in college.
• I am prepared academically to succeed in college.
CR Network
• Participate in student initiated study group.
• Participate in a required study group
• Work with classmates outside of class on class projects or assignments.
Intent to Persist (Dependent Variable)
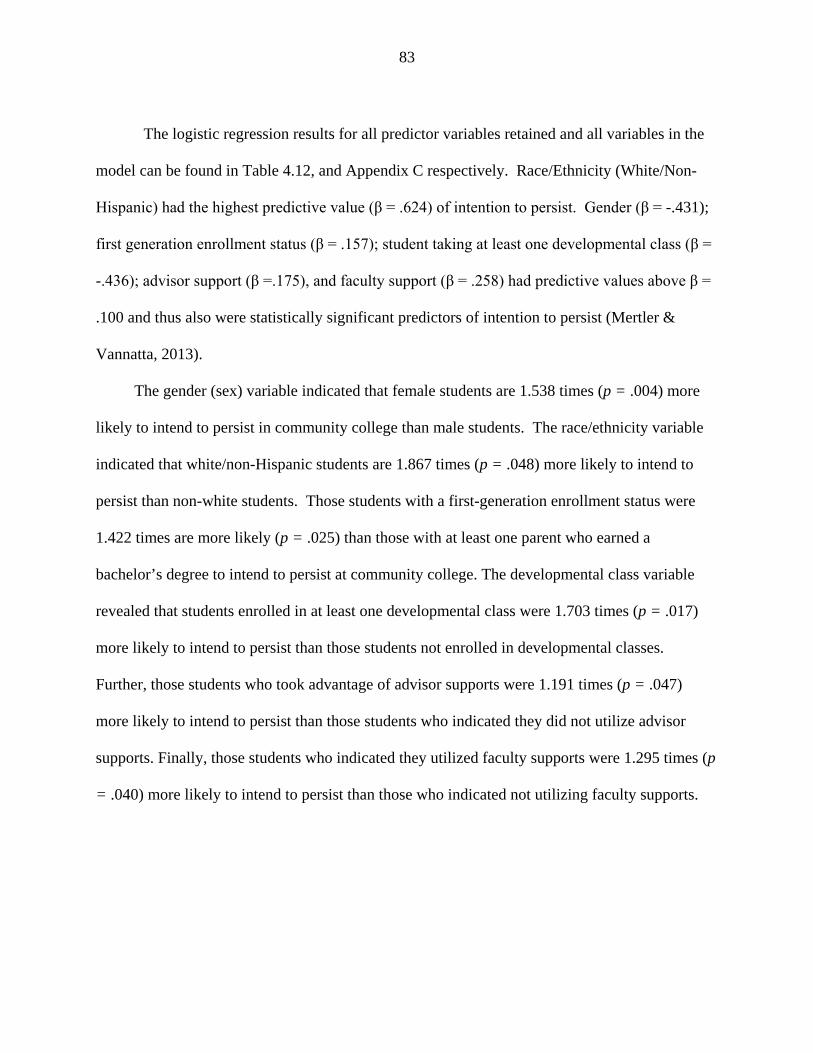
83
The logistic regression results for all predictor variables retained and all variables in the
model can be found in Table 4.12, and Appendix C respectively. Race/Ethnicity (White/Non-
Hispanic) had the highest predictive value (β = .624) of intention to persist. Gender (β = -.431);
first generation enrollment status (β = .157); student taking at least one developmental class (β =
-.436); advisor support (β =.175), and faculty support (β = .258) had predictive values above β =
.100 and thus also were statistically significant predictors of intention to persist (Mertler &
Vannatta, 2013).
The gender (sex) variable indicated that female students are 1.538 times (p = .004) more
likely to intend to persist in community college than male students. The race/ethnicity variable
indicated that white/non-Hispanic students are 1.867 times (p = .048) more likely to intend to
persist than non-white students. Those students with a first-generation enrollment status were
1.422 times are more likely (p = .025) than those with at least one parent who earned a
bachelor’s degree to intend to persist at community college. The developmental class variable
revealed that students enrolled in at least one developmental class were 1.703 times (p = .017)
more likely to intend to persist than those students not enrolled in developmental classes.
Further, those students who took advantage of advisor supports were 1.191 times (p = .047)
more likely to intend to persist than those students who indicated they did not utilize advisor
supports. Finally, those students who indicated they utilized faculty supports were 1.295 times (p
= .040) more likely to intend to persist than those who indicated not utilizing faculty supports.

84
Table 4.12 Logistic Regression Coefficients - Intention to Persist Variable
β
Wald
df
p
Odds Ratio
High school grade .067 1.529 .21
.216 1.069 Gender (female) .431 8.222 1 .004** 1.538 Age .079 2.712 1 .100 1.082 Marital Status (no) .228 1.337 1 .241 1.257 Race/Ethnicity (non-white) .624 3.901 6 .048* 1.867 First Generation Student (non-1st) .352 5.022 1 .025* 1.422 At least one developmental class taken (no) .436 5.723 1 .017* 1.703
Weekly hours worked -.026 .190 1 .663 .974
Advisor Support .175 3.956 1 .047* 1.191
Faculty Support .258 4.234 1 .040* 1.295
College ready – skill set .038 .134 1 .715 1.039
College ready – attitude .178 2.318 1 .128 1.194
College ready – student networking -.129 1.121 1 .290 .879 Constant 1.840 5.979 1 .014* 0.159 †p ≤ .05. **p ≤ .005.
Thirteen independent variables were inputted into the logistic regression analysis in
two blocks and analyzed on the dependent variable intention to persist. Of the 13 variables
inputted, six variables were retained for the final model. The results of the chi-square
analysis, –2 log likelihood, and Hosmer–Lemeshow test indicate that the model was
statistically significantly reliable in distinguishing between students who intend to persist at
community college and those who have indicated they will not.
Summary
In this chapter, student participant’ demographic characteristics were reviewed and
analyzed. Next, constructs were created through exploratory factor analysis and became the

85
foundation for confirmatory factor analysis (CFA). The CFA tested a model of measurement
on community college student possessing either a high school diploma or General Equivalency
Diploma (GED). Third, a comparative analysis was accomplished using t-test and cross-
tabulation statistical methods. Specifically, possible statistical differences in demographic
variables, college readiness, and institutional intervention was explored. Finally, a binary
logistic regression was conducted to assess the probability to which college readiness and
institutional intervention predicts students’ intentions to persist in community college. Chapter
5 will consider the finding’s meanings, practice implications and future research options.

86
CHAPTER 5
DISCUSSION
Retention and persistence in community college has become a major topic for policy
makers, administrators, faculty and staff. A student population which has historically struggled
are those students possessing GED credentials (Long & Mullin, 2014). GED graduates are often
first-generation college students, have minimal experience navigating the maze-like situations of
higher education, and possess the often-cited socio-economic barriers of underserved
populations. This is complicated by the reality that GED graduates left high school early,
thereby not having the opportunity to gain both the educational awareness and confidence
needed to be successful in post-secondary situations (Goodall, 2009). Whether motivated due to
socio-economic or personal mission reasons, GED graduates, full of optimism enter post-
secondary institutions and struggle to persist in fulfilling their academic and life dreams
(Musgrave, 2014).
The presence of this often forgotten and underprepared population needs opportunities
to earn the credentials (not simply short-term training) and degrees needed to obtain gainful
employment. Short term training often results in lower earnings. As such, community
colleges are challenged to rethink and redesign academic programs and student success
services (Prince & Jenkins, 2005).
The purpose of this study is to recognize the unique needs of GED credentialed
community college students but more importantly define and explore factors that predict
persistence. Specifically, examination ensued regarding the impact of college readiness
(behavior and attitude) and institutional intervention (faculty and advisor support) upon

87
persistence of community college students possessing the General Education Development
(GED) credential.
Discussion of the Findings
Discussion of the Descriptive Analysis Findings
Through calculation of frequency statistics, a series of descriptive analyses was
conducted on students with GED and high school credentials responding to the SENSE
survey. In both groups, a greater percentage of students were female, white, did not work,
took developmental courses and declared an intention to persist.
Demographic differences did exist between the GED credentialed and HS diploma
student groups. A greater percentage of GED credentialed students were non-traditional aged
(>25 years old), married, had children living in the home, had a greater instance of lower self-
reported HS grades (B- to C+ vs. A- to B+), and were first generation students. These
demographic characteristics are comparable to GED Testing Service data (Zhang, Guison-
Dowdy, Patterson, & Song, 2011). For example, the 2004 cohort (2004-2010) of GED test
passers beginning postsecondary education included approximately 50% female, 60% white,
and 60% being first generation college students. Though approximately 54% of students
were 24 or older, 15% of the population were between the ages of 15-18. This fact must be
taken seriously when considering institutional policies for incoming community college
students with GED credentials. The potential negative impact upon GED instruction and
consequential move to post-secondary education include, but not limited to a pedagogy
assuming that most students value self-reliance, student failure to recognize their GED study

88
as a bridge to post-secondary education and/or employment, and the educational attainment
can be accomplished in extremely shortened time (Rachal & Bingham, 2004).
Discussion of Factor Analysis Findings
An exploratory factor analysis (EFA) was conducted and confirmed by confirmatory
factor analysis (CFA) that included five latent variables (advisor support, faculty support, college
readiness networking, college readiness attitude, and college readiness skill sets). Advisor and
faculty support represent institutional intervention while networking, attitude, and skill sets are
expressions of college readiness.
The latent variable advisor support focused on the value of providing guidance in selection
of majors and courses. In addition, advisors are instrumental in setting student derived academic
course goals and the creation of resulting academic plan to achieve them. The extant literature
(Gordon, et al., 2008; Bahr, 2008) details numerous examples of advisors providing these kinds
of services to students. As GED credentialed students possess limited exposure in integrating
academic programming to either transfer or employment considerations, these findings confirm
the paramount need of increased student self-efficacy and institutional support in this process.
The faculty support construct included items detailing faculty behavior directly related to
student successful classroom participation. Specifically, helpful faculty support was found to
include the use of purposeful syllabi that contain clear rubrics for grading, course expectations
and possibly the greatest help to GED credentialed students, procedures to contact instructors
outside of class. Course syllabi can no longer be static (Cummings, Bonk & Jacobs, 2002),
rather be written as if it were a living document offering a roadmap for course success.

89
The final three latent variables, skillsets, attitude, and networking represented college
readiness in this study. The emergence of these three factors was consistent with previous
studies (Conley, 2007; Kyllonen, et al., 2014; Kuh, et al., 2006). The literature demonstrates
that student academic skills, success motivation (classroom choices), and life issues all impact
college readiness. This recognition of GED credentialed students’ multi-faceted situation
potentially increases intention to persist in community college.
Discussion of Comparative Analysis Findings
The comparative analysis provided an evidenced based account of General Educational
Development (GED) credentialed students in this study. An analysis of significant differences in
demographic variables such as age, marital status, children in the home, enrollment status,
developmental classes taken, first generation student status, and HS grade between GED
credentialed and high school diploma community college students was conducted. Pearson chi-
square and independent samples t-tests results indicate a rejection of the null hypothesis and
revealed that GED students were older, more likely to be married, have at least one child in the
home, and a reported lower HS GPA.
This study revealed that more high school diploma respondents self-reported GPA
grades of B or better while more GED credentialed students reported greater frequency of B-
grades or less. This is consistent with previous studies demonstrating academic deficiencies
and life situations negatively impacted HS GPA and eventually motivated dropping out
(Bridgeland, et al., 2006; Oreopoulos, 2007; Hickman, Bartholomew, Mathwig, & Heinrich,
2008; Bradley & Renzulli, 2011). Student life and academic barriers that are brought to
community colleges underscores the importance of providing efficacious institutional
intervention to increase potential persistence rates.

90
Discussion of Logistic Regression Analysis Findings
A logistic regression analyses was conducted using 13 independent variables and one
dependent variable: intention to persist. Variables were entered into the logistic regression in two
blocks including background characteristics, college readiness, advisor, and faculty support.
Intention to persist. The logistic regression analysis on the dependent variable intention
to persist retained six variables in the GED credentialed community college student persistence
model: gender; race/ethnicity, first generation student, taking at least one developmental class,
advisor support, and faculty support. This indicates that in addition to student demographics,
institutional intervention plays a significant role in predicting GED students’ intentions to persist
at community college.
In this study, GED credentialed students who were female, White/non-Hispanic, and first
generation were more likely to intend to persist, while contrarily, persistence intention was more
for those enrolled in a developmental course. Surprisingly, self-reported first generation students
were more likely to express an intention to persist in their college endeavors. The results of this
study show that those reporting maleness, are persons of color, have at least one parent
possessing a college degree, and enrolled in a developmental class has a significant negative
impact on GED credentialed students’ intention to persist.
Kenner and Weinerman (2011) assert that often GED credentialed students are adult
learners who have demonstrated success in non-academic settings. Developmental educators are
charged with incorporating material into real life experiences. Those students courageously
returning to school understand the value and connection of education to employment and must

91
not see developmental coursework as a necessary hoop in their educational experience. Jenkins
and Weiss (2011) found an increased rate of persistence and retention for those GED
credentialed students taking developmental courses who have committed to a deliberate
concentration of courses.
Institutional intervention (faculty and Advisor Support) was found to positively influence
student intention to persist. Questions most influential included those that focused on students
developing academic plans, ascertaining courses needed to be taken, and communicating with
instructors regarding class procedures. These results acknowledge both GED credentialed students
naivete' and belief that institutional personnel will provide pathways to persist.
The findings of the logistic regression analysis indicated that there is a statistically
significant relationship between institutional intervention on the dependent variable of intention
to persist for GED credentialed community college students and resulted in the rejection of the
first hypothesis (H01). Though the model was able to correctly identify students who intend to
persist (99.5%) it was NOT at all accurate in predicting those not intending to persist. This is
typical when the outcome variable is skewed heavily. While the great majority of students intend
to persist, many do not. This result occurred because no true variable “persist” existed in the
original survey, thus leaving the researcher to user the variable “intent to persist” as the
dependent variable.
Implications
Implications for Institutional Practice
The findings of this study provide a foundation for effective service to GED
credentialed community college students by administrators, faculty and student service

92
personnel. The results also suggest development and application of approaches that consider
the need of students and educational institutions alike. The implications for practice of
institutional intervention and college readiness upon on GED credentialed community college
students are summarized thusly.
First, this study results in a greater understanding how institutional intervention
heightens student intention to persist. Interaction specifically considered a) how advising
staff’s provision of academic goal planning tools, and b) faculty’s willingness to make clear
course expectations/accessibility to assistance positively impacts GED credentialed student’s
intention to persist in community college. Practitioners are expected to understand their role in
nourishing this population’s self-determination (Ajzen, 1991) through supports and provide
contextualized learning environments (Knowles, 1980) to achieve their academic, employment
and life aspirations.
Advising Interaction
Academic goal planning provided by advisors must transcend recitation of courses
needed for degrees, but include a purposeful review of how majors and programs of study lead
directly to desired employment situations, and an emphasis that general skill sets are needed in
college differ greatly than those in a GED program. GED credentialed students in this study
self-identified a greater recognition of improved study skills, academic strengths/weakness, and
test-taking ability. This would suggest that the GED credentialed population demonstrates a
self-determination “intrinsic aspirations” (Deci & Ryan 2000). Helton (2005) reported that
students believed that academic activities and eventual success in a GED program could be
replicated at the college level when comprehensive institutional supports were implemented.

93
This can be accomplished initiating three practical approaches; creation of cohorts, use of
occupational databases, and “bridging” GED classes and services with current post-secondary
offerings.
An initial practical approach to this problem is the creation of a cohort (learning
communities) of GED students assigned to specific academic advisors. In addition, GED
credentialed students would complete orientations, first-year experience courses (facilitated by
advising staff), and required gateway (developmental or college level) courses limited to
students with GED credentials.
Learning communities provide students with support, safety, accountability, and a
confidence that they belong in college (Engstrom & Tinto, 2008). Advisors who approach their
craft actively and intrusively to include multiple student visits per semester, review of academic
plans and referring to other services when needed are more likely to heighten student chances of
success (Engle & Tinto, 2008). Advisors collaborating in this fashion offer hope and tools to
GED credentialed students to increase confidence and take responsibility in their future.
A second approach to academic goal planning would include the use of an occupational
database such as O*Net Online, sponsored by the United States Department of Labor, when
developing student academic goal plans. The O*Net resource is searchable through career
clusters, industries and job zones (job preparation needed). Though the process of
employment acquisition can be potentially overwhelming, academic advisors (and other
institutional representatives) can provide useful information and guidance in a minimal amount
of time. It is not unusual for community college students to be undecided as to career
aspirations, but clear academic advisement with a priority of helping students discern

94
economic and work value priorities will benefit them greatly (Brown & Associates, 2002).
Advisors and other student service professionals who provide unencumbered information
regarding employment aspirations motivates student’s beliefs and self-reliant behavior (Ajzen,
1991).
A third general approach is to develop models that bridge GED class and services to
college options. Initially, this type of transition model could be realized through a
redevelopment of course curriculum that weaves outcomes from both GED and college credit
courses. This approach makes GED students aware of greater need to continue post-secondary
studies but could also overwhelm GED instructors who have little freedom to adapt curriculum
because of the limited time and great amounts of content to be covered (Zafft, 2008). A more
deliberate transition program would include GED instructors and community college instructors
co-teaching courses. Institutional investment, assessment of academic skills, commitment to
contextualized learning, team-teaching pedagogy, and release time for faculty preparation have
increased participation and securing of market-valued post-secondary credentials (Wachen,
Jenkins, Belfield, & Van Noy, 2012). Student centered and pedagogically creative community
college faculty’s intervention can positively impact GED credentialed students’ intent to persist.
In addition, the GED students (like all students) in this study arrive at our institutions
with various levels of self-confidence and college readiness. Thus, community college student
services and faculty are tasked with meeting the needs of this population by adapting the
environment. Some practical examples of accomplishing this include, group and individual
introductory meetings by assigned advisor to this population regarding the general goal of
academic planning, providing examples of program/transfer plans for common career and

95
academic paths, and executing short workshops reviewing the application of classroom skills
utilizing the GED curriculum materials.
Faculty Interaction
Often GED credentialed students are non-traditional age and possess numerous socio-
economic and familial pressures. The educational pursuit can simply be one (albeit primary)
voice competing for student attention. Experiencing multiple stressors, a sense of regret can lead
to a judgment that their current situation is their primary barrier to life success. When faced with
the decision to further their education, some are motivated to reach out for assistance (Hand &
Payne, 2008), while others consider high school experiences the fault of instructors and judge
they weren’t necessarily interested in their academic success (Komarraju, Musulkin, &
Bhattacharya, 2010). This population ‘s varied and complex needs cannot be overstated. An
often-overlooked resource are course syllabi.
Effective course syllabi must minimally include detailed information regarding instructor
office hours/contact information, clearly demarcated due dates (not TBA), required work grading
rubrics, textbook information and general course policies (Fink, 2013). GED credentialed
students consider the instructor as the course authority and as such, are understood as the
purveyor of resources to be successful in the course. This study showed that those resources
must include an open communication by faculty as to non-classroom accessibility and specific
grading rubrics for assessment purposes. Faculty must resist the temptation of assuming all
students are homogenous and possess the basic wherewithal for successful classroom behavior.
An effective course syllabus will address both these resources and become a literal roadmap for
course success.

96
For this population, human connection and the perception they matter implied in faculty
outside-classroom interaction is a primary factor for success. As GED credentialed students
enroll in postsecondary education at later stages in their life than their high school graduate
counterparts (Zhang, et al., 2011) and often have less understanding of college classroom
mechanics, faculty should take seriously student readiness to learn, and the power they possess
for relationship building (Knowles, 1980). Faculty enhance student trust by providing clear
knowledge as to application of course materials to future goals. In addition, faculty are
challenged to personally review or refer to other student services deliberate resources leading to
college success. This balance of providing academic rigor and compassion to often under-
prepared adult students can be very tricky. The temptation to judge a student’s placement in
college due to apparent lack of basic academic (reading, writing, math) and course content skills
must be avoided. Though the goal for all educational institutions is student procurement of life
and market-valued information and credentials, faculty have the dubious task of balancing course
content with student need (Schnee, 2008).
A promising resource to undergird the faculty mission is supplemental instruction.
Supplemental instruction, voluntary to students, considers courses that traditionally pose
academic difficulties, moderated by students who have successfully taken the course, and
supplement rather than review class material. This type of instruction has proven to be
successful. One such study reported increases in academic performance of males, increased pass
rates in underrepresented minority populations, and an increase in registration for subsequent
sequenced courses (Peterfruend, Rath, Xenos, & Bayliss, 2008).
It is vitally important for community college students to fully understand how they are
assessed. This can be accomplished by faculty developing grading rubrics. Rubrics minimally

97
should contain a clear statement of the assignment/assessment objectives, criteria for evaluation,
and a point scale using descriptive statements. The importance of using grading rubrics include
fair and consistent grades being used, saves instructor time grading, and results in a better
understanding of student strengths and weaknesses (Walvoord & Johnson-Anderson, 2010). In
addition, the use of rubrics will decrease anxiety by providing knowledge of expectations and
overall assessment criteria (Panadero et al., 2012) thereby increasing student efficacy (Andrade,
Wang, Du, & Akawi, 2009) and self-regulation (Reynolds-Keefer 2010).
Pedagogical considerations (Developmental Education)
Though this study showed a higher rate of unpreparedness for GED credentialed students
(especially math) than their high school graduate counterparts, students (GED credentialed or HS
diploma) who completed developmental courses were more likely to persist in college (Guison-
Dowdy & Patterson, 2011). Thus, it is reasonable to assert that developmental course success
increases student willingness to succeed at the post-secondary level. Faculty have noteworthy
influence on student success. Faculty, when advancing pedagogical method, should consider at
least the following; contextualized learning and use of audio/visual supplements.
GED credentialed (often adult students) find relevancy when exposed to real-world
situations. Wise instructors, giving students opportunities to share their life experiences in the
context of classroom material, connect the educational process to employment opportunities
(Clyburn, 2013). Contextualizing developmental curricula was found to overcome numerous
barriers that are present in adult learners. One astute instructor attempting to explain the
Pythagorean theorem in a developmental math class setting, brought in a ladder and a work
safety manual to show geometric real-life applications (Showalter, Wollett, & Reynolds, 2014).

98
For the overwhelmed and anxious student in content driven courses like mathematics or
history, theory becomes practical with the insertion of contextualized tutorial videos. Video
tutorials as a supplemental pedagogical method to traditional lectures have shown promise
extending instructor influence to adult students (Pan et al., 2012). Video course enhancement
engaging multiples senses to heighten student learning (Bonk, 2008), offers students greater
control over learning by being able to review material as needed (Hartsell & Yuen, 2006), and
offer material in an attention heightening fashion (Branigan, 2005).
Implications for Future Research
This study explored the impact of institutional intervention and college readiness’ impact
upon GED credentialed student’s intent to persist at community colleges. A result of this study
was the creation of a model of institutional intervention and college readiness (Figure 4.7).
Another result is a comparison between GED credentialed and high school diploma students
using various statistical analyses. This study contributes to the growing body of literature and
presents implications for future research in specific areas.
First, this study analyzes SENSE survey data captured during weeks four and five of
student’s first semester and considers only intention to persist for GED credentialed students.
The survey’s intention is improvement of institutional practices impacting student success. As
GED credentialed students often have minimal understanding of college workings or the skills
needed for success, the use of “front-gate” intentions to persist might not be representative of or
consistent with best practices found in the ongoing literature concerning the power of
engagement upon GED credentialed students or other high-risk populations. The researcher
recommends replicating this study using a study administered later in a student’s career such as
the Community College Survey of Student Engagement (CCSSE), which considers student

99
engagement and family support’s impact upon student success. Future studies can also consider
the impact upon student confidence associated with specific ethnicity and or age groups. In
addition, statistical techniques such as survival analysis could prove helpful to consider how
students follow through on their intent to persist.
Second, this study was limited to institutional intervention variables advising academic
planning and faculty as purveyors of classroom tools. Building upon current research on GED
credentialed students, would benefit community colleges’ attempt at increasing persistence rates
for this population. As the literature suggests that GED credentialed student’s primary reason for
community college attendance is to acquire market valued employment skills (Foster, Strawn &
Duke-Benefield, 2011), future study should include exploration of advising methods that focus
on career needs and pedagogical method’s impact on GED or other at-risk populations (Grubb,
2006 & Krathwohl, 2002).
Third, this study can be expanded upon by adapting the intent to persist model structure
by focusing on college readiness as a product of previous secondary education (traditional high
school and equivalency studies), rather than student attitude and behavior. This study considered
college readiness as inferred by student confidence and specific study patterns. Structural
equational modeling focused on college readiness would have been possible through inclusion of
variables such as study time, use of tutoring services and socio-economic factors.
Fourth, the study of this population may be enhanced through the addition of qualitative
research that focus on psycho-social differences between GED credentialed and high school
diploma holders entering community college. Institutions of higher education are challenged to
listen to the “voices” of this population.

100
Conclusions
GED credentialed students, often first-generation and underprepared, arrive at
community colleges with complex and multifaceted needs. Sensitivity to this fact will motivate
college administrators and other servants to develop procedures and offer programs that not only
heighten chances of success, but also increase the probability of transfer to 4 year institutions.
This study sought answers to how institutional intervention and college readiness
influences intention to persist in GED credentialed community college students. The study’s
research goals were accomplished through the development of an intent to persist model, which
describes institutional intervention and college readiness constructs, prediction on intention to
persist, and interaction of those constructs and other factors. The study’s findings are instructive
to community college administrators, educators, and researchers who are interested in
community college student success.
This study contributed to extant literature on institutional intervention and student
persistence by demonstrating how specific interventions of both faculty and academic advisors
positively impact GED credentialed community college students. The GED student population
has multifaceted issues and barriers inhibiting academic success. The intent to persist model
provides options for community college personnel to heighten chances of persistence.

101
APPENDIX A: 2014 (SENSE) SURVEY

102

103

104

105

106

107

108

109
APPENDIX B: INSITUTITONAL REVIEW BOARD (IRB) STATUS

110
APPENDIX C: 2014 SENSE SURVEY CODEBOOK
Item Variable Responses
Item 1
1. Have you taken this survey in another class this semester/quarter?
SRVAGAIN 1 = Yes
2 = No
Item 2
2. Thinking about this semester/quarter, how would you describe your enrollment at this college?
ENRLMENT 1 = Less than full-time
2 = Full-time
Item 3
3. Did you begin college at this college or elsewhere?
ENTER 1 = Started here
2 = Started elsewhere
Item 4: While in high school, did you earn college credit for one or more courses? (Mark all that apply)
4a. No NOHS 0 = No response
1 = Response
4b. Yes, at this college THISC 0 = No response
1 = Response
4c. Yes, at a different college DIFFC 0 = No response
1 = Response
4d. Yes, at my high school MYHS 0 = No response
1 = Response
Item 5
5. In addition to taking courses at this college, were/are you also enrolled at a 4-year college or university during your first semester/quarter?
OTHERENR 1 = Yes
2 = No
Item 6
6. How many semesters/quarters have you been enrolled at this college?
TERMSENR 1 = This is my first semester/quarter
2 = This is my second semester/quarter
3 = This is my third semester/quarter
4 = This is my fourth semester/quarter
5 = I have been enrolled more than four semesters/quarters

111
Item Variable Responses
Item 7
7. How many courses did you enroll in for your first semester/quarter at this college?
COURSENO 1 = One
2 = Two
3 = Three
4 = Four or more
Item 8
8. Did you add or drop any classes within the first three weeks of your first semester/quarter at this college?
ADDROP 1 = Yes, without discussing my decision with a college staff member or instructor
2 = Yes, after discussing my decision with a college staff member or instructor
3 = No, I did not add or drop any courses
Item 9
9. Of the courses you enrolled in during your first semester/quarter at this college, how many did you drop after the first day of class?
DROPNO 1 = None
2 = One
3 = Two
4 = Three
5 = Four or more
Item 10
10. When did you register for your courses for your first semester/quarter at this college?
REGCLASS 1 = More than one week before classes began
2 = During the week before classes began
3 = During the first week of classes
4 = After the first week of classes
Item 11: The following statements are about this college's orientation for new students.(Mark all that apply)
11a. I took part in an online orientation prior to the beginning of classes
ONLORIEN 0 = No response
1 = Response
11b. I attended an on-campus orientation prior to the beginning of classes
ONCORIEN 0 = No response
1 = Response
11c. I enrolled in an orientation course as part of my course schedule during my first semester/quarter at this college
CSORIEN 0 = No response
1 = Response

112
Item Variable Responses
11d. I was not aware of a college orientation NWORIEN 0 = No response
1 = Response
Item Variable Responses
Item 11: The following statements are about this college's orientation for new students.(Mark all that apply)
11e. I was unable to participate in orientation due to scheduling or other issues
UNAORIEN 0 = No response
1 = Response
Item 12: Think about your experiences from the time of your decision to attend this college through the end of the first three weeks of your first semester/quarter.
12a. Before I could register for classes, I was required to take a placement test (COMPASS, ASSET, ACCUPLACER, SAT, ACT, etc.) to assess my skills in reading, writing, and/or math
REQPTEST 1 = Yes
2 = No
12b. I took a placement test (COMPASS, ASSET, ACCUPLACER, SAT, ACT, etc.)
TKPTEST 1 = Yes
2 = No
12c. I was exempt from taking a placement test at this college
EXPTEST 1 = Yes
2 = No
Item 13: My placement test scores indicated that I needed to take a Developmental course (also referred to as Basic Skills, College Prep, etc.) in the following areas. (Mark all that apply)
13a. Didn't take a placement test NOTEST 0 = No response
1 = Response
13b. Developmental Reading NEEDREAD 0 = No response
1 = Response
13c. Developmental Writing NEEDWRIT 0 = No response
1 = Response
13d. Developmental Math NEEDMATH 0 = No response
1 = Response
13e. Didn't place into any Developmental courses
NEEDNONE 0 = No response
1 = Response
Item 14
14. This college required me to enroll in classes indicated by my placement test scores during my first semester/quarter
REQCLASS 1 = Yes
2 = No

113
Item Variable Responses
Item 15: With regard to financial assistance (scholarships, grants, or loans, etc.) to help with your college costs:
15a. I applied for financial assistance APPLIED 1 = Yes
2 = No
15b. I was notified I was eligible to receive financial assistance
OFFERED 1 = Yes
2 = No
Item Variable Responses
Item 15: With regard to financial assistance (scholarships, grants, or loans, etc.) to help with your college costs:
15c. I received financial assistance funds before classes began
RECEIVED 1 = Yes
2 = No
Item 16
16. When did you first apply for financial assistance?
TIMEAPPL 1 = 3 or more months before classes began
2 = 1 to 2 months before classes began
3 = Less than 1 month before classes began
4 = After classes began
5 = I did not apply for financial assistance
Item 17: In which of the following types of courses were you enrolled during your first semester/quarter at this college?
17a. Developmental Reading (also referred to as Basic Skills, College Prep, etc.)
EDCPR 1 = Enrolled
2 = Not enrolled
17b. Developmental Writing (also referred to as Basic Skills, College Prep, etc.)
EDCPW 1 = Enrolled
2 = Not enrolled
17c. Developmental Math (also referred to as Basic Skills, College Prep, etc.)
EDCPM 1 = Enrolled
2 = Not enrolled
17d. An English course taught specifically for students whose first language is not English (ESL, ESOL)
ENRLENG 1 = Enrolled
2 = Not enrolled
17e. A course specifically designed to teach skills and strategies to help students succeed in college (e.g., a college success or student success course)
ENRLSSDC 1 = Enrolled
2 = Not enrolled
17f. An organized "learning community" (two or more courses that a group of students take together)
ENRLOLC 1 = Enrolled
2 = Not enrolled

114
Item Variable Responses
Item 18: Think about your experiences from the time of your decision to attend this college through the end of the first three weeks of your first semester/quarter.
18a. The very first time I came to this college I felt welcome
WELCOME 1 = Strongly disagree
2 = Disagree
3 = Neutral
4 = Agree
5 = Strongly agree
Item Variable Responses
Item 18: Think about your experiences from the time of your decision to attend this college through the end of the first three weeks of your first semester/quarter.
18b. The instructors at this college want me to succeed
WNTSCCD 1 = Strongly disagree
2 = Disagree
3 = Neutral
4 = Agree
5 = Strongly agree
18c. All the courses I needed to take during my first semester/quarter were available at times convenient for me
CONVTIME 1 = Strongly disagree
2 = Disagree
3 = Neutral
4 = Agree
5 = Strongly agree
18d. I was able to meet with an academic advisor at times convenient for me
AACONTIM 1 = Strongly disagree
2 = Disagree
3 = Neutral
4 = Agree
5 = Strongly agree
18e. An advisor helped me to select a course of study, program, or major
AASELMAJ 1 = Strongly disagree
2 = Disagree
3 = Neutral
4 = Agree
5 = Strongly agree

115
Item Variable Responses
18f. An advisor helped me to set academic goals and to create a plan for achieving them
ACADGOAL 1 = Strongly disagree
2 = Disagree
3 = Neutral
4 = Agree
5 = Strongly agree
18g. An advisor helped me to identify the courses I needed to take during my first semester/quarter
CRSADV 1 = Strongly disagree
2 = Disagree
3 = Neutral
4 = Agree
5 = Strongly agree
Item 18: Think about your experiences from the time of your decision to attend this college through the end of the first three weeks of your first semester/quarter.
18h. A college staff member talked with me about my commitments outside of school (work, children, dependents, etc.) to help me figure out how many courses to take
OSCOMM 1 = Strongly disagree
2 = Disagree
3 = Neutral
4 = Agree
5 = Strongly agree
18i. The college provided me with adequate information about financial assistance (scholarships, grants, loans, etc.)
FAINFO 1 = Strongly disagree
2 = Disagree
3 = Neutral
4 = Agree
5 = Strongly agree
18j. A college staff member helped me determine whether I qualified for financial assistance
QUALFA 1 = Strongly disagree
2 = Disagree
3 = Neutral
4 = Agree
5 = Strongly agree
18k. All instructors had activities to introduce students to one another
ACTINTRO 1 = Strongly disagree
2 = Disagree
3 = Neutral
4 = Agree
5 = Strongly agree

116
Item Variable Responses
18l. All instructors clearly explained academic and student support services available at this college
RESOURCE 1 = Strongly disagree
2 = Disagree
3 = Neutral
4 = Agree
5 = Strongly agree
18m. All instructors clearly explained course grading policies
GRADEPOL 1 = Strongly disagree
2 = Disagree
3 = Neutral
4 = Agree
5 = Strongly agree
Item 18: Think about your experiences from the time of your decision to attend this college through the end of the first three weeks of your first semester/quarter.
18n. All instructors clearly explained course syllabi (syllabuses)
SYLLABI 1 = Strongly disagree
2 = Disagree
3 = Neutral
4 = Agree
5 = Strongly agree
18o. I knew how to get in touch with my instructors outside of class
FACMEET 1 = Strongly disagree
2 = Disagree
3 = Neutral
4 = Agree
5 = Strongly agree
18p. At least one college staff member (other than an instructor) learned my name
CSTAFNAM 1 = Strongly disagree
2 = Disagree
3 = Neutral
4 = Agree
5 = Strongly agree
18q. At least one other student whom I didn't previously know learned my name
OSTUDNAM 1 = Strongly disagree
2 = Disagree
3 = Neutral
4 = Agree
5 = Strongly agree

117
Item Variable Responses
18r. At least one instructor learned my name FACNAM 1 = Strongly disagree
2 = Disagree
3 = Neutral
4 = Agree
5 = Strongly agree
18s. I learned the name of at least one other student in most of my classes
STUNAM 1 = Strongly disagree
2 = Disagree
3 = Neutral
4 = Agree
5 = Strongly agree
Item 18: Think about your experiences from the time of your decision to attend this college through the end of the first three weeks of your first semester/quarter.
18t. I have the motivation to do what it takes to succeed in college
ITTAKES 1 = Strongly disagree
2 = Disagree
3 = Neutral
4 = Agree
5 = Strongly agree
18u. I am prepared academically to succeed in college
ACPRPRD 1 = Strongly disagree
2 = Disagree
3 = Neutral
4 = Agree
5 = Strongly agree
Item 19: During the first three weeks of your first semester/quarter at this college, about how often did you do the following?
19a. Ask questions in class or contribute to class discussions
ASKQUES 1 = Never
2 = Once
3 = Two or three times
4 = Four or more times
19b. Prepare at least two drafts of a paper or assignment before turning it in
PREPDRFT 1 = Never
2 = Once
3 = Two or three times
4 = Four or more times

118
Item Variable Responses
19c. Turn in an assignment late LATETURN 1 = Never
2 = Once
3 = Two or three times
4 = Four or more times
19d. Not turn in an assignment NOTTURN 1 = Never
2 = Once
3 = Two or three times
4 = Four or more times
Item Variable Responses
Item 19: During the first three weeks of your first semester/quarter at this college, about how often did you do the following?
19e. Participate in supplemental instruction (extra class sessions with an instructor, tutor, or experienced student)
SUPINSTR 1 = Never
2 = Once
3 = Two or three times
4 = Four or more times
19f. Come to class without completing readings or assignments
NOTCOMPL 1 = Never
2 = Once
3 = Two or three times
4 = Four or more times
19g. Work with other students on a project or assignment during class
PINCLASS 1 = Never
2 = Once
3 = Two or three times
4 = Four or more times
19h. Work with classmates outside of class on class projects or assignments
PREPOUTC 1 = Never
2 = Once
3 = Two or three times
4 = Four or more times

119
Item Variable Responses
19i. Participate in a required study group outside of class
GRPSTUDY 1 = Never
2 = Once
3 = Two or three times
4 = Four or more times
19j. Participate in a student-initiated (not required) study group outside of class
NRGSTUDY 1 = Never
2 = Once
3 = Two or three times
4 = Four or more times
19k. Use an electronic tool (e-mail, text messaging, Facebook, MySpace, class Web site, etc.) to communicate with another student about coursework
USEINTMG 1 = Never
2 = Once
3 = Two or three times
4 = Four or more times
Item Variable Responses
Item 19: During the first three weeks of your first semester/quarter at this college, about how often did you do the following?
19l. Use an electronic tool (e-mail, text messaging, Facebook, MySpace, class Web site, etc.) to communicate with an instructor about coursework
MAILFAC 1 = Never
2 = Once
3 = Two or three times
4 = Four or more times
19m. Discuss an assignment or grade with an instructor
FACASSN 1 = Never
2 = Once
3 = Two or three times
4 = Four or more times
19n. Ask for help from an instructor regarding questions or problems related to a class
CLASSREL 1 = Never
2 = Once
3 = Two or three times
4 = Four or more times

120
Item Variable Responses
19o. Receive prompt written or oral feedback from instructors on your performance
FEEDBACK 1 = Never
2 = Once
3 = Two or three times
4 = Four or more times
19p. Receive grades or points on assignments, quizzes, tests, or papers, etc.
RCVGRDS 1 = Never
2 = Once
3 = Two or three times
4 = Four or more times
19q. Discuss ideas from your readings or classes with instructors outside of class
FACIDOC 1 = Never
2 = Once
3 = Two or three times
4 = Four or more times
19r. Discuss ideas from your readings or classes with others (students, family, co-workers, etc.) outside of class
OCIDEAS 1 = Never
2 = Once
3 = Two or three times
4 = Four or more times
Item Variable Responses
Item 19: During the first three weeks of your first semester/quarter at this college, about how often did you do the following?
19s. Skip class SKIPCL 1 = Never
2 = Once
3 = Two or three times
4 = Four or more times
Item 20.1: Think about your experiences from the time of your decision to attend this college through the end of the first three weeks of your first semester/quarter. Did you know about the following services?
20.1a. Academic advising/planning ACADPLNG 1 = Yes
2 = No
20.1b. Career counseling CAREERC 1 = Yes
2 = No

121
Item Variable Responses
20.1c. Job placement assistance JOBPLACE 1 = Yes
2 = No
20.1d. Face-to-face tutoring FFTUTOR 1 = Yes
2 = No
20.1e. Online tutoring OLTUTOR 1 = Yes
2 = No
20.1f. Writing, math, or other skill lab SKILLABS 1 = Yes
2 = No
20.1g. Financial assistance advising FAADVS 1 = Yes
2 = No
20.1h. Computer lab COMPLAB 1 = Yes
2 = No
20.1i. Student organizations STUORGS 1 = Yes
2 = No
20.1j. Transfer credit assistance TRANSFCR 1 = Yes
2 = No
20.1k. Services to students with disabilities DISABSVS 1 = Yes
2 = No
Item Variable Responses
Item 20.2: Think about your experiences from the time of your decision to attend this college through the end of the first three weeks of your first semester/quarter. How often did you use the following services?
20.2a. Academic advising/planning ACADPUSE 1 = Never
2 = Once
3 = Two or three times
4 = Four or more times
20.2b. Career counseling CARCUSE 1 = Never
2 = Once
3 = Two or three times
4 = Four or more times
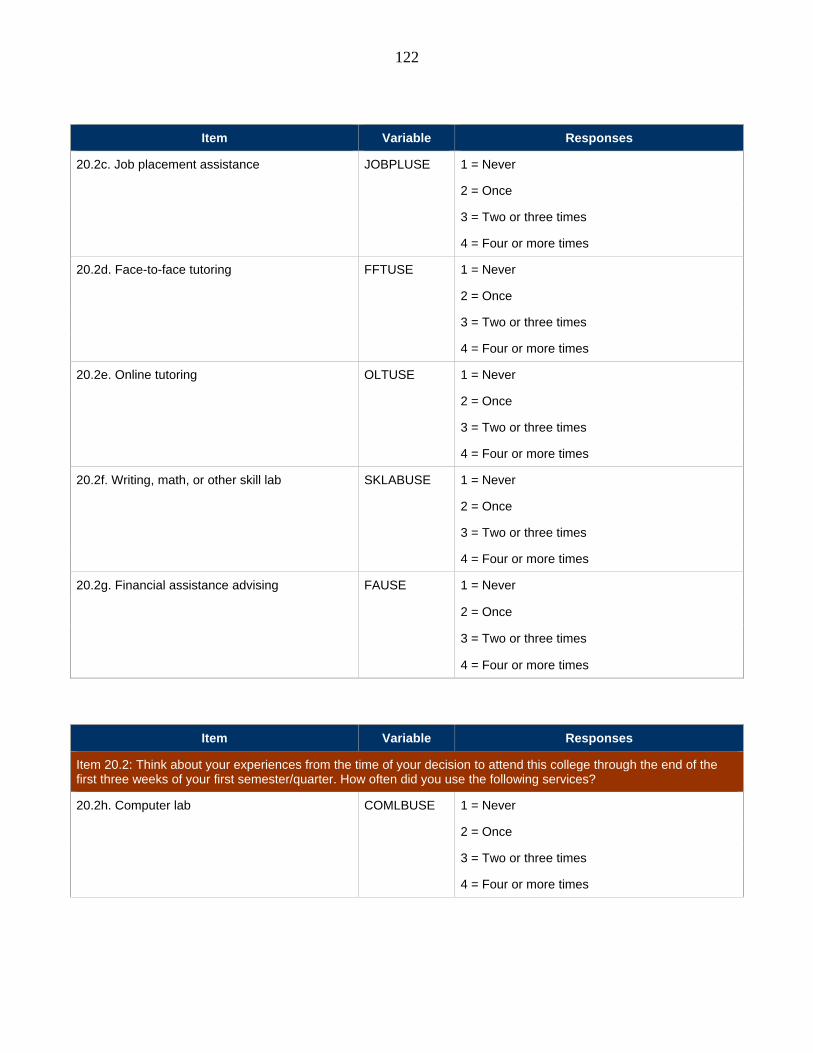
122
Item Variable Responses
20.2c. Job placement assistance JOBPLUSE 1 = Never
2 = Once
3 = Two or three times
4 = Four or more times
20.2d. Face-to-face tutoring FFTUSE 1 = Never
2 = Once
3 = Two or three times
4 = Four or more times
20.2e. Online tutoring OLTUSE 1 = Never
2 = Once
3 = Two or three times
4 = Four or more times
20.2f. Writing, math, or other skill lab SKLABUSE 1 = Never
2 = Once
3 = Two or three times
4 = Four or more times
20.2g. Financial assistance advising FAUSE 1 = Never
2 = Once
3 = Two or three times
4 = Four or more times
Item Variable Responses
Item 20.2: Think about your experiences from the time of your decision to attend this college through the end of the first three weeks of your first semester/quarter. How often did you use the following services?
20.2h. Computer lab COMLBUSE 1 = Never
2 = Once
3 = Two or three times
4 = Four or more times

123
Item Variable Responses
20.2i. Student organizations STORGUSE 1 = Never
2 = Once
3 = Two or three times
4 = Four or more times
20.2j. Transfer credit assistance TRNFCRAS 1 = Never
2 = Once
3 = Two or three times
4 = Four or more times
20.2k. Services to students with disabilities DISVSUSE 1 = Never
2 = Once
3 = Two or three times
4 = Four or more times
Item 20.3: Think about your experiences from the time of your decision to attend this college through the end of the first three weeks of your first semester/quarter. How satisfied were you with the following services?
20.3a. Academic advising/planning ACADPSAT 0 = Not applicable
1 = Not at all
2 = Somewhat
3 = Very
20.3b. Career counseling CARCSAT 0 = Not applicable
1 = Not at all
2 = Somewhat
3 = Very
20.3c. Job placement assistance JOBPLSAT 0 = Not applicable
1 = Not at all
2 = Somewhat
3 = Very
Item 20.3: Think about your experiences from the time of your decision to attend this college through the end of the first three weeks of your first semester/quarter. How satisfied were you with the following services?
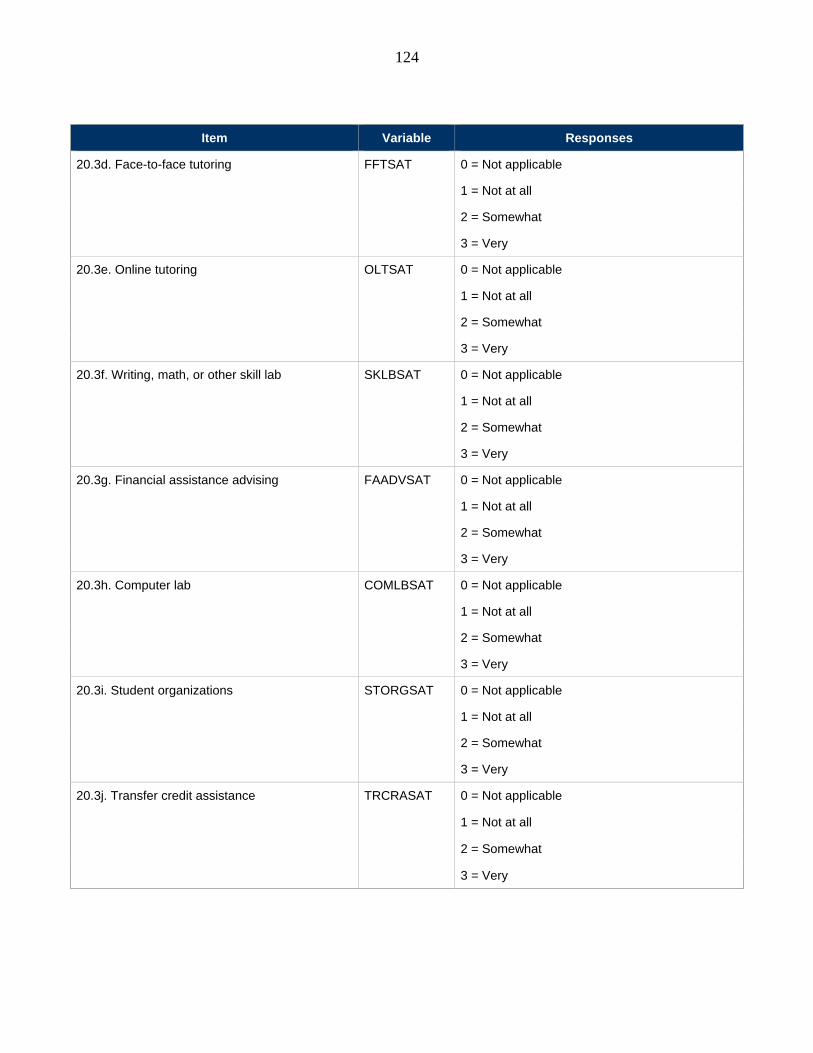
124
Item Variable Responses
20.3d. Face-to-face tutoring FFTSAT 0 = Not applicable
1 = Not at all
2 = Somewhat
3 = Very
20.3e. Online tutoring OLTSAT 0 = Not applicable
1 = Not at all
2 = Somewhat
3 = Very
20.3f. Writing, math, or other skill lab SKLBSAT 0 = Not applicable
1 = Not at all
2 = Somewhat
3 = Very
20.3g. Financial assistance advising FAADVSAT 0 = Not applicable
1 = Not at all
2 = Somewhat
3 = Very
20.3h. Computer lab COMLBSAT 0 = Not applicable
1 = Not at all
2 = Somewhat
3 = Very
20.3i. Student organizations STORGSAT 0 = Not applicable
1 = Not at all
2 = Somewhat
3 = Very
20.3j. Transfer credit assistance TRCRASAT 0 = Not applicable
1 = Not at all
2 = Somewhat
3 = Very

125
Item Variable Responses
Item 20.3: Think about your experiences from the time of your decision to attend this college through the end of the first three weeks of your first semester/quarter. How satisfied were you with the following services?
20.3k. Services to students with disabilities DISVSAT 0 = Not applicable
1 = Not at all
2 = Somewhat
3 = Very
Item 21: Think about your experiences from the time of your decision to attend this college through the end of the first three weeks of your first semester/quarter. Within a class, or through another experience at this college:
21a. I learned to improve my study skills (listening, note taking, highlighting readings, working with others, etc.)
LNDSTUDY 1 = Strongly disagree
2 = Disagree
3 = Neutral
4 = Agree
5 = Strongly agree
21b. I learned to understand my academic strengths and weaknesses
LNDACAWK 1 = Strongly disagree
2 = Disagree
3 = Neutral
4 = Agree
5 = Strongly agree
21c. I learned skills and strategies to improve my test-taking ability
LNDSKLLS 1 = Strongly disagree
2 = Disagree
3 = Neutral
4 = Agree
5 = Strongly agree
Item 22
22. What has been your MAIN source of academic advising (help with academic goal-setting, planning, course recommendations, graduation requirements, etc.)?
PSOURACA 1 = Instructors
2 = College staff (not instructors)
3 = Friends, family, or other students
4 = Computerized degree advisor system
5 = College Web site
6 = Other college materials

126
Item Variable Responses
Item 23
23. Was a specific person assigned to you so you could see him/her each time you needed information or assistance?
ASNPERS 1 = Yes
2 = No
Item 24: During the first three weeks of your first semester/quarter at this college, about how many hours did you spend in a typical 7-day week doing each of the following?
24a. Preparing for class PREPCLAS 1 = None
2 = 1-5 hours
3 = 6-10 hours
4 = 11-20 hours
5 = 21-30 hours
6 = More than 30 hours
24b. Working for pay WORKPAY 1 = None
2 = 1-5 hours
3 = 6-10 hours
4 = 11-20 hours
5 = 21-30 hours
6 = More than 30 hours
Item 25
25. When do you plan to take classes at this college again?
AGAINCL 1 = I will accomplish my goal(s) during this semester/quarter and will not be returning
2 = I have no current plans to return
3 = Within the next 12 months
4 = Uncertain
Item 26: While in high school, did you:
26a. Take math every school year? MATHALLF 0 = Not applicable
1 = Yes
2 = No
26b. Take math during your senior year? MATHSNYR 0 = Not applicable
1 = Yes
2 = No

127
Item Variable Responses
Item 27
27. Would you recommend this college to a friend or family member?
RECOCOLL 1 = Yes
2 = No
Item 28
28. In what range was your overall high school grade average?
HSGRADE 1 = A
2 = A- to B+
3 = B
4 = B- to C+
5 = C
6 = C- or lower
Item 29
29. Your sex SEX 1 = Male
2 = Female
Item 30
30. Mark your age group AGENEW 2 = 18 to 19
3 = 20 to 21
4 = 22 to 24
5 = 25 to 29
6 = 30 to 39
7 = 40 to 49
8 = 50 to 64
9 = 65+
Item 31
31. Are you married? MARRSTAT 1 = Yes
2 = No
Item 32
32. Do you have children who live with you and depend on you for their care?
CHILDREN 1 = Yes
2 = No
Item 33

128
Item Variable Responses
33. Is English your native (first) language? ENGNAT 1 = Yes
2 = No
Item 34
34. Are you an international student or nonresident alien?
INTERNAT 1 = Yes
2 = No
Item 35
35. What is your racial/ethnic identification? DIVERSIT 1 = American Indian or Native American
2 = Asian, Asian American, or Pacific Islander
3 = Native Hawaiian
4 = Black or African American, Non-Hispanic
5 = White, Non-Hispanic
6 = Hispanic, Latino, Spanish
7 = Other
Item 36
36. What is the highest academic certificate or degree you have earned?
DEGREE 1 = None
2 = GED
3 = High school diploma
4 = Vocational/technical certificate
5 = Associate degree
6 = Bachelor's degree
7 = Master's/Doctoral/Professional degree
Item 37: Please indicate whether your goal(s) for attending this college include the following:
37a. To complete a certificate CERTPRGM 1 = Yes
2 = No
37b. To obtain an Associate degree ASSOCDEG 1 = Yes
2 = No
37c. To transfer to a 4-year college or university TR4YR 1 = Yes
2 = No
Item 38: Who in your family has attended at least some college? (Mark all that apply)

129
Item Variable Responses
38a. Mother MOTHED 0 = No response
1 = Response
38b. Father FATHED 0 = No response
1 = Response
Item 38: Who in your family has attended at least some college? (Mark all that apply)
38c. Brother/Sister SIBLINED 0 = No response
1 = Response
38d. Child CHILDED 0 = No response
1 = Response
38e. Spouse/Partner SPOUCED 0 = No response
1 = Response
38f. Legal Guardian LGUARDED 0 = No response
1 = Response
38g. None of the above NONED 0 = No response
1 = Response

130
APPENDIX D: LOGISTIC REGRESSION COEFFICIENTS
Variable
β
Wald
df
p Odds Ratio
High school grade .067 1.529 .21
.216 1.069 Gender (female) -.431 8.222 1 .004** 1.538 Age .079 2.712 1 .100 1.082 Marital Status (no) .228 1.337 1 .241 1.257 Race/Ethnicity (non-white) .624 3.901 6 .048* 1.867 First Generation Student (non 1st) .352 5.022 1 .025* 1.422 At least one developmental class taken (no) -.436 5.723 1 .017* 1.703
Weekly hours worked -.026 .190 1 .663 .974
Advisor Support .175 3.956 1 .047* 1.191
Faculty Support .258 4.234 1 .040* 1.295
College ready – skill set .038 .134 1 .715 1.039
College ready – attitude .178 2.318 1 .128 1.194
College ready – student networking -.129 1.121 1 .290 .879 Constant 1.840 5.979 1 .014* 0.159
p ≤ .05. **p ≤ .005

131
REFERENCES
Ajzen, I. (1991). The theory of planned behavior. Organizational Behavior and Human
Decision Processes, 50(2), 179-211. http://dx.doi:10.1016/0749-5978(91)90020-T
Ajzen, I. & Fishbein, M (1977). Attitude-behavior relations: A theoretical analysis and review
of empirical research. Psychological Bulletin, 84(5), 888-918.
http://dx.doi.org/10.1037/0033-2909.84.5.888
Allen, C. A., & Jones, E. V. (1992). GED Testing Program: The First Fifty Years. Retrieved
from http://files.eric.ed.gov/fulltext/ED351558.pdf
Alexander, A., Karvonen, M., Ulrich, J., Davis, T., & Wade, A. (2012). Community college
faculty competencies. Community College Journal of Research and Practice, 36, 849-
862. http://dx.doi.org/10.1080/10668926.2010.515511
Andrade, H. L., Wang, X., Du, Y., & Akawi, R. L. (2009). Rubric-referenced self-assessment
and self-efficacy for writing. The Journal of Educational Research, 102(4), 287-302.
http://dx.doi.org/10.3200/JOER.102.4.287-302
Angelo, T. A., & Cross, K. P. (1993). Classroom assessment techniques: A handbook for
college teachers. San Francisco, CA: Jossey-Bass.
Aud, S., Hussar, W., Johnson, F., Kena, G., Roth, E., Manning, E., ... & Zhang, J. (2012). The
Condition of Education 2012. NCES 2012-045. National Center for Education
Statistics. Retrieved from http://files.eric.ed.gov/fulltext/ED532315.pdf
Azzam, A. M. (2007). Why students drop out. Educational Leadership, 64(7), 91-93.
Retrieved from
http://eds.a.ebscohost.com.proxy.lib.iastate.edu/ehost/pdfviewer/pdfviewer?sid=446f9e
c4-ba68-41ff-afba-88ca39838d24%40sessionmgr4010&vid=1&hid=4105

132
Bahr, P. R. (2008). Cooling out in the community college: What is the effect of academic
advising on students’ chances of success? Research in Higher Education, 49(8), 704-
732. http://dx.doi.org/10.1007/s11162-008-9100-0
Bailey, A., & Marsh, M. (2010). Transitioning non-traditional students to an undergraduate
Business program. American Journal of Business Education, 3(8).
http://dx.doi.org/10.19030/ajbev3i8.468
Bailey, T. (2009). Challenge and opportunity: Rethinking the role and function of
developmental education in community college. New Directions for Community
Colleges, 2009(145), 11-30. http://dx.doi.org/10.1002/cc.352
Berker, A., & Horn, L. (2004). Work first, study second: Adult undergraduates who combine
employment and postsecondary enrollment. Retrieved from National Center for
Educational Statistics: http://nces.ed.gov/pubs2003/2003167.pdf
Bonk, C. J. (2008, March). YouTube anchors and enders: The use of shared online video
content as a macrocontext for learning. Paper presented at the American Educational
Research Association, New York, NY. Retrieved from
http://www.publicationshare.com/SFX7EED.pdf
Bosworth, B. (2010). Certificates count: An analysis of sub-baccalaureate certificates.
Complete College America. Retrieved from
http://knowledgecenter.completionbydesign.org/sites/default/files/352 CCA2010.pdf
Bradley, C. L., & Renzulli, L. A. (2011). The complexity of non-completion: Being pushed or
pulled to drop out of high school. Social Forces, 90(2), 521-545.
http://dx.doi.org/10.1093/sf/sor003

133
Branigan, C. (2005). Video goes to school, part I: Whether watching or recording, students
find video engaging. Retrieved from http://www.eschoolnews.com/2005/04/01/video-
goes-to-school-part-i/
Braskamp, L., Trautvetter, L. C., & Ward, K. (2008). Putting students first: Promoting lives of
purpose and meaning. About Campus/Wiley InterScience, 26-32. DOI: 10.1002/abc.244
Braxton, J., Doyle, W., Hartley III, H., Hirschy, A., Jones, W., & McLendon, M (2014).
Rethinking college student retention. San Francisco: Jossey-Bass.
Brickman, A., & Braun, L. (1999). Existing models for post-secondary transition
programs: Research findings. Boston: Massachusetts Community College Executive
Office.
Bridgeland, J. M., DiIulio Jr, J. J., & Morison, K. B. (2006). The silent epidemic: Perspectives
of high school dropouts. Civic Enterprises. Retrieved from
http://files.eric.ed.gov/fulltext/ED513444.pdf
Brock, T., Jenkins, D., Ellwein, T., Miller, J., Gooden, S., Martin, K., ... & Pih, M. (2007).
Building a culture of evidence for community college student success: Early progress in
the achieving the dream initiative. MDRC. Retrieved from
http://files.eric.ed.gov/fulltext/ED496977.pdf
Brookfield, S. D. (1983). Adult learners, adult education and the community. Buckingham,
England: Open University Press.
Brown, D. & Associates. (2002). Career choice and development (4th ed.). San Francisco, CA:
Jossey-Bass.
Byrne, B. (2016). Structural equation modeling with AMOS (3rd ed.). New York, NY:
Routledge.

134
Capps, R. (2012). Supporting adult-student persistence in community colleges. Change: The
Magazine of Higher Learning, 44(2), 38-44.
http://dx.doi.org/10.1080/00091383.2012.655218
Carnevale, A. P., & Desrochers, D. M, 2003. Standards for What? The Economic Roots of K–
16 Reform. Princeton, NJ: Educational Testing Service.
Center for Community College Student Engagement. (2007). Starting right: A first look at
engaging students. Austin, TX: The University of Texas at Austin, Program in Higher
Education Leadership.
Center for Community College Student Engagement. (2008). Imagine Success: Engaging
Entering Students (2008 SENSE Field Test Findings). Austin, TX: The University of
Texas at Austin, Community College Leadership Program.
Center for Community College Student Engagement. (2016a). CCSSE 2014 Cohort Overview.
Retrieved from http://www.ccsse.org/survey/reports/2014/overview.cfm#overview
Center for Community College Student Engagement. (2016b). CCSSE Frequently Asked
Questions. Retrieved from http://www.ccsse.org/sense/aboutSENSE/faqs.cfm
Cerna, O., Platania, C., & Fong, K. (2012). Leading by Example: A Case Study of Peer Leader
Programs at Two Achieving the Dream Colleges. MDRC. Retrieved from
http://www.mdrc.org/sites/default/files/full_417.pdf
Chaloux, B. (2008). Overcoming the financial aid barriers for e-learners. Journal of
Asynchronous Learning Networks, 12(2), 55-59. Retrieved from
http://files.eric.ed.gov/fulltext/EJ837477.pdf

135
Chiang, S.C., & Hawley, J. (2013), The role of higher education in their life: Emerging adults
on the crossroad. New Horizons in Adult Education and Human Resource Development,
25: 3–13. doi:10.1002/nha3.20027
Chickering, A. (1981). The modern American college: Responding to the new realities of
diverse students and a changing society. San Francisco: Jossey-Bass.
Christian, T. Y., & Sprinkle, J. E. (2013). College student perceptions and ideals of advising:
An exploratory analysis. College Student Journal, 47(2), 271-291. Retrieved from
http://www.ingentaconnect.com
Clyburn, G. M. (2013). Improving on the American dream: Mathematics pathways to student
success. Change: The Magazine of Higher Learning, 45(5), 15-23. Retrieved from
http://eds.b.ebscohost.com.proxy.lib.iastate.edu/ehost/pdfviewer/pdfviewer?sid=cddc7
4fe-d3c1-4ee0-b57e-3a065ba2b4a8%40sessionmgr101&vid=1&hid=117
Cohen, A. M., Brawer, F. B., & Kisker, C. B. (2014). The American community college (6th
ed.). San Francisco, CA: Jossey-Bass.
Comings, J. (2007). Persistence: Helping adult education students reach their goals. Review of
Adult Learning and Literacy 2007.
http://ncsall.net/fileadmin/resources/ann_rev/comings-02.pdf
Compton, J. I., Cox, E., & Laanan, F. S. (2006). Adult learners in transition. New Directions
for Student Services, 2006(114), 73-80. http://dx.doi.org/10.1002/ss.208
Comrey, A. L, & Lee, H. B. (1992). A first course in factor analysis (2nd. Ed.). Hillsdale, NJ:
Erlbaum. Conley, D. T. (2007). Redefining college readiness. Educational Policy Improvement Center
(NJ1). Retrieved from http://files.eric.ed.gov/fulltext/ED539251.pdf

136
Creswell, J. W. (2014). Research design: Qualitative, quantitative, and mixed methods
approaches (4th ed.). Thousand Oaks, CA: Sage.
Creswell, J. W. (2015). Educational research: Planning, conducting, and evaluating
quantitative and qualitative research (5th ed.). Boston: MA, Pearson.
Cronbach, L. J., & Meehl, P. E. (1955). Construct validity in psychological tests.
Psychological Bulletin, 52(4), 281. Retrieved from
http://dx.doi.org/10.1037/h0040957
Cross, K. P. (1981). Adults as learners: Increasing participation and facilitating learning. San
Francisco, CA: Jossey-Bass.
Cummings, J. A., Bonk, C. J., & Jacobs, F. R. (2002). Twenty-first century college syllabi:
Options for online communication and interactivity. The Internet and Higher
Education, 5(1), 1-19. Retrieved from http://dx.doi.org/10.1016/S1096-
7516(01)00077-X
Darkenwald, G. G., & Merriam, S. B. (1982). Adult education: Foundations of practice. New
York, NY: HarperCollins.
Davison, J. A. (1962, Autumn). Literature and literacy in Ancient Greece. Phoenix, 16(3), 141-
156. http://dx.doi.org/1086811
Dirkx, J. M. (2008). The meaning and role of emotions in adult learning. New Directions for
Adult and Continuing Education, 2008(120), 7-18. http://dx.doi.org/ 10.1002/ace.311
Donaldson, J. F., & Townsend, B.K. (2007). Higher education journals’ discourse about adult
undergraduate students. The Journal of Higher Education 78(1), 27-50.
http://dx.doi.org/10.1353/jhe.2007.0001

137
Drake, J. K. (2011). The role of academic advising in student retention and persistence. About
Campus, 16(3), 8-12. http://dx.doi.org/10.1002/abc.20062
Eberly Center at Carnegie Mellon University. (2016). Make the most of the first day of class
[Teaching Excellence & Educational Innovation website].
http://www.cmu.edu/teaching/designteach/teach/firstday.html
Eberly Center at Carnegie Mellon University. (: Teaching Excellence & Educational
Innovation website. (2016).
http://www.cmu.edu/teaching/designteach/teach/firstday.html
Emerick-Brown, D. (2013). Integrated curricular approaches in reaching adult students. Adult
Learning, 24(3), 128-130. http://dx.doi.org/10.1177/1045159513489114
Engle, J., & Tinto, V. (2008). Moving Beyond Access: College Success for Low-Income,
First-Generation Students. Pell Institute for the Study of Opportunity in Higher
Education. Retrieved from http://files.eric.ed.gov/fulltext/ED504448.pdf
Engstrom, C., & Tinto, V. (2008). Access without support is not opportunity. Change:
The Magazine of Higher Learning, 40(1), 46-50.
http://dx.doi.org/10.3200/CHNG.40.1.46-50
Ezzelle, C., & Setzer, J. C. (2009). Technical manual: 2002 series GED tests. Washington,
DC.: American Council on Education.
Fink, L. D. (2013). Creating significant learning experiences: An integrated approach to
designing college courses. San Francisco, CA: Jossey-Bass.
Fishbein, M., & Ajzen, I. (2010). Predicting and changing behavior: The reasoned action
approach. New York, NY: Taylor & Francis.

138
Foster, M., Strawn, J., & Duke-Benfield, A. E. (2011). Beyond Basic Skills: State Strategies to
Connect Low-Skilled Students to an Employer-Valued Postsecondary Education.
Washington, DC: Center for Law and Social Policy, Inc.(CLASP).
Friedman, H. H., How to destroy a good College: The misuse of the corporate model in
academe (October 28, 2015). Retrieved from http://dx.doi.org/10.2139/ssrn.2682883
Garvey, J. (2011). From GED to College Degree: Creating Pathways to Postsecondary Success
for High School Dropouts. Jobs for the Future. Retrieved from
http://eric.ed.gov/?id=ED519796
GED Testing Service. (2014). The crosswalk: College and career readiness standards for
adult education and the 2014 GED test. Retrieved from
http://www.gedtestingservice.com/uploads/files/652b969a13a0126c909facc5aa166363.
GED Testing Service. (2015). http://www.gedtestingservice.com/educators/history
Goodall, D. (2009, March 5). Community college forum: Bridging the gap from GED to
community college student. Diverse Issues in Higher Education, 26(1), 18. Retrieved
from http://bsc.chadwyck.com.
Gordon, V. R., Habley, W.R., & Grites, T. J. (2008). Academic advising: A comprehensive
handbook (2nd Ed.). San Francisco, CA: Jossey-Bass
Goto, S. T., & Martin, C. (2009). Psychology of success: Overcoming barriers to pursuing
further education. The Journal of Continuing Higher Education, 57(1), 10-21.
http://dx.doi.org/10.1080/07377360902810744

139
Graham, S.W., & Gisi, S. (2000). Adult undergraduate students: What role does college
involvement play? NASPA Journal, 38(1), 99–121.
http://dx.doi.org/10.2202/1949-6605.1122
Grubb, W. N. (2006). Like, what do I do now?”: The dilemmas of guidance counseling. In T.
Bailey & V.S. Morest (Eds.). Defending the community college equity agenda (pp. 195-
222). Baltimore, MD: the Johns Hopkins University Press.
Guglielmino, L. M. (1977). Self-Directed Learning Readiness Scale. Boca Raton: Florida
Atlantic University.
Guison-Dowdy, A., & Patterson, M. B. (2011). Journeys through college: Postsecondary
transitions and outcomes of GED test passers. Retrieved from
https://eric.ed.gov/?id=ED541697
Hand, C., & Payne, E. M. (2008). First-generation college students: A study of Appalachian
student success. Journal of Developmental Education, 32(1), 4. Retrieved from
http://www.jstor.org/stable/427775649
Hardin, C. J. (2008). Adult students in higher education: A portrait of transitions. New
Directions for Higher Education, 2008(144), 49-57.
Harnish, R. J., McElwee, R. O., Slattery, J. M., Frantz, S., Haney, M. R., Shore, C. M., &
Penley, J. (2011, January). Creating the foundation for a warm classroom climate: Best
practices in syllabus tone. Observer, 24. Retrieved from
http://www.psychologicalscience.org/index.php/publications/observer/2011/january-
11/creating-the-foundation-for-a-warm-classroom-climate.html

140
Harrell II, I. & Bower, B. (2011): Student characteristics that predict persistence in community
college online courses. American Journal of Distance Education, 25(3), 178-191.
http://dx.doi.org/10.1080/08923647.2011.590107
Harrington, C. M., & Gabert-Quillen, C. A. (2015). Syllabus length and use of images: An
empirical investigation of student perceptions. Scholarship of Teaching and Learning in
Psychology, 1, 235–243. http://dx.doi.org/10.1037/stl0000040
Hartsell, T., & Yuen, S. C. (2006). Video streaming in online learning. AACE Journal, 14(1),
31-43. Retrieved from http://www.editlib.org/j/AACEJ/v/14/n/1/
Hashim, K. F., Tan, F. B., & Rashid, A. (2015). Adult learners’ intention to adopt mobile
learning: A motivational perspective. British Journal of Educational Technology,
46(2), 381-390. http://dx.doi.org/10.1111/bjet.12148
Heckman, J. J., Humphries, J. E., & Mader, N. S. (2010). The GED (No. w16064). National
Bureau of Economic Research. Retrieved from
http://www.nber.org/papers/w16064.pdf
Heckman, J. J., Humphries, J. E., & Kautz, T. (Eds.). (2014). The myth of achievement tests:
The GED and the role of character in American life. Chicago, IL: University of
Chicago Press.
Helton, W. E., Jr. (2005). General educational development (GED) graduates in their
freshman year in college: A case study at a large mid-western state university (Order
No. 3185597). Available From ProQuest Dissertations & Theses Global. (304995472).
Retrieved from
http://search.proquest.com.proxy.lib.iastate.edu/docview/304995472?accountid=10906

141
Hickman, G. P., Bartholomew, M., Mathwig, J., & Heinrich, R. S. (2008). Differential
developmental pathways of high school dropouts and graduates. The Journal of
Educational Research, 102(1), 3-14. Retrieved from
http://www.jstor.org/stable/27548260
Hoban, D., Lawson, S. R., Mazmanian, P. E., Best, A. M., Seibel, H. R. (2005). The self-
directed learning readiness scale: A factor analysis study. Medical Education, 39(3),
370-379. http://dx.doi.org/10.1111/j.1354-2929.2005.02140x
Hooper, D., Coughlan, J. & Mullen, M.R. (2008). Structural equation modeling: Guidelines for
determining fit. Electronic Journal of Business Research Methods, 6(1), 53-59.
Retrieved from
http://arrow.dit.ie/cgi/viewcontent.cgi?article=1001&context=buschmanart&sei-
redir=1&referer=http%3A%2F%2Fscholar.google.com%2Fscholar%3Fhl%3Den%26q
%3Dhooper%2Bcoughlan%2Bmullen%2B2008%26as_sdt%3D1%252C16%26as_sdtp
%3D%26oq%3Dhooper%2Bcoug#search=%22hooper%20coughlan%20mullen%2020
08%22
Hosmer Jr, D. W., & Lemeshow, S. (2004). Applied logistic regression (2nd ed.). New York:
John Wiley & Sons:
Houle, C. O., Burr, E. W., Hamilton, T. H., & Yale, J. R. (1947). The Armed Services and
Adult Education. Washington, DC.: American Council on Education.
Hsieh, P., Sullivan, J. R., & Guerra, N. S. (2007). A closer look at college students: Self-
efficacy and goal orientation. Journal of Advanced Academics, 18(3), 454-476.
Retrieved from http://ebscohost.com
Jenkins, D., & Weiss, M. J. (2011). Charting Pathways to Completion for Low-Income
Community College Students. CCRC Working Paper No. 34. Community College

142
Research Center, Columbia University. Retrieved from
http://files.eric.ed.gov/fulltext/ED523767.pdf
Jenkins, D., & Cho, S. W. (2013). Get with the program… and finish it: Building guided
pathways to accelerate student completion. New directions for community colleges,
2013(164), 27-35. http://dx.doi.org/10.1080/07377363.2011.544977
Johnson, E. J., & Morgan, B. L. (2005). Advice on advising: Improving a comprehensive
university's program. Teaching of Psychology, 32(1), 15-18.
http://dx.doi.org/10.1207/s15328023top3201_3
Jones, D., & Kelly, P. (2007). Mounting pressures facing the U.S. workforce and the
increasing need for adult education and literacy. Retrieved from National Commission
on Adult Literacy website: http://www.nationalcommissiononadultliteracy.org/
Jongbloed, B., Enders, J., & Salerno, C. (2008). Higher education and its communities:
Interconnections, interdependencies and a research agenda. Higher education, 56(3),
303-324. http://dx.doi.org/doi:10.1007/s10734-008-9128-2
Kasworm, C. E. (2008). Emotional challenges of adult learners in higher education. New
Directions for Adult and Continuing Education, 2008(120), 27-34.
http://dx.doi.org/10.1002/ace.313
Kegan, R. (1994). In over our heads: The mental demands of modern life. Cambridge, MA:
Harvard University Press.
Kenner, C., & Weinerman, J. (2011). Adult learning theory: Applications to non-traditional
college students. Journal of College Reading and Learning, 41(2), 87-96. Retrieved
from http://files.eric.ed.gov/fulltext/EJ926365.pdf
Knowles, M. S. (1973). The adult learner: A neglected species. Houston, TX: Gulf Publishing.

143
Knowles, M. S. (1978). The adult learner: A neglected species (2nd ed.). Houston, TX: Gulf. Knowles, M. S. (1980). The modern practice of adult education: From pedagogy to andragogy
(revised and updated). Englewood Cliffs, NJ: Cambridge.
Knowles, M. S. (1984). Andragogy in action. San Francisco, CA: Jossey-Bass.
Knowles, M. S., Holton, E. F., & Swanson, R. A. (1998). The adult learner: The definitive
classic in adult education and human resource development (5th ed.). Houston, TX:
Gulf Publishing.
Knowles, M. S., Holton III, E. F., & Swanson, R. A. (2015). The adult learner: The definitive
classic in education and human resource development (8th ed.). New York, NY:
Routledge.
Komarraju, M., Musulkin, S., & Bhattacharya, G. (2010). Role of student–faculty interactions
in developing college students' academic self-concept, motivation, and achievement.
Journal of College Student Development, 51(3), 332-342.
https://doi.org/10.1353/csd.0.0137
Krathwohl, D. R. (2002). A revision of Bloom’s taxonomy: An overview. Theory into
Practice, 41(4), 212-218. http://dx.doi.org/10.1207/s15430421tip4104_2
Kuh, G. D., Kinzie, J., Buckley, J. A., Bridges, B. K., & Hayek, J. C. (2006, July). What
matters to student success: A review of the literature. Retrieved from
http://nces.ed.gov/npec/papers.asp
Kuh, G. D., Kinzie, J., Buckley, J. A., Bridges, B. K., & Hayek, J. C. (2007). Piecing together
the student success puzzle: Research, propositions, and recommendations (ASHE
Higher Education Report 32). http://dx.doi.org/10.1002/aehe.3205/epdf

144
Kutner, M., Greenberg, E., Jin, Y., Boyle, B., Hsu, Y., & Dunleavy, E. (2007). Literacy in
everyday life: Results from the 2003 national assessment of adult literacy. NCES (2007-
490). Retrieved from http://eric.ed.gov/?id=ED495996
Kyllonen, P., Lipnevich, A., Burrus, J., & Roberts, R. (2014). Personality, motivation, and
college readiness: A prospectus for assessment and development (ETS Research
Report 14-06). http://dx.doi.org/10.1002/ets2.12004
Lattuca, L. R., & Stark, J. S. (2009). Shaping the college curriculum: Academic plans in
context (2nd ed.). San Francisco, CA: Jossey-Bass.
Lau, L. K. (2003). Institutional factors affecting student retention. Education, 124(1), 126-136.
Retrieved from http://ebscohost.com
Le, H., Casillas, A., Robbins, S., & Langley, R. (2005). Motivational and skills, and self-
management predictors of college outcomes: Constructing the student readiness
inventory. Educational and Psychological Measurement, 65(3), 482-508.
http://dx.doi.org/10.1177/0013164404272493
Leech, N. L., Barrett, K. C., & Morgan, G. A. (2015). IBM SPSS for intermediate statistics:
Use and interpretation (5th ed.). New York, NY: Routledge.
Long, H., & Agyekum, S. (1983). Guglielmino's Self-Directed Learning Readiness Scale: A
Validation Study. Higher Education, 12(1), 77-87. Retrieved from
http://www.jstor.org/stable/3446193
Long, A., & Mullin, C. M. (2014). America's forgotten student population: Creating a path to
college success for GED completers. Sterling, VA: Stylus.
Lott, D., & O’Dell, J. (2014). GED completer’ perceptions of college readiness and social
capital: Linking adult literacy to a greater quality of life. Journal of Research &

145
Practice for Adult Literacy, Secondary & Basic Education, 3(1), 21-34. Retrieved
from http://ebscohost.com
Lundberg, C. A., McIntire, D. D., & Creasman, C. T. (2008). Sources of social support and
self-efficacy for adult students. Journal of College Counseling, 11(1), 58-73. Retrieved
from
http://eds.b.ebscohost.com.proxy.lib.iastate.edu/ehost/pdfviewer/pdfviewer?sid=d6771
4e4-6e70-4e4e-98c9-379d4d0127d9%40sessionmgr120&vid=1&hid=117
Malkus, N., & Sen, A. (2011). Characteristics of GED Recipients in High School: 2002-06.
Issue Brief. NCES 2012-025. National Center for Education Statistics. Retrieved from
http://files.eric.ed.gov/fulltext/ED526222.pdf
Marschall, S., & Davis, C. (2012). A conceptual framework for teaching critical reading to
adult college students. Adult learning, 23(2), 63-68.
http://dx.doi:10.1177/1045159512444265
McClenney, K., Marti, C. N., & Adkins, C. (2012). Student engagement and student outcomes:
key findings from "CCSSE" validation research. Community College Survey of Student
Engagement. http://files.eric.ed.gov/fulltext/ED529076.pdf
McClenney, K., Marti, C. N., & Adkins, C. (2007). Student engagement and student
outcomes: Key findings from CCSSE validation research. Community College Survey
of Student Engagement. Retrieved from
http://www.ccsse.org/aboutsurvey/docs/CCSSE%20Validation%20Summary.pdf
Merriam, S. B. (2001). Andragogy and self‐directed learning: Pillars of adult learning theory.
New directions for adult and continuing education, 2001(89), 3-14.
http://dx.doi:10.1002/ace.3

146
Mertler, C. A., & Vannatta, R. A. (2013). Advanced and multivariate statistical methods:
Practical application and interpretation (5th ed.). Glendale, CA: Pyrczak.
Morgan, G. A., Leech, N. L., Gloeckner, G. W., & Barrett, K. C. (2013). IBM SPSS for
introductory statistics: Use and interpretation (5th ed.). New York, NY: Routledge.
Musgrave, S. (2014). America's forgotten student population: Creating a path to college
success for GED Completers (pp. ix-x). In A. C. Long, & C. M. Mullin (Eds.). Sterling,
VA: Stylus.
National Association of Colleges and Employers. (2011). Job Outlook 2012. Retrieved from
www.naceweb.org
National Center for Educational Statistics. (2013). Enrollment in postsecondary degree-
granting institutions: Enrollment by selected characteristics and control of institution
(NCES 2013-008). Retrieved from
http://nces.ed.gov/programs/projections/projections2021/sec5c.asp
Nichols, M. (2010). Student perceptions of support services and the influence of targeted
interventions on retention in distance education. Distance Education, 31(1), 93-113.
O'Banion, T. (2013). Picking the low-hanging fruit. Community College Week, 25(17), 4-5.
http://eds.a.ebscohost.com.proxy.lib.iastate.edu/ehost/pdfviewer/pdfviewer?sid=b6d425
19-5c2b-442e-a48e-149bb0ef8001%40sessionmgr120&vid=1&hid=120
O’Donnell, V. L., & Tobbell, J. (2007). The transition of adult students to higher education:
Legitimate peripheral participation in community of practice? Adult Education
Quarterly, 57(4), 312-328. http://dx.doi.org/10.1177/0741713607302686
O’Keeffe, P. (2013). A sense of belonging: Improving student retention. College Student
Journal, 47(4), 605-613.

147
Oreopoulos, P. (2007). Do dropouts drop out too soon? Wealth, health and happiness from
compulsory schooling. Journal of public Economics, 91(11), 2213-2229.
http://dx.doi.org/10.1016/j.jpubeco.2007.02.002
Pan, G., Sen, S., Starrett, D. A., Bonk, C. J., Rodgers, M. L., Tikoo, M., & Powell, D. V.
(2012). Instructor-made videos as a learner scaffolding tool. Journal of Online
Learning and Teaching, 8(4). Retrieved from http://jolt.merlot.org
Panadero, E., Tapia, J. A., & Huertas, J. A. (2012). Rubrics and self-assessment scripts effects
on self-regulation, learning and self-efficacy in secondary education. Learning and
individual differences, 22(6), 806-813.
http://dx.doi.org.proxy.lib.iastate.edu/10.1016/j.lindif.2012.04.007
Park, J. H. & Choi, H. J. (2009). Factors influencing adult learners' decision to drop out or
persist in online learning. Educational Technology & Society, 12(4), 207–217.
Park, E. L., & Choi, B. K. (2014). Transformation of classroom spaces: Traditional versus
active learning classroom in colleges. Higher Education, 68(5), 749-771.
http://dx.doi.org/10.1007/s10734-014-9742-0
Pascarella, E. T., & Terezini, P. T. (1977). Patterns of student-faculty informal interaction
beyond the classroom and voluntary freshman attrition. The Journal of Higher
Education, 48(5), 540-552. http://dx.doi.org/10.2307/1981596
Patterson, M. B. (2014). America’s untapped resource. In A. Long, & C. Mullin (Eds.),
America’s forgotten student population: Creating a path to college success for GED
completers (pp. 12-34). Sterling, VA: Stylus Publishing.
Patterson, M. B., Zhang, J., Song, W., & Guison-Dowdy, A. (2010). Crossing the bridge:
GED credentials and postsecondary educational outcomes.

148
http://files.eric.ed.gov/fulltext/ED509888.pdfhttp://www.gedtestingservice.com/upload
s/files/e28d9ff32e78d2de273b67c09a03d48d.pdf
Peterfreund, A. R., Rath, K. A., Xenos, S. P., & Bayliss, F. (2008). The impact of supplemental
instruction on students in STEM courses: Results from San Francisco State University.
Journal of College Student Retention: Research, Theory & Practice, 9(4), 487-503.
Retrieved from http://www.sagefoxgroup.com/_articles/Impact_of_SI_STEM_2008.pdf
Prince, D., & Jenkins, D. (2005). Building pathways to success for low-skill adult students:
Lessons for community college policy and practice from a statewide longitudinal
tracking study. Community College Research Center. Retrieved from
http://ccrc.tc.columbia.edu/media/k2/attachments/pathways-success-low-skill-adult.pdf
Quinn, L. M. (2002). An institutional history of the GED. Retrieved from
http://www4.uwm.edu/eti/reprints/GEDHistory.pdf
Rachal, J. R., & Bingham, M. J. (2004). The adolescentizing of the GED. Adult Basic
Education, 14(1), 32. Retrieved from
http://content.ebscohost.com/ContentServer.asp?T=P&P=AN&K=13020493&S=R&D
=voh&EbscoContent=dGJyMNHr7ESep7A4xNvgOLCmr0%2Bep65Ssau4Ta%2BWx
WXS&ContentCustomer=dGJyMPGutk%2Bzp7FOuePfgeyx44Dt6fIA
Reder, S. (2007). Adult Education and Postsecondary Success. Policy Brief. National
Commission on Adult Literacy (NJ1). Retrieved from http://eric.ed.gov/?id=ED506591
Reynolds-Keefer, L. (2010). Rubric-referenced assessment in teacher preparation: An
opportunity to learn by using. Practical Assessment, Research & Evaluation, 15(8), 1-
9. Retrieved from http://pareonline.net/getvn.asp?v=15&n=8

149
Robbins, R. (2012). Everything you have always wanted to know about academic advising
(well, almost). Journal of College Student Psychotherapy, 26(3), 216-226.
doi:10.1080/87568225.2012.685855
Rocca, K. A. (2010). Student participation in the classroom: An extended multidisciplinary
literature review. Communication Education, 59(2), 185-213. http://dx.doi.org/
10.1080/03634520903505936
Rose, A. D. (1991). End or means: An overview of the history of the adult education act.
Retrieved from http://files.eric.ed.gov/fulltext/ED341875.pdf
Ruffalo Noel-Levitz. (2016). 2015-16 national student satisfaction and priorities report, Cedar
Rapids, IA: Ruffalo Noel Levitz
Russell, S. S. (2006). An overview of adult learning processes. Urologic Nursing, 26(5), 349-
352, 370. Retrieved from http://ebscohost.com
Ryan, C. L., & Bauman, K. (2016). Educational attainment in the United States: 2015 (P20-
578). Retrieved from United States Census Bureau website:
http://www.census.gov/content/dam/Census/library/publications/2016/demo/p20-
578.pdf
Ryan, R. M., & Deci, E. L. (2000). Intrinsic and extrinsic motivations: Classic definitions and
new directions. Contemporary Educational Psychology, 25, 54-67.
http://dx.doi.org/10.1006/ceps.1999.1020
Ryder, A. J. & Hagedorn, L. S. (2012), GED and other noncredit courses: The other side of the
community college. New Directions for Institutional Research, 2012: 21–31.
doi:10.1002/ir.20004

150
Sandlin, J. A., Wright, R., & Clark, C. (2013). Reexamining theories of adult learning
and adult development through the lenses of public pedagogy. Adult Education
Quarterly, 63(1), 3-23. http://dx.doi.org/10.1177/0741713611415836
Schnee, E. (2008). “In the real world no one drops their standards for you”: Academic tigor in
a college worker education program. Equity & Excellence in Education, 41(1), 62-80.
http://dx.doi.org/10.1080/10665680701764502
Showalter, D. A., Wollett, C., & Reynolds, S. (2014). Teaching a high-level contextualized
mathematics curriculum to adult basic learners. Journal of Research and Practice for
Adult Literacy, Secondary, and Basic Education, 3(2), 21-34. Retrieved from
https://static1.squarespace.com/static/55a158b4e4b0796a90f7c371/t/57996b32e6f2e17
cc7258775/1469672280060/COABE+Journal+Summer+2014.pdf
Slattery, J. M., & Carlson, J. F. (2005). Preparing an effective syllabus: Current best practices.
College Teaching, 53, 159–164. http://dx.doi.org/10.3200/CTCH.53.4.159-164
Smith, P. J., Murphy, K. L., & Mahoney, S. E. (2003). Towards identifying factors underlying
readiness for online learning: An exploratory study. Distance Education, 24(1), 57-67.
http://dx.doi.org/10.1080/0158791032000066525
Song, W., & Hsu, Y. C. (2008). Economic and noneconomic outcomes for GED credential
recipients. (GED Testing Service [TM] Research Studies, 2008-2). GED Testing Service.
Retrieved from http://files.eric.ed.gov/fulltext/ED510064.pdf
Stephens, C. (2010). The potential barriers to adult GED transition. Online Journal for
Workforce Education and Development, 4(2), 5. Retrieved from
http://opensiuc.lib.siu.edu/cgi/viewcontent.cgi?article=1006&context=ojwed

151
Stephens, N. M., Hamedani, M. G., & Destin, M. (2014). Closing the social-class achievement
gap: A difference-education intervention improves first-generation students’ academic
performance and all students’ college transition. Psychological Science, 25(41), 943-
953. http://dx.doi.org/ 10.1177/0956797613518349
Stes, A., Gijbels, D., & Van Petegem, P. (2008). Student-focused approaches to teaching in
relation to context and teacher characteristics. Higher Education, 55(3), 255-267.
http://dx.doi.org/10.1007/s10734-007-9053-9
Sutherland, P., & Crowther, J. (Eds.). (2008). Lifelong learning: Concepts and contexts. New
York, NY: Routledge.
Tabachnick, B. G., & Fidell, L. S. (2013). Using multivariate statistics (6th ed.). Boston, MA:
Pearson Education.
Tate, P., Klein-Collins, R., & Steinberg, K. (2011). Lifelong learning in the U.S.A.: A focus
on innovation and efficiency for the 21st century learner. International Journal of
Continuing Education and Lifelong Learning, 4(1), 1-23.
Terrell, P. S. (1990). Adapting institutions of higher education to serve adult students’ needs.
NASPA journal, 27(3), 241-247. http://dx.doi.org/10.1080/00220973.1990.11072162
The White House. (2009, July 14). Remarks by the President on the American graduation
initiative in Warren, MI [Press release]. Retrieved from
https://www.whitehouse.gov/the-press-office/remarks-president-american-graduation-
initiative-warren-mi
Thompson, L. R., & Prieto, L. C. (2013). Improving retention among college students:
Investigating the utilization of virtualized advising. Academy of Education Leadership
Journal, 17(4), 13-26. Retrieved from http://eds.b.ebscohost.com

152
Tokpah, C. L., & Padak, N. (2003). Academic challenges. Adult Learning, 14(3), 8.
http://dx.doi: 10.1177/104515950301400303
Trabant, T.D. (2006). Advising syllabus 101. Retrieved from NACADA Clearinghouse of
Academic Advising Resources website:
http://www.nacada.ksu.edu/Resources/Clearinghouse/View-Articles/Creating-an-
Advising-Syllabus.aspx
Tyler, J. H. (2005). The general educational development (GED) credential: History, current
research, and directions for policy and practice. Review of Adult Learning and Literacy,
5, 45-84. Retrieved from
http://www.ncsall.net/fileadmin/resources/ann_rev/rall_v5_ch3.pdf
United States Department of Education. (2006). A test of leadership: Charting the future of
U.S. higher education. Washington, D.C.: U.S. Department of Education
United States - Department of Education, National Institute of Literacy. (2013). Illiteracy
Statistics. Washington, DC: U.S. Department of Education, National Institute of
Literacy.
Urbina, S. (2014). Essentials of psychological testing (2nd ed.). Hoboken, NJ: Wiley and Sons.
Urdan, T. C. (2010). Statistics in plain English (3rd ed.). New York, NY: Routledge.
Veltri, S., Banning, J. H., & Davies, T. G. (2006). The community college classroom
environment: Student perceptions. College Student Journal, 40(3), 517-527. Retrieved
from http://www.projectinnovation.com/college-student-journal.html
Vianden, J., & Barlow, P. J. (2015) Strengthen the bond: Relationships between academic
advising quality and undergraduate student loyalty. NACADA Journal, 40(2), 15-27.
http://dx.doi.org/10.12930/NACADA-15-026

153
Wachen, J., Jenkins, D., Belfield, C., & Van Noy, M. (2012). Contextualized college transition
strategies for adult basic skills students: Learning from Washington State's I-BEST
program Model. Community College Research Center, Columbia University. Retrieved
from http://files.eric.ed.gov/fulltext/ED538999.pdf
Wade, J. D. (2011). A portrait of an effective GED teacher: A qualitative study (Doctoral
dissertation, New Mexico State University). Retrieved from
http://gradworks.umi.com/35/34/3534141.html
Walvoord, B. E., & Johnson Anderson, V. (2011). Effective grading: A tool for learning and
assessment in college (2nd Ed.). San Francisco, CA: Jossey-Bass.
Weimer, M. (2002). Learner-centered teaching: Five key changes to practice. San Francisco,
CA: Jossey-Bass.
Wigfield, A., & Cambria, J. (2010). Students’ achievement values, goal orientations, and
interest: Definitions, development, and relations to achievement outcomes.
Developmental Review, 30(2010), 1-35.
http://dx.doi.org.proxy.lib.iastate.edu/10.1016/j.dr.2009.12.001
Wirth, R. M., & Padilla, R. V. (2008). College student success: A qualitative modeling
approach. Community College Journal of Research and Practice, 32, 688-711.
http://dx.doi.org/10.1080/10668920701380942
Wodlinger, M. (2007). Adult education: Understanding the adult learner. Maitland, FL:
Xulon Press.
Wojecki, A. (2007). ‘What's identity got to do with it, anyway?’ Constructing adult learner
identities in the workplace. Studies in the Education of Adults, 39(2), 168-182.
http://dx.doi.org/ 10.1080/02660830.2007.11661547

154
Wyatt, L. (2011). Nontraditional student engagement: Increasing adult student success and
retention. The Journal of Continuing Higher Education, 59(1), 10-20.
Young-Jones, A. D., Burt, T. D., Dixon, S., & Hawthorne, M. J. (2013). Academic advising:
Does it really impact student success? Quality Assurance in Education, 21(1), 7-19.
http://dx.doi.org/10.1108/09684881311293034
Zafft, C. K. (2008). Bridging the great divide: Approaches that help adults navigate from adult
education to college. Adult Learning, 19, 6-11.
http://dx.doi.org/10.1177/104515950801900101
Zhang, J., Han, M. Y., & Patterson, M. B. (2009). Young GED examinees and their
performance on the GED tests. GED Testing Service Research Studies, 2009-1. GED
Testing Service. Retrieved from http://files.eric.ed.gov/fulltext/ED510062.pdf
Zhang, J., Guison-Dowdy, A., Patterson, M. B., & Song, W. (2011). Crossing the bridge: GED
credentials and postsecondary education outcomes, Year 2 Report. GED Testing
Service. Retrieved from
http://www.gedtestingservice.com/uploads/files/5851d29b2a2c4f6820fa77d0438bf3df.
2MB)
Zinth, J. (2015). GED, HiSET and TASC: A Comparison of High School Equivalency
Assessments. ECS Education Trends. Education Commission of the States. Retrieved
from http://files.eric.ed.gov/fulltext/ED558072.pdf
![Building Institutional Learning Outcomes Readiness › overview › ... · Faculty Retreat Spring. 5 Readiness on the ground: ... Result of Gen Ed Reflection Process: 1] Confirmation](https://img.pdfslide.us/doc/110x75/5f266be306c7df1d533c6cc6/building-institutional-learning-outcomes-readiness-a-overview-a-faculty.jpg)