Embed Size (px)
Citation preview

University of Arkansas, FayettevilleScholarWorks@UARK
Civil Engineering Undergraduate Honors Theses Civil Engineering
5-2019
The Influence of Citric Acid on Setting Time andTemperature Behavior of Calcium Sulfoaluminate-Belite CementEdgar Soriano
Follow this and additional works at: https://scholarworks.uark.edu/cveguht
Part of the Civil Engineering Commons, and the Structural Engineering Commons
This Thesis is brought to you for free and open access by the Civil Engineering at ScholarWorks@UARK. It has been accepted for inclusion in CivilEngineering Undergraduate Honors Theses by an authorized administrator of ScholarWorks@UARK. For more information, please [email protected].
Recommended CitationSoriano, Edgar, "The Influence of Citric Acid on Setting Time and Temperature Behavior of Calcium Sulfoaluminate-Belite Cement"(2019). Civil Engineering Undergraduate Honors Theses. 50.https://scholarworks.uark.edu/cveguht/50

University of Arkansas
College of Engineering
Department of Civil Engineering
Undergraduate Honors Thesis
The Influence of Citric Acid on Setting Time and Temperature Behavior
Of Calcium Sulfoaluminate-Belite Cement
by
Edgar O. Soriano S.
Advisor:
Dr. Cameron Murray
3-25-2019
The Influence of Citric Acid on Setting Time and Temperature Behavior of Calcium Sulfoaluminate-Belite Cement
2
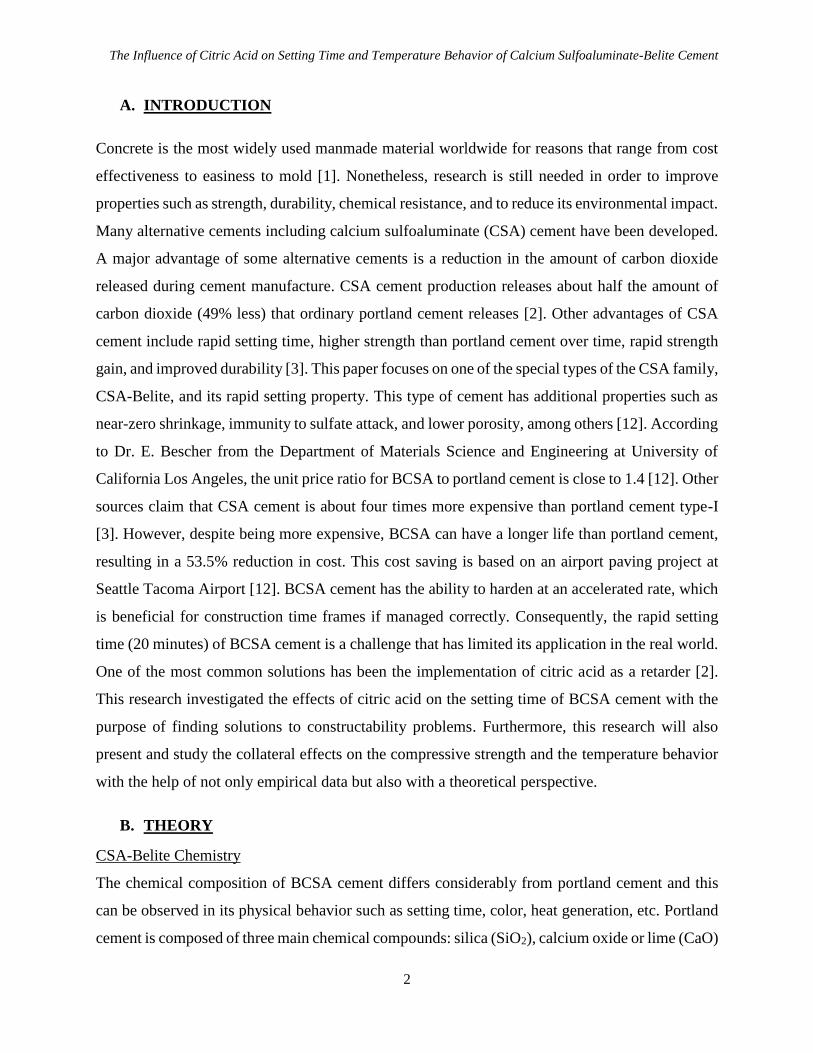
A. INTRODUCTION
Concrete is the most widely used manmade material worldwide for reasons that range from cost
effectiveness to easiness to mold [1]. Nonetheless, research is still needed in order to improve
properties such as strength, durability, chemical resistance, and to reduce its environmental impact.
Many alternative cements including calcium sulfoaluminate (CSA) cement have been developed.
A major advantage of some alternative cements is a reduction in the amount of carbon dioxide
released during cement manufacture. CSA cement production releases about half the amount of
carbon dioxide (49% less) that ordinary portland cement releases [2]. Other advantages of CSA
cement include rapid setting time, higher strength than portland cement over time, rapid strength
gain, and improved durability [3]. This paper focuses on one of the special types of the CSA family,
CSA-Belite, and its rapid setting property. This type of cement has additional properties such as
near-zero shrinkage, immunity to sulfate attack, and lower porosity, among others [12]. According
to Dr. E. Bescher from the Department of Materials Science and Engineering at University of
California Los Angeles, the unit price ratio for BCSA to portland cement is close to 1.4 [12]. Other
sources claim that CSA cement is about four times more expensive than portland cement type-I
[3]. However, despite being more expensive, BCSA can have a longer life than portland cement,
resulting in a 53.5% reduction in cost. This cost saving is based on an airport paving project at
Seattle Tacoma Airport [12]. BCSA cement has the ability to harden at an accelerated rate, which
is beneficial for construction time frames if managed correctly. Consequently, the rapid setting
time (20 minutes) of BCSA cement is a challenge that has limited its application in the real world.
One of the most common solutions has been the implementation of citric acid as a retarder [2].
This research investigated the effects of citric acid on the setting time of BCSA cement with the
purpose of finding solutions to constructability problems. Furthermore, this research will also
present and study the collateral effects on the compressive strength and the temperature behavior
with the help of not only empirical data but also with a theoretical perspective.
B. THEORY
CSA-Belite Chemistry
The chemical composition of BCSA cement differs considerably from portland cement and this
can be observed in its physical behavior such as setting time, color, heat generation, etc. Portland
cement is composed of three main chemical compounds: silica (SiO2), calcium oxide or lime (CaO)

The Influence of Citric Acid on Setting Time and Temperature Behavior of Calcium Sulfoaluminate-Belite Cement
3
and alumina (Al2O3) [10]. In general, these compounds are present in the form of other
configurations as shown in Table 1. This table also shows the main products of the cement-water
reaction. Other products such as calcium silicate hydrate (C-S-H) appear in the structure at later
ages [18]. The following table presents the chemical formulae of the components of CSA, BCSA
and type-I portland cement [3],[4],[12]. Type- I portland cement has been included in the table
since it is the most widely used type of cement [10].
Reactants Compound Cement
Chemist
Notation
Percentage by mass (%)
Type I CSA CSA-B
Ye’elimite (CaO)4(Al2O3)3SO4 C4A3S --- 50-60 30
Alite (CaO)3SiO2 C3S 59 --- ---
Belite (CaO)2SiO2 C2S 15 0-20 45
Ferrite (CaO)4(Al2O3)Fe2O3 C4AF 8 5-15 2
Aluminate (CaO)3Al2O3 C3A 12 --- ---
Anhydrite (CaO)SO4 CS 2.9 15-25 15
Main Products
Ettringite (CaO)6Al2O3(SO4)3(H2O)32 C6AS3H32
Monosulfate (CaO)4Al2O3SO4(H2O)12 C4ASH12
Calcium Aluminate Al(OH)3 Al(OH)3
Table 1. Chemical composition of Portland, CSA and Belite-CSA cements [3],[4],[12].
Each one of these compounds contribute in a different way to the hardened properties of concrete.
C3S and C2S are responsible for the hydration rate and gain in strength of portland cement in the
early and late stages respectively. These compounds cause concrete strength gain primarily
through the formation of C-S-H. For CSA, C4A3S is the responsible for the rate of hydration,
expansion, and rapid grain strength of concrete due to the amount of alumina (Al2O3) it contains
[10]. Table 1 shows that BCSA has a much greater amount of alumina than portland cement, which
results in faster strength gain and refractory properties. Another important compound is C3A,
which contributes in the increasing of heat of hydration, but reduces its resistance to sulfate attack
and volumetric shrinkage [10]. In BCSA, rapid formation of ettringite is responsible for the rapid
strength gain and short setting time [3].
The Influence of Citric Acid on Setting Time and Temperature Behavior of Calcium Sulfoaluminate-Belite Cement
4
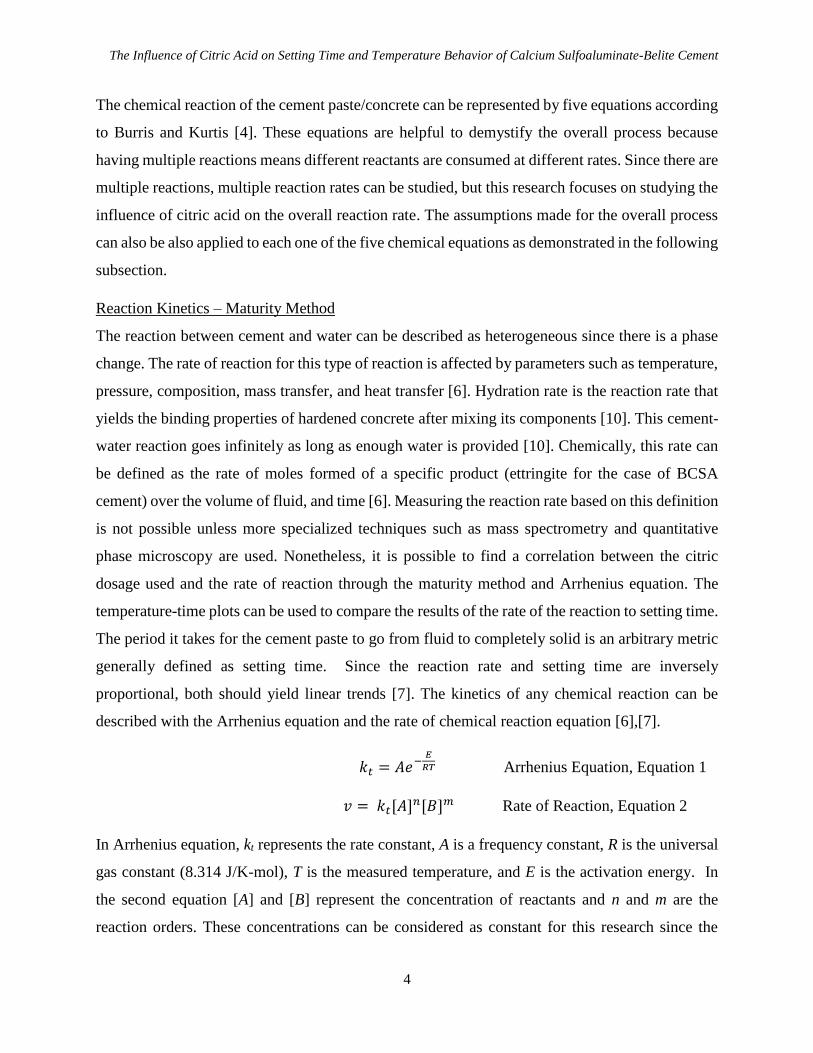
The chemical reaction of the cement paste/concrete can be represented by five equations according
to Burris and Kurtis [4]. These equations are helpful to demystify the overall process because
having multiple reactions means different reactants are consumed at different rates. Since there are
multiple reactions, multiple reaction rates can be studied, but this research focuses on studying the
influence of citric acid on the overall reaction rate. The assumptions made for the overall process
can also be also applied to each one of the five chemical equations as demonstrated in the following
subsection.
Reaction Kinetics – Maturity Method
The reaction between cement and water can be described as heterogeneous since there is a phase
change. The rate of reaction for this type of reaction is affected by parameters such as temperature,
pressure, composition, mass transfer, and heat transfer [6]. Hydration rate is the reaction rate that
yields the binding properties of hardened concrete after mixing its components [10]. This cement-
water reaction goes infinitely as long as enough water is provided [10]. Chemically, this rate can
be defined as the rate of moles formed of a specific product (ettringite for the case of BCSA
cement) over the volume of fluid, and time [6]. Measuring the reaction rate based on this definition
is not possible unless more specialized techniques such as mass spectrometry and quantitative
phase microscopy are used. Nonetheless, it is possible to find a correlation between the citric
dosage used and the rate of reaction through the maturity method and Arrhenius equation. The
temperature-time plots can be used to compare the results of the rate of the reaction to setting time.
The period it takes for the cement paste to go from fluid to completely solid is an arbitrary metric
generally defined as setting time. Since the reaction rate and setting time are inversely
proportional, both should yield linear trends [7]. The kinetics of any chemical reaction can be
described with the Arrhenius equation and the rate of chemical reaction equation [6],[7].
𝑘𝑡 = 𝐴𝑒−𝐸
𝑅𝑇 Arrhenius Equation, Equation 1
𝑣 = 𝑘𝑡[𝐴]𝑛[𝐵]𝑚 Rate of Reaction, Equation 2
In Arrhenius equation, kt represents the rate constant, A is a frequency constant, R is the universal
gas constant (8.314 J/K-mol), T is the measured temperature, and E is the activation energy. In
the second equation [A] and [B] represent the concentration of reactants and n and m are the
reaction orders. These concentrations can be considered as constant for this research since the
The Influence of Citric Acid on Setting Time and Temperature Behavior of Calcium Sulfoaluminate-Belite Cement
5
water-cement ratio remained the same through the experiment. The Arrhenius equation can be
used to establish the relationship between the setting time and rate constant if the ASTM C1074-
17 standard is used. However, an alternative method which relates setting time to age development
will be used. This method is described by Hover et al, and it defines equivalent age as the time it
takes for the specimen to reach a certain level of strength development based on the temperature-
time behavior. The maturity function by Freisleben-Hasen and Pederson is derived from the
Arrhenius equation [7].
𝑡𝑒 = ∑ 𝑒−
𝐸𝑎𝑅
(1
𝑇𝑎−
1
𝑇𝑟𝑒𝑓)∆𝑡𝑡
0 Maturity function, Equation 3
In the maturity equation, Ta is the average temperature over time, Tref is the reference temperature,
and te is the equivalent age at reference temperature. For this case, the development age of each
specimen can be obtained with its corresponding final setting time and temperature. The slope of
ln(kt) vs 1/T is a factor of the activation energy. The variable kt is replaced by the inverse of setting
time since it is unknown and it is proportional to setting time.
Comparison of Vicat and Penetration Resistance Test
The Vicat and Penetration resistance test are methodologies utilized to measure the initial and final
setting time of mortar or cement paste. Initial set time can be defined as the period it takes to stiffen
(or lose its plasticity). Final time is defined as the time it takes the mortar or cement paste to harden,
or reach structural strengths [10]. The Vicat apparatus measures these times as a function of the
displacement of a needle into the mortar. The penetrometer measures these times as a function of
the stress created after pushing a series of needles over a sample. Given that the 1 mm-needle
pushes a weight of 300 g into the paste, the resulting stress is 536 psi (3.7 MPa), which is close to
the stress indicating initial set in the penetration resistance test, 500 psi (3.4 MPa). This means that
both tests should have an acceptable level of agreement in their initial set times [9].

The Influence of Citric Acid on Setting Time and Temperature Behavior of Calcium Sulfoaluminate-Belite Cement
6
Figure 1. Vicat Apparatus (left), and Penetrometer (right).
Source: Adapted from [23]
For the analysis of the temperature behavior, it is necessary to establish a relationship between the
initial and final setting time and the temperature at these points. For this analysis, the setting time
obtained with the penetration resistance test will be used because the temperature was measured
in the sample where the penetration resistance test was performed. In addition, there are some
reasons to believe that the measurements provided by the penetration test are more reliable. First,
the Vicat test does not provide a strong relationship between stiffening and setting time. In a study
performed by Lee and Hover [8], the Vicat test did not provide any measurement of stiffening
before the initial set time of the same paste compared to the penetration resistance test. This study
also concluded that the penetration resistance test is the most accepted method, which provides an
accurate correlation between setting time and the stiffening of the paste [8]. Both tests are based
on the same physical principle of deformation over a surface area. A study of the Vicat apparatus
led by Sleiman et al. showed that different needle masses yielded different results. They concluded

The Influence of Citric Acid on Setting Time and Temperature Behavior of Calcium Sulfoaluminate-Belite Cement
7
that the assumption (quasi-static penetration) on which the Vicat test relies are not suitable during
the thixotropic period, which is approximately the first hour [16]. A quasi-static process is a
process that occurs slowly. Another important aspect to consider is that for the penetration
resistance test, the mass of the batch was greater, and consequently more heat is produced, which
speeds up the reaction. This is more realistic to what happens in the field, and one of the reasons
why the setting time was shorter for the penetration resistance test almost all the time. Despite the
Vicat test’s deficiencies, it is an acceptable technique since the needle shape and frustum depth
produce normalized results that can be used to compare setting times between cements prepared
in the same fashion [16]. Consequently, this research will also consider the results from the Vicat
test since it is widely utilized by cement manufacturers to measure setting times [17].
Effect of Citric Acid on Dynamic Viscosity
The influence of citric acid on the cement paste extends to other properties, not just setting time.
It improved its fluidity, which can be represented through dynamic viscosity. Viscosity can be
defined as the flow resistance of a fluid. The viscosity of a citric acid aqueous solution can be
calculated with one form of the Arrhenius equation [19].
𝜇 = 𝜇0𝑒−𝐸𝑎𝑅𝑇 Viscosity function, Equation 4
µ represents the dynamic viscosity of the solution, µ0 is the dynamic viscosity of water, R the gas
constant, T the absolute temperature, and Ea is the activation energy. For this research, the viscosity
of water and temperature will be treated as constant since the variation of these parameters is small.
The only variable is activation energy, which increases as more citric acid is used in the mix.
Negative catalysts or retarders increase the activation energy, which reduces the reaction rate [20].
Therefore, increasing the activation energy, reduces the viscosity of the mixture according to
equation 3. If the viscosity of the mixture is reduced, the flow resistance is reduced as well, which
results in an improved and more fluid mix. The viscosity of the mixture was influenced by the
dosage of citric acid and not by the water-cement ratio since it was kept constant. Equation 4 shows
that the only factor of water that affects the viscosity of the mixture is the viscosity of the water.

The Influence of Citric Acid on Setting Time and Temperature Behavior of Calcium Sulfoaluminate-Belite Cement
8
C. EXPERIMENTAL PROCEDURE
There are three parameters of BCSA cement being studied in this research: setting time,
compressive strength, and temperature behavior. Therefore, the procedures to measure each one
of these will be described separately. These procedures follow the methods in accordance to the
ASTM standards with some minor modification due to the nature of BCSA cement.
Cement Paste
The cement paste was made in accordance to ASTM C305-14 [13]. First, the water (mixed with
the citric acid retarder) was placed in the mixing bowl before adding the cement so that the citric
acid was well dispersed in the water. The water to cement ratio (w/c) in this experiment was 0.48.
Other specialized studies related to the effect of retarders on CSA cements used w/c values of 0.4
or 0.5 [4],[5]. CSA cements generally requires a higher w/c than portland cement in order to fully
hydrate [3]. The dosage of citric acid measured by number of fluid ounces per 100 lb. cement was
varied: 0, 4.5, 9, 13.5, 18 and 36 (added later in the research). In order to obtain these dosages, 5
lb. powdered citric acid was added to 1 gallon of water to make a solution similar to a typical
concrete admixture. Based on these ratios, the amounts of citric acid were: 0.0%, 0.18%, 0.35%,
0.53%, 0.70% and 1.4% by weight of cement. After adding the cement, the components were left
to absorb for 30 seconds. Then, the laboratory bench mixer was started at low speed for a time
between 30 seconds and 1 minute. After this time, the mixer was paused for about 15 seconds to
scrape the bottom of the mixing bowl to make sure all the components were being mixed
appropriately. Then, the medium speed was set for a time between one to two minutes. This is a
slight deviation from the ASTM C305-14, which is based on a mix of 650 g of cement with a water
to cement ratio determined by ASTM C187-16. These deviations are justified with the fact that the
amount of cement utilized was more (6166.65 g) and the w/c ratio was established to be 0.48 since
it is more common for this type of cement [4]. The amount of cement paste made by batch was
approximately 308 in3 (5047.2 cm3). The mixing water was kept at a temperature within a range
of 73.5 ± 3.5 ℉ (23.0±2.0 ºC). Tests were performed at 21.1º, 23.3º and 25º Celsius specifically
to see the variability of the results based upon water temperature.
Setting Time
The initial and final setting time were determined by means of two methods. The setting times
were determined in accordance to ASTM C403/C403M-16 [15] and ASTM C191-18 [14]. Both

The Influence of Citric Acid on Setting Time and Temperature Behavior of Calcium Sulfoaluminate-Belite Cement
9
methods were performed inside an environmental chamber where the ambient temperature was
kept between 73.5 ± 5.5 ℉ (23.0 ± 3.0º C). Due to high temperatures during the summer, the
ambient temperature in the environmental chamber was higher than the temperature of the range
sometimes. Also, the humidity was kept above 50% as the ASTM standards dictates. It was kept
between 65% and 75%, specifically. The procedure for each methodology will be explained as
follows.
I. Vicat Needle (ASTM C191-18)
Once the cement paste was made, part of it was placed in a non-absorbent conical ring with
an internal volume of approximately 14 in3 (229.4 cm3). The conical ring was placed over
the glass plate, and the cement paste was poured through the smaller diameter of the ring
until the paste surface and the ring border were leveled. The surface was leveled and
smoothed carefully with the help of a rod to avoid adding stress. For the specimen without
retarder, the ring was tapped on the sides to make sure voids are filled with the paste. This
was not necessary when the retarder was used because the mix was more fluid. The mix was
more fluid despite keeping the water-cement reaction constant for reasons explained in the
literature review. Immediately after molding, the specimen was placed in the environmental
chamber for testing. This test was performed with a manual Vicat apparatus, which is
described as Method A in the ASTM standards. The indicator was placed at zero before
releasing the rod and the one-millimeter needle into the paste. The first penetration of the
needle into the paste was done at the center of the specimen, and the subsequent
measurements were done approximately five millimeters away from the previous
penetration. The pattern of these measurements was circular and moving out of the center.
Measurements were performed at least 10 mm away from the border.
Depending on the nature of the specimen, the time between the preparation of the specimen
and first measurement varied. Likewise, the measurements were done at different time
intervals depending on the amount of citric acid used. For example, if no retarder was used,
faster measurements were required to achieve an accurate view of the setting behavior. On
the other hand, if more citric acid was used the measurements were spread out to capture the
range of behavior between mixing and setting. Data points were collected until zero
displacements of the needle or no marks were observed on the cement paste within a period
of 90 seconds. The time at which this happened is the final setting time according to ASTM

The Influence of Citric Acid on Setting Time and Temperature Behavior of Calcium Sulfoaluminate-Belite Cement
10
C191-18. The initial time was determined by linear interpolation of the time at which 25 mm
of displacement is believed to occur. The data of this test were plotted in a set of piecewise
linear functions where the function of interest was the one crossing the 25 mm displacement.
II. Penetration Resistance (C403/C403M-16)
In contrast to the Vicat test which has a criterion based on the displacement of the needle,
the Penetration Resistance test has a criterion based on the stress created when some force is
applied. First, approximately 170 in3 (2785.8 cm3) of cement paste was poured into a cylinder
leaving a gap of one inch from the cylinder’s top edge. The cylinder had a diameter and
height of 6 in. and was made of a non-absorbent plastic material. The surface of the sample
was smoothed with a rod. The same rod was utilized to tap the sides of the container to
improve consolidation. Then, the specimen was placed in the environmental chamber for
testing. This test consists of pushing six needles of decreasing diameters vertically one inch
into the specimen, resulting in six different stresses. The measurements were performed at
least 1/2 in. apart, and 1 in. away from the border. Due to limitations of the specimen surface
and the need to perform additional penetrations these separation distances were less
sometimes. However, if that was the case and the data point was misrepresentative, it was
discarded for calculations purposes.
At least six measurements were performed, conforming to ASTM C403. According to the
standard, the initial setting time occurs when the cement paste has reached 500 psi (3.4 MPa)
in strength, and the final setting time occurs when the penetration strength is 4000 psi (27.6
MPa). The data is presented in two different ways. First, a simple plot of time versus stress
will yield a curved line. Nevertheless, straight lines help to have a better interpretation of the
nature of the experiment. Therefore, the standards give guidance on how to present the data
points in a log-log plot. Despite the two ways to present the data, the results for setting times
should be close in value. It is important to highlight that the required ambient temperature
varies slightly compared to the one required for the Vicat test. Nonetheless, for consistency
the ambient temperature was kept at 73.5 ± 5.5 ℉ (23.0 ± 3.0º C) as previously mentioned.
Compressive Strength and Temperature Behavior
The rest of the cement paste was used to mold 12 2 in. cubes, which were tested ten minutes after
both setting time tests were done then at three hours, one day and seven days. Due to the extremely
fast setting (< 20 minutes) of the specimen when no retarder was used, the setting time samples
The Influence of Citric Acid on Setting Time and Temperature Behavior of Calcium Sulfoaluminate-Belite Cement
11
and the cubes were cast from different batches. This only applied for the specimens with zero citric
acid and water temperatures of 23.3ºC and 25ºC. The cubes were tested in a compression machine
according to ASTM C109 [22].
The temperature change within the cement paste was measured by inserting a type-K thermocouple
into the center of the penetration resistance specimen contained in the 6 in. cylinder. This
thermocouple was coated with epoxy to avoid issues if contacted with water. The temperature was
recorded with an HBM QuantumX data acquisition system at a frequency of 10 Hertz.
D. RESULTS AND ANALYSIS
Setting Time
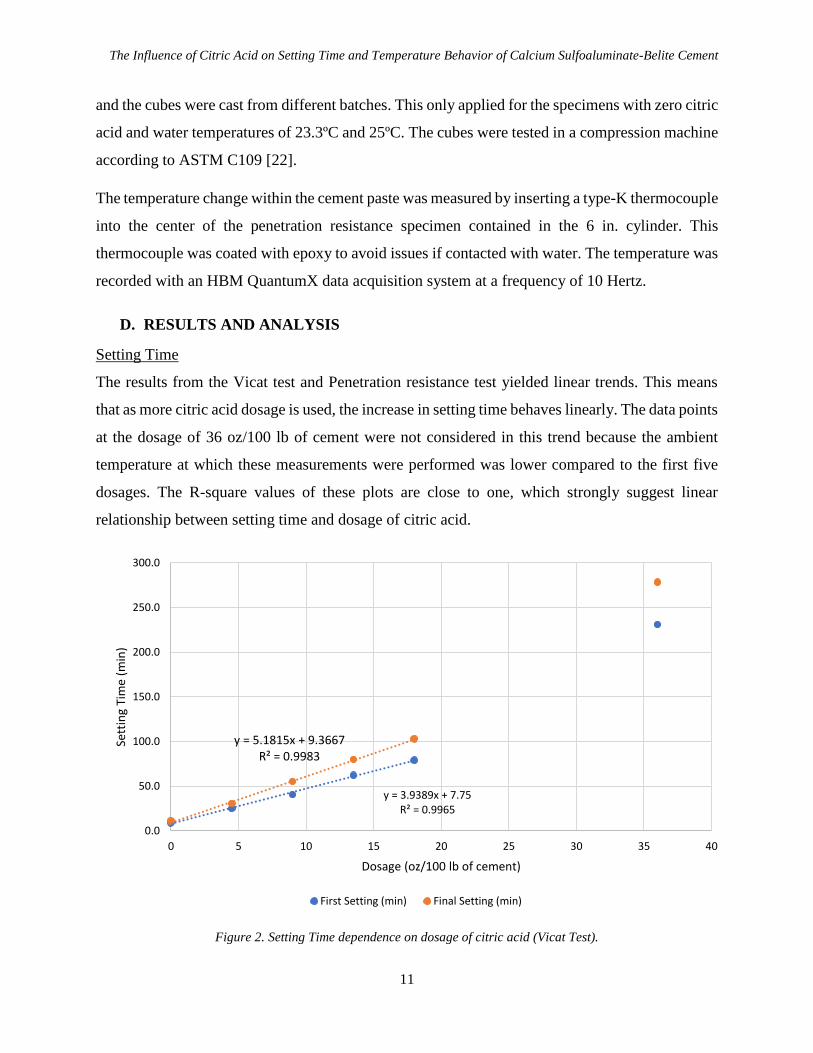
The results from the Vicat test and Penetration resistance test yielded linear trends. This means
that as more citric acid dosage is used, the increase in setting time behaves linearly. The data points
at the dosage of 36 oz/100 lb of cement were not considered in this trend because the ambient
temperature at which these measurements were performed was lower compared to the first five
dosages. The R-square values of these plots are close to one, which strongly suggest linear
relationship between setting time and dosage of citric acid.
Figure 2. Setting Time dependence on dosage of citric acid (Vicat Test).
y = 3.9389x + 7.75R² = 0.9965
y = 5.1815x + 9.3667R² = 0.9983
0.0
50.0
100.0
150.0
200.0
250.0
300.0
0 5 10 15 20 25 30 35 40
Sett
ing
Tim
e (m
in)
Dosage (oz/100 lb of cement)
First Setting (min) Final Setting (min)

The Influence of Citric Acid on Setting Time and Temperature Behavior of Calcium Sulfoaluminate-Belite Cement
12
Figure 3. Setting Time dependence on dosage of citric acid (Penetrometer Test).
The tests performed have different mechanisms and levels of reliability as previously discussed.
However, they both showed that the relationship between setting time and dosage of citric acid is
linear. Moreover, if the slopes of the initial and final setting time trends of the Vicat test results
are compared to their equivalent on the penetrometer test results, it shows that their magnitudes
are close. For both setting time tests, the difference between first and final setting time increases
as the dosage of citric acid increases. For the Vicat test, the differences in time between the initial
and setting time are 2.1, 5.4, 14.8, 17.8 and 23.8 minutes for its corresponding dosage. Therefore,
the linear trend lines diverge as the dosage increases. This divergence is also observed in the
penetrometer test. This divergence is corroborated with the difference of slope or by analyzing the
separation between initial and final times as the dosage increases. The ratio between consecutive
initial and final differences for consecutives dosages can describe the level of divergence. This
ratio starts at 2.6 and finishes at 1.3 for the Vicat Test. For the Penetrometer Test, this ratio starts
at 2 and finishes at 1.4. If this ratio is one, it means that the difference between initial and final
time is constant, and if it is below one, this gap is being reduced and the linear equations converge.
The results show that these ratios are always above one, meaning that the gap always increases,
but at some point it approaches one. The linear trend lines of these ratios can be utilized to
extrapolate the setting times for higher dosages. An extra dosage of 1.4% of citric acid by weight
y = 3.7921x + 8.8247R² = 0.9965
y = 4.4927x + 9.5747R² = 0.9957
0.0
50.0
100.0
150.0
200.0
250.0
0 5 10 15 20 25 30 35 40
Sett
ing
Tim
e (m
in)
Dosage (oz/100 lb of cement)
First Setting (min) Final Setting (min)
The Influence of Citric Acid on Setting Time and Temperature Behavior of Calcium Sulfoaluminate-Belite Cement
13
of cement was tested four months after (December). The results of the 36 oz/100 lb of cement
(1.4%) are shown in the graphs, but they are not considered in these calculations because of the
different ambient temperatures and humidity at which these specimens were tested. Even though
these specimens were tested at temperatures that fall within the allowed range of the ASTM, they
were not included to keep consistent data. Furthermore, setting times of 100 minutes were
measured with 18 fl. oz. of the citric acid solution. These times are more consistent with the setting
time of portland cement, but for most applications higher setting times than this are not needed.
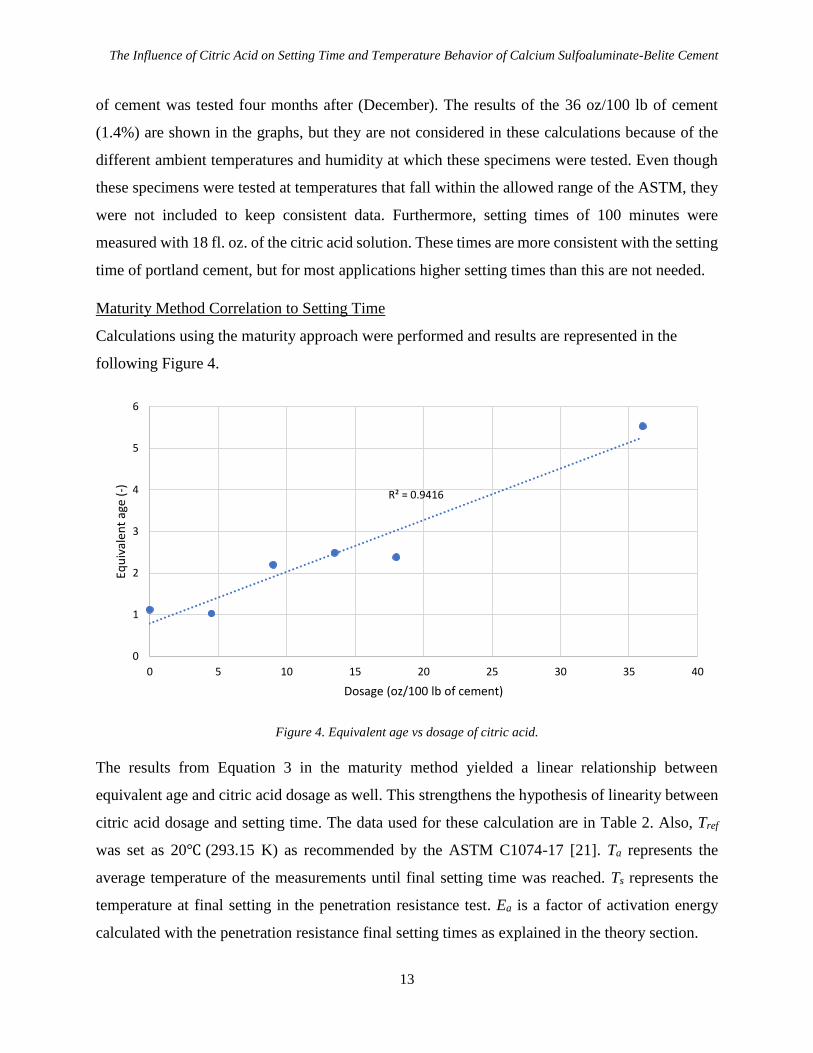
Maturity Method Correlation to Setting Time
Calculations using the maturity approach were performed and results are represented in the
following Figure 4.
Figure 4. Equivalent age vs dosage of citric acid.
The results from Equation 3 in the maturity method yielded a linear relationship between
equivalent age and citric acid dosage as well. This strengthens the hypothesis of linearity between
citric acid dosage and setting time. The data used for these calculation are in Table 2. Also, Tref
was set as 20℃ (293.15 K) as recommended by the ASTM C1074-17 [21]. Ta represents the
average temperature of the measurements until final setting time was reached. Ts represents the
temperature at final setting in the penetration resistance test. Ea is a factor of activation energy
calculated with the penetration resistance final setting times as explained in the theory section.
R² = 0.9416
0
1
2
3
4
5
6
0 5 10 15 20 25 30 35 40
Equ
ival
ent
age
(-)
Dosage (oz/100 lb of cement)
The Influence of Citric Acid on Setting Time and Temperature Behavior of Calcium Sulfoaluminate-Belite Cement
14
Dosage Initial Set
ti (min)
Final Set
tf (min)
t
(min)
t
(min)
ln(1/t) Ta
(K)
1/Ts
(1/K)
Ea
(J/mol)
te (-)
0
10.3 12.0 ti 10.31 -2.333 0.00304 -28255.5 1.12
tf – ti 1.69 -0.526 317.61 0.00298
4.5 24.1 27.2 ti 24.07 -3.180 0.00296 -31989.3 1.03
tf – ti 3.09 -1.128 316.87 0.00289
9 41.8 48.4 ti 41.80 -3.732 0.00302 -16423.9 2.20
tf – ti 6.59 -1.885 314.38 0.00291
13.5 61.8 71.6 ti 61.83 -4.124 0.00302 -14373.6 2.49
tf – ti 9.81 -2.283 314.57 0.00290
18 76.8 90.8 ti 76.75 -4.340 0.00300 -13824.9 2.38
tf – ti 14.10 -2.645 316.56 0.00288
36 182.9 214.1 ti 182.92 -5.209 0.00318 -9260.66 5.53
tf – ti 31.19 -3.439 307.81 0.00299
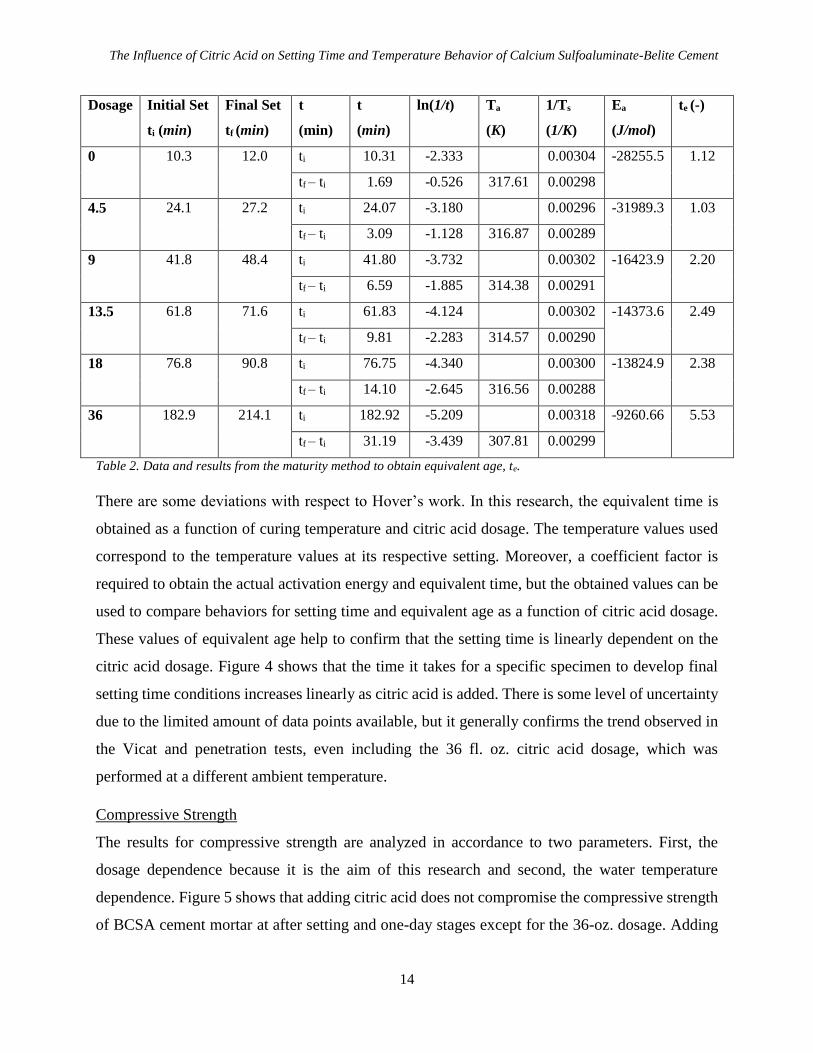
Table 2. Data and results from the maturity method to obtain equivalent age, te.
There are some deviations with respect to Hover’s work. In this research, the equivalent time is
obtained as a function of curing temperature and citric acid dosage. The temperature values used
correspond to the temperature values at its respective setting. Moreover, a coefficient factor is
required to obtain the actual activation energy and equivalent time, but the obtained values can be
used to compare behaviors for setting time and equivalent age as a function of citric acid dosage.
These values of equivalent age help to confirm that the setting time is linearly dependent on the
citric acid dosage. Figure 4 shows that the time it takes for a specific specimen to develop final
setting time conditions increases linearly as citric acid is added. There is some level of uncertainty
due to the limited amount of data points available, but it generally confirms the trend observed in
the Vicat and penetration tests, even including the 36 fl. oz. citric acid dosage, which was
performed at a different ambient temperature.
Compressive Strength
The results for compressive strength are analyzed in accordance to two parameters. First, the
dosage dependence because it is the aim of this research and second, the water temperature
dependence. Figure 5 shows that adding citric acid does not compromise the compressive strength
of BCSA cement mortar at after setting and one-day stages except for the 36-oz. dosage. Adding

The Influence of Citric Acid on Setting Time and Temperature Behavior of Calcium Sulfoaluminate-Belite Cement
15
citric acid to the mix increases the compressive strength slightly at the seven-days stage as it can
be observed for the 36-oz. dosage. Furthermore, Figure 6 shows that there is not a significant
impact of the temperature ranges of the mixing water used in this study on the compressive
strength. Nonetheless, hotter water increases the rate of reaction and reduces the setting time.
Figure 5. Compressive strength results with its corresponding citric acid dosage.
Figure 6. Compressive strength dependence on water temperature.
-2000.0
0.0
2000.0
4000.0
6000.0
8000.0
10000.0
After setting 3 hours 1 day 7 day
Co
mp
ress
ive
Stre
ngt
h (
psi
)
0 oz
4.5 oz
9 oz
13.5 oz
18 oz
36 oz
0.0
1000.0
2000.0
3000.0
4000.0
5000.0
6000.0
7000.0
After Setting 3 hours 1 day 7 day
Co
mp
ress
ive
Stre
ngt
h (
psi
)
21.1 *C
23.3 *C
25 *C
The Influence of Citric Acid on Setting Time and Temperature Behavior of Calcium Sulfoaluminate-Belite Cement
16
Specimens prepared with portland cement type I can exhibit a minimum of 1800 psi (12.4 MPa)
and 2800 psi (19.3 MPa) strength at 3 and 7 days respectively [10]. The specimens made of BCSA
cement presented an average strength of 3557.5 psi (24.5 MPa) and 4967.0 psi (34.2 MPa) for 3
and 7 days. Moreover, concrete made of BCSA cement is expected to have a higher strength since
the strength of concrete depends on the strength of the aggregates and the cement paste.
Fractures were noticed in the compressive strength cubes when no citric acid was used. These
fractures can be attributed to the high temperature gradient. This is explained with more details in
the temperature behavior section. The cubes tested for 1-day and 7-day compressive strength
presented cracks even though they were cured by two different methods. First, they were placed
in a water tank 60-90 minutes after the final setting time for curing, and they presented cracks at
the moment they were tested. These specimens could not be tested for compressive strength.
Therefore, the mortar specimens were cured in air alternatively, and even though they still
presented smaller fractures, they were able to hold load, so they were tested. The other specimens
containing citric acid did not present fractures. This may be a limitation of testing a pure cement
paste, since the heat generation is very high when no aggregate is used and no citric acid is present.
Temperature Behavior
This section focuses on how the increase in citric acid dosage affects the temperature behavior of
the cement paste during and after setting. The temperature behavior will be studied by identifying
parameters such as point of maximum temperature, point of maximum change of temperature and
the area under the curve of the temperature-time plot (related to the heat transfer) for each one of
the different dosages. To measure heat more accurately, other parameters such as mass transfer
and heat capacity need to be considered. Additionally, this section will study the special case of
no citric acid since cracks were observed after curing. The following plots represent the
measurements of the temperature versus time during the cement reaction up to a few hours after
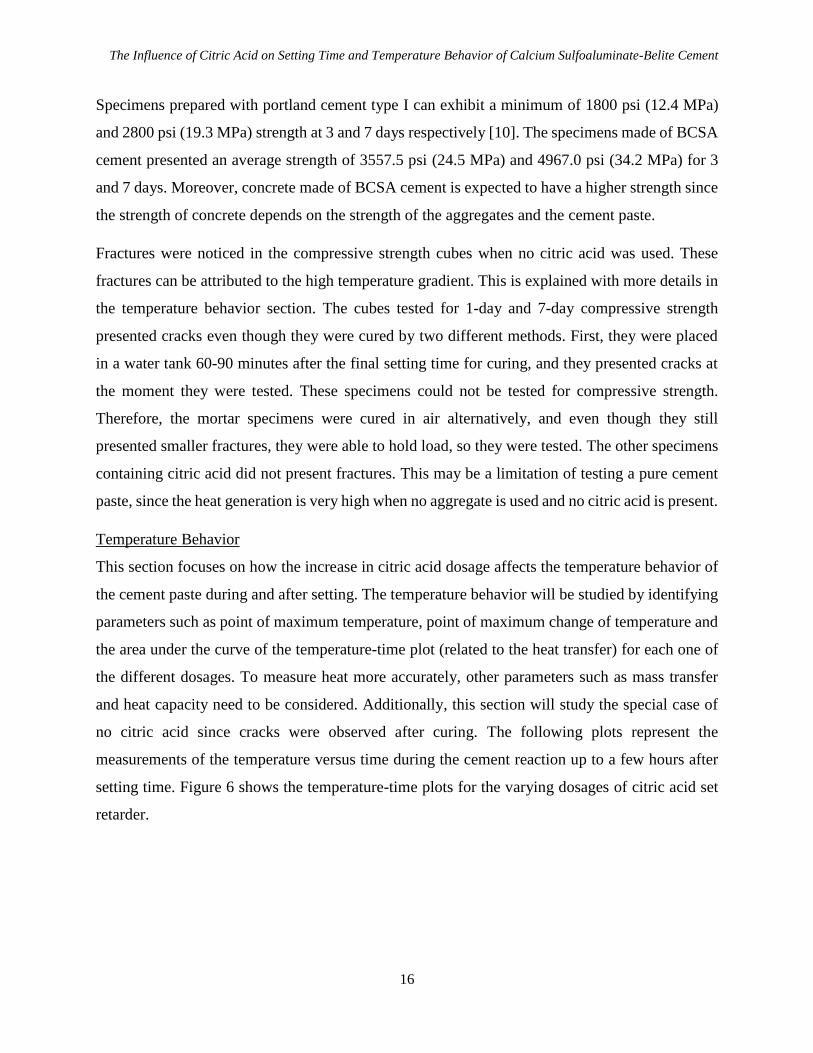
setting time. Figure 6 shows the temperature-time plots for the varying dosages of citric acid set
retarder.
The Influence of Citric Acid on Setting Time and Temperature Behavior of Calcium Sulfoaluminate-Belite Cement
17
Figure 7. Temperature-Time relationship by citric acid dosage.
Figure 6 shows that the peak temperature decreases and is shifted in the time axis as more citric
acid is added. The points in time at which the maximum temperature occurred were calculated by
averaging the last and first point at which a maximum temperature was detected since multiple
maximum values were measured due to the frequency of the apparatus (10 Hz). Furthermore, the
points in time at which the maximum slope occurred for each of the temperature-time plots were
calculated using a MATLAB function. These points are represented with black dots in Figure 7.
The results for maximum slope yielded a linear trend with the equation y = 4.6127x and an R-
square value of 0.9671. The maximum change (slope) in temperature is represented by y and x is
the dosage of citric acid.

The Influence of Citric Acid on Setting Time and Temperature Behavior of Calcium Sulfoaluminate-Belite Cement
18
Figure 8. Initial setting time and maximum slope time as a function of citric acid dosage.
Figure 9. Average temperature, maximum temperature and time of maximum temperature results.
It can be observed from Figure 9 that the maximum temperature is reduced by a linear factor as
citric acid is added. Despite this fact, the time at which the maximum temperature occurs increases
R² = 0.9671
R² = 0.9842
0
20
40
60
80
100
120
140
160
180
200
0 5 10 15 20 25 30 35 40
Tim
e (m
in)
Dosage of citric acid (oz/100 lb of cement)
Max Slope Initial Setting
R² = 0.9866
R² = 0.9535R² = 0.9903
0
50
100
150
200
250
300
0
20
40
60
80
100
120
0 5 10 15 20 25 30 35 40
Tim
e (m
in)
Tem
per
atu
re (
℃)
Dosage (oz/100 lb of cement)
Tmax Taverage Time at Tmax

The Influence of Citric Acid on Setting Time and Temperature Behavior of Calcium Sulfoaluminate-Belite Cement
19
because the reaction has been decelerated. All the temperature parameters studied in this section
have yielded linear trends.
These temperature plots can be utilized to explain the reasoning behind the slight increase of the
compressive strength due to increase in citric acid dosage. First, this correlation can be explained
by means of the maturity method. This concept explains that early strength is higher when
temperatures are high during the curing process, and late strength is higher when temperatures are
low during the curing process. The slow hydration rate and low temperature allows the cement
paste to maximize the reduction of porosity due to a uniform formation of ettringite and other
reaction products [1]. Besides, the slow hydration, fluidity of the cement paste could have also
been a factor in the development of strength. The mixing proportions and properties of the
materials used for the cement paste influence the consistency of the mortar [10]. In this case, as
more citric acid was added to the mix, the consistency of the mix was improved. Consequently,
the material was easier to mold, fill space and reduce the porosity. The compressive strength
increases as the percentage of air voids in concrete is reduced [10].
The results of the compressive strengths somewhat match the maturity theory. The dosage at which
the early rapid gain strength is reduced lies between 0.7% and 1.4% of citric acid because the 1.4%
citric acid specimens showed lower strength at the after setting and three hours’ stages, and higher
strength at the seven-days stage compared to the 0.7% specimens. Despite the fact that this theory
cannot explain the small variations of compressive strength for specimens with dosages below
0.7%, the idea of this theory helps to understand that at some dosage of citric acid the early rapid
gain strength property is reduced since the temperature and dosage are inversely related. This
deficiency can be attributed to the fact that the maturity approach does not consider other factors
such as early age curing temperatures and humidity [1]. The maturity approach also establishes
that time and temperature of hydration have a correlation with strength. This is expressed as a
maturity function which is the area under the curve of the temperature-time plot. The results of the
area under the curve are presented in the following table:
Dosage (%) 0.0 0.18 0.35 0.53 0.7 1.4
Area under the
temperature-time plot
(℃-min) (103)
1.5717 2.2064 2.5308 3.0628 4.0403 5.2457
Table 3. Area under the curve of temperature-time plots.
The Influence of Citric Acid on Setting Time and Temperature Behavior of Calcium Sulfoaluminate-Belite Cement
20
The table shows that the area under the curve increases as the dosage of citric acid increases. The
correlation is that as the area increases, the compressive strength should increase [1]. However,
the results of this research show that this fact only applied to the strength at 1 day or more since
the 1.4% dosage specimens had lower compressive strengths after setting and at 6 hours despite
having greater area under the temperature-time plot. Further studies are required to understand the
mechanism behind the formation of ettringite at early stages when high dosages of citric acid are
used.
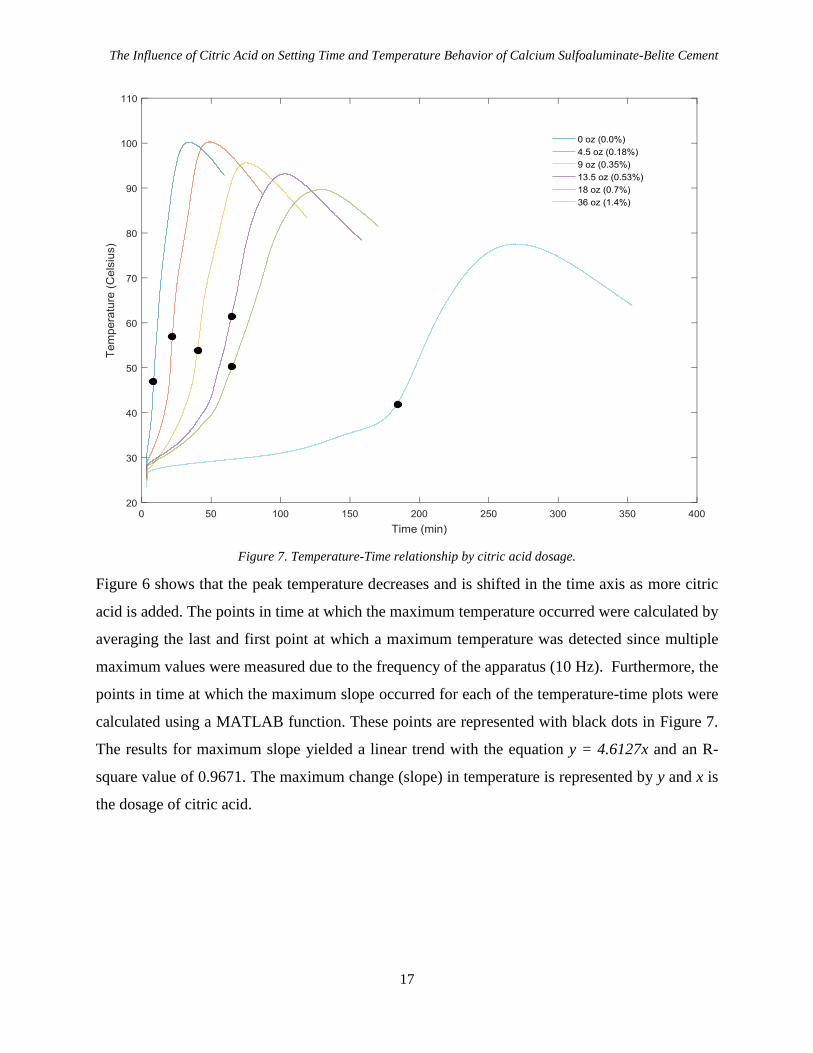
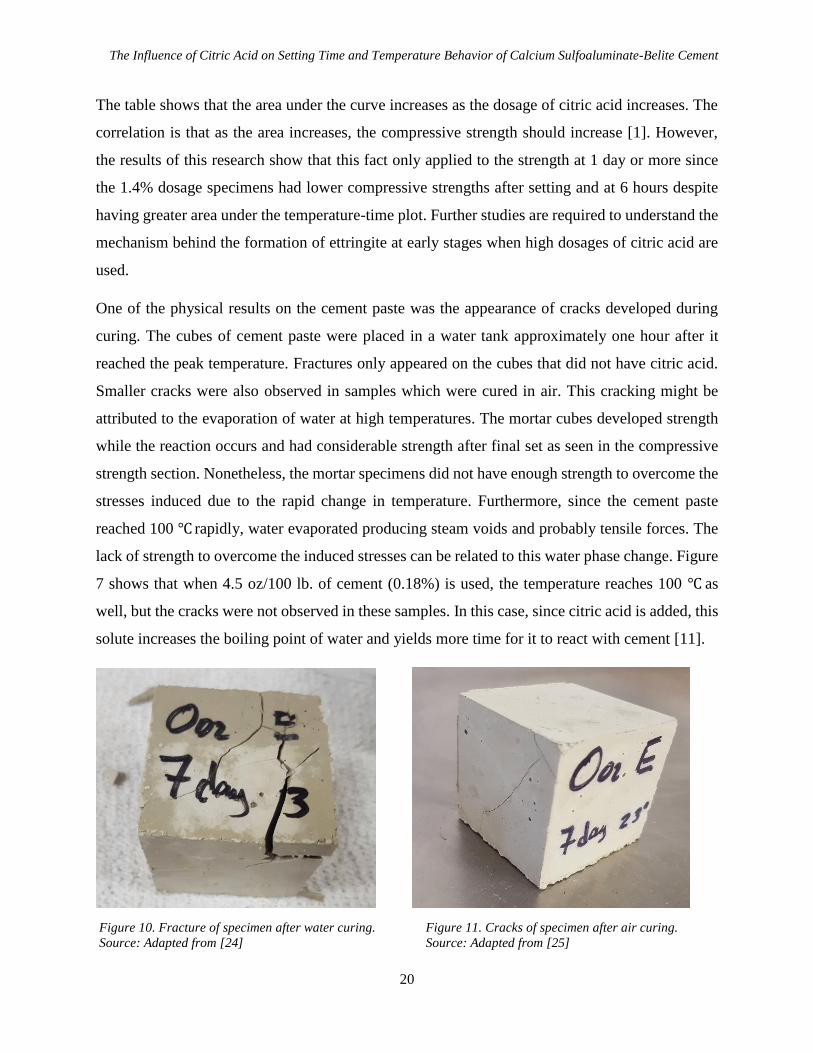
One of the physical results on the cement paste was the appearance of cracks developed during
curing. The cubes of cement paste were placed in a water tank approximately one hour after it
reached the peak temperature. Fractures only appeared on the cubes that did not have citric acid.
Smaller cracks were also observed in samples which were cured in air. This cracking might be
attributed to the evaporation of water at high temperatures. The mortar cubes developed strength
while the reaction occurs and had considerable strength after final set as seen in the compressive
strength section. Nonetheless, the mortar specimens did not have enough strength to overcome the
stresses induced due to the rapid change in temperature. Furthermore, since the cement paste
reached 100 ℃ rapidly, water evaporated producing steam voids and probably tensile forces. The
lack of strength to overcome the induced stresses can be related to this water phase change. Figure
7 shows that when 4.5 oz/100 lb. of cement (0.18%) is used, the temperature reaches 100 ℃ as
well, but the cracks were not observed in these samples. In this case, since citric acid is added, this
solute increases the boiling point of water and yields more time for it to react with cement [11].
Figure 10. Fracture of specimen after water curing. Figure 11. Cracks of specimen after air curing.
Source: Adapted from [24] Source: Adapted from [25]

The Influence of Citric Acid on Setting Time and Temperature Behavior of Calcium Sulfoaluminate-Belite Cement
21
E. CONCLUSIONS AND RECOMMENDATIONS
The following conclusions can be made based on the work described in this paper:
a. The relationship between setting time and citric acid dosage is linear. This has been
confirmed experimentally based on Vicat testing, penetrometer tests, and temperature-
time relationships from this research.
b. The results obtained from data available in this research and the modified methodology
of the maturity method yielded a linear trend. Therefore, the fact that the equivalent
age and citric acid dosage is linear supports the fact the setting time is behaves linearly
with respect to citric dosage since the maturity method correlates setting time, reaction
rate and equivalent age.
c. The strength of the BCSA specimens after setting and at one day is improved by
increasing the dosage of citric acid until it reaches a breakpoint between 0.7% and 1.4%
of dosage. At some dosage between 0.7% and 1.4% the after setting and 3 hours
strength reduces significantly.
d. At later stages, the strength is slightly improved. A more uniform formation of ettringite
due to a slower reaction and a lower porosity due to improved fluidity can be
determined to be the main factors influencing this improvement in compressive
strength.
e. The range of water temperatures used in this research did not have a significant effect
on compressive strength.
f. Increasing the dosage of citric acid reduces the peak temperature and the temperature-
time slope, but increases the area under the curve of the temperature-time plot.
g. The appropriate use of retarders, citric acid in this case, allows us to understand the
behavior of BCSA cement paste under different dosage. Concrete should have the same
behavior since the aggregates are not part of the reaction. However, additional research
with BCSA concrete is required to understand its behavior and determine the possible
positive outcomes of its use.
More research is required to fully understand its behavior and promote its usage in larger projects.
This research paper offers some basic relationships between the dosage of citric acid and the
cement behavior to be used to guide mixture proportioning and other research. Future work in this
area could improve on the methodology presented here by making the following changes:

The Influence of Citric Acid on Setting Time and Temperature Behavior of Calcium Sulfoaluminate-Belite Cement
22
a. Variability in parameters such as setting time and compressive strength can be attributed
to ambient temperature and humidity. Research with more control of these is required.
b. Curing in cold water is not recommended for very low dosage of citric acid. Even curing
in air will required some special methodology to avoid fractures on the specimens.
c. Research with a wider water temperature range should be done to account for seasonal
conditions in the field.
d. The use of other techniques such as calorimetry and X-ray diffraction can help to monitor
the hydration rate and obtain other chemical information more precisely.
e. Applying the maturity method described by the ASTM C1074-17 is another alternative to
confirm the facts about setting time presented in this paper.
F. REFERENCES
[1] P. K. Mehta and P. J. M. Monteiro, Concrete: microstructure, properties, and
materials. New York: McGraw-Hill Education, 2014. [2] L. Burris, T. Ley, P. Alapati, and N. Berke, “ALTERNATIVE CEMENTITIOUS
MATERIALS: CHALLENGES AND OPPORTUNITIES,” ResearchGate. [Online].
[3] R. Thomas, M. Maguire, A. Sorensen, and I. Quezada, “Calcium Sulfoaluminate
Cement,” Concrete International. [Online].
[4] L. E. Burris and K. E. Kurtis, “Influence of set retarding admixtures on calcium
sulfoaluminate cement hydration and property development,” Cement and Concrete
Research, vol. 104, pp. 105–113, 2018. [5] J. Skocek, F. Bullerjahn, Z. Maciej, and M. Haha, “Effect of retarders on the early
performance of CSA-type cement” Conference: International Workshop on
Durability and Sustainability of Concrete Structures. At: Bologna, Italy.
[6] O. Levenspiel, Chemical Reaction Engineering, 3rd edition. New York, NY: John
Wiley and Son, Incs, 1999.
[7] R. Pinto and K. Hover, “Application of Maturity Approach to Setting Times,” ACI
Materials Journal, vol. 96, no. 6, 1999.
[8] C. H. Lee and K. C. Hover, “Early-Age Stiffening of Paste, Mortar, and Concrete in
Lab and Field,” ACI Materials Journal, vol. 113, no. 1, 2016. [9] L. Struble, T. Y. Kim, and H. Zhang, “Setting of Cement and Concrete,” Cement,
Concrete and Aggregates, vol. 23, no. 2, pp. 88–93, Dec. 2001. [10] S. Somayaji, Civil Engineering Materials, 2nd ed. Prentice Hall, 2001. [11] J. W. Mullin, “Crystallization”, 4th ed. Oxford, 2001. [Online]. Available:
https://app.knovel.com/hotlink/pdf/id:kt00BWT7N5/crystallization-4th-
edition/front-matter
[12] E. P. Bescher, “Calcium Sulfoaluminate-Belite Concrete: Structure, Properties,
Practice.”

The Influence of Citric Acid on Setting Time and Temperature Behavior of Calcium Sulfoaluminate-Belite Cement
23
[13] ASTM C305-14 Standard Practice for Mechanical Mixing of Hydraulic Cement
Pastes and Mortars of Plastic Consistency, ASTM International, West
Conshohocken, PA, 2014, https://doi.org/10.1520/C0305-14
[14] ASTM C191-18 Standard Test Methods for Time of Setting of Hydraulic Cement
by Vicat Needle, ASTM International, West Conshohocken, PA, 2018,
https://doi.org/10.1520/C0191-18
[15] ASTM C403/C403M-16 Standard Test Method for Time of Setting of Concrete
Mixtures by Penetration Resistance, ASTM International, West Conshohocken, PA,
2016, https://doi.org/10.1520/C0403_C0403M-16
[16] H. Sleiman, A. Perrot, and S. Amziane, “A new look at the measurement of
cementitious paste setting by Vicat test,” Cement and Concrete Research, vol. 40,
no. 5, pp. 681–686, 2010. [17] R. Ylmén, U. Jäglid, B.-M. Steenari, and I. Panas, “Early hydration and setting of
Portland cement monitored by IR, SEM and Vicat techniques,” Cement and
Concrete Research, vol. 39, no. 5, pp. 433–439, 2009. [18] M. Zajac, J. Skocek, F. Bullerjahn, and M. B. Haha, “Effect of retarders on the
early hydration of calcium-sulpho-aluminate (CSA) type cements,” Cement and
Concrete Research, vol. 84, pp. 62–75, 2016. [19] C. Grigoras, L. Gavrila, and A. I. Simion, “Modelling of the thermophysical
properties of citric acid aqueous solutions. Density and viscosity.,” Annals. Food
Science and Technology, pp. 193–202, 2014. [20] M. Aresta, A. Dibenedetto, and F. Dumeignil, Biorefineries: an introduction.
Berlin: De Gruyter, 2015. [21] ASTM C1074-17 Standard Practice for Estimating Concrete Strength by the
Maturity Method, ASTM International, West Conshohocken, PA,
2017, https://doi.org/10.1520/C1074-17
[22] ASTM C109/C109M-16a Standard Test Method for Compressive Strength of
Hydraulic Cement Mortars (Using 2-in. or [50-mm] Cube Specimens), ASTM
International, West Conshohocken, PA, 2016,
https://doi.org/10.1520/C0109_C0109M-16A.
[23] Soriano, E. 2018. Vicat Apparatus (left), and Penetrometer (right). [Photograph]
[24] Soriano, E. 2018. Fracture of specimen after water curing. [Photograph] [25] Soriano, E. 2018. Cracks of specimen after air curing. [Photograph]

The Influence of Citric Acid on Setting Time and Temperature Behavior of Calcium Sulfoaluminate-Belite Cement
24
G. APPENDIX
Figure 12. Penetrometer test plot at 21.1℃ water temperature.
Figure 13. Log-Log Penetrometer test plot at 21.1℃ water temperature.
Figure 14. Penetrometer test plot at 23.3℃ water temperature.
0
2000
4000
6000
8000
10000
12000
0 20 40 60 80 100 120 140 160 180 200 220 240
Stre
ss (
psi
)
Time (min)
10
100
1000
10000
5 50 500
Stre
ss (
psi
)
Time (min)
0
2000
4000
6000
8000
10000
12000
0 20 40 60 80 100 120 140 160 180 200 220 240
Stre
ss (
psi
)
Time (min)

The Influence of Citric Acid on Setting Time and Temperature Behavior of Calcium Sulfoaluminate-Belite Cement
25
Figure 15. Log-Log Penetrometer test plot at 23.3℃ water temperature.
Figure 16. Penetrometer test plot at 25℃ water temperature.
Figure 17. Log-Log Penetrometer test plot at 25℃ water temperature.
10
100
1000
10000
5 50 500
Stre
ss (
psi
)
Time (min)
0
2000
4000
6000
8000
10000
12000
0 20 40 60 80 100 120 140 160 180 200 220 240
Stre
ss (
psi
)
Time (min)
10
100
1000
10000
5 50 500
Stre
ss (
psi
)
Time (min)
The Influence of Citric Acid on Setting Time and Temperature Behavior of Calcium Sulfoaluminate-Belite Cement
26
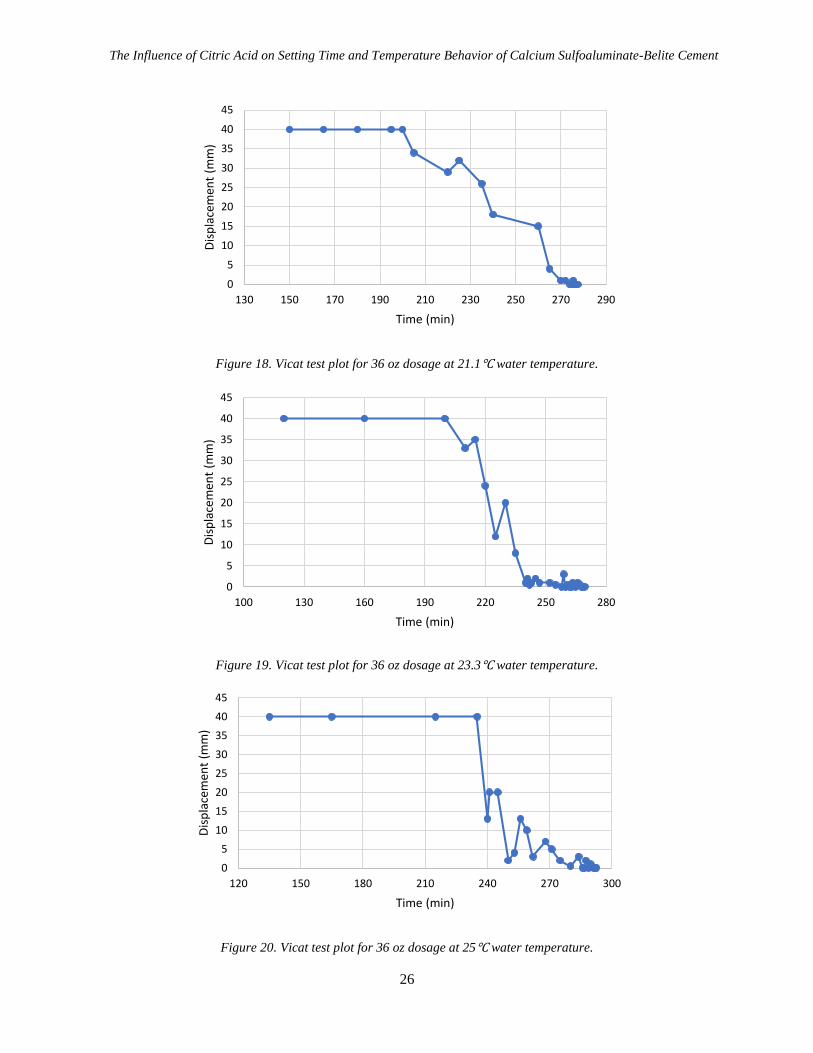
Figure 18. Vicat test plot for 36 oz dosage at 21.1℃ water temperature.
Figure 19. Vicat test plot for 36 oz dosage at 23.3℃ water temperature.
Figure 20. Vicat test plot for 36 oz dosage at 25℃ water temperature.
0
5
10
15
20
25
30
35
40
45
130 150 170 190 210 230 250 270 290
Dis
pla
cem
ent
(mm
)
Time (min)
0
5
10
15
20
25
30
35
40
45
100 130 160 190 220 250 280
Dis
pla
cem
ent
(mm
)
Time (min)
0
5
10
15
20
25
30
35
40
45
120 150 180 210 240 270 300
Dis
pla
cem
ent
(mm
)
Time (min)
The Influence of Citric Acid on Setting Time and Temperature Behavior of Calcium Sulfoaluminate-Belite Cement
27
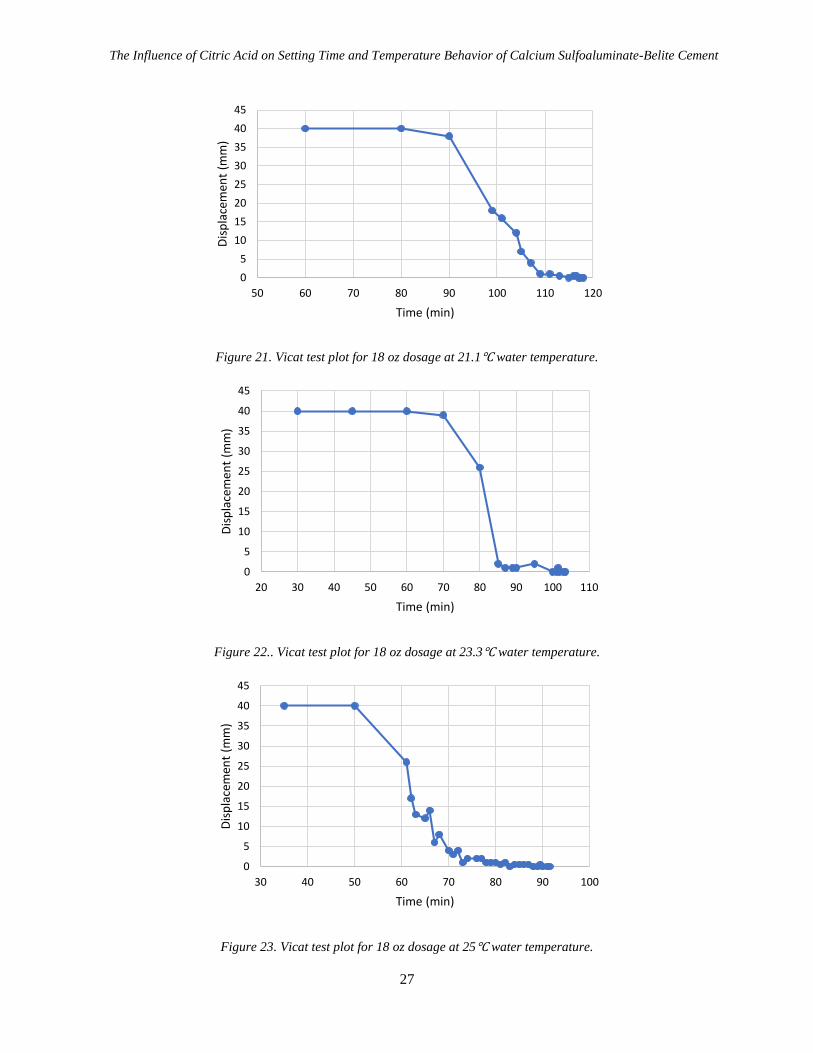
Figure 21. Vicat test plot for 18 oz dosage at 21.1℃ water temperature.
Figure 22.. Vicat test plot for 18 oz dosage at 23.3℃ water temperature.
Figure 23. Vicat test plot for 18 oz dosage at 25℃ water temperature.
0
5
10
15
20
25
30
35
40
45
50 60 70 80 90 100 110 120
Dis
pla
cem
ent
(mm
)
Time (min)
0
5
10
15
20
25
30
35
40
45
20 30 40 50 60 70 80 90 100 110
Dis
pla
cem
ent
(mm
)
Time (min)
0
5
10
15
20
25
30
35
40
45
30 40 50 60 70 80 90 100
Dis
pla
cem
ent
(mm
)
Time (min)

The Influence of Citric Acid on Setting Time and Temperature Behavior of Calcium Sulfoaluminate-Belite Cement
28
Figure 24. Vicat test plot for 13.5 oz dosage at 21.1℃ water temperature.
Figure 25. Vicat test plot for 13.5 oz dosage at 23.3℃ water temperature.
Figure 26. Vicat test plot for 13.5 oz dosage at 25℃ water temperature.
0
5
10
15
20
25
30
35
40
45
20 30 40 50 60 70 80 90
Dis
pla
cem
ent
(mm
)
Time (min)
0
5
10
15
20
25
30
35
40
45
20 30 40 50 60 70 80 90
Dis
pla
cem
ent
(mm
)
Time (min)
0
5
10
15
20
25
30
35
40
45
20 30 40 50 60 70 80
Dis
pla
cem
ent
(mm
)
Time (min)

The Influence of Citric Acid on Setting Time and Temperature Behavior of Calcium Sulfoaluminate-Belite Cement
29
Figure 27. Vicat test plot for 9 oz dosage at 21.1℃ water temperature.
Figure 28. Vicat test plot for 9 oz dosage at 23.3℃ water temperature.
Figure 29. Vicat test plot for 9 oz dosage at 25℃ water temperature.
0
5
10
15
20
25
30
35
40
45
20 30 40 50 60
Dis
pla
cem
ent
(mm
)
Time (min)
0
5
10
15
20
25
30
35
40
45
20 30 40 50 60
Dis
pla
cem
ent
(mm
)
Time (min)
0
5
10
15
20
25
30
35
40
45
20 30 40 50 60
Dis
pla
cem
ent
(mm
)
Time (min)
The Influence of Citric Acid on Setting Time and Temperature Behavior of Calcium Sulfoaluminate-Belite Cement
30
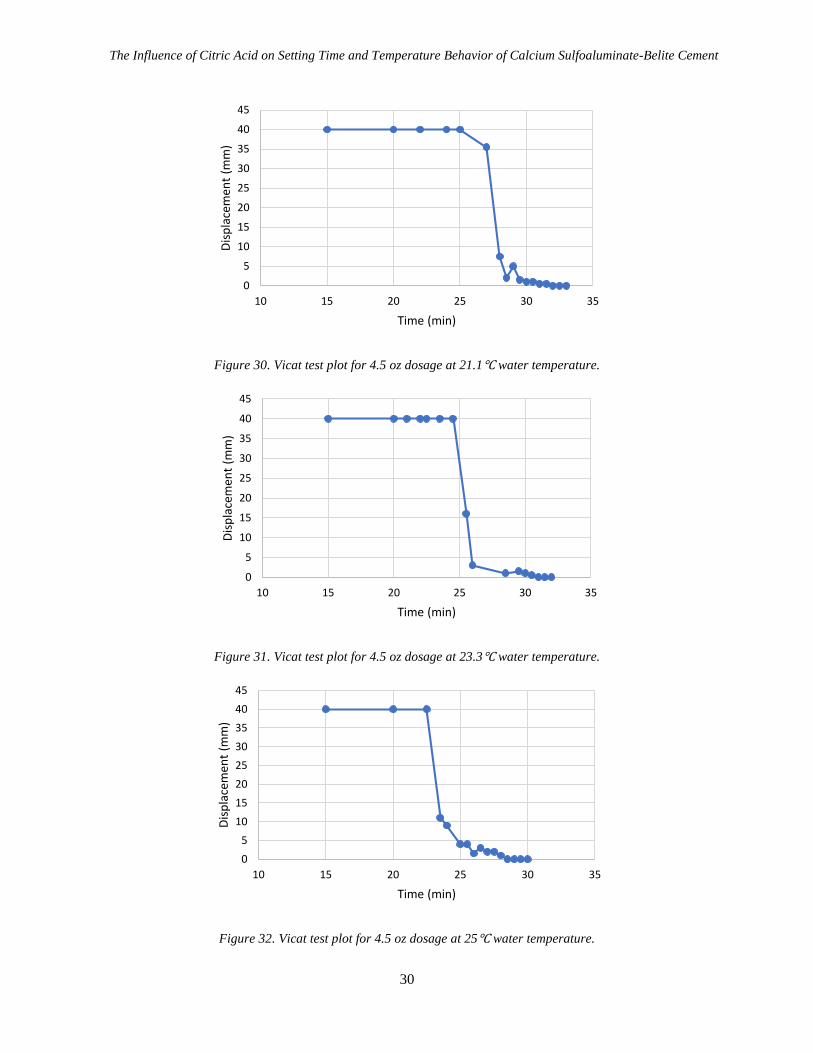
Figure 30. Vicat test plot for 4.5 oz dosage at 21.1℃ water temperature.
Figure 31. Vicat test plot for 4.5 oz dosage at 23.3℃ water temperature.
Figure 32. Vicat test plot for 4.5 oz dosage at 25℃ water temperature.
0
5
10
15
20
25
30
35
40
45
10 15 20 25 30 35
Dis
pla
cem
ent
(mm
)
Time (min)
0
5
10
15
20
25
30
35
40
45
10 15 20 25 30 35
Dis
pla
cem
ent
(mm
)
Time (min)
0
5
10
15
20
25
30
35
40
45
10 15 20 25 30 35
Dis
pla
cem
ent
(mm
)
Time (min)

The Influence of Citric Acid on Setting Time and Temperature Behavior of Calcium Sulfoaluminate-Belite Cement
31
Figure 33. Vicat test plot for 0 oz dosage at 21.1℃ water temperature.
Figure 34. Vicat test plot for 0 oz dosage at 23.3℃ water temperature.
Figure 35. Vicat test plot for 0 oz dosage at 25℃ water temperature.
0
5
10
15
20
25
30
35
40
45
4 6 8 10 12 14 16 18
Dis
pla
cem
ent
(mm
)
Time (min)
0
5
10
15
20
25
30
35
40
45
6 7 8 9 10 11 12 13
Dis
pla
cem
ent
(mm
)
Time (min)
0
5
10
15
20
25
30
35
40
45
4 5 6 7 8 9 10
Dis
pla
cem
ent
(mm
)
Time (min)

The Influence of Citric Acid on Setting Time and Temperature Behavior of Calcium Sulfoaluminate-Belite Cement
32
Figure 36. MATLAB code used to determine location of maximum slope.
The Influence of Citric Acid on Setting Time and Temperature Behavior of Calcium Sulfoaluminate-Belite Cement
33
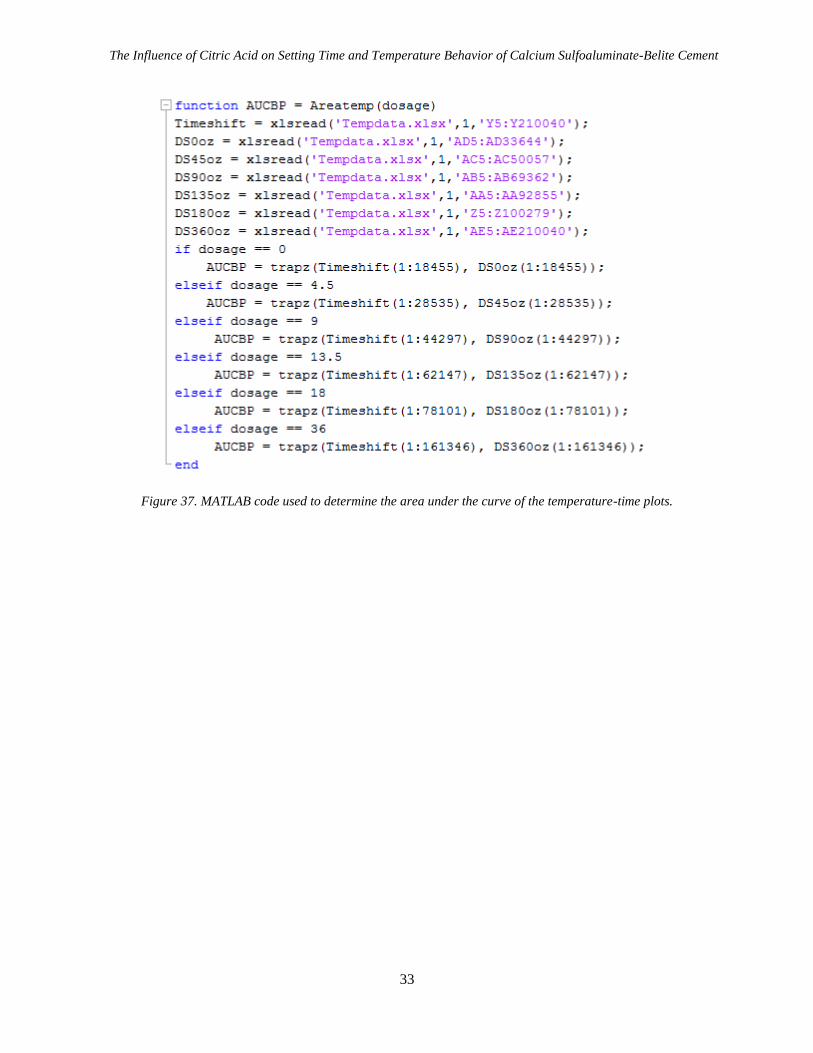
Figure 37. MATLAB code used to determine the area under the curve of the temperature-time plots.