Embed Size (px)
Citation preview
JVlutation Research, 29 (1975) 4o7-422 ~) Elsevier Scientific Publishing Company, Amsterdam--Printed in The Netherlands 407
THE INDUCTION BY X-RAYS OF CHROMOSOME ABERRATIONS IN MALE
GUINEA-PIGS, RABBITS AND GOLDEN HAMSTERS
II I . DOSE-RESPONSE RELATIONSHIP A F T E R SINGLE DOSES OF X-RAYS
TO SPERMATOGONIA
MARY F. LYON AND BARBARA D. COX (Received February i3th, I975) (Accepted April 7th, 1975)
SUMMARY
The induction by X-rays of translocations in spermatogonia was studied by cytological means in spermatocytes derived from them. In the rabbit and guinea-pig hump shaped dose-response curves were obtained, with a linear relationship at the low doses. The shapes of the curves were similar to those reported for the mouse, ex- cept that the maximum occurred at 6oo-7oo rad in the mouse as opposed to 3oo rad in the guinea-pig and rabbit. Unlike the guinea-pig and rabbit, the golden hamster showed a hump dose-response curve without a definite peak value and with little decrease in yield at high radiation doses. Over the low dose range lOO-3OO rad, the slopes of the curves of translocation yield were in the order: mouse (highest), rabbit, guinea-pig and hamster.
Data on sterile periods suggested that the amount of spermatogonial killing in the rabbit and guinea-pig was as great or greater than in the mouse, and that in the golden hamster it was most severe. It is suggested that the differing shapes of the dose-response curves can be explained by a lower sensitivity to translocation induc- tion in the test species and, also especially in the golden hamster, a greater sensitivity to cell killing.
The possibility of extrapolating from these data to other species is discussed.
INTRODUCTION
The need to determine the response to radiation of germ cells of different mam- malian species, in connection with the genetic risks of radiation in man, has been previously discussed2,6, 7. With this in mind comparisons of species were made for the primary oocyte in the femaleL and for the post-meiotic stages in the maleT, 8. However, in the male, the spermatogonial stem cell is the germ cell most at risk because it re- ceives the greater pait of a lifetime dose of radiation. Therefore, the response to X-
Abbreviation: IUdR, iododeoxyuridine.
4 0 ~ M . F . l . ' f O > , , 1),. I). ((} 'x
rays of spermatogonia of different species has been investigated, and the: wsults f(~r single doses are presented here. As in the other papers, the golden hamster (3lesocr~ cetus aurar.if s), the guinea-pig (Cavia porcdhts) and the rabbit ( Orvctolaz(lts c~t~zic2dtts) were chosen for the study, and the results are compared with published data ()n th(' mouse, and other species.
M A T E R I A L S AND M E T H O D S
Adult male golden hamsters, guinea-pigs and rabbits, aged 3, 6 and 9 months respectively were given single X- ray exposures in the dose-range ioo-6oo rad, chosen on the results of a pilot s tudy 25. Only the caudal thi ld of the animal was exposed (25o keV, o.25 mm Cu, io mA, 88 rad/nfin)" the remaining two-thirds was protected by lead shielding.
After irradiation the animals were left for varying times to allow recovery of spermatogenesis. In the golden hamster recovery was judged to be adequate when one of two females to which the male was mated became pregnant. In the guinea-pig and rabbit return of normal testis size was used as the criterion, except in guinea-pigs given 6oo rad. Each of these latter males was mated to 4 females and recovery of spermatogenesis was assumed when one female was found by palpation to be 4 5 weeks pregnant. Cytological preparat ions were made after recovery had been ascer- tained, and hence the time interval between irradiation and cytological examination ranged from 3-7 months in the golden hamster and 3 9 months in the guinea-pig and rabbit. In the hamster, tests showed tha t the translocation yield did not vary over the sampling period (see RESULTS); this point was not tested in guinea-pigs and rabbits.
For all three species the right testis was removed surgically and meiotic chromo- somes were obtained using MEREDITH'S cytological technique2% modified in order to allow examinat ion of pr imary spermatocytes from all parts of the testis. All the testis material, after t rea tment first with z% citrate (golden hamster, z o - I 5 rain; guinea- pig, 2o 3o rain ; rabbit, 6o-12o min) and then with fixative (3 : z, acetic alcohol), was divided into a number of equal fractions, dependent on testis size. Each fraction was made into a homogeneous cell suspension using 6o% acetic acid solution in a 5 ml centrifuge tube, from which a number of small drops were deposited, by means ot a micropipette, onto a clean slide placed on a hot plate (6o~). The drops were withdrawn soon after application and discarded. This procedure was repeated m a n y times until the contents of each tube were placed on one slide. The technique ensured tha t the sampling of cells from the different parts of the testis was random, and tha t the scor- ing of clones of aberrant cells was minimi:sed. The slides were then stained with lacto- acetic orcein and mounted in euparal.
In general zo slides [one per fraction) were made for each testis and these were coded with those of control animals or with those of other irradiated animals. A max imum of 5o spermatocytes at diakinesis-first metaphase stage was analysed per slide.
This modified technique has been tested on the mouse where it gave transloca- tion frequencies similar to those obtained with the widely used EVANS method% 2~ and thus it was assumed to be suitable for other mammal ian species.
In the calculation of the translocation yield, two values were obtained, ore,
SPECIES COMPARISONS IN SPERMATOGONIA 409
when both "definite" and "possible" and the other when only "definite" transloca- tions were taken into account. "Possible" translocations refer to cells containing a configuration which resembled in size and shape a nmltivalent but in which the indi- vidual chromosomes were not distinct. Provided these cells also contained the correct number of bivalents minus the number involved in the translocation, they were scored in the "possible" category. In case of any doubt in the interpretation of a particular configuration a second opinion was sought.
6
~ 5
2
2 "6
3
£ g2
1
~8o ~o ~;o .~o 600 X - roy dose
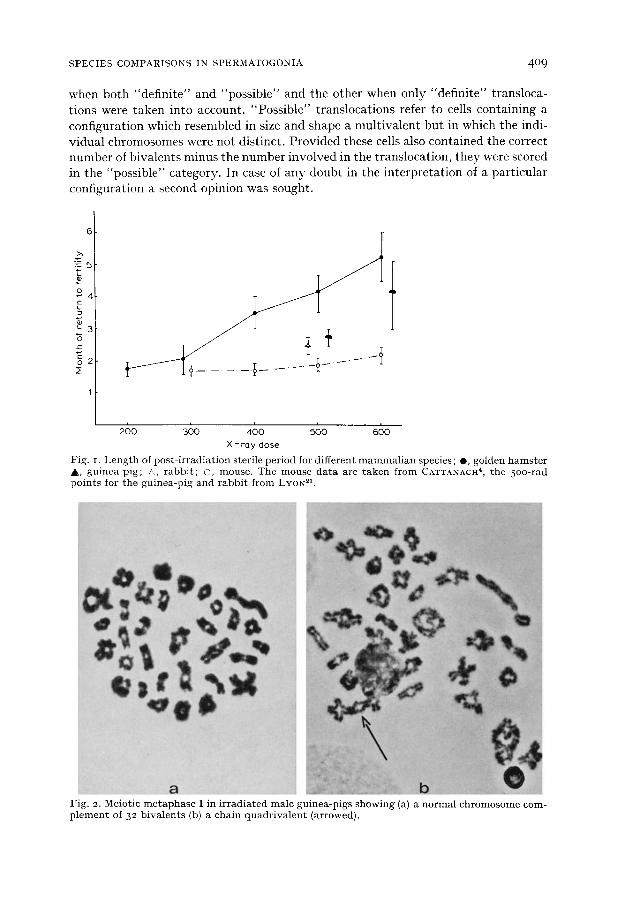
Fig. I. Length of post- irradiat ion sterile period for different mammal ian species ; e , golden hams te r &, guinea-pig; &, rabbi t ; O, mouse. The mouse data are taken from CATTANACH 4, the 5oo-rad points for the guinea-pig and rabbi t f rom LYON 21.
a
Fig. 2. Meiotic metaphase I in irradiated male guinea-pigs showing (a) a normal chromosome com- plement of 32 bivalents (b) a chain quadr ivalent (arrowed).
4Io M . F . I . Y ( ) N , I.L 1). ( ( )N
G
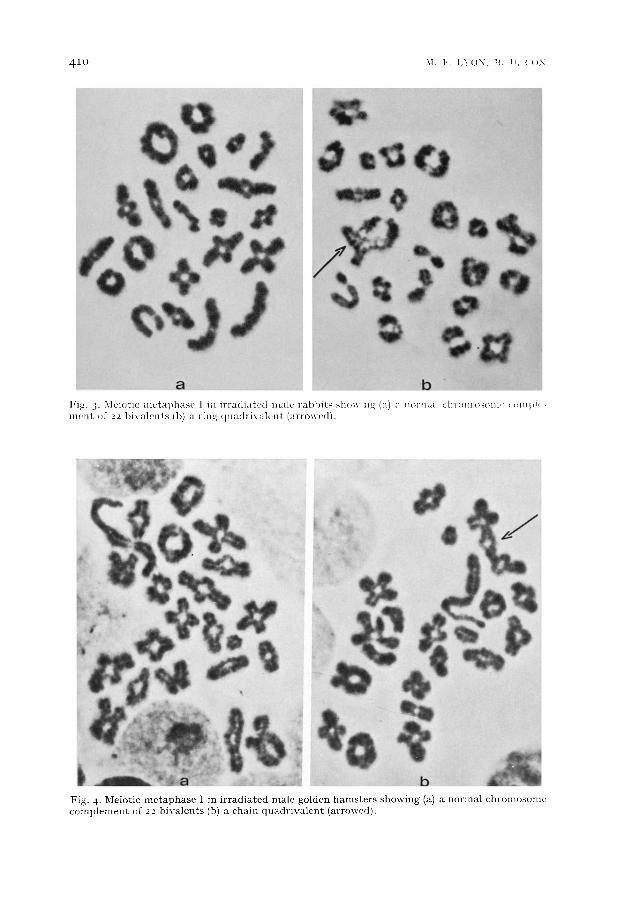
a b Fig . 3- M e i o t i c m c t a p h a s c I i n i r r ~ ( l i a t c d ~ t t l t ' r a b b i t s s h o ~ i n ~ ( a ) . m>rmalchr(>m()som~'¢*~m)>I<- n l e n t of 22 1)ival t-nts (b) a r i n x qtmth-ix al¢'nt ( a r r o w c d ) .
iil ~ i i ; ¸ / ~i~ ~ii~ !iii~ i! ~ ~ ~
F i g . 4. M e i o t i c m e t a p h a s e I in i r r a d i a t e d m a l e g o l d e n h a m s t e r s s h o w i n g (a) a n o r m a l c t ~ r o m o s o n m c o m p l e m e n t of 2 2 1 ) iva len t s (b) ~ c h a i n q u a d r i v a l e n t ( a r r o w e d ) .
S P E C I E S C O M P A R I S O N S I N S P E R M A T O G O N I A 4 1 1
R E S U L T S
I. Spermatogonial killing In fo rma t ion on t ime of r e tu rn of fe r t i l i ty was ob ta ined in the golden hams te r by
sub t r ac t ing 16 days from the da te of b i r th of the first l i t ter , and in the guinea-pig b y sub t r ac t ing 4-5 weeks f rom the t ime of the first posi t ive pa lpa t ion of the females to which the males were t e s t -ma ted . The d a t a are p lo t t ed in Fig. I toge ther wi th a few resul ts a f te r 500 r ad ~1 and the d a t a of CATTANACH 4 for the mouse. All three species s tud ied here took longer to r e tu rn to fe r t i l i ty af ter a given dose t han the mouse. The guinea-pig appea red to have a somewhat shor ter steri le per iod t han the hamster , bu t the confidence l imi ts were wide.
II . Classification of spermatocytes In all three species the most common types of mul t iva len t s were r ing and chain
quadr iva len t s (Table I I , Figs. 2, 3 and 4). Rings were more p reva len t t han chains in the r abb i t , as in the mouse15,17, is. In the guinea-pig and golden hamster , however, as in our ear l ier work wi th t rans loca t ions induced in pos t -meiot ic s tages 8, chains were more common than rings. A small p ropor t ion of hexavalen ts , and a few cells conta in ing two quadr iva len t s were found in all species. However , there appea red to be no correla- t ion be tween the t ype of chronlosomal associat ion and the rad ia t ion dose in any of the species. The same finding has been repor ted previous ly for the mouse is.
Time after irradiation (months)
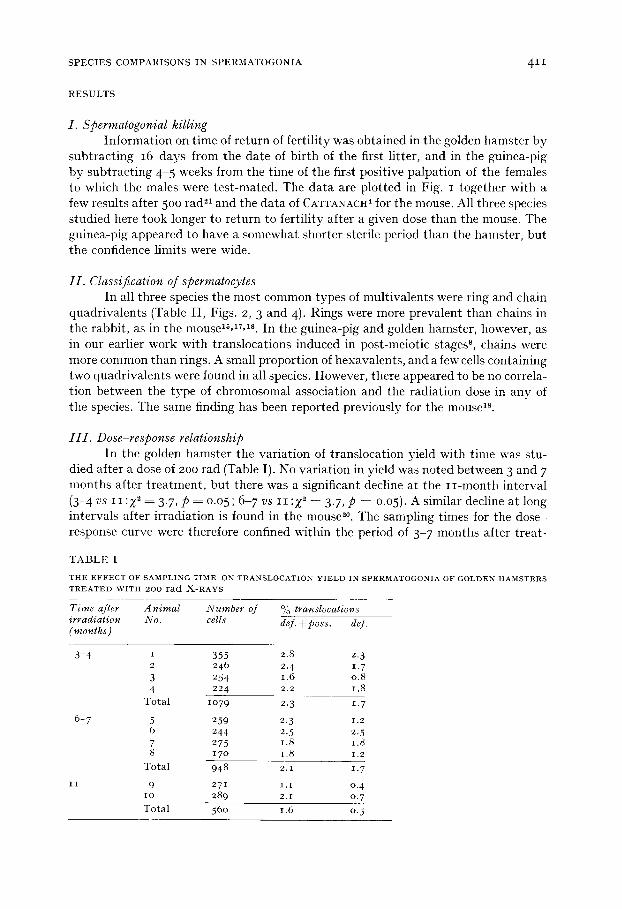
HI. Dose-response relationship In the golden hams t e r the va r ia t ion of t rans loca t ion yield wi th t ime was stu-
died af ter a dose of 200 rad (Table I). No var ia t ion in yield was no ted between 3 and 7 mon ths af ter t r e a tmen t , bu t there was a significant decline at the i i - m o n t h in te rva l (3-4 vs I I :Z 2 = 3-7, P = 0.05; 6 - 7 vs I I :Z 2 = 3.7, P = 0.05). A similar decline at long in te rva ls af ter i r r ad ia t ion is found in the mouse 2°. The sampl ing t imes for the dose - response curve were therefore confined wi thin the per iod of 3-7 months af ter t r ea t -
T A B L E I
THE EFFECT OF SAMPLING TIME ON TRANSLOCATION YIELD IN SPERMATOGONIA OF GOLDEN HAMSTERS TREATED W I T H 2 0 0 r a d X - R A Y S
Animal Number of % translocations No. cells def. + poss. de].
3 - 4 I
2
3 4
T o t a l
6 - 7 5 6
7 8
T o t a l
i i 9 i o
T o t a l
355 2 .8 2. 3 2 4 6 2. 4 1 .7 2 5 4 1 .6 o . 8 224 2 .2 i .8
l O 7 9 2. 3 1. 7
2 5 9 2.3 1.2 244 2.5 2 .5 275 1 .8 1 .8 1 7 o 1.8 1 .2
9 4 8 2 , i 1. 7
2 7 I I . I o, 4 2 8 9 2.1 0. 7
5 6 0 i .6 0. 5
4 1 2 51. F. LY N, B. I). ( '()X
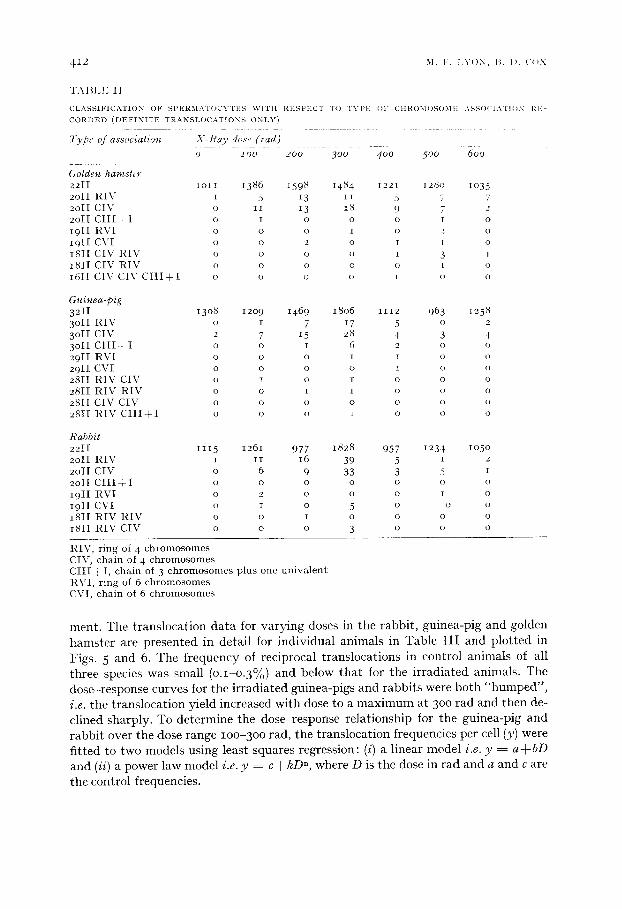
"I'ABI.I~; i I
C L A S S I I ; I C A T I O N O F -%PI~2RMATOCY'ITI~;-% \ V I T t i REGPI~;CT T O T'~'lq'2 O1" CHROMOHOMI, ; A N S ( ) C I . \ T I O N I~.I'I-
C O R D E D ( D E F I N I T E T R A N S L O C A T i O N S O N L Y )
Type of association X - R a y dose ( tad)
o l oo 200 300 400 500 600
Golden hamster 2 2 1 I lO11 1386 i 5 9 8 1484 1221 128o lO35 2 o l l R I \ 5 t 5 13 I i 5 7 7 2o11 C I V o I1 13 18 9 7 2 2 o l 1 C I I I + I o I o o o r o 191I R V I o o o I o 2 o 1 9 l [ C V I o o 2 o I l o 1811 C I V R I V o o o o I 3 t 181I C I V R I V o o o o o t o 161i C I V C I V C I I I + 1 o o o o ~ o o
Guinea-pig 3 2 I I 13o8 12o9 1469 18o6 1112 963 1 2 5 8
3 o i 1 R I V o i 7 17 5 o 2 3 o l i C I V 2 7 15 28 4 3 4 3 o l l C l l i - ¢ I o o i 6 2 o o 2 9 I I R V I o o o i i o o 2 9 I I C V I o o o o i o o 2 8 I I R I V C I V o i o 1 o o o 2 8 I I R I V R I V o o i i o o o 2811 C I V C I V o o o o o o o 281 I t l l V C l l l / I o o o 1 o o o
Rabbit 2 2 I [ 1115 1261 9 7 7 1828 957 1234 lO5O 2 o i i R I V i i i 16 39 5 i 2 2 o l 1 C l V o 6 9 33 3 5 i 2 o i 1 C I I I + I o o o o o o o i 9 I I R V I o 2 o o o 1 o i 9 I I C V I o i o 5 o o o 181I R I V R I V o o i o o o o 181I R I V C I V o o o 3 o o o
R I V , r i n g of 4 c h r o m o s o m e s CIV , c h a i n of 4 c h r o m o s o m e s C I I [ + I, c h a i n of 3 c h r o m o s o n l e s p l u s o n e u n i v a l e n t R V I , r i n g of 6 c h r o m o s o m e s CVI , c h a i n of 6 c h r o m o s o m e s
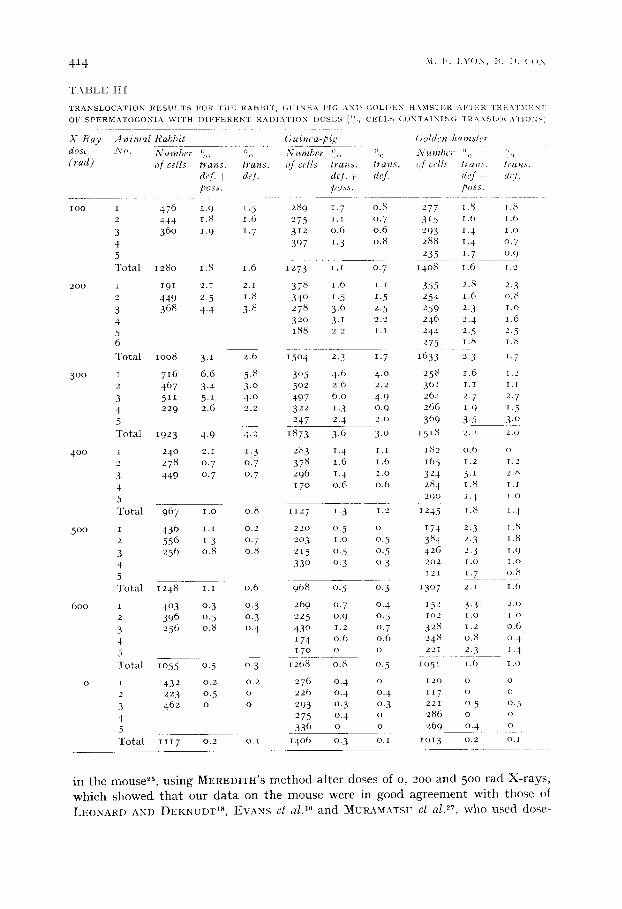
m e n t . T h e t r a n s l o c a t i o n d a t a f o r v a r y i n g d o s e s i n t h e r a b b i t , g u i n e a - p i g a n d g o l d e n
h a m s t e r a r e p r e s e n t e d i n d e t a i l f o r i n d i v i d u a l a n i m a l s i n T a b l e I I I a n d p l o t t e d i n
F i g s . 5 a n d 6 . T h e f r e q u e n c y o f r e c i p r o c a l t r a n s l o c a t i o n s i n c o n t r o l a n i m a l s o f a l l
t h r e e s p e c i e s w a s s m a l l ( O . l - O . 3 ° ) a n d b e l o w t h a t f o r t h e i r r a d i a t e d a n i m a l s . T h e
d o s e - r e s p o n s e c u r v e s f o r t h e i r r a d i a t e d g u i n e a - p i g s a n d r a b b i t s w e r e b o t h " h u m p e d " ,
i .e . t h e t r a n s l o c a t i o n y i e l d i n c r e a s e d w i t h d o s e t o a m a x i m u m a t 3 o o r a d a n d t h e n d e -
c l i n e d s h a r p l y . T o d e t e r m i n e t h e d o s e - r e s p o n s e r e l a t i o n s h i p f o r t h e g u i n e a - p i g a n d
r a b b i t o v e r t h e c l o s e r a n g e l O O - 3 O O r a d , t h e t r a n s l o c a t i o n f r e q u e n c i e s p e r c e l l (y ) w e r e
f i t t e d t o t w o m o d e l s u s i n g l e a s t s q u a r e s r e g r e s s i o n : (i) a l i n e a r m o d e l i .e . y = a + b D
a n d (ii) a p o w e r l a w m o d e l i .e . y = c + k D n, w h e r e D i s t h e d o s e i n r a d a n d a a n d c a r e
t h e c o n t r o l f r e q u e n c i e s .
SPECIES COMPARISONS IN SPERMATOGONIA
(a)
413
y - - a ± b D b Goodness q f f i t
X ~ d.f. P
R a b b i t d e f . + p o s s . ( I .7 ° ± o.14) lO -4 0.82 2 0.66 R a b b i t def. (1.48 j : o.13) IO 4 0.86 2 0.65 G u i n e a - p i g d e f . ± p o s s . ( i . i i ± o . i i ) lO -4 0.60 2 0.74 G u i n e a - p i g def. (o.91 ± o . io ) lO -4 1.58 2 0.45
(b)
y - - c ± k D n k Test f o r n = I Goodness o f f i t
u P X ~ d . f . P
R a b b i t d e f . + p o s s . (2.34 :J_ 2.75) lO -4 0.94 :J: o.21 0.27 0.79 0.73 I 0 .39 R a b b i t def. (2.26 i 2.78) lO -4 0.92 ± 0 .23 0.34 0.73 0 .73 I 0 .39 G u i n e a p ig d e f . ± p o s s . (3.16 :J: 5.29) lO -5 1.23 ± 0.3 ° 0 .76 o.45 o.o13 i o.91 G u i n e a p ig def. (0.91 ~: 1.73) lO -5 1.42 ~: 0.35 1.2 0.22 o.o12 i o.91
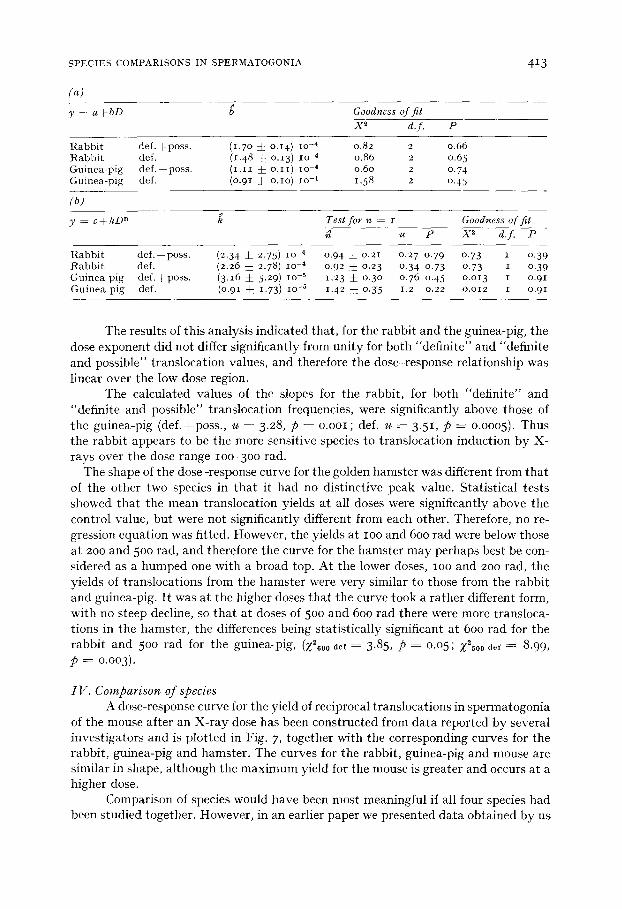
The results of this analysis indicated that , for the rabbit and the guinea-pig, the dose exponent did not differ significantly from uni ty for both "definite" and "definite and possible" translocation values, and therefore the dose-response relationship was linear over the low dose region.
The calculated values of the slopes for the rabbit, for both "definite" and "definite and possible" translocation frequencies, were significantly above those of the guinea-pig (def .+poss. , u - - 3.28, p = o .ooi ; def. u = 3.51, p = 0.0005). Thus the rabbit appears to be the more sensitive species to translocation induction by X- rays over the dose range lOO-3OO rad.
The shape of the dose-response curve for the golden hamster was different from tha t of the other two species in tha t it had no distinctive peak value. Statistical tests showed tha t the mean translocation yields at all doses were significantly above the control value, but were not significantly different from each other. Therefore, no re- gression equation was fitted. However, the yields at IOO and 600 rad were below those at 200 and 500 rad, and therefore the curve for the hamster may perhaps best be con- sidered as a bumped one with a broad top. At the lower doses, IOO and 200 rad, the yields of translocations from the hamster were very similar to those from the rabbit and guinea-pig. I t was at the higher doses tha t the curve took a rather different form, with no steep decline, so tha t at doses of 500 and 600 rad there were more transloca- tions in the hamster , the differences being statistically significant at 600 rad for the rabbit and 500 tad for the guinea-pig, (;f2600 oe~ = 3.85, p = 0.05; Z2500 0el = 8.99, p = 0.003).
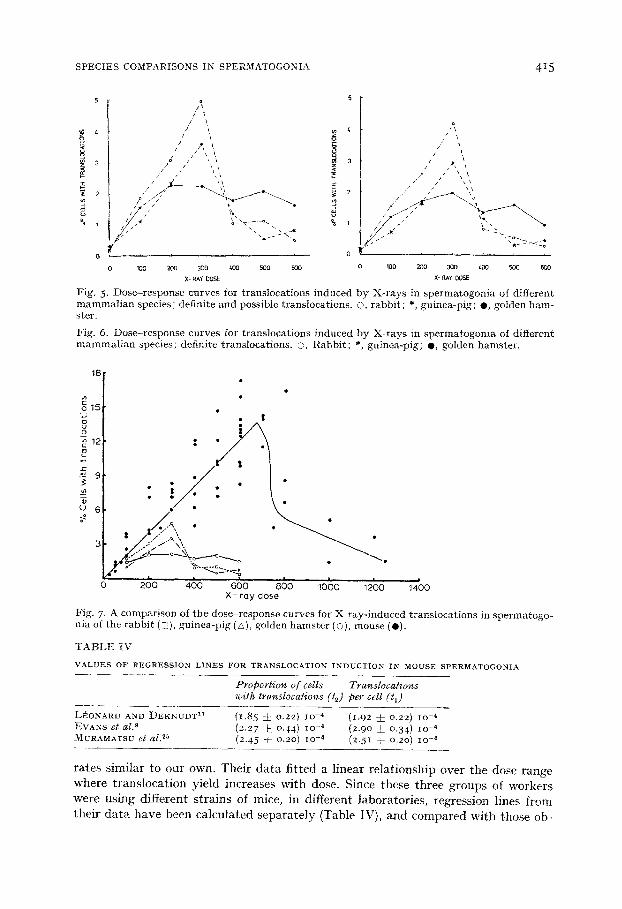
I V . Comparison of species A dose-response curve for the yield of reciprocal translocations in spermatogonia
of the mouse after an X- ray dose has been constructed from data reported by several investigators and is plot ted in Fig. 7, together with the corresponding curves for the rabbit, guinea-pig and hamster. The curves for the rabbit, guinea-pig and mouse are similar in shape, a l though the max imum yield for the mouse is greater and occurs at a higher dose.
Comparison of species would have been most meaningful if all four species had been studied together. However, in an earlier paper we presented data obtained by us
4 1 4 M . F . I ,V(IN, B. I}. ('{)X
T A B L E I I [
TRANSLOCATION RESULTS FOR Tills RABBIT, GUINEA PIG ANI) (;OLDEN HAMSTER AFTER TRI:;.K~IMI'LNI OF SPERMATOGONIA V¢ITH DIFFERENT RAI)IAT1ON DOSES (°c~ CELLS CONTAININ(} "" ~ \ N S , )CATIONSI
X - R a y A n i m a l Rabbit Guinea-pig (;olden hamster dose No. N u m b e r % % N u m b e r % o Nutnbct . . . . . o o o (rad) of cells trans, trans, of cells trans, trans, qf cells t ra , s , leans.
def. + def. def. i dqf. dl'f. ! de t. poss. poss. poss.
IOO I
2
3 4 5
T o t a l
200 I 2
3 4 5 6
T o t a l
300 i 2
3 4 5 T o t a l
400 i 2
3 4 5 T o t a l
5oo i 2
3 4 5 T o t a l
600 I 2
3 4 5 T o t a l
o i 2
3 4 5 T o t a l
4 7 6 1.9 t .5 289 1.7 o.8 444 1.8 1.6 275 l . r 0. 7 360 1.9 1.7 312 0.6 o.6
397 1.3 o.8
128o 1.8 1.6 1273 1.1 0. 7
191 2.1 2.1 378 1.6 l . [
449 2-5 1.8 34 ° 1.5 1.5 368 4.4 3 .8 278 3.6 2.5
320 3.1 2.2 188 2 2 1.1
lOO8 3.1 2.6 15o 4 2. 3 1. 7
716 6.6 5.8 305 4.6 4.0 467 3-4 3 .0 502 2.6 2.2 511 5.1 4 .0 497 6.0 4-9 229 2.6 2.2 322 I '3 0"9
247 2. 4 2.o
1923 4-9 4 .2 1873 3 .6 3 .0
24 ° 2.1 1. 3 283 1. 4 I . I 278 0. 7 0. 7 378 1.6 1.6 449 0-7 0.7 296 1.4 I .o
] 7 ° 0.6 0.6
967 I.O 0.8 1127 1. 3 1.2
436 I .I o.2 220 0. 5 o 556 1.3 0.7 203 I .o 0.5 256 0.8 0.8 2I 5 0.5 0.5
33 ° o.3 o.3
1248 I . I 0.6 968 0.5 o .3
403 0.3 0.3 269 0.7 0.4 396 0.5 0.3 225 0.9 0.5 256 0.8 0. 4 43 ° 1.2 o. 7
174 0.6 0.6 17o o o
lO55 0. 5 0. 3 1268 0.8 0.5
432 0.2 o.2 276 0. 4 o 223 0.5 o 226 0. 4 0.4 462 o o 293 0.3 0.3
275 0.4 o 336 o o
1 1 1 7 0.2 o . I 14o6 0. 3 o . I
277 r.8 1.8 315 1.6 1.6 293 1.4 I.O 288 [.4 ° .7 235 1.7 0.9
14o8 1.6 1.2
3.55 2.8 2.3 254 1.6 0.8 259 2.3 t .o 246 2. 4 1.6 244 2.5 2..5 275 1.8 i .S
1633 2.3 1.7
2.58 1.6 [ .2 361 1.I [.1 264 2.7 2. 7 266 I 9 ['.5
369 3..5 3 .0
I 5 [ 8 2.2 2.0
1 8 2 0.6 O
165 1.2 1,2
324 3.1 2.8 284 1.8 1.1 29 ° 1.4 [ .o
1245 1.8 1. 4
174 2. 3 1.8 384 2.3 [ .8 426 2. 3 1.9 202 I .O I .O I21 1. 7 0.8
13o 7 2.1 1.6
152 3.3- 2.0 102 [ .0 I,O 328 1.2 0.6 248 0.8 0. 4 221 2. 3 I "4
l O 5 I 1.6 1.0
1 2 0 O O
I I 7 O O
22I 0. 5 0. 5 286 0 o 269 0.4 o
1013 0.2 o.1
i n t h e I l lOUSe 25, u s i n g M E R E D I T I t ' S m e t h o d a f t e r d o s e s o f o , 2 0 0 a n d 5 o o t a d X - r a y s ,
w h i c h s h o w e d t h a t o u r d a t a o n t h e m o u s e w e r e i n g o o d a g r e e m e n t w i t h t h o s e o f
L E O N A R D A N D D E K N U D T is, E V A N S et al. 1° a n d M U R A M A T S U et a l .2L w h o u s e d d o s e -
SPECIES COMPARISONS IN SPERMATOGONIA 415
£
3
u
5
/ / ,
2
/ , i , 0
6O0
A /
/ / / / \$ / d / 1
0 100 200 300 Z,00 500 100 200 300 ~00 500 600
X- RAY DOE X- RAY DOSE
Fig. 5. Dose-response curves for translocations induced by X-rays in spermatogonia of different mammalian species ; definite and possible translocations. ©, rabbit; *, guinea-pig; O, golden ham- ster.
Fig. 6. Dose-response curves for translocations induced by X-rays in spermatogonia of different mammalian species; definite translocations. G, Rabbit; *, guinea-pig; 0, golden hamster.
18
o15 •
|
1 2 • •
m • • • •
o
3 •
• .... i ~ . ,| .......... i ......... l i 0 2 0 0 4 0 0 6 0 0 8 0 0 1 0 0 0 1 2 0 0 1 4 0 0
X - r a y d o s e
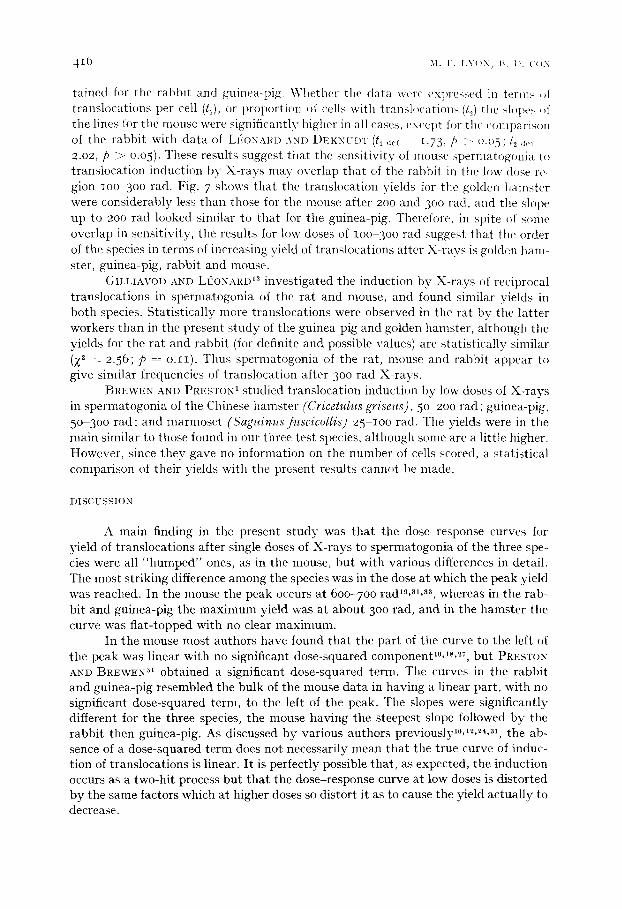
F i g . 7 . A c o m p a r i s o n o f t h e d o s e - r e s p o n s e c u r v e s for X - r a y - i n d u c e d t r a n s l o c a t i o n s in s p e r m a t o g o - n i a of t h e r a b b i t (c:), g u i n e a - p i g (A), g o l d e n h a m s t e r (©), m o u s e ( O ) .
T A B L E I V
V A L U E S O F R E G R E S S I O N L I N E S F O R T R A N S L O C A T I O N I N D U C T I O N I N M O U S E S P E R M A T O G O N I A
Proportion of cells Translocations with translocations (t2) per cell ( t l )
LEONARD AND DEKNUDT 17 (I.85 4- 0.22) XO -4 (I.92 ~ 0.22) 10 -4 EVA~'S et al. ~ (2.27 J= o.44) ~o-* (2-90 i 0.34) lO .4 MURAMATSU et al, 2~ (2.45 i 0.20) lO -4 (2.51 ± o,2o) IO-*
rates similar to our own. Their data fitted a linear relationship over the dose range where translocation yield increases with dose. Since these three groups of workers were us ing different strains of mice, in different laboratories, regression lines from their data have been calculated separately (Table IV), and compared with those ob-
4 1 6 M.F . L','t)N, B. l~. ( l)N
tained for tile rabbit and guinea-pig. Whether tile data were expressed in terms ,~1 translocations per cell (1~), or proportion of (:ells with transhwations (re) the slopes ,~1 the lines for the mouse were significantly higher in all cases, except for the comparison of the rabbit with da ta of I.J:;O~'At~D AND DEKNUIIT ( t 1 , l e t : 1.73,/~ o.o5; t2 , > r 2.02, p >- o.05). These results suggest tha t the -.'ensitivity of mouse spermatogonia to t ranslocation induction by X-rays nlay overlap tha t of the rabbit in the low dose re- gion lOO-3OO rad. Fig. 7 shows tha t the translocation yields for the golden hamster were considerably less than those for the mouse after 200 and 3oo rad, and the slope up to 200 rad looked similar to tha t for the guinea-pig. Therefore, in spite of some overlap in sensitivity, the results for low doses of lOO 3o0 rad suggest tha t the order of the species in terms of increasing yield of translocations after X-ravs is golden ham- ster, guinea-pig, rabbit and mouse.
GILLIAVOI) AND LI~ONARD la investigated the induction by X-rays of reciprocal translocations in spermatogonia of the rat and nlouse, and found similar yields in bo th species. Statistically more translocations were observed in the rat by the latter workers than in the present s tudy of the guinea-pig and golden hamster, a l though the yields for the rat and rabbit (for definite and possible values) are statistically similar (2 ~ - : 2.56; p -- o . I I ) . Thus spermatogonia of the rat, mouse and rabbit appear to give similar frequencies of t ranslocation after 3oo rad X-rays.
BREWEN AND PRI~STON ~ studied translocation induction by low doses of X-rays in spermatogonia of the Chinese hamster (Cricetulus griseus), 5o 2oo rad; guinea-pig, 5o 3oo rad; and marmoset (Saguim,ts fuscicollis) 25 IOO rad. The yields were in the main similar to those found in our three test species, al though some are a little higher. However, since they gave no information on the number of cells scored, a statistical comparison of their yields with the present results cannot be made.
DISCUSSION
A main finding in the present s tudy was tha t the dose-response curves for yield of translocations after single doses of X-rays to spermatogonia of the three spe- cies were all " h u m p e d " ones, as in the mouse, but with various differences in detail. The most striking difference among the species was in the dose at which the peak yield was reached. In the mouse the peak occurs at 600-700 radlg,al, 3a, whereas in the rab- bit and guinea-pig the m a x i m um yield was at about 3o0 rad, and in the hamster tile curve was flat- topped with no clear maxinmm.
In the mouse most authors have found tha t the par t of the curve to tile left of the peak was linear with no significant dose-squared componentl°,lS,% but PRESTON AND BREWEN al obtained a significant dose-squared term. The curves in the rabbit and guinea-pig resembled the bulk of the mouse data in having a linear part , with no significant dose-squared term, to the left of the peak. The slopes were significantly different for the three species, the mouse having the steepest slope followed by the rabbit then guinea-pig. As discussed by various authors previouslyt°,1%~, 3~, the ab- sence of a dose-squared term does not necessarily mean tha t the true curve of induc- tion of translocations is linear. I t is perfectly possible that , as expected, the induction occurs as a two-hit process bu t tha t the dose-response curve at low doses is distorted by the same factors which at higher doses so distort it as to cause the yield actual ly to decrease.
SPECIES COMPARISONS IN SPERMATOGONIA 417
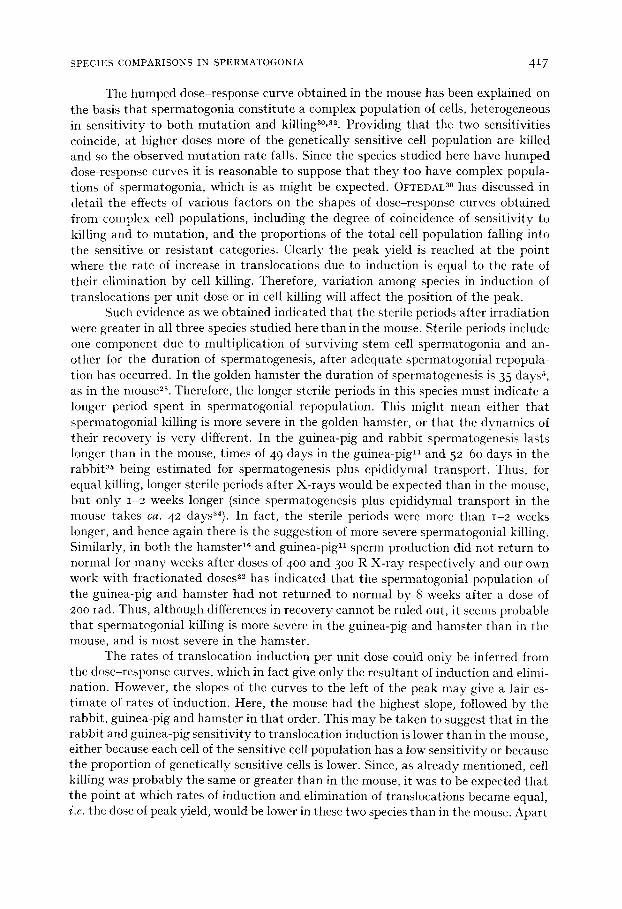
The humped dose-response curve obtained in the mouse has been explained on the basis that spermatogonia constitute a complex population of cells, heterogeneous in sensitivity to both mutation and killing3°, 32. Providing that the two sensitivities coincide, at higher doses more of the genetically sensitive cell population are killed and so the observed nmtation rate falls. Since the species studied here have humped dose-response curves it is reasonable to suppose that they too have complex popula- tions of spermatogonia, which is as might be expected. O~'TEDAL 3° has discussed in detail the effects of various factors on the shapes of dose-response curves obtained from complex cell populations, including the degree of coincidence of sensitivity to killing and to mutation, and the proportions of the total cell population falling into the sensitive or resistant categories. Clearly the peak yield is reached at the point where the rate of increase in translocations due to induction is equal to the rate of their elimination by cell killing. Therefore, variation among species in induction of translocations per unit dose or in cell killing will affect the position of the peak.
Such evidence as we obtained indicated that the sterile periods after irradiation were greater in all three species studied here than in the mouse. Sterile periods include one component due to multiplication of surviving stem cell spermatogonia and an- other for the duration of spermatogenesis, after adequate spermatogonial repopula- tion has occurred. In the golden hamster the duration of spermatogenesis is 35 day sS, as in the mouse 28. Therefore, the longer sterile periods in this species must indicate a longer period spent in spermatogonial repopulation. This might mean either that spermatogonial killing is more severe in the golden hamster, or that the dynamics of their recovery is very different. In the guinea-pig and rabbit spermatogenesis lasts longer than in the mouse, times of 49 days in the guinea-pig 11 and 52 6o days in the rabbit 35 being estimated for spermatogenesis plus epididymal transport. Thus, for equal killing, longer sterile periods after X-rays would be expected than in the mouse, but only 1-2 weeks longer (since spermatogenesis plus epididymal transport in the mouse takes ca. 42 daysa4). In fact, the sterile periods were more than I 2 weeks longer, and hence again there is the suggestion of more severe spermatogonial killing. Similarly, in both the hamster 16 and guinea-pig n sperm production did not return to normal for many weeks after doses of 4oo and 3oo R X-ray respectively and our own work with fractionated doses '22 has indicated that the spermatogonial population of the guinea-pig and hamster had not returned to normal by 8 weeks after a dose of 2oo rad. Thus, although differences in recovery cannot be ruled out, it seems probable that spermatogonial killing is more severe in the guinea-pig and hamster than in the mouse, and is most severe in the hamster.
The rates of translocation induction per unit dose could only be inferred from the dose-response curves, which in fact give only the resultant of induction and elimi- nation. However, the slopes of the curves to the left of the peak may give a fair es- timate of rates of induction. Here, the mouse had the highest slope, followed by the rabbit, guinea-pig and hamster in that order. This may be taken to suggest that in the rabbit and guinea-pig sensitivity to translocation induction is lower than in the mouse, either because each cell of the sensitive cell population has a low sensitivity or because the proportion of genetically sensitive cells is lower. Since, as already mentioned, cell killing was probably the same or greater than in the mouse, it was to be expected that the point at which rates of induction and elimination of translocations became equal, i .e . the dose of peak yield, would be lower in these two species than in the mouse. Apart
4z8 M.F.I.Y()N~ I;. 1~. C{~x
from tile posi t ion of t i le peak the slopes of tile curves in ti le r abb i t and guinea-pig wen' ve ry similar to t ha t in ti le mouse. In view of OFTEDAL'S a° discussion of the effect ol changes in the charac ter i s t ics of the cell popu la t ion on the shape of the curve, this suggests tha t , a p a r t from exact levels of sensi t ivi ty , t i le r abb i t ' s and guinea-pig ' s spe rmatogon ia l popu la t ions m a y be fa i r ly s imilar to tha t of the mouse. An unexpla ined fact is t ha t the dose of peak yie ld in the guinea-pig appea red ti le same as in the rabb i t , a l though the slope to the left of the peak was lower in the guinea-pig. Since our da t a on spe rmatogon ia l ki l l ing are ve ry meagre, it is possible tha t the two species do differ somewha t in this respect .
The dose- response curve for golden hamste rs was ra the r different, however, in being nmch flat ter , never reaching a high value and ye t ac tua l ly giving grea te r yields at high doses t han the o ther species. As a l r eady ment ioned it is p robab le t ha t cell ki l l ing was most severe in hamsters . This could be due to a more dras t ic kil l ing of the sensi t ive section, or to a spread of kil l ing to a wider sect ion of the cell popula t ion . If the former, the dose of peak yie ld would be moved to the left, bu t there would be no exp lana t ion of the a l te red shape and the higher yield of t r ans loca t ion at high doses. The l a t t e r poss ib i l i ty could provide some exp lana t ion of the f la t tened curve since it would mean t h a t the sensi t ivi t ies to kil l ing and to genet ic effects were now non- coincident and OFTEDAL a° has shown tha t non-coincidence can lead to the observed t ype of f lat tening. In addi t ion , as far as can be judged, the slope of the curve to the left of the peak m a y be lower in hamsters , i .e. the sens i t iv i ty per cell to t r ans loca t ion induct ion or the p ropor t ion of genet ical ly sensi t ive cells m a y be low. If t rue, this would also t end to move the peak of the curve to the left and accen tua te the flat- tening. Yet ano ther poss ib i l i ty is t ha t the " r e s i s t an t " cells might in fact have an ap- preciable sens i t iv i ty not only to kil l ing bu t to t rans loca t ion induct ion. If this were so, the curve of t rans loca t ion yield would rise once more at doses above those used in this work. However , af ter var ious types of f r ac t iona ted doses the hams te r gave results s imilar to those from the guinea-pig 2.. In par t icu la r , there was no evidence t ha t the sens i t iv i ty to t rans loca t ion induct ion was lower in the hamster , or t ha t the " r e s i s t an t " cells were more sensi t ive to t rans loca t ion induct ion. Thus, it seeins probable t ha t the s imples t exp lana t ion for the difference between the species, t ha t of grea ter cell ki l l ing leading to non-coincidence of sensi t ivi t ies in the hamster , is the correct one.
Thus, the forms of the curves could be explained by the postulates that in all three species studied here the induction of translocations per unit dose is lower than in the mouse, and that in addit ion there is higher sensit ivity to kill ing, in the hamster part icular ly among cells not sensitive to translocation induction.
I t is also possible that the only difference among tile species is in spermato- gonial kill ing, and that the varying slopes of the curves to the ]eft and the r ight of the close of peak yield can be explained by this alone.
In work wi th post-meiotic germ cells, part icular ly spermatozoa, the four species seemed to have the same relative order of sensit ivity to translocation induction Le. mouse (highest), rabbit, guinea-pig, hamsterL This is of interest in relation to human hazards, and the question whether measurements of damage in one type of cell can be used to extrapolate to another. I t might be that the differences we have observed are due to intrinsic differences in all the cells, or at least all the spermatogenic cells, of the species to chromosome breakage and rejoining. However , in fact the appa ren t similar-
SPECIES COMPARISONS IN S P E R M A T O G O N I A 419
ity may be false and great caution is needed. Spermatozoa form a relatively simple population of cells and any genetic damage in them is expressed at the formation of a zygote, without any intervening cell divisions and cell selection. By contrast, many cell divisions intervene between the induction of translocations in spermatogonia and their later observation in spermatocytes. In addition, there may be severe killing of spermatogonia, allowing selection against sensitive cell types. We have already dis- cussed the drastic effects of this selection on the dose-response curve at high doses, and there may be some effect at low doses. The elimination need not necessarily be due to a direct cell killing effect of the radiation. In addition, the inhibition of sper- matogenesis seen in sterile translocationsS, -03 could result in either a partial or total elimination of these. Moreover, among heterozygotes for translocations induced in post-meiotic cells, some cells carrying a translocation showed no multivalent confi- guration at meiosis; the frequency of this being highest in hamsters in which as many as 42~o of translocation bearing cells showed no multivalent 8. I t is reasonable to sup- pose tha t translocations induced in spermatogonia may behave similarly, since the frequencies of rings and chains in post-meiotic and gonially induced translocations of the various species were correlated. This would mean that the observed yields in spermatogonia are underscored through failure of multivalent formation, and the degree of underscoring as well as amount of elimination will vary with species. In particular, the hamster appeared to have the lowest yield of translocations both in spermatozoa and in spermatogonia, but it also had the highest cell killing and the highest proportion of translocation-bearing cells not showing a multivalent, and so it is possible that its spermatogonia are not in fact the least sensitive to translocation induction. Furthermore, even if the true rate of induction of translocations in sper- matogonia could be established, then variations among species could occur through differences either in intrinsic sensitivity per cell, or in the proportions of cells falling into sensitive or resistant populations.
I t would be valuable if one could pin-point the factors underlying the observed differences among the species and thereby enable the prediction of the sensitivity of untested species. BREWEN AND PRESTON 1 suggested that sensitivity to translocation induction among mammalian species was proportional to chromosome arm number. However, the present data for spermatogonia and the previous data for post-meiotic cells do not support this theory, since the arm numbers are: mouse 40; rabbit 80; guinea-pig 64 and golden hamster 80. Possible reasons for this discrepancy have been discussed previously 7.
Another possible basis for prediction concerns the zoological relationship of the animals. The three species of rodents considered, tile mouse, golden hamster and guinea-pig, differed considerably. The species most closely related to the mouse, the hamster, differed from it the most, and the species nearest in sensitivity, the rabbit, was most distantly related. In at tempting to predict the genetic sensitivity of man it is obviously of interest to study primate species. However, great caution will be ne- cessary, since there may be as much, or more variation among primates as among the rodents studied here.
BREWEN et a l . 2 have recently studied frequencies of X-ray-induced transloca- tions in spermatogonia of humans and marmosets. They report that at low doses both species were at least twice as sensitive to translocation induction as the mouse, but the dose of peak yield was only about IOO tad. Conversely, in rhesus monkeys some data
42o ~l. i,. I.Y()N, I~. 1), (7~)X
of our own (unpublished) suggest low translocation frequencies with a peak vield at about 2oo tad.
Thus, the present work has not indicated a basis for predicti,g the sensitivit\ of an untested species. Species may differ in such factors as intracellular oxygen ten- sion, proportions of cells at wtrious stages of the mitotic cycle, intrinsic sensitivity tt, chromosome breakage and rejoining etc., but tiffs is not known. The karyotype of the golden hamster is remarkable for its many large blocks of constitutive heterochroma- tint% but whether this accounts for its ratber different genetic response to radiation is not known at present. BURKI '~ showed that radiation damage due to uptake of ~"'~'I UdR in cultured chinese hamster cells was more effective ia sterilising the <'ells if the l"SI UdR was incorporated in the late replicating DNA, which presumably included the constitutive heterochromatin. Therefore, further investigation of tim importance of constitutive heterochromatin in this context might prove rewarding.
ACKNOWLEDGEMENTS
We are very grateful to Mrs. J. NASH for technical assistance, to Mr. D. G. PAPWORXH for statistical help and to Mr. M. CORe and Mr. P. J. V. ADAMS for irradia- tions.
R E F E R E N C E S
I IBREWEN, J. G. AND R. J. PRESTON, Cytogenetic effects of environnlentaI nlutagcns in manlma- ]Man cells and the extrapolat ion to man, Mutation Res., 26 (1974) 297-304.
2 BREWEN, J. O., R. J. PRESTON AND N. GENGOZlAN, Analysis of X-ray induced chron10somal t ranslocat ions in h u m a n and marmose t spermatogonial s tem cells, Nature, 253 (197.5) 468-47 o.
3 BURKI, H J., Mammalian cells : Damage in late replicating DNA as the most efficient cause of reproduct ive death, Expll. Cell Res., 87 (1974) 277-280.
4 CATTANACH, B. M., Spermatogonial s tem cell killing in the ntouse following single and fraction ated X-ray (loses, as assessed by length of sterile period, Mutation Res., 25 (1974) 53-62.
5 CLERMONT, Y., AND M. TROTT, Durat ion of the cycle of the senliniferous epithelium iu the mouse and hams te r determined by means of SH-thynlidine and radioautography, Fertil. and Sterih, 20 (1969) 805 819.
6 Cox, B. D., AND M. F. LYON, X-Ray induced dominan t lethal muta t ions in mature and imnla- ture oocytes of guinea-pigs and golden hanlsters, Mutation Res., 28 (I975) 421-436.
7 COX, B. D., AND M. F. LYON, The induction by X-rays of chromosome aberrat ions in m a k guinea-pigs, golden hamsters and rabbits , I. Dose response in post-meiotic stages: Mutation Res., 29 (1975) 93-1o9.
8 Cox, B. D., AND M. F. LYON, The induction by X-rays of chronlosome aberrat ions in male guinea-pigs, golden hamsters and rabbits, I I Properties of t ranslocations induced in post- meiotic stages, Mutation Res., 29 (1975) 111-125.
9 EVANS, F~. P., G. I~RECKON AND C. E. FORt), An air-drying method of meiotic preparat ions f rom manunal ian testes, Cytogeneties, 3 (1964) 289 294.
IO EVANS, t . I)., C. E. FORD, A. G. SEARLE AND B. J. WEST, Studies on the induction of transloca- tions iu mouse spermatogonia, I f I . Effects of X-irradiation, Mutation Res., 9 {197 o) 5 ol -5 o6-
I I FREUND, M., AND F. J. BORRELLI, The effects of X-irradiat ion on male fertility in the guinea- pig, Radiation Res., 22 (i964) 4o4 413 .
12 GERBER, G. B., AND A. LkONARD, Influence of selection, non-uniform cell populat ion and repair on dose-effect curves of genetic effects, ~gIulation Res., 12 (1971) 175-182.
13 GILLIAVOD, N., AND A. LkONARD, Etude des rdarrangenlents chromosomiques produi ts dans les spermatogonies du ra t et de la souris par une exposition aux rayon X, Canad. J. (;enet. C ytol., 14 (I972) 341-345 .
14 a s u , T. C., AND F. E. ARRIGHI, Distr ibut ion of const i tut ive heterochromat in in mammal ian chromosomes, Chromosoma (Berl.), 34 (1971) 243 233.
15 LkONARD, A., Radiation-induced translocations in spermatogonia of mice, .,XIutalion Rcs., I1 (t97 I) 7 r 88.
SPECIES COMPARISONS IN SPERMATOGONIA 42I
16 LEONARD, A., AND GH. DEKNUDT, L a radiosensibi l i td comparde des souris et h a m s t e r s males , Compt. Rend. Soc. Biol., 16o (1966) 22o9-2211.
17 LI~ONARD, A., AND GH. DEKNUDT, Meiotic ch romosome r e a r r a n g e m e n t s induced by i r radia t ion of spe rn la togon ia l s tages , Can. J. Genet. Cytol., 8 (1966) 52o-527.
18 LI~ONARD, A., AND GH. DEKNUDT, Rela t ion be tween t he X - r a y dose and the ra te of chromo- some r e a r r a n g e m e n t s in s p e r m a t o g o n i a of mice, Radiation Res., 32 (1967) 35-41.
19 L~ONARD, A., AND GH. DEKNUDT, Dose - re sponse re la t ionship for t r ans loca t ions induced by X- i r rad ia t ion in s p e r m a t o g o n i a of mice, Radiation Res., 4 ° (1969) 276-284.
20 LI~ONARD, A. AND GH. DEKNUDT, Pers i s t ence of ch romosome r e a r r a n g e m e n t s induced in male mice by X- i r rad ia t ion of p re -meio t i c ge rm cells, Mutation Res., 9 (I97 o) 127-133.
21 LYON, M. F., X - R a y induced d o m i n a n t le thal m u t a t i o n s in male guinae-pigs , h a m s t e r s and rabbi t s , Mutation Res., io (197 o) i 3 3 - i 4 o .
22 LYON, M. F., AND B. D. Cox, The induc t ion by X- r ays of ch romosome aber ra t ions in male gu inea-p igs and golden hams t e r s , IV. Dose - r e sponse for spe rma togon i a t r ea ted wi th f ract ion- a t ed doses, Mutation Res., in press.
23 LYON, M. F., AND R. MEREDITH, Au t osoma l t r ans loca t ions caus ing male s ter i l i ty and v iab le aneup lo idy in t he mouse , Cytogenetics, 5 (1966) 335-354.
24 LYON, M. F., AND T. MORRIS, Gene and ch romosome m u t a t i o n af ter large f rac t iona ted or un- f r ac t iona ted rad ia t ion doses to mouse spe rmatogon ia , Mutation Res., 8 (1969) 191--198.
25 LYON, M. F , AND B D SMITH, Species compar i sons concern ing r ad ia t ion - induced don l inan t le tha ls and ch romosome aberra t ions , Mutation Res , II (1971) 45-58.
26 MEREDITH, R., A s imple m e t h o d for p r epa r ing meiot ic ch romosomes f rom m a m m a l i a n test is , Chromosoma, 26 (1969) 254 258.
27 MURAMATSU, S., W. NAKAMURA AND H. J~TO, Rad ia t i on induced t r ans loca t ions in mouse spe rmatogon ia , Jap. J. Genet., 46 (1971) 281-283.
28 OAKBERa, E. F., A descr ip t ion of spermiogenes is in t he mouse and i ts use in ana lys i s of t he cycle of t he semini ferous ep i the l ium and ge rm cell renewal, A mer. J. Anat., 99 (1956) 391-414.
29 OAKBERG, E. F., AND E. CLARK, Species compar i sons of rad ia t ion response of t he gonads , in W. D. CARLSON AND F. X. GASSNER (Eds.), Effects of Radiation on the Reproductive System, Pergan lon , Oxford, 1964, pp. II 24.
3o OFTEDAL, P., A theore t ica l s t u d y of m u t a n t yield and cell kill ing af ter t r e a t m e n t of he terogene- ous cell popula t ions , Hereditas, 60 (1968) 177-21o.
31 PRESTOY, R. J., A~D J. G. BREWED, X - R a y induced t rans loca t ions in spe rmatogon ia , i . Dose a n d / r a c t i o n a t i o n responses in mice, Mutation Res., 19 (1973) 215 223.
32 RUSSELL, W'. L., L a c k of l inear i ty be tween m u t a t i o n ra te and dose for X - r a y induced m u t a t i o n s in mice, Genetics, 41 (i956) 658-659.
33 SAVKOVlC, N. V., AND M. F. LYON, Dose - r e sponse curve for X - r a y induced t rans loca t ions in m o u s e spe rma togon ia , I. Single doses, Mutation Res., 9 (197 o) 4o7-4o9 .
34 SIRLIN, J. L., AND R. G. EDWARDS, Sens i t iv i ty of i m m a t u r e mouse spe rm to the m u t a g e n i c effects of X-rays , Nature, 179 (1957) 725-727 .
35 SWlERSTRA, E. E., AND R. H. FOOTE, Dura t ion of spe rma togenes i s and s p e r m a t o z o a n t r a n s p o r t in the rabb i t based on cytological changes , D N A syn thes i s and label l ing wi th t r i t i a ted t h y m i - dine, Amer. J. Anat., 116 (1965) 4Ol-412.