Embed Size (px)
Citation preview

The Indianapolis Deep Tunnel
Surge Analysis: Debugging
Future Operational Issues in the
Present
Karen Ridgway, P.E., Applied Science Inc.
Chris Ranck, P.E., BCEE, D.WRE, RW Armstrong
Dave Klunzinger, P.E., DLZ
John Morgan, Citizens Water
June 20, 2012
Agenda
• Background – The Indianapolis Tunnel
System & The TAP Model
• Precursors to TAP Analysis
• TAP Analysis
• TAP Model Refinements
• TAP Results – Recommended Surge
Strategy
• Discussion

Background – Why Do a Surge Analysis?
Background – The TAP Model (Transient Analysis Program)
• State-of-the-Art Computational Hydraulics
Program
• Fully-dynamic one-dimensional program
• Uses a finite-volume solution technique
• Properly simulates open channel and pressurized
wave fronts created during rapid filling
• Validated to laboratory data, Method of
Characteristics (MOC) and Implicit Methods (i.e.
WHAMO)
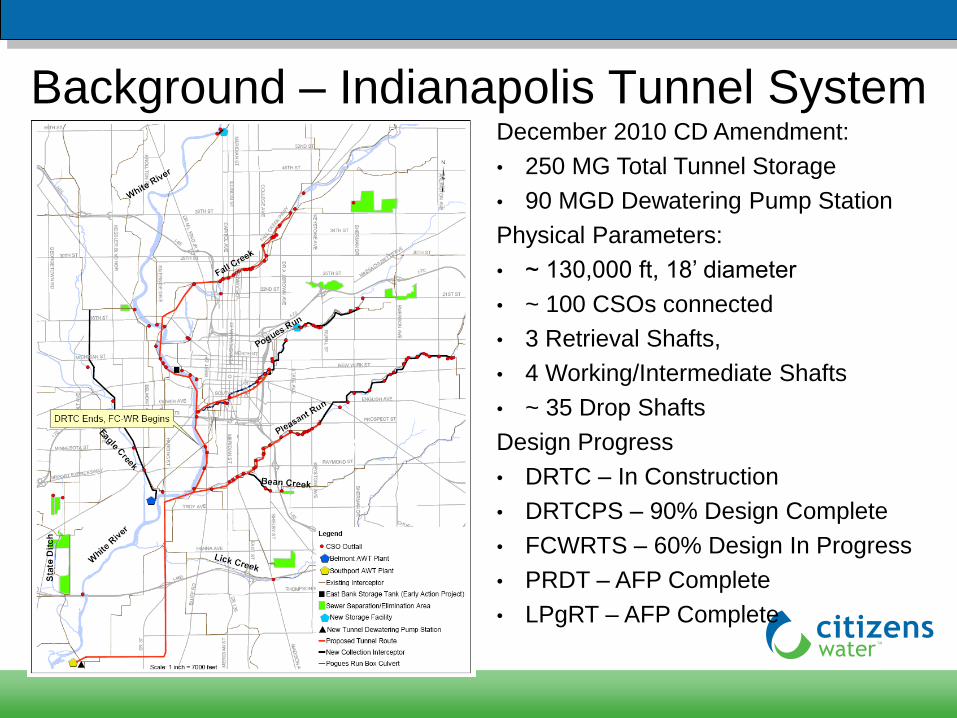
Background – Indianapolis Tunnel System December 2010 CD Amendment:
• 250 MG Total Tunnel Storage
• 90 MGD Dewatering Pump Station
Physical Parameters:
• ~ 130,000 ft, 18’ diameter
• ~ 100 CSOs connected
• 3 Retrieval Shafts,
• 4 Working/Intermediate Shafts
• ~ 35 Drop Shafts
Design Progress
• DRTC – In Construction
• DRTCPS – 90% Design Complete
• FCWRTS – 60% Design In Progress
• PRDT – AFP Complete
• LPgRT – AFP Complete
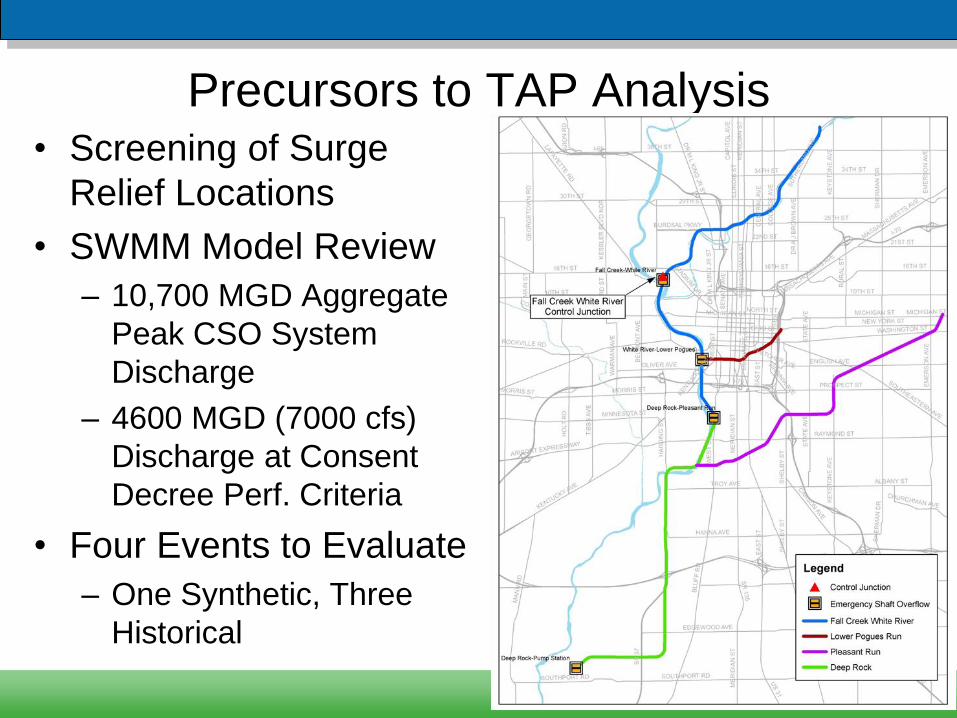
Precursors to TAP Analysis • Screening of Surge
Relief Locations
• SWMM Model Review
– 10,700 MGD Aggregate
Peak CSO System
Discharge
– 4600 MGD (7000 cfs)
Discharge at Consent
Decree Perf. Criteria
• Four Events to Evaluate
– One Synthetic, Three
Historical
TAP Analysis
• Level 1 – Tunnel Only
• Level 2 – Tunnel & Drop Shafts
• Level 3 – Tunnel, Drop Shafts, Consolidation
Sewers, CSO Outfalls, CSO Weirs
• Level 4 – Ventilation
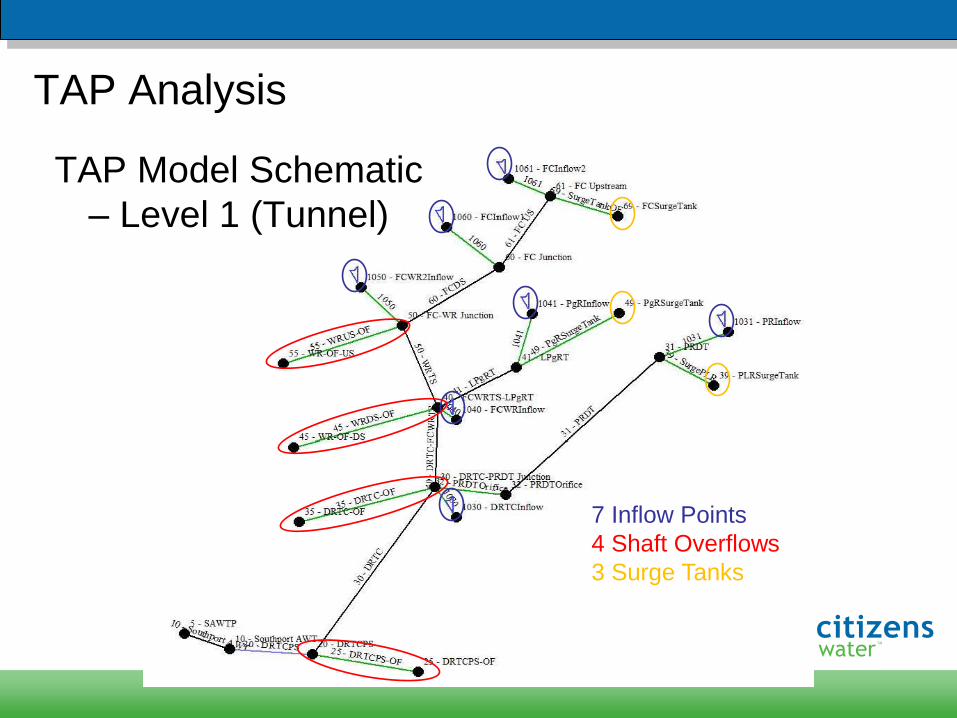
TAP Model Schematic
– Level 1 (Tunnel)
7 Inflow Points
4 Shaft Overflows
3 Surge Tanks
TAP Analysis
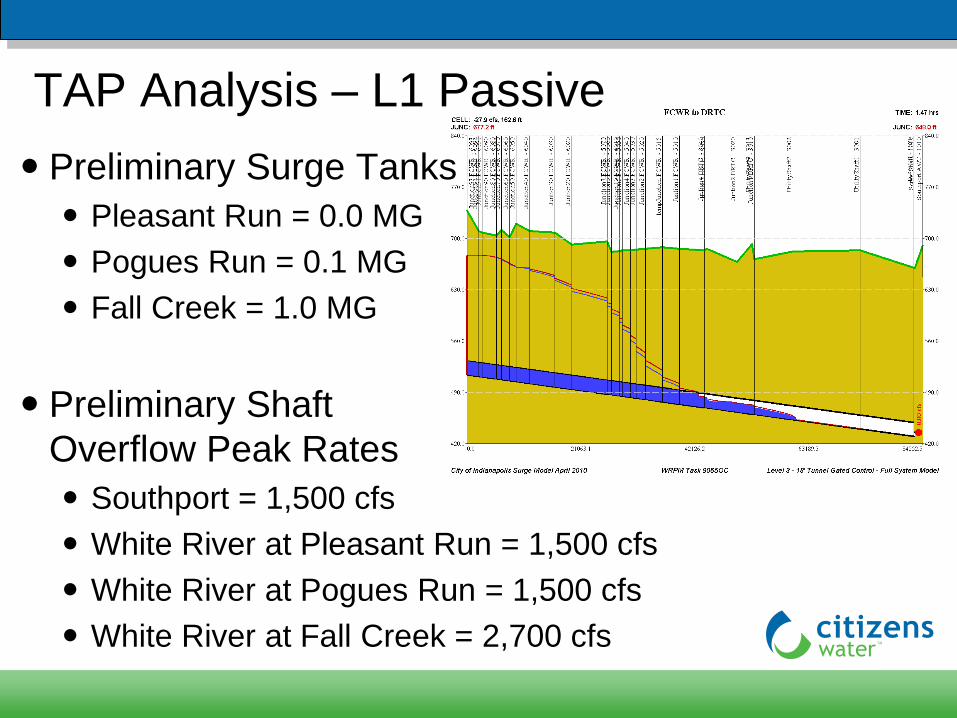
Preliminary Surge Tanks
Pleasant Run = 0.0 MG
Pogues Run = 0.1 MG
Fall Creek = 1.0 MG
Preliminary Shaft
Overflow Peak Rates
Southport = 1,500 cfs
White River at Pleasant Run = 1,500 cfs
White River at Pogues Run = 1,500 cfs
White River at Fall Creek = 2,700 cfs
TAP Analysis – L1 Passive
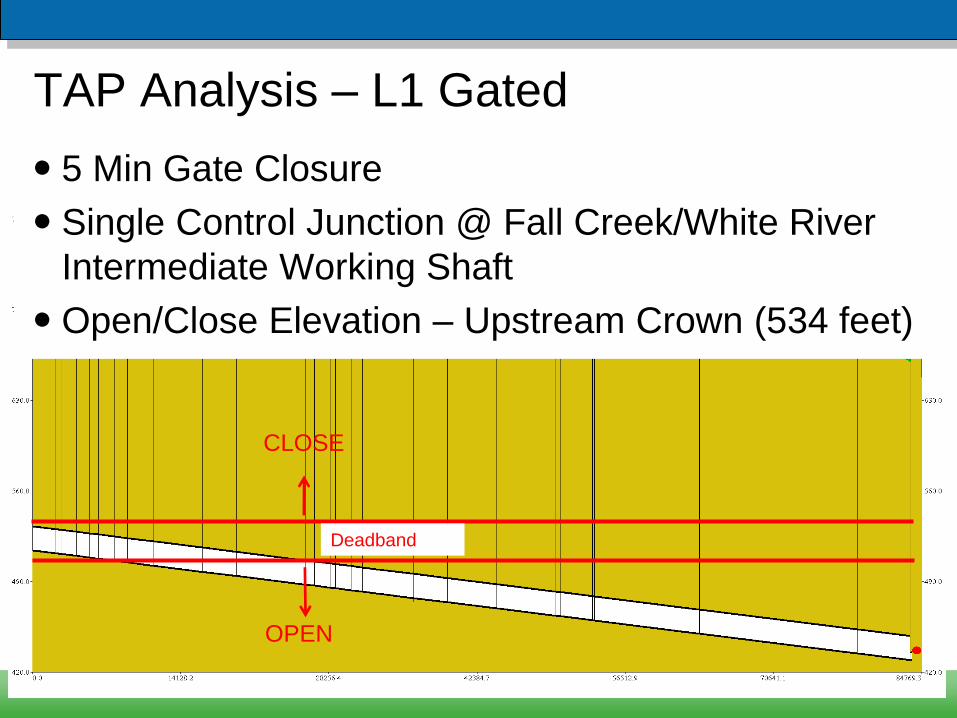
OPEN
CLOSE
Deadband
5 Min Gate Closure
Single Control Junction @ Fall Creek/White River
Intermediate Working Shaft
Open/Close Elevation – Upstream Crown (534 feet)
TAP Analysis – L1 Gated
No Surge Tanks Required
Shaft Overflows May be Necessary if Too Many
Gates Fail
Gates Need to Convey the Flow Rate for the Consent
Decree Perf. Criteria (~4600 MGD)
18’ Tunnel System Cannot Convey 10,700 MGD
Peak – Restriction at Drop Shafts or Consolidation
Sewers are Required
TAP Analysis – L1 Gated
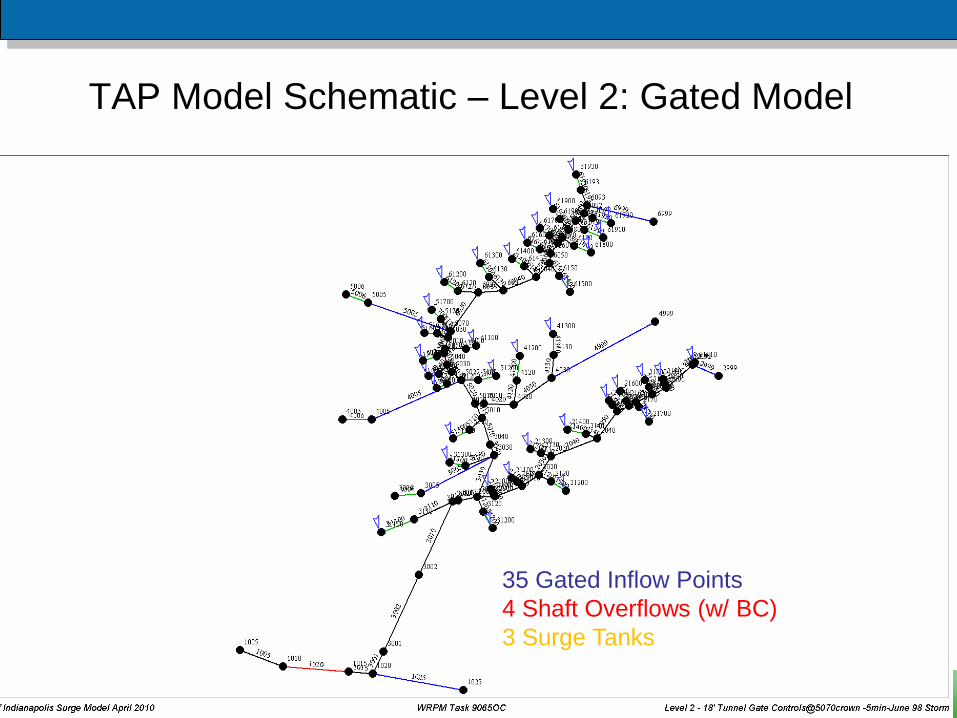
TAP Model Schematic – Level 2: Gated Model
35 Gated Inflow Points
4 Shaft Overflows (w/ BC)
3 Surge Tanks
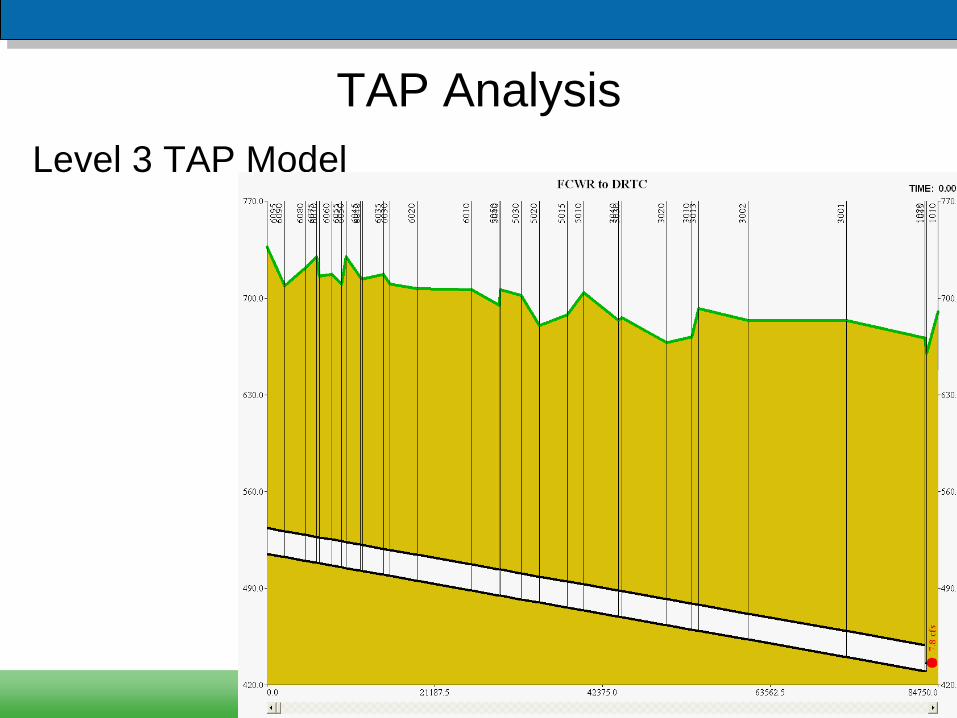
TAP Analysis
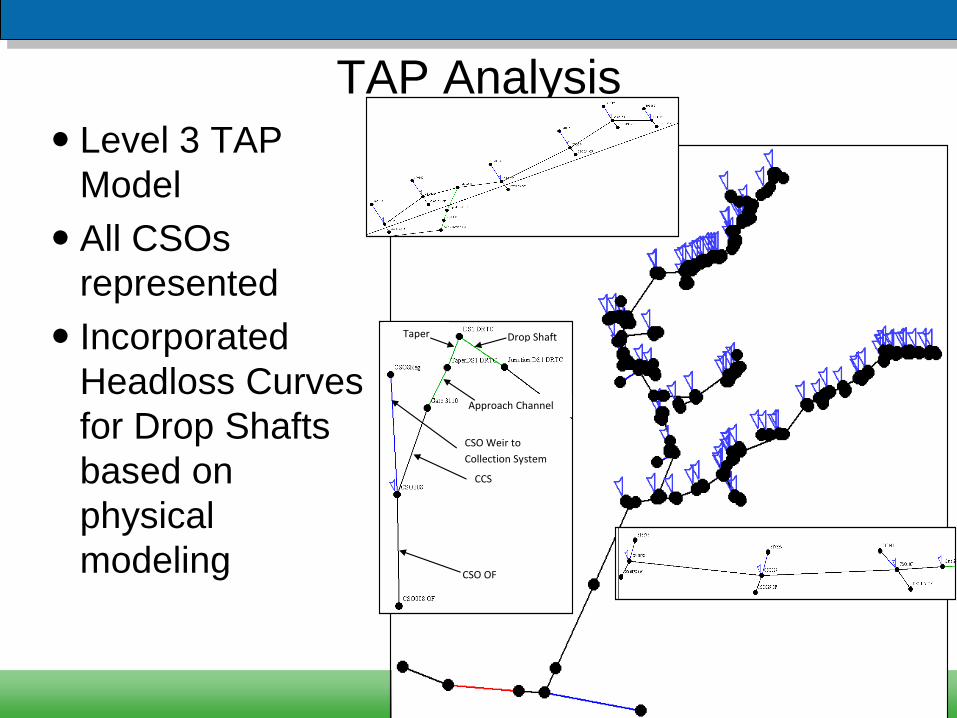
Level 3 TAP
Model
All CSOs
represented
Incorporated
Headloss Curves
for Drop Shafts
based on
physical
modeling
CSO Weir to
Collection System
CSO OF
Approach Channel
Taper
Channel
Drop Shaft
CCS
TAP Analysis
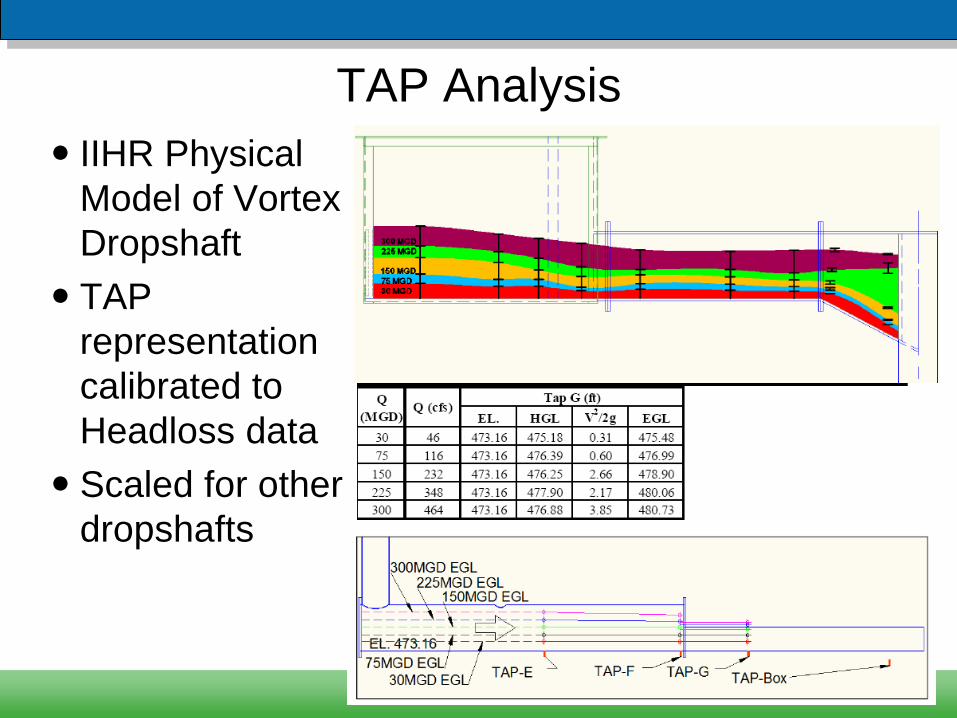
IIHR Physical
Model of Vortex
Dropshaft
TAP
representation
calibrated to
Headloss data
Scaled for other
dropshafts
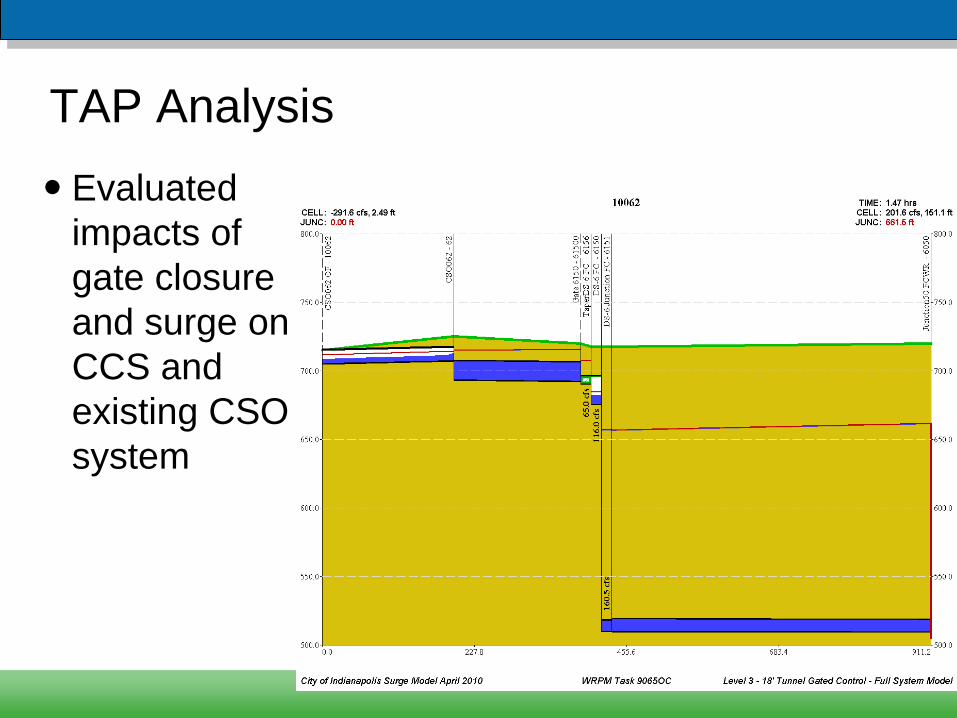
Evaluated
impacts of
gate closure
and surge on
CCS and
existing CSO
system
TAP Analysis
TAP Analysis
Level 3 TAP Model
TAP Analysis
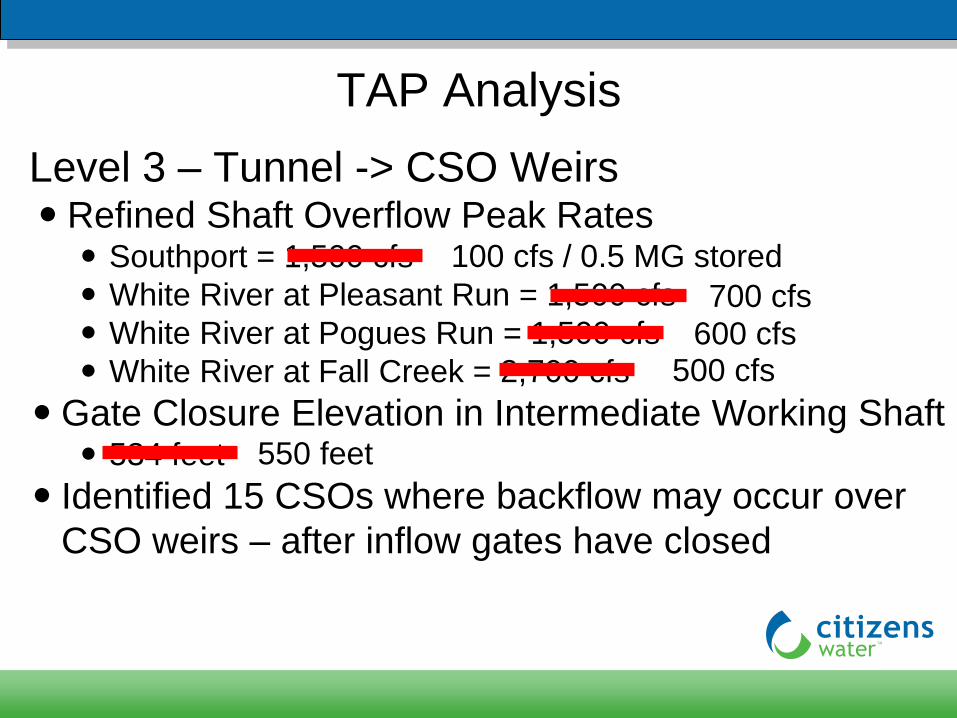
Level 3 – Tunnel -> CSO Weirs Refined Shaft Overflow Peak Rates
Southport = 1,500 cfs
White River at Pleasant Run = 1,500 cfs
White River at Pogues Run = 1,500 cfs
White River at Fall Creek = 2,700 cfs
Gate Closure Elevation in Intermediate Working Shaft 534 feet
Identified 15 CSOs where backflow may occur over
CSO weirs – after inflow gates have closed
100 cfs / 0.5 MG stored
700 cfs
600 cfs 500 cfs
550 feet
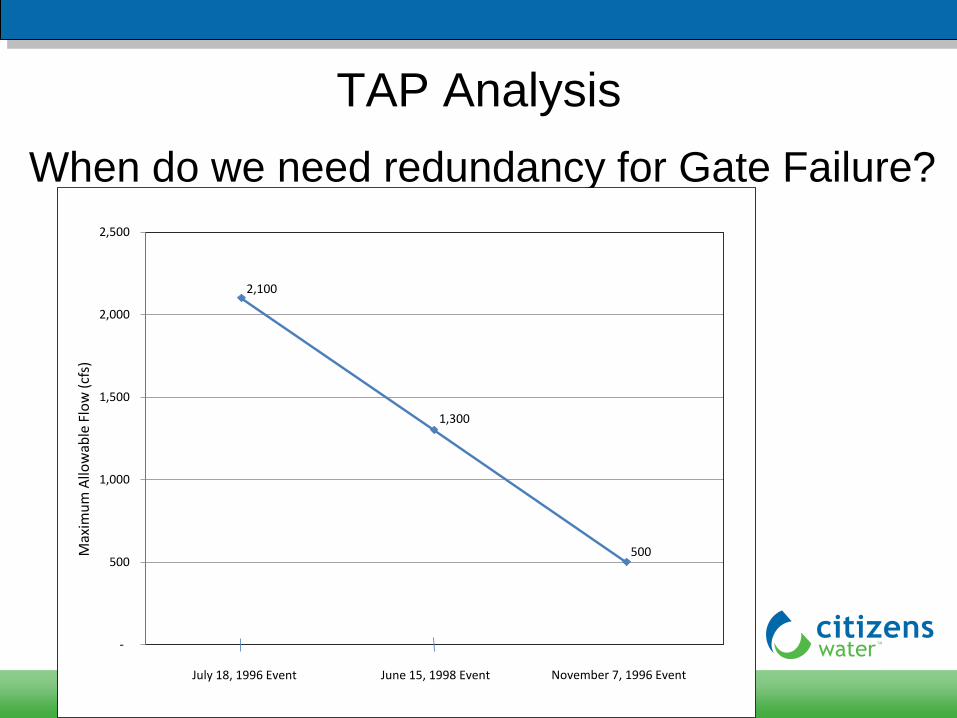
TAP Analysis
When do we need redundancy for Gate Failure?
2,100
1,300
500
-
500
1,000
1,500
2,000
2,500
Max
imu
m A
llow
able
Flo
w (
cfs)
July 18, 1996 Event June 15, 1998 Event November 7, 1996 Event
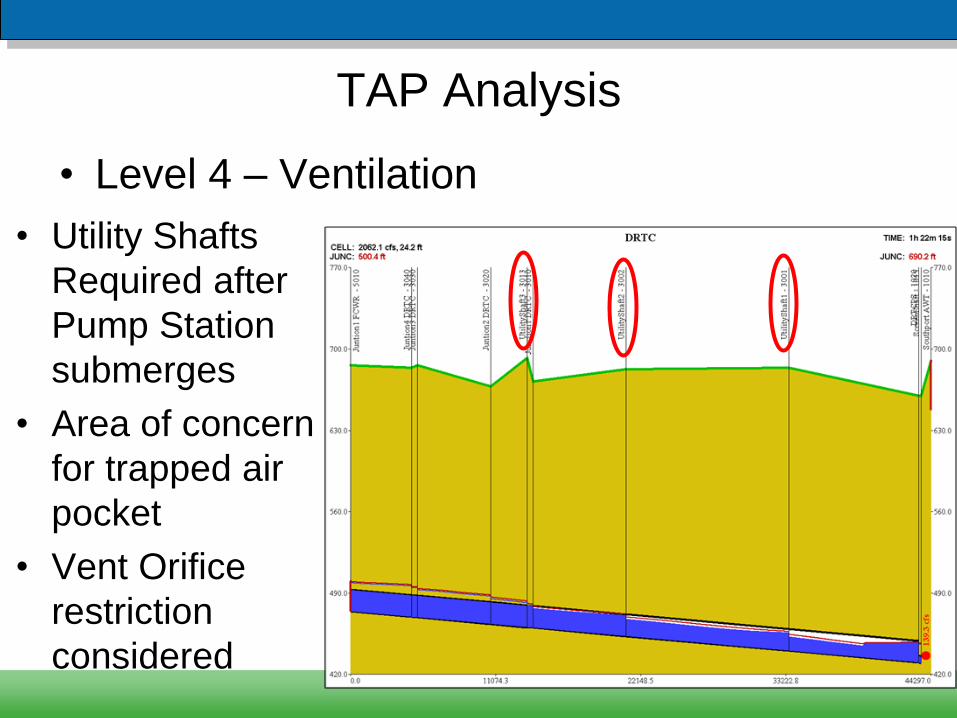
TAP Analysis
• Level 4 – Ventilation
• Utility Shafts
Required after
Pump Station
submerges
• Area of concern
for trapped air
• Vent Orifice
restriction
considered
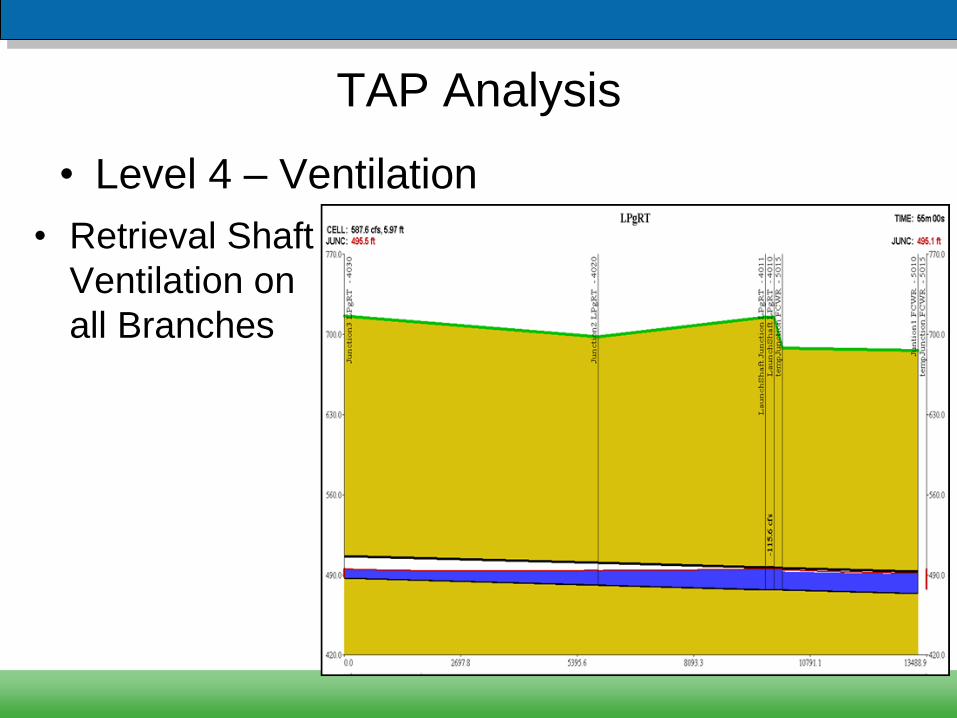
TAP Analysis
• Level 4 – Ventilation
• Retrieval Shaft
Ventilation on
all Branches
TAP Model Refinements
• Model Size
• 250 Junctions -> 450 Junctions
• 150 Conduits -> 250 Conduits
• Air Volume Tracking
– Volume of water & air reported in all conduits at all
time steps
– Allows for post-processing to track movement of air
and calculate ventilation rates in shafts
Recommended Surge Strategy
• Restrict peak inflow to tunnel system – 18’
Tunnel has capacity for peak inflow per the
Consent Decree requirement
• Inflow Gates at all Drop Shafts
• Central Monitoring Point at Intermediate Working
Shaft
• Redundancy for Inflow Gates
– Passive Shaft Overflows based on real storms
– Or Redundant Inflow Gates at largest drop shafts
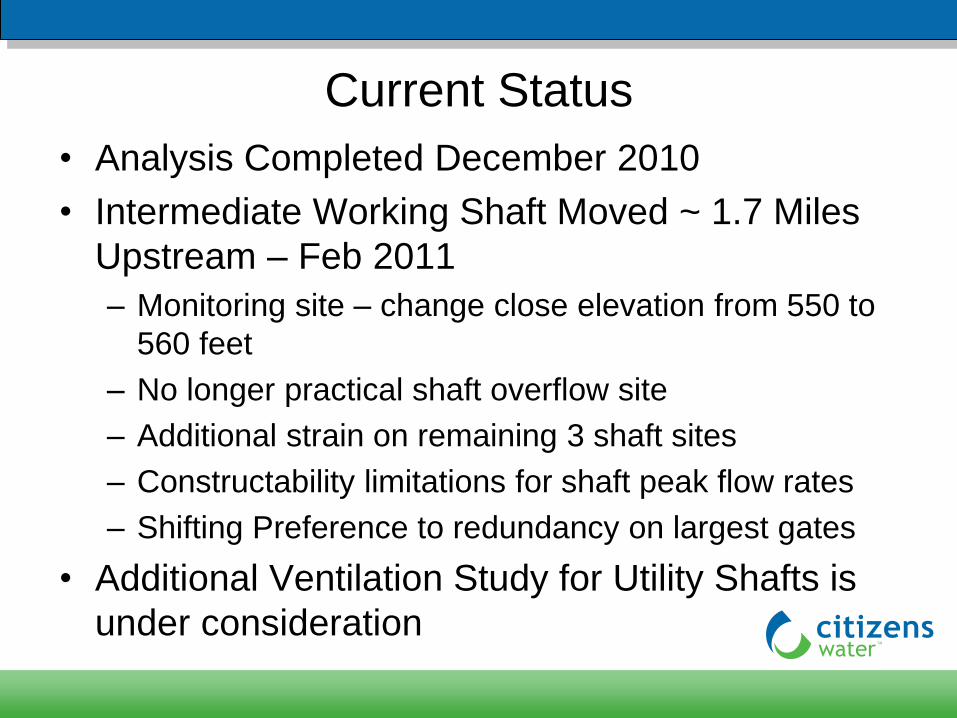
Current Status
• Analysis Completed December 2010
• Intermediate Working Shaft Moved ~ 1.7 Miles
Upstream – Feb 2011
– Monitoring site – change close elevation from 550 to
560 feet
– No longer practical shaft overflow site
– Additional strain on remaining 3 shaft sites
– Constructability limitations for shaft peak flow rates
– Shifting Preference to redundancy on largest gates
• Additional Ventilation Study for Utility Shafts is
under consideration
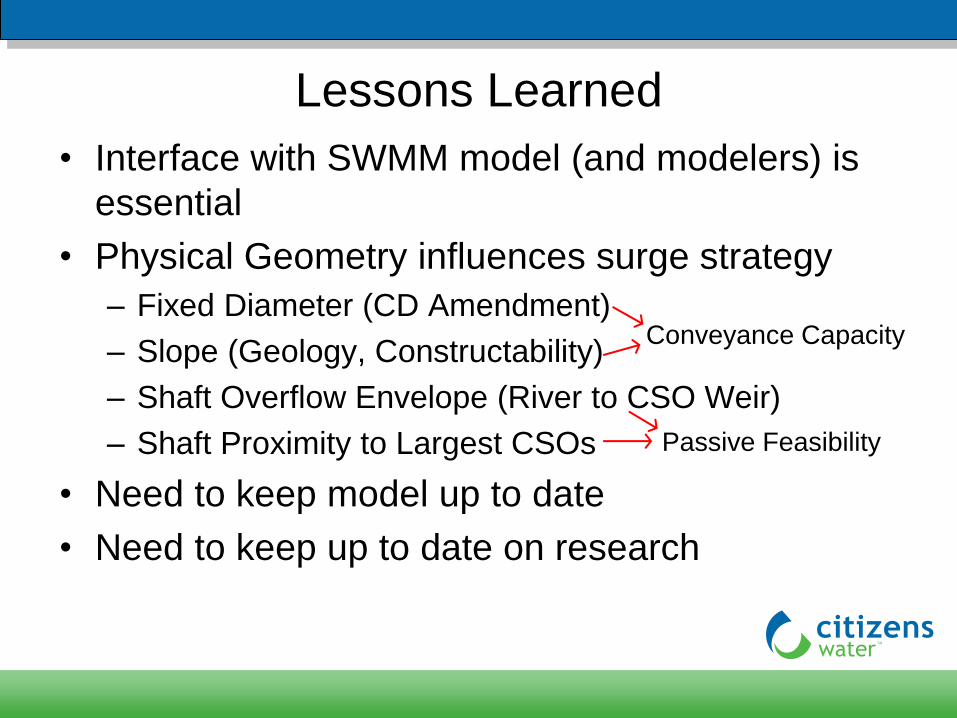
Lessons Learned
• Interface with SWMM model (and modelers) is
essential
• Physical Geometry influences surge strategy
– Fixed Diameter (CD Amendment)
– Slope (Geology, Constructability)
– Shaft Overflow Envelope (River to CSO Weir)
– Shaft Proximity to Largest CSOs
• Need to keep model up to date
• Need to keep up to date on research
Conveyance Capacity
Passive Feasibility
Acknowledgements
• John Morgan – Citizens Water
• Dave Klunzinger – DLZ
• Surge Modelers: Brittany Vrzina, Stephen Rowe
• Iowa Institute of Hydraulic Research (IIHR)
• Tunnel Designers: AECOM, Black & Veatch,
B&N

Discussion
• Questions?