Embed Size (px)
Citation preview

The Independent-Samples t Test
Chapter 11

Quick Test Reminder
> One person = Z score> One sample with population standard
deviation = Z test> One sample no population standard
deviation = single t-test> One sample test twice = paired samples
t

Independent Samples t-Test
> Used to compare two means in a between-groups design (i.e., each participant is in only one condition)• Remember that dependent t (paired
samples) is a repeated measures or within-groups design
Did you notice?
More about beer!

Between groups design
> In between groups, your sets of participant’s scores (i.e. group 1 versus group 2) have to be independent• Remember independence is the
assumption that my scores are completely unrelated to your scores

Quick Distributions Reminder
• Z = Distribution of scores• Z = distribution of means (for samples)• t = distribution of means (for samples with
estimated standard deviation)• t = distribution of differences between
paired scores (for paired samples with estimated standard deviation)
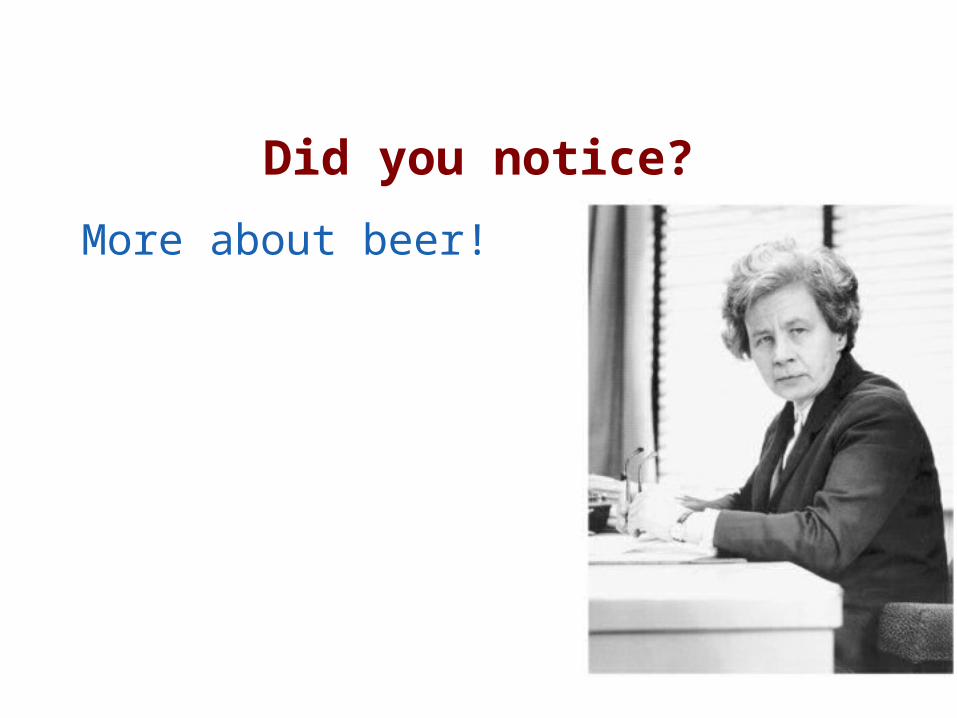
• t = distribution of differences between means (for two groups independent t)
Distribution of Differences Between Means

Hypothesis Tests & Distributions
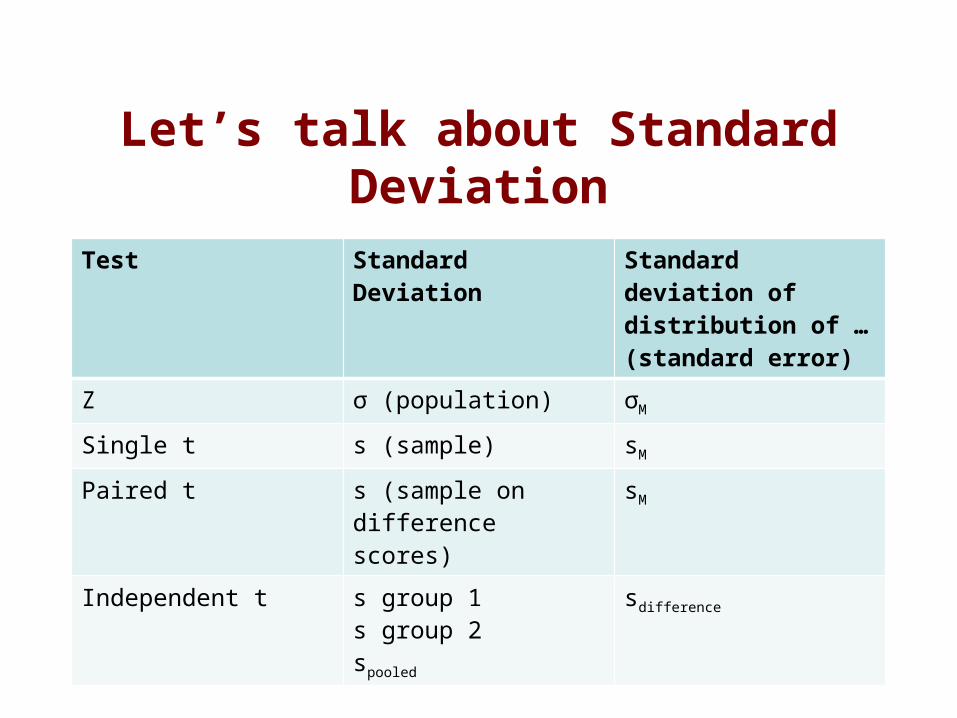
Let’s talk about Standard Deviation
Test Standard Deviation Standard deviation of distribution of …(standard error)
Z σ (population) σM
Single t s (sample) sM
Paired t s (sample on difference scores)
sM
Independent t s group 1s group 2spooled
sdifference

Let’s talk about Standard Deviation
Variance = same for all tests, but paired t is on difference scores
Standard error = same for paired and single t
Take the square root for standard deviation of these

Let’s talk about Standard Deviation
222Y
total
YX
total
Xpooled s
df
dfs
df
dfs
222
YX MMdifference sss
Variance = same for all tests, but paired t is on difference scores
This section is for independent t only
Take the square root for standard deviation of these

Let’s talk about test statisticsTest type Formula
Z M – μM
σM
Single t M – μM
sM
Paired t M sM
Independent t M – Msdifference

Additional Formulae
difference
YXYX
s
MMt
)()(
difference
YX
s
MMt

Let’s talk about dfTest type df
Single sample N – 1
Paired samples t N – 1
Independent t N – 1 + N – 1

Assumptions
Assumption Solution
Normal distribution N >=30
DV is scale Nothing – do nonparametrics
Random selection (sampling) Random assignment to group

Steps for Calculating Independent Sample t Tests
> Step 1: Identify the populations, distribution, and assumptions.
> Step 2: State the null and research hypotheses.
> Step 3: Determine the characteristics of the comparison distribution.
> Step 4: Determine critical values, or cutoffs.
> Step 5: Calculate the test statistic.> Step 6: Make a decision.

SPSSYou’ll need two columns:1) Group membership column
(independent variable)1) Remember use value
labels! Helps with reading the output
2) Dependent variable column

SPSS
Analyze > compare means > Independent Samples T-Test

SPSS
IV goes in grouping variable, DV into Test variable
SPSS
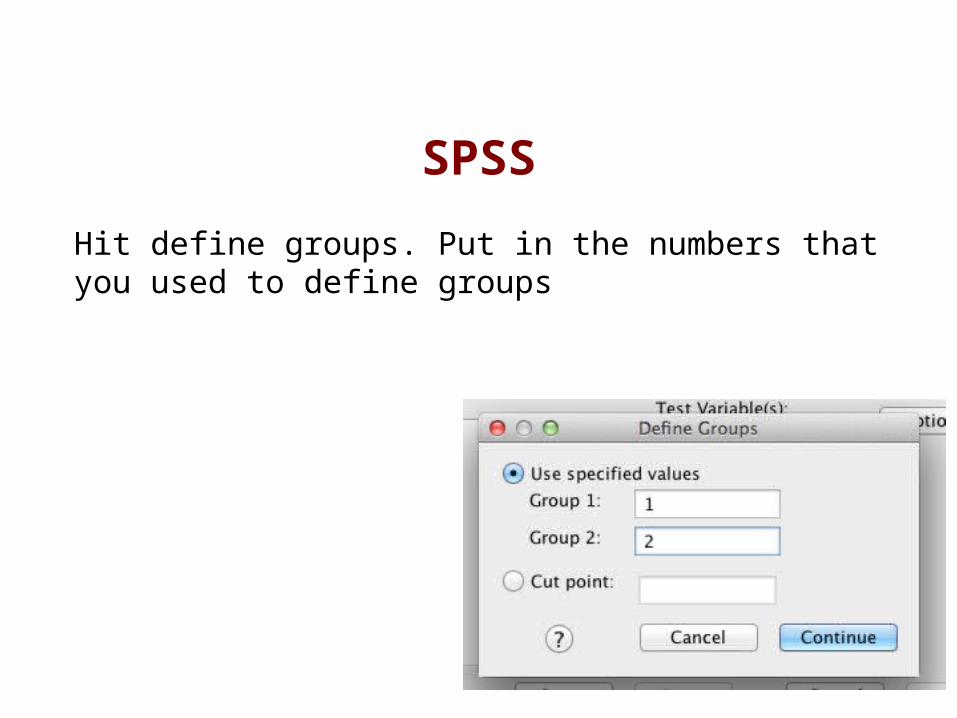
Hit define groups. Put in the numbers that you used to define groups

SPSS
Hit options – if you need a 99% CI, you can change it here.

SPSS
N values for each groupM values for each groups values for each groupsM values for each group (not the standard error you need)(Confidence intervals here)

SPSS
t = step 5df = step ¾Mdifference = M – MStd. Error = SdifferenceCI = CI around Mdifference (what the book suggests)

> t(df) = tcalc, p < .05 • Use p > .05 if there is no difference
between means• Use p < .05 if there is a difference between
means
> t(7) = -2.44, p < .05
Reporting the Statistics
Beyond Hypothesis Testing
> Just like z tests, single-sample t tests, and paired-samples t tests, we can calculated confidence intervals and effect size for independent-samples t tests

Steps for Calculating CIs
> The suggestion for CI for independent t is to calculate the CI around the mean difference (M – M).• This calculation will tell you if you should reject
the null.• Does not match what people normally do
(which is calculate each M CI separately).

Effect Size
> Used to supplement hypothesis testing> Cohen’s d:
pooled
YXYX
s
MMd
)()(


![Wd E D ^z>> h^ Z u ] Ç ] o Ç d í ì ( } z o z í î Z z v P P Z u ] Ç ] o Ç d í ... · 2020. 8. 12. · Sr. No. Class Test Name Test Date Test Syllabus Physics : Physical World,](https://img.pdfslide.us/doc/110x75/5ff8e3192e0ad007d73bb662/wd-e-d-z-h-z-u-o-d-z-o-z-z-z-v-p-p-z-u-.jpg)