Embed Size (px)
Citation preview
1 INTRODUCTION
Recent climatic warming has initiated the melting of ground ice throughout permafrost regions. This isresulting in increased terrain disturbance. A potentialconsequence of these alterations to the land surface isdamage to ecosystems and infrastructure (e.g. roads,buildings and pipelines).
Before significant surface disturbance is initiated,melting ground ice causes small changes in the mor-phology, elevation and hydrology of the ground surface.Unfortunately, conventional techniques cannot providethe three essential elements required to detect the ini-tial stages of ground ice melt: extensive spatial cover-age (tens of square kilometres), frequent measurements(monthly or more frequently), and fine-resolutionchange detection measurements (sub-metre). Manyremote sensing techniques easily cover the first twoelements and with the high resolution interferometricproducts that may be extracted from SAR (syntheticaperture radar) images there is a possibility that thethird required element may be met as well.
Both the timing and the degree of surface change arehighly variable in permafrost environments. Processesthat vary in magnitude, frequency, and spatial extent/distribution such as wind mobilization of snow, glacio-hydrologic events involving stored water and slopemovements are all superimposed on permafrost degra-dation which is primarily governed by seasonal anddiurnal melt cycles. The superimposition of these eventsobscures longer term landscape destabilization due to
melting permafrost. In this paper we highlight theimportance of matching the temporal scale of the phys-ical process with the repeat-period of interferometricSAR (InSAR). Also, we stress the complexity of usingremote sensing imagery for isolating particular changes.Specifically, we intend to provide a general frameworkwithin which to evaluate different sources of InSAR fordetecting various types of landscape destabilization inpermafrost terrain.
2 METHODS
Cross-track airborne interferometric SAR is now com-monly used to create DEMs of the land surface (Grayet al., 1995; Orwig et al., 1995), and this method isnow commercially available (Moorman et al., 1998).
Repeat-pass interferometry has the potential for mapping a greater array of variables including, temporalchange, however, there are also greater complicationsassociated with it. In certain situations, repeat-passsatellite interferometric SAR can also be used to gen-erate DEMs of the Earth’s surface and produce asso-ciated temporal derivatives. Some of the applicationsdemonstrated to date include, measuring glacier flowrates (e.g. Vachon et al., 1996), detecting frost heave inthe active layer (e.g. Wang and Li, 1999), crust bulgingassociated with volcanic activity (e.g. Massonet et al.,1995), and land subsidence (e.g. Strozzi et al., 2001).One of the limiting factors in using satellite SAR datafor interferometry is the change in the character of the
1057
The importance of temporal scale when mapping landscape change in permafrost environments using Interferometric Synthetic Aperture Radar
D.B. SjogrenEarth Science Program, University of Calgary, Calgary, Alberta, Canada
B.J. MoormanEarth Science Program, University of Calgary, Calgary, Alberta, Canada
P.W. VachonCanada Centre for Remote Sensing, Natural Resources Canada, Ottawa, Ontario, Canada
ABSTRACT: The properties of satellite interferometric synthetic aperture radar (InSAR) data were assessed todetermine whether it is suitable to detect small landscape changes in a permafrost environment. The advantage ofInSAR is that it can generate measurements with large spatial coverage with relatively fine horizontal and verticalresolution. Amplitude, coherence, and interferometric phase images were generated from SAR data from the ERS-1/2, RADARSAT-1, and JERS-1 satellites. It was found that the variations between repeat pass period and technicalcharacteristics of the satellites resulted in each system producing unique data sets. Decorrelation between imagesgenerally resulted in coherence that was too low to map the absolute rate and direction of surface motion. However,the relative decrease in coherence is useful for establishing the relative rates of ground surface change and linkingthese to geomorphic and hydrologic processes.
Permafrost, Phillips, Springman & Arenson (eds)© 2003 Swets & Zeitlinger, Lisse, ISBN 90 5809 582 7
ground surface between satellite passes. Even smallchanges result in decorrelation of the images, limitingthe potential for generating a DEM (e.g. Vachon et al.,1995; Kenyi et al., 1999). This is particularly true in apermafrost environment during summer melt.
Decorrelation between SAR images is of interest in detecting landscape changes. Areas where there is a relatively large change in the character of the groundsurface over time (e.g. were ground ice is melting)will be expressed in a coherence image as areas oflocalized decorrelation. However, due to the slow rateof surface subsidence associated with the initiation ofground ice melt, longer observation periods are requiredfor a detectable amount of surface change to develop.Unfortunately, as the repeat period of the satelliteincreases, so does the potential for widespread scenedecorrelation due to other processes (e.g. vegetationgrowth, snow accumulation/ablation, or changes in thesoil moisture content).
The coherence between SAR scenes (i.e. the abilityto interferometrically correlate the two images) isdependent on a number of factors other than just groundsurface change (e.g. Vachon et al., 1996). In generat-ing interferometric images from satellite SAR data,both the orbital and sensor characteristics of the satelliteplay a major role in the suitability of the data for inter-ferometric processing. Orbital considerations includethe repeat period of the satellite and its across-trackrepeatability. Sensor considerations include spatial reso-lution, incidence angle, radar wavelength, and signal-to-noise ratio. For example, the longer wavelength ofthe JERS-1 sensor is theoretically less sensitive to thesmall changes that would affect the ERS-1/2 andRADARSAT-1 sensors, thus decreasing resolution,but at the same time decreasing the level of backgroundnoise.
The optimal system for locating melting ground icewould show a loss of coherence in the areas of melt,while coherence is retained throughout the rest of thescene. The different system configurations of the sen-sors considered (Table 1) enabled examination of theloss of coherence within a scene due to geomorphologicand hydrologic processes that occur at different rates.
For this project, amplitude, coherence, and phaseimages were generated from ERS-1/2 (tandem mode),RADARSAT-1, and JERS-1 image pairs for roughly
the same area. Because we were concerned with iden-tifying particular processes and not mapping per se, theimages were left in slant-range. The characteristics ofthe three systems are compared in relation to observedscene changes and the rate of landscape activity.
Because our goal was to investigate the linkagebetween the coherence images and terrain processes,we compared two unsupervised classification tech-niques. The first was a variant on a K-means clustering(isodata) and the second was a non-parametric approachknown as Narendra-Goldberg clustering (Narendraand Goldberg, 1977) that was developed for LandsatMSS data. Due to the highly skewed nature of the data(Skewness of ERS-1/2 � �1.69, RADARSAT-1 �0.56, JERS-1 � 1.06) and the assumptions about theprobability density inherent in the isodata method we elected to use the non-parametric approach. TheNarendra-Goldberg clustering partitions the histogramby employing a valley seeking algorithm (Koontz et al.,1976). This method identifies breaks in the histogramand, therefore, can produce groups that have non-normal frequency distributions. For the analysis weapplied a 5 point (digital number) running mean toeliminate high frequency noise in the histogram. Also,we eliminated any groups that had less than 1000 pix-els. This technique allowed an unbiased, simple clas-sification of the coherence images based on naturalbreaks in the histogram.
3 STUDY AREA
A study area on southern Bylot Island in the easternCanadian Arctic was chosen for this project as it con-tains a variety of terrain types and a number of sub-surface massive ice bodies that are currently meltingat varying rates (Klassen, 1993). The area’s cold anddry climate results in little vegetation growth or snowaccumulation, and thus the potential for detecting ice-melt related changes is enhanced.
Within the study area, there are two main geologicregions, Precambrian mountains consisting of highlyresistant metamorphic bedrock, and a Cretaceous/Tertiary platform that is composed of easily erodablesedimentary bedrock. The mountains act as a sourcearea for the glaciers, some of which flow out onto theplatform. The sedimentary platform consists of gentlyrolling uplands and broad U-shaped valleys carvedout during past glaciations.
Generally, the moraines surrounding the retreatingglaciers are ice cored. Ground ice bodies observed onthe island range in size from 1 m3 to over 200 000 m3.As the mean annual air temperature in the region is approximately �9.5°C, meltout of the ice-coredmoraines does not occur spontaneously followingdeglaciation as in more temperate environments.
1058
Table 1. InSAR image pair parameters.
Repeat period BaselineSatellite Band (days) Dates (m)
ERS-1/2 C 1 Dec. 4/5 1995 83(tandem mode)
RADARSAT-1 C 24 Dec. 4/28 1996 149JERS-1 L 44 May 14/ �910
Aug. 10 1996
Some ground ice bodies were found to still exist inareas not glaciated for tens of thousands of years. Theultimate result of ground ice melt in this environmentis the development of thermokarst lakes, many ofwhich can be observed throughout the lowlands.
4 RESULTS AND DISCUSSION
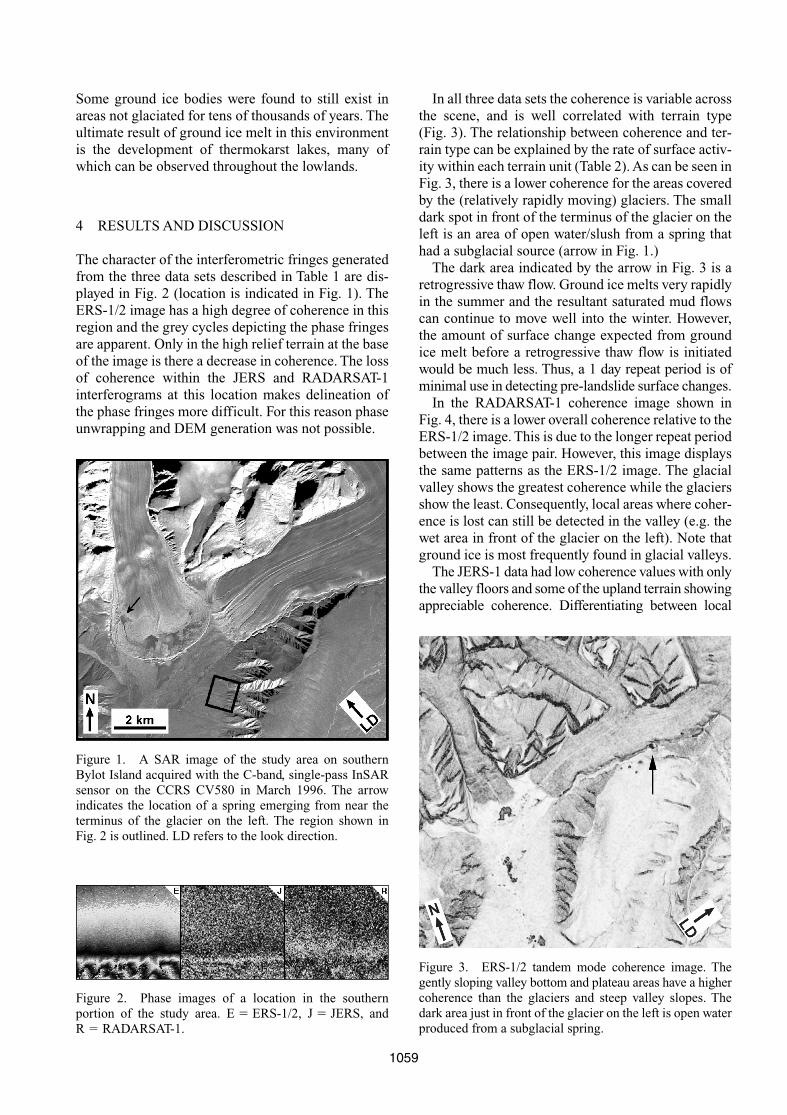
The character of the interferometric fringes generatedfrom the three data sets described in Table 1 are dis-played in Fig. 2 (location is indicated in Fig. 1). TheERS-1/2 image has a high degree of coherence in thisregion and the grey cycles depicting the phase fringesare apparent. Only in the high relief terrain at the baseof the image is there a decrease in coherence. The lossof coherence within the JERS and RADARSAT-1interferograms at this location makes delineation ofthe phase fringes more difficult. For this reason phaseunwrapping and DEM generation was not possible.
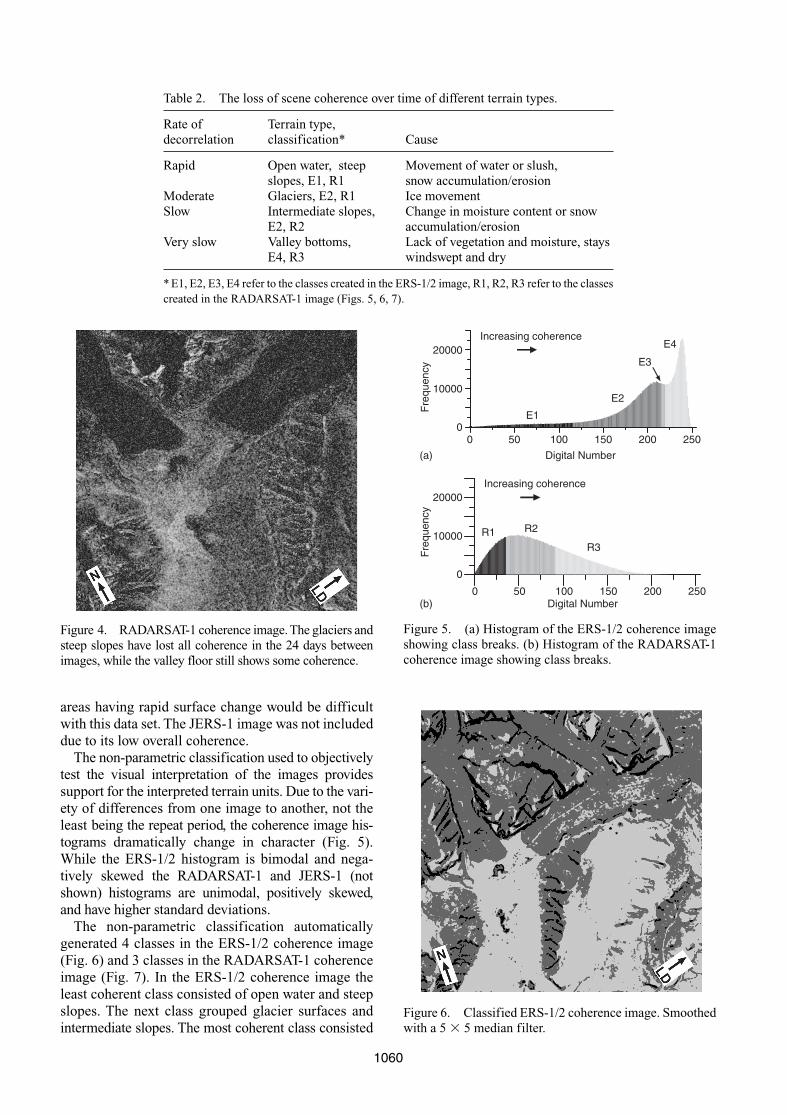
In all three data sets the coherence is variable acrossthe scene, and is well correlated with terrain type (Fig. 3). The relationship between coherence and ter-rain type can be explained by the rate of surface activ-ity within each terrain unit (Table 2). As can be seen inFig. 3, there is a lower coherence for the areas coveredby the (relatively rapidly moving) glaciers. The smalldark spot in front of the terminus of the glacier on theleft is an area of open water/slush from a spring thathad a subglacial source (arrow in Fig. 1.)
The dark area indicated by the arrow in Fig. 3 is aretrogressive thaw flow. Ground ice melts very rapidlyin the summer and the resultant saturated mud flowscan continue to move well into the winter. However,the amount of surface change expected from groundice melt before a retrogressive thaw flow is initiatedwould be much less. Thus, a 1 day repeat period is ofminimal use in detecting pre-landslide surface changes.
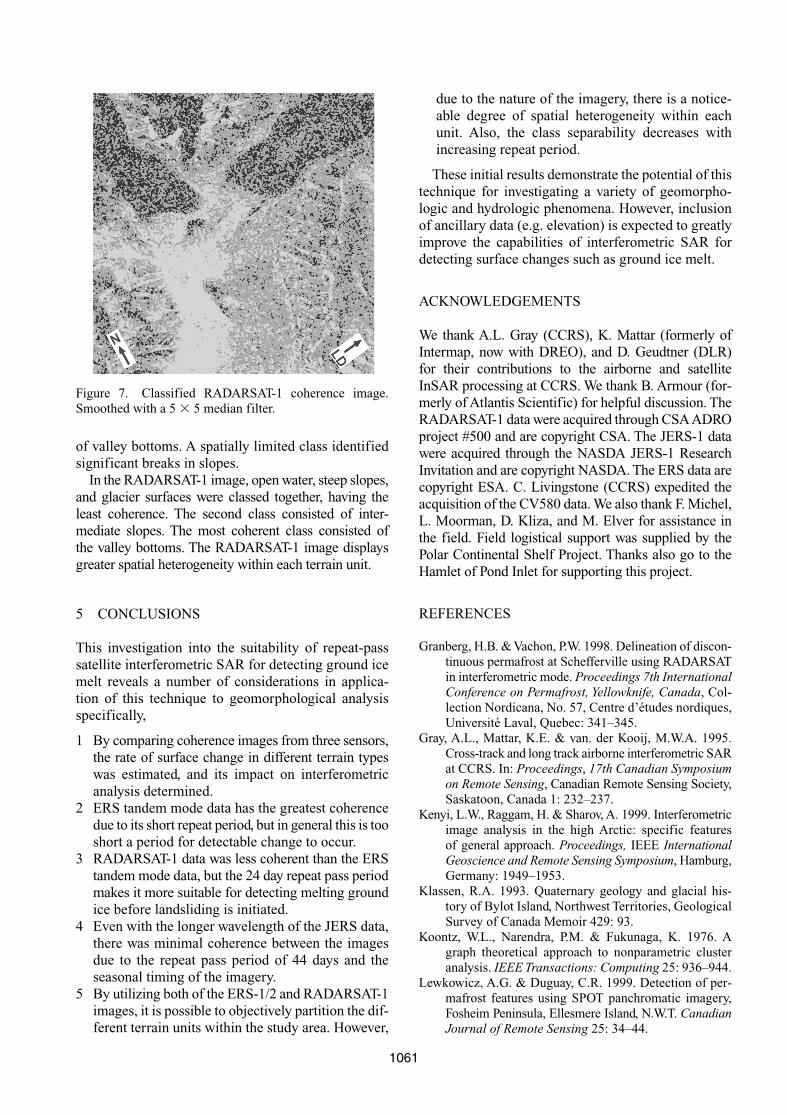
In the RADARSAT-1 coherence image shown inFig. 4, there is a lower overall coherence relative to theERS-1/2 image. This is due to the longer repeat periodbetween the image pair. However, this image displaysthe same patterns as the ERS-1/2 image. The glacialvalley shows the greatest coherence while the glaciersshow the least. Consequently, local areas where coher-ence is lost can still be detected in the valley (e.g. thewet area in front of the glacier on the left). Note thatground ice is most frequently found in glacial valleys.
The JERS-1 data had low coherence values with onlythe valley floors and some of the upland terrain showingappreciable coherence. Differentiating between local
1059
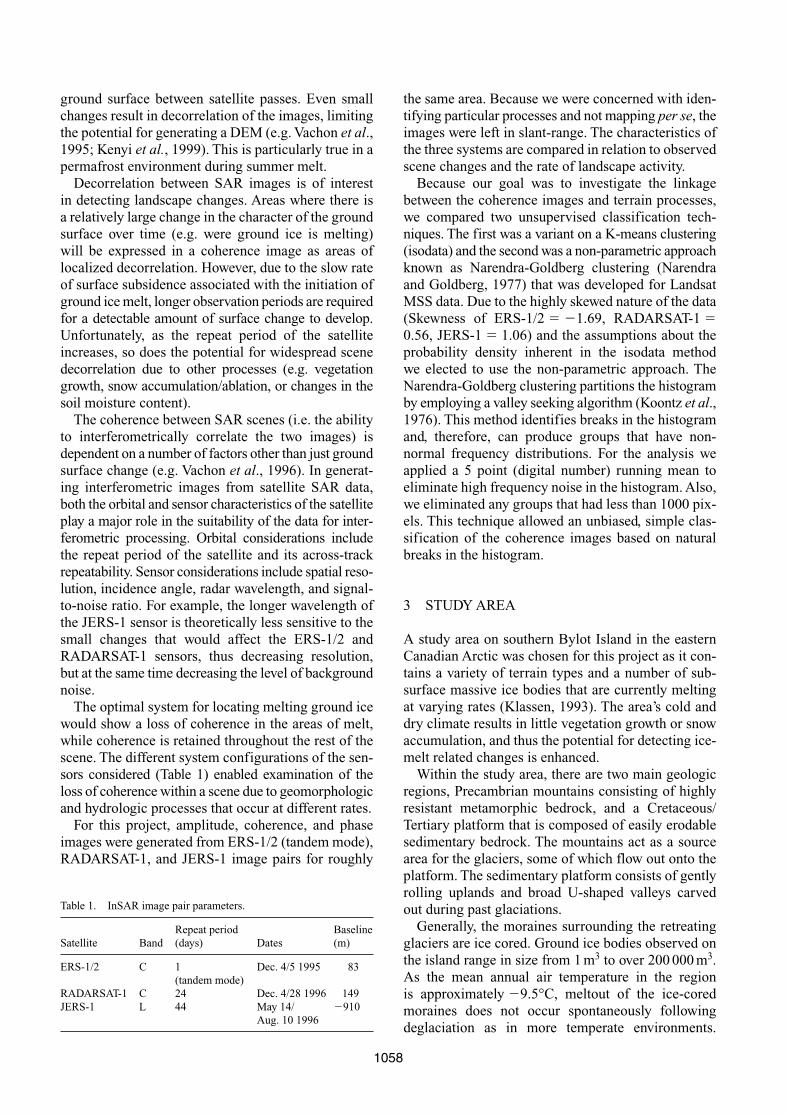
Figure 1. A SAR image of the study area on southernBylot Island acquired with the C-band, single-pass InSARsensor on the CCRS CV580 in March 1996. The arrowindicates the location of a spring emerging from near theterminus of the glacier on the left. The region shown in Fig. 2 is outlined. LD refers to the look direction.
Figure 2. Phase images of a location in the southern portion of the study area. E � ERS-1/2, J � JERS, andR � RADARSAT-1.
Figure 3. ERS-1/2 tandem mode coherence image. Thegently sloping valley bottom and plateau areas have a highercoherence than the glaciers and steep valley slopes. Thedark area just in front of the glacier on the left is open waterproduced from a subglacial spring.
areas having rapid surface change would be difficultwith this data set. The JERS-1 image was not includeddue to its low overall coherence.
The non-parametric classification used to objectivelytest the visual interpretation of the images providessupport for the interpreted terrain units. Due to the vari-ety of differences from one image to another, not theleast being the repeat period, the coherence image his-tograms dramatically change in character (Fig. 5).While the ERS-1/2 histogram is bimodal and nega-tively skewed the RADARSAT-1 and JERS-1 (notshown) histograms are unimodal, positively skewed,and have higher standard deviations.
The non-parametric classification automaticallygenerated 4 classes in the ERS-1/2 coherence image(Fig. 6) and 3 classes in the RADARSAT-1 coherenceimage (Fig. 7). In the ERS-1/2 coherence image theleast coherent class consisted of open water and steepslopes. The next class grouped glacier surfaces andintermediate slopes. The most coherent class consisted
1060
Figure 4. RADARSAT-1 coherence image. The glaciers andsteep slopes have lost all coherence in the 24 days betweenimages, while the valley floor still shows some coherence.
0 50 100 150 200 250
Digital Number
0
10000
20000
Fre
quen
cy
0 50 100 150 200 250Digital Number
0
10000
20000
Fre
quen
cy
(a)
(b)
Increasing coherence
Increasing coherence
E1
E2
E3
E4
R1 R2
R3
Figure 5. (a) Histogram of the ERS-1/2 coherence imageshowing class breaks. (b) Histogram of the RADARSAT-1coherence image showing class breaks.
Figure 6. Classified ERS-1/2 coherence image. Smoothedwith a 5 � 5 median filter.
Table 2. The loss of scene coherence over time of different terrain types.
Rate of Terrain type,decorrelation classification* Cause
Rapid Open water, steep Movement of water or slush,slopes, E1, R1 snow accumulation/erosion
Moderate Glaciers, E2, R1 Ice movementSlow Intermediate slopes, Change in moisture content or snow
E2, R2 accumulation/erosionVery slow Valley bottoms, Lack of vegetation and moisture, stays
E4, R3 windswept and dry
* E1, E2, E3, E4 refer to the classes created in the ERS-1/2 image, R1, R2, R3 refer to the classescreated in the RADARSAT-1 image (Figs. 5, 6, 7).
of valley bottoms. A spatially limited class identifiedsignificant breaks in slopes.
In the RADARSAT-1 image, open water, steep slopes,and glacier surfaces were classed together, having theleast coherence. The second class consisted of inter-mediate slopes. The most coherent class consisted of the valley bottoms. The RADARSAT-1 image displaysgreater spatial heterogeneity within each terrain unit.
5 CONCLUSIONS
This investigation into the suitability of repeat-passsatellite interferometric SAR for detecting ground icemelt reveals a number of considerations in applica-tion of this technique to geomorphological analysisspecifically,
1 By comparing coherence images from three sensors,the rate of surface change in different terrain typeswas estimated, and its impact on interferometricanalysis determined.
2 ERS tandem mode data has the greatest coherencedue to its short repeat period, but in general this is tooshort a period for detectable change to occur.
3 RADARSAT-1 data was less coherent than the ERStandem mode data, but the 24 day repeat pass periodmakes it more suitable for detecting melting groundice before landsliding is initiated.
4 Even with the longer wavelength of the JERS data,there was minimal coherence between the imagesdue to the repeat pass period of 44 days and theseasonal timing of the imagery.
5 By utilizing both of the ERS-1/2 and RADARSAT-1images, it is possible to objectively partition the dif-ferent terrain units within the study area. However,
due to the nature of the imagery, there is a notice-able degree of spatial heterogeneity within eachunit. Also, the class separability decreases withincreasing repeat period.
These initial results demonstrate the potential of thistechnique for investigating a variety of geomorpho-logic and hydrologic phenomena. However, inclusionof ancillary data (e.g. elevation) is expected to greatlyimprove the capabilities of interferometric SAR fordetecting surface changes such as ground ice melt.
ACKNOWLEDGEMENTS
We thank A.L. Gray (CCRS), K. Mattar (formerly ofIntermap, now with DREO), and D. Geudtner (DLR)for their contributions to the airborne and satelliteInSAR processing at CCRS. We thank B. Armour (for-merly of Atlantis Scientific) for helpful discussion. TheRADARSAT-1 data were acquired through CSA ADROproject #500 and are copyright CSA. The JERS-1 datawere acquired through the NASDA JERS-1 ResearchInvitation and are copyright NASDA. The ERS data arecopyright ESA. C. Livingstone (CCRS) expedited theacquisition of the CV580 data. We also thank F. Michel,L. Moorman, D. Kliza, and M. Elver for assistance inthe field. Field logistical support was supplied by thePolar Continental Shelf Project. Thanks also go to theHamlet of Pond Inlet for supporting this project.
REFERENCES
Granberg, H.B. & Vachon, P.W. 1998. Delineation of discon-tinuous permafrost at Schefferville using RADARSATin interferometric mode. Proceedings 7th InternationalConference on Permafrost, Yellowknife, Canada, Col-lection Nordicana, No. 57, Centre d’études nordiques,Université Laval, Quebec: 341–345.
Gray, A.L., Mattar, K.E. & van. der Kooij, M.W.A. 1995.Cross-track and long track airborne interferometric SARat CCRS. In: Proceedings, 17th Canadian Symposiumon Remote Sensing, Canadian Remote Sensing Society,Saskatoon, Canada 1: 232–237.
Kenyi, L.W., Raggam, H. & Sharov, A. 1999. Interferometricimage analysis in the high Arctic: specific features of general approach. Proceedings, IEEE InternationalGeoscience and Remote Sensing Symposium, Hamburg,Germany: 1949–1953.
Klassen, R.A. 1993. Quaternary geology and glacial his-tory of Bylot Island, Northwest Territories, GeologicalSurvey of Canada Memoir 429: 93.
Koontz, W.L., Narendra, P.M. & Fukunaga, K. 1976. Agraph theoretical approach to nonparametric clusteranalysis. IEEE Transactions: Computing 25: 936–944.
Lewkowicz, A.G. & Duguay, C.R. 1999. Detection of per-mafrost features using SPOT panchromatic imagery,Fosheim Peninsula, Ellesmere Island, N.W.T. CanadianJournal of Remote Sensing 25: 34–44.
1061
Figure 7. Classified RADARSAT-1 coherence image.Smoothed with a 5 � 5 median filter.

1062
Massonet, D., Briole, P. & Arnaud, A. 1995. Deflation ofthe Mount Etna monitored by spaceborne radar inter-ferometry. Nature 375: 567–570.
Moorman, L.A., Geile, W. & Mercer, B. 1998. NewFrontiers: Environmental applications of high accuracyDEMs. Proceedings, 27th International Symposiumon Remote Sensing of Environment, Tromsø, Norway:613–616.
Narendra, P.M. & Goldberg, M. 1977. A non-parametricclustering scheme for Landsat. Pattern Recognition9: 207–215.
Orwig, L.P., Aronoff, A.D., Ibsen, P.M., Maney, H.D.,O’Brien, J.D. & Holt Jr., H.D. 1995. Wide-area terrainsurveying with interferometric SAR. Remote Sensingof the Environment 53: 97–108.
Strozzi, T., Wegmuller, U., Tosi, L., Bitelli, G. & Spreckels, V.2001. Land subsidence monitoring with differential
SAR Interferometry. Photogrammetric Engineering &Remote Sensing 67(11): 1261–1270.
Vachon, P.W., Geudtner, D., Gray, A.L. & Touzi, R. 1995.ERS-1 synthetic aperture radar repeat-pass inter-ferometry studies: implications for RADARSAT-1.Canadian Journal of Remote Sensing 21: 441–454.
Vachon, P.W., Geudtner, D., Mattar, K., Gray, A.L.,Brugman, M. & Cumming, I.G. 1996. DifferentialSAR interferometry measurements of Athabasca andSaskatchewan Glacier flow rate. Canadian Journal ofRemote Sensing 22: 287–296.
Wang, Z. & Li, S. 1999. Detection of winter frost heavingof the active layer of Arctic Permafrost using SARDifferential Interferograms. Proceedings, IEEE Inter-national Geoscience and Remote Sensing Symposium,Hamburg, Germany: 1946–1948.