Embed Size (px)
Citation preview

THE IMPORTANCE OF POPULATION DENSITY
IN BROILER PRODUCTION
by
DOUGLAS MALCOLM HAMILTON, B.S.A.
University of B r i t i s h Columbia, 1 9 6 6
A THESIS SUBMITTED IN PARTIAL FULFILMENT OF
THE REQUIREMENTS FOR THE DEGREE OF
MASTER OF SCIENCE IN AGRICULTURE
i n the Department
of
Poultry Science
We accept t h i s thesis as conforming to the
required standard
THE UNIVERSITY OF BRITISH COLUMBIA
A p r i l , 1 9 6 6
I n p r e s e n t i n g t h i s t h e s i s i n p a r t i a l f u l f i l m e n t o f t h e
r e q u i r e m e n t s f o r a n a d v a n c e d d e g r e e a t t h e U n i v e r s i t y o f B r i t i s h
C o l u m b i a , I a g r e e t h a t t h e L i b r a r y s h a l l m a k e i t f r e e l y a v a i l a b l e
f o r r e f e r e n c e a n d s t u d y . I f u r t h e r a g r e e t h a t p e r m i s s i o n f o r e x
t e n s i v e c o p y i n g o f t h i s t h e s i s f o r s c h o l a r l y p u r p o s e s m a y b e g r a n
b y t h e H e a d o f m y D e p a r t m e n t o r b y h i s r e p r e s e n t a t i v e s . I t i s
u n d e r s t o o d t h a t c o p y i n g o r p u b l i c a t i o n o f t h i s t h e s i s f o r f i n a n
c i a l g a i n s h a l l n o t b e a l l o w e d w i t h o u t m y w r i t t e n p e r m i s s i o n .
D e p a r t m e n t o f Q * n * ^ £ ^ S^,^L^>
T h e U n i v e r s i t y o f B r i t i s h C o l u m b i a V a n c o u v e r 8, C a n a d a
D a t e 'U- 6\ 7

i i
ABSTRACT'
Commercial b r o i l e r chickens were reared as combined sexes at f l o o r
space areas of 0.6, 0.7, 0.8, 0.9 and 1.0 f t . 2 per b i r d to ten weeks of
age. There was no s i g n i f i c a n t difference i n the mean body weights at nine
weeks of age„ At ten weeks of age, there was no s i g n i f i c a n t difference i n
the mean body weights of the birds reared at 0,7, 0.8, 0,9 and 1.0 f t . 2 per
b i r d , while the f l o o r area of 0.6 f t . 2 per b i r d produced s i g n i f i c a n t l y
l i g h t e r birds than did 1.0 f t , 2 .
Mortality was not affected by b i r d density, whereas the percentage
of breast b l i s t e r s increased with increasing density,.
B r o i l e r production costs and various combinations of feed and meat
prices were used i n models to determine the age at which maximum annual net
returns per square foot of f l o o r area occurred. Assuming that the weekly
mean body weights were the same for birds grown at 0.7 and 1,0 f t . 2 per
bi r d f l o o r area, maximum net returns were obtained by marketing at nine or
ten weeks of age depending on feed and meat prices«
The effect on net returns of marketing one week e a r l i e r or l a t e r than
at the age of greatest net returns was examined.
When i t was assumed that the number of l o t s per year was li m i t e d to
4,33 i . e . a twelve week replacement program, annual maximum net returns were
found to occur at a market age of at least ten weeks.

i i i
When the number of l o t s marketed was not assumed to be l i m i t e d ,
annual maximum returns also occurred, with few exceptions, at least at ten
weeks of age.
iv
TABLE OF CONTENTS CHAPTER PAGE
I. INTRODUCTION 1
II. REVIEW OF THE LITERATURE 5
III. MATERIALS AND METHODS 11
IV, RESULTS AND DISCUSSION 14
Weekly Body Weights and Feed Consumption 14. Final Body Weights 21 Mortality 22 Marketing and Market Grades 22
V, DEVELOPMENT OF FIXED AND VARIABLE COSTS OF BROILER PRODUCTION 25 Variable Costs 26 Fixed Costs 29
Depreciation of Buildings and Equipment 29
VI. INFLUENCE OF MARKET AGE AND WEIGHT ON ANNUAL NET RETURNS 31 Meat Yield per 1000 Square Feet of Floor Space at
0«7 and 1,0 Square Foot per Bird 32 Annual Net Returns Per Square Foot of Floor Area Per Year 32
VII. SUMMARY 46
BIBLIOGRAPHY 4 9
APPENDIXES 5A

V
LIST OF TABLES
TABLE PAGE
I . B r o i l e r Production E f f i c i e n c y and Marketing Trends i n Canada
for the Period 1950-1965 2
I I . Average Body Weight and Average Cumulative Feed Consumption
for Mixed Sexes of B r o i l e r s Raised at Floor Areas of 0.6,
0.7, 0„8, 0,9 and 1.0 Square Foot per b i r d to Ten Weeks
of Age 15
I I I . Results of Duncan1s Test of Weekly Mean Body Weights for Sexes
Separately and Combined from Hatch to Ten Weeks of Age 16
IV. Quality Defects Reported During Processing of B r o i l e r s at
Seventy-three Days of Age 23
V. Some Production Costs for 1962, 1963 and 1964, and the Three
Year Average for B r o i l e r s reared i n B r i t i s h Columbia 27
VI. Maximum Annual Net Returns per Square Foot of Floor Area and
Associated Market Age and Weight for Various Feed and Meat
Prices: B i r d Density 0.7 Square Foot per B i r d 36
VII. Maximum Annual Net Returns per Square Foot of Floor Area and
Associated Market Age and Weight for Various Feed and Meat
Prices: B i r d Density 1.0 Square Foot per B i r d 37
v i
TABLE PAGE
VIII. The Decrease i n Annual Net Returns per Square Foot of Floor
Area Incurred by Marketing One Week E a r l i e r or One Week
Later Than Optimum for Various Feed and Meat Prices: B i r d
Density 0.7 Square Foot per B i r d 39
IX. Maximum Annual Net Returns per Square Foot of Floor Area and
Associated Market Age and Weight for Various Feed and Meat
Prices: B i r d Density 1.0 Square Foot per B i r d and Number
of Lots per Year Limited to 4-33 41
X. Maximum Annual Net Returns per Square Foot of Floor Area and
Associated Market Age and Weight for Various Feed and Meat
Prices: Bird Density 0.7 Square Foot per Bi r d and Number
of Lots per Year Limited to 4.33 4-3

v i i
LIST OF FIGURES
FIGURE PAGE
1. Ranking of Weekly Mean Body Weights for B r o i l e r s Reared
as Combined Sexes from Hatch to Ten Weeks of Age 18
2. Relationship Between Live Body Weights and Y i e l d of
B r o i l e r Meat per 1000 Square Feet of Floor Area
per Year at Bird Densities of 0.7 and 1.0 Square
Foot per B i r d 34.

v i i i
ACKNOWLEDGMENT
The writer wishes to express h i s appreciation to hi s advisor, Dr.
J. F. Richards and to the other members of the Department of Poultry
Science for t h e i r guidance and c r i t i c i s m throughout the course of t h i s
study. He i s also indebted to the members of hi s committee who c r i t i
c a l l y read t h i s manuscript.
The author i s indeed grateful to The Honourable Frank Richter,
Minister of Agriculture, Mr. Alex H. Turner, Deputy Minister of A g r i c u l
ture and Mr. W. H. Pope, Poultry Commissioner, B r i t i s h Columbia Department
of Agriculture, for the opportunity provided by them for him to pursue
the graduate program of which t h i s thesis i s a part.
Appreciation i s also extended to Mr. H. E l l i s , Special Assistant,
and to Mr. D. Crober, fellow graduate student, for assistance rendered.
Sincere appreciation i s also expressed for the patience and
understanding of hi s wife and family.

CHAPTER I
INTRODUCTION
The production of broilers in Canada has developed into a multi-million dollar business involving breeder supply flocks, hatcheries, broiler farms and processing plants. In 1964,306 million pounds (live weight) of broilers, with a value to the growers of about 65 million dollars were delivered to processing plants in Canada. This represents an increase of 13.5 percent over the number of pounds delivered in 1961 and is reflected in the per capita consumption of broiler meat. The per capita consumption increased from 19.6 pounds (estimated) in 1961 to 21.2 pounds in 19641. British Columbia broiler prices at all stages of marketing have decreased steadily while production costs have increased. For example, cost other than fixed costs, feed, labour and cartage were 17.19 cents per bird in 1962, 17.79 cents in 1963 and 18.21 cents in 1964., Pope (1964b.) The average broiler price declined from 25.9 cents per pound live weight in 1957 to 19.22 cents in 1964 (Appendix I).
In view of decreasing prices and Increasing operating costs, broiler, growers have attempted to maintain profits by increasing the size of the production unit and the efficiency of the growing operation. Since 1950 the average age of broilers marketed, decreased from approximately 11*5 weeks to 8.5 weeks of age while the average live weight of broilers marketed increased from 3.11 to 3.75 pounds, as presented in Table I. The number of broilers
^Estimates Received by A Private Communication, 1965. Production and Marketing Branch, Canada Department of Agriculture, Ottawa.

.2
TABLE I
BROILER PRODUCTION EFFICIENCY AND MARKETING TRENDS IN CANADA FOR THE PERIOD 1950-19652
1950 1955 1965
Age of Broilers Sold
11 weeks -5 days
9 weeks -5 days
8 weeks - U days to 9 weeks
Average Weight
3,11 lbs. 3.30 lbs. 3.75 lbs.
Average feed Efficiency- 3.31 2.57 2.39
Size of Unit Per Man 3,000 25,000 60,000
Price to Housewife - 63* 50* 46*
Estimates Received by A Private Communication, Production and Marketing Branch, Canada Department of Agriculture, Ottawa.
Pounds of feed required per pound body weight.
%etail broiler prices per pound.

3
raised per man as l i s t e d i n Table I i s estimated to have increased from 3,000
to 60,000 birds per annum while the price to the consumer dropped from s i x t y -
three to f o r t y - s i x cents per pound between 1950 and 1965.
The gains i n e f f i c i e n c y evidenced i n Table I are the r e s u l t of improve
ments i n the genetic potential of b r o i l e r chicks available and the manifestation
of that potential r e s u l t i n g from improved feed formulation and manufacture.
These advances have meant that during recent years more birds with a weight
at least equal to those produced i n 1950 could be marketed annually from
f a c i l i t i e s of the same physical size.
With a view to increasing e f f i c i e n c y even more, there has recently been
increased interest i n the ef f e c t s of f l o o r space per b i r d ^ on e f f i c i e n c y of
weight gains i n b r o i l e r s . In recent years i t has been generally recommended
that at least one square foot of f l o o r area per b i r d i s required to achieve
maximum weight at nine or ten weeks of age. However, some reports i n the
l i t e r a t u r e have indicated that less space may be required f o r maximum growth.
Because of the obvious importance of establishing the growth which may be
expected from b r o i l e r s under varying f l o o r space allotments, the study
reported herein was undertaken.
The primary objectives of t h i s study were (a) to determine the i n -
fluence of f l o o r space allotments from 0.6 to 1.0 square foot per b i r d on
5Floor space per b i r d i s indicated by the terms "population density" or "bird density". These terms are used interchangeably throughout t h i s thesis.
^Square foot per b i r d w i l l be represented by f t . 2 per b i r d .

u
the average weight that b r o i l e r s achieved from one to ten weeks of age;
(b) to determine fixed and variable costs of production f o r each treatment
group; (c) to study the influence of the age at which b r o i l e r s are marketed
on net returns using the body weights, feed consumption and cost data
developed.

CHAPTER I I \
REVIEW OF THE LITERATURE
I t was generally accepted by early workers that f l o o r area per b i r d
was a very important factor influencing the body weight of b r o i l e r s . Brooks
(1957) reported that differences i n body weight between birds at 0.5 and 1.0 .
f t ? were found to be r e l a t i v e l y small at one week of age but became progressively
greater after t h i s age, and that one could expect a steady increase i n the body 2
weights as the f l o o r area was increased from 0.5 to 2.0 f t . per b i r d for
birds between nine and twelve weeks of age. Similar r e s u l t s were reported by
Hansen and Becker (i960), who demonstrated that when birds of f i v e d i f f e r e n t
genotypes were provided with f l o o r areas of 0.50, 0.75, 1.00 and 1.25 f t . 2 per
b i r d from eight to eleven weeks of age, growth decreased as b i r d density i n
creased.
Siegel and Coles (1958), however, found no s i g n i f i c a n t differences i n
body weights of b r o i l e r s grown to nine weeks of age at f l o o r space levels
ranging from 0.50 to 1.25 f t . 2 per b i r d . Siegel (i960) believed that the con
tradictory r e s u l t s were due to the differences i n genetic stock, management or
other environmental causes. He suggested that these factors may be important
i n determining the body weights of birds grown under various f l o o r space a l l o t
ments.
In order to determine the influence of time of the year and f l o o r space
per b i r d on b r o i l e r weights, Moreng et a l (i960) reared commercial type b r o i l e r
chicks during the four seasons of the year at area densities of 0.50, 0.75, 1.00

6
p 2 and 1.25 f t . per b i r d . In general they found that birds given 1.00 f t . of
f l o o r area to eleven weeks grew w e l l during f a l l , winter and spring months how-
ever, during the summer months 1.25 f t . per b i r d was required to obtain
comparable growth rates. There was very l i t t l e difference i n body weights 2
between 0.75 and 1.00 f t . of f l o o r space. Depressed growth was observed at 2
the 0.5 f t . f l o o r area p a r t i c u l a r l y during the nine to eleven week period. Krueger (196l) reported that b r o i l e r growth at eight weeks was p o s i t i v e l y
correlated with f l o o r space. In t h i s study the birds averaged 3.12 pounds at
0.60 f t . 2 and 3.29 pounds at 1.20 f t . 2 per b i r d .
Siegel (i960) and Moreng et a l (1961) concluded that body weight as a
function of b r o i l e r s t r a i n was more important than age i n determining f l o o r
space requirements for optimum growth and development. Nurse and co-workers
(i960) recommended that a three pound b r o i l e r be allowed 0.70 f t . ; a 3.5 pound
b i r d 0.85 f t . 2 and a four pound b i r d 1.0 f t . 2 . Noles and Padgett (1964b)
recommended s l i g h t l y more f l o o r area per b i r d ; 0.86 f t . f o r each three pound ? 2 b r o i l e r ; 1.0 f t . f o r a 3.5 pound b r o i l e r and 1.1 f t . per b i r d at four pounds
body weight.
Some recent reports have indicated that population density has no s i g
n i f i c a n t e f f e c t on body weights. B i e l y et a l (1963) pointed out that where 2
commercial b r o i l e r s were reared at densities of 0.75 and 1.45 f t . per b i r d ,
birds at the lower density (1.45 f t . 2 per bird) had higher average body weights
at 3, 5, 7, and 8 weeks of age. These differences increased with age. The
difference however, between the two densities at eight weeks was not s t a t i s
t i c a l l y s i g n i f i c a n t .

7 Recent reports of the Arkansas Meat Performance Test (1965) indicated
no significant differences in broiler body weights among densities of 0.6, 0.8, 0.9, and 1.0 ft. per bird for fourteen different broiler strains raised to eight weeks of age. In a second test using thirteen strains of broilers at floor areas of 0.4, 0.5, 0.6, 0.7 and 0.8 f t . 2 per bird to eight weeks, i t was found that there was no significant difference among the floor areas of 0.5, 0.6, 0.7 and 0.8 f t . 2 per bird. However, birds reared at floor areas of 0.5, 0,6, 0.7 and 0.8 f t . 2 had significantly greater body weights than those reared at the 0.4 f t . 2 level*
Merritt et al (i960) reported that when sexes were reared separately there was greater variation in body weight than when they were reared together. This difference disappeared at eight weeks of age. In order to determine if growing the sexes separately or combined had any effect on the overall body weights and profits Wiseman et al (1961) grew broilers separately and combined at two different floor allotments of 0.8 and 1,0 f t . 2 per bird to thirteen weeks of age. They found that the males grew faster when reared with the females than when they were reared separately. The females, when grown separately, were heavier than when reared with males at 0.8 ft«2. At 1,0 f t . 2 per bird the reverse of, this relationship was true, Wiseman et al (1961) also compared the effect of floor areas of 0,8 and 1.0 f t . 2 per bird on thirteen week body weights for broilers reared as combined sexes. They reported that at 0.8 and 1.0 f t . 2 per bird floor areas, the males weighed 5.40 and 5.67 pounds respectively and the females 4*03 and 4.22 pounds respectively. These differences in body weights favouring the greater floor area were significant.

8 To determine optimum production conditions on the basis of the weight of
the birds alone, i s not possible. When values are applied to the input-output"*"
factors of production, p r o f i t or loss calculations may then be put to p r a c t i c a l
use through the adoption of monetary values as a common basis f o r study. Several
studies have been undertaken to determine at what age or weight b r o i l e r s should
be marketed i n order that maximum net returns are re a l i z e d on a per l o t basis.
Smith et a l (194-9) conducted a study of the Del-Mar-Va b r o i l e r industry,
and found that the marketing of a three pound b i r d at thirteen weeks of age
resulted i n greatest returns. Baum and Walkup (1950) found that a 3.5 b r o i l e r
marketed at twelve weeks of age provided highest t o t a l returns. Baum and Walkup
(1956) reported positive net returns to management occurring when the b r o i l e r
body weights ranged from 2.37 to 3.43 pounds, while Berg (1958) reported that
b i r d s marketed at 10.5 weeks averaging 3.5 pounds were the most p r o f i t a b l e .
Sanz-Arias and Paz-Saez (1963) pointed out that due to the growth pattern
of b r o i l e r s , net p r o f i t s decrease rapidly after the desired market weights have
been obtained and t h i s results i n a net loss i f birds are not marketed close to
optimum weight. He found that p r o f i t s began when the birds reached 2.84 pounds
and were greatest at 4.35 pounds l i v e weight.
When calculating p r o f i t s from a b r o i l e r growing operation within a speci
f i e d time period the point of maximum p r o f i t i s where marginal cost and marginal
revenue coincide. Early investigators f i r s t determined net returns on a per b i r d
ilnput - any item that contributes to the production of the product; output - the product produced.

9
per l o t basis as indicated by the work of Baum and Walkup (1952), M e r r i t t et a l
(i960) and Smith (1949)« This approach i s not v a l i d for any continuous b r o i l e r
operation as i t does not consider the time f a c t o r , Trent and Winder (1961),
Nurse et a l (i960) and Noles and Padgett (1964b) indicated that the cost of
feeding a flo c k of b r o i l e r s for an additional day or week must include the
opportunity c o s t . 2 The question which must be asked i s could the additional
day or week have been used more p r o f i t a b l y (on the basis of annual net returns
per unit area) by a subsequent f l o c k .
Noles and Padgett (1964b) indicated that marketing b r o i l e r s e a r l i e r than
ten or twelve weeks of age may maximize net returns by spreading the deprecia
t i o n over more birds per year*
Nurse et a l (i960) investigated the marketing of b r o i l e r s at l i v e weights
of 2.6 to 4.0 pounds l i v e weight with variable feed and chick costs and l i v e
b r o i l e r prices. They assumed that the body weight achieved by b r o i l e r s i n a
given time i s a function of f l o o r area allowed per b i r d . The model they used
assumed that the l i g h t e r the weight at which broilers were marketed, the lower
the f l o o r area required per b i r d . By the use of t h i s model they concluded that
under a continuous operation net returns per year ..are maximized i f b r o i l e r s
are marketed younger ( i . e . l i g h t e r birds and more birds per year) when:
1. Feed and chick prices are constant and meat prices increase.
2. Feed and meat prices are constant and chick price decreases,
3. Chick and meat prices are constant and feed price decreases.
Opportunity cost: the return that the occupied f l o o r area would contribute to the annual net return i f used by a new l o t of b r o i l e r s .
10
When the reverse of these relations hold true net returns are maximized when
birds were reared to heavier weights.
Smith ( l % 5 ) concluded that the faster and cheaper b r o i l e r weight gains
obtained by growers i n 1963 as compared to 1952 were due to improved technol
ogy i n b r o i l e r production. With price mapping he showed that technological
changes have materially lessened the r e l a t i v e cost disadvantage of heavier
b r o i l e r s . Costs such as chick, f u e l and medicines are constant per chick
started. On a per pound basis they decrease as body weight increases. In
comparing the most profitable marketing weight of b r o i l e r s between 1952 and
1963, Smith (1965) showed that (a) the entire cost structure of b r o i l e r pro
duction has been lowered hence maximization of p r o f i t s are possible at lower
meat prices, (b) increases i n the broiler-feed price r a t i o have favoured a
l i g h t e r b i r d since t h i s i s the only way that output from a given f l o o r area
can be expanded, (c) the penalty for producing a b i r d somewhat heavier or
l i g h t e r than the desired marketing weight was considerably less i n 1963 than
i n 1952, i . e . The weight of b r o i l e r s marketed has increased with these
heavier birds becoming more competitive due to improved feed conversion.

CHAPTER III
MATERIALS AND METHODS
An experiment was designed to determine the effects of varying f l o o r
space on the body weight of b r o i l e r s from one to ten weeks of age. Sixteen
hundred and twenty-four one-day old commercial b r o i l e r chicks of a single
s t r a i n were sexed by the vent method, injected with Tylosin and randomly
assigned by sex to treatment groups so that each group contained an equal
number of males and females. A l l chicks were wing-banded and i n d i v i d u a l l y
weighed to the nearest gram.
The treatments consisted of f i v e population densities: 1.0, 0.9, 0.8,
0.7 and 0.6 f t . of f l o o r space per b i r d . The b r o i l e r s were raised i n a
pressure-ventilated, windowless house consisting of sixteen pens. Ten pens,
f i v e i n s i m i l a r positions i n each end of the house were chosen to form r e p l i
cates i n space. Within each block (end of the house) the treatment groups
were randomly assigned to pens. Each pen consisted of 126 f t . of f l o o r
space so the number of birds per treatment group was as indicated below:
Number of Square Feet Number of Birds Per B i r d Males Females
1.0 63 63
0.9 70 70
0.8 78 78
0.7 90 90
0.6 105 105
Each pen had 3 inches of k i l n - d r i e d shavings on the f l o o r and heat
was provided by e l e c t r i c heat lamps.

1 2
During the f i r s t week the chicks had access to chick feeders then gradu
a l l y they were changed to f o r t y pound capacity hanging feeders, two per 1 0 0
b i r d s , supplying 104. inches of feeding space per 1 0 0 birds. Equal feed space
per b i r d was maintained i n each pen by i n s t a l l i n g , wooden blocks as required to
r e s t r i c t feed space (Appendix 3 ). Each pen contained three or four feeders per
pen depending on the requirements. The feed was a regular commercial ration and
feeding practices recommended by the feed manufacturer were followed. One-half
pound of starter mash per b i r d was fed, followed by medicated grower crumbles
u n t i l the birds were 4 2 days old. Any feed l e f t at t h i s date was weighed and
removed. A medicated, crumbled f i n i s h e r was then fed to the birds u n t i l they
were 70 days old at which time the experiment was terminated.
The chicks had access to four one-gallon water founts per pen (except
for the lowest density pen which had three). These were used for fourteen days
then gradually replaced by one four-gallon waterer and two automatic fountain
cups per pen. This resulted i n a minimum water space of approximately 0 . 3 3
inches per b i r d .
Floxaid, an antibiotic-vitamin mixture was administered i n the drinking
water at one teaspoon per gallon for 0 - 3 days. A regular coccidiostat was
provided i n the feed throughout the test period. A l l birds were vaccinated
at fourteen days of age using Modified Combined Newcastle-Bronchitis water type
vaccine i n the drinking water.
The birds were i n d i v i d u a l l y weighed to the nearest gram each week from
1 to 10 weeks. The feed assigned to each pen and the feed remaining i n each
pen was weighed weekly to the nearest one-quarter of a pound. Feed conversion
13
was corrected f o r mortality. At the end of the ten week period the birds were
commercially processed and plant graded.
From each pen, 62 males and 62 females were randomly selected and the
weekly weights of these birds were subjected to analysis of variance. The
data f o r each sex were analyzed separately as w e l l as on the combined sex data.
Treatment means were subjected to Duncan's New Multiple Range Test^ Duncan,
(1955) to determine the significance of differences. A l l tests of significance
were performed at the 5 percent l e v e l .
"^Duncan's New Multiple Range Test w i l l be referred to as Duncan's Test.

CHAPTER IV
RESULTS AND DISCUSSION
Weekly Body Weights and Feed Consumption. Mean weekly body weights and
average cumulative feed consumption f o r the birds i n each population density
are presented i n Table I I . The data were subjected to analysis of variance
(Appendix 4- - 6) . The.; significance of differences among the means was deter
mined by Duncan's Test and the weekly r e s u l t s are summarized i n Table I I I .
I t was found (Table I I I ) that f o r the mean body weights of the combined-
sex data there was a s i g n i f i c a n t difference among the density means at 1, 2, 3,
4 and 5 weeks of age. During t h i s period birds at the 0.6 f t . allotment were
generally l i g h t e r than those at lower densities and at 3 and 4 weeks s i g n i -o
f i c a n t l y l i g h t e r than a l l other density groups. Birds at 0.7 f t . were
generally heaviest but were not s i g n i f i c a n t l y heavier than birds at 0.8 or
0.9 f t . 2 .
No s i g n i f i c a n t differences were found at 6 weeks but at 7 and 8 weeks
of age birds at 0.7 f t . 2 were the l i g h t e s t and were s i g n i f i c a n t l y l i g h t e r than
the heaviest birds - those at 1.0 f t . 2 per b i r d . The differences were 40 and
35 grams at 7 and 8 weeks respectively.
At 9 weeks of age no s i g n i f i c a n t differences were evident. At 10 weeks
of age the average weight of birds at 0.6 f t . was s i g n i f i c a n t l y lower than
that of birds at 0.9 or 1.0 f t . 2 . No s i g n i f i c a n t differences i n average body
weight were found among 0.7, 0.8, 0.9 or 1.0 f t . per b i r d at 10 weeks.

TABLE I I
AVERAGE BODY WEIGHT AND AVERAGE CUMULATIVE FEED CONSUMPTION FOR MIXED SEXES OF BROILERS RAISED AT FLOOR AREAS OF 0.6, 0.7, 0.8, 0.9 and 1.0 SQUARE FOOT
PER BIRD TO TEN WEEKS OF AGE
FLOOR AREA PER BIRD IN FT. 2
1.0 0.9 0.8 0 .7 0.6
Age Weeks
Average Body
Weight Grams
Cumul a t i v e Feed
Pounds
Average Body
Weight Grams
Cumul a t i v e Feed Pounds
Average Body
Weight Grams
Cumul a t i v e Feed Pounds
Average Body
Weight Grams
Cumul a t i v e Feed Pounds
Average Body
Weight Grams
Cumul a t i v e Feed Pounds
0 38 0 37 0 37 0 37 0 37 0
1 107 0.2 109 0.2 110 0.2 111 0.2 108 0.2
2 235 0.7 241 0.7 241 0.7 246 0.7 230 0.6
3 407 1.3 408 1.3 408 1.3 414 1.3 394 1.2
A 584 2.1 605 2.1 594 2.1 609 2.1 571 2.0 5 808 3.1 816 3.1 786 3.1 798 3.1 773 3.0 6 1036 A, 3 1019 4.2 1027 4.3 1011 4.2 1011 4.2 7 1294 5.7 1274 5.6 1285 5.6 1254 5.5 1273 5.5 8 1550 7.1 1529 7.1 1534 7.1 1515 7.0 1526 7.0
9 1789 8.7 1787 8.7 1776 8.6 1759 8.5 1762 8.5 10 2035 10.5 2027 10.4 1993 10.2 1991 10.2 1972 10.1

Facing page 16
NOTE: The mean body weight of birds from treatments underlined by the same line were not significantly different.
lBirds were reared as combined sexes. 2Floor area per bird (0.7 - seven tenths of one square foot).

TABLE I I I
RESULTS OF DUNCAN'S TEST OF WEEKLY MEAN BODY WEIGHTS FOR SEXES
SEPARATELY AND COMBINED FROM HATCH TO TEN WEEKS OF AGE1
FEMALES MALES COMBINED SEXES
Age Weeks
Lighte st Heavie st Weight Weight
Lightest Heaviest Weight Weight
Lightest Heaviest Weight Weight
DENSITIES
Hatch 0.7 2 1 , 0 0 . 6 0.9 0 . 8 0 T 8 1 , 0 0,7 0,9 0 . 6 1 , 0 0.7 0 . 9 0 . 6 0 t 8
1 0 . 6 1 . 0 0.9 0 f 8 0.7 1 . 0 0 . 6 0 , 8 0,7 1 . 0 0 . 6 o,9 0 . 8 0 t7
2 0 . 6 1 . 0 0 , 8 o,9 0.7 0 . 6 1 . 0 0 t 8 0,9 0,7 0 , 6 1 , 0 0 . 8 o,9 0,7
3 0 . 6 0 , 8 1 , 0 Ot? 0.7 0 . 6 1 , 0 o,9 0 . 8 0,7 0 . 6 1 , 0 0 , 8 0,9 0,7
A 0 . 6 1 . 0 0 . 8 0 . 9 0.7 0 . 6 1 . 0 O t 8 0 . 9 0.7 0 . 6 1 . 0 0 . 8 0 . 9 0.7
5 0 . 6 0 . 8 0.7 1 . 0 0 . 9 0 . 6 0 . 8 0.7 1 . 0 0 . 9 0 , 6 0 . 8 0.7 1 . 0 0 . 9
6 o,9 0,7 0 f 8 0 , 6 1 , 0 0 . 6 0.7 o,9 1 , 0 0 , 8 0.7 0 . 6 0 . 9 0 . 8 1 . 0
7 0,7 Of? 0 , 8 0 . 6 1 , 0 0.7 0 , 6 o„9 1 , 0 0 , 8 0,7 0 , 6 o,9 0 , 8 1 , 0
8 0 t 8 0,7 0.9 0 . 6 1 , 0 0.7 0 . 6 0 . 9 1 . 0 0 . 8 0.7 0 . 6 0 . 9 0 . 8 1 . 0
9 0 . 8 0 . 6 0.7 0 . 9 1 , 0 0 . 6 0.7 1 . 0 0 . 9 0 . 8 0 . 6 0.7 0 . 8 1 . 0 0 . 9
1 0 0 . 8 0 . 6 0.7 0 . 9 1 . 0 0 . 6 0.7 0 . 8 1 . 0 0 . 9 0 . 6 0.7 0 . 8 0 . 9 1 . 0

1 7
When the mean body weights of the sexes were analyzed separately,
Duncan's Test indicated that s i g n i f i c a n t differences existed among the density
treatments each week for the males and each week except 6, 7, 8, and 9 f o r
the females. During the f i r s t U weeks i t was noted that for either sex the
birds reared at 0.7 f t . 2 per b i r d were the heaviest and i n most cases s i g n i
f i c a n t l y heavier than those reared at either 0.6 or 1.0 f t . 2 per b i r d . However,
during subsequent weeks an apparent density e f f e c t began to appear as the rank p
of the 0.7 f t . treatment decreased and that of the lower density pens, par
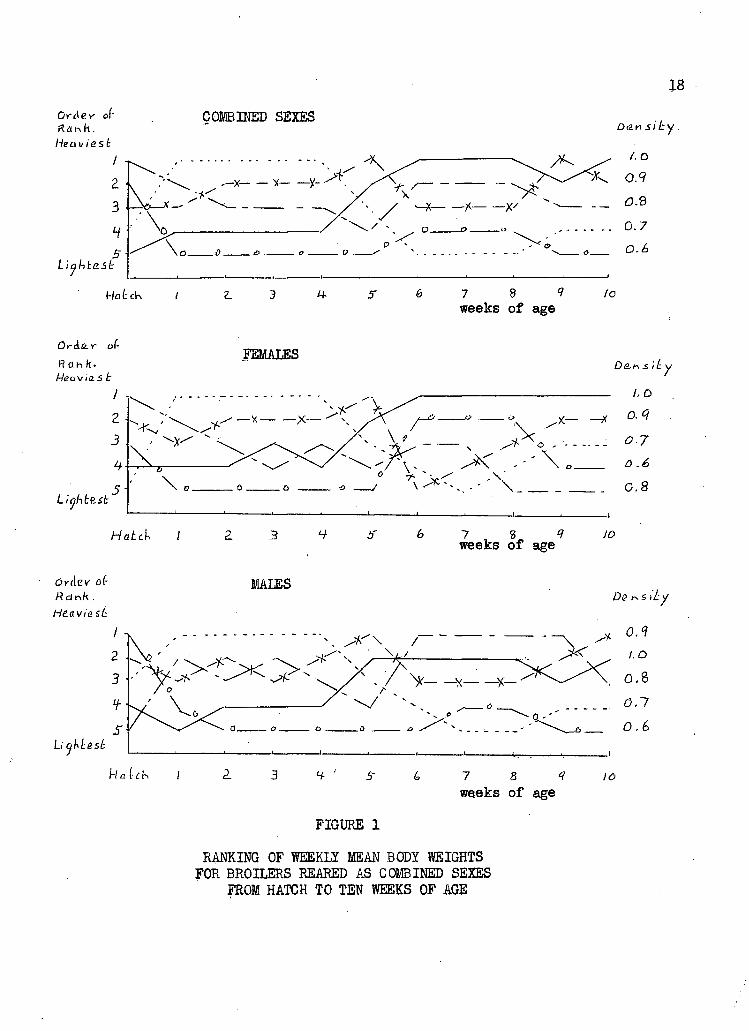
t i c u l a r l y 1.0 f t . 2 , increased. This effect i s i l l u s t r a t e d i n Figure 1
(page 18) for both the separate and combined sex data.
I t can be seen from Figure 1 and Table I I I that there was considerable
var i a t i o n i n the order of rank beyond U weeks of age and i t should be noted
that differences i n rank were not always based on s i g n i f i c a n t body weight
differences.
I t can also be seen that the order of rank i s not precisely i n accordance
with density at 10 weeks of age but there did appear to be a tendency for the 2
low density pens, i . e . , 0.9 and 1.0 f t . per b i r d , to be the heaviest.
A sim i l a r v a r i a b i l i t y i n the eff e c t of density on body weights through
out the experiment was observed by Moreng et a l (1961). They noticed that
b r o i l e r s at f i v e weeks of age were s i g n i f i c a n t l y heavier when the population 0 2
density was 0.5 f t . per b i r d than when 1.00 or 1.25 f t . were allowed.
I t i s d i f f i c u l t to explain why the birds reared on the f l o o r area of 2 2 0.7 f t . i n the present work and at 0.5 f t . i n the test as reported by
18
Ortlev of
He aviest
I
2 3 H
Lightest:
COMBINED SEXES
x-
r l a t c k / if 7 8 ? weeks of age
fo
OrAo-V of
Rahk. Hea\i~<Q.s t
FEMALES Da« s It y
Hah test . 5"
7 2 <7 JO weeks o f age
Orciev of « d n l t . Hcavi&sL
I
2 3
¥•
LiyhLest
MALES £><2 rs 5 lZy
h- L 7 8 weeks of
IO
FIGURE 1
RANKING OF WEEKLY MEAN BODY WEIGHTS FOR BROILERS REARED AS COMBINED SEXES
FROM HATCH TO TEN WEEKS OF AGE
Moreng et a l ( 1961 ) , were superior and i n some cases s i g n i f i c a n t l y superior
i n body weight during the f i r s t four or f i v e weeks and no better than equal
to birds at the low density pens at eight and nine weeks of age. Any ex
planation advanced must take into account the fact that i n the work reported
herein, the 0 .6 f t . 2 treatment was generally i n f e r i o r to 0 . 7 f t . 2 during the
f i r s t f i v e weeks-.
Moreng et a l (1961) suggested that the superiority of the birds from
the more crowded pens might be explained by the fact that the birds were
closer to the feeders i n the pens. In the present experiment feeder space
per b i r d was kept constant at one inch per b i r d for a l l pens. This i s more
than an adequate amount of feed space to ten weeks of age according to the
work of Hansen and Becker ( I 9 6 0 ) . The denser pens, then, have more feed 2
space per f t . of f l o o r area which may have made i t easier for the birds i n
the crowded pens to f i n d the feed as they did not have to t r a v e l as f a r as
i n the less populated pens. This explanation, however, cannot account f o r 2
the f a c t that the birds at 0 . 7 f t . per b i r d were s i g n i f i c a n t l y superior to those at 0 .6 f t . during t h e i r early growing period unless i t Is assumed
, 2
that the additional t h i r t y birds present i n the 0 . 6 f t . treatment pens
caused the crowding about the feeders to become so severe as to actually .
discourage some birds from attempting to eat.
Another factor which may be involved i n the changing pattern of the
density effect i s s o c i a l pressure. Guhl (1953) reported that prior to eight
weeks of age there does not appear to be any s o c i a l dominance among chickens.
C o l l i a s (1950) concluded from his studies of chick ;• ac t i v i t i e s " , that the

20
need for companionship i n chick behaviour f a c i l i t a t e s aggregation and s o c i a l i z
ation. A f l o o r allowance of 0.7 f t . 2 produced the heaviest b r o i l e r s during
the f i r s t four weeks i n the present experiment. I t i s possible that t h i s
degree of crowding also f a c i l i t a t e d aggregation and s o c i a l i z a t i o n which through
some mechanism not yet elucidated contributed to the well-being of the chicks
during the f i r s t four weeks. During the l a t e r weeks t h i s crowding may have
been detrimental as the birds became more aggressive.
As outlined by Guhl (1953$ aggressiveness develops slowly and begins to
express i t s e l f around eight weeks of age for the males and ten weeks for the
females. This could also partly account for the males responding to density
pressure e a r l i e r than the females. I t must be recognized that the applica
b i l i t y of t h i s explanation to the present experiment depends upon certain
premises. I t must be assumed that there are l i m i t s to the benefits to be
gained by crowding during the f i r s t few weeks and that overcrowding can be
actually detrimental to growth during the f i r s t four weeks as w e l l as during
the l a t e r weeks. In the present experiment i t would appear that 0.6 square
foot per b i r d constituted an overcrowded condition during the f i r s t four weeks, 2 2
0.7 f t . was optimum and the 0.8 and 0.9 f t . per b i r d pens were not s i g n i f i c a n t l y d i f f e r e n t to the 0.7 density pens.
The preceding theories are attempts to explain differences of a
r e l a t i v e l y small magnitude - i n most cases differences of no more than
45 grams (0.1 lb.) and during the early weeks considerably l e s s . There i s
the p o s s i b i l i t y that the changing order of rank was the r e s u l t of pen e f f e c t s
during the early weeks. The s i m i l a r i t y of the results reported by Moreng et a l
21
(1961) concerning increased density favouring early chick growth however,
lend credence to the findings i n the present experiment. Nevertheless, much
more supporting evidence i s required to establish the v a l i d i t y of the f i n d
ings and to f u l l y explain them.
F i n a l Body Weights. I t i s w e l l established that environmental tempera
tures influence growth and feed e f f i c i e n c y . Recently, Prince et a l (1965)
demonstrated that an ambient temperature of 55° F. was superior to one of
75° F. for growth and feed e f f i c i e n c y of b r o i l e r s from four to eight weeks
of age.
Average weekly maximum temperatures during the experiment reported
herein ranged from a high of 79° F. during the fourth week to a low of 62° F.
during the tenth week. (Appendix 7), These temperatures are somewhat above
the i d e a l and probably had a depressing e f f e c t i n the average body weight
achieved. The average body weight at eight and nine weeks were somewhat
below those normally achieved i n experimental work and more closely approxi
mate what could be expected under commercial conditions*
There was some evidence to suggest that the a i r movement within the
building was not adequate p a r t i c u l a r l y from the seventh week on. A notice
able amount of ammonia was present, at times, i n the b u i l d i n g . Although the
l e v e l of ammonia was not l i k e l y high enough to have an effect on the birds
per se, (Smith et a l , 1962) i t was an indication that a i r movement through
the building was not at as high a rate as required to adequately remove the
moisture developed from the increased b i r d population.

22
Mortality. The losses incurred to ten weeks of age amounted to 1.37
percent of the 1624. birds started. This mortality rate ranged from a low of
0.8 percent f o r the 1.0 f t . 2 allowances to 2.9 percent f o r the 0.9 f t . 2 f l o o r
areas. (Appendix 8). Losses due to starveouts and smothering amounted to
ten birds out of a t o t a l mortality of twenty-five. Another f i v e birds died
from perosis and the remaining ten died from unknown causes.
. The o r i g i n a l densities of 0.6, 0.7, 0.8, 0.9 and 1.0 f t . 2 were modified
very l i t t l e by subsequent mortality. At f i v e weeks of age the densities,
corrected for mortality were 0.61, 0.71, 0.82, 0.94 and 1.02 f t . 2 per b i r d .
At ten weeks of age the corresponding figures were 0.62, 0.72, 0.82, 0.95
and 1.02. The difference between these values and the densities at the
i n i t i a t i o n of the experiment were deemed to be inconsequential.
Marketing and Market Grades. The birds were marketed at seventy-three
days of age through a l o c a l inspected 1 processing plant. Each treatment group
was processed separately according to pen density. The birds were l i n e graded
according to standard plant practices and the res u l t s of the grading are shown
i n Table IV.
I t i s generally believed that l i t t e r condition i s a primary cause of
breast b l i s t e r s . Wiseman and Bean (1965), found that l i t t e r moisture was
the major cause of breast b l i s t e r s i n male b r o i l e r s . They reported that the
number of b l i s t e r s doubled with each two week age i n t e r v a l after eight or
nine weeks of age, at densities of 1.0 square foot per b i r d .
-^-Inspected by Health of Animals D i v i s i o n , Production and Marketing Branch, Canada Department of Agriculture, Ottawa.

23
TABLE IV
QUALITY DEFECTS REPORTED DURING PROCESSING OF BROILERS
-AT SEVENTY-THREE DAYS OF AGE
Floor Space Number Ft. per of Bird Birds
Number of Birds with
Breast B l i s t e r s
Breast B l i s t e r s
%
Number of Birds with
Lack of Fleshing (Condemned
Birds
1.0 250 25 10.0$ 1 0
0.9 272 3U 12.5% - 1 (P.)
0.8 307 a 5 0
0.7 354 58 16.4$ - 1 (P.) 0.6 412 77 18.7$ 3 0
P. Perosis
In the present experiment the percentage of breast b l i s t e r s increased
according to density from ten percent at 1.0 f t . 2 per b i r d to 18.7 percent
at 0,6 f t , 2 f l o o r space allotments as presented i n Table IV. This pattern
reflected the condition of the l i t t e r which was worse i n the high density
than i n the low density pens. The l i t t e r remained quite dry to s i x and one
half weeks of age for a l l densities but then became increasingly damp and caked
as the b i r d density was increased.
Krueger et a l (1961) showed that crowding per se had only a s l i g h t i n
fluence on the number of condemnations and breast b l i s t e r s to eight weeks of
age and that adjustments i n v e n t i l a t i o n rateucould control l i t t e r dampness
ar i s i n g from high density operation.
Under normal commercial conditions the birds would have been marketed

24
no l a t e r than 9 weeks of age. This would have undoubtedly reduced the number
of breast b l i s t e r s and might even have eliminated the differences between
densities. I t should be noted further that under present marketing arrange
ments i n B r i t i s h Columbia the producer receives the same price for birds with
b l i s t e r s as for those without; even when the b l i s t e r may be severe enough to
cause the b i r d to be c l a s s i f i e d as Grade B or lower. Thus,from an economic
standpoint the fact that the higher densities resulted i n a higher proportion
of b l i s t e r s i s of questionable importance to B r i t i s h Columbia producers.

CHAPTER V
DEVELOPMENT OF FIXED AND VARIABLE COSTS OF BROILER PRODUCTION
Any short-run feeding enterprise, such as the production of b r o i l e r s ,
hogs or beef i n feed l o t s , begins with the purchase of the young animal and
terminates when the animal i s marketed. E a r l i e r investigators, such as
Baum and Walkup (1952), described b r o i l e r farming as a comparatively simple
vehicle for studying some techniques for determining appropriate input-output
values. B r o i l e r production involves or concerns both fi x e d and variable re
sources each of which varies i n importance with environmental conditions and
physiological age of the b i r d . Baum and Walkup (1952) described fixed resources
as those that do not change during the growing period whereas variable resources
do change as the birds grow older.
Baum and Walkup (1956) and Noles and Padgett (1964a) stated that when a
single l o t of b r o i l e r s i s considered, a l l production costs, except feed costs,
are f i x e d ; feed cost then i s the only variable cost. This assumes that popu
l a t i o n density i s specified. However when considering a continuous b r o i l e r
production operation, many of the costs which are considered fixed on a single
l o t basis must be classed as variable costs even though population density i s
specified, because on the basis of cost per square foot per year these items
vary with the number of l o t s produced, which i s determined by the age at which
each l o t i s marketed. Noles and Padgett (1964b) indicated that f o r a continu
ous operation, the cost of feed, chicks, medication, brooding, f u e l , l i t t e r ,
e l e c t r i c i t y , labour and miscellaneous items are variable costs. Fixed costs
consist of depreciation on buildings and equipment, repairs, taxes, insurance

26
and interest on investment.
Variable Costs. A broiler cost survey conducted by Pope (1964b) provided information on some of the variable production costs (continuous basis) during 1962-1964. The total number of birds involved in this report represented 4.5 percent of all broiler chicks hatched in British Columbia from 1962-1964. The results of this survey are summarized in Table V. For the purpose of this thesis the three year average for each of these costs was used for the development of an input cost structure.
The variable costs included chick cost, which changed very little during the period. Vaccination and medication costs increased each year, probably because of greater use of vaccines followed by medication for a few days to reduce the effect of the vaccine. Litter and brooding costs rose slightly each year, while electricity costs showed very little change. It was expected that increased mechanization would be reflected in increased electricity costs but this was not the case. It was thought advisable, therefore, to compute the electricity demands in order to compare the value of 0.38 cents per bird with an expected cost for 1964. In applying 1964 electricity costs to a model farm as outlined in Appendix 9, the costs were estimated to be 0.37 cents per bird.. The close agreement between this estimate and the 0.38 cents reported seemed to justify the use of this latter value.
l l f the number of lots produced annually by a continuous operation as well as the population density is specified and remains constant, then the situation is similar to the single lot operation; all costs except feed are fixed. This is normally the situation when the industry is governed by a marketing board.

TABLE V
SOME PRODUCTION COSTS FOR 1962, 1963 AND 1964, AND THE THREE YEAR
AVERAGE FOR BROILERS REARED IN BRITISH COLUMBIA
THREE YEAR SUMMARY
1962 1963 1964. No. of flocks reporting 124 78 33 Total number of birds sold 804,300 442,958 323,635 Average number of birds 6,486 5,679 9,807 Percent v i a b i l i t y 96.3 97.9 98.8 Days to market 64.3 62.9 62.3 Percent Grades - A's 91.1 92.4 92.1
- B's 6.6 7.0 7.1 - Rejects 2.3 0.6 0.8
Average body weight i n pounds 3.62 3.75 3.84 Feed e f f i c i e n c y 3 2.52 2.48 2.49 Costs: per b i r d started (cents)^ 1962 1963 1964 (Average
Chicks 14.36 14.08 14.30 14.25 Vaccination and Medication .27 .58 .72 .52 L i t t e r .50 .58 .68 .59 Brooding 1.25 1.40 1.48 1.38 E l e c t r i c i t y .44 .44 .38 .43 Marketing Board ,56 ,71 M .64
17.19 17.79 18.21 17.81
2The t o t a l number of birds sold accounted for 4.5 percent of a l l b r o i l e r chicks hatched during the 3 year period.
3pounds of feed required to produce one pound of l i v e b r o i l e r .
. Does not include interest on investment, depreciation, cartage, labour or feed.

28
In British Columbia, all broilers are marketed through a marketing board at a cost of 0.75 cents for each Grade A or Grade B bird processed. This amounted to 0.64 per bird started over the three year period.
Mortality of broilers during rearing has decreased considerably in recent years. Nurse et al. (i960) assumed a 7 percent mortality rate. Data from the broiler cost survey of Pope (1964b) indicate a range of from 1 to 4 percent. It is common practice for hatcheries to provide four extra chicks per one hundred delivered and the chick cost figure of #14..25 per hundred is actually overstated. However, based on the figures of the cost survey (1964) a mortality rate of 4 percent was assumed and the chick price of #14.25 per hundred was considered to be adjusted for mortality.
Because of the variability of labour costs among broiler operations, these costs were not included in the cost calculations. Broiler feed costs were charged at the average commercial feed prices of feed delivered in bulk to broiler establishments in the Fraser Valley during the year 1964- by a local feed cooperative.^ The costs were: #105.00 per ton for starter, l/2 pound of which was fed per bird; #93.90 per ton for grower which was fed until the birds were six weeks old; and #87.4-5 per ton for finisher.
2 It is normal for broiler production costs to be expressed on a per ft.
per year basis as is done with fixed costs in the following section. In order 2
to convert variable costs expressed on a per bird basis, to an annual per ft. basis these costs must be multiplied by two factors. One factor adjusts for the
Surrey Cooperative Association

number of birds raised per f t . per l o t (density) and the other adjusts f o r the
number of l o t s marketed per year (market age and clear period^). For example,
i f b r o i l e r s are raised at 0.7 f t . per b i r d , marketed at eight weeks and a two
week clear period i s allowed between l o t s the variable costs are multiplied by
1.43 and 5.20. The conversion factors for other densities and market ages are
presented i n Appendix 13.
Fixed Costs
Depreciation of buildings and equipment. Appendix 10 contains building
and equipment specifications and costs which are estimated to be t y p i c a l f o r
B r i t i s h Columbia. The cost of the two-storey 10,000 square foot, controlled
environment house described i s estimated at $1.00 per f t . of f l o o r area.
Depreciation of the building over twenty years (straight l i n e method) results
i n an estimated annual cost of f i v e cents per f t . 2 .
Automatic equipment for the building i s estimated at #5,000. or #500. 2
per year. The estimated annual cost then would be f i v e cents per f t . based 7
on s t r a i g h t - l i n e depreciation over ten years.
2
Insurance costs were estimated at 2.248 cents per f t . per year f o r
f u l l coverage of buildings, equipment and birds (Appendix 11). Some b r o i l e r
producers do not insure the birds and others do not carry f u l l coverage on
buildings and equipment. In addition, insurance rates d i f f e r between companies
^The age at which the birds are to be marketed plus a two week clear period.
^Department of National Revenue, Farmer's: and Fisherman's Guide 1964. (Ottawa, Queen's P r i n t e r ) , p. 5.
30
and between d i s t r i c t s depending upon f i r e p r o t e c t i o n . 8 Therefore the estimated
insurance cost may be different than that actually incurred by many growers.
Interest on investment was calculated on the basis of 6„0( percent per
annum. Interest on a $15,000. investment amounts to 4.4V cents per f t . per
year (Appendix 12).
2 These fix e d costs were calculated on a f t . per year basis and totaled
2 io 16.72 cents per f t . per year.
^Dudley Blaschek, 1965, A private communication, Royal Exchange Assurance Corporation, V i c t o r i a .
9Daryl T. Thompson, 1965, A private communication, Accounting Corporation of America, Vancouver.
i^Due to v a r i a b i l i t y of tax rates between areas, the difference due to size of operation, the d i s t r i b u t i o n of taxes between business and dwelling, a charge for taxes was not included i n the t o t a l fixed costs. A similar situation was encountered for repairs. In the following chapter Net Returns i s returns to labour, taxes and repairs.

CHAPTER VI
INFLUENCE OF MARKET AGE AND WEIGHT ON ANNUAL NET RETURNS
The study reported herein indicates that changing b i r d density from 0.7
to 1.0 f t . per b i r d has no s i g n i f i c a n t effect on body weight at nine or ten
weeks of age. At seven and eight weeks of age birds reared at 0.7 f t . 2 per 2
b i r d were s i g n i f i c a n t l y l i g h t e r than those at 1.0 f t . . The fact that t h i s
s i g n i f i c a n t difference did not ex i s t at nine or ten weeks of age and was not
present at s i x weeks of age suggests t h i s difference may be the results of
factors other than density.
In I960, Siegel concluded that the contradictory r e s u l t s obtained from
b r o i l e r density studies may be due to the difference i n genetic stock, or
other environmental factors. Krueger et a l (1961) reported that there was
l i t t l e e f f e c t on growth, l i v a b i l i t y , and market qua l i t y and number of con
demnations for b r o i l e r s reared to eight weeks at f l o o r areas of from 0.6 to
1.2 f t . per b i r d . B i e l y et a l (1963) was unable to demonstrate any s i g n i
f i c a n t difference i n body weight for b r o i l e r s reared to eight weeks at 0.75
and 1.45 f t . per b i r d . The Arkansas Meat Productions Tests (1965) showed
no s i g n i f i c a n t difference at eight weeks of age for b r o i l e r s reared at 0.5,
0.6, 0.7, 0.8 and 1.0 f t . 2 allotments.
In view of these reports and the results of the present experiment i t
was concluded that 0.7 f t . 2 of f l o o r area per b i r d would produce average body
weights comparable to those achieved at 0.8, 0.9 and 1.0 f t . per b i r d at ages
of from s i x to ten weeks. This would be applicable to commercial b r o i l e r pro
duction assuming that the b r o i l e r s were reared i n an insulated, mechanically

32
ventilated building, with adequate feed and water space and good management.
Meat Yi e l d per 1000 Square Feet of Floor Space at 0/7 and JLO Square
Fobt per B i r d . The t o t a l y i e l d i n pounds of meat per 1000 f t . 2 of f l o o r space
per year f o r birds reared at 0.7 and 1.0 f t . 2 per b i r d f l o o r areas and marketed
within the period of s i x to ten weeks of age i s outlined i n Figure 2. I t i s
obvious that annual y i e l d increases as the birds are marketed at heavier
weights. Nurse et a l (I960) plotted annual y i e l d per f t . 2 versus average mar
ket weight and presented a curve with a negative slope. This was due to t h e i r
assumption that as the b r o i l e r s grew older they required more f l o o r space per
b i r d with an average of about one f t . 2 f o r a four pound b i r d and less for
l i g h t e r birds. By marketing l i g h t e r birds (younger), density (number of birds
per l o t ) as w e l l as the number of l o t s per year could be increased. Thus, a
decrease i n the market age resulted i n an increase i n the pounds produced per
year. Such a model however, w i l l not accommodate the findings of the present
work, therefore, i t was decided to determine the influence of market age and 2
weight on net returns per year when b i r d density was constant at 0.7 f t . per
b i r d , regardless of market age and weight. Annual Net Returns Per Square Foot of Floor Area Per Year. To ascer-
2 o
t a i n the annual net returns per f t . using 0,7 f t . of f l o o r area per b i r d
the following calculations were performed.

Total Revenue per ft.* per year (T.R.)
T.R. = AW x P m x L x 1.431
Total Costs per f t . 2 per year (T.C.)
T.C. = F.C. + (V.C.nf x L x 1.43) 4 ( F p x P f x L x 1.4-3) Net Return per f t . 2 per year (N.R.)
N.R. = T.R. - T.C.
AW - Average b i r d weight i n pounds
- Price per pound of l i v e b r o i l e r
L - Number of l o t s of b r o i l e r s produced per year
1.43 - Number of birds produced per f t . 2
F.C. - p Fixed Costs per f t . per year
V.C.nf - Non-feed variable costs per b i r d
F P - Pounds of feed per b i r d
Pf - Price per pound of feed
In Table VI the age and weight at which b r o i l e r s must be marketed to p
maximize annual net returns per f t . of f l o o r area i s presented for each combination of several feed and meat prices. These data, based on allowing 0.7
2
f t . per b i r d , were selected from Appendix 14 which l i s t s the net returns c a l
culated for market ages of s i x to ten weeks for each combination of feed and
meat price.
In t h i s model (Table VI) p r o f i t s are maximized by marketing at nine or
ten weeks of age depending upon feed and meat prices. As indicated, when the
At 0.7 f t . per b i r d each square foot of f l o o r area accommodates 1.43 birds.

34
FIGURE 2
RELATIONSHIP BETWEEN LIVE BODY WEIGHTS AND YIELD OF BROILER MEAT PER 1000 SQUARE FEET OF FLOOR AREA PER YEAR AT BIRD
DENSITIES OF 0.7 AND 1.0 SQUARE FOOT PER BIRD
A clear period of two weeks between successive l o t s i s assumed.

feed price was four cents per pound birds should be marketed at least at ten
weeks of age to maximize net returns within a meat price range of 15-23 cents
per pound. Using a f i v e cent per pound feed price, birds should be marketed
at nine weeks on a 17-19 cent meat price and at least at ten weeks of age with
a 21-23 cent meat price. Thus, as meat price increases f o r any constant feed
price (4.0-5.5 cents per pound), net returns are maximized when birds are mar
keted at heavier weights. Nurse et a l (i960) stated that when meat prices
increased, b r o i l e r s should be marketed younger ( l i g h t e r b i r d s ) . This allows
for the production of more birds per f t . 2 per year r e s u l t i n g i n increased net
returns. S i m i l a r l y , Nurse et a l (i960) recommended keeping the birds longer
and marketing them as heavier b r o i l e r s , when meat price was constant and feed
price increased. This resulted i n decreasing the t o t a l feed consumption per
year f o r birds grown i n a given f l o o r area. The data i n Table VI however,
indicate that b r o i l e r s should be marketed younger (at l i g h t e r weights) under
constant meat price and increasing feed price conditions. The fact that
Nurse et a l (i960) assumed that the number of birds per f t . 2 could be i n
creased as the market age and weight was decreased, accounts for these d i s
crepancies.
Table VII (taken from Appendix 15) indicates the maximum net returns o 2 obtainable per f t . " ' per year when b r o i l e r s are raised at 1.0 f t . with a
fourteen day clear period. P r o f i t s were maximized when birds were marketed
at nine or ten weeks of age depending upon feed and meat price. The p r o f i t
maximizingjmarket age was exactly the same as that f o r b r o i l e r s reared at
0.7 f t . . The increase i n annual net return attained by r a i s i n g b r o i l e r s

TABLE VI
MAXIMUM ANNUAL NET RETURNS PER SQUARE FOOT OF FLOOR AREA
AND ASSOCIATED MARKET AGE AND WEIGHT FOR VARIOUS FEED
AND MEAT PRICES: BIRD DENSITY 0.7 SQUARE FOOT PER BIRD 3
Live B r o i l e r Meat Price Feed Cost (cents per pound) In Cents Per Pound 15 17 19 21 23
4.0 28.4194" 10 4.42
83.155 10 4.42
137.892 10 4.42
192.628 10 4.42
247.365 10 4.42
4.5 -2.245 9 3.91
51.267 10 4.42
106.003 10 4.42
160.740 10 4.42
215.476 10 4.42
5.0 -31.330 9 3.91
21.564 9 3.91
74.457 9 3.91
128.852 10 4.42
183.588 10 4.42
5.5 -60.415 9 3.91
-7.521 9 3.91
45.373 9 3.91
98.266 9 3.91
151.700 10 4.42
3A two week clear period between successive l o t s i s assumed.
4For each combination of feed and meat price, the upper figure refers to the maximum annual net returns per square foot (cents). The second and t h i r d figures are the associated market age (weeks) and weight (pounds), respectively.

TABLE VII
MAXIMUM ANNUAL NET RETURNS PER SQUARE FOOT OF FLOOR AREA
AND ASSOCIATED MARKET AGE AND WEIGHT FOR VARIOUS FEED
AND MEAT PRICES: BIRD DENSITY 1.0 SQUARE FOOT PER BIRD 5
Live B r o i l e r Meat Price Feed Cost (cents per pound) In Cents Per Pound 15 17 19 21 23
4.0 6
14.846 53.123 91.400 129.677 167.955 10 10 10 10 110 4.42 4.42 4.42 4.42 4.42
4.5 -6.598 30.823 69.101 107.378 145.655 9 10 10 10 10 3.91 4.42 4.42 4.42 4.42
, 5.0 -26.937 10.052 47.040 85.078 123.356 9 9 9 10 10 3.91 3.91 3.91 4.42 4.42
5.5 -47.276 -10.287 26.701 63.690 101.056 9 9 9 9 10 3.91 3.91 3.91 3.91 4.42
5A two week clear period between successive l o t s Is assumed.
^For each combination of feed and meat pri c e , the upper figure refers to the maximum annual net return per f t . i n cents. The second and t h i r d figures are the associated market age (weeks) and weight (pounds), respectively.

38 2 ? at 0.7 f t . as compared to that of 1.0 f t . can be seen by comparing Tables VI
and VII. For example, when the feed price was 5.0 cents per pound the net re-2 5 turn f o r 0.7 f t . allotments was greater than that for the 1.0 f t . allotments
by 11.51, 27.42, 43.77 and 60.23 cents for meat prices of 17, 19, 21, and 23 cents per pound,respectively.
Sometimes for reasons beyond t h e i r control producers are unable to ship
b r o i l e r s to market at the desired age. The effect that t h i s would have on
annual net returns can be seen i n Table VIII (taken from Appendix 14.). When
feed costs were 4.0 or 4.5 cents per pound maximum net returns were obtained
by marketing at ten weeks of age. Under these conditions as the meat price i n
creased the penalty for marketing one week e a r l i e r also increased. When feed
prices were 5.0 or 5.5 cents per pound and the desired market weight was nine
weeks at meat prices of 17 and 19, and 19 and 21, respectively, marketing one
week early caused a much larger reduction i n net returns than marketing one
week l a t e . Thus, the severity of the effect of marketing before or after the
desired age i s dependent upon the body weight and the meat and feed prices pre
v a i l i n g . Smith (1965) indicated that the e f f i c i e n c y of feed conversion with
present day commercial b r o i l e r stock i s now better maintained into the heavier
weights. For t h i s reason present day b r o i l e r growers incur a smaller penalty
than did growers i n the early 1950's by marketing e a r l i e r or l a t e r than the
desired market age.
The data i n Table IX (taken from Appendix 16) indicate the age and
weight at which b r o i l e r s should be marketed to maximize net returns when the
number of l o t s of birds marketed yearly was li m i t e d to 4.33 (twelve week

TABLE VIII
THE DECREASE IN ANNUAL NET RETURNS PER SQUARE FOOT OF
FLOOR AREA INCURRED BY MARKETING ONE WEEK EARLIER OR
ONE WEEK LATER THAN OPTIMUM FOR VARIOUS FEED AND
MEAT PRICES: BIRD DENSITY 0.7 SQUARE FOOT PER BIRD 7
Live B r o i l e r Meat Price Feed Cost (cents per pound) In Cents Per Pound 15 17 19 21 23
4.0 1.628 3.4 5.3 7.1 9.0 (10) » •
(10) • •
(10) • •
(10) • •
(10) * •
4.5 -8.6 0.6 2.5 4.3 6.1 (9) (10) (10) (10) (10)
-1.2 • • • • • • • •
5.0 -5.9 8.7 11.5 1.5 3.3 (9) (9) (9) (10) (10)
-4.0 2.2 0.3 • • • •
5.5 -3.2 -6.0 8.8 11.5 0.5 (9) (9) (9) (9) (10)
-6.8 -5.0 3.1 1.3 • •
A two week clear period between successive l o t s i s assumed.
% o r each combination of feed and meat price the upper and the lower figures indicate the respective decrease (cents) i n net return per f t . 2 per year incurred by marketing one week e a r l i e r or one week l a t e r than optimum, . The middle figure i s the market age i n weeks at which net returns per f t . 2 per year are maximized, i . e . , the optimum market weight.

replacement cycle) and the density at which they were reared was specified at 2 9
1.0 f t . per b i r d . For each combination of feed and meat prices where posi
t i v e maximum net returns were found, the magnitude of net returns was maximized
by marketing at ten weeks of age. Under t h i s production-controlled system, the
market tvould receive birds of maximum body weight (4.42 pounds) at ten weeks of
age. The market, however, requires some l i g h t e r birds f o r i n s t i t u t i o n a l trade.
In order to obtain such birds i t then would be necessary for the buyer to pay a
premium for the l i g h t e r birds. This premium would need to be of such magnitude
that for each combination of feed and meat prices the net returns would be at
least equal to those obtained by r a i s i n g the birds to ten weeks of age (Appen
dix 16).
The same situ a t i o n e x i s t s when there i s no r e s t r i c t i o n on the number of
l o t s that can be marketed per year. Again a premium would be required to bring
forth l i g h t e r birds and I t s magnitude can be e a s i l y obtained from Appendix 15.
In many cases the minimum premium necessary to maintain net,returns i s very
small. In practice the premium offered would probably need to be considerably
more than the minimum to entice growers to market birds at l i g h t e r weights.
The data i n Table X indicate maximum net returns per square foot of
f l o o r space with a twelve-week replacement cycle and a 0.7 f t . per b i r d f l o o r
•'When controls are placed on the number of l o t s of birds reared per year at a given f l o o r area per b i r d as may occur under a Marketing Board, such controls are referred to i n t h i s thesis as production-controlled or controlled replacement. When these conditions e x i s t c a l c u l a t i n g net returns becomes analogous to determining the market age and weight required to maximize net returns per l o t .
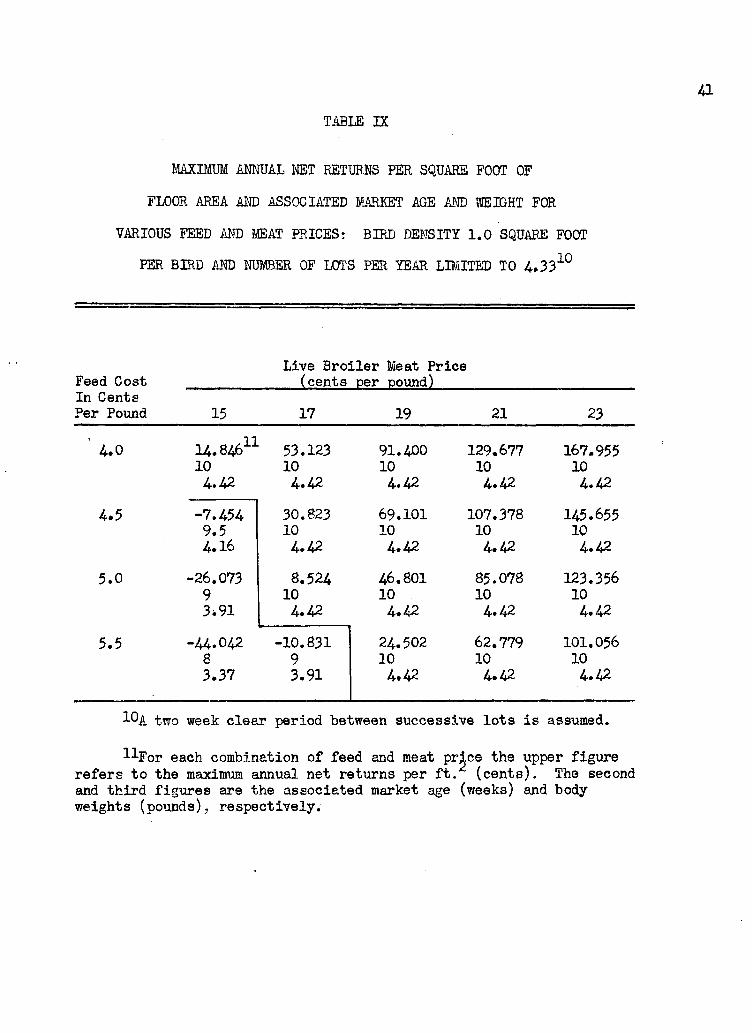
TABLE IX
MAXIMUM ANNUAL NET RETURNS PER SQUARE FOOT OF
FLOOR AREA AND ASSOCIATED MARKET AGE AND WEIGHT FOR
VARIOUS FEED AND MEAT PRICES: BIRD DENSITY 1.0 SQUARE FOOT
PER BIRD AND NUMBER OF LOTS PER YEAR LIMITED TO 4.33 1 0
Live B r o i l e r Meat Price Feed Cost (cents per pound) In Cents Per Pound 15 17 19 21 23
4.0 14.84611 53.123 91.400 129.677 167.955 10 10 10 10 10 4.42 4.42 4.42 4.42 4.42
4.5 -7.454 30.823 69.101 107.378 145.655 9.5 10 10 10 10 4.16 4.42 4.42 4.42 4.42
5.0 -26.073 8.524 46.801 85.078 123.356 9 10 10 10 10 3^91 4.42 4.42 4.42 4.42
5.5 -44.042 -10.831 24.502 62.779 101.056 8 9 10 10 10 3.37 3.91 4.42 4.42 4.42
10A two week clear period between successive l o t s i s assumed.
HFor each combination of feed and meat price the upper figure refers to the maximum annual net returns per f t . (cents). The second and t h i r d figures are the associated market age (weeks) and body weights (pounds), respectively.

space allotment. Net returns were maximized by marketing at ten weeks of age.
The obvious increase i n net returns per f t . 2 per year over a 1.0 f t . 2 a l l o t
ment (Table IX) was due to the increased number of birds produced.
I f the density allotment were changed from 1.0 to 0.7 f t . 2 per b i r d
there would be an increase i n the number of b r o i l e r s coming onto the market
(1.43 birds per f t . 2 i n place of 1 b i r d per f t . 2 ) . This could cause meat
price to decline and possibly lower the net returns per f t . per year. For
example, i f the price declined two cents per pound (from 21^ to 19<£) at a
feed price of f i v e cents per pound the net returns per f t . * of f l o o r area
for birds reared at 0.7 f t . 2 per b i r d would be 74.115 cents (Table X). This
i s 10.963 cents (85.078^ - 74.115<£) less than net returns received when birds 2
were grown at the 1.0 f t . allotments at the 21 cent meat price p r i o r to the
increase i n density. An increase i n output by increasing b i r d population
density can be achieved without a concomitant drop i n price only i f i t i s
assumed that a market i s available f o r the additional product.
The influence of a controlled replacement program on net returns can
be seen from a comparison of Tables VI and X and Tables VII and IX. In most
cases maximum net returns occurred at ten weeks of age and, with few excep
tion s , net returns were i d e n t i c a l regardless of whether the number of l o t s
were controlled or not controlled. There were four combinations of feed and
meat prices at which s l i g h t l y greater returns resulted from nine week mar-2 keting under the uncontrolled system. When the birds were reared at 0.7 f t .
(Tables VI and X) and when the feed price was 5.0 cents per pound and meat
prices 17 and 19 cents the differences i n net returns i n favour of the open

TABLE X
MAXIMUM ANNUAL NET RETURNS PER SQUARE FOOT OF
FLOOR AREA AND ASSOCIATED MARKET AGE AND WEIGHT FOR
VARIOUS FEED AND MEAT PRICES: BIRD DENSITY 0.7 SQUARE FOOT 12
PER BIRD AND NUMBER OF LOTS PER YEAR LIMITED TO 4.33
Live B r o i l e r Meat Price Feed Cost (cents per pound) In Cents Per Pound 15 17 19 21 23
4.0 28.419 83.155 10 10 4.42 4.42
137.892 10 4.42
192.628 10 4.42
247.365 10 4.42
4.5 -3.469 9.5 4.16
51.267 10 4.42
106.003 10 4.42
160.740 10 4.42
215.476 10 4.42
5.0 -30.095 9 3.91
19.379 10 4.42
74.115 10 4.42
128.852 10 4.42
183.588 10 4.42
5.5 -55.791 8 3.37
-8.299 9 3.91
42.227 10 4.42
96.963 10 4.42
151.700 10 4.42
12 A two week clear period between successive l o t s i s assumed.
l^For each combination of feed and meat price the upper figure refers to the maximum annual net returns per f t . 2 (cents). The second and t h i r d figures are the associated market age (weeks) and body-weights (pounds), respectively.

44
system were 2.195 cents and 0.342 cents respectively per f t . 2 per year. When feed price was 5.5 cents per pound and meat prices 19 and 21 cents the d i f f e r ences i n favour of the open system were 3.146 and 1.303 cents respectively per
2 f t . per year.
Removal of production control (assuming a two week clear period was
maintained) t h e o r e t i c a l l y would have no effect on the number or weight of
birds marketed except under the four combinations of feed and b r o i l e r prices
mentioned above. I f any of these four b r o i l e r and feed price combinations
existed i t would be expected that a greater number of bir d s of l i g h t e r weight
would be marketed. The increase expected would be approximately 9.2%. The
depression i n price which could res u l t from such an increase could e a s i l y
eliminate the advantage of the open market sit u a t i o n which was i n i t i a l l y
superior to controlled production by only a f r a c t i o n of a cent per f t . per
year at comparable b r o i l e r prices.
2 I f the controlled density and replacement cycle of 1.0 f t . per b i r d
and twelve weeks respectively (Table IX) was removed, a large increase i n net
returns would occur. This assumes that the increased numbers of birds which
could be expected on the market by rearing at greater density to as low as
0.7 f t . per b i r d would not depress market price (Table IX and Table VI).
That t h i s assumption i s u n r e a l i s t i c i s obvious when i t i s seen that.the -
U (1.43H 4.73) - (1.43 U4.33) (1.43)(4.33) x 100 = 9.2J6
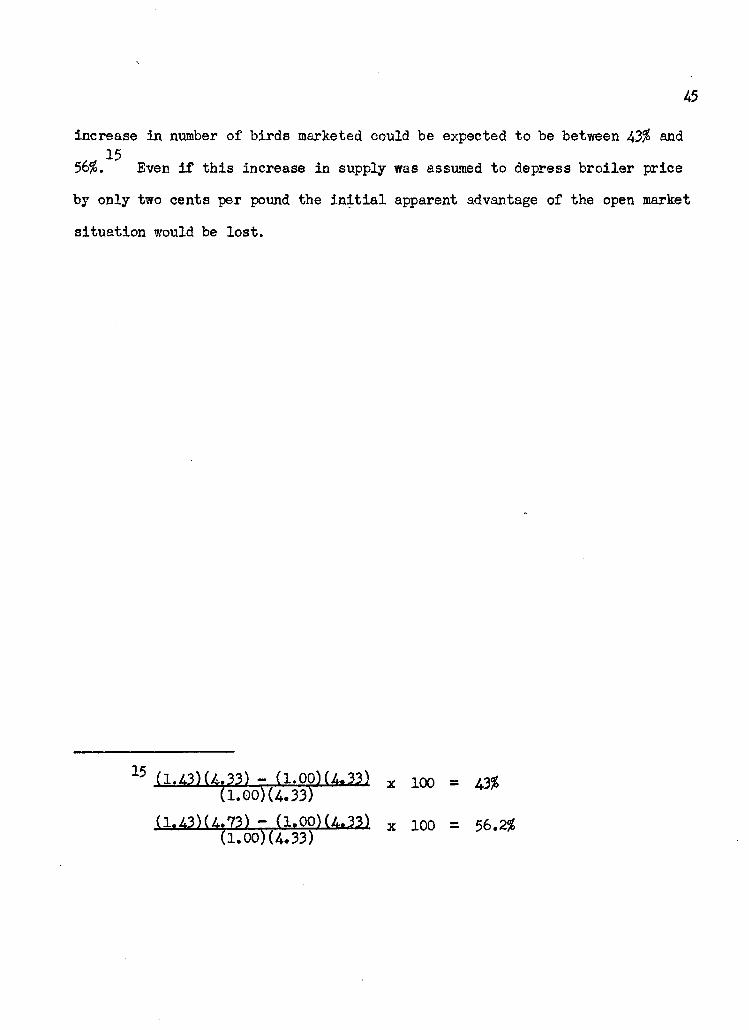
increase i n number of birds marketed could be expected to be between 4 3 $ and 1 5
5 6 $ . Even i f t h i s increase i n supply was assumed to depress b r o i l e r price
by only two cents per pound the i n i t i a l apparent advantage of the open market
situa t i o n would be l o s t .
1 5 ( 1 . 4 3 ) ( 4 . 3 3 ) - ( l . 0 0 ) ( 4 . 3 3 ) x 1 0 0 = 4 3 $
( l . O O ) ( 4 . 3 3 )
( l r 4 3 ) ( 4 . 7 3 ) - ( l t o p ) ( 4 t 3 3 ) x i o o = 5 6 . 2 $
( 1 . 0 0 ) ( 4 . 3 3 )

CHAPTER VII
SUMMARY
Sixteen hundred and twenty-four commercial b r o i l e r chickens were
reared as mixed sexes under f i v e d i f f e r e n t f l o o r space areas (0.6, 0.7,
0.8, 0,9, and 1.0 f t . 2 per bird) to study the effect of density on produc
ti o n e f f i c i e n c y and annual net returns per f t . 2 of f l o o r area* The chick
ens were fed a commercial b r o i l e r r a t i o n according to the manufacturer ls
recommendations. Individual body weights and feed consumption per pen
were taken at weekly i n t e r v a l s u n t i l the birds reached ten weeks of age.
The birds reared at 0,7 f t . 2 f l o o r area were the heaviest during
the one to four week period. This difference i n body weight may have been
due to differences i n feed space per f t . 2 of f l o o r area, the s o c i a l behav
i o r of the birds or merely a pen e f f e c t . On a combined-»sex basis, no s i g
n i f i c a n t differences among densities were observed i n nine week mean body p
weight. At ten weeks of age the mean body weight of the birds at 1,0 f t .
density was s i g n i f i c a n t l y superior to that of birds with 0,6 f t . per b i r d .
There were no s i g n i f i c a n t differences among the mean body weights of b r o i l -p
ers reared at 0.7, 0.8, 0.9 and 1.0 f t , per b i r d at ten weeks of age.
Mortality was not affected by b i r d density. The percentage of
breast b l i s t e r s at slaughter (73 days) was d i r e c t l y related to the f l o o r
area per b i r d .
B r o i l e r production costs were developed and used i n models to deter
mine at what age maximum net returns per f t , 2 of f l o o r area per year
occurred, for various combinations of feed and meat prices. I t was assumed p
that weekly mean body weights of birds grown at 0.7 and 1.0 f t . per b i r d

were equal and that a two week clear period was provided between success
ive l o t s . Under these assumptions, the market age at which annual net
returns were maximized was nine or ten weeks, depending upon feed and meat
priees.
When i t was assumed that b r o i l e r s were reared at a f i x e d density,
that did not change with market age, and a two week clear period was allowed
between l o t s , the following observations were made:
(a) for any given feed price, as meat price increased annual
net returns per f t , 2 could be maximized by marketing
l a t e r (heavier and older b i r d s ) ,
(b) for any given meat price as feed price increased annual
net returns per f t , 2 could be maximized by marketing
e a r l i e r ( l i g h t e r and younger b i r d s ) .
The magnitude of the effect on annual net returns per f t , 2 of f l o o r
area of marketing one week e a r l i e r or l a t e r than the age of greatest net
returns varied with feed and meat prices. As meat prices increased the
loss incurred by marketing one week e a r l i e r also increased.
When production controls, consisting of a twelve week replacement
program ( i . e . no more than 4*33 l o t s per year) were also assumed, maximum
net returns per f t , 2 were found to occur by marketing no younger than ten
weeks of age for any feed and meat price combination considered. Under these
conditions the market would receive l i g h t e r weight b i r d s , i . e . younger than
ten weeks, only by the payment of a premium price s u f f i c i e n t to r e s u l t i n
an annual net return equal to that which would have been received by mar
keting at ten weeks.

4-8
A comparison of models with and without the assumption of pro
duction controls indicated that with few exceptions, maximum annual net
returns occurred at the same market age, i . e . ten weeks*
The influence of population density on annual production per f t . 2
and i t s implications with regard to b r o i l e r prices and net returns under
several model systems was discussed.

49
BIBLIOGRAPHY
Adams, J . L., W. J. Owings. 1964. The performance of laying chickens housed at various densities on l i t t e r f l o o r . Poultry S c i . , 43: 1298. (Abstract)
Arkansas Meat Performance Test No. 9-B. 1965. Preliminary report. F a y e t t e v i l l e , Arkansas. Mimeographed report, 6 pp.
Baker, R. L. 1964. Some aspects of marketing poultry meat i n the U.S.A. World's Poultry S c i . Journal, 20: 193-207.
Baum, E. L., H. B. Fletcher, H. G. Walkup and W. J . Standelman. 1953. An application of p r o f i t maximizing techniques to experimental fryer input-output data. Poultry S c i . , 32: 375-382.
Baum, E. L., and H. G. Walkup. 1950. Problems i n poultry meat production In the p a c i f i c northwest. Poultry S c i . , 29: 858-861.
1951. A further comment on p r o f i t maximization i n fryer production. Journal of FarmEcon., 33: 259-261.
1953. Some economic implications of input-output relationships i n f ryer production. Journal of Farm Econ., 35: 223-235.
1956. Economic considerations i n fryer production and marketing i n the p a c i f i c northwest. Poultry S c i . , 33: 90-107.
Berg, L. R. 1958. Production costs of fryers marketed at different ages. Western Washington Experimental Station. Mimeographed report, 6 pp.
B i e l y , Jacob, C. W. Roberts, B. E. March and W. H. Pope. 1963. B r o i l e r feeding and management at the 10th B.C. random sample meat test. Poultry Branch, B.C. Department of Agriculture, Publication 149. V i c t o r i a , Queen's Pr i n t e r .
Blaschek, Dudley. 1965. A private communication. Royal Exchange Assurance Corporation, V i c t o r i a , B. C.
Bray, D. F., J . B i e l y and W. H. Pope. 1962. The relationship of r a t i o n ingredient to the concept of genotype x. environment interaction as demonstrated i n B r i t i s h Columbia random sample b r o i l e r t e s t s . Poultry S c i . , 41s 1367-1374.
Brody, S. 1945. Bioenergetics and growth. Reinhold Publishing Corporation, New York.
50
Brooks, D. L., G. G. Judge, R. H. Thayer and G. W. Newell. 1957. The economic impact of fl o o r space on b r o i l e r production. Poultry S c i . , 36: 1107-1121.
— 1958. Analysis of the economic, technical and sampling measure. Poultry S c i . , 37: 1189-1198.
Canada Department of Agriculture, 1957-1965. Poultry Market Weekly Reports, Ottawa, Queen's Printer.
Canada Department of Agriculture, Production and Marketing Branch, 1965. A Private Communication, Ottawa.
C o l l i a s , N. E. 1950. The s o c i a l i z a t i o n of chicks. Anat. Rec., 108: 65.
Cook, R. E., C. W. Hess, J. L. Carmon, E. F. Dembnicki. 1962. Importance of genotype-environment interactions at various ages i n b r o i l e r type chickens. Poultry S c i . , 41: 1637.
Combs, G. F., and J. L. Nicholson. 1965. E f f e c t of protein l e v e l and quality on performance of b r o i l e r chickens separated by sexes. University of Maryland, Miscellaneous Publication 558.
Department of National Revenue. 1964. Farmer's and Fisherman's Guide. Ottawa, Queen's Printer.
Dominion Bureau of S t a t i s t i c s . Shipments of prepared stock and poultry feeds. August 1965. 19, No. 8. Ottawa, Queen's Printers.
Duncan, D. B. 1955. Multiple range and multiple F test s . Biometrics, 11: 1-42.
Ewing, Ray. 1963. Poultry n u t r i t i o n . F i f t h E d i t i o n , The Ray Ewing Company, Pasadena, C a l i f o r n i a .
Guhl, A. M. 1958. The development of s o c i a l organization i n the domestic chick. Animal Behaviour, 6: 92-111.
Guhl, A. M. 1953. S o c i a l behavior of the domestic fowl. Kansas A g r i c u l t u r a l Experimental Station, Technical B u l l e t i n 73.
Hansen, Reed S., and W. A. Becker. I960. Feeding space, population density and growth of young chickens. Poultry S c i . , 39: 654-661.
H i l l , A. W. 1965. Do Canadian consumers prefer white or yellow skinned b r o i l e r s ? Canada Poultryman, September 1965, pp. 4-6.
Hoepner, Paul H., and R. J. Freund. 1964. A methodological approach to the estimation of time-quality b r o i l e r production functions. A g r i c u l t u r a l Experimental Station, V i r g i n i a Polytechnic I n s t i t u t e , Technical B u l l e t i n 170.
51
Ince, J. H., and W. P. Jaffe. 1961. V a r i a b i l i t y i n the growth response of chicks. Poultry S c i . , 40: 67-73.
Krueger, W. F., C. B. Ryan, W. 0. Cawley and J. H. Quisenberry. 1961. The influence of certain management practices on condemnation losses i n b r o i l e r s . Poultry S c i . , AO: H21-L422.
McCoy, John L. 1965. Homemakers opinions and preferences for b r o i l e r fryers and turkeys. S t a t i s t i c a l reporting service. United States Department of Agriculture. Washington Government Pr i n t i n g Office. (Preliminary Report).
McPherson, B. N., N. R. Gyles and J. Kan. 1962. The effects of handling frequency on 8 week body weight, feed conversion and mortality. World's Poultry S c i . Journal, 18: 180 (Abstract).
M e r r i t t , E. S. 1959. Differences i n market quality between b r o i l e r strains as evaluated by market grading. Canadian Journal of Animal S c i . , 39: 121-127.
M e r r i t t , E. S., J. H. Downs, R. Bordeleau and B. F. Tinney. I960. Growth; v a r i a b i l i t y of growth and market quality of b r o i l e r s on mash and p e l l e t s . Canadian Journal of Animal S c i . , 4.0: 7-14-.
Me r r i t t , E. S., and R. S. Gowe. 1956. Environment and poultry problems. Canadian Journal of Animal S c i . , 36: 72-82.
Moreng, R. E., H. L. Enos, E. G. Buss and T. E. Hartung. 1961. The r e l a t i o n ship of f l o o r space to factors influencing b r o i l e r growth. Poultry S c i . , 40: 1039-1044.
Noles, R. K., and J. H. Padgett. 1964a. Guides to the use of resources. University of Georgia, Athens. Mimeographed report, 39 pp.
^ 1964b. Guides to the use of resources, the continuous operation. University of Georgia, Athens. Mimeographed report, 14 pp.
Nurse, J . , G. Trant and J. Walker. I960. B r o i l e r weights and p r o f i t s . Departments of A g r i c u l t u r a l Economics and Poultry Science, Guelph, Ontario A g r i c u l t u r a l College B u l l e t i n .
Ota, H., and H. L. Garver. 1954- Studies on the growth of baby chicks to fry i n g chickens i n the poultry calorimeters. Annual Meeting of the American Society Agriculture Engineers, Minneapolis, Minnesota.
Pope, W. H. 1964a. Annual report of poultry branch, B r i t i s h Columbia. Department of Agriculture, V i c t o r i a . Mimeographed report, 39 pp.
1964b. B r o i l e r cost comparison 3 year summary. B r i t i s h Columbia Department of Agriculture, V i c t o r i a . Mimeographed report.
52
Prince, R. P., W. C. Wheeler, W. A. J u n i l a , L. M. Potter and S. P. Singsen. 1958. Effect of temperature on feed consumption and weight gains i n b r o i l e r production. University of Connecticut, Progress Report 33.
Prince, R. P., J. H. Whitaker, L. D. Matterson and R. E. Luginbuhl. 1965. Response of chickens to temperature and r e l a t i v e humidity. Poultry S c i . , 44: 73-78.
Proudfoot, F. G., R. S. Gowe and B. F. Cheney. 1957. Studies on the design of comparative poultry tests. A comparison of three strains of white leghorns housed i n replicated f i f t y - b i r d pens and intermingled i n a large pen. Canadian Journal of Animal S c i . , 37: 168-178.
Roy, Ewell P. 1965. A Private Communication. Louisiana State University, Baton Rouge.
Sanz-Arias, R., and A. Paz-Saez. 1963. Determination of the best sale weight of heavy breed b r o i l e r s . World's Poultry S c i . Journal, 19: 231.
Siegel, H. S. I960. Ef f e c t of population density on the pituitary-adrenal c o r t i c a l axis of cockerels. Poultry S c i . , 39: 500-509.
Sieg e l , P. B., and R. H. Coles. 1958. Effects of f l o o r space on b r o i l e r performance. Poultry S c i . , 37: 1243.
S i e g e l , P. B., W. L. Beane and C. Y. Kramer. 1963. The measurement of feeding a c t i v i t y i n chickens from 0 to 8 weeks of age. World's Poultry S c i . Journal, 19: 594-608.
Smith, E. J. 1965. Technology i n b r o i l e r production. Economic Research Service, United States Department of Agriculture, C i r c u l a r 246. U.S. Government P r i n t i n g Office.
Smith, H. D., P. R. Poffenberger and S. H. De Vault. 1949. Relationship of production factors to out-of-pocket b r o i l e r costs and p r o f i t s . Maryland A g r i c u l t u r a l Experimental Station, Publication 91. University of Maryland.
Smith, R..M., J. Kan and T. R. C. Rokeby. 1962. The effects of poultry housing on b r o i l e r weight, feed conversion, and mortality. Poultry S c i . , 41: 594-608.
Stephenson, E. L., J. M. Bezanson and C. F. H a l l . I960. Factors affecting the incidence and severity of a breast b l i s t e r condition i n b r o i l e r s . Poultry S c i . , 39: 1520-1524.
Thompson, Daryl T. 1965. A Private Communication. Accounting Corporation of America, Vancouver, B. C.

53
Trant, G. I . , and J. W. L. Winder. 1961. Time opportunity costs i n b r o i l e r production. Journal of Farm Economics, A3: 939-957.
Wiseman, E. L., W. L. Beane, W. R. Luckman and E. 0. Essary. 1961. E f f i c i e n c y of growing b r o i l e r s to a heavier weight. Poultry S c i . , AO: 1705-1712.
Wiseman, E. L., and W. L. Beane. 1965. Eff e c t of some management factors on the incidence of breast b l i s t e r s i n heavy b r o i l e r s . Poultry S c i . , A4: 737-7A1.
54
-APPENDIXES
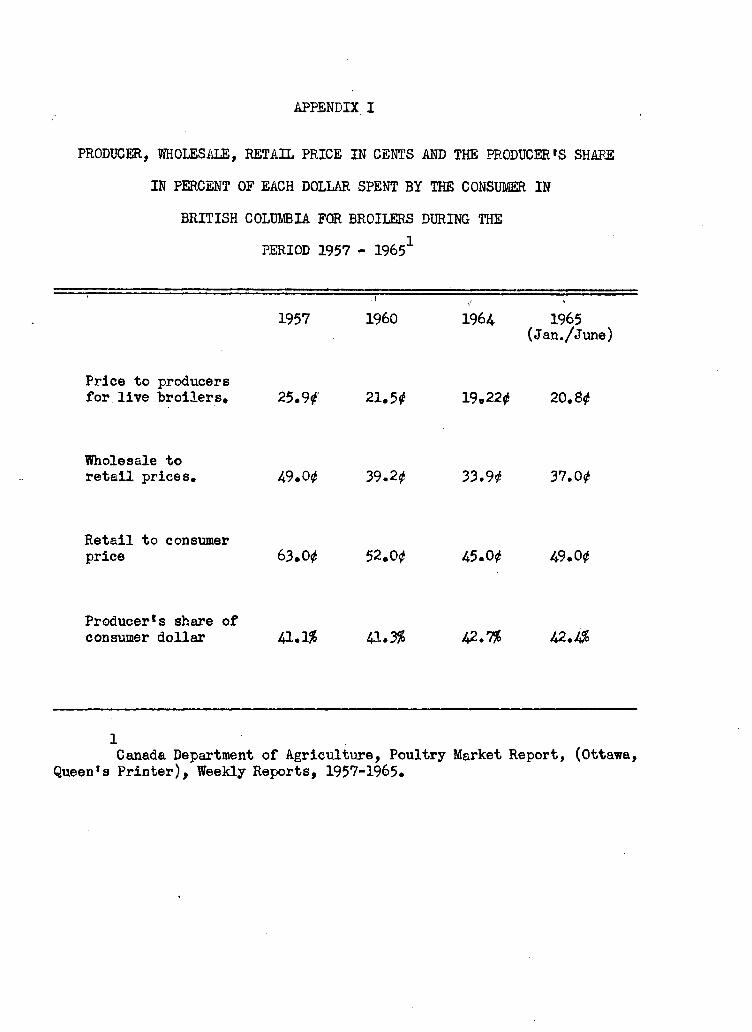
APPENDIX I
PRODUCER, WHOLESALE, RETAIL PRICE IN CENTS AND THE PRODUCERS SHARE IN PERCENT OF EACH DOLLAR. SPENT BY THE CONSUMER IN
BRITISH COLUMBIA FOR BROILERS DURING THE PERIOD 1957 - 19651
1957 I960 1964 1965 (Jan./June)
Price to producers for live broilers. 25.9*' 21.5* 19.22* 20.8*
Wholesale to retail prices. 49.0* 39.2* 33.9* 37.0*
Retail to consumer price 63.0* 52.0* 45.0* 49.0*
Producerls share of consumer dollar 41.1$ 41.3$ 42.7% 42.4$
1 Canada Department of Agriculture, Poultry Market Report, (Ottawa,
Queen's Printer), Weekly Reports, 1957-1965.
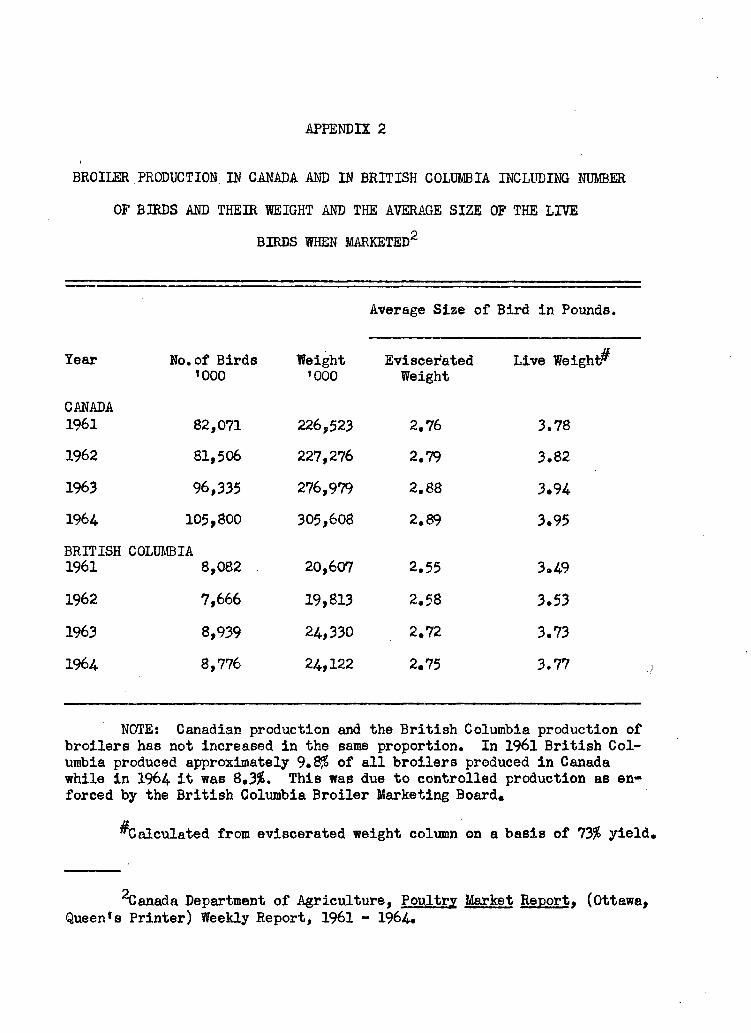
APPENDIX 2
BROILER PRODUCTION. IN CANADA AND IN BRITISH COLUMBIA INCLUDING NUMBER
OF BIRDS AND THEIR WEIGHT AND THE AVERAGE SIZE OF THE LIVE
BIRDS WHEN MARKETED2
Average Size of B i r d i n Pounds.
Year No.of Birds 'OOO
Weight '000
Eviscerated Weight
Live Weight^
CANADA 1961 82,071 226,523 2.76 3.78 1962 81,506 227,276 2.79 3.82 1963 96,335 276,979 2.88 3.94 1964 105,800 305,608 2.89 3.95 BRITISH 1961
COLUMBIA 8,082 20,607 2.55 3.49
1962 7,666 19,813 2.58 3.53 1963 8,939 24,330 2.72 3.73 1964 8,776 24,122 2.75 3.77
NOTEs Canadian production and the B r i t i s h Columbia production of b r o i l e r s has not Increased i n the same proportion. In 1961 B r i t i s h Columbia produced approximately 9.8$ of a l l b r o i l e r s produced i n Canada while i n 1964 i t was 8.3$. This was due to controlled production as enforced by the B r i t i s h Columbia B r o i l e r Marketing Board.
^Calculated from eviscerated weight column on a basis of 73$ y i e l d .
Canada Department of Agriculture, Poultry Market Report, (0ttawa:
Queen*s Printer) Weekly Report, 1961 - 1964.

^APPENDIX 3
FORTY POUND HANGING FEEDER3
^Each feeder supplied 52" of feed space. Based on supplying one inch of feed space per b i r d (2 feeders per 100 birds) started, three or four feeders were supplied to each pen as required. Wooden blocks were i n s t a l l e d i n the feed trough to r e s t r i c t the actual feeding space to the required equivalent feeding area. These blocks were cut to shape from §• inch plywood and i n s t a l l e d i n the feeding tray. When the blocks were i n place, the chicks had access to feed only i n the exposed areas of the feed trough.
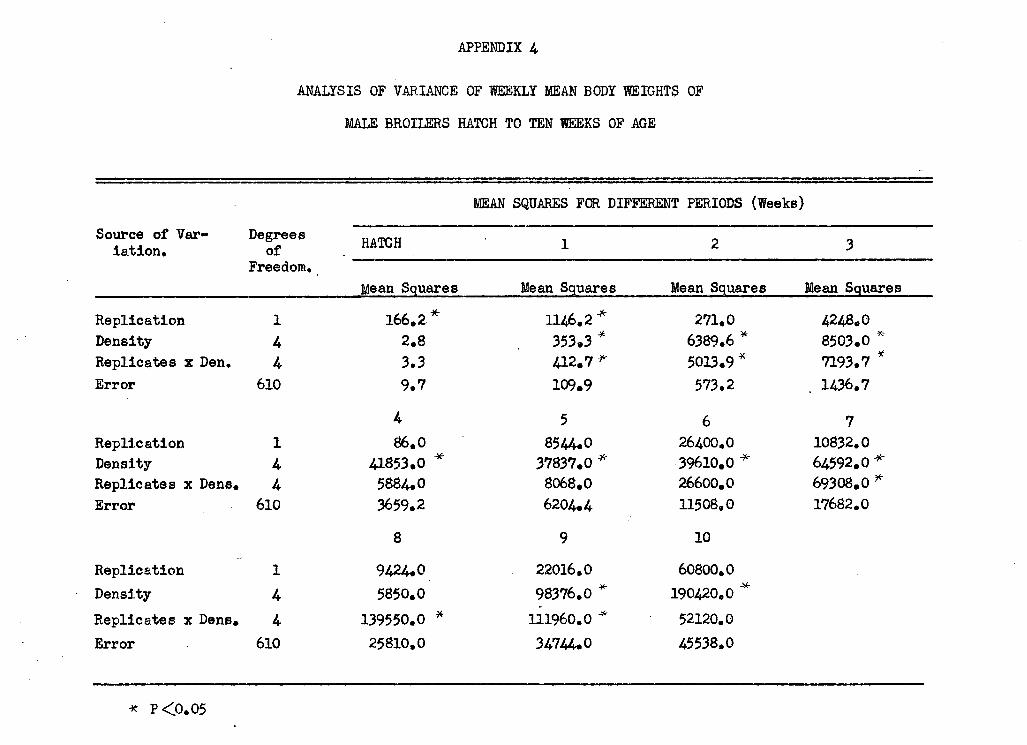
APPENDIX 4
ANALYSIS OF VARIANCE OF WEEKLY MEAN BODY WEIGHTS OF
MALE BROILERS HATCH TO TEN WEEKS OF AGE
MEAN SQUARES FOR DIFFERENT PERIODS (Weeks) Source of Var
i a t i o n . Degrees
of Freedom.
HATCH
Mean Squares Mean Squares Mean Squares Mean Squares
Replication 1 Density 4 Replicates x Den. 4 Error 610
Replication 1 Density 4 Replicates x Dens. 4 Error 610
Replication 1 Density 4 Replicates x Dens. 4 Error 610
166.2* 2.8 3.3 9.7
4 86.0
41853.0 * 5884.0 3659.2
8
9424.0 5850.0
139550.0 * 25810,0
1146.2* 353.3 * 412.7* 109.9
5 8544.0
37837.0 * 8068.0 6204.4
9 22016.0 98376.0 * 111960.0 * 34744.0
271.0 6389.6 5013.9 573.2
6 26400.0 39610.0 * 26600.0 11508,0
10
60800.0 190420,0 * 52120.0 45538.0
4248.O 8503.0 7193.7 1436,7
7 10832,0 64592.0*" 69308.0 *" 17682.0
* P<0.05

APPENDIX 5
ANALYSIS OF VARIANCE OF WEEKLY MEAN BODY WEIGHTS OF FEMALE BROILERS, HATCH TO TEN WEEKS OF AGE
MEAN SQUARES FOR DIFFERENT PERIODS (Weeks)
Source of Var Degrees HATCH 1 2 3 iation, of
Freedom, Mean Squares Mean Squares 'Mean Squares Mean Squares
Replication 1 196.4* 2037,7 20.2 7174*0 * Density 4 14.5 3563.7 * 4217.1 * 6405.7 * Replicate x Dens, u 13.8 244.5 * 1834*1 * 3306.7* Error 610 7.72 81,4 389.1 988.8
4 5 6 7 Replication 1 6634.0 628.0 28148,0 * 31648.0 Density 4 28117.0 * 34055.0 * 8470,0 10562.0 Replicate x Dens, 4 3015*5 26658,0 * 20190.0 * 13048.0 Error 610 2296.8 3839.1 6385.1 9802.9
8 9 10 Replication 1 42400.0 98464,0 * 44032,0 Density 4 16312.0 16812,0 71776,0 * Replicate x Dens, 4 30940.0 18864,0 23136,0 Error 610 13408,0 16903.0 21332,0
* P<0.05
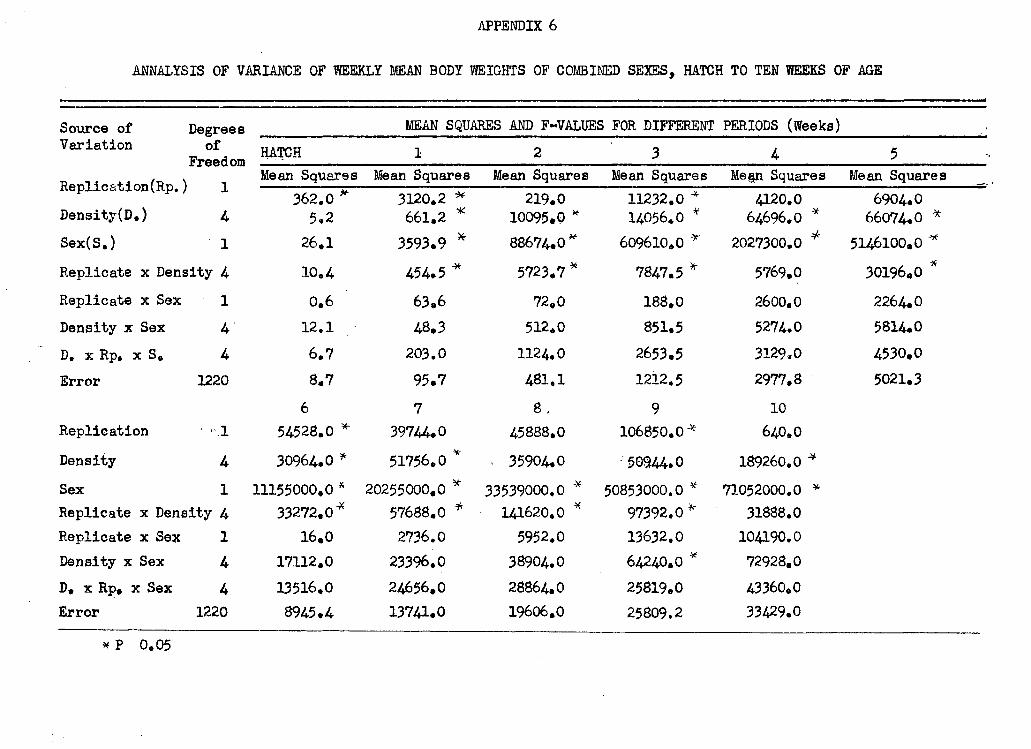
APPENDIX 6
ANNALYSIS OF VARIANCE OF WEEKLY MEAN BODY WEIGHTS OF COMBINED SEXES, HATCH TO TEN WEEKS OF AGE
Source of MEAN SQUARES AND F-VALUES FOR DIFFERENT PERIODS (Weeks) Variation of
Freedom HATCH 1 2 3 4 5
Replication(Rp.) Density(D.)
1 A
Mean Squares Mean Squares Mean Squares Mean Squares Mean Squares Mean Squares Replication(Rp.) Density(D.)
1 A
362.0 * 5,2
3120.2 * 661.2 *
219.0 10095.0 *
11232,0 * 14056.0 *
4120.0 64696.O *
6904.0 66074.0 *
Sex(S.) 1 26,1 3593.9 * 88674.0* 609610.0 *" 2027300.0 * 5146100.0 * Replicate x Density 4 10.4 454.5 * 5723.7 * 7847.5 * 5769.0 30196.0 * Replicate x Sex 1 0,6 63 86 72,0 188,0 2600,0 2264.0 Density x Sex A 12.1 48.3 512.0 851.5 5274.0 5814.0 D. x Rp» x S, A 6.7 203.0 1124.0 2653.5 3129.0 4530.0 Error 1220 8.7 95.7 481.1 1212.5 2977.8 5021.3
6 7 8 . 9 10 Replication •1 54528.0 * 39744.0 45888,0 106850.0^ 640.0 Density A 30964.0 * 51756,0 * • 35904.0 50944.0 189260.0 * Sex 1 11155000,0 * 20255000,0 * 33539000.0 * 50853000.0 * 71052000.0 * Replicate x Density A 33272,0* 57688.0 * 141620.0 * 97392.0* 31888.0 Replicate x Sex 1 16.0 2736.0 5952.0 13632.0 104190.0 Density x Sex A 17112.0 23396.0 38904.0 64240,0 * 72928.0 D, x Rp, x Sex A 13516.0 24656.O 28864.0 25819.0 43360,0 Error 1220 8945.4 13741.0 19606.0 25809.2 33429.0
* P 0.05
APPENDIX 7
DAILY TEMPERATURE AND RELATIVE HUMIDITIES AS RECORDED BY THE UNIVERSITY
OF BRITISH COLUMBIA METEOROLOGICAL STATION SITUATED IN THE CLOSE
PROXIMITY OF THE POULTRY FARM - JULY 6 TO SEPTEMBER 16, 1965
'JULY 1965 AUGUST 1965 SEPTEMBER 1965
D / A Temperature*- ; Mean Temperature Mean Temperature Mean T Relative Relative Relative E High Low Humidity High Low Humidity High Low Humidity .1 80 66 52 65 57 74 2 74 62 71 59 54 78 3 60 58 97 R 61 54 73 4 57 56 98 R. 62 53 81 5 66 55 90 62 55 79 6 76 57 53 72 54 72 69 58 51 7 74 58 53 76 59 74 64 56 62 8 60 52 78 64 60 96 R 63 55 69 9 60 51 81 73 56 76 64 55 81 10 63 50 77 73 60 68 64 57 74 11 61 52 82 71 59 80 R 60 53 79 12 68 51 56 64 60 84 R 61 54 74 13 71 51 74 69 56 72 57 53 88 14 74 59 68 69 52 83 63 54 87 15 73 59 63 70 54 81 58 52 69 16 72 54 74 71 55 78 58 49 41 17 71 53 76 57 68 18 66 54 60 80 61 62 19 64 52 65 66 59 75 R 20 65 55 73 67 58 90 R 21 64 54 75 70 55 87 22 67 55 76 70 57 86 23 71 53 73 58 57 97 R 24 77 54 60 60 57 92 R 25 77 61 73 67 57 80 26 80 62 46 67 59 66 27 70 57 81 63 56 62 28 74 58 59 61 51 65 29 83 56 60 61 54 68 30 86 58 37 64 55 72 31 86 61 39 70 58 55
R - Rain.
^Temperatures are taken i n a Stevenson Screen which simulates temperature inside a shaded building* Relative humidity was read at 4:15 P.M. Peak da i l y temperatures are normally obtained on or about 4:00 P.M. during summer months, hence, the taking of humidities when peak d a i l y temperatures are to be expected.

APPENDIX 8
WEEKLY MORTALITY FOR BROILERS RAISED AT DENSITIES
0.6, 0.7, 0.8, 0.9 AND 1.0 SQUARE FOOT
PER BIRD TO TEN WEEKS
WEEKS Percent Mortality to Dens
i t y 1 2 3 4 5 6 7 8 9 10 9 weeks 10 weeks
1.0 u.u. 0.8$ 0.8$
0.9 u.u. u.u. u. u. p. P. 2.5$ 2.9$ 0.8 u. u. u. s. 1.3$ 1.3$
0.7 u. u. P. s. s. 1.1$ 1.4$ 0.6 u.u. p.s. p. u. 1.2$ 1.4$
u. Unknown causes: and starveouts
p, Perosis
s. Smothering

APPENDIX 9
E l e c t r i c i t y Costs per B i r d
In 1962 and 1963 e l e c t r i c i t y costs per b i r d were 0.44 cents,
however, i n 1964. they declined to 0.38 cents. (Table V) Generally
costs have been increasing therefore average e l e c t r i c i t y costs were ap
p l i e d to a model b r o i l e r farm using 1964- e l e c t r i c i t y rates to check t h i s
rate of 0,38 cents.
Model Specifications:
- 10,000 square foot house of 10,000 b i r d capacity.
- Lighting - continuous, 72/4-0 watt bulbs weekly cost
$2.02.
- Ve n t i l a t i o n by fans (calculations on next page).
A fans 1500 c.f.m. with -J- hp motors
11 fans 3000 c.f.m. with 1/3 hp motors
Calculated e l e c t r i c i t y requirements to 63 days of age.
Light 9 x $2.02 = #18.18 for 63 days.
Approximate 63 day e l e c t r i c i t y cost per b i r d *
Minimum Usage Maximum Usage
Lights #18.180 #18.180
Fans 14.092 27.258
Total #32.272 #41.350
Cost per b i r d basis 10,000 birds 0.32* 0.413*
Average 0.37*

9 "continued"
MINIMUM AIR MOVEMENT - BASIS 0.5 CUBIC FEET PER MINUTE
Age i n Estimated-* c.f.m. No. Fans Volume Horse Total Cost 6 Additive Weeks Bird Wt. Minimum .Required iof Fans . Power - Per Week f Cost
(in pounds) 1 0.26 1,300 1 1500 3/4 0.314 .314 2 0.56 2,800 2 1500 i A 0.628 .942 3 0.95 4,750 3 1500 i A 0.942 1.884 4 1.39 6,950 2 3000 0.836 2.720 5 2.01 10,000 3 3000 1/3 1.250 3.970 6 2.64 13,200 (1 1500 i A ) 1.984 5.954
(4 3000 3/3) 7 3.27 16,350 (1 1500 IA) 2.404 8.358 •
(5 3000 V3) 8 3.84 19,200 (1 1500 1/4) 2.814 11.172 (6 3000 V3)
9 4.33 21,650 7 3000 1/3 2,920 14.092 10 4.79 23,950 8 3000 1/3 3.340 17.432
17.432
MAXIMUM AIR MOVEMENT - BASIS 1 CUBIC FOOT PER MINUTE c.f.m.
Maximum
1 0,26 2,600 2 1500 i A 0.625 0.628 2 0.56 5,600 2 3000 1/3 0,836 1.464 3 0.95 9,500 3 3000 1.250 2.714 4 1.39 13,900 (1 1500 i A ) 1.984 4.698 13,900
(4 3000 1/3) 5 2.01 20,100 7 3000 v ; 2.920 7.618 6 2.64 26,400 9 3000 1/3 3.760 11.378 7 3.27 32,700 11 3000 1/3 4.600 15.978 8 3.84 38,400 13 3000 1/3 5.430 21.408 9 4.33 43,300 14 3000 1/3 5.850 27.258
10 4.79 47,900 15 3000 V3 6.270 33.528 33.528
",J-1" •! II • i i II. . . M . I I i i i i • i i i • i
Fan usage - three f i f t e e n hundred c.f.m. set at f i v e minute a i r change, a l l others calculated to run as required.
^Selected optimum body weight growth, as obtained from the 10th B r o i l e r Tests, B. C. Random Sample Testing Station, 1964.
%S. C. Power Commission rates.

APPENDIX 10
DESCRIPTION OF BROILER REARING BUILDING,
ITS EQUIPMENT AND ESTIMATED COST7
1. Building Costs.
- two-storied — 31 feet x 161 feet.
- walls and c e i l i n g of top f l o o r l i n e d
with vapour b a r r i e r , plywood and i n
su l a t i o n ,
- Fan ventilated.
- Exterior - shiplap, tar paper and siding.
Cedar shingle roof.
- Concrete f l o o r down, plywood f l o o r up.
- Concrete foundations.
Estimated cost for 10,000 square feet - $10,000.00 #10,000.00
2. Equipment Costs.
Brooding Equipment 1,800.00 Fans 14- @ 140.00 each 560.00 Bulk Tanks and Augers 500.00 Waterers, feeders, conveyors 2,14-0.00
Total Cost # 5,000.00 5.000.00
Total Cost Building and Equipment 115,000.00
Annual C a p i t a l Cost Allowance. Per Square Foot
Buildings 20 years @ #10,000.00 #500.00 #0.05 Equipment 10 years @ # 5,000.00 #500.00 #0.05
Total Cost Per Square Foot Per Year as a C a p i t a l Cost Allowance
).10
^Estimated by Author.

APPENDIX 11
INSURANCE RATES8 AS APPLIED TO A BROILER-FRYER HOUSE
CONTAINING 10,000 SQUARE FEET OF FLOOR AREA
AS DESCRIBED IN APPENDIX TABLE TEN
Annual Insurance cost f o r building #10,000,00 and equipment #5,000.00 at a rate of #1,33 per #100.00 #199.50
B i r d insurance (10,000 birds) housed at one square foot per b i r d 25.27
#224.77 Insurance cost per square foot of f l o o r area 2.248*
Bir d insurance was calculated on a 19 cent per b i r d value which would be
the cost of sta r t i n g a new l o t of chicks. Insurance rates on the birds
was estimated at #1.33 per #100.00 b i r d value per year. This can vary
according to how insured, type of bu i l d i n g , f i r e protection and the com
pany. I f the birds were insured at a market value of a four pound b i r d
at 19 cents per pound then the insurance would increase from #25.27 to
#101.56 per 10,000 b i r d capacity per year.
Insurance rates estimated by Insurance Agent, Exact rates unobtainable due to variations between companies, f i r e protection d i s t r i c t s and ove r - a l l coverage required.
^Dudley Blaschek, 1965, A private communication, Royal Exchange Assurance Corporation, V i c t o r i a .

APPENDIX 12
From correspondence with recognized authorities i n accounting,
i t was thought that 0.06 was a f a i r value to use i n calculating interest
on investment for b r o i l e r production. 1*^ The procedure as outlined by Roy 1
was used to calculate interest charges.
Value of property the f i r s t of the year i s added to the deprec
iated value at the end of the year and averaged.
The same procedure i s followed for equipment. In order that the
average interest on investment may be used for the purpose of t h i s study
the t o t a l investment payments for a twenty year period were added and
divided by twenty which resulted i n $7,4-50,00 as the average investment.
Using 0,06 as the rate of interest the annual cost of interest i n invest-2
ment was 4-»47 cents per f t per year.
1 0 D a r y l T. Thompson, 1965. A private communication. Accounting Corporation of America, Vancouver,
i : LEwell P. Roy, 1965, A private communication, Louisiana State University, Department of A g r i c u l t u r a l Economics and Agribusiness,

12 "continued"
Year Value of Build
ing as of January 1st
Average Yearly Value
Value of Equipment as of
January 1st Average Yearly Value
Average Yearly Value of Equipment
and Buildings.
1 10,000 9,750 5,000 4,750 14,500 2 9,500 9,250 4,500 4,250 13,500 3 9,000 8,750 4,000 3,750 12,500 4 8,500 8,250 3,500 3,250 11,500 5 8,000 7,750 3,000 2,750 10,500 6 7,500 7,250 2,500 2,250 9,500 7 7,000 6,750 2,000 1,750 8,500 8 6,500 6,250 1,500 1,250 7,500 9 6,000 5,750. 1,000 750 6,500 10 5,500 5,250 500 250 5,500 11 5,000 4,750 * 5,000 4,750 9,500 12 4,500 4,250 4,500 4,250 8,500
13 4,000 3,750 4,000 3,750 7,500
14 3,500 3,250 3,500 3,250 6,500
15 3,000 2,750 3,000 2,750 5,500 16 2,500 2,250 2,500 2,250 4,500 17 2,000 1,750 2,000 1,750 3,500 18 1,500 1,250 1,500 1,250 2,500
19 1,000 750 1,000 750 1,500 20 500 250 500 250 500 21 0 0
149,000 20
17,450 New Equipment
APPENDIX 13
NUMBER OF LOTS OF BROILERS PER YEAR WHEN
REPLACEMENT TIME IS TWO WEEKS AFTER MARKETING
Marketing Replacement Lots per Age Weeks Period Weeks Year
11 13 4.00
10 12 4.33
9 11 4.73
8 10 5.26
7 9 5.78
6 8 6.50
• CORRECTION FACTORS FOR CHANGING VALUES
FOR DENSITIES BELOW ONE SQUARE FOOT TO ONE SQUARE FOOT
Square Foot Allotment Correction Factor
1.0 1.00
0.9 1.11
0,8 1.25
0.7 1.43
0.6 1.67
APPENDIX 14
ANNUAL NET RETURNS PER SQUARE FOOT OF FLOOR AREA WHEN
BIRDS ARE MARKETED AT 6, 7, 8, 9 OR 10 WEEKS OF AGE FOR
VARIOUS FEED AND MEAT PRICES: BIRD DENSITY 0*7 SQUARE FOOT PER BIRD
Feed Cost Age of In Cents B i r d i n Live B r o i l e r Meat Price Per Pound Weeks (cents per pound)
15 17 19 21 23 4.0 6 -24.714 17.114 58.941 100.769 142.596
7 - 0.685 45.766 92.218 138.670 185.121 8 15.552 65.671 115.790 165.908 216.027 9 26.840 79.733 132.627 185.521 238.414 10 28.419+ 83.1554 137.892+ 192.6284 247.365+
4.5 6 -44.233 - 2.406 39.422 81.249 123.077 7 -23.828 22,623 69.075 115.526 161.978 8 -10,846 39.273 89.392 139.510 189.629 9 - 2.245 + 50.648 103.542 156.436 209.330 10 - 3.469 51.267+ 106.003+ 160,740+ 215.476+
5.0 6 -63.753 -21.925 19.902> 61.730 103.557 7 -46.971 - 0.520 45.932 92.383 138.835 8 -37.243 12.875 62.994 113.113 163.231 9 -31.330+ 21.564+ 74.457+ 127.351 . 180.245 10 -35.358 19.379 74.115 128.852+-H 183.588+
5.5 6 -83.272 - a . 445 0.383 42.210 84,038, 7 -70.114 -23.663 22.789 69.240 115.692 8 -63.641 -13.523 36.596 86.715 136.833 9 -60.415+ - 7.521+ 45.373 4 98.266+ 151.160 10 -67.246 -12.510 42.227 96.963 151.700+
Maximum annual net returns per f t . ^ for each combination of feed and meat p r i c e ,
•9A two week clear period between successive l o t s i s assumed. USample calculation: Marketed at ten weeks with a l i v e body weight of
4.42 pounds, two week clear period, feed cost of 5.0* per pound and a 21 cent per pound l i v e b r o i l e r meat pr i c e .

14 "continued"
T.R.=- 4.42 x 21.0 x 4.33 x 1.43= 574.732* T.C.r 16.72+(17.8 x 1.43 x 4.33) + (10.3 x 5.0 x
1.43 x 4.33) = 445.880*
Net return per square foot per year = 128.852*

APPENDIX 15
ANNUAL NET RETURNS PER SQUARE FOOT OF FLOOR AREA WHEN
BIRDS ARE MARKETED AT 6, 7, 8, 9 OR 10 WEEKS OF AGE FOR
VARIOUS FEED AND MEAT PRICES: BIRD DENSITY 1.0 SQUARE FOOT PER BIRD
Feed Cost Age of i n Cents B i r d i n Live B r o i l e r Meat Price Per Pound Weeks (cents per pound)
15 17 19 .21 23
4.0 6 -22.310 6.940 36.190 65.440 94.690 7 - 5.507 26.977 59.460 91.944 124.428 8 5.848 40.896 75.944 110.992 146.040 9 13.741+ 50.730^ 87.718 124.707 161.696 10 14.846 53.123+ 91.400f 129.677+ 167.9554
4.5 6 -35.960 - 6.710 22.540 51.790 81.040 7 -21.691 10.793 43.276 75.760 108.244 8 -12.612 22.436 57.484 92.532 127.580 9 - 6.5981" 30.391 67.379 104.368 141.357 10 - 7.454 30.8234' 69.101+ 107.378"1" 145.655+
5.0 6 -49.610 -20.360 8.890 38.140 67.390 7 -37.875 - 5.391 27.092 59.576 92.060 8 -31.072 3.976 39.024 74.072 109.120 9 -26.937 * 10.052+ 47.040+ 84.029 121.018 10 -29.753 8.524 46.801 85.078+ 123.356 +
5.5 6 -63.260 -34.010 - 4.760 24.490 53.740 7 -54.059 -21.575 10.908 43.392 75.876 8 -49.532 -14.484 20.564 55.612 90.660 9 -47.276+ -10.287+ 26.701^ 63.690 + 100.679 10 -52.053 -13.776 24.502 62.779 101.056+"
+" Maximum annual net returns per f t . 2 for each combination of feed and meal price.
'A two week clear period between successive l o t s i s assumed.

APPENDIX 16
'ANNUAL NET RETURNS PER SQUARE FOOT OF FLOOR AREA WHEN
'BIBBS ARE MARKETED AT 6, 7, 8, 9 OR 10 WEEKS OF AGE FOR
VARIOUS FEED AND MEAT PRICES: BIRD DENSITY 1.0 SQUARE FOOT PER BIRD
AND NUMBER OF LOTS PER YEAR LIMITED TO £.3313
Feed Cost Age of Live B r o i l e r Meat Price i n Cents B i r d i n (cents per pound) Per Pound Weeks .
15 .17 19 .21 23 4.0 6 -20.444 - 0.959 18.526 38.011 57.496
64.684 89.019 89.625 118.809 112.747 146.608 129.677+ 167*955
4.5
5.0
6 -20.444 - 0.959 18.526 7 - 8.320 16.015 40.349 8 2.072 31.256 60.441 9 11.165,
14.846 45.026 78.886
10 11.165, 14.846 53.123+ 91.400+
6 -29.537 -10.052 9.433 28.918 48.403 7 -20.444 3.891 28.225 52.560 76.895 8 -13.299 15.885 45.069 74.253 103.437 9 - 7.454+ 26.407 60.267 94.128 127.989 10 - 7.454"" 30.823 * 69.101+ 107.378 + 145.655 +
6 -38.630 -19.145 0.340 19.825 39.310 7 -32.568 - 8.233 16.101 40.436 64.771 8 -28.671 0.513 29.698 58.882 88.066 9 -26.073+ 7.788 41.648 75.509 109.370 10 -29.753 8.524+ 46.801^ 85.078^" 123.356+
5.5 6 -47.723 -28.238 - 8.753 10.732 30.217 7 -44.692 -20.357 3.977 28.312 52.647 8 -44.042 -14.858 14.326 43.510 72.694 9 -44.692 -10.831^ 23.029 56.890 90.751 10 -52.053 -13.776 24.502+ 62.779 + 101.056 +
Maximum annual net returns per f t . for each combination of feed and meat price,
13 A two week clear period between successive l o t s i s assumed.

APPENDIX 17
ANNUAL NET RETURNS PER SQUARE FOOT OF FLOOR AREA WHEN BIRDS ARE MARKETED AT 6, 7, 8, 9 OR 10 WEEKS OF AGE FOR
VARIOUS FEED AND MEAT PRICES: BIRD DENSITY 0.7 SQUARE FOOT PER BIRD AND NUMBER OF LOTS PER YEAR LIMITED TO
Feed Cost i n Cents Per Pound
Age of Bi r d i n Weeks
Live B r o i l e r Meat Price (cents per pound)
15 17 19 21 23 4.0 6
7 8 9 10
-22.045 - 4.708 10.153 23.156 28.419+
5.819 30.091 51.886 71.576 83.155+
33.682 64*889 93.620 119.997 137.8924
61.546 99.688 135.353 168.418
89.409 134.486 177.086 216.838
192.628* 247.365
4.5 6 7 8 9 10
-35.048 -22.045 -11.828 - 3.469* - 3.469
- 7.184 12.753 29.905 44.951 51.267+
20.679 47.552 71.638 93.372 106.003+
48.543 76.406 82.350 117.149 113.372 155.105 141.793 190.213 160.740^ 215.476"
5.0 6 -48.051 -20.187 7.676 35.540 63.403 7 -39.382 - 4.584 30.215 65.013 99.812 8 -33.810 7.924 49.657 91.391 133.124 9 -30.095+ 18.326 66.747
74.115+ 115.167 128.852+
163.588 10 -35.358 19,379^
66.747 74.115+
115.167 128.852+ 183.588+
5.5 6 -61,054 -33.190 - 5.327 22.537 50.400 7 -56.720 -21.921 12.877 47.676 82.474 8 -55.791+ -14.057 27.676 69.409 111.143 9 -56.720 - 8.299 + 40.122 88.542
96.963*-136.963
10 -67.246 -12.510 42.227+ 88.542 96.963*- 151.700^
* Maximum annual net returns per f t . 2 for each combination of feed and meat price.
*4A two week clear period between successive l o t s i s assumed.