Embed Size (px)
Citation preview
Person. indiuid. D@ Vol. 13, No. 8, PP. 869-881, 1992 0191-8869/92 $5.00 + 0.00 Printed in Great Britain. All rights reserved Copyright 0 1992 Pergamon Press Ltd
THE IMPORTANCE OF INTRAINDIVIDUAL VARIATION IN REACTION TIME
ARTHUR R. JENSEN
School of Education, University of California, Berkeley, CA 94720, U.S.A.
(Received 10 December 1991)
Smmnary-Individual differences in the trial-to-trial variability of reaction time (RT), indexed by the standard deviation of the individual’s RTs over n trials (RTSD), generally has a larger negative correlation with psychometric g than does the median RT (RTmd) over n trials. Large data sets are brought to bear on the question of whether RTmd and RTSD, which are highly correlated, reflect one and the same source of variance, but with different reliability and validity for predicting g, or represent independent processes. Several lines of evidence consistently lead to the conclusion that RTmd and RTSD, though having a substantial proportion of their variance in common even when measured separately in experimentally independent sets of RT trials, also have significant independent components of variance, each of which is correlated with psychometric g. Hypotheses about the neurophysiological basis of individual differences in the independent components of RTmd and RTSD are discussed.
INTRODUCTION
The variability of a person’s reaction time (RT) obtained in a large number of trials is a peculiarly neglected phenomenon in the experimental psychology of RT. Throughout the history of research on RT, which spans the entire history of experimental psychology, the dependent variable of virtually exclusive interest has been the S’s response time per se (or, less often, its reciprocal, speed of response). Typically, the S is given a large number of RT trials under a particular experimental condition in order to obtain a highly reliable measure of RT. Because the distribution of a S’s RTs over many trials is always positively skewed, the median of the distribution rather than its mean is the preferred measure of central tendency, as the median is less sensitive to variation in skewness. The literature on the experimental psychology of RT, with rare exceptions, has treated the variance of the distribution of a S’s RTs over n trials only as experimental error, to be overcome by averaging the RTs, but of virtually no interest in its own right. Scarcely anything can be found about intertrial variability in RT in the most recent and comprehensive works on the experimental psychology of RT (e.g. Lute, 1986; Welford, 1980a). In the one paragraph (of a 500 page book) that refers to the intertrial variability of RT, Lute (1986, p. 64) briefly mentions two facts in the experimental literature: (1) intensity of the reaction stimulus decreases both the mean and the intertrial variability of RT; and (2) in various distributions of RTs there is a fairly constant proportionality between the standard deviation and the mean (expressed as the coefficient of variation).
Intraindividual variability in RT, however, has recently become of interest in the differential psychology of RT, with its traditional focus on the correlation between RT and general mental ability, or g, a line of inquiry tracing back to Galton’s investigations of individual differences in the late 19th century. Two empirical facts, discovered surprisingly late in the history of RT research (Berkson & Baumeister, 1967) but now well established, are mainly responsible: (1) intertrial variability in RT is not really measurement error in the narrow or experimental sense, but a robust phenomenon in which there are reliable individual differences that are manifested consistently across quite different RT tasks; and (2) the correlation (negative) between individual differences in intertrial variability of RT and individual differences in IQ (or scores on any highly g loaded mental tests) is usually slightly larger than the correlation between the median (or mean) RT and IQ, despite the fact that S’s median (or mean) RT over trials always has higher reliability than the measure of intraindividual variability, which is the standard deviation of the S’s RTs over n trials, henceforth abbreviated as RTSD. (RTm and RTmd refer to the mean and median, respectively, of the S’s RTs over n trials, when this information needs to be explicit. Otherwise, as in the RT literature generally, the simple abbreviation RT usually means RTmd.)
869
870 ARTHUR R. JENSEN
In the only published study that is mainly addressed to intraindividual variability in RT (measured as RTSD) in normal Ss, Larson and Alderton (1990) cite nine independent studies in which RTSD has, in their words, “a robust statistical relationship to intelligence” (p. 310). Many other studies could be mentioned. In a review of all studies of RT in the Hick paradigm in relation to IQ, comprising eight independent samples with a total n of 603, it was found that the average (negative) correlation of IQ with RTSD was larger than its correlation with RTmd, despite the fact that RTSD has consistently lower reliability than RTmd (Jensen, 1987a, CJ Tables 27 and 29). In a study (Jensen, 1987b) of three RT paradigms (visual search, memory search, and Hick), it was found that the general factor of RTSD (extracted from the three paradigms) has a larger correlation (r = -0.312) with scores on Raven’s Advanced Progressive Matrices (RAPM) than does the general factor of RTmd (Y = -0.249); corrected for attenuation, these correlations are -0.350 and -0.273. In a study of three forms of RT (simple, choice, and odd-man-out discrimination) in 187 elementary school children, the average correlation of Raven’s Standard Progressive Matrices with RTmd of the three tasks was - 0.3 1 (average disattenuated r = -0.36); the corresponding average correlation for RTSD was -0.39 (average disattenuated r = -0.50) (Jensen, 1991). Smith and Stanley (1987) extracted the first principal component (PCI) from six psychometric tests; RTSD on three independent tasks had an average correlation of -0.48 with PCI; RTm had an average correlation of -0.19 with PCI. Reliability coefficients of RTSD and RTm were not reported, but there is no reason to suspect that the data would not show the typically lower reliability of RTSD, so correcting the above correlations for attenuation would magnify the difference. Jensen, Larson and Paul (1988) extracted the PC1 from the Armed Services Vocational Aptitude Battery (ASVAB) and found that the profile of correlations between RTSD (on a Semantic Verification Test) and each of the 10 ASVAB subtests predicts the general factor, or PCI, loadings of the subtests with a correlation of -0.846, as compared with the analogous correlation for RTmd of -0.508. This result indicates that RTSD more closely reflects the general factor of the ASVAB than does RTmd. The logic of this type of analysis is well explicated by Smith and Stanley (1987). Comparisons between each of six pairs of groups (total n = 1405) that differ in IQ show a mean difference (expressed in terms of the average within-groups SD) in RTSD of 0.79 SD (Jensen, 1987a, Table 24). Hence the inverse relationship of RTSD to psychometric g is quite well established, and it appears that it is a stronger correlation than that between RTmd and g.
Granted that RTmd and RTSD are highly correlated with each other and each variable is correlated with psychometric g, a question of theoretical importance for understanding g in terms of information processes (and ultimately brain processes) concerns the exact nature of the relationship between RTmd and RTSD and of their relation to g. The main question is whether RTmd and RTSD reflect two distinct, albeit correlated, processes, or both reflect, with different degrees of validity, some one and the same basic process. The diameter and circumference of a circle are obviously different measurements, but they are perfectly correlated and wholly redundant in accounting for the variance in the differing sizes of a varied collection of circles. But our means of measuring diameters and circumferences, if we measure each of them directly, could differ in reliability and validity, so they would be imperfectly correlated, giving the false impression that they each made independent contributions to the variance of circle size. Could the same be true for RTmd and RTSD? As I noted 10 years ago (Jensen, 1982),
“Variability of RTs would seem to have priority over the average speed of RTs. Assuming an inherent periodicity in the nervous system, the average speed of RT can be seen as a consequence of variability of RT more easily than the reverse relationship” (p. 103).
Although the “periodicity” referred to undoubtedly has a neural basis, at this point it is best regarded as a hypothetical construct needed to account for a behavioral phenomenon, much like Clark Hull’s (1951) postulate of behavioral oscillation , SOR, in connection with the fluctuating probability of a stimulus to evoke its conditioned response during the course of S-R learning. Because there is a physiological limit to the speed of reaction and no limit on the slowness of reaction (unless imposed by the experimenter), a S’s oscillation in reaction speed will cause a positive skew in the distribution of RTs obtained in a large number of trials. The greater the oscillation, the larger will be RTSD, but also the RTm (and, to a lesser degree, RTmd) are increased by the positive skewness of the total distribution of RTs. That is, any measure of central tendency
Intraindividual variability in RT 871
is necessarily pulled in the direction of skew. Hence RTm or RTmd could simply be derivatives of the phenomenon of temporal oscillations in reaction speed. Eysenck (1982) has held the view that RTmd or RTm are merely consequences of whatever basic process is reflected by RTSD. The particular “process” hypothesized by Eysenck is random errors in the transmission of information in the brain, or what might be called neural “noise”. By analogy, a telephone conversation on a “noisy” line takes longer than on a noise-free line, because noise interferes with signals, which then must be repeated to convey information. As Eysenck (1982) explains,
“If the best RTs of bright and dull are roughly equal (as seems to be the case when the quickest reactions are being compared), then those with low R scores [R is the probability that a given message encoded in a series of pulse trains will arrive at its destination in the identical form in which it was encoded, i.e. error-free transmission of information in the brain] would have many long or very long RTs because of errors in the transmission of information through the cortex; it is these which lengthen the mean RT, and produce an increase in variance over trials”
(P. 9).
Commenting on Jensen’s oscillation model of RTSD, Eysenck (1987) further explicates his theory of random errors in neural transmission:
“This alternative model posits essentially that correct recognition of an individual stimulus, which is essential for any kind of performance, is based on the propagation through a series of neurons and synapses of the incoming stimulation, suitably coded: errors may occur in this process, probably at the synapse, and recognition is hence probabilistic” (p. 292).
Eysenck goes on to suggest that the oscillation between excitatory and refractory phases of a neural pathway posited by my model and the random errors in transmission posited by his model could be alternative explanations involving authentically different mechanisms or could simply be different ways of describing one and the same phenomenon. Empirically, the question remains unanswered.
The first issue that needs to be settled, however, is whether RTmd (or RTm) and RTSD reflect distinct causal factors or do they both reflect one and the same basic factor (say, either neural oscillation or transmission errors) although with different degrees of reliability and validity. As yet, no very definitive evidence has been presented on this question. On the basis of two studies of the Hick RT paradigm that provided experimentally independent measures of RTmd and RTSD, I (Jensen, 1987a, pp. 134-139) surmized that RTmd and RTSD are independent processes but are highly correlated, with about two-thirds of their interindividual variance in common. Another reason to suspect that RT and RTSD reflect different processes is that in the Hick paradigm (see Jensen, 1987a) RTmd increases as a linear function of the number of bits of information implicit in the RT task, while RTSD increases as an exponential function of bits (but as a linear function of the number of response alternatives). The difference in these functions is so striking as to suggest different underlying processes; but it does not prove the case, because the difference could be an artifact of the scales on which RTmd and SDRT are measured. A logarithmic or exponential transformation of either scale can completely remove this particular difference, much as we could equalize diameters and circumferences of circles by either multiplying or dividing by pi.
Another item of evidence which suggests that speed of reaction and its intertrial variability represent different processes is the finding that nerve conduction velocity (NCV) in the visual tract (a neural pathway from the retina to the primary visual cortex, containing only three synapses) is significantly correlated with IQ (Reed & Jensen, 1992). Although this neural pathway is not itself involved in the higher mental processes required by the IQ test (RAPM), it is a reasonable hypothesis that the correlation between NCV in the visual tract and IQ is the indirect result of similarity of NCV throughout different regions of the brain, including the higher association centers involved in complex reasoning. However, the fact that there are three synapses in the visual tract, at each of which there could be some probability of a momentary “error” in transmission, means that the Reed-Jensen finding could also possibly support Eysenck’s theory that the average latency (AEP) of the neural response registered at the visual cortex results, not from NCV per se, but from the accumulation of delays due to random errors in transmission, the errors presumably occurring at the synapses. This possibility, however, seems to be absent in another study showing a correlation between NCV and IQ, by Vernon and Mori (1992). They measured NCV in sections of the median nerve of the forearm, which have no synapses, and found significant and substantial
872 ARTHUR R. JENSEN
correlations both with a variety of RTs and with IQ. Vernon and Mori replicated their results in another sample. [Further replications would still seem to be called for, however, in view of the failure of another study (Reed & Jensen, 1991) to find any correlation between NCV in the median nerve and IQ.] Assuming that the Vernon and Mori result holds up in further studies, the fact that a sheer speed measure, viz. peripheral NCV, which cannot be merely a derivative of variability in NCV, is correlated with IQ suggests that efficiency of information processing involves speed of processing as well as some neural phenomenon that causes moment to moment variability, or oscillation, in processing speed. Individual differences in e$ciency of information processing, which is the basis of g, may be represented as a joint effect of both the speed and the rate of oscillation (above/below excitatory threshold) of neural impulses.
A study by Barrett, Daum and Eysenck (1990) measured NCV in the median nerve of the forearm (in the wrist section) in some 40 young adults, but found no significant correlation between NCV and intelligence as measured by RAPM. It is especially noteworthy, however, that intraindividual variability in NCV was found to be correlated up to -0.44 with RAPM. In the same group, 50 trials of choice RT and movement time (MT) (the Hick paradigm with eight light/button alternatives) showed intraindividual variability in RT and MT to be correlated -0.25 and -0.33, respectively, with the RAPM. Also, to remove some of the motor component from the RT, thereby making it a more pure measure of cognitive decision time (DT), MT was subtracted from RT on every trial. Intraindividual variability in this measure of decision time (DTSD) was found to be correlated -0.48 with the RAPM, despite the inevitably lower reliability of the difference scores (i.e. DT = RT - MT) than of either RT or MT alone. This suggests that motor- speed per se is correlated either zero or negatively with cognitive decision speed (see Jensen & Reed, 1990). The findings of Barrett et al. with respect to intraindividual variability in both NCV and RT and their significant correlations with the RAPM (a good measure of g) lend support to an hypothesis of considerable generality. It would be of great importance if supported by further evidence. The authors stated this hypothesis as follows:
‘I . . . variability is a property of all nerve conduction, whether motor, sensory, or cerebral. In addition, it is suggested that such variability may be implicated in both motor and cognitive tasks. With this hypothesis there is no requirement that synaptic activity must mediate such variability” (Barrett et al., 1990, pp. l-2).
Larson and Alderton (1990) have shown that when Ss’ RT trials are rank ordered from the fastest to the slowest RTs, the correlation of RT with psychometric g is smaller on the faster RTs and larger on the slower RTs, with a perfectly monotonic increase in the correlation, going from the fastest to the slowest RTs. Kranzler (1992) found the same effect in a variety of other RT tasks not used by Larson and Alderton, and discovered that the rank order of RTs, when they are ordered from fastest to slowest, is a stronger determinant of the RTs’ correlations with g for more complex than for simpler RT tasks, such as the difference between discrimination RT and simple RT. However, these facts themselves cannot answer the question of whether individual differences in RTmd and RTSD reflect the same cause or different causes. What they do suggest is that whatever it is that causes intertrial variability in RT is related to g and that it is most strongly manifested in the Ss most deviant RTs. Because there is a physiological limit on the quickness of reaction but not on slowness of reaction, the factor that makes for RT variability can be more manifested in slower than in faster reactions. Hence, as Larson and Alderton (1990) note, “. . . the position of RTs on a fastest-to-slowest RT ordering is almost perfectly correlated with their ability to predict both psychometric intelligence and working memory scores” (p. 316).
METHOD
The analyses are based on various sets of data used in previously published studies, with two exceptions. The raw data from each study have been analyzed here with the specific aim of answering the main question of this inquiry: Do RTm and RTSD reflect one and the same, or different, sources of variance? One data set, based on the Odd-Man-Out paradigm (Frearson & Eysenck, 1986), is completely new, and the study was expressly designed to help answer the key question. Another study, based on 1042 school children, as yet unpublished, contains data
Intraindividual variability in RT 813
specifically relevant to the key question here. Each of the several data sets are given a Study Identification Number (SID), with references to articles in which the studies were originally reported and brief descriptions of the Ss and tests. The rationale of each type of analysis is presented along with its results.
Data sets and subjects
Three of the data sets are from studies referenced and summarized elsewhere (Jensen, 1987a), where they were given the same SID numbers that are used here:
SID Nos 6 and 7: n = 105 university undergraduates (57 males, 48 females). SID Nos 14 and 15: n = 106 male vocational college students (56 whites, 50 blacks).
SID No 17: n = 162 children (white) in grades 4, 5, and 6 (mean age 10.75 years, SD 0.93; 76 boys, 86 girls).
Recent studies, not summarized in Jensen (1987a), are given SID numbers in the 50s:
SID No. 50: (Jensen & Reed, 1990). n = 213 white male college undergraduates. SID No. 51: (Kranzler & Jensen, 1991). n = 101 college students (49 males, 52 females). SID No. 52: (Unpublished). n = 1042 elementary school pupils (grades 4, 5, and 6). SID No. 53: (Odd-man-out study specifically designed for the present analysis.) n = 71 college
students.
RT tasks
Hick paradigm. Fully described in Jensen (1987a), this consists of a response console that displays a single reaction stimulus at random among a number of possible alternatives, the various set sizes (SS) consisting of either 1, 2, 4, or 8 lights arranged in a semicircular array; each light is adjacent to a pushbutton. The S holds down a central “home” button; preparatory signal (“beep”) sounds 1 to 4 set (random interval) before one of the lights goes on; the S has been instructed to release the home button and touch the button adjacent to the light as quickly as he/she can to turn it off. RT is defined as the interval between the onset of the light and the Ss releasing the home button. All of the RT test trials are preceded by instructions and a number of practice trials. In SID Nos 6 and 7 there are 15 test trials on each of SSs 1, 2, 4, and 8; in SID Nos 14 and 15 there are 30 trials on each of SSs 1, 4, and 8. In SID No. 17 there are 30 trials on each of SSs 1, 4, and 8. In SID Nos 50, 51, and 52 there was a total of 32 trials (16 trials given on each of two occasions separated by about 10 min), but only SS 8 was used.
SID No. 53 utilized the Odd-Man-Out (OMO) paradigm, first described by Frearson and Eysenck (1986). It is a form of discrimination RT. It uses the very same response console as the Hick paradigm, with all 8 light-buttons exposed. But after the preparatory “beep,” 3 of the lights go on simultaneously, in a pattern such that 2 of the lights in the array are always closer together than the third, which is the “odd-man-out.” Ss are instructed to touch the “odd-man” light-button as quickly as they can, which instantly turns off all 3 lights. With an array of 8 lights, there are 44 possible ways of 3 lights going on in an OMO pattern. All 44 patterns were used, in three replications, with different random orders of presenting of the patterns, making a total of 44 x 3 = 132 trials. Ss in SID No. 53 were also given RAPM test, a nonspeeded, nonverbal, highly g-loaded test of reasoning ability.
RESULTS
Hick paradigm: RTmd and RTSD on odd-even trials
The correlation between RTmd and RTSD alone cannot answer the main question if the RTmd (or RTm) and RTSD are based on the same set of trials. RTmd and RTSD must be experimentally independent, that is, based on different trials. Otherwise, some part of their covariance will be attributable to correlated errors of measurement. The logic of the following analysis is to split the total number of trials into two sets: the odd-numbered and the even-numbered trials, from which the odd-even split-half reliability coefficients for RTmd and RTSD can be obtained, to be used
874 ARTHUR R. JENSEN
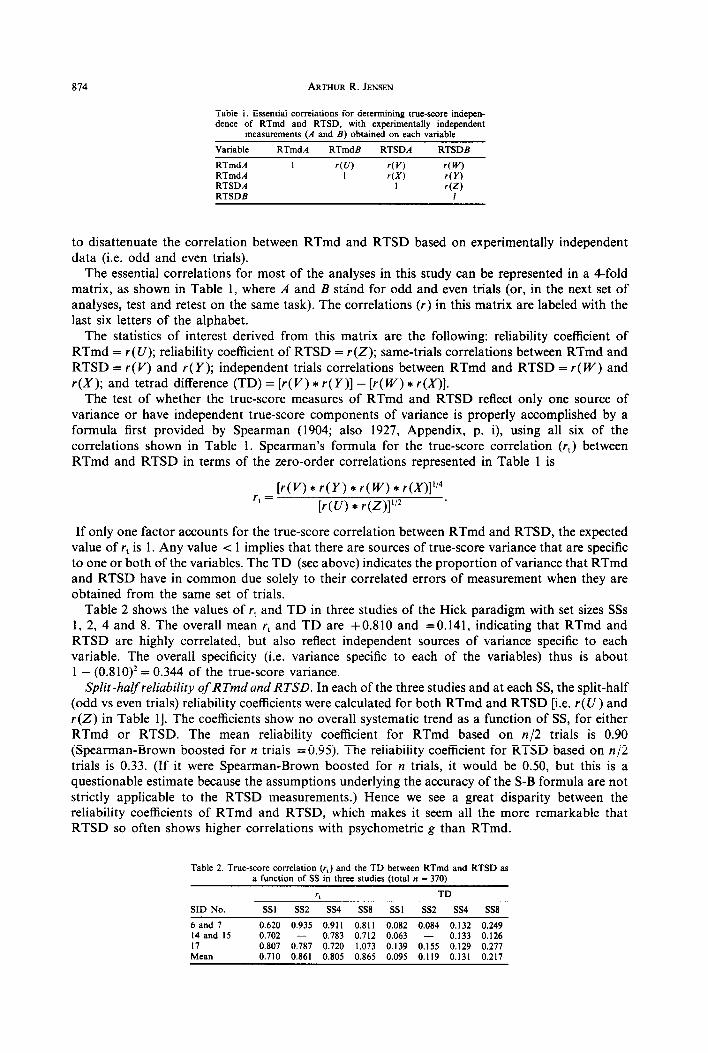
Table 1. Essential correlations for determining true-score indepen- dence of RTmd and RTSD, with experimentally independent
measurements (A and B) obtained on each variable
Variable RTmdA RTmdE RTSDA RTSDB
RTmdA RTmdA RTSDA RTSDB
1 r(U) r(V) r(W) I r(X) r(Y)
1 r(Z) 1
to disattenuate the correlation between RTmd and RTSD based on experimentally independent data (i.e. odd and even trials).
The essential correlations for most of the analyses in this study can be represented in a 4-fold matrix, as shown in Table 1, where A and B stand for odd and even trials (or, in the next set of analyses, test and retest on the same task). The correlations (r) in this matrix are labeled with the last six letters of the alphabet.
The statistics of interest derived from this matrix are the following: reliability coefficient of RTmd = r(U); reliability coefficient of RTSD = r(Z); same-trials correlations between RTmd and RTSD = r(V) and r(Y); independent trials correlations between RTmd and RTSD = r(W) and r(X); and tetrad difference (TD) = [r(V) * r(Y)] -[r(W) * r(X)].
The test of whether the true-score measures of RTmd and RTSD reflect only one source of variance or have independent true-score components of variance is properly accomplished by a formula first provided by Spearman (1904; also 1927, Appendix, p. i), using all six of the correlations shown in Table 1. Spearman’s formula for the true-score correlation (r,) between RTmd and RTSD in terms of the zero-order correlations represented in Table 1 is
r t = [r(V) *r(Y) *r(W) * rW)1””
[r(U) *r(Z)]“*
If only one factor accounts for the true-score correlation between RTmd and RTSD, the expected value of rt is 1. Any value c 1 implies that there are sources of true-score variance that are specific to one or both of the variables. The TD (see above) indicates the proportion of variance that RTmd and RTSD have in common due solely to their correlated errors of measurement when they are obtained from the same set of trials.
Table 2 shows the values of rt and TD in three studies of the Hick paradigm with set sizes SSs 1, 2, 4 and 8. The overall mean rt and TD are +0.810 and = 0.141, indicating that RTmd and RTSD are highly correlated, but also reflect independent sources of variance specific to each variable. The overall specificity (i.e. variance specific to each of the variables) thus is about 1 - (0.810)* = 0.344 of the true-score variance.
Split-halfreliability of RTmd and RTSD. In each of the three studies and at each SS, the split-half (odd vs even trials) reliability coefficients were calculated for both RTmd and RTSD [i.e. r(U) and r(Z) in Table 11. The coefficients show no overall systematic trend as a function of SS, for either RTmd or RTSD. The mean reliability coefficient for RTmd based on n/2 trials is 0.90 (Spearman-Brown boosted for n trials =0.95). The reliability coefficient for RTSD based on n/2 trials is 0.33. (If it were Spearman-Brown boosted for n trials, it would be 0.50, but this is a questionable estimate because the assumptions underlying the accuracy of the S-B formula are not strictly applicable to the RTSD measurements.) Hence we see a great disparity between the reliability coefficients of RTmd and RTSD, which makes it seem all the more remarkable that RTSD so often shows higher correlations with psychometric g than RTmd.
Table 2. True-score correlation (r,) and the TD between RTmd and RTSD as a function of SS in three studies (total n = 370)
?I TD
SID No. SSI ss2 ss4 SS8 SSl ss2 ss4 SS8
6 and 7 0.620 0.935 0.911 0.811 0.082 0.084 0.132 0.249 14 and 15 0.702 - 0.783 0.712 0.063 - 0.133 0.126 17 0.807 0.787 0.720 1.073 0.139 0.155 0.129 0.277 Mean 0.710 0.861 0.805 0.865 0.095 0.119 0.131 0.217
Intraindividual variability in RT 875
Test-retest data on Hick paradigm for SS 8
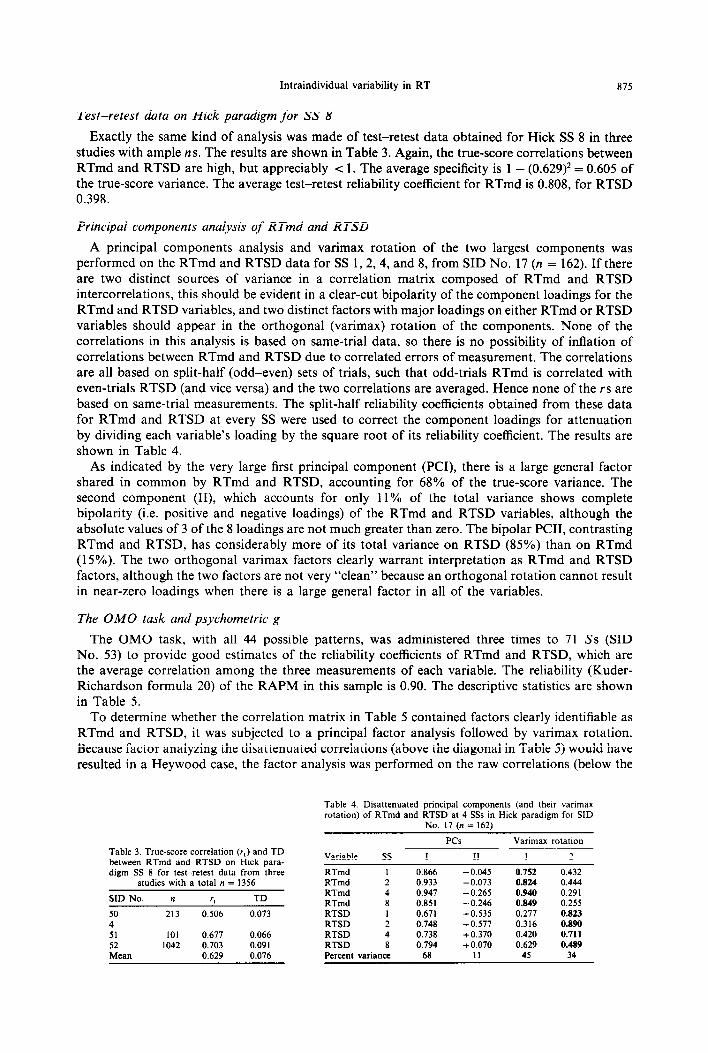
Exactly the same kind of analysis was made of test-retest data obtained for Hick SS 8 in three studies with ample n s. The results are shown in Table 3. Again, the true-score correlations between RTmd and RTSD are high, but appreciably < 1. The average specificity is 1 - (0.629)’ = 0.605 of the true-score variance. The average test-retest reliability coefficient for RTmd is 0.808, for RTSD 0.398.
Principal components analysis of RTmd and RTSD
A principal components analysis and varimax rotation of the two largest components was performed on the RTmd and RTSD data for SS 1, 2,4, and 8, from SID No. 17 (n = 162). If there are two distinct sources of variance in a correlation matrix composed of RTmd and RTSD intercorrelations, this should be evident in a clear-cut bipolarity of the component loadings for the RTmd and RTSD variables, and two distinct factors with major loadings on either RTmd or RTSD variables should appear in the orthogonal (varimax) rotation of the components. None of the correlations in this analysis is based on same-trial data, so there is no possibility of inflation of correlations between RTmd and RTSD due to correlated errors of measurement. The correlations are all based on split-half (odd-even) sets of trials, such that odd-trials RTmd is correlated with even-trials RTSD (and vice versa) and the two correlations are averaged. Hence none of the rs are based on same-trial measurements. The split-half reliability coefficients obtained from these data for RTmd and RTSD at every SS were used to correct the component loadings for attenuation by dividing each variable’s loading by the square root of its reliability coefficient. The results are shown in Table 4.
As indicated by the very large first principal component (PCI), there is a large general factor shared in common by RTmd and RTSD, accounting for 68% of the true-score variance. The second component (II), which accounts for only 11% of the total variance shows complete bipolarity (i.e. positive and negative loadings) of the RTmd and RTSD variables, although the absolute values of 3 of the 8 loadings are not much greater than zero. The bipolar PCII, contrasting RTmd and RTSD, has considerably more of its total variance on RTSD (85%) than on RTmd (15%). The two orthogonal varimax factors clearly warrant interpretation as RTmd and RTSD factors, although the two factors are not very “clean” because an orthogonal rotation cannot result in near-zero loadings when there is a large general factor in all of the variables.
The OMO task and psychometric g
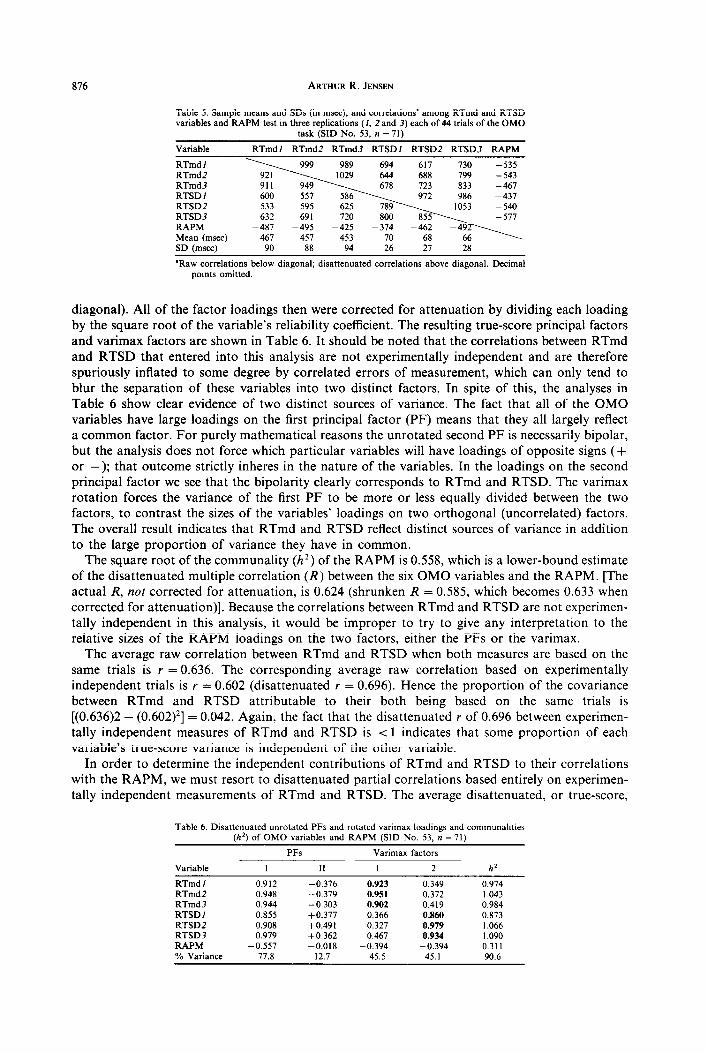
The OMO task, with all 44 possible patterns, was administered three times to 71 Ss (SID No. 53) to provide good estimates of the reliability coefficients of RTmd and RTSD, which are the average correlation among the three measurements of each variable. The reliability (Kuder- Richardson formula 20) of the RAPM in this sample is 0.90. The descriptive statistics are shown in Table 5.
To determine whether the correlation matrix in Table 5 contained factors clearly identifiable as RTmd and RTSD, it was subjected to a principal factor analysis followed by varimax rotation. Because factor analyzing the disattenuated correlations (above the diagonal in Table 5) would have resulted in a Heywood case, the factor analysis was performed on the raw correlations (below the
Table 4. Disattenuated principal components (and their varimax rotation) of RTmd and RTSD at 4 SSs in Hick paradigm for SID
No. 17 (n = 162)
Table 3. True-score correlation (I,) and TD between RTmd and RTSD on Hick para- digm SS 8 for test-retest data from three
studies with a total n = 1356
SID No. n r1 TD
50 213 0.506 0.073 4 51 IO1 0.677 0.066 52 1042 0.703 0.091 Mean 0.629 0.076
PCS Varimax rotation
Variable SS I II I 2
RTmd RTmd RTmd RTmd RTSD RTSD RTSD RTSD
I 0.866 2 0.933 4 0.947 8 0.851 I 0.671 2 0.748 4 0.738 8 0.794
- 0.045 -0.073 -0.265 -0.246 +0.535 f0.577 +0.370 +0.070
II
0.752 0.432 0.824 0.444 0.940 0.291 0.849 0.255 0.277 0.823 0.316 0.890 0.420 0.711 0.629 0.489
Percent variance 68 45 34
876 ARTHUR R. JENSEN
Table 5. Sample means and SDS (in msec), and correlationsa among RTmd and RTSD variables and RAPM test in three replications (1, 2 and 3) each of 44 trials of the OMO
task (SID No. 53, n = 71)
Variable RTmdl RTmd2 RTmd3 RTSDI RTSDZ RTSD3 RAPM
SD (msec) 90 88 94 26 27 28
sRaw correlations below diagonal; disattenuated correlations above diagonal. Decimal points omitted.
diagonal). All of the factor loadings then were corrected for attenuation by dividing each loading by the square root of the variable’s reliability coefficient. The resulting true-score principal factors and varimax factors are shown in Table 6. It should be noted that the correlations between RTmd and RTSD that entered into this analysis are not experimentally independent and are therefore spuriously inflated to some degree by correlated errors of measurement, which can only tend to blur the separation of these variables into two distinct factors. In spite of this, the analyses in Table 6 show clear evidence of two distinct sources of variance. The fact that all of the OMO variables have large loadings on the first principal factor (PF) means that they all largely reflect a common factor. For purely mathematical reasons the unrotated second PF is necessarily bipolar, but the analysis does not force which particular variables will have loadings of opposite signs (+ or -); that outcome strictly inheres in the nature of the variables. In the loadings on the second principal factor we see that the bipolarity clearly corresponds to RTmd and RTSD. The varimax rotation forces the variance of the first PF to be more or less equally divided between the two factors, to contrast the sizes of the variables’ loadings on two orthogonal (uncorrelated) factors. The overall result indicates that RTmd and RTSD reflect distinct sources of variance in addition to the large proportion of variance they have in common.
The square root of the communality (h*) of the RAPM is 0.558, which is a lower-bound estimate of the disattenuated multiple correlation (R) between the six OMO variables and the RAPM. [The actual R, not corrected for attenuation, is 0.624 (shrunken R = 0.585, which becomes 0.633 when corrected for attenuation)]. Because the correlations between RTmd and RTSD are not experimen- tally independent in this analysis, it would be improper to try to give any interpretation to the relative sizes of the RAPM loadings on the two factors, either the PFs or the varimax.
The average raw correlation between RTmd and RTSD when both measures are based on the same trials is r = 0.636. The corresponding average raw correlation based on experimentally independent trials is r = 0.602 (disattenuated r = 0.696). Hence the proportion of the covariance between RTmd and RTSD attributable to their both being based on the same trials is [(0.636)2 - (0.602)*] = 0.042. Again, the fact that the disattenuated r of 0.696 between experimen- tally independent measures of RTmd and RTSD is < 1 indicates that some proportion of each variable’s true-score variance is independent of the other variable.
In order to determine the independent contributions of RTmd and RTSD to their correlations with the RAPM, we must resort to disattenuated partial correlations based entirely on experimen- tally independent measurements of RTmd and RTSD. The average disattenuated, or true-score,
Table 6. Disattenuated unrotated PFs and rotated varimax loadings and communalities (h2) of OMO variables and RAPM (SID No. 53, n = 71)
PFs Varimax factors
Variable I II I 2 h2
RTmd I 0.912 RTmd2 0.948 RTmd3 0.944 RTSD 1 0.855 RTSDZ 0.908 RTSD3 0.979 RAPM .0.557 % Variance 77.8
-0.376 0.923 0.349 0.974 -0.379 0.951 0.372 1.043 -0.303 0.902 0.419 0.984 +0.377 0.366 0.860 0.873 +0.491 0.327 0.979 1.066 +0.362 0.467 0.934 1.090 -0.018 -0.394 -0.394 0.311
12.7 45.5 45. I 90.6
Intraindividual variability in RT 877
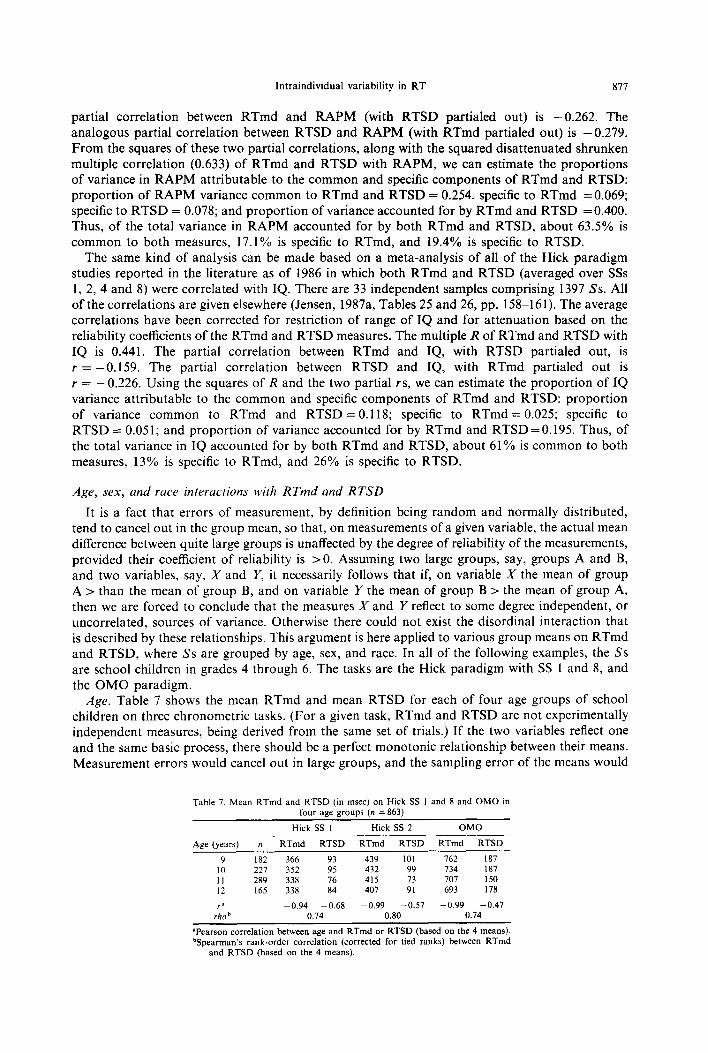
partial correlation between RTmd and RAPM (with RTSD partialed out) is -0.262. The analogous partial correlation between RTSD and RAPM (with RTmd partialed out) is -0.279. From the squares of these two partial correlations, along with the squared disattenuated shrunken multiple correlation (0.633) of RTmd and RTSD with RAPM, we can estimate the proportions of variance in RAPM attributable to the common and specific components of RTmd and RTSD: proportion of RAPM variance common to RTmd and RTSD = 0.254. specific to RTmd =0.069; specific to RTSD = 0.078; and proportion of variance accounted for by RTmd and RTSD = 0.400. Thus, of the total variance in RAPM accounted for by both RTmd and RTSD, about 63.5% is common to both measures, 17.1% is specific to RTmd, and 19.4% is specific to RTSD.
The same kind of analysis can be made based on a meta-analysis of all of the Hick paradigm studies reported in the literature as of 1986 in which both RTmd and RTSD (averaged over SSs 1, 2, 4 and 8) were correlated with IQ. There are 33 independent samples comprising 1397 Ss. All of the correlations are given elsewhere (Jensen, 1987a, Tables 25 and 26, pp. 158-l 6 1). The average correlations have been corrected for restriction of range of IQ and for attenuation based on the reliability coefficients of the RTmd and RTSD measures. The multiple R of RTmd and RTSD with IQ is 0.441. The partial correlation between RTmd and IQ, with RTSD partialed out, is r = -0.159. The partial correlation between RTSD and IQ, with RTmd partialed out is r = -0.226. Using the squares of R and the two partial rs, we can estimate the proportion of IQ variance attributable to the common and specific components of RTmd and RTSD: proportion of variance common to RTmd and RTSD = 0.118; specific to RTmd = 0.025; specific to RTSD = 0.051; and proportion of variance accounted for by RTmd and RTSD=0.195. Thus, of the total variance in IQ accounted for by both RTmd and RTSD, about 61% is common to both measures, 13% is specific to RTmd, and 26% is specific to RTSD.
Age, sex, and race interactions with RTmd and RTSD
It is a fact that errors of measurement, by definition being random and normally distributed, tend to cancel out in the group mean, so that, on measurements of a given variable, the actual mean difference between quite large groups is unaffected by the degree of reliability of the measurements, provided their coefficient of reliability is >O. Assuming two large groups, say, groups A and B, and two variables, say, X and Y, it necessarily follows that if, on variable X the mean of group A > than the mean of group B, and on variable Y the mean of group B > the mean of group A, then we are forced to conclude that the measures X and Y reflect to some degree independent, or uncorrelated, sources of variance. Otherwise there could not exist the disordinal interaction that is described by these relationships. This argument is here applied to various group means on RTmd and RTSD, where Ss are grouped by age, sex, and race. In all of the following examples, the Ss are school children in grades 4 through 6. The tasks are the Hick paradigm with SS 1 and 8, and the OMO paradigm.
Age. Table 7 shows the mean RTmd and mean RTSD for each of four age groups of school children on three chronometric tasks. (For a given task, RTmd and RTSD are not experimentally independent measures, being derived from the same set of trials.) If the two variables reflect one and the same basic process, there should be a perfect monotonic relationship between their means. Measurement errors would cancel out in large groups, and the sampling error of the means would
Table 7. Mean RTmd and RTSD (in msec) on Hick SS I and 8 and OMO in four age groups (n = 863)
Hick SS I Hick SS 2 OMO
Aee (wars) n RTmd RTSD RTmd RTSD RTmd RTSD
9 182 366 93 439 101 762 187 IO 227 352 9s 432 99 734 187 II 289 338 76 415 73 707 150 I2 I65 338 84 407 91 693 I78
i-4 -0.94 -0.68 -0.99 -0.57 -0.99 - 0.47 rho b 0.74 0.80 0.74
aPearson correlation between age and RTmd or RTSD (based on the 4 means). ?jpearman’s rank-order correlation (corrected for tied ranks) between RTmd
and RTSD (based on the 4 means).
878 ARTHUR R. JENSEN
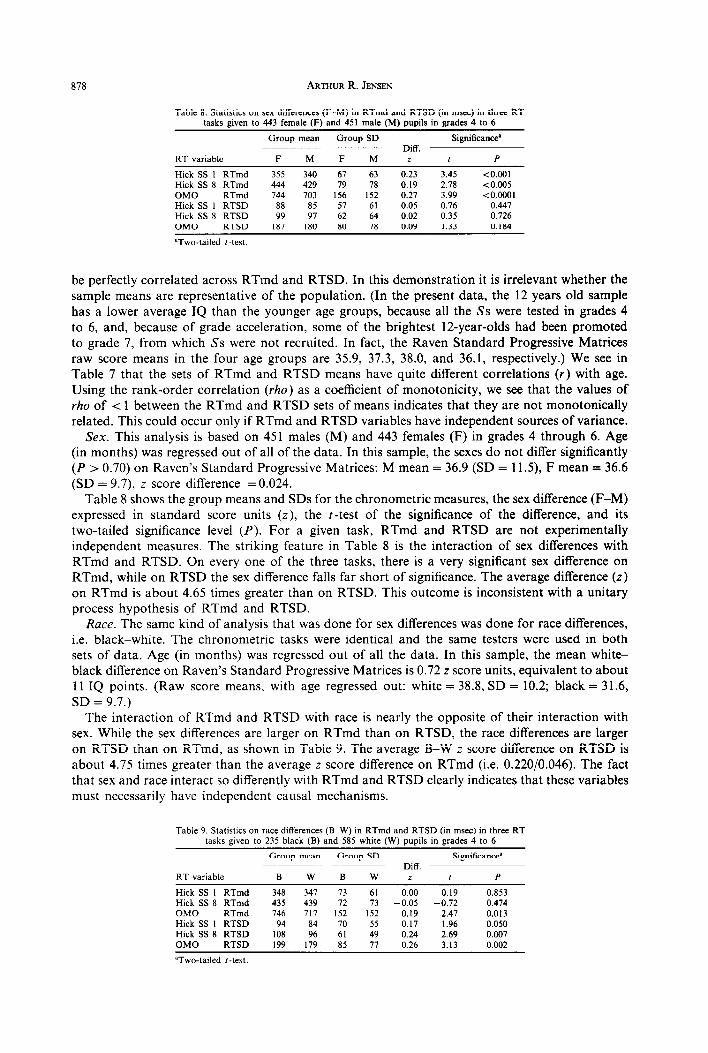
Table 8. Statistics on sex differences (F-M) in RTmd and RTSD (in msec) in three RT tasks given to 443 female (F) and 451 male (M) pupils in grades 4 to 6
RT variable
Group mean Group SD Significancea Diff.
F M F M z * P
Hick SS I RTmd 355 340 67 63 0.23 3.45 <0.001 Hick SS 8 RTmd 444 429 79 18 0.19 2.78 <o.OOs OMO RTmd 744 703 156 152 0.27 3.99 <O.OOOl Hick SS I RTSD 88 85 57 61 0.05 0.76 0.447 Hick SS 8 RTSD 99 97 62 64 0.02 0.35 0.726 OMO RTSD 187 180 80 78 0.09 I .33 0.184
“Two-tailed I-test.
be perfectly correlated across RTmd and RTSD. In this demonstration it is irrelevant whether the sample means are representative of the population. (In the present data, the 12 years old sample has a lower average IQ than the younger age groups, because all the Ss were tested in grades 4 to 6, and, because of grade acceleration, some of the brightest 12-year-olds had been promoted to grade 7, from which Ss were not recruited. In fact, the Raven Standard Progressive Matrices raw score means in the four age groups are 35.9, 37.3, 38.0, and 36.1, respectively.) We see in Table 7 that the sets of RTmd and RTSD means have quite different correlations (I) with age. Using the rank-order correlation (rho) as a coefficient of monotonicity, we see that the values of rho of < 1 between the RTmd and RTSD sets of means indicates that they are not monotonically related. This could occur only if RTmd and RTSD variables have independent sources of variance.
Sex. This analysis is based on 451 males (M) and 443 females (F) in grades 4 through 6. Age (in months) was regressed out of all of the data. In this sample, the sexes do not differ significantly (P > 0.70) on Raven’s Standard Progressive Matrices: M mean = 36.9 (SD = 11.5), F mean = 36.6 (SD = 9.7) z score difference =0.024.
Table 8 shows the group means and SDS for the chronometric measures, the sex difference (F-M) expressed in standard score units (z), the t-test of the significance of the difference, and its two-tailed significance level (P). For a given task, RTmd and RTSD are not experimentally independent measures. The striking feature in Table 8 is the interaction of sex differences with RTmd and RTSD. On every one of the three tasks, there is a very significant sex difference on RTmd, while on RTSD the sex difference falls far short of significance. The average difference (z) on RTmd is about 4.65 times greater than on RTSD. This outcome is inconsistent with a unitary process hypothesis of RTmd and RTSD.
Race. The same kind of analysis that was done for sex differences was done for race differences, i.e. black-white. The chronometric tasks were identical and the same testers were used in both sets of data. Age (in months) was regressed out of all the data. In this sample, the mean white- black difference on Raven’s Standard Progressive Matrices is 0.72 z score units, equivalent to about 11 IQ points. (Raw score means, with age regressed out: white = 38.8, SD = 10.2; black = 31.6, SD = 9.7.)
The interaction of RTmd and RTSD with race is nearly the opposite of their interaction with sex. While the sex differences are larger on RTmd than on RTSD, the race differences are larger on RTSD than on RTmd, as shown in Table 9. The average B-W z score difference on RTSD is about 4.75 times greater than the average z score difference on RTmd (i.e. 0.220/0.046). The fact that sex and race interact so differently with RTmd and RTSD clearly indicates that these variables must necessarily have independent causal mechanisms.
Table 9. Statistics on race differences (B-W) in RTmd and RTSD (in msec) in three RT tasks given to 235 black (B) and 585 white (W) pupils in grades 4 to 6
RT variable
Group mean Group SD Significance’ Diff.
B W B W z t P
Hick SS I RTmd Hick SS 8 RTmd OMO RTmd Hick SS I RTSD Hick SS 8 RTSD OMO RTSD
‘Two-tailed f-test.
348 347 73 61 0.00 0.19 0.853 435 439 72 73 - 0.05 -0.72 0.474 746 717 I52 152 0.19 2.47 0.013 94 84 70 55 0.17 I .96 0.050
I08 96 61 49 0.24 2.69 0.007 199 179 85 17 0.26 3.13 0.002
Intraindividual variability in RT 879
DISCUSSION
Viewed all together, the foregoing analyses, based on a number of large and varied samples, quite consistently lead to the conclusion that RTmd and RTSD, though highly correlated, reflect independent sources of variance. Both variables are correlated (negatively) with psychometric g, RTSD somewhat more than RTmd. Hence the multiple correlation of the two variables with g is significantly larger than the simple correlation of either variable with g, both before and after correlations are corrected for attenuation. The fact of disordinal interactions of RTmd and RTSD with certain group differences (e.g. age, sex and race) make it imperative that both variables be taken into account in the study of group difference in mental abilities.
The fact that RTmd and RTSD reflect different processes that are independently correlated with psychometric g is in agreement with the empirical finding by Kranzler and Jensen (1991; also see exchange with J. B. Carroll on this point in the same issue) that g does not represent a unitary process but is a composite effect of a number of uncorrelated elementary cognitive processes. We would infer that each of these processes must involve some neurologically independent mechanisms.
At present we have only vague, speculative hypotheses concerning the neural mechanisms involved in RTmd and RTSD. The obvious fact that RTmd predominantly reflects speed of information processing and RTSD reflects consistency in processing speed may suggest some clues as to causal mechanisms.
Regarding speed, the simplest hypothesis, originally suggested by Reed (1984, 1988), is that speed of processing, a component of g, is a function of the average neural conduction velocity (including synaptic delays) in the association pathways of the cerebral hemispheres. This hypothesis was tested by Reed and Jensen (1992) with positive results.
Regarding consistency, there is no obvious hypothesis. The gist of my speculative “neural oscillation” model (Jensen, 1980, pp. 702-704; 1982, pp. 127-13 1) is as follows. We know that single neurons, and large groups of neurons firing in synchrony, show regular periodic oscillations in excitatory potential, which are registered by the EEG as “brain waves”. In fact, there is evidence of a correlation between both simple and choice RT and the frequency of the alpha-rhythm (Surwillo, 1961, 1963). How would individual differences in the rate of oscillation of excitatory potential be reflected in individual differences in RTSD? A reaction stimulus (RS) would have to persist longer to effect a response if its onset (or arrival in the CNS) coincided with a below-threshold excitatory potential in any of the neural pathways involved in the processing of the RS and the execution of the appropriate response. Over a number of trials of RS presentations that occur at random with respect to the oscillations in excitatory potential, an individual with a slow rate of oscillation would produce some very short RTs (when the RS coincides with the superthreshold phase of oscillation in excitatory potential) and some quite long RTs (when the RS coincides with the subthreshold phase of oscillation). The same mechanism would occur in the chaining of many neurons throughout the entire S-R pathway, accumulating the subthreshold “delays” that may occur along the way. Since the onset of the RS is random with respect to the period of oscillation, the number of subthreshold delays (occurring in different elements of the neural pathway) on a given trial will be random. Thus the degree of intraindividual variation in RT will reflect the random variation in the number of delays. And, as there are potentially more delays the larger the number of neural elements involved in the processing, the greater will be the potential variation in RTs over trials. Hence an increase in task complexity, involving more neural elements, would result in a larger RTSD. For example, RTSD increases as a perfectly linear function of set size in the Hick paradigm (Jensen, 1987a, pp.l34-137). On the other hand, an individual with a comparatively fast rate of oscillation would have shorter subthreshold delays, and their accumulated effects throughout the neural pathway would have a smaller range of variation across trials, hence smaller RTSD. This model implies a necessary correlation between RTmd and RTSD, because the greater accumulated delays resulting from slower oscillation would cause not only greater RTSD but longer RTmd as well. That would explain the correlation between RTmd and RTSD. To explain the independence of RTmd and RTSD, we would have to posit that individual differences in NCV and in rate of oscillation are independent, or at least imperfectly correlated.
880 ARTHUR R. JENSEN
Another hypothesis to explain RTSD is that of errors, or “noise, ” in the neural transmission of information. This idea, originated by Hendrickson (1982) in connection with his theory of the correlation between the average evoked potential and IQ, was suggested as an explanation of the RTmd and RTSD correlations with IQ by Eysenck (1982, 1987). Eysenck (1987) admits that what I refer to as “oscillation” and what he (and Hendrickson) refer to as random errors may be one and the same phenomenon, with the same cause. Hendrickson (1982) explains random errors in neural trans- mission (or “recognition failures,” as he also terms it, meaning the failure of a neuron to “recognize” an incoming signal) in terms of a molecular mechanism at the synapse. but he states that
“The actual molecular ‘failure’ at the synapse that might bring about misrecognition could be any one of a large number of possibilities, and it is pointless to extend our model to discuss these possibilities at this time” (p. 183).
Whatever the cause of “recognition errors”, Hendrickson states,
“We believe that all individuals can be characterized by the extent to which recognition failures occur or do not occur. This characterization can be expressed as a single parameter, a probability of recognition occurring when it should occur. The parameter as it might apply at a single synapse need not apply to other synapses, but what seems to be likely is that the distribution of individual synaptic probabilities will have a mean, characteristic value for the individual as a whole. The greater or less characteristic probability of correct pulse train cognition at the synapse for given individuals we believe to be the biological basis of intelligence” (p. 184).
Although Hendrickson (p. 183) mentions the well established fact that the speed of neural impulses is a function of axon size, neural conduction velocity per se is not an important source of variance in his theory of biological intelligence.
The present investigation, however, suggests that if RTmd and RTSD have components of variance that are independently correlated with g, an explanation of these relationships requires at least two parameters of individual differences. An hypothesis of the neural basis of these relationships must posit mechanisms that could explain both speed and “oscillation” (or “noise”) and the correlation between them.
Axonal size (i.e. diameter) and amount of myelination are the two neuronal mechanisms that would seem to fill the bill. They have been brought to bear in Robbie Case’s (1985, pp. 377-381) neurophysiological model of maturation changes in mental ability, and they seem quite relevant to understanding individual differences in speed and oscillation in RT. [The many references to the neurophysiological research germane to Case’s theorizing and to the following discussion are given in Case’s book (pp. 377-381).] The gist of this hypothesis is as follows. NCV is a function of (1) axon size, larger axons having faster conduction velocity; and (2) degree of neuronal myelination, one of the functions of myelin, a fatty substance that surrounds neurons, being to speed up neural conduction. The myelination of neurons progresses at varying rates from infancy to early adulthood, and there are presumably individual differences in the rate and degree of myelination at any given age. Myelin also acts as insulation of axons, preventing “leakage” of action potentials across neural pathways and confining excitation between neurons to their synaptic connections. This insulation of neurons is essential for the process of learning, which depends on changes in synaptic connections to channel the transmission of neurally encoded information into the “correct” pathways. The “leakage” of excitation due to incomplete myelination is a source of “noise” or interference in the neural transmission of information. Hence we have here two mechanisms, axon size and degree of myehnation, that are physiologically independent (though positively correlated) structures and in which there are individual differences (and in the case of myelination, also age differences); both mechanisms govern NCV, and degree of myelination also governs the amount of neural “leakage” or “noise”.
These features of the brain seem well in accord with the facts of age differences in RTmd, RTSD, and g. For example, there is a steady decrease in both RTmd and RTSD as a function of age, from early childhood to late adolescence, and the rate of decrease in RTmd and RTSD in this age range is related to the complexity of the RT task (Jensen, 1982, pp. 105-106; Jensen, 1987a, pp. 149-152). RTmd and RTSD increase in old age, which is accompanied by other indicators of increased random activity, or “neural noise”, in the brain (Welford, 1980b). Slowed NCV and increased “neural noise”, probably associated with some demyelination of neurons in old age, are likely
Intraindividual variability in RT 881
mechanisms. This is not to say, however, that certain changes in the complex chemistry involved in axonal conduction and synaptic transmission are an unlikely mechanism in the effects of aging on RT, or in individual differences in RT at any age, for that matter. Yet another attractive feature of the myelination hypothesis is its relation to the fact that there is a correlation between overall brain size and IQ (Jensen & Sinha, 1992; Willerman, Schultz, Rutledge & Bigler, 1991). Variation in brain size, particularly in the white matter composed of fibers interconnecting cortical neurons, is constituted in part by the size of axons and the amount of their surrounding myelin-hence positive correlations between brain-size, NCV, speed and consistency of information processing, and g.
Theoretical speculation aside, it does seem reasonable to expect that research on the biological basis of g will be advanced by testing hypotheses about likely physiological mechanisms involved in the elementary process components of g as indexed by such relatively simple and precisely measurable variables as RTmd and RTSD.
REFERENCES
Barrett, P. T., Daum, I. & Eysenck, H. J. (1990). Sensory nerve conduction and intelligence: A methodological study. Journal of Psychophysiology, 4, l-l 3.
Berkson, G. & Baumeister, A. A. (1967). Reaction time variability of mental defectives and normalsy. American Journal of Mental Deficiency, 72, 262-266.
Case, R. (1985). Intellectual development: Birth to adulthood. Orlando, FL: Academic Press. Eysenck, H. J. (1982). Introduction. In Eysenck, H. J. (Ed.), A model for intelligence. Berlin: Springer. Eysenck, H. J. (1987). Intelligence and reaction time: The contribution of Arthur Jensen. In Modgil, S. & Modgil, C. (Eds.),
Arthur Jensen: Consensus and controversy. New York: Falmer Press. Frearson, W. M. & Eysenck, H. J. (1986). Intelligence, reaction time (RT) and a new “odd-man-out” RT paradigm.
Personality and Individual Differences, 7, 808-8 17. Hendrickson, A. E. (1982). The biologicial basis of intelligence. Part I: Theory. In Eysenck, H. J. (Ed.), A model for
intelligence. Berlin: Springer. Hull, C. L. (1951). Essentials of behavior. New Haven: Yale University Press. Jensen, A. R. (1980). Bias in mental testing. New York: Free Press. Jensen, A. R. (1982). Reaction time and psychometric g. In Eysenck, H. J. (Ed.), A model for intelligence. Berlin: Springer. Jensen, A. R. (1987a). Individual differences in the Hick paradigm. In Vernon, P. A. (Ed.), Speed of information processing
and intelligence. Norwood, NJ: Ablex. Jensen, A. R. (1987b). Process differences and individual differences in some cognitive tasks. Intelligence, II, 107-136. Jensen, A. R. (1991). Speed of elementary cognitive processes: A chronometric anchor for psychometric tests of
g. Psychological Test Bulletin, 4, 59-70. Jensen, A. R. & Reed, T. E. (1990). Simple reaction time as a suppressor variable in the chronometric study o@inte@enoe.
Intelligence, I4, 375-388. Jensen, A. R. & Sinha, S. N. (1992). Physical correlates of human intelligence. In Vernon, P. A. (Ed.), Biological approaches
IO the study of human intelligence. Not-wood, NJ: Ablex. Jensen, A. R., Larson, G. E. & Paul, S. M. (1988). Psychometric g and mental processing speed on a semantic verification
test. Personality and Individual Differences, 9, 243-255. Kranzler, J. H. (1992). A test of Larson and Alderton’s (1990) worst performance rule of reaction time variability.
Personality and Individual Differences, 13, 255-261. Kranzler, J. H. St Jensen, A. R. (1991). The nature of psychometric g: Unitary process or a number of independent
processes? Intelligence, 15, 397-422. Larson, G. E. & Alderton, D. L. (1990). Reaction time variability and intelligence: A “worst performance” analysis of
individual differences. Intelligence, 14, 309-325. Lute, R. D. (1986). Response times: Their role in inferring elementarymentalorganization. New York: Oxford University Press. Reed, T. E. (1984). Mechanism for heritability of intelligence. Nature, 311, 417. Reed, T. E. (1988). A neurophysiological basis for the heritability of intelligence. In Jerison, J. J. & Jerison, I. (Eds.),
Intelligence and evolutionarv biology. Berlin: Springer. Reed, T. E. & Jensen, A. R. (1991). Arm nerve conduction velocity (NCV), brain NCV, reaction time, and intelligence.
Intelligence, 15, 33-47. Reed, T. E. & Jensen, A. R. (1992). Conduction velocity in a brain nerve pathway of normal adults correlates with
intelligence level. Intelligence, 16. Smith, G. A. and Stanley, G. (1987). Comparing subtest profiles of g loadings and correlations with RT measures.
Intelligence 11 291-298. Spearman, C. (1904). “General intelligence,” objectively determined and measured. American Journal of Psychology, 15,
201-293. Spearman, C. (1927). The abilities of man. London: Macmillan. Surwillo, W. W. (1961). Frequency of the ‘Alpha’ rhythm, reaction time and age. Nature, 191, 823-824. Surwillo, W. W. (1963). The relation of simple response time to brain-wave frequency and the effects of age.
Electroencephalography and Clinical Neurophysiology, 15, 10-l 14. Vernon, P. A. & Mori, M. (1992). Intelligence, reaction times, and peripheral nerve conduction velocity. Intelligence, 16. Welford, A. T. (1980a). Reaction times. London: Academic Press. Welford, A. T. (1980b). Relationships between reaction time and fatigue, stress, age and sex. In Welford, A. T. (Ed.),
Reaction times. London: Academic Press. Willerman, L., Schultz, R., Rutledge, N. & Bigler, E. (1991). In L&O brain size and intelligence. Intelligence, 15.