Embed Size (px)
Citation preview

The importance of Energy Efficiency for Medium Enterprises
Mark Liptrot – Group Sustainability Manager, Afripack
PSEE Conference 11November 2015, Maharani Hotel, Durban, South Africa
INTRODUCTION
2
• Afripack was founded in 1933 in Cape Town as Paper Sacks (SA). Now spreading throughout Africa, it has two main product lines:
• Industrial Flexibles - the supply of paper- and plastic-based printed products for the industrial packaging and roof insulation markets, eg cement bags and Sisalation®;
• Consumer Flexibles - supplying flexible packaging and a variety of label types, including wraparound, shrink and stretch for the beverage, cosmetic , food and pharmaceutical markets.
• The SA plants are based in Pinetown (2), Mobeni and Brits
• This study concentrates on the Pinetown Flexibles site, which had the first PSEE-funded energy audit in July 2014
INTRODUCTION
3
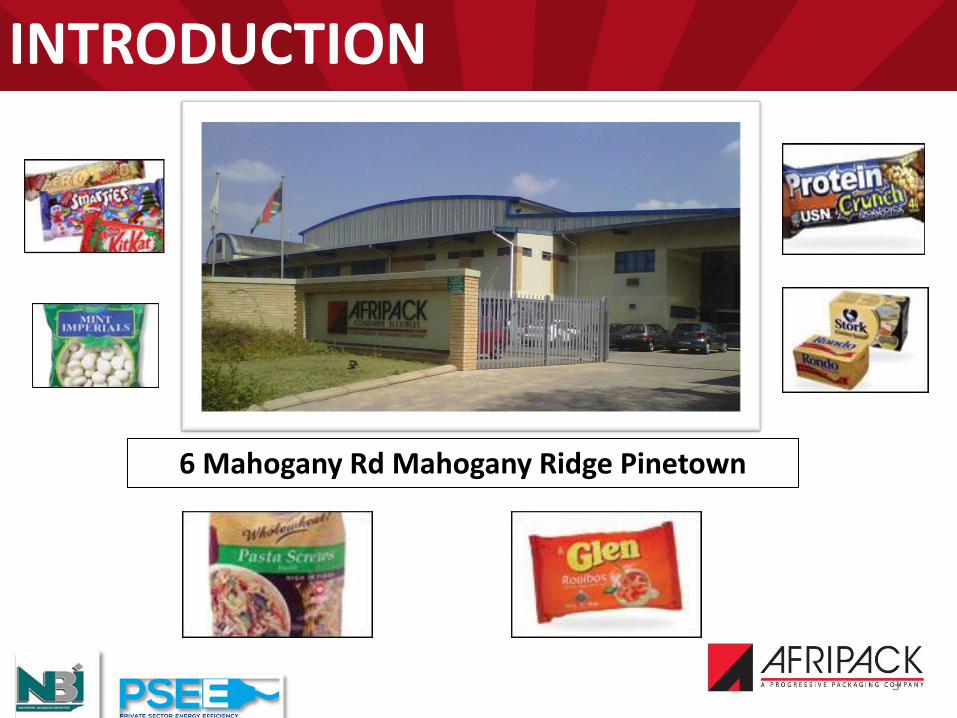
6 Mahogany Rd Mahogany Ridge Pinetown

2014
THE ONLY WAY FORWARD… …BE SUSTAINABLE!
ENOUGH FOR ALL, FOREVER

AFRIPACK’S COMMITMENT TO SUSTAINABILITY
SUST
AIN
AB
LE S
OU
RC
ING
O
F R
AW
MA
TER
IALS
CA
RB
ON
FO
OTP
RIN
T R
EDU
CTI
ON
WA
STE
MIN
IMIS
ATI
ON
REC
YCLA
BIL
ITY
RESPONSIBLE PACKAGING INITIATIVES
RESPONSIBLE PACKAGING IS BASED ON 4 PRINCIPLES:
• We set up “green teams” at each of the Afripack sites to monitor and have reported on energy, water, waste and carbon footprint each month since 2011
• We have been working with the CSIR and NBI on ways to improve our productivity. Engineering interns from the CSIR started at 3 sites between June 2013 and Feb 2014.
• Energy audits were conducted between July 2014 and March 2015 at the 3 sites in KZN, arranged by the NBI
• They have outlined where we could make energy, water and material savings
AFRIPACK’S STRATEGY:
THE AUDIT METHODOLOGY
7
• One week on site
• Tariff Analysis
• Factory Electrical Usage by Area
• Energy Monitoring and Targeting
• Process analysis
From the above, the following were deduced:
• Key Energy Savings Opportunities
• Other savings, eg waste control, water use
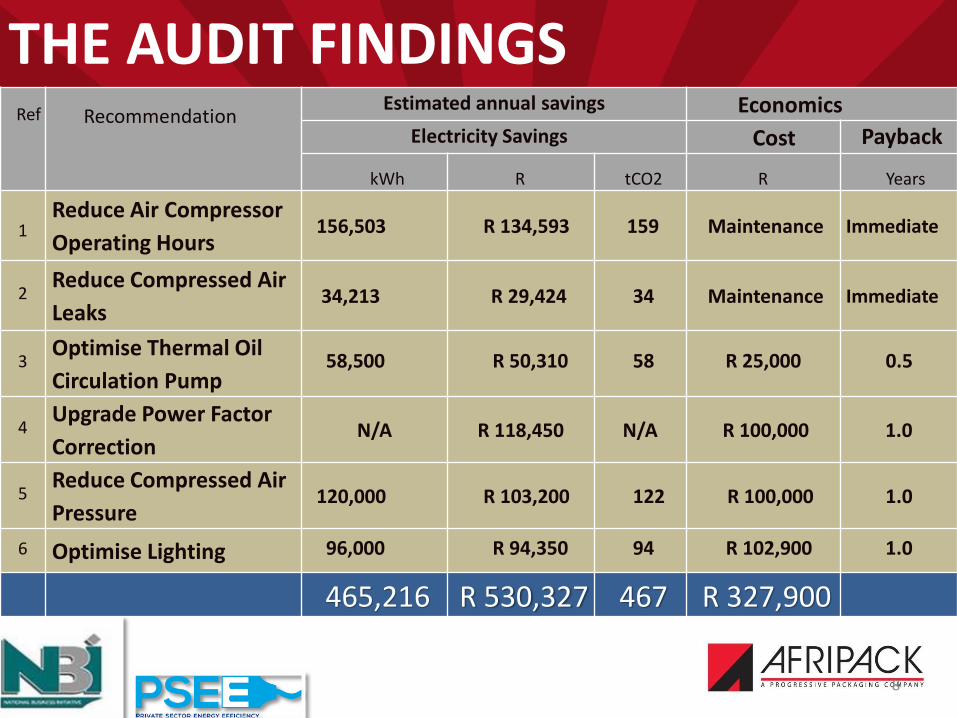
THE AUDIT FINDINGS
8
Ref
Recommendation Estimated annual savings Economics
Electricity Savings Cost
Payback
kWh
R
tCO2
R
Years
1
Reduce Air Compressor
Operating Hours 156,503 R 134,593 159 Maintenance Immediate
2 Reduce Compressed Air
Leaks 34,213 R 29,424 34 Maintenance Immediate
3 Optimise Thermal Oil
Circulation Pump 58,500 R 50,310 58 R 25,000 0.5
4 Upgrade Power Factor
Correction N/A R 118,450 N/A R 100,000 1.0
5 Reduce Compressed Air
Pressure 120,000 R 103,200 122 R 100,000 1.0
6 Optimise Lighting 96,000 R 94,350 94 R 102,900 1.0
465,216 R 530,327 467 R 327,900

THE AUDIT FINDINGS
9
Ref
Recommendation
Estimated annual savings Economics
Fuel Savings Cost Payback
kg
R
tCO2
R
Years
1 Heat Recovery 1,815,600 R 2,115,622 2,723 R 500,000 0.25
2 Fuel Swop from
LPG to Paraffin 0 R 1,765,262 N/A R 500,000 0.30
Total
1,815,600
R 3,880,884 2,723 R 1,000,000 0.50

THE AUDIT FINDINGS
10
11
The compressor findings
• We have reduced the operating hours of the compressor, it gets shut down weekends when not required, we also ensured that it is ramped down when the demand is low
• Programme began to trace and fix the compressor leaks
• A programme has started to replace all air-driven pumps with those that work on a lower bar rating – 26 out of 38 so far
• Once complete, we can reduce the air pressure
THE AFRIPACK RESPONSES

12
Lighting
• We have optimised all outdoor lighting to LED and done away with 400W sodium/metal halide lights
• Internally we have converted the majority of the lights to T5 fluorescent tubes, and we are over the required lux level at work stations and around machines, as this is an operational requirement
THE AFRIPACK RESPONSES

13
Power factor correction
• Power factor correction is a project also on the cards, we have removed some machinery and our power factor has improved to an acceptable 0.98
• We will relook PF correction after we have installed our new machines by 2017.
THE AFRIPACK RESPONSES

14
Fuel swop from LPG to paraffin
• We didn’t do the fuel swop – LPG is a cleaner burning fuel and the burners require less maintenance - what we did do is renegotiate our supply price (saving of R3.5/L)
• In December we will do efficiency tests on our burners and change our supplier for a bigger reduction in cost (by R6/L)
• After the tests and optimisation we expect to save somewhere in the region of R2mil/annum – this was not an audit recommendation, but the actions we did were sparked from this finding
•
THE AFRIPACK RESPONSES

15
Heat recovery
• We didn’t do the recommendation but because of it we looked at our ventilation system, we found flaws in the design and we are currently rectifying; this will stop us from dumping all the hot air thus requiring less heating due to circulation of used hot air. This will also result in reducing the burner temperature which is a further gas saving.
• We are doing a heat recovery exercise for our curing room so that we don’t use electric elements, and this is a project for implementation in 2017.
THE AFRIPACK RESPONSES

16
There was an immediate response to
the changes in our energy
management – as can be seen
from the following slides…
THE AFRIPACK RESULTS
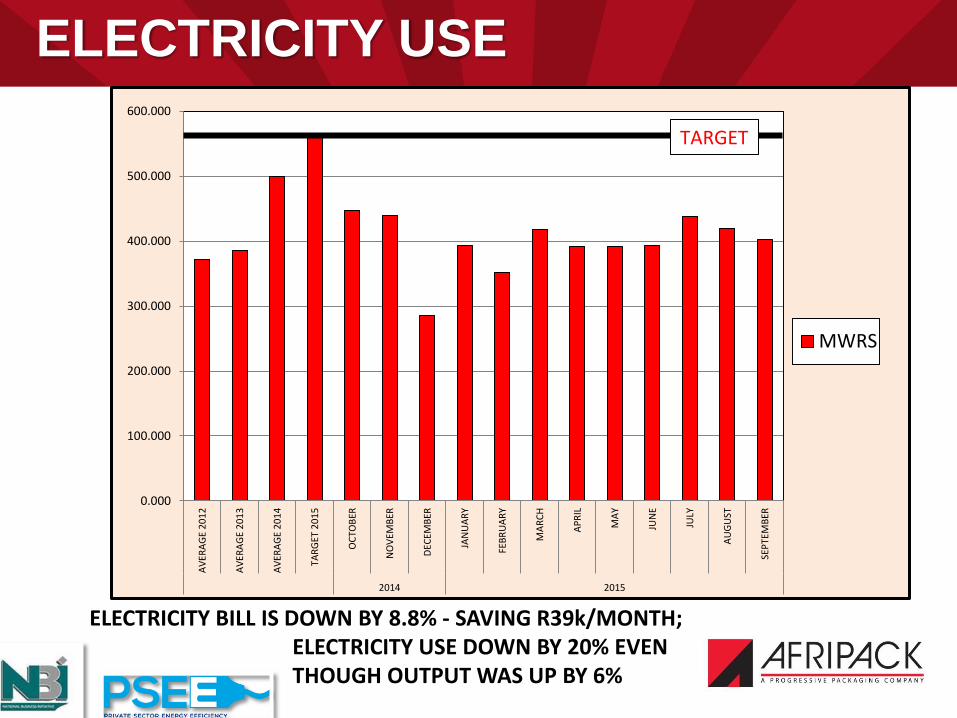
ELECTRICITY USE
0.000
100.000
200.000
300.000
400.000
500.000
600.000
AV
ERA
GE
20
12
AV
ERA
GE
20
13
AV
ERA
GE
20
14
TAR
GET
20
15
OC
TOB
ER
NO
VEM
BER
DEC
EMB
ER
JAN
UA
RY
FEB
RU
AR
Y
MA
RC
H
AP
RIL
MA
Y
JUN
E
JULY
AU
GU
ST
SEP
TEM
BER
2014 2015
MWRS
TARGET
ELECTRICITY BILL IS DOWN BY 8.8% - SAVING R39k/MONTH; ELECTRICITY USE DOWN BY 20% EVEN THOUGH OUTPUT WAS UP BY 6%

ELECTRICITY USE PER TONNE PRODUCT
0.00
0.20
0.40
0.60
0.80
1.00
1.20
1.40
AV
ERA
GE
20
12
AV
ERA
GE
20
13
AV
ERA
GE
20
14
TAR
GET
20
15
OC
TOB
ER
NO
VEM
BER
DEC
EMB
ER
JAN
UA
RY
FEB
RU
AR
Y
MA
RC
H
AP
RIL
MA
Y
JUN
E
JULY
AU
GU
ST
SEP
TEM
BER
2014 2015
MWHR/TONNEPRODUCT
TARGET
24% BELOW 2014 AVERAGE
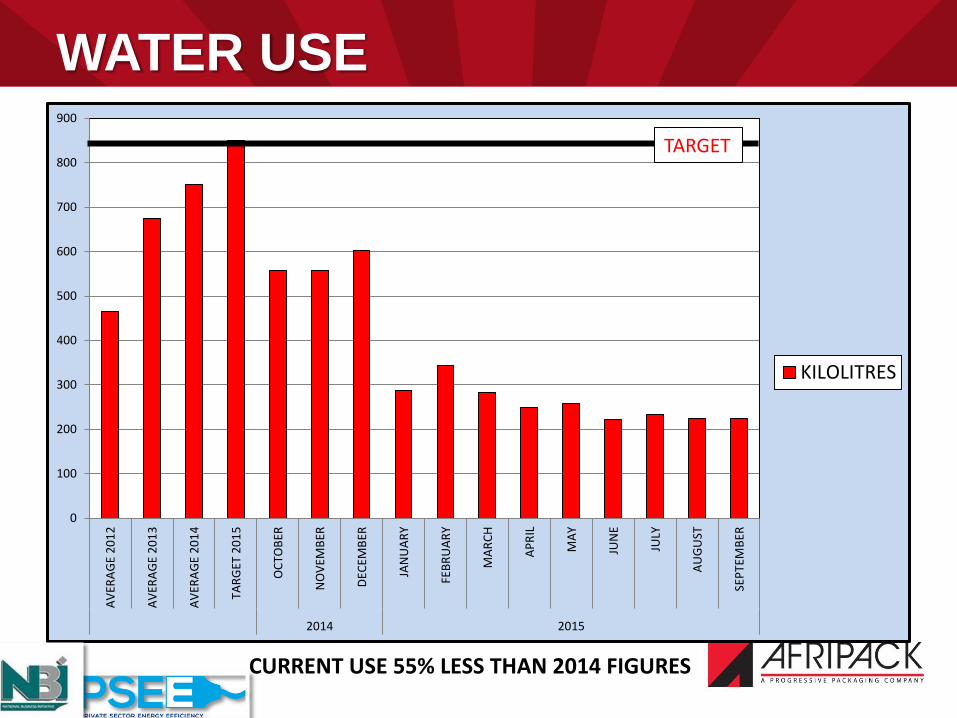
WATER USE
0
100
200
300
400
500
600
700
800
900A
VER
AG
E 2
01
2
AV
ERA
GE
20
13
AV
ERA
GE
20
14
TAR
GET
20
15
OC
TOB
ER
NO
VEM
BER
DEC
EMB
ER
JAN
UA
RY
FEB
RU
AR
Y
MA
RC
H
AP
RIL
MA
Y
JUN
E
JULY
AU
GU
ST
SEP
TEM
BER
2014 2015
KILOLITRES
CURRENT USE 55% LESS THAN 2014 FIGURES
TARGET

WATER USE PER TONNE PRODUCT
0.00
0.20
0.40
0.60
0.80
1.00
1.20
1.40
1.60
1.80
AV
ERA
GE
20
12
AV
ERA
GE
20
13
AV
ERA
GE
20
14
TAR
GET
20
15
OC
TOB
ER
NO
VEM
BER
DEC
EMB
ER
JAN
UA
RY
FEB
RU
AR
Y
MA
RC
H
AP
RIL
MA
Y
JUN
E
JULY
AU
GU
ST
SEP
TEM
BER
2014 2015
56% LOWER THAN 2014 USAGE
TARGET

CARBON FOOTPRINT – TOTAL
83% OF TOTAL FOOTPRINT IS ESKOM ELECTRICITY
14%
83%
3%
TOTAL CARBON FOOTPRINT ACF KZN 2015
SCOPE 1
SCOPE 2
SCOPE 3
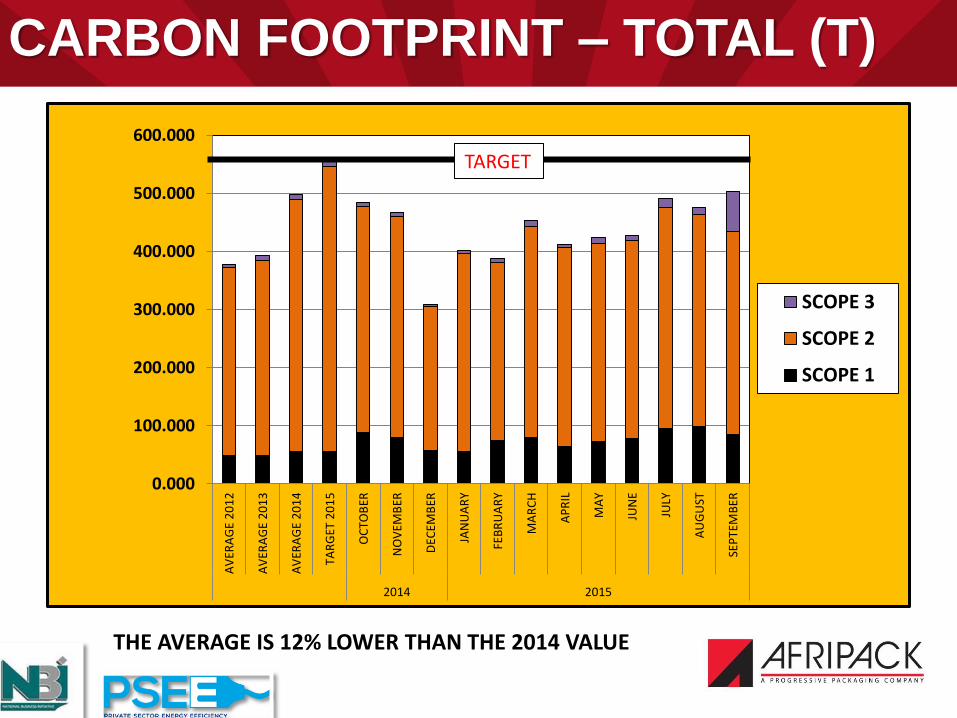
CARBON FOOTPRINT – TOTAL (T)
0.000
100.000
200.000
300.000
400.000
500.000
600.000
AV
ERA
GE
20
12
AV
ERA
GE
20
13
AV
ERA
GE
20
14
TAR
GET
20
15
OC
TOB
ER
NO
VEM
BER
DEC
EMB
ER
JAN
UA
RY
FEB
RU
AR
Y
MA
RC
H
AP
RIL
MA
Y
JUN
E
JULY
AU
GU
ST
SEP
TEM
BER
2014 2015
SCOPE 3
SCOPE 2
SCOPE 1
THE AVERAGE IS 12% LOWER THAN THE 2014 VALUE
TARGET

CARBON FOOTPRINT PER T product
0.00
0.20
0.40
0.60
0.80
1.00
1.20
1.40A
VER
AG
E 2
012
AV
ERA
GE
20
13
AV
ERA
GE
20
14
TAR
GET
20
15
OC
TOB
ER
NO
VEM
BER
DEC
EMB
ER
JAN
UA
RY
FEB
RU
AR
Y
MA
RC
H
AP
RIL
MA
Y
JUN
E
JULY
AU
GU
ST
SEP
TEM
BER
2014 2015
23% LOWER THAN IN 2014
TARGET

SUMMARY OF RESULTS 2014
AVERAGE OVER
2014: ACF KZN ELECTRICITY
(MWhr/T)
WATER
(Kl/T)
WASTE
(DIVERSION
FROM LANDFILL)
CO2
FOOTPRINT (tCO2e/T product)
ON OR
ABOVE 2013
RESULT
-8%
UP TO 5%
WITHIN 2013
RESULT
+3%
MORE THAN
5% OFF 2013
RESULT
+6%
-11%

SUMMARY OF RESULTS 2015
AVERAGE OVER
2015: ACF KZN ELECTRICITY
(MWhr/T)
WATER
(Kl/T)
WASTE
(DIVERSION
FROM LANDFILL)
CO2
FOOTPRINT (tCO2e/T product)
ON OR
ABOVE 2014
RESULT
-24%
-56%
+4.9%
-23%
UP TO 5%
WITHIN 2014
RESULT
MORE THAN
5% OFF 2014
RESULT