Embed Size (px)
Citation preview

The Importance of Data Occupations in the U.S.
Economy
Executive Summary
The growing importance of data in the economy is hard to dispute. But what does this mean for workers and jobs? A lot, as it turns out: higher paying (over $40/hour), faster growing jobs.
In this report we identify occupations where data analysis and processing are central to the work performed and measure the size of employment and earnings in these occupations, as well as in the industries that have the highest concentration of these data occupations.
Key findings of the report include:
• Employment where data is central to the job was about 10.3 million in 2013 (of which 1.6 million were government workers), or about 7.8 percent of all employment. However, including occupations where working with data is at least an important part of the job dramatically increases that number: to 74.3 million jobs, or over half of the workforce.
• Hourly wages for private-sector workers in data occupations, which are concentrated in the broad categories of business and computer/mathematical occupations, averaged $40.30 in 2013, about 68 percent higher for all occupations.
• For these top data occupations, two-thirds or more of the workers have at least a college degree; in comparison about one-third of workers across all occupations have a bachelor’s degree or higher.
• Private sector industries with the highest concentration of data occupations added 1.8 million jobs over the last decade, representing about 31 percent of total private job growth which was four times faster than in private industries overall.
• Data intensive industries are located in many states, but the highest concentrations are in Washington, D.C.; Virginia; Massachusetts; Maryland; and Connecticut.
By William Hawk, Regina Powers, Economists, and Robert Rubinovitz Deputy Chief Economist Economics and Statistics Administration Office of the Chief Economist ESA Issue Brief #01-15 March 12, 2015
U.S. Department of Commerce, ESA, Office of the Chief Economist Page 2
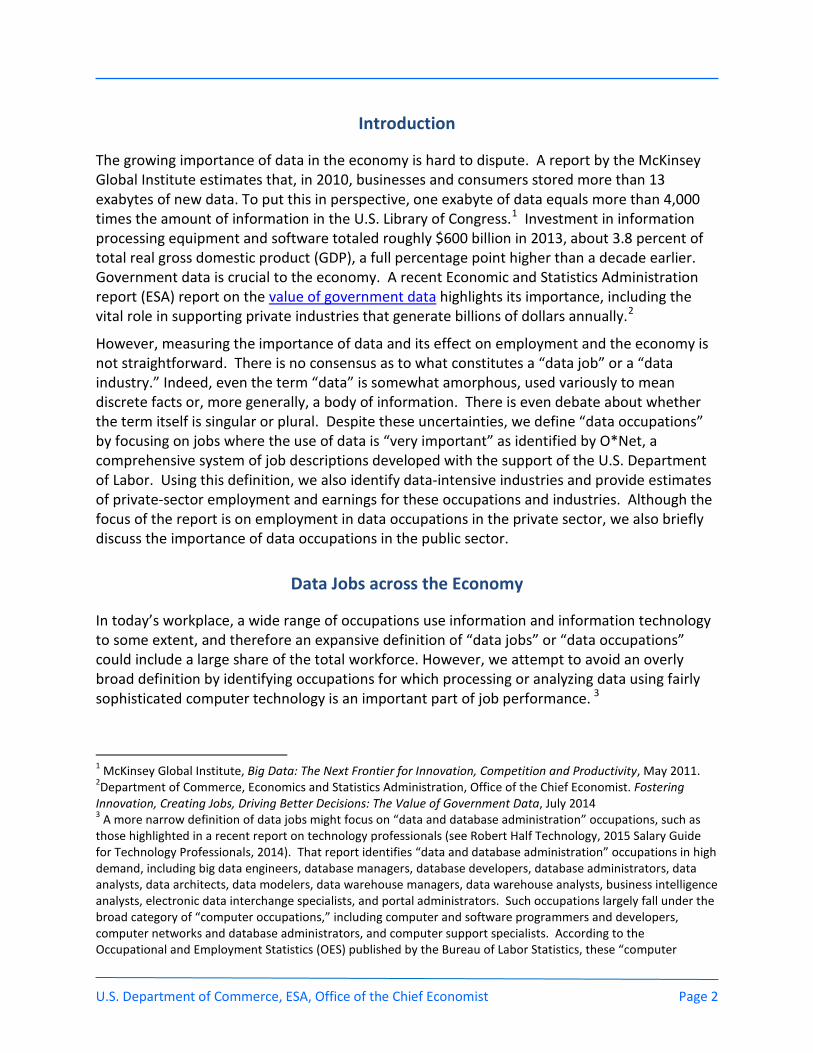
Introduction
The growing importance of data in the economy is hard to dispute. A report by the McKinsey Global Institute estimates that, in 2010, businesses and consumers stored more than 13 exabytes of new data. To put this in perspective, one exabyte of data equals more than 4,000 times the amount of information in the U.S. Library of Congress.1 Investment in information processing equipment and software totaled roughly $600 billion in 2013, about 3.8 percent of total real gross domestic product (GDP), a full percentage point higher than a decade earlier. Government data is crucial to the economy. A recent Economic and Statistics Administration report (ESA) report on the value of government data highlights its importance, including the vital role in supporting private industries that generate billions of dollars annually.2
However, measuring the importance of data and its effect on employment and the economy is not straightforward. There is no consensus as to what constitutes a “data job” or a “data industry.” Indeed, even the term “data” is somewhat amorphous, used variously to mean discrete facts or, more generally, a body of information. There is even debate about whether the term itself is singular or plural. Despite these uncertainties, we define “data occupations” by focusing on jobs where the use of data is “very important” as identified by O*Net, a comprehensive system of job descriptions developed with the support of the U.S. Department of Labor. Using this definition, we also identify data-intensive industries and provide estimates of private-sector employment and earnings for these occupations and industries. Although the focus of the report is on employment in data occupations in the private sector, we also briefly discuss the importance of data occupations in the public sector.
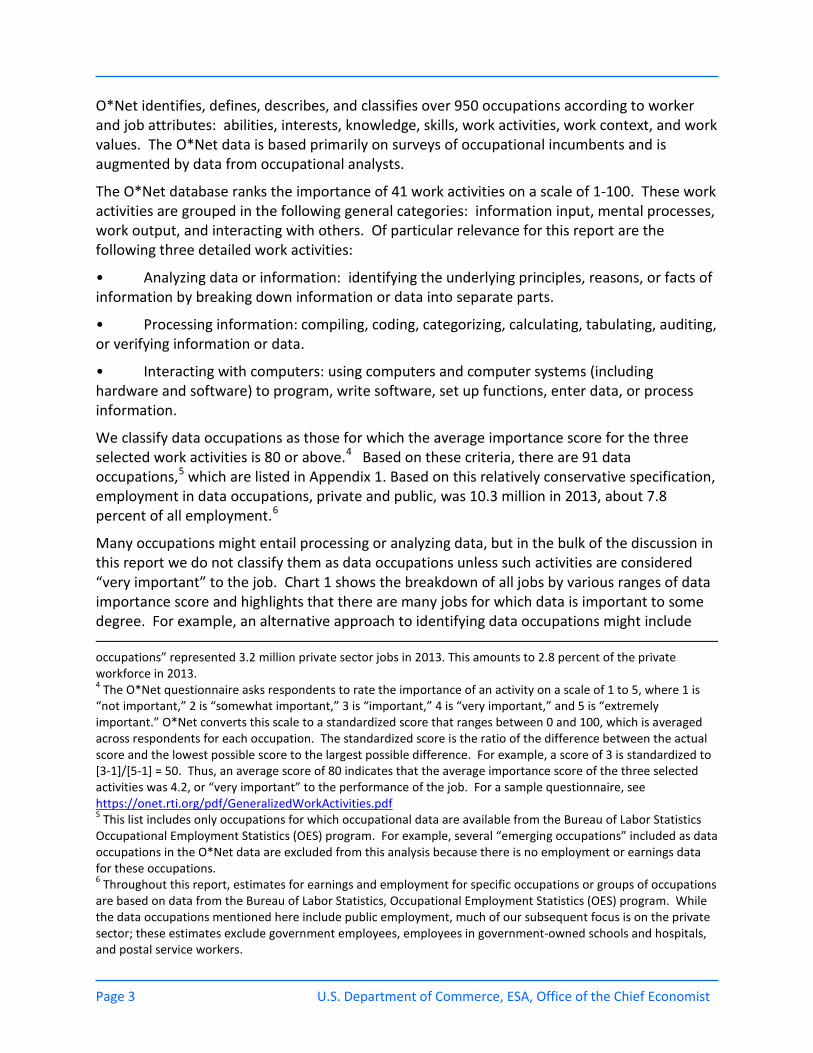
Data Jobs across the Economy
In today’s workplace, a wide range of occupations use information and information technology to some extent, and therefore an expansive definition of “data jobs” or “data occupations” could include a large share of the total workforce. However, we attempt to avoid an overly broad definition by identifying occupations for which processing or analyzing data using fairly sophisticated computer technology is an important part of job performance. 3
1 McKinsey Global Institute, Big Data: The Next Frontier for Innovation, Competition and Productivity, May 2011. 2Department of Commerce, Economics and Statistics Administration, Office of the Chief Economist. Fostering Innovation, Creating Jobs, Driving Better Decisions: The Value of Government Data, July 2014 3 A more narrow definition of data jobs might focus on “data and database administration” occupations, such as those highlighted in a recent report on technology professionals (see Robert Half Technology, 2015 Salary Guide for Technology Professionals, 2014). That report identifies “data and database administration” occupations in high demand, including big data engineers, database managers, database developers, database administrators, data analysts, data architects, data modelers, data warehouse managers, data warehouse analysts, business intelligence analysts, electronic data interchange specialists, and portal administrators. Such occupations largely fall under the broad category of “computer occupations,” including computer and software programmers and developers, computer networks and database administrators, and computer support specialists. According to the Occupational and Employment Statistics (OES) published by the Bureau of Labor Statistics, these “computer
Page 3 U.S. Department of Commerce, ESA, Office of the Chief Economist
O*Net identifies, defines, describes, and classifies over 950 occupations according to worker and job attributes: abilities, interests, knowledge, skills, work activities, work context, and work values. The O*Net data is based primarily on surveys of occupational incumbents and is augmented by data from occupational analysts.
The O*Net database ranks the importance of 41 work activities on a scale of 1-100. These work activities are grouped in the following general categories: information input, mental processes, work output, and interacting with others. Of particular relevance for this report are the following three detailed work activities:
• Analyzing data or information: identifying the underlying principles, reasons, or facts of information by breaking down information or data into separate parts.
• Processing information: compiling, coding, categorizing, calculating, tabulating, auditing, or verifying information or data.
• Interacting with computers: using computers and computer systems (including hardware and software) to program, write software, set up functions, enter data, or process information.
We classify data occupations as those for which the average importance score for the three selected work activities is 80 or above.4 Based on these criteria, there are 91 data occupations,5 which are listed in Appendix 1. Based on this relatively conservative specification, employment in data occupations, private and public, was 10.3 million in 2013, about 7.8 percent of all employment.6
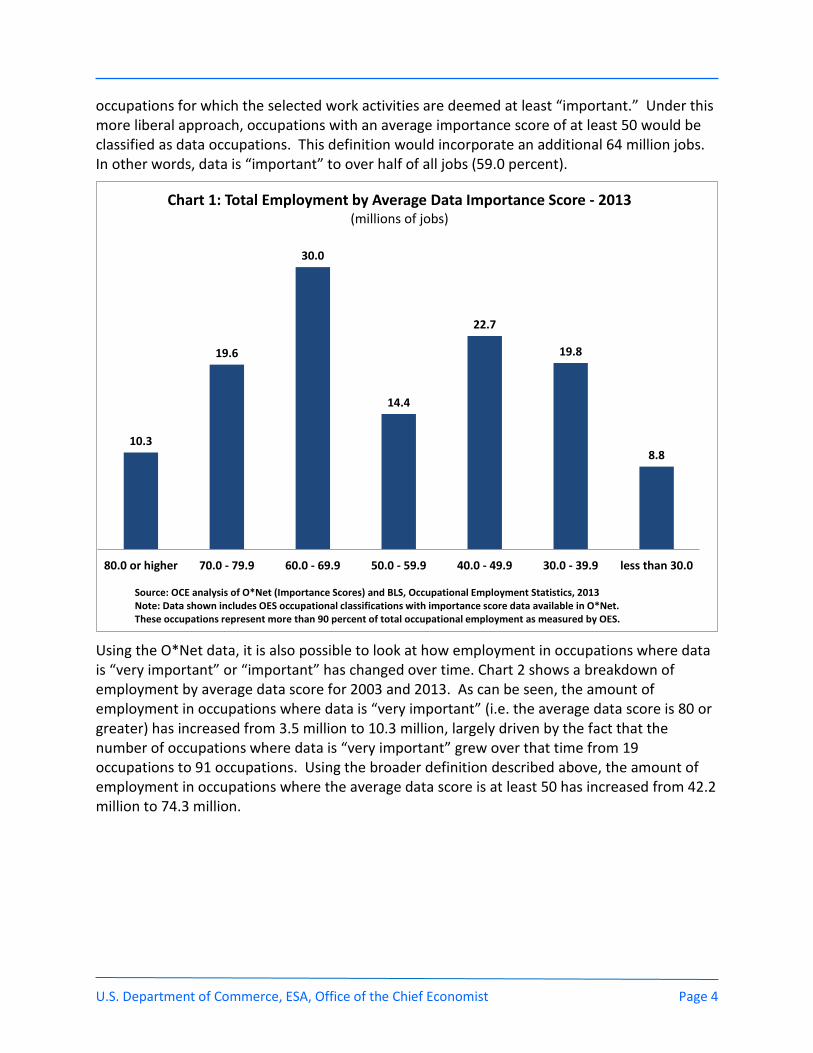
Many occupations might entail processing or analyzing data, but in the bulk of the discussion in this report we do not classify them as data occupations unless such activities are considered “very important” to the job. Chart 1 shows the breakdown of all jobs by various ranges of data importance score and highlights that there are many jobs for which data is important to some degree. For example, an alternative approach to identifying data occupations might include occupations” represented 3.2 million private sector jobs in 2013. This amounts to 2.8 percent of the private workforce in 2013. 4 The O*Net questionnaire asks respondents to rate the importance of an activity on a scale of 1 to 5, where 1 is “not important,” 2 is “somewhat important,” 3 is “important,” 4 is “very important,” and 5 is “extremely important.” O*Net converts this scale to a standardized score that ranges between 0 and 100, which is averaged across respondents for each occupation. The standardized score is the ratio of the difference between the actual score and the lowest possible score to the largest possible difference. For example, a score of 3 is standardized to [3-1]/[5-1] = 50. Thus, an average score of 80 indicates that the average importance score of the three selected activities was 4.2, or “very important” to the performance of the job. For a sample questionnaire, see https://onet.rti.org/pdf/GeneralizedWorkActivities.pdf 5 This list includes only occupations for which occupational data are available from the Bureau of Labor Statistics Occupational Employment Statistics (OES) program. For example, several “emerging occupations” included as data occupations in the O*Net data are excluded from this analysis because there is no employment or earnings data for these occupations. 6 Throughout this report, estimates for earnings and employment for specific occupations or groups of occupations are based on data from the Bureau of Labor Statistics, Occupational Employment Statistics (OES) program. While the data occupations mentioned here include public employment, much of our subsequent focus is on the private sector; these estimates exclude government employees, employees in government-owned schools and hospitals, and postal service workers.
U.S. Department of Commerce, ESA, Office of the Chief Economist Page 4
occupations for which the selected work activities are deemed at least “important.” Under this more liberal approach, occupations with an average importance score of at least 50 would be classified as data occupations. This definition would incorporate an additional 64 million jobs. In other words, data is “important” to over half of all jobs (59.0 percent).
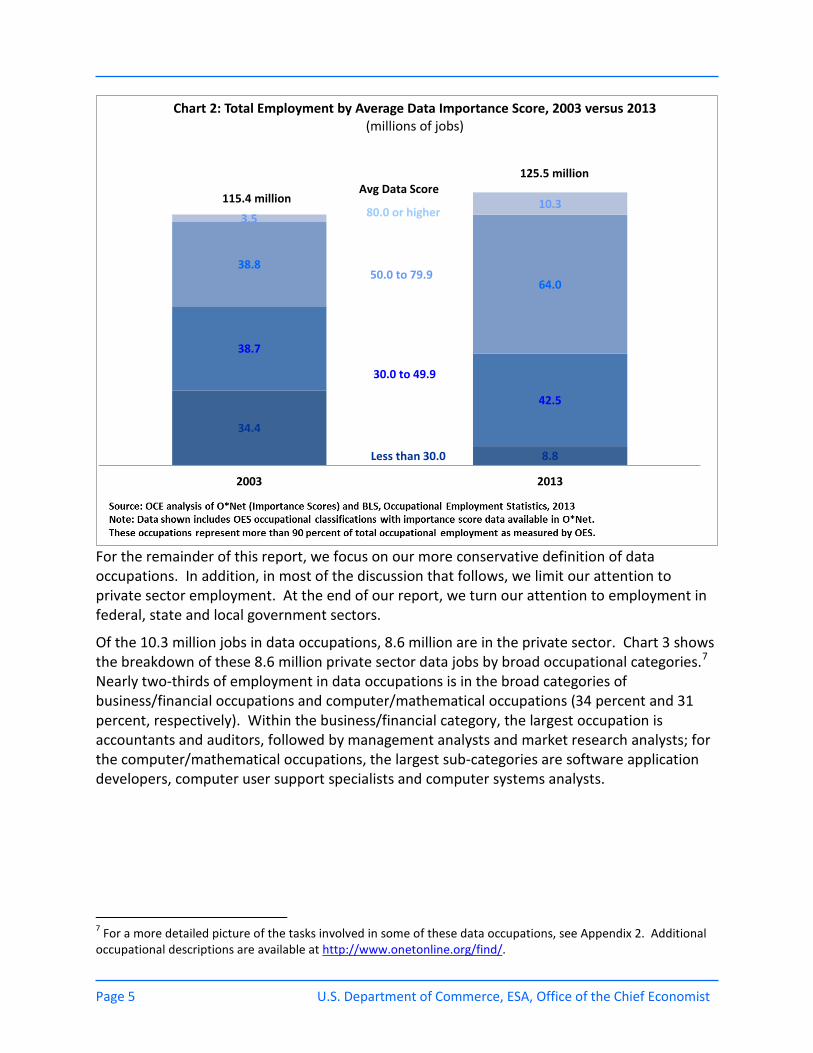
Using the O*Net data, it is also possible to look at how employment in occupations where data is “very important” or “important” has changed over time. Chart 2 shows a breakdown of employment by average data score for 2003 and 2013. As can be seen, the amount of employment in occupations where data is “very important” (i.e. the average data score is 80 or greater) has increased from 3.5 million to 10.3 million, largely driven by the fact that the number of occupations where data is “very important” grew over that time from 19 occupations to 91 occupations. Using the broader definition described above, the amount of employment in occupations where the average data score is at least 50 has increased from 42.2 million to 74.3 million.
10.3
19.6
30.0
14.4
22.7
19.8
8.8
80.0 or higher 70.0 - 79.9 60.0 - 69.9 50.0 - 59.9 40.0 - 49.9 30.0 - 39.9 less than 30.0
Chart 1: Total Employment by Average Data Importance Score - 2013(millions of jobs)
Source: OCE analysis of O*Net (Importance Scores) and BLS, Occupational Employment Statistics, 2013Note: Data shown includes OES occupational classifications with importance score data available in O*Net. These occupations represent more than 90 percent of total occupational employment as measured by OES.
Page 5 U.S. Department of Commerce, ESA, Office of the Chief Economist
For the remainder of this report, we focus on our more conservative definition of data occupations. In addition, in most of the discussion that follows, we limit our attention to private sector employment. At the end of our report, we turn our attention to employment in federal, state and local government sectors.
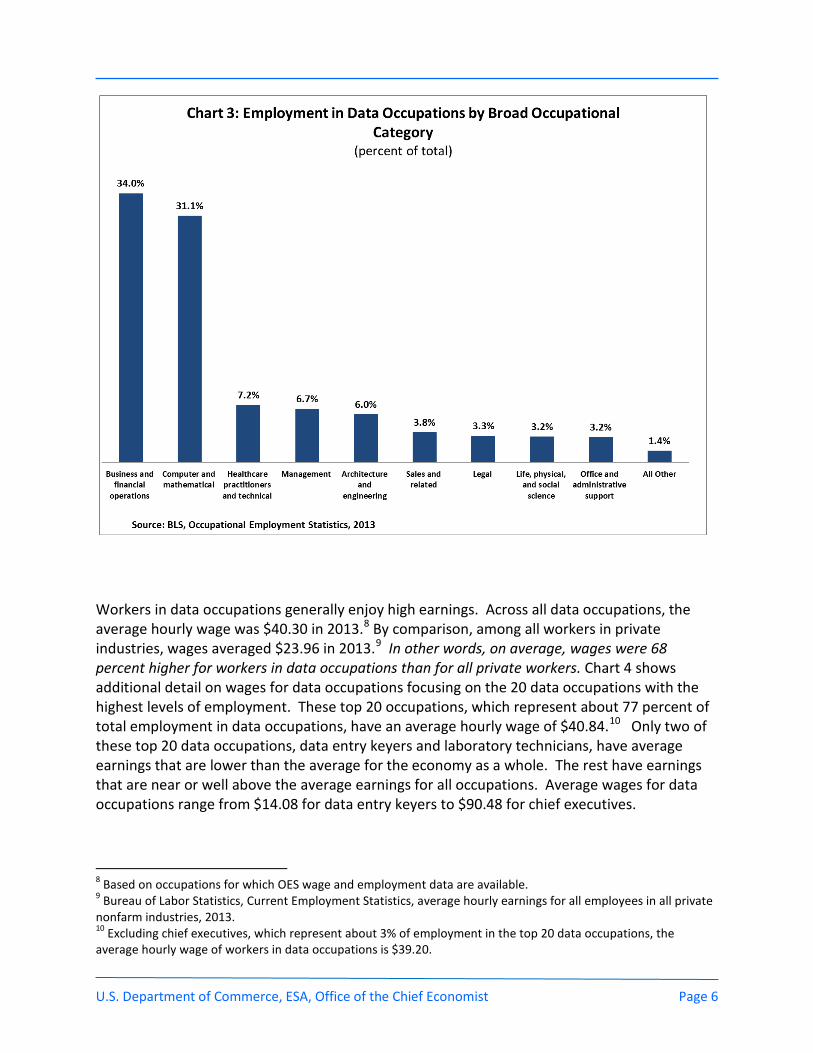
Of the 10.3 million jobs in data occupations, 8.6 million are in the private sector. Chart 3 shows the breakdown of these 8.6 million private sector data jobs by broad occupational categories.7 Nearly two-thirds of employment in data occupations is in the broad categories of business/financial occupations and computer/mathematical occupations (34 percent and 31 percent, respectively). Within the business/financial category, the largest occupation is accountants and auditors, followed by management analysts and market research analysts; for the computer/mathematical occupations, the largest sub-categories are software application developers, computer user support specialists and computer systems analysts.
7 For a more detailed picture of the tasks involved in some of these data occupations, see Appendix 2. Additional occupational descriptions are available at http://www.onetonline.org/find/.
34.4
8.8
38.7
42.5
38.8
64.0
3.510.3
2003 2013
Chart 2: Total Employment by Average Data Importance Score, 2003 versus 2013(millions of jobs)
80.0 or higher
50.0 to 79.9
30.0 to 49.9
Less than 30.0
Avg Data Score125.5 million
115.4 million
U.S. Department of Commerce, ESA, Office of the Chief Economist Page 6
Workers in data occupations generally enjoy high earnings. Across all data occupations, the average hourly wage was $40.30 in 2013.8 By comparison, among all workers in private industries, wages averaged $23.96 in 2013.9 In other words, on average, wages were 68 percent higher for workers in data occupations than for all private workers. Chart 4 shows additional detail on wages for data occupations focusing on the 20 data occupations with the highest levels of employment. These top 20 occupations, which represent about 77 percent of total employment in data occupations, have an average hourly wage of $40.84.10 Only two of these top 20 data occupations, data entry keyers and laboratory technicians, have average earnings that are lower than the average for the economy as a whole. The rest have earnings that are near or well above the average earnings for all occupations. Average wages for data occupations range from $14.08 for data entry keyers to $90.48 for chief executives.
8 Based on occupations for which OES wage and employment data are available. 9 Bureau of Labor Statistics, Current Employment Statistics, average hourly earnings for all employees in all private nonfarm industries, 2013. 10 Excluding chief executives, which represent about 3% of employment in the top 20 data occupations, the average hourly wage of workers in data occupations is $39.20.

Page 7 U.S. Department of Commerce, ESA, Office of the Chief Economist
Chart 5 shows the educational attainment of workers employed in these top data occupations, as well as for workers in all occupations. About one-third of workers across all occupations have a bachelor’s degree or higher; in comparison, for these top data occupations, two-thirds or more of the workers have at least a college degree. Only data entry keyers and cost estimators have a share of workers with at least a college degree that is lower than the share across all occupations.11
11 The higher wages and higher educational attainment for data jobs in Chart 4 are likely related. That is, given that workers with higher educational attainment levels tend to be paid more, it would be expected that workers in data occupations, given their higher average level of educational attainment, would have higher average wages relative to other occupations.

U.S. Department of Commerce, ESA, Office of the Chief Economist Page 8
Chart 6 shows the major field of study for private sector workers in data occupations who earned a college degree.12 Perhaps not surprisingly, workers in data occupations were most likely to have majored in a science, technology, engineering and math (STEM) field; roughly 36 percent of workers in data occupations with a college degree had a STEM major. This is in comparison to the workforce, as a whole, where only about a quarter of those who graduated college majored in a STEM field. In addition, a large percentage of workers in data occupations (32 percent) studied a business-related field (as compared to 24 percent for the workforce as a whole) while more than 20 percent of these workers had a college major in the social sciences or humanities.
12 This analysis uses American Community Survey data for persons employed by private for-profit organizations or private non-profit organizations or self-employed in their own incorporated business. It excludes the unemployed, government employees, persons self-employed in an unincorporated business, and those working without pay in a family business.

Page 9 U.S. Department of Commerce, ESA, Office of the Chief Economist
Jobs in Data-Intensive Industries
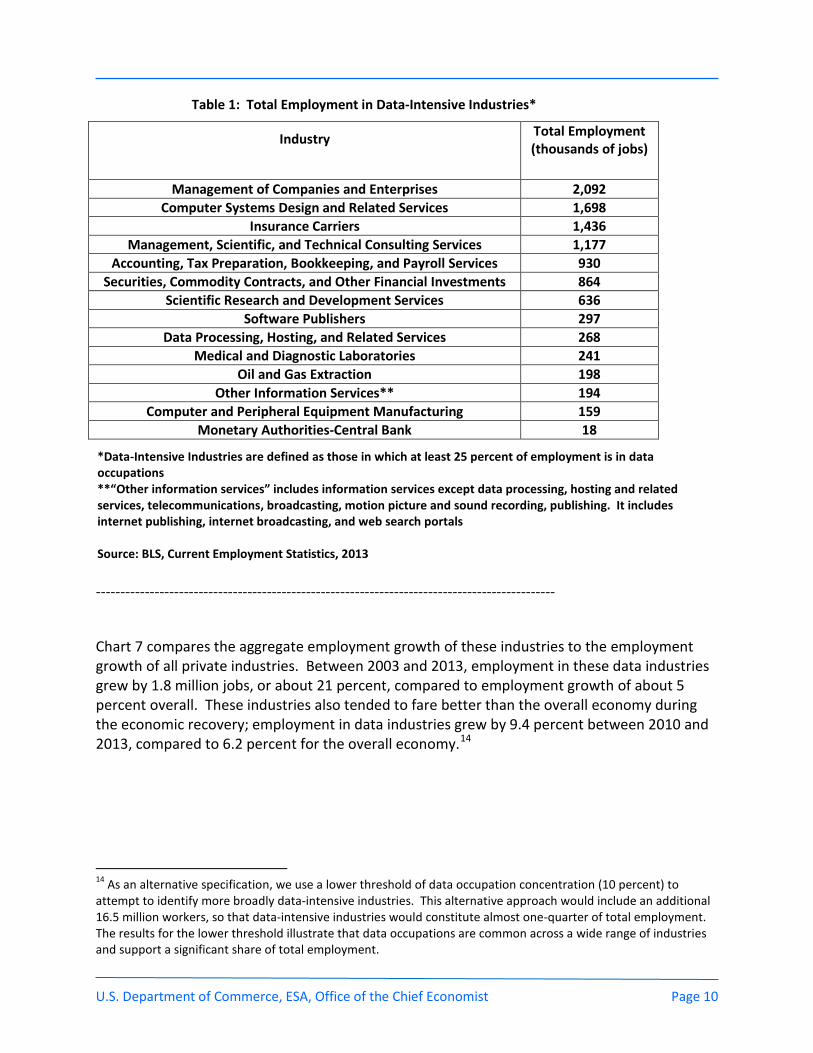
Another way to measure the importance of data in the economy is to focus on industries that are data-intensive. However, efforts to estimate the economic importance of data-intensive sectors have encountered challenges in clearly identifying such sectors as distinct from the rest of the economy.13 For this report, we identify private sector data-intensive industries as those in which employment in data occupations represent at least 25 percent of the industry’s total private employment. Table 1 lists these industries in order of size (total employment).
13 See, for example, Deighton, John and Peter A. Johnson, 2013. The Value of Data: Consequences for Insight, Innovation & Efficiency in the U.S. Economy. Direct Marketing Association, Data-Driven Marketing Institute, 2013. See also Oxera Consulting, Ltd. What is the Economic Impact of Geo Services? 2013.
U.S. Department of Commerce, ESA, Office of the Chief Economist Page 10
Table 1: Total Employment in Data-Intensive Industries*
Industry Total Employment (thousands of jobs)
Management of Companies and Enterprises 2,092 Computer Systems Design and Related Services 1,698
Insurance Carriers 1,436 Management, Scientific, and Technical Consulting Services 1,177
Accounting, Tax Preparation, Bookkeeping, and Payroll Services 930 Securities, Commodity Contracts, and Other Financial Investments 864
Scientific Research and Development Services 636 Software Publishers 297
Data Processing, Hosting, and Related Services 268 Medical and Diagnostic Laboratories 241
Oil and Gas Extraction 198 Other Information Services** 194
Computer and Peripheral Equipment Manufacturing 159 Monetary Authorities-Central Bank 18
----------------------------------------------------------------------------------------------
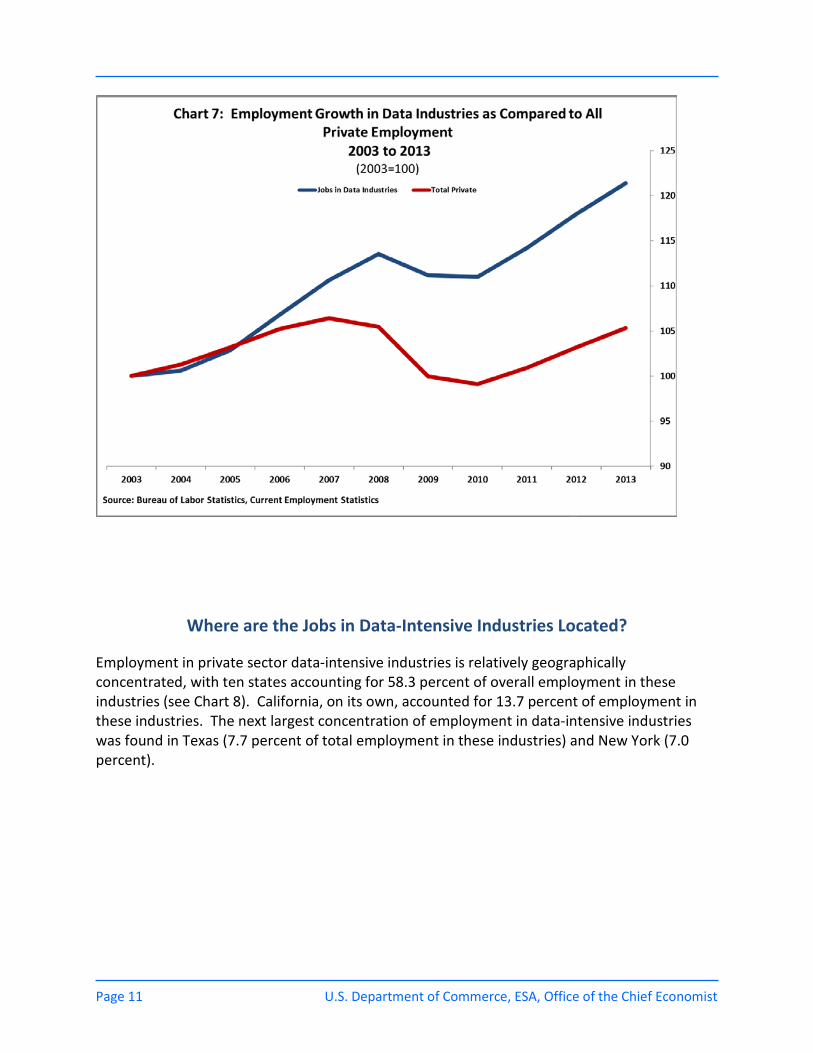
Chart 7 compares the aggregate employment growth of these industries to the employment growth of all private industries. Between 2003 and 2013, employment in these data industries grew by 1.8 million jobs, or about 21 percent, compared to employment growth of about 5 percent overall. These industries also tended to fare better than the overall economy during the economic recovery; employment in data industries grew by 9.4 percent between 2010 and 2013, compared to 6.2 percent for the overall economy.14
14 As an alternative specification, we use a lower threshold of data occupation concentration (10 percent) to attempt to identify more broadly data-intensive industries. This alternative approach would include an additional 16.5 million workers, so that data-intensive industries would constitute almost one-quarter of total employment. The results for the lower threshold illustrate that data occupations are common across a wide range of industries and support a significant share of total employment.
*Data-Intensive Industries are defined as those in which at least 25 percent of employment is in data occupations **“Other information services” includes information services except data processing, hosting and related services, telecommunications, broadcasting, motion picture and sound recording, publishing. It includes internet publishing, internet broadcasting, and web search portals Source: BLS, Current Employment Statistics, 2013
Page 11 U.S. Department of Commerce, ESA, Office of the Chief Economist
Where are the Jobs in Data-Intensive Industries Located?
Employment in private sector data-intensive industries is relatively geographically concentrated, with ten states accounting for 58.3 percent of overall employment in these industries (see Chart 8). California, on its own, accounted for 13.7 percent of employment in these industries. The next largest concentration of employment in data-intensive industries was found in Texas (7.7 percent of total employment in these industries) and New York (7.0 percent).

U.S. Department of Commerce, ESA, Office of the Chief Economist Page 12
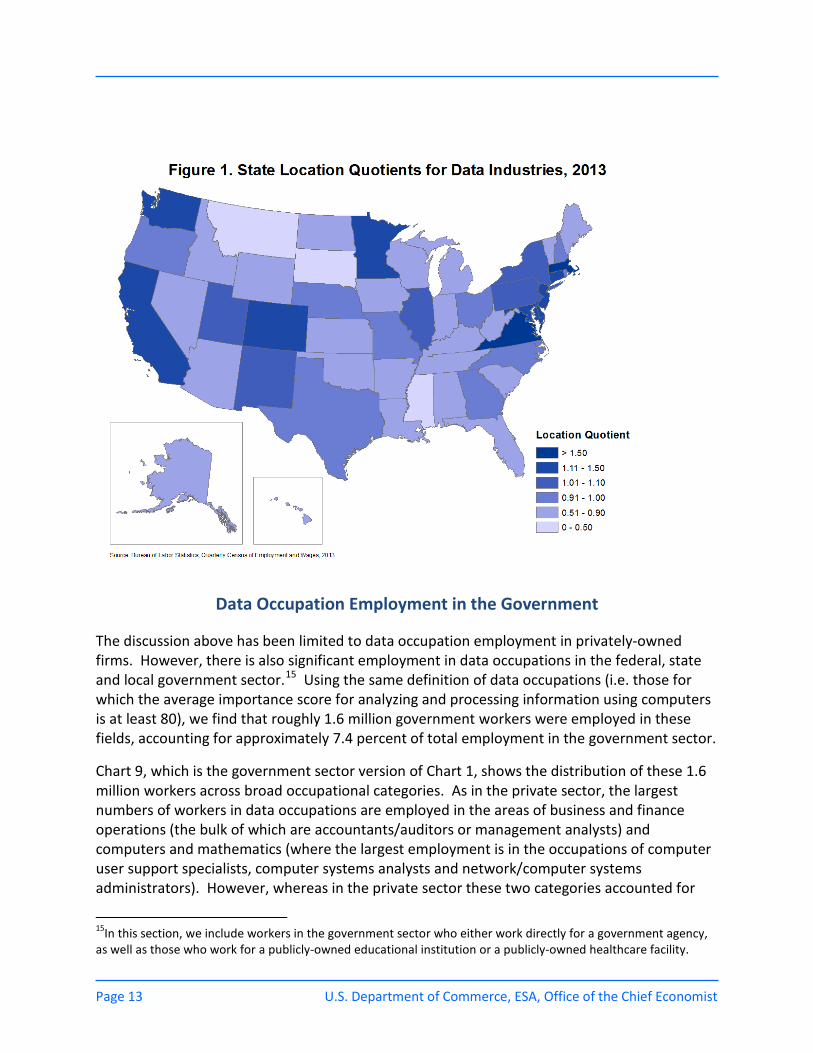
Another way to look at the question of the geographic concentration of workers in data-intensive industries is to measure the “location quotient” for these workers in each state. The location quotient compares the percentage of all workers in a state who are in data industries to the national average. A location quotient greater than 1 implies that the percentage of employment in data-intensive industries in a given state is higher than the national average.
Using this measure, employment in the District of Columbia has the highest concentration of employment in private sector data-intensive industries relative to the nation; its location quotient is 1.70, indicating that the share of its workforce in data-intensive industries is over one and a half times as large as the national average. Virginia and Maryland, with location quotients of 1.68 and 1.32, respectively, are in the top five states for data industry concentration, suggesting that jobs that support the federal government may be playing a role in this specialization in data industries. Massachusetts (1.57) and Connecticut (1.29) are the other two states in the top five in terms of the degree of specialization in data-intensive industries. Colorado and New Jersey also have relatively high degrees of specialization in data-intensive industries, with location quotients of 1.28 and 1.25, respectively, followed by California (1.18), Minnesota (1.17), Washington (1.15) and Delaware (1.11). (See Figure 1.)
Page 13 U.S. Department of Commerce, ESA, Office of the Chief Economist
Data Occupation Employment in the Government
The discussion above has been limited to data occupation employment in privately-owned firms. However, there is also significant employment in data occupations in the federal, state and local government sector.15 Using the same definition of data occupations (i.e. those for which the average importance score for analyzing and processing information using computers is at least 80), we find that roughly 1.6 million government workers were employed in these fields, accounting for approximately 7.4 percent of total employment in the government sector.
Chart 9, which is the government sector version of Chart 1, shows the distribution of these 1.6 million workers across broad occupational categories. As in the private sector, the largest numbers of workers in data occupations are employed in the areas of business and finance operations (the bulk of which are accountants/auditors or management analysts) and computers and mathematics (where the largest employment is in the occupations of computer user support specialists, computer systems analysts and network/computer systems administrators). However, whereas in the private sector these two categories accounted for
15In this section, we include workers in the government sector who either work directly for a government agency, as well as those who work for a publicly-owned educational institution or a publicly-owned healthcare facility.

U.S. Department of Commerce, ESA, Office of the Chief Economist Page 14
nearly two-thirds of data occupation employment, in the government sector less than half of total data occupation employment is in these areas. Employment in data occupations in the areas of management (primarily education administration) and in office support (largely police and fire dispatchers) make up a larger portion of the total in the government sector than they do in the private sector; these two areas account for more than a quarter of the government sector employment in data occupations, as compared to 10 percent in the private sector.
Conclusion
This report suggests that the growing importance of data has had a measurable effect on the economy and jobs. We define data occupations as those for which analyzing and processing data using sophisticated computer technology is very important. We employ data from a comprehensive occupational classification system to identify the occupations that fall under this definition, and we measure the employment, earnings, education, and industry concentrations of these occupations.
We find that, in the private sector, data occupations employ 8.6 million workers, although a more liberal definition of data occupations would include over half of all private sector employment. These workers are concentrated in the fields of business and computers but are otherwise dispersed throughout many fields. Private sector workers in data occupations tend to be paid relatively well and have relatively high levels of education. Furthermore, private
Page 15 U.S. Department of Commerce, ESA, Office of the Chief Economist
sector employment in data-intensive industries has outpaced overall private employment over the past decade, and workers in these data-intensive industries (including those workers not in data occupations) enjoy relatively high earnings. States with the highest concentrations of employment in data-intensive industries are located along the East Coast.
We also analyze employment in the government sector and find that roughly 1.6 million government workers are employed in data occupations. As with the private sector, the bulk of these workers are in business and computer fields; however, a higher percentage of government workers in data occupations are found in management and in office/administrative support fields as compared to the private sector.
Notwithstanding the challenges of defining and measuring data occupations and data-intensive industries, these findings provide evidence that data is an important economic asset, supporting good jobs and economic growth for the nation.

U.S. Department of Commerce, ESA, Office of the Chief Economist Page 16
Appendix 1: List of Data Occupations, by Importance of the Use of Data
SOC Code Occupation
Average Importance Score
19-2011 Astronomers 96 15-2011 Actuaries 94 15-2041 Statisticians 94 13-2051 Financial Analysts 93 15-2091 Mathematical Technicians 93 19-1041 Epidemiologists 93 13-1161 Market Research Analysts and Marketing Specialists 91 25-1051 Atmospheric, Earth, Marine, and Space Sciences Teachers, Postsecondary 91 25-1054 Physics Teachers, Postsecondary 91 15-2031 Operations Research Analysts 90 19-1013 Soil and Plant Scientists 90 43-9111 Statistical Assistants 90 19-3011 Economists 90 19-1021 Biochemists and Biophysicists 89 25-1082 Library Science Teachers, Postsecondary 89 19-3091 Anthropologists and Archeologists 89 19-2021 Atmospheric and Space Scientists 89 19-3092 Geographers 89 15-1141 Database Administrators 89 19-2042 Geoscientists, Except Hydrologists and Geographers 89 19-3041 Sociologists 89 25-1043 Forestry and Conservation Science Teachers, Postsecondary 89 17-1022 Surveyors 88 19-3022 Survey Researchers 88 25-1041 Agricultural Sciences Teachers, Postsecondary 88 13-1051 Cost Estimators 87 17-2081 Environmental Engineers 87 15-1132 Software Developers, Applications 86 17-2031 Biomedical Engineers 86 19-2031 Chemists 86 13-2031 Budget Analysts 85 19-2012 Physicists 85 23-2093 Title Examiners, Abstractors, and Searchers 85 25-1064 Geography Teachers, Postsecondary 85 25-1065 Political Science Teachers, Postsecondary 85 15-1122 Information Security Analysts 85 17-2061 Computer Hardware Engineers 85 43-9021 Data Entry Keyers 85

Page 17 U.S. Department of Commerce, ESA, Office of the Chief Economist
15-2021 Mathematicians 85 19-1011 Animal Scientists 85 13-2052 Personal Financial Advisors 84 19-1022 Microbiologists 84 13-2011 Accountants and Auditors 84 17-2161 Nuclear Engineers 84 19-1042 Medical Scientists, Except Epidemiologists 84 19-3094 Political Scientists 84 15-1121 Computer Systems Analysts 84 23-1021 Administrative Law Judges, Adjudicators, and Hearing Officers 84 15-1111 Computer and Information Research Scientists 83 25-1081 Education Teachers, Postsecondary 83 41-3031 Securities, Commodities, and Financial Services Sales Agents 83 13-2061 Financial Examiners 83 19-2032 Materials Scientists 83 11-3111 Compensation and Benefits Managers 83 15-1142 Network and Computer Systems Administrators 83 29-1051 Pharmacists 83 15-1134 Web Developers 82 17-2171 Petroleum Engineers 82 17-3022 Civil Engineering Technicians 82 13-2021 Appraisers and Assessors of Real Estate 82 13-1111 Management Analysts 82 17-2041 Chemical Engineers 82 13-2053 Insurance Underwriters 82 17-2011 Aerospace Engineers 82 29-2012 Medical and Clinical Laboratory Technicians 82 43-9011 Computer Operators 82 43-9031 Desktop Publishers 82 11-9032 Education Administrators, Elementary and Secondary School 81 11-9121 Natural Sciences Managers 81 13-1141 Compensation, Benefits, and Job Analysis Specialists 81 15-1131 Computer Programmers 81 17-2151 Mining and Geological Engineers, Including Mining Safety Engineers 81 13-2081 Tax Examiners and Collectors, and Revenue Agents 81 17-2021 Agricultural Engineers 81 23-2011 Paralegals and Legal Assistants 81 29-1071 Physician Assistants 81 29-2011 Medical and Clinical Laboratory Technologists 81 15-1151 Computer User Support Specialists 81 17-1021 Cartographers and Photogrammetrists 81 25-1113 Social Work Teachers, Postsecondary 81 11-3021 Computer and Information Systems Managers 80

U.S. Department of Commerce, ESA, Office of the Chief Economist Page 18
13-1081 Logisticians 80 19-2043 Hydrologists 80 27-1014 Multimedia Artists and Animators 80 53-2011 Airline Pilots, Copilots, and Flight Engineers 80 11-1011 Chief Executives 80 13-2082 Tax Preparers 80 15-1152 Computer Network Support Specialists 80 17-2071 Electrical Engineers 80 27-3042 Technical Writers 80 43-5031 Police, Fire, and Ambulance Dispatchers 80
Page 19 U.S. Department of Commerce, ESA, Office of the Chief Economist
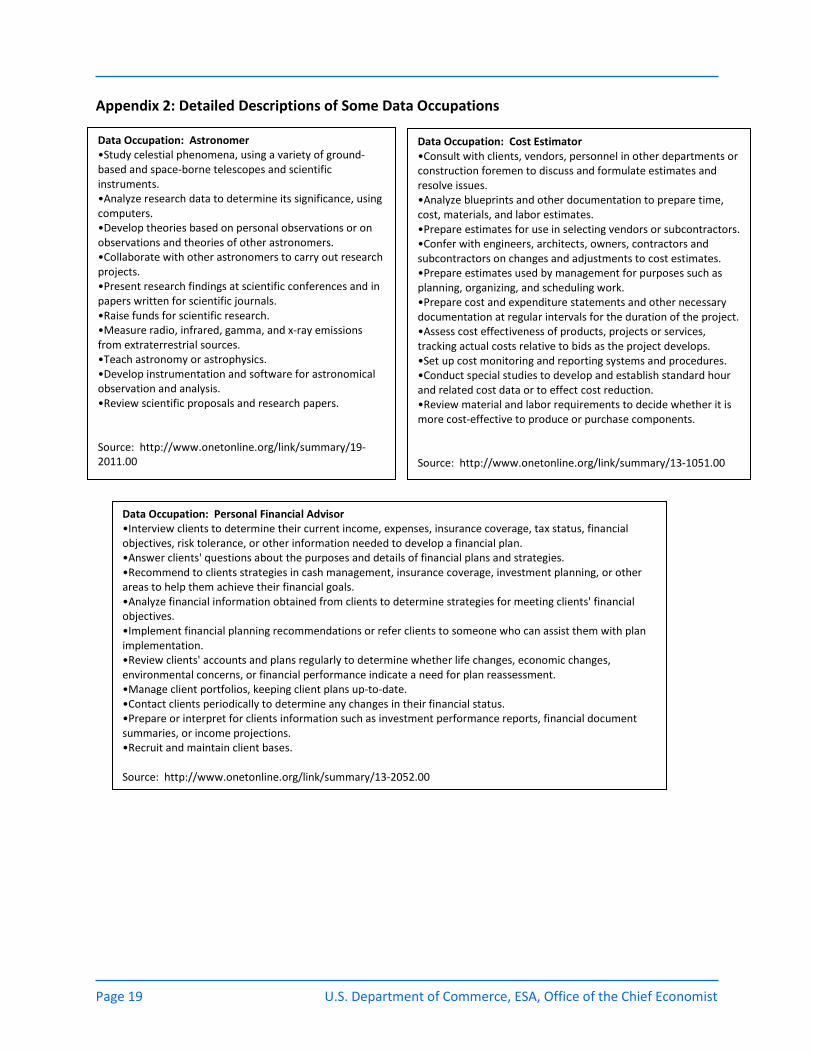
Appendix 2: Detailed Descriptions of Some Data Occupations
Data Occupation: Astronomer •Study celestial phenomena, using a variety of ground-based and space-borne telescopes and scientific instruments. •Analyze research data to determine its significance, using computers. •Develop theories based on personal observations or on observations and theories of other astronomers. •Collaborate with other astronomers to carry out research projects. •Present research findings at scientific conferences and in papers written for scientific journals. •Raise funds for scientific research. •Measure radio, infrared, gamma, and x-ray emissions from extraterrestrial sources. •Teach astronomy or astrophysics. •Develop instrumentation and software for astronomical observation and analysis. •Review scientific proposals and research papers. Source: http://www.onetonline.org/link/summary/19-2011.00
Data Occupation: Cost Estimator •Consult with clients, vendors, personnel in other departments or construction foremen to discuss and formulate estimates and resolve issues. •Analyze blueprints and other documentation to prepare time, cost, materials, and labor estimates. •Prepare estimates for use in selecting vendors or subcontractors. •Confer with engineers, architects, owners, contractors and subcontractors on changes and adjustments to cost estimates. •Prepare estimates used by management for purposes such as planning, organizing, and scheduling work. •Prepare cost and expenditure statements and other necessary documentation at regular intervals for the duration of the project. •Assess cost effectiveness of products, projects or services, tracking actual costs relative to bids as the project develops. •Set up cost monitoring and reporting systems and procedures. •Conduct special studies to develop and establish standard hour and related cost data or to effect cost reduction. •Review material and labor requirements to decide whether it is more cost-effective to produce or purchase components. Source: http://www.onetonline.org/link/summary/13-1051.00
Data Occupation: Personal Financial Advisor •Interview clients to determine their current income, expenses, insurance coverage, tax status, financial objectives, risk tolerance, or other information needed to develop a financial plan. •Answer clients' questions about the purposes and details of financial plans and strategies. •Recommend to clients strategies in cash management, insurance coverage, investment planning, or other areas to help them achieve their financial goals. •Analyze financial information obtained from clients to determine strategies for meeting clients' financial objectives. •Implement financial planning recommendations or refer clients to someone who can assist them with plan implementation. •Review clients' accounts and plans regularly to determine whether life changes, economic changes, environmental concerns, or financial performance indicate a need for plan reassessment. •Manage client portfolios, keeping client plans up-to-date. •Contact clients periodically to determine any changes in their financial status. •Prepare or interpret for clients information such as investment performance reports, financial document summaries, or income projections. •Recruit and maintain client bases. Source: http://www.onetonline.org/link/summary/13-2052.00

U.S. Department of Commerce, ESA, Office of the Chief Economist Page 20
Acknowledgements The authors would like to thank our colleagues from the Economics and Statistics Administration for their contributions to this report, especially:
Mark Doms, Under Secretary for Economic Affairs Sue Helper, Chief Economist Austin Durrer, Chief of Staff
Burton Reist, Director of External Affairs David Langdon, Senior Economist and Policy Advisor
Jane Callen, Editor Ryan Noonan, Economist
Adji-Fatou Diagne, Pathways Intern Claire Monteiro, Pathways Intern
The authors are economists in the Office of the Chief Economist of the U.S. Department of Commerce’s Economics and Statistics Administration.
Technical inquiries: Office of the Chief Economist
(202) 482-3523
Media inquiries: Office of Communications
(202) 482-3331
U.S. Department of Commerce Economics and Statistics Administration
Office of the Chief Economist 1401 Constitution Ave., NW
Washington, DC 20230 www.esa.doc.gov