Embed Size (px)
Citation preview
41
THE IMPORTANCE OF COMPARTMENTALIZATION IN METABOLIC FLUX MODELS: YEAST AS AN ECOSYSTEM OF
ORGANELLES
NIELS KLITGORD1 DANIEL SEGRÈ1,2 [email protected] [email protected]
1 Graduate Program in Bioinformatics
2 Department of Biology and Department of Biomedical Engineering
Boston University, Boston MA 02215, U.S.A.
Understanding the evolution and dynamics of metabolism in microbial ecosystems is an ongoing challenge in microbiology. A promising approach towards this goal is the extension of genome-scale flux balance models of metabolism to multiple interacting species. However, since the detailed distribution of metabolic functions among ecosystem members is often unknown, it is important to investigate how compartmentalization of metabolites and reactions affects flux balance predictions. Here, as a first step in this direction, we address the importance of compartmentalization in the well characterized metabolic model of the yeast Saccharomyces cerevisiae, which we treat as an “ecosystem of organelles”. In addition to addressing the impact that the removal of compartmentalization has on model predictions, we show that by systematically constraining some individual fluxes in a de-compartmentalized version of the model we can significantly reduce the flux prediction errors induced by the removal of compartments. We expect that our analysis will help predict and understand metabolic functions in complex microbial communities. In addition, further study of yeast as an ecosystem of organelles might provide novel insight on the evolution of endosymbiosis and multicellularity.
Keywords: microbial communities; metabolic network models; flux balance analysis; compartments; constraint-based models.
1. Introduction
Microbial ecosystems are ubiquitous on our planet [1], and are implicated in phenomena of utmost importance to humankind: from the global cycling [2] of carbon, nitrogen and sulfur, to the balance between health and disease within our body [3]; from the production of biofuels [4-5] to the evolution of antibiotic resistance [6]. Metabolism, the complex network of biochemical reactions responsible for providing energy and building blocks to the cell, plays a key role in the dynamics and evolution of microbial ecosystems, as most microbe-microbe and microbe-environment interactions are mediated by metabolic intermediates [7-9]. Hence, understanding the flow of metabolism within and between microbes constitutes a fundamental open challenge. While, in terms of computational models, we can confidently predict and understand the metabolic processes of an individual microbial species [10-13], the capacity to predict the concurrent metabolic activity of thousands of different species possibly present in a consortium is currently beyond reach [14]. The magnitude of this problem becomes even
42 N. Klitgord & D. Segrè
more evident upon considering that for most microbial communities there is very little information, if any, about the individual microbial players, their abundance, and their mutual interactions, and that the very definition of species is a debated issue [15]. Metagenomic sequencing data provide incredible panoramic snapshots of the genetic content of microbial communities [16-19], but lack information about how different metabolic reactions are compartmentalized in different species. Thus, deep sequencing technology might provide a list of the metabolic functions performed by the community, a sort of meta-organism, without boundaries between members. Even if it was possible to obtain complete genomic sequences for individual members of a community, genome scale model construction for all organisms, if at all possible, would be an extremely time consuming process.
Paradoxically, it is exactly this lack of information about compartmentalization that may hold the key for a new way of thinking about predictive models of metabolism in microbial ecosystems. As recently suggested by the analysis of multiple microbial consortia [16], the list of metabolic functions encoded in the metagenome may be more predictive of a community environment than the member species composition.
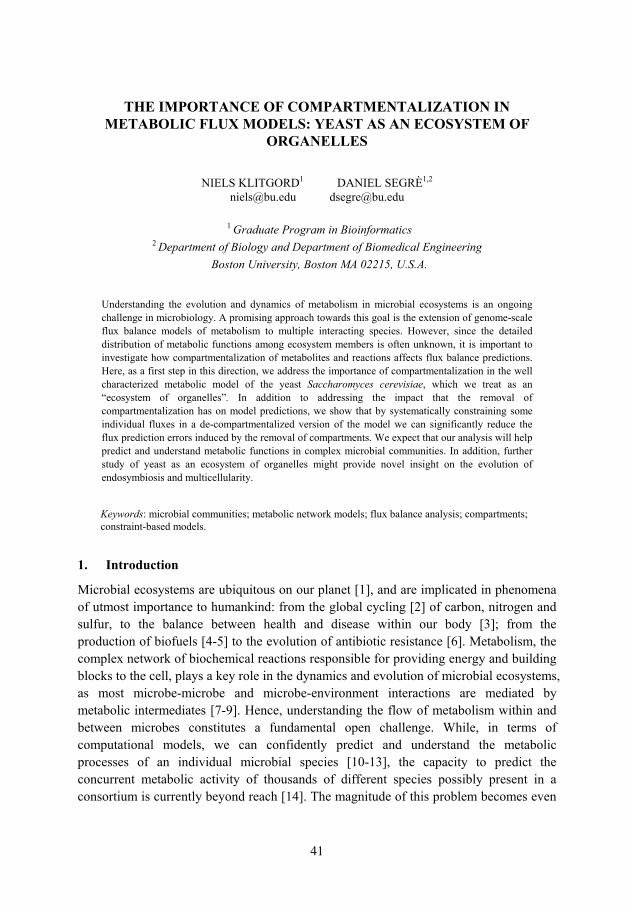
Figure 1: Formal analogy between a microbial ecosystem and a eukaryotic cell, from the perspective of flux balance modeling. Both systems consist of multiple membrane-bound compartments that sequester specific reactions and metabolites. Compartmentalization in flux balance models is implemented by labeling metabolites with the compartment they belong to.
Here, to explore the role of metabolic compartmentalization in microbial ecosystems
we focus on the simpler “ecosystem” of organelles in a yeast cell (Figure 1). Eukaryotic cells contain many membrane bound compartments harboring different assortments of metabolic enzymes, and selectively connected by metabolic transport. The yeast flux balance metabolic network model is among the most carefully curated and tested, and it explicitly includes intracellular compartments [20]. Importantly, the way organelles are
Eukaryotic CellMicrobial community
The Importance of Compartmentalization 43
represented in a eukaryotic metabolic network model is mathematically analogous to the representation of different microbes in an ecosystem. Thus, by studying compartments in the yeast model we expect to gain insight that will be directly useful when modeling a microbial ecosystem. Our work is organized as follows: First, we develop and apply to the yeast model an algebraic method that formally transforms a compartmentalized flux balance model (the c-network) into an elementally balanced de-compartmentalized model (the d-network). To address the impact that the removal of compartmentalization has on model predictions, we next perform a number of metabolic flux comparisons between the c-network and the d-network under different growth media. Finally, we test whether, by systematically constraining some individual fluxes, in the d-network model, to values btained from the c-network solution, we can significantly reduce the flux prediction errors induced by the removal of compartments.
2. Materials and Method
2.1. Constraint-based models of metabolic networks
Constraint-based models of metabolic networks, such as flux balance analysis (FBA) allow genome-scale simulations of metabolic flow in individual species and have been described in detail elsewhere [21,10]. Briefly, in FBA, a metabolic network is described in terms of an N (reactions) by M (metabolites) stoichiometric matrix S whose element Sij indicates the moles of metabolite i produced (positive sign) or consumed (negative sign) in reaction j (which has flux vj). Constraints can be applied to the system in the form of a steady state assumption (Sv=0), as well as in the form of lower or upper bounds to individual fluxes (LBi viUBi). Within the feasible space defined by these constrains, one can search for reaction flux solutions that maximize or minimize a given (typically linear) objective function. Maximization of the rate of biomass production (representing growth) has been pursued as a standard procedure for FBA in microorganisms. FBA predictions for model organisms such as yeast [13] and E. coli [22] have been subjected to extensive experimental validation. Linear Programming calculations were performed using the GNU Linear Programming Kit, and glpkmex for Matlab.
2.2. The compartmentalized S. cerevisiae stoichiometric model
For this analysis we chose to use the recent iMM904 genome scale metabolic reconstruction of the yeast Saccharomyces cerevisiae [20]. This model is structured into 8 compartments representing the extracellular space, the cytosol and the yeast organelles: mitochondria, nucleus, golgi, peroxisomes, vacuoles, and endoplasmic reticulum (Table 1). In a stoichiometric model, compartments are usually defined simply by multiple labels associated with metabolites. For example GLC is the label for glucose; in the yeast model, GLC[c] indicates cytosolic glucose, while GLC[m] stands for mitochondrial glucose. In the stoichiometric matrix S for the yeast model, these are effectively
44 N. Klitgord & D. Segrè
represented as two different metabolites, each associated with a row of S. The names of the metabolites form an ordered set (a cell array in Matlab) whose order reflects the corresponding order in the S matrix rows. Transport between compartments is represented by reactions that convert metabolites with different compartment labels into each other. For example, free diffusion of glucose between cytosol and mitochondria would be represented as GLC[c] ↔ GLC[m]. We refer to this compartmentalized model as the c-network. The de-compartmentalized model is derived from the c-network by applying the de-compartmentalization process described below. We refer to this second model as the d-network.
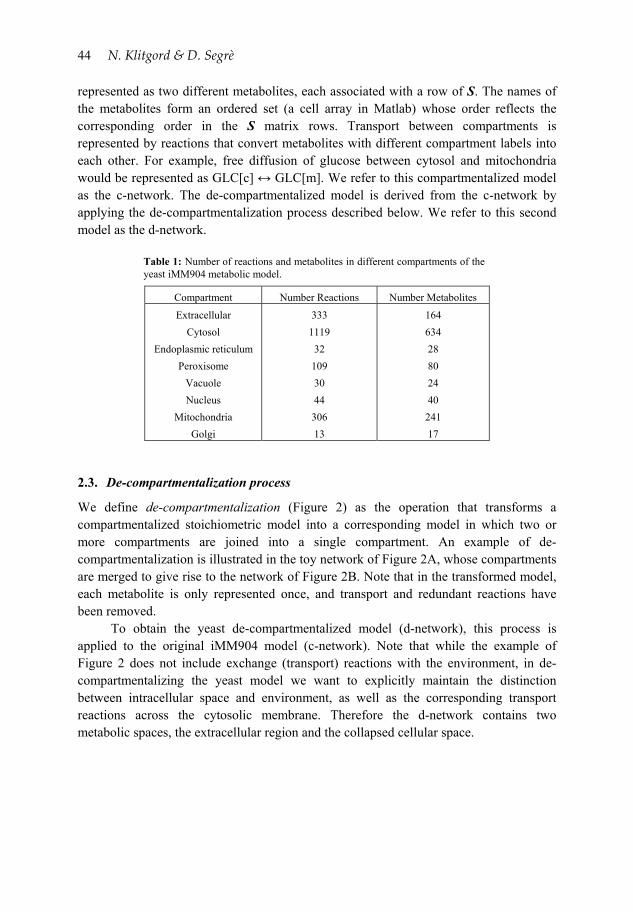
Table 1: Number of reactions and metabolites in different compartments of the yeast iMM904 metabolic model.
Compartment Number Reactions Number Metabolites
Extracellular 333 164
Cytosol 1119 634
Endoplasmic reticulum 32 28
Peroxisome 109 80
Vacuole 30 24
Nucleus 44 40
Mitochondria 306 241
Golgi 13 17
2.3. De-compartmentalization process
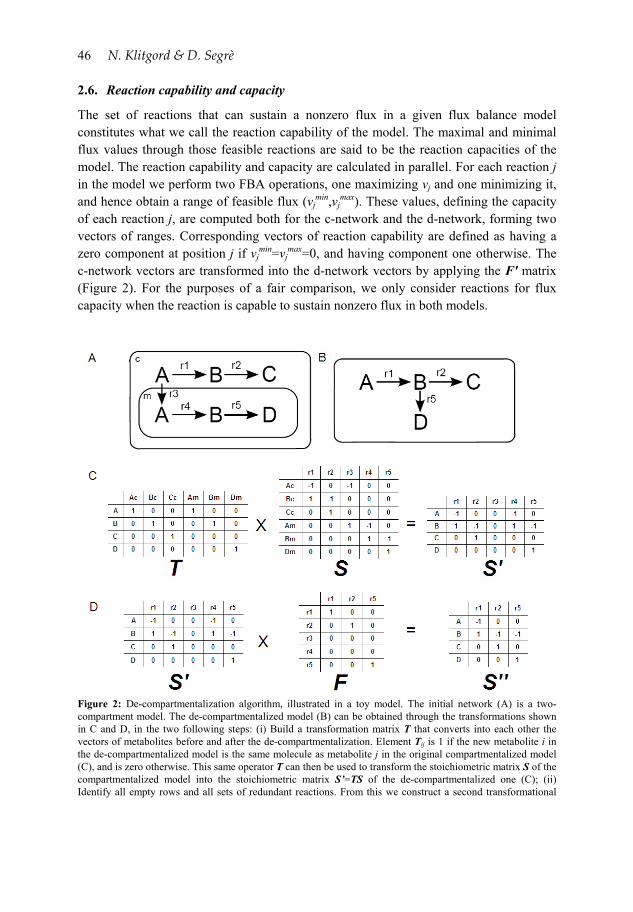
We define de-compartmentalization (Figure 2) as the operation that transforms a compartmentalized stoichiometric model into a corresponding model in which two or more compartments are joined into a single compartment. An example of de-compartmentalization is illustrated in the toy network of Figure 2A, whose compartments are merged to give rise to the network of Figure 2B. Note that in the transformed model, each metabolite is only represented once, and transport and redundant reactions have been removed.
To obtain the yeast de-compartmentalized model (d-network), this process is applied to the original iMM904 model (c-network). Note that while the example of Figure 2 does not include exchange (transport) reactions with the environment, in de-compartmentalizing the yeast model we want to explicitly maintain the distinction between intracellular space and environment, as well as the corresponding transport reactions across the cytosolic membrane. Therefore the d-network contains two metabolic spaces, the extracellular region and the collapsed cellular space.
The Importance of Compartmentalization 45
2.4. Flux Correlation between c-network and d-network
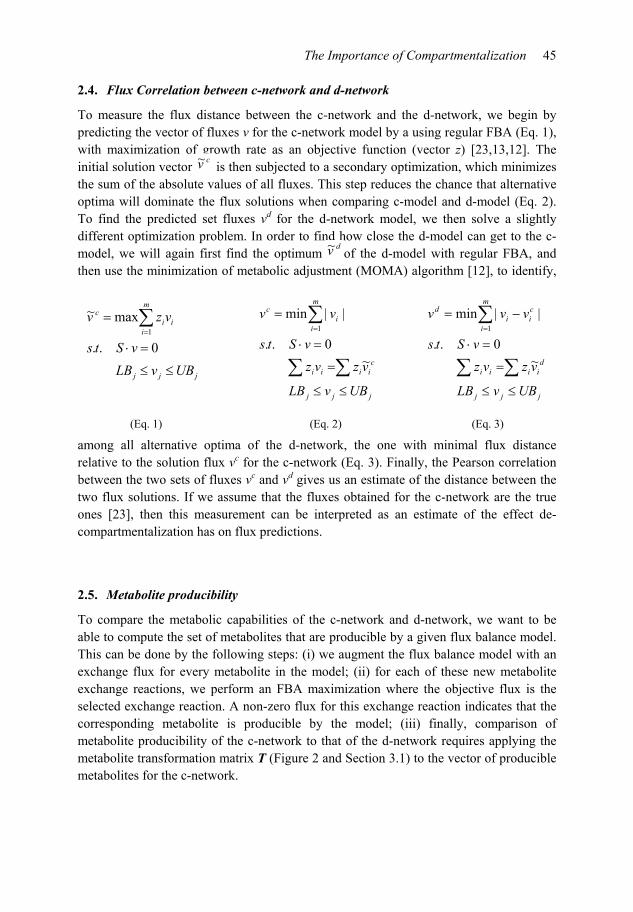
To measure the flux distance between the c-network and the d-network, we begin by predicting the vector of fluxes v for the c-network model by a using regular FBA (Eq. 1), with maximization of growth rate as an objective function (vector z) [23,13,12]. The initial solution vector
cv~ is then subjected to a secondary optimization, which minimizes the sum of the absolute values of all fluxes. This step reduces the chance that alternative optima will dominate the flux solutions when comparing c-model and d-model (Eq. 2). To find the predicted set fluxes vd for the d-network model, we then solve a slightly different optimization problem. In order to find how close the d-model can get to the c-model, we will again first find the optimum
dv~ of the d-model with regular FBA, and then use the minimization of metabolic adjustment (MOMA) algorithm [12], to identify,
among all alternative optima of the d-network, the one with minimal flux distance relative to the solution flux vc for the c-network (Eq. 3). Finally, the Pearson correlation between the two sets of fluxes vc and vd gives us an estimate of the distance between the two flux solutions. If we assume that the fluxes obtained for the c-network are the true ones [23], then this measurement can be interpreted as an estimate of the effect de-compartmentalization has on flux predictions.
2.5. Metabolite producibility
To compare the metabolic capabilities of the c-network and d-network, we want to be able to compute the set of metabolites that are producible by a given flux balance model. This can be done by the following steps: (i) we augment the flux balance model with an exchange flux for every metabolite in the model; (ii) for each of these new metabolite exchange reactions, we perform an FBA maximization where the objective flux is the selected exchange reaction. A non-zero flux for this exchange reaction indicates that the corresponding metabolite is producible by the model; (iii) finally, comparison of metabolite producibility of the c-network to that of the d-network requires applying the metabolite transformation matrix T (Figure 2 and Section 3.1) to the vector of producible metabolites for the c-network.
jjj
m
iii
c
UBvLB
vSts
vzv
0..
max~1
jjj
ciiii
m
ii
c
UBvLB
vzvz
vSts
vv
~0..
||min1
jjj
diiii
ci
m
ii
d
UBvLB
vzvz
vSts
vvv
~0..
||min1
(Eq. 1) (Eq. 2) (Eq. 3)
46 N. Klitgord & D. Segrè 2.6. Reaction capability and capacity
The set of reactions that can sustain a nonzero flux in a given flux balance model constitutes what we call the reaction capability of the model. The maximal and minimal flux values through those feasible reactions are said to be the reaction capacities of the model. The reaction capability and capacity are calculated in parallel. For each reaction j in the model we perform two FBA operations, one maximizing vj and one minimizing it, and hence obtain a range of feasible flux (vj
min,vjmax). These values, defining the capacity
of each reaction j, are computed both for the c-network and the d-network, forming two vectors of ranges. Corresponding vectors of reaction capability are defined as having a zero component at position j if vj
min=vjmax=0, and having component one otherwise. The
c-network vectors are transformed into the d-network vectors by applying the F' matrix (Figure 2). For the purposes of a fair comparison, we only consider reactions for flux capacity when the reaction is capable to sustain nonzero flux in both models.
Figure 2: De-compartmentalization algorithm, illustrated in a toy model. The initial network (A) is a two-compartment model. The de-compartmentalized model (B) can be obtained through the transformations shown in C and D, in the two following steps: (i) Build a transformation matrix T that converts into each other the vectors of metabolites before and after the de-compartmentalization. Element Tij is 1 if the new metabolite i in the de-compartmentalized model is the same molecule as metabolite j in the original compartmentalized model (C), and is zero otherwise. This same operator T can then be used to transform the stoichiometric matrix S of the compartmentalized model into the stoichiometric matrix S’=TS of the de-compartmentalized one (C); (ii) Identify all empty rows and all sets of redundant reactions. From this we construct a second transformational
The Importance of Compartmentalization 47
matrix F that maps the first of each redundant reaction set to a single location and removes empty reactions (D). By applying this matrix to S’ we obtain our de-compartmentalized stoichiometric matrix S''=S'F. To convert the upper bound (UB) and lower bound (LB) vectors into vectors with a number of elements equal to the number of reactions in S'', we employ a variant of matrix F, labeled F' in which all redundant reactions in a set are mapped to a single equivalent reaction. The F' matrix is also used to map between reaction flux solutions from the c-network to the flux reaction space of the d-network (see Methods).
2.7. Recovering c-network fluxes in the d-network through individual flux constraints
First, a flux vector solution vc is determined for the c-network. This vector is then transformed into the corresponding flux vector for the d-network vc→d by adding together fluxes in the c-network that correspond to the same reaction (through the F’ transformation, Figure 2). We then systematically solve again the FBA model for the d-network (as from Eq. 2), while imposing, for every i, that vi
d=vic→d. For every possible
flux constraint added, we evaluate again the Pearson correlation, to determine if that specific constrain is bringing the d-network solution close to the c-network one. This algorithm (which we refer to as “flux-fixing approach”) provides us with a list of fluxes whose c-network (i.e. “true”) value, when imposed to the d-network, improves substantially the capacity to correctly predict fluxes. Reactions whose flux-constraining operation is able to restore the correlation between d-network and c-network predictions to a value above 0,9 will be called r-reactions. The computation of r-reactions is performed for the 10 different growth media used previously, and shown in Figure 4.
2.8. Functional enrichment of constraining fluxes
To determine whether the r-reactions identified across different media tend to belong to specific functional categories, we implemented a functional enrichment analysis. Out of a total of 172 r-reactions identified across all media conditions, 137 are present in all of them. These are r-reactions that can restore the correct fluxes in the d-network with minimal sensitivity to environmental parameters. Hence, we focus on these 137 reactions for our enrichment analysis. The functional annotation for each reaction was taken from the yeast iMM904 model. The significance of enrichment for each pathway was determined using the cumulative hypergeometric distribution function in Matlab. Those pathways that remained significant after an =0.05 false discovery rate correction are reported.
3. Results and Discussion
3.1. De-compartmentalization
Our first step is to convert the original iMM904 model of the yeast network, which includes 8 distinct compartments (Table 1), into a de-compartmentalized version. For this goal we developed an algorithm that removes compartments between reactions, while
48 N. Klitgord & D. Segrè
preserving elemental balance (Figure 2 and Methods). This transformation can be performed through the action of two linear operators on the S matrix. The first operator, a metabolite transformation matrix T, maps same metabolites from different compartments into single molecular species. The second operator, a refinement matrix F, is mostly responsible for collapsing together identical reactions originally belonging to different compartments. The combination of the T and F operators transforms the c-network model containing 1228 metabolites and 1577 reactions into the d-network model, with 875 metabolites and 1214 reactions. Since the d-network has less variables but also less constraints relative to the c-network, it is not clear a priori whether this transformation will contract or expand the space of feasible solutions. In any case, we expect a difference in the specific FBA solutions and in the flux distribution flexibility between c-network and d-network. These differences will be characterized in detail in the next section.
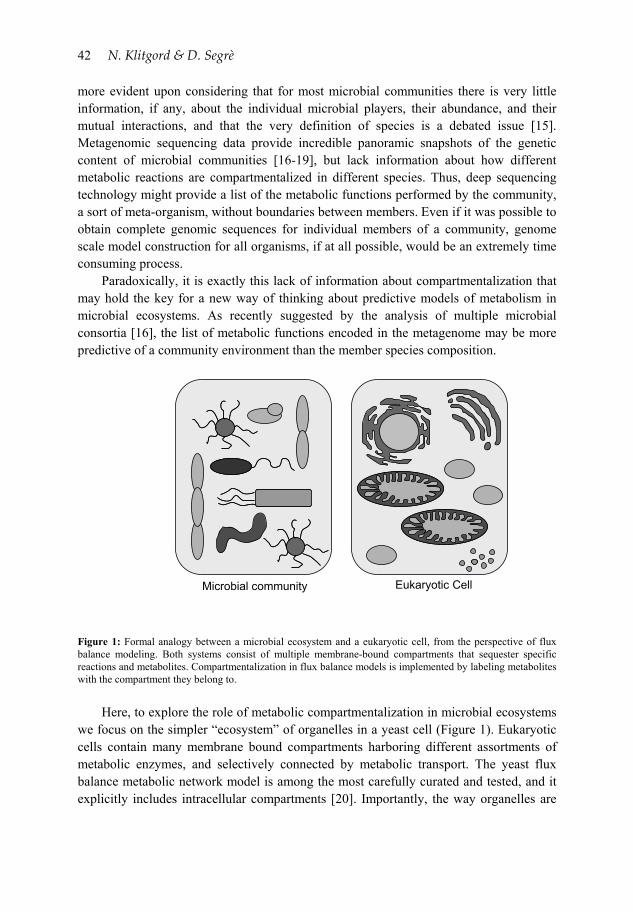
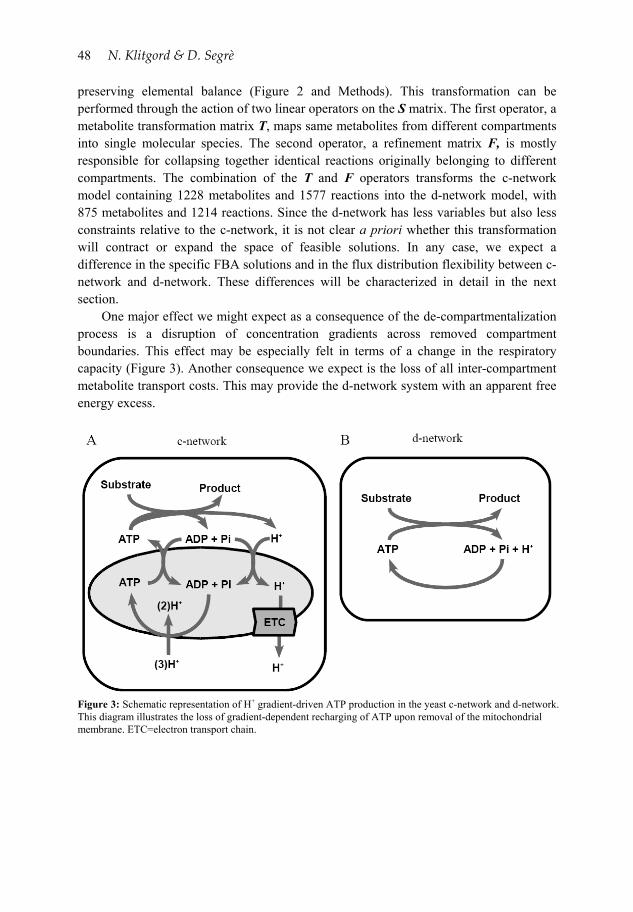
One major effect we might expect as a consequence of the de-compartmentalization process is a disruption of concentration gradients across removed compartment boundaries. This effect may be especially felt in terms of a change in the respiratory capacity (Figure 3). Another consequence we expect is the loss of all inter-compartment metabolite transport costs. This may provide the d-network system with an apparent free energy excess.
Figure 3: Schematic representation of H+ gradient-driven ATP production in the yeast c-network and d-network. This diagram illustrates the loss of gradient-dependent recharging of ATP upon removal of the mitochondrial membrane. ETC=electron transport chain.
The Importance of Compartmentalization 49
3.2. Model comparison
In order to determine whether the d-network model has increased or decreased flexibility in its flux distributions relative to the c-network model, and to ascertain any changes in their predictive ability, we compare the two models using different metrics.
We began by comparing the maximal biomass production (growth) rate between the c-network and the d-network in minimal media. We found that the growth rate for the d-network model is several fold larger than the growth rate for the c-network model. This increase in growth rate was consistently present under 10 different carbon sources, which span a variety of energy potentials, and have entry into the central carbon metabolism at a variety of points. The degree of increase in growth rate depends substantially on the specific carbon used (Table 2).
A more detailed analysis of the extent to which d-network solutions differ from the c-network ones can be performed by comparing the whole set of predicted fluxes for the two models. Specifically, we computed the Pearson correlation coefficient between these two flux solutions under all 10 carbon sources. The correlation coefficients vary between 0.27 and 0.70, depending on the carbon source used (Table 2). Overall, confirming the result obtained by comparing growth rates, this indicates that the FBA predictions for the d-network model display significant discrepancies relative to the “true” c-network model. One may observe that good growth rate agreement does not imply good flux correlation (and vice versa). It is possible to verify that the observed flux discrepancies between c-network and d-network FBA predictions are induced by an increased flexibility of flux capability, flux capacity and metabolite producibility upon de-compartmentalization (see Methods and Table 3).
Table 2: Maximal biomass production rates of the yeast c-network and the d-network, and flux correlation between the two models.
Carbon Source
Uptake Flux (mmol/grDM·h)
Flux Correlation
Growth rate ( c-network )
(1/h)
Growth rate (d-network)
(1/h)
Glucose 10 0.2575 0.2879 1.6333
Fructose 10 0.2721 0.2879 1.6333
Succinate 15 0.4055 0.0914 1.225
Fumerate 15 0.5953 0.0512 1.225
Lactate 20 0.6082 0.0392 1.3611
Pyruvate 20 0.2654 0.0712 1.3611
Acetate 30 0.6981 0.0256 1.2751
Ethanol 30 0.5285 0.0292 1.2751
In order to identify the source of the discrepancies between the c-network and the d-
network we have examined in detail the flux distributions for growth on glucose. In agreement with our initial intuition that de-compartmentalization might have a dramatic effects on energy-related pathways, due to the disruption of gradients, we found that the
50 N. Klitgord & D. Segrè
increased biomass yield in the d-network model is caused by an unlimited capacity to recharge ATP from ADP. In the c-network, the ATP synthase is dependent on the differential H+ concentration gradient between the cytosol and mitochondria. The development of this H+ gradient is an energy consuming process dependent on reducing NADH or equivalents through the electron transport chain (labeled ETC in Figure 3A). This is not the case in the d-network, where ATP generation is not dependent on the flow of H+ across the mitochondrial membrane (because it has been removed), but it just relies on the constantly regenerated H+ in the single intracellular compartment now present (Figure 3B). Thus the ATP recharging reaction (ATP synthase) can carry a constant arbitrarily large flow, as we verified by directly maximizing this flux in the model. Hence energy does not constitute a limiting factor in the d-network, whose biomass production rate will be constrained only by the availability of building blocks (carbon, nitrogen, etc.). It is likely that a large fraction of the discrepancy observed between the c-network and d-network models is ultimately due to this faux unlimited energy supply. Table 3: Results of metabolic characteristics analysis in the yeast c-network and d-network model. The quantities computed are: metabolite producibility, reaction capability, and reaction capacity, in the c- (see Methods). In all cases the d-network displays more flexibility than the c-network.
Metabolite Producibility Reaction Capability Reaction Capacity Carbon Source
c-Network Both
d-Network
c-Network Both
d-Network
c-Network Both
d-Network
Glucose 0 633 6 0 741 95 0 70 671
Fructose 0 633 6 0 741 95 0 70 671
Fumarate 0 632 6 0 739 95 0 62 677
Succinate 0 632 6 0 739 95 0 47 692
Lactate 0 632 6 0 739 95 0 47 692
Pyruvate 0 632 6 0 739 95 0 50 689
Acetate 0 632 6 0 739 95 0 47 692
Ethanol 0 632 6 0 739 95 0 48 691
Citrate 0 632 6 0 739 95 0 55 684
Glycerol 0 632 6 0 739 95 0 51 688
3.3. Improved de-compartmentalized model through individual flux constraints
Our analysis to this point suggests that a de-compartmentalized model has increased flux flexibility relative to the corresponding compartmentalized model. This flexibility, due in part to the absence of limitations in energy supply, causes the solutions of the d-network model to be inaccurate, as quantified with flux correlations above. Here we discuss a method to potentially recover this correlation, hence providing a route towards improved de-compartmentalized models. Specifically, we ask whether the flux correlation can be improved by imposing the value of an individual c-network flux as a constraint in the d-network model.
The Importance of Compartmentalization 51
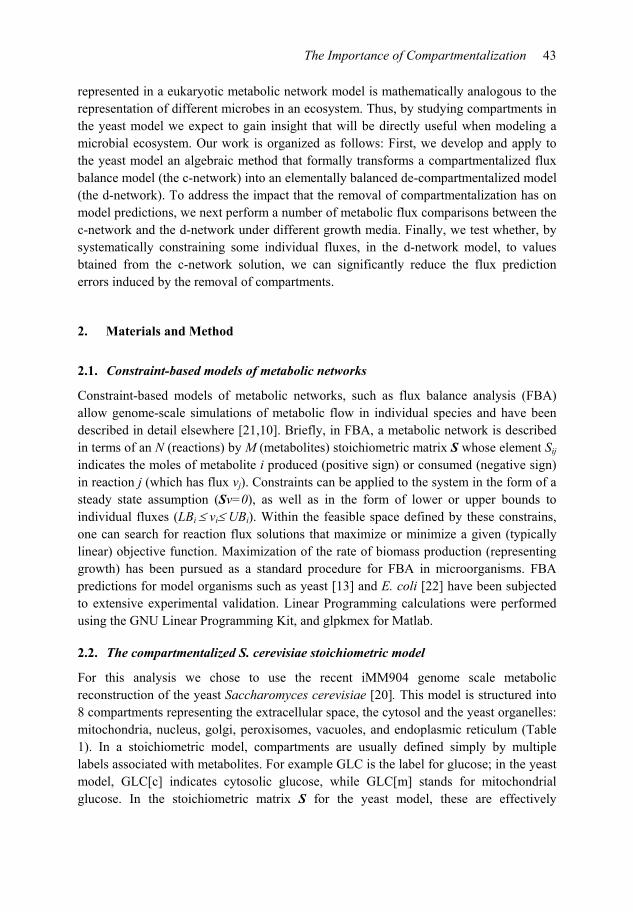
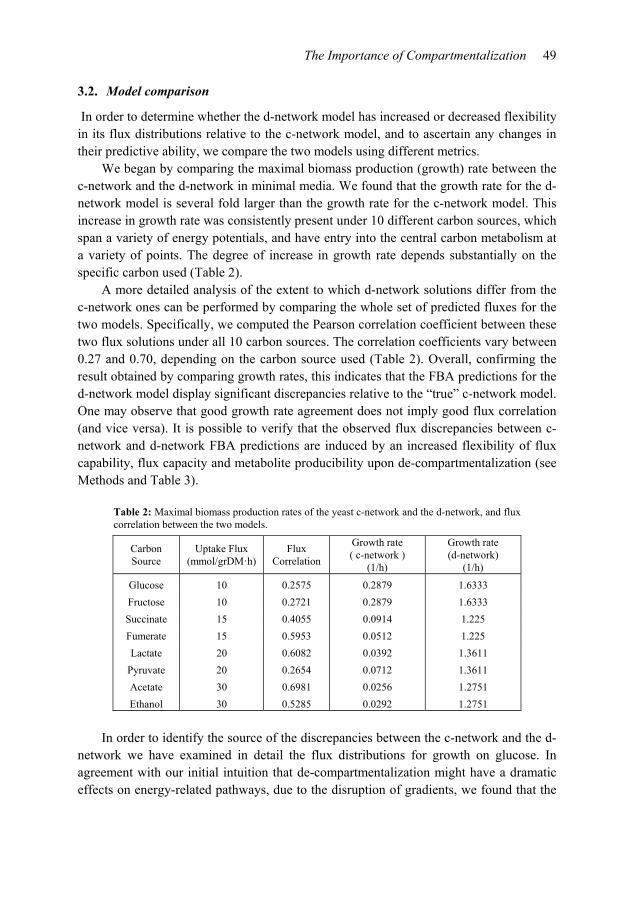
We thus examined how the flux correlation consistency changed when we constrained the d-network FBA model using individual reaction fluxes from the c-network solution, under the 10 media conditions considered. The resulting distribution of correlations between c-network and d-network fluxes shows a clear bimodal distribution (Figure 4). It can be seen that fixing a single flux is sufficient to restore the flux correlation to above 0.9 in 159 cases for growth on glucose. Similar results are obtained for the 9 other media conditions (Table 4). There are a total of 137 reactions that can restore the flux correlation in all 10 media conditions.
Figure 4: Distribution of flux correlations between the d-network and the c-network upon fixing individual reaction fluxes in a glucose medium. The bi-modal distribution indicates that constrained fluxes have either very little or a very strong effect on the resulting flux correlations.
Visual inspection of these 137 reactions revealed some trivial cases, such as the
biomass flux itself, or reactions feeding directly into biomass. Other reactions appeared to be much more interesting, such as those associated with central carbon metabolism or exchange of metabolites with the environment, such as ammonium, sulfate or phosphate.
Table 4: Number of reactions, in the flux-fixing method, that restore a correlation greater than 0.9 between c-network and d-network flux solutions. Numbers are reported for ten different growth media.
Carbon Source r-reactions Carbon Source r-reactions
Glucose 156 Pyruvate 155
Fructose 159 Acetate 158
Fumarate 160 Ethanol 168
Succinate 159 Citrate 156
Lactate 157 Glycerol 148
0.2 0.3 0.4 0.5 0.6 0.7 0.8 0.9 10
100
200
300
400
500
600
700
Num
ber
of
fluxe
s
Total Flux Correlation
52 N. Klitgord & D. Segrè
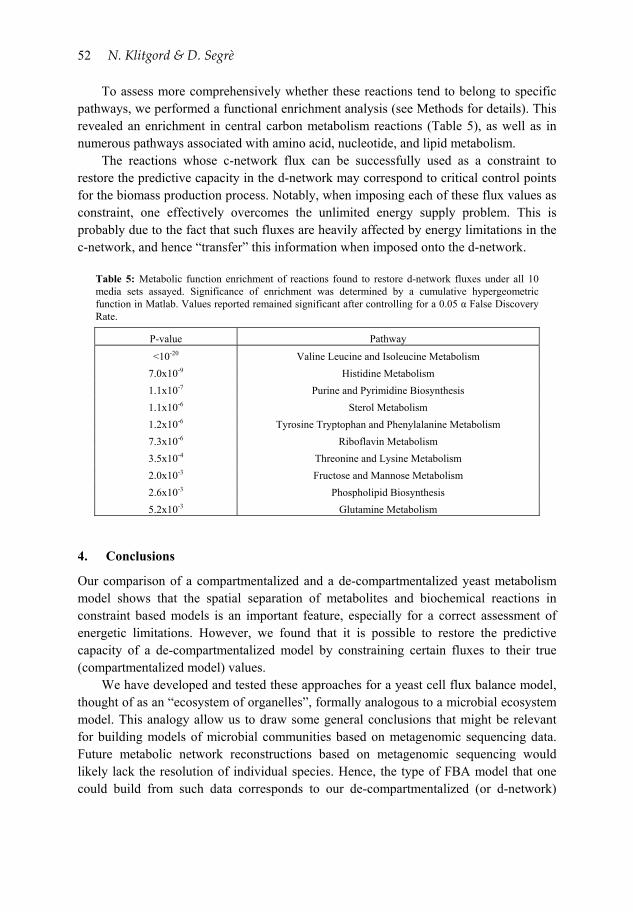
To assess more comprehensively whether these reactions tend to belong to specific pathways, we performed a functional enrichment analysis (see Methods for details). This revealed an enrichment in central carbon metabolism reactions (Table 5), as well as in numerous pathways associated with amino acid, nucleotide, and lipid metabolism.
The reactions whose c-network flux can be successfully used as a constraint to restore the predictive capacity in the d-network may correspond to critical control points for the biomass production process. Notably, when imposing each of these flux values as constraint, one effectively overcomes the unlimited energy supply problem. This is probably due to the fact that such fluxes are heavily affected by energy limitations in the c-network, and hence “transfer” this information when imposed onto the d-network.
Table 5: Metabolic function enrichment of reactions found to restore d-network fluxes under all 10 media sets assayed. Significance of enrichment was determined by a cumulative hypergeometric function in Matlab. Values reported remained significant after controlling for a 0.05 α False Discovery Rate.
P-value Pathway
<10-20 Valine Leucine and Isoleucine Metabolism
7.0x10⁻⁹ Histidine Metabolism
1.1x10⁻⁷ Purine and Pyrimidine Biosynthesis
1.1x10⁻⁶ Sterol Metabolism
1.2x10⁻⁶ Tyrosine Tryptophan and Phenylalanine Metabolism
7.3x10⁻⁶ Riboflavin Metabolism
3.5x10⁻⁴ Threonine and Lysine Metabolism
2.0x10⁻³ Fructose and Mannose Metabolism
2.6x10⁻³ Phospholipid Biosynthesis
5.2x10⁻³ Glutamine Metabolism
4. Conclusions
Our comparison of a compartmentalized and a de-compartmentalized yeast metabolism model shows that the spatial separation of metabolites and biochemical reactions in constraint based models is an important feature, especially for a correct assessment of energetic limitations. However, we found that it is possible to restore the predictive capacity of a de-compartmentalized model by constraining certain fluxes to their true (compartmentalized model) values.
We have developed and tested these approaches for a yeast cell flux balance model, thought of as an “ecosystem of organelles”, formally analogous to a microbial ecosystem model. This analogy allow us to draw some general conclusions that might be relevant for building models of microbial communities based on metagenomic sequencing data. Future metabolic network reconstructions based on metagenomic sequencing would likely lack the resolution of individual species. Hence, the type of FBA model that one could build from such data corresponds to our de-compartmentalized (or d-network)
The Importance of Compartmentalization 53
yeast model. As a consequence of our current analysis, we know that predictions based on such an approximated system may not be accurate, and would likely over-estimate growth rates and fluxes. At the same time, our flux constraint approach shows that, in principle, coupling such a de-compartmentalized model with single carefully selected flux measurements may greatly improve the predictive capacity. It is quite promising that several exchange fluxes can play this role, since these fluxes might be more readily measurable.
Alternatively, the fact that the de-compartmentalized model is considerably affected by the energetic problems caused by gradient removal, suggests that an artificial “meta-compartment” could be used to effectively model concentration gradients in metagenomic-based models. Finally, while in the current work we have focused on yeast mainly for the purpose of understanding the role of compartmentalization in flux balance models, one could use similar approaches to study, from a metabolic perspective, the origin of eukaryotic cells and multi-compartment systems.
Acknowledgments
This work was partially supported by the NASA Astrobiology Institute and the US Department of Energy.
References
[1] Rothschild, L.J., Mancinelli, R.L., Life in extreme environments, Nature, 409: 1092-1101, 2001.
[2] Follows, M.J., Dutkiewicz, S., Grant, S., Chisholm, S.W., Emergent Biogeography of Microbial Communities in a Model Ocean, Science, 315:1843-1846, 2007.
[3] Turnbaugh, P.J., Ley, R.E., Hamady, M., Fraser-Liggett, C.M., Knight, R., Gordon, J.I., The Human Microbiome Project, Nature, 449: 804-810, 2007.
[4] Warnecke, F., Luginbuhl, P., Ivanova, N., Ghassemian, M., Richardson, T.H., Stege, J.T., Cayouette, M., McHardy, A.C., Djordjevic, G., Aboushadi, N., Sorek, R., Tringe, S.G., Podar, M., Martin, H.G., Kunin, V., Dalevi, D., Madejska, J., Kirton, E., Platt, D., Szeto, E., Salamov, A., Barry, K., Mikhailova, N., Kyrpides, N.C., Matson, E.G., Ottesen, E.A., Zhang, X., Hernandez, M., Murillo, C., Acosta, L.G., Rigoutsos, I., Tamayo, G., Green, B.D., Chang, C., Rubin, E.M., Mathur, E.J., Robertson, D.E., Hugenholtz, P., Leadbetter, J.R., Metagenomic and functional analysis of hindgut microbiota of a wood-feeding higher termite, Nature, 450: 560-565, 2007.
[5] Stephanopoulos, G., Challenges in Engineering Microbes for Biofuels Production, Science, 315: 801-804, 2007.
[6] Diaz-Torres, M.L., Villedieu, A., Hunt, N., McNab, R., Spratt, D.A., Allan, E., Mullany, P., Wilson, M., Determining the antibiotic resistance potential of the
54 N. Klitgord & D. Segrè
indigenous oral microbiota of humans using a metagenomic approach, FEMS Microbiology Letters, 258: 257-262, 2006.
[7] Chait, R., Craney, A., Kishony, R., Antibiotic interactions that select against resistance, Nature, 446: 668-671, 2007.
[8] Kolenbrander, P.E., Andersen, R.N., Blehert, D.S., Egland, P.G., Foster, J.S., Palmer, R.J. Jr., Communication among oral bacteria, Microbiol. Mol. Biol. Rev., 66: 486-505, 2002.
[9] Woyke, T., Teeling, H., Ivanova, N.N., Huntemann, M., Richter, M., Gloeckner, F.O., Boffelli, D., Anderson, I.J., Barry, K.W., Shapiro, H.J., Szeto, E., Kyrpides, N.C., Mussmann, M., Amann, R., Bergin, C., Ruehland, C., Rubin, E.M., Dubilier, N., Symbiosis insights through metagenomic analysis of a microbial consortium, Nature, 443: 950-955, 2006.
[10] Kauffman, K.J., Prakash, P., Edwards, J.S., Advances in flux balance analysis, Current Opinion in Biotechnology, 14: 491-496, 2003.
[11] Schuetz, R., Kuepfer, L., Sauer, U., Systematic evaluation of objective functions for predicting intracellular fluxes in Escherichia coli, Mol Syst Biol, 3: 119, 2007.
[12] Segrè, D., Vitkup, D., Church, G.M., Analysis of optimality in natural and perturbed metabolic networks, Proceedings of the National Academy of Sciences of the United States of America, 99: 15112-15117, 2002.
[13] Snitkin, E.S., Dudley, A.M., Janse, D.M., Wong, K., Church, G.M., Segrè, D., Model-driven analysis of experimentally determined growth phenotypes for 465 yeast gene deletion mutants under 16 different conditions, Genome Biology, 9(9):R140, 2008.
[14] Raes, J., Bork, P., Molecular eco-systems biology: towards an understanding of community function, Nat Rev Micro, 6: 693-699, 2008.
[15] Konstantinidis, K.T., Ramette, A., Tiedje, J.M., The bacterial species definition in the genomic era, Philosophical Transactions of the Royal Society B: Biological Sciences, 361: 1929-1940, 2006.
[16] Dinsdale, E.A., Edwards, R.A., Hall, D., Angly, F., Breitbart, M., Brulc, J.M., Furlan, M., Desnues, C., Haynes, M., Li, L., McDaniel, L., Moran, M.A., Nelson, K.E., Nilsson, C., Olson, R., Paul, J., Brito, B.R., Ruan, Y., Swan, B.K., Stevens, R., Valentine, D.L., Thurber, R.V., Wegley, L., White, B.A., Rohwer, F., Functional metagenomic profiling of nine biomes, Nature, 452: 629-632, 2008.
[17] Gill, S.R., Pop, M., Deboy, R.T., Eckburg, P.B., Turnbaugh, P.J., Samuel, B.S., Gordon, J.I., Relman, D.A., Fraser-Liggett, C.M., Nelson, K.E., Metagenomic Analysis of the Human Distal Gut Microbiome, Science, 312: 1355-1359, 2006.
[18] Tringe, S.G., Rubin, E.M., Metagenomics: DNA sequencing of environmental samples, Nat Rev Genet, 6: 805-814, 2005.
[19] Tyson, G.W., Chapman, J., Hugenholtz, P., Allen, E.E., Ram, R.J., Richardson, P.M., Solovyev, V.V., Rubin, E.M., Rokhsar, D.S., Banfield, J.F., Community structure and metabolism through reconstruction of microbial genomes from the environment, Nature, 428: 37-43, 2004.
[20] Herrgård, M.J., Swainston, N., Dobson, P., Dunn, W.B., Arga, K.Y., Arvas, M., Blüthgen, N., Borger, S., Costenoble, R., Heinemann, M., Hucka, M., Le Novère, N., Li, P., Liebermeister, W., Mo, M.L., Oliveira, A.P., Petranovic, D., Pettifer, S., Simeonidis, E., Smallbone, K., Spasić, I., Weichart, D., Brent, R., Broomhead,

The Importance of Compartmentalization 55
D.S., Westerhoff, H.V., Kirdar, B., Penttilä, M., Klipp, E., Palsson, B.Ø., Sauer, U., Oliver, S.G., Mendes, P., Nielsen, J., Kell, D.B., A consensus yeast metabolic network reconstruction obtained from a community approach to systems biology, Nature Biotechnology, 26: 1155-1160, 2008.
[21] Lee, J.M., Gianchandani, E.P., Papin, J.A., Flux balance analysis in the era of metabolomics, Briefings in Bioinformatics, 7: 140-150, 2006.
[22] Edwards, J.S., Palsson, B.O., Metabolic flux balance analysis and the in silico analysis of Escherichia coli K-12 gene deletions, BMC Bioinformatics, 1: 1., 2000.
[23] Snitkin, E.S. , Segrè, D., Optimality criteria for the prediction of metabolic fluxes in yeast mutants, Genome Informatics, 20:123-134, 2008.