Embed Size (px)
Citation preview
1
The import VAT and duty de-minimis in
the European Union – Where should they
be and what will be the impact?
Final report
14 October 2014
Cross-border Research Association, Lausanne,
Switzerland – in co-operation with HEC University of
Lausanne and University of Bamberg
Hintsa J., Mohanty S., Tsikolenko V., Ivens B., Leischnig A.,
Kähäri P., Hameri AP., and Cadot O.
2
Executive Summary
The purpose of this study is to explore economic consequences, consumer behaviour and other potential
implications of various VAT and duty de-minimis levels relating to the import of small, low value
consignments into the European Union. De-minimis for the purpose of this study is defined as “a valuation
ceiling for goods, including documents and trade samples, below which no duty or tax is charged and
clearance procedures, including data requirements, are minimal”. Three specific research questions to be
answered by this study are as follows:
1. What are the economically optimal VAT and duty de-minimis levels for imports into the EU,
considering the cost of tax collection for public administrations and the cost of import processes
and procedures for the private sector?
2. If VAT and/or duty de-minimis levels were to increase in the future, how would consumer
behaviour change in terms of e-commerce imports from 3rd countries versus e-commerce and
retail purchases within the EU?
3. Which other political and economic implications could follow from potential decisions in the
future to increase VAT and/or duty de-minimis levels in the EU?
The overall research approach for this study covers both quantitative and qualitative methods for data
collection and analysis, including: (i) a broad literature review on cross-border trade, e-commerce, logistics,
customs and tax; (ii) collection of relevant governmental and industry data, through workshops,
questionnaires and data system queries; (iii) development of a de-minimis economic model and web-based
optimization tool; (iv) calculation of optimum de-minimis values; (v) performing a consumer behaviour
conjoint and survey study; and (vi) carrying out multiple expert interviews. Building on such a multi-
disciplinary approach, the study conclusions are finally drawn, results discussed, and recommendations
made.
The five main outcomes and conclusions of the study are:
VAT de-minimis should be raised to 80 EUR from the current 22 EUR – this is due to the fact that
the total cost of collection faced by Customs administrations and the private sector currently
exceeds the revenues collected.
While increasing de-minimis levels might affect the buying behaviour of consumers, such changes
are not likely to be significant – for example, quality and dealer-reputation are more important to
consumers in their purchase decisions.
Raising the VAT de-minimis would enable Customs administrations across the European Union to
reallocate resources towards higher priorities such as: the collection of higher revenues; anti-fraud
activities; addressing product safety and intellectual property violations; and supply chain security.
Development of an improved understanding of the costs faced by EU Customs administrations is
crucial to the future enhancement of EU-level and national policy and regulatory decision-making in
the future – as, today, significant shortcomings are apparent e.g. among the captured labour and
technology costs.
Investments in further harmonization and lean government programs across the EU are needed -
as today there are significant and costly variations across Member States, for example in VAT-levels
and rules, as well as in the practical implementation of customs procedures.
3
Contents Diagrams ............................................................................................................................................................ 5
Tables ................................................................................................................................................................. 5
1 Introduction ............................................................................................................................................... 6
1.1 Purpose and scope of the study ........................................................................................................ 6
1.2 Universe of small consignments ........................................................................................................ 6
1.2.1 Markets, products, sellers, buyers and logistics ........................................................................ 6
1.2.2 The role of duties, VAT, and de-minimis threshold ................................................................... 7
1.2.3 De-minimis thresholds across the world ................................................................................... 8
1.2.4 The concept of de-minimis optimization for this study .......................................................... 10
1.2.5 Key terms and definitions ........................................................................................................ 11
1.3 Study process, data sources and the structure of the report ......................................................... 12
2 Collection and analysis of governmental information and data ............................................................. 14
2.1 Overview .......................................................................................................................................... 14
2.2 Key findings from literature on cost of tax collection for governments ......................................... 14
2.3 Governmental data collection and analysis .................................................................................... 16
2.3.1 Overview .................................................................................................................................. 16
2.3.2 Government letter campaign – Round 1 ................................................................................. 17
2.3.3 Government letter campaign – Round 2 ................................................................................. 18
2.3.4 Discussions on the governmental data collection and analysis .............................................. 21
3 Collection and analysis of industry information and data ....................................................................... 22
3.1 Overview .......................................................................................................................................... 22
3.2 Key findings from literature on cost of customs compliance and postal benchmarking ................ 22
3.2.1 Cost of Customs compliance ................................................................................................... 22
3.2.2 Postal sector import fees and charges .................................................................................... 24
3.3 Information and data collection from the express carriers............................................................. 24
3.3.1 Import data record collection process .................................................................................... 24
3.3.2 Import data profiles ................................................................................................................. 26
3.3.3 Other information and data collected from the express carriers ........................................... 29
3.3.4 Discussions on express carrier data collection and analysis ................................................... 30
4 De-minimis economic model and optimization outcomes ..................................................................... 30
4.1 Overview .......................................................................................................................................... 30
4.2 Clearance costs, import records and share of B2C shipments ........................................................ 31
4.2.1 Parameters to calculate import clearance costs ..................................................................... 31
4
4.2.2 Import records; duty and VAT revenues ................................................................................. 32
4.2.3 B2C %-share of total shipments.............................................................................................. 32
4.3 Expansion of database to cover EU27 Member States ................................................................... 32
4.4 De-minimis optimization ................................................................................................................. 33
4.4.1 De-minims optimization principles .......................................................................................... 33
4.4.2 Optimization of VAT de-minimis across EU27 ......................................................................... 33
4.4.3 Variation in de-minimis optimum values between the EU Member States ............................ 34
4.4.4 Optimization of duty de-minimis across EU27 ........................................................................ 35
4.4.5 Discussions on the de-minimis optimization process and the outcomes ............................... 35
5 Consumer behaviour study ..................................................................................................................... 36
5.1 Overview .......................................................................................................................................... 36
5.2 Empirical study ................................................................................................................................ 36
5.3 Results ............................................................................................................................................. 37
6 Conclusions, discussions and recommendations .................................................................................... 40
6.1 Key conclusions ............................................................................................................................... 40
6.2 Further discussions and considerations on political and economic implications ........................... 41
6.3 Final recommendations ................................................................................................................... 44
Bibliography ..................................................................................................................................................... 46
List of annexes ................................................................................................................................................. 48
ANNEX I. Cross-border Research Association and the research team ........................................................ 48
ANNEX II. VAT- and de-minimis -levels at EU Member States .................................................................... 48
ANNEX III. Government letter campaign, Round 1 ..................................................................................... 48
ANNEX IV. Government letter campaign, Round 2 ..................................................................................... 48
ANNEX V. Import data record verification and correction –procedure ...................................................... 48
ANNEX VI. User interfaces for the de-minimis optimization tool ............................................................... 48
ANNEX VII. Data elements and mathematical formulas for the de-minimis optimization tool .................. 48
ANNEX VIII. Screenshots for the consumer study ....................................................................................... 48
ANNEX IX. Expert interview transcripts ....................................................................................................... 48
ANNEX X. Other possible impacts of changing de-minimis levels ............................................................... 48
5
Diagrams Figure 1: Examples of duty de-minimis levels outside EU ................................................................................. 9
Figure 2: Examples of typical import related costs which may / may not be impacted by changes in de-
minimis levels .................................................................................................................................................. 11
Figure 3: Structure of the report reflecting the flow of the research process and main information and data
sources ............................................................................................................................................................. 13
Figure 4: Adjusted collection costs to GST revenue ratio – international mail environment ......................... 15
Figure 5: The distribution of average cost per declaration depending on number of declarations ............... 23
Figure 6: Number of shipments per value range (over two years) ................................................................. 27
Figure 7: Number of shipments per value range (0-100 EUR shipments; over two years) ............................. 27
Figure 8: Number of shipments per value range (100-1000 EUR shipments; over two years) ....................... 28
Figure 9: Cumulative number of shipments as a function of value range (over two years) ........................... 28
Figure 10: Cumulative value of shipments as a function of value range (over two years) ............................. 29
Figure 11: Cumulative duties and VAT in EUR as a function of the value range (over two years) .................. 29
Figure 12: Chapter 4 and the de-minimis optimization process ..................................................................... 31
Figure 13: Relationship between VAT revenues collected and total cost of collection (in EUR, per annum) 34
Figure 14: The optimum de-minimis value per EU Member State (in EUR) .................................................... 35
Figure 15: Conjoint analysis for the product category mobile charger ........................................................... 37
Figure 16: Conjoint analysis for the product category digital camera ............................................................ 38
Figure 17: Relevance of purchase criteria ....................................................................................................... 39
Tables Table 1: Key terms and definitions for this report .......................................................................................... 11
Table 2: Responses received on government survey (Round 1 and Round 2) per EU Member State ............ 17
Table 3: Data elements requested from the four express carriers ................................................................. 25
Table 4: Other information and data requested from the four carriers ......................................................... 30
Table 5: Consumer segments .......................................................................................................................... 39
6
1 Introduction
1.1 Purpose and scope of the study The purpose of this study is to explore economic consequences, consumer behaviour and other potential
implications of various VAT and duty de-minimis levels relating to the import into European Union of goods
with a value less than 1000 EUR. Three specific research questions for this study are as follows:
1. What are the economically optimal VAT and duty de-minimis levels for imports into the EU,
considering the cost of tax collection for public administrations and the cost of import processes
and procedures for the private sector?
2. If VAT and/or duty de-minimis levels were to increase in the future, how would consumer
behaviour change in terms of e-commerce imports from 3rd countries versus e-commerce and
retail purchases within the EU?
3. Which other political and economic implications could follow from potential decisions in the
future to increase VAT or duty de-minimis levels in the EU?
The scope of the study covers the de-minimis levels of VAT and duty of import shipments within the
European Union. Some references are made to other countries for benchmarking purposes. Furthermore,
the scope also covers the potential implications of changes to the de-minimis levels as described above. At
the outset, the following three key decisions were made regarding presumptions for the study:
This study is effectively a multi-stakeholder one, considering the pros and cons of all identifiable
stakeholders in the context of changing the de-minimis levels; at the same time, however,
importers are considered to be the focal point of the whole importation process, as they typically
pay the import processing and tax collection costs, one way or another.
This study focuses on the total cost of import tax collection for public administrations and import
process costs for the private sector; this is preferred to simply looking at one of the two cost
components as part of the overall de-minimis optimization exercise.
In calculating the optimum de-minimis values, any savings will be calculated net of the tax revenue
foregone due to an increased de-minimis threshold. In case of VAT, only that paid by consumers is
taken into account, since VAT paid by companies is deductible.
The study is carried out by Cross-border Research Association (CBRA), a Swiss-based trade facilitation and
supply chain security research institute. The research team consisted of five CBRA staff members and of
four university professors from the fields of consumer behaviour, international trade, macroeconomics and
supply chain management1. The project started on 15 March 2013 and was finalized by 14 October 2014.
The mandate for the CBRA to undertake the study was provided by the European Express Association (EEA).
1.2 Universe of small consignments
1.2.1 Markets, products, sellers, buyers and logistics
This study looks specifically at small international consignments. While there is no distinct definition for
“small consignments”, we refer to value rather than size or weight in our definition. Hence, we have
1 Please see ANNEX I. for additional information on Cross-border Research Association (CBRA) and short bios for the
whole research team
7
chosen 1000 EUR as the upper limit of consignment value, which corresponds to the EUROSTAT threshold
for trade-reporting requirements. Also, under this limit, we argue that in most cases the small size, low
weight and low value go hand in hand. Despite the somewhat arbitrary nature of its definition, the small
consignments can be seen to form a distinct segment within the market. This distinction is driven by a
complex combination of products, buyers, sellers and transport modalities.
The universe of small consignments is a playing field of both firms and consumers. Traditionally, the
majority of recipients are businesses with a logistical need for fast and reliable import of goods in small
quantities. However, the number of consumers has increased sharply in the past decade, following the rise
of cross-border e-commerce.
Typical products within the universe of small consignments include spare parts, professional equipment,
samples and consumer goods. Examples of highly traded consumer goods crossing international borders
include books, electronic appliances (such as cameras and chargers), clothing and shoes, and sports
equipment.2 The buyers in the universe of small consignments include large firms, SMEs and private
consumers, and the market thus deals with both business-to-business (B2B) and business-to-consumer
(B2C) trade. The sellers are in most cases multinational firms and, particularly in B2C, typically large e-
commerce companies located for example in the USA, Europe and China. Small consignments are typically
carried by express operators and mail operators, due, for example to the type and quantity of products
shipped, and the logistics requirements of customers (e.g. urgency for spare parts).
The main driver in the growth of the universe of small consignments is e-commerce, which is a globally
burgeoning industry that has led to a dramatic increase in B2C online sales. In 2012, global e-commerce
B2C sales shot up to 1 trillion USD (Jones Lang LaSalle, 2013, p.4). Recent years have witnessed a substantial
growth in cross-border e-commerce as both internet-only and multi-channel retailers turn to overseas
markets for new sources of revenue. The rapid growth of e-commerce has significantly changed the
transportation patterns and lead to a high growth of small consignments being shipped globally.
In the EU, the share of citizens / consumers buying goods or services over the Internet has more than
doubled, from 15% in 2004 to 35% in 2012. However, there are significant variations between the member
countries: in the Nordic countries and in the UK the share exceeded 60% in 2012, while in Eastern Europe
the levels remained between 10% and 20%. Similarly, the average spending varies between 100 EUR in
Romania and Slovakia and 2100 EUR in the UK.3
From the Customs perspective the universe of small consignments is highly relevant, since it involves an
increasingly large number of shipments, representing a significant workload and yet for a limited amount of
duty and VAT revenues collected. This issue has been mediated, mainly for customs duties, by the
stipulations of international agreements and conventions such as the WCO Revised Kyoto Convention, WCO
Immediate Release Guidelines, and WTO Bali Agreement; these will be discussed in the next sub-chapter.
1.2.2 The role of duties, VAT, and de-minimis threshold
2 In contrast, bulk import would typically exceed the 1000 EUR threshold and thus be excluded from this study.
3 This data was derived from EUROSTAT 2012 statistics,
http://epp.eurostat.ec.europa.eu/portal/page/portal/eurostat/home/
8
The cross-border consignments, whether they emanate from e-commerce or traditional business
transactions, are subject to VAT and import duties, unless specifically exempted. The level of import duties
is related to the commodity category, the country of origin and, in general, to the value of the goods. Value
Added Tax (VAT) is directly related to the value of the goods and commodity category. Average tariff rates
for import duties for consignments originating outside of the EU Customs Union are 2-13%. VAT is charged
on some goods and services imported from countries outside the EU and when brought into one EU
country from another. There are three rates of VAT in the EU: standard, reduced and zero; the standard
VAT rates vary between 15% and 27% among the Member States4.
In order to reach an ideal balance between the overall costs of assessing and collecting customs duties and
VAT, de-minimis thresholds for tax-free shipments have been set. The International Chamber of Commerce
(ICC) Customs Guideline #11 defines de-minimis as “a valuation ceiling for goods, including documents and
trade samples, below which no duty or tax is charged and clearance procedures, including data
requirements, are minimal (UNECE, 2012)”. The Revised Kyoto Convention (RKC), by the World Customs
Organization (WCO), calls for Customs administrations to set de-minimis thresholds below which duties and
taxes are waived. Shipments falling into this category enjoy expedited release with minimum documentary
requirements. The WTO Bali agreement of 2013 supports the future development of trade facilitation,
including setting relevant de-minimis levels across the globe.
Collection of VAT and import duties generates additional cost not only for Customs and tax authorities, but
also for the logistics operators, importers and consumers. Furthermore, it causes time delays with
quantifiable value. Hence, the application of de-minimis levels is likely to reduce the cost for all parties
involved, while improving the fast flow of goods.5
1.2.3 De-minimis thresholds across the world6
In the EU, goods with a total intrinsic value equal to or less than 150 EUR are exempt from import duties,
and goods having a total value equal to or less than EUR 10 should be exempt from VAT on importation.
Member States may also grant an exemption on VAT for imported goods which have a minimum total value
between EUR 10 and EUR 22 (Council Directive 2009/132/EC of 19 October 2009).7 Thus, unlike import
duties, the VAT de-minimis threshold is not harmonized and can significantly vary across the EU but within
this given range. However, the upper limit of 22 EUR is typically applied by most Member States8.
In the EU, the recent report on the taxation of the so-called 'digital economy' (European Commission,
2014c) aims to address current flaws in European taxation as regards the emergence of the digital
economy. The Group behind this report considers de-minimis rules to represent a distortion of
competition. The Group recommends that “the small consignments exemption is abolished and that this
should be pursued as a priority in tandem with the development of the broader One Stop Shop (OSS), in
order to create a level playing field between EU and non-EU suppliers” (European Commission, 2014c) . The
4 ANNEX II. VAT-levels at EU Member States (standard and reduced) as well as de-minimis levels.
5 Specific aspects of excise taxes have been purposefully left out-of-scope for this study.
6 All national currencies have been converted on 16 July 2014, using moneyconverter.com
(http://moneyconverter.com/) with the following exchange rates: 1 EUR = 1.36 USD 1 EUR = 1.45 AUD; 1 EUR = 1.55 NZD; 1 EUR = 46.73 RUB; 1 EUR = 81.83 INR; 1 EUR = 138.28 JPY; 1 EUR = 8.44 CNY 7 See http://eur-lex.europa.eu/legal-content/EN/TXT/?uri=CELEX:32009L0132 (accessed 14 September 2014).
8 See ANNEX II for details.
9
Group also notes that the consignments falling between 22 EUR and 150 EUR in value create “an
unnecessary burden” for “both customs administrations and parcel operators/couriers”. The Group
recommends “that the One Stop Shop should not just apply to the currently exempted small consignments
but to other small consignments for which no customs duties are due. Such supplies could then benefit
from a specific fast-track customs clearance” (European Commission, 2014c).
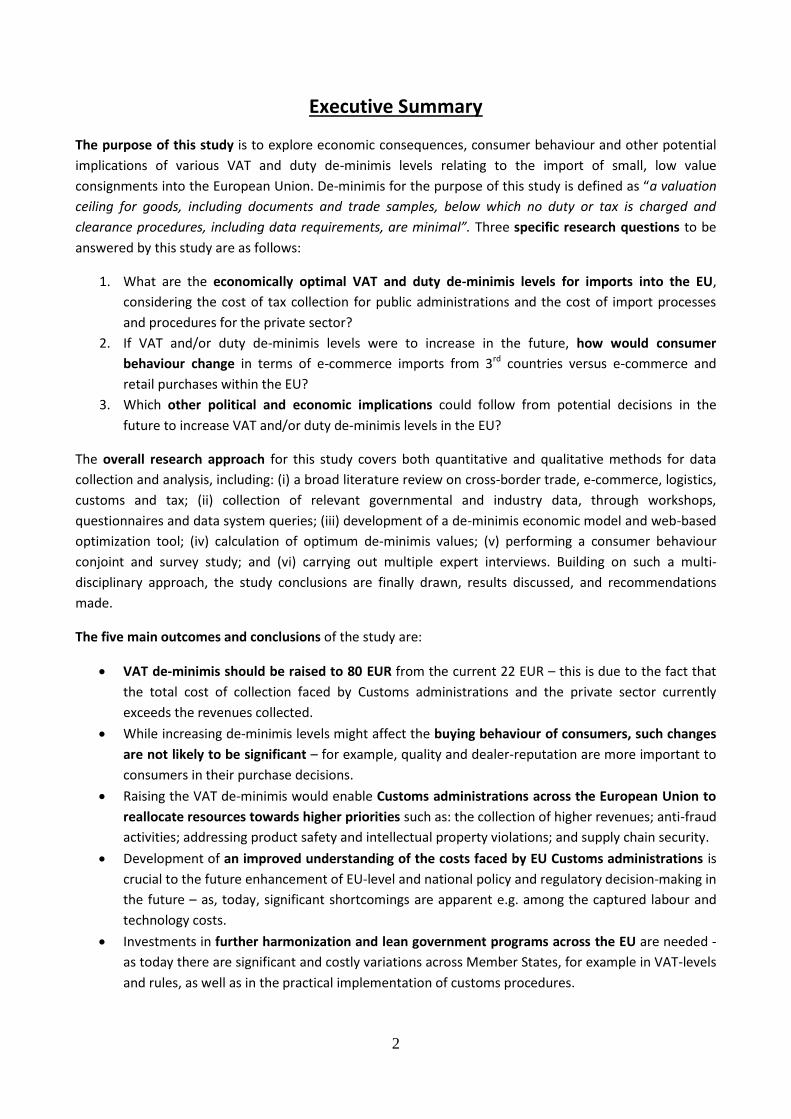
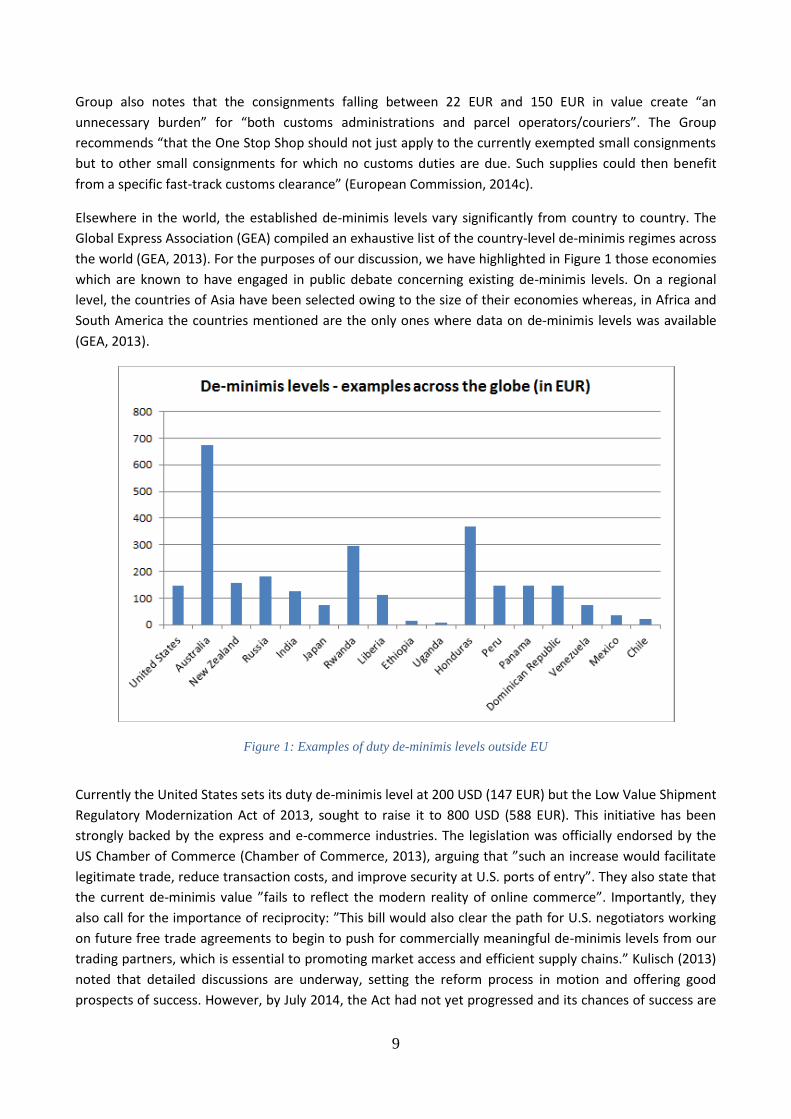
Elsewhere in the world, the established de-minimis levels vary significantly from country to country. The
Global Express Association (GEA) compiled an exhaustive list of the country-level de-minimis regimes across
the world (GEA, 2013). For the purposes of our discussion, we have highlighted in Figure 1 those economies
which are known to have engaged in public debate concerning existing de-minimis levels. On a regional
level, the countries of Asia have been selected owing to the size of their economies whereas, in Africa and
South America the countries mentioned are the only ones where data on de-minimis levels was available
(GEA, 2013).
Figure 1: Examples of duty de-minimis levels outside EU
Currently the United States sets its duty de-minimis level at 200 USD (147 EUR) but the Low Value Shipment
Regulatory Modernization Act of 2013, sought to raise it to 800 USD (588 EUR). This initiative has been
strongly backed by the express and e-commerce industries. The legislation was officially endorsed by the
US Chamber of Commerce (Chamber of Commerce, 2013), arguing that ”such an increase would facilitate
legitimate trade, reduce transaction costs, and improve security at U.S. ports of entry”. They also state that
the current de-minimis value ”fails to reflect the modern reality of online commerce”. Importantly, they
also call for the importance of reciprocity: ”This bill would also clear the path for U.S. negotiators working
on future free trade agreements to begin to push for commercially meaningful de-minimis levels from our
trading partners, which is essential to promoting market access and efficient supply chains.” Kulisch (2013)
noted that detailed discussions are underway, setting the reform process in motion and offering good
prospects of success. However, by July 2014, the Act had not yet progressed and its chances of success are
10
unknown – this issue may be related to the on-going EU-US negotiations over the Transatlantic Trade and
Investment Partnership (TTIP).
Australia maintains a current de-minimis value of 1000 AUD (689 EUR) (GEA, 2013). In New Zealand no
duties or taxes are collected on imports if the total amount payable is less than 60 NZD (39 EUR), and which
translates to a value of approximately 400 NZD (259 EUR) for most goods (Ewart, 2013). The domestic retail
industries in both countries have voiced concerns on the impacts of the national de-minimis regimes on
their business sectors (Hufbauer and Wong, 2011a, p.7 & New Zealand Retailers Association, 2011). Despite
their disgruntlement, no changes in re-adjusting de-minimis levels have taken place. In 2011, the New
Zealand government announced that the status quo of 60 NZD would be retained (Williamson, 2011),
stating that given the current capabilities of Customs’ cargo reporting and revenue collection systems, a
higher de-minimis would decrease the amount of revenue collected by the Crown, there would be negative
impacts on wider risk management (for example illicit drugs) if the present cargo reporting system for low
value imports was extended for a higher level de-minimis; a lower de-minimis would, it was argued,
increase compliance costs to importers and not produce a worthwhile increase in Crown revenue
(Williamson, 2011).
Large differences in the current de-minimis thresholds are observed between some of the largest Asian
economies, such as China, Japan and India. India maintains a relatively high de-minimis level of 10,000 INR
(122 EUR), followed by Japan at 10,000 JPY (72 EUR). In China the threshold is defined as duty and VAT
liability of less than 50 RMB (6 EUR). One notices similar divergences across the African, Central and South
American economies.
1.2.4 The concept of de-minimis optimization for this study
As discussed above, the policy makers and legislators are faced with the task of identifying an ideal balance
between the overall costs of assessing and collecting customs duties and VAT versus the total revenue
raised, in order to set the de-minimis thresholds. Furthermore, they will also need to consider the costs
generated for importers and logistics operators and, going yet further, the effects on cross-border trade.
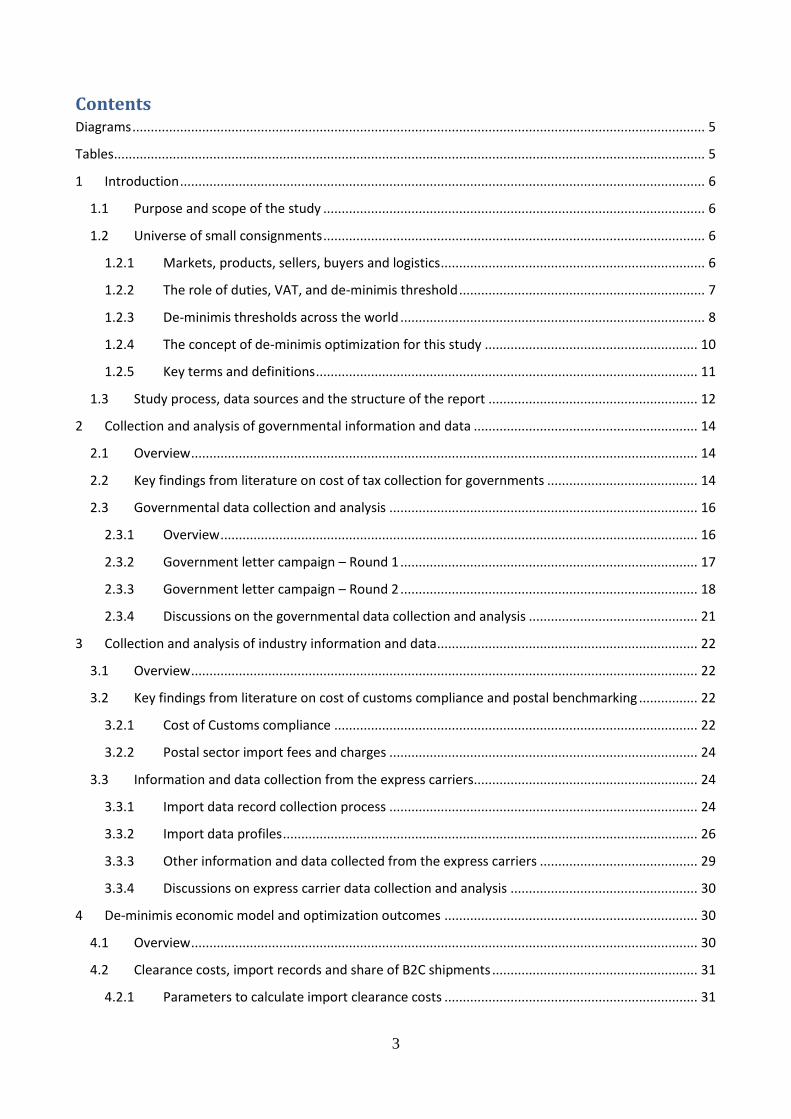
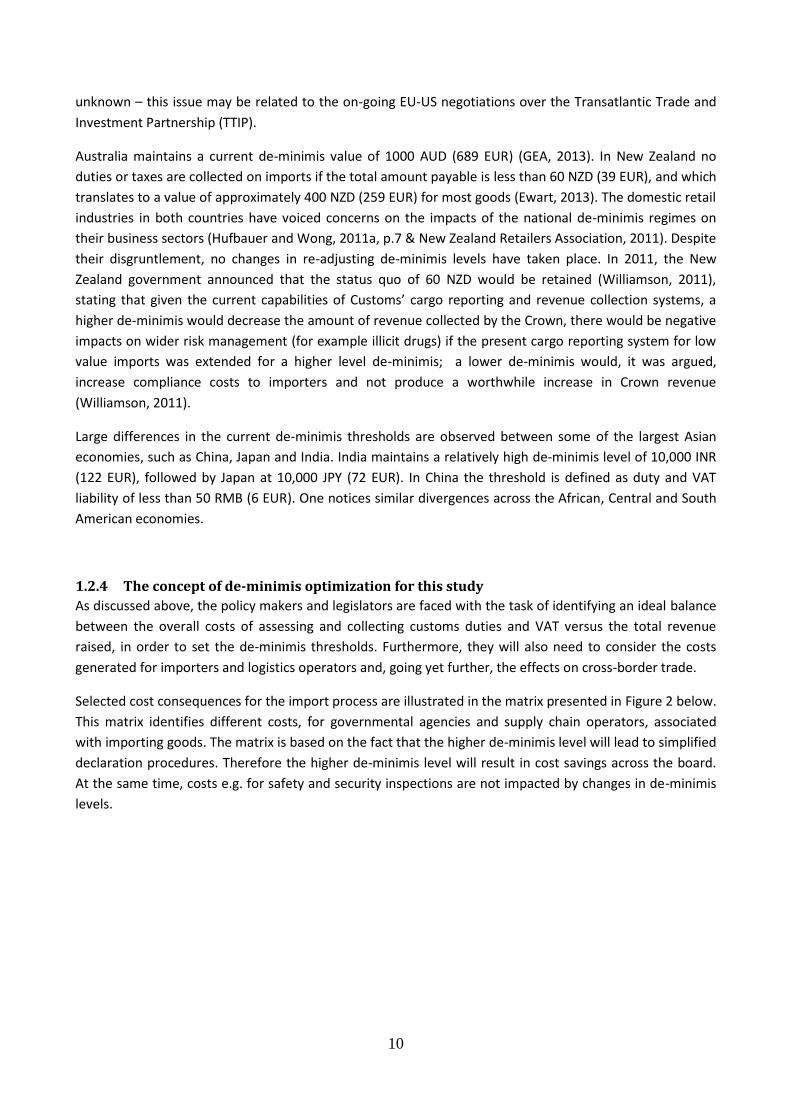
Selected cost consequences for the import process are illustrated in the matrix presented in Figure 2 below.
This matrix identifies different costs, for governmental agencies and supply chain operators, associated
with importing goods. The matrix is based on the fact that the higher de-minimis level will lead to simplified
declaration procedures. Therefore the higher de-minimis level will result in cost savings across the board.
At the same time, costs e.g. for safety and security inspections are not impacted by changes in de-minimis
levels.
11
Figure 2: Examples of typical import related costs which may / may not be impacted by changes in de-minimis levels
The cost savings achieved in the simplified import procedures may be partly offset by the loss of duty and
VAT revenues. In the calculation of the optimum de-minimis value, the tax revenue foregone should include
all Customs duties and the VAT (net effect). The calculation of the optimum results in the graphical
representation depicting an inverted u-shape curve, where the optimal value will be found on the top of
the curve, representing the maximum net gain for the whole economy.
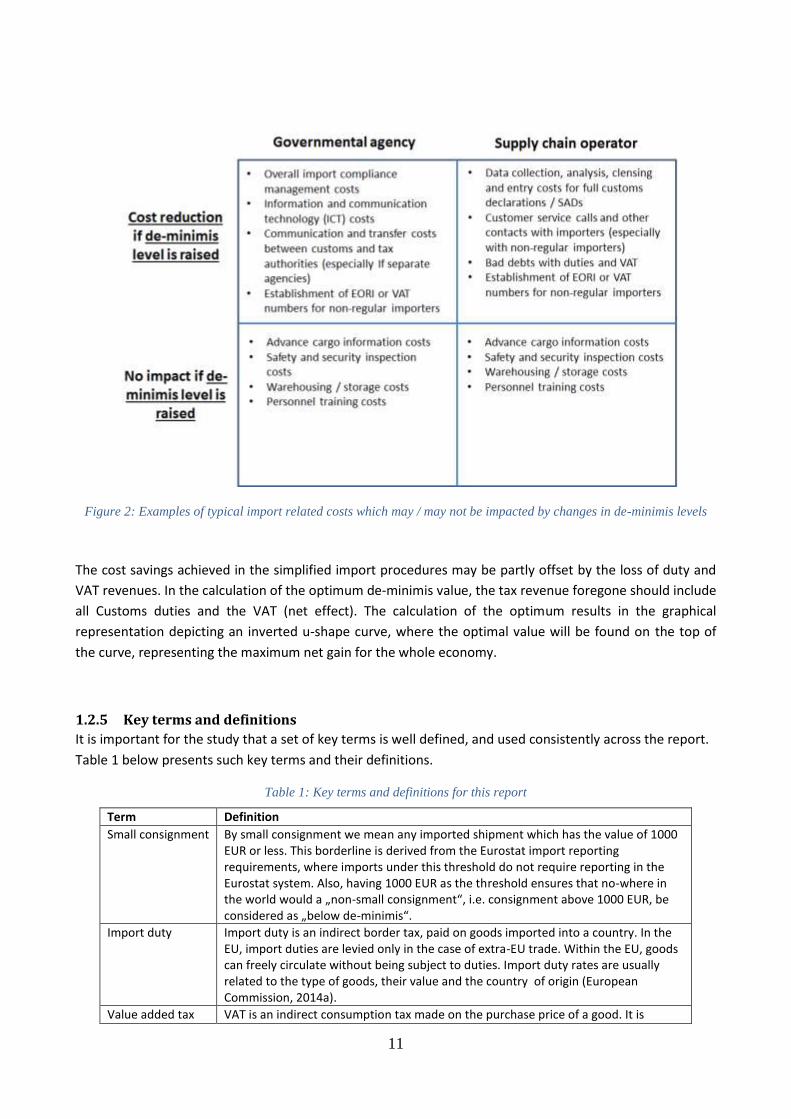
1.2.5 Key terms and definitions
It is important for the study that a set of key terms is well defined, and used consistently across the report.
Table 1 below presents such key terms and their definitions.
Table 1: Key terms and definitions for this report
Term Definition
Small consignment By small consignment we mean any imported shipment which has the value of 1000 EUR or less. This borderline is derived from the Eurostat import reporting requirements, where imports under this threshold do not require reporting in the Eurostat system. Also, having 1000 EUR as the threshold ensures that no-where in the world would a „non-small consignment“, i.e. consignment above 1000 EUR, be considered as „below de-minimis“.
Import duty Import duty is an indirect border tax, paid on goods imported into a country. In the EU, import duties are levied only in the case of extra-EU trade. Within the EU, goods can freely circulate without being subject to duties. Import duty rates are usually related to the type of goods, their value and the country of origin (European Commission, 2014a).
Value added tax VAT is an indirect consumption tax made on the purchase price of a good. It is
12
(VAT) charged on a product whenever value is added at any stage of production and at final sale. The seller of the goods is the taxable person, but it is the buyer who actually pays the taxable amount to the seller as part of the price (European Commission, 2014b). In the EU, import VAT is charged on some goods and services imported from 3rd countries and when brought into one EU country from another. Elsewhere in the world, some countries use the acronym GST (goods and services tax/general sales tax) instead of VAT. Businesses – unlike consumers – can deduct the VAT they pay on their purchases on the VAT collected on their sales.
De-minimis threshold
De-minimis threshold refers to „a valuation ceiling for goods, including documents and trade samples, below which no duty or tax is charged and clearance procedures, including data requirements, are minimal“ (UNECE, 2012). In the EU goods falling below the de-minimis thresholds are subject to simplified clearance procedures at import.
Low value (LV) import
These import shipments have intrinsic value less than VAT de-minimis (e.g. 22 EUR in several EU Member States); this means that import declarations can be done on manifest basis – a.k.a. informal import entries.
Medium value (MV) import
Really specific to this study, this value range sits in between LV and HV imports, i.e. imports of higher value than VAT de-minimis (22 EUR in multiple EU Member States), and lower value than duty de-minimis (150 EUR in EU)
High value (HV) import
These import shipments have intrinsic value higher than VAT and duty de-minimis (latter fixed for 150 EUR across EU); this means that import declarations must be done in SAD-format a.k.a formal import entries.
Formal import entry
Formal import entry, a.k.a. SAD– Single Administrative Documents –, must be done for all imports above VAT de-minimis level.
Informal import entry
Informal import entry, can be done for most low value (LV) shipments; exceptions exist e.g. with excise goods.
Import process cost
By import process cost we mean all costs incurred internally by public administrations – Customs and tax in particular -; as well as by logistics service providers, freight forwarders and Customs brokers. The intention of „optimum de-minimis levels“ is to minimize such administrative costs, for the benefit of the whole supply chain.
Import service fee Logically linked to the import process costs above – while still independently defined and agreed between various parties – the import service fees are passed typically from the freight forwarding actors to the importers.
1.3 Study process, data sources and the structure of the report Following from the research questions explained in Chapter. 1.1, the process of this study centres around
an econometric model, drawing from governmental and industry data – specifically on a large sample of
shipment data from the four major express carriers, and a consumer behaviour study.
This study benefited from and analysed a multitude of data and information sources: Academic and
practitioner literature and regulatory documents were reviewed; publicly available statistical and other
databases were examined and data drawn for analysis; expert knowledge was collected in workshops and
interviews, and study questionnaires were used to collect information from various countries and bodies.
Finally, data records from information systems provided a source of crucial proprietary data. Research
methods included economic modelling and analysis as well as conjoint analysis.
The report provides a condensed presentation of the key findings and results of the study. In order to keep
the body of the core report within manageable size limits, the majority of detailed research and technical
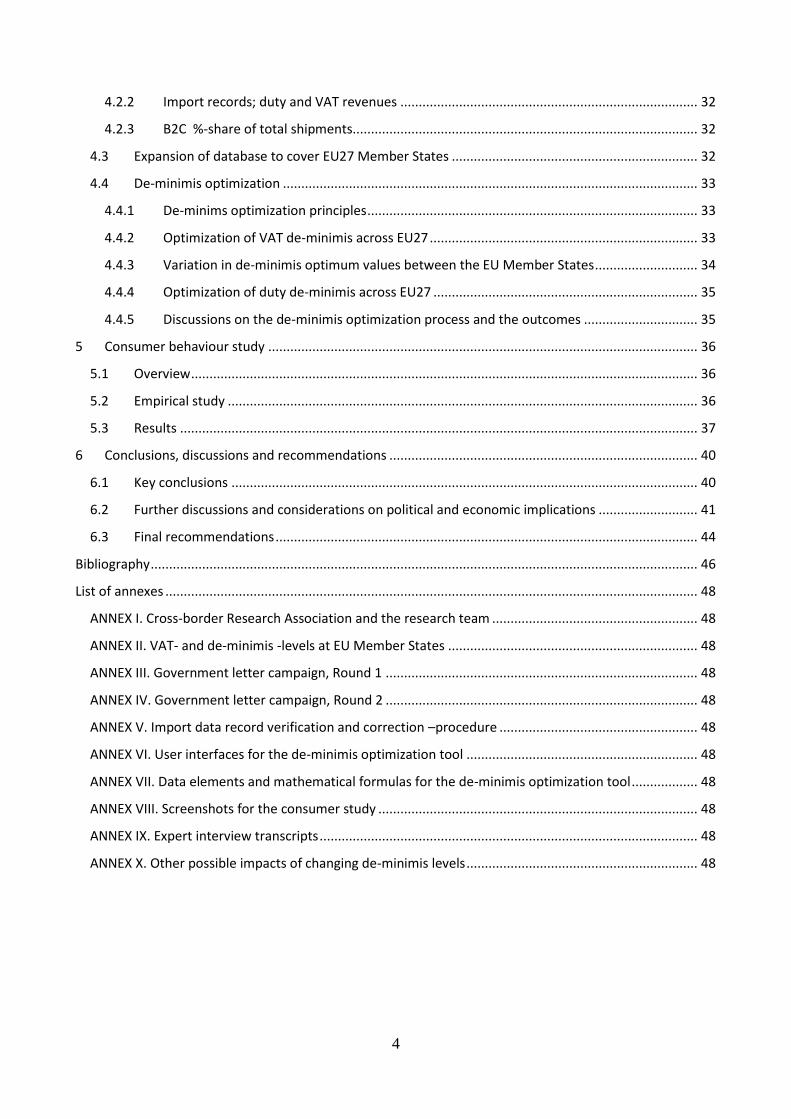
information is made available in ten annexes.9 The study process, expressed as report chapters and the
9 Editorial note: ANNEX I to ANNEX X – in this report references to the annexes are normally presented as footnotes.
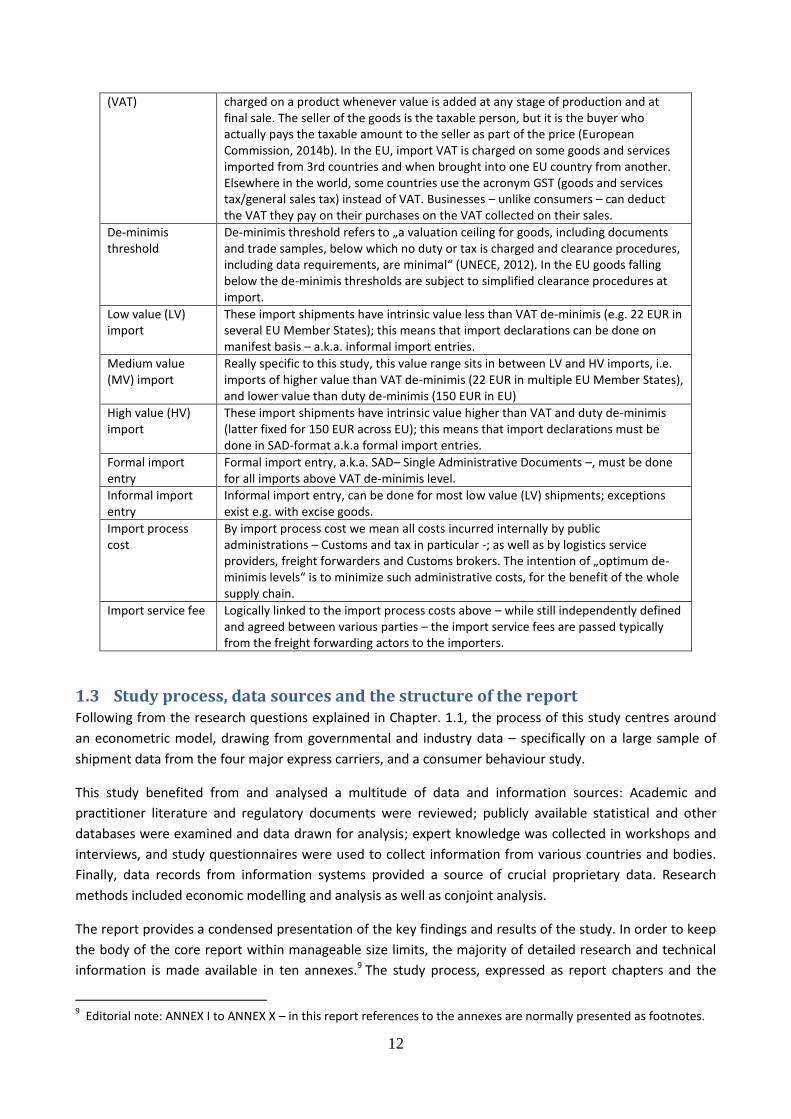
13
flow between them, as well as the main information and data sources behind various chapters, are
visualized in Figure 3 below.
Figure 3: Structure of the report reflecting the flow of the research process and main information and data sources
The purpose and content of each chapter in the report can be summarized as follows:
Chapter 1 provides a brief introduction to the topic and to the report, including main research
questions, overview on indirect border taxes, key terms and definitions and the structure of the
report.
Chapter 2 starts with a brief literature review on cost of tax collection for governments, followed
by the reasoning, process, outcomes and limitations of governmental data collection, executed in
two rounds by the research team.
Chapter 3 starts with a brief literature review on cost of customs compliance for industry and
importers, followed by the reasoning, process, outcomes and limitations of express carrier data
collection, executed on two levels by the research team.
Chapter 4 presents the de-minimis optimization tool, calculation steps and optimization outcomes
for VAT and duty de-minimis levels, across the European Union.
Chapter 5 presents the consumer behaviour study, which examines the relevance of different
criteria for consumers’ purchase decision - including sales channel, product price, shipping fees,
charges for duty and VAT, and delivery time - providing understanding of the importance of
different criteria in reaching a purchase decision.
Chapter 6 presents the key conclusions for the study – in the form of answering the three research
questions from Chapter 1 – followed by sub-chapters on further discussions and final
recommendations.
14
2 Collection and analysis of governmental information and data
2.1 Overview The purpose of this chapter is to explain the process and results of governmental information and data
collection. It focuses primarily on cost of revenue collection at Customs and tax administrations both inside
the EU – data to be used in our de-minimis economic model – and outside the EU – data to be used for
benchmarking purposes. We start with a brief literature review on the cost of tax collection for these
governmental agencies (Chap. 2.2.). We then continue by explaining the process, target audience,
questionnaires and main outcomes of the two rounds of “governmental letter campaigns” carried out by
the research team (Chap. 2.3.1): Round 1 high-level questionnaire for national audit offices, Customs
administrations and ministries of finance during spring 2013 (Chap. 2.3.2), and Round 2 detailed
questionnaire for Customs administrations only during winter 2014 (Chap. 2.3.3).
2.2 Key findings from literature on cost of tax collection for governments Published literature on the cost of VAT and duty collection is rather limited. A rule of thumb suggests that
the 25% share that EU Member States receive on the duties they each collect, provides one benchmark for
how much it costs for Customs authorities to collect duties (European Commission, 2013). It should also be
noted that this rule of thumb only applies to duties and not to VAT and there is no clear rationale as to its
level. Furthermore, there are significant differences across the Member States on the roles the various
authorities play in duty and VAT collection (Sowinski & Taelman, 2014). Overall, while the 25% rule of
thumb may give an idea of the magnitude of the cost, some more sophisticated analysis has been
conducted in the Member States and elsewhere.
The French Customs annual performance plan can be used as one benchmark on how to measure the cost
of collection. According to this plan, the reduction target for the average cost for collecting 100 EUR in
taxes and duties for the French Customs is 0,51 EUR - across all shipment values, not limited to small
consignments (French Customs, 2011). It is indeed important to note that shipments vary significantly in
terms of their value and other parameters, and therefore average cost figures are hard to interpret,
particularly if they are not stated in relation to shipment values. In addition, these costs can include
standard customs declarations for regular importers, for example: those with deferment accounts.
Consequently the cost for such an importation may well be lower than for an ad-hoc e-commerce entry, for
example.
At a global level, cost estimates for customs clearance processes for government administrations have been
made for the APEC-6 economies – Canada, Indonesia, Japan, Malaysia, the Philippines and Thailand
(Holloway and Rae, 2012, p. 51). The costs incurred per consignment depend on the transport modalities.
For air and mail deliveries, the Canadian and the Japanese Customs administrations spend 28.51 EUR (38.74
USD) and 26.94 EUR (36.61 USD) respectively. The accrued expenses to the remaining four countries range
from 10.41 EUR (14.14 USD) to 2.46 EUR (3.34 USD). By sea cargo, cost estimates are a bit higher, with
15
Canada and Japan spending 35.47 EUR (48.19 USD) and 33.51 EUR (45.53 USD) respectively. The other four
Customs administrations spend between 12.94 EUR (17.58 USD), and 3.08 EUR (4.19 USD). 10
An Australian study also collected processing fees in six countries (Canada, South Korea, New Zealand,
Singapore, the United Kingdom and the United States) and found them to vary between 0.59 and 14.07
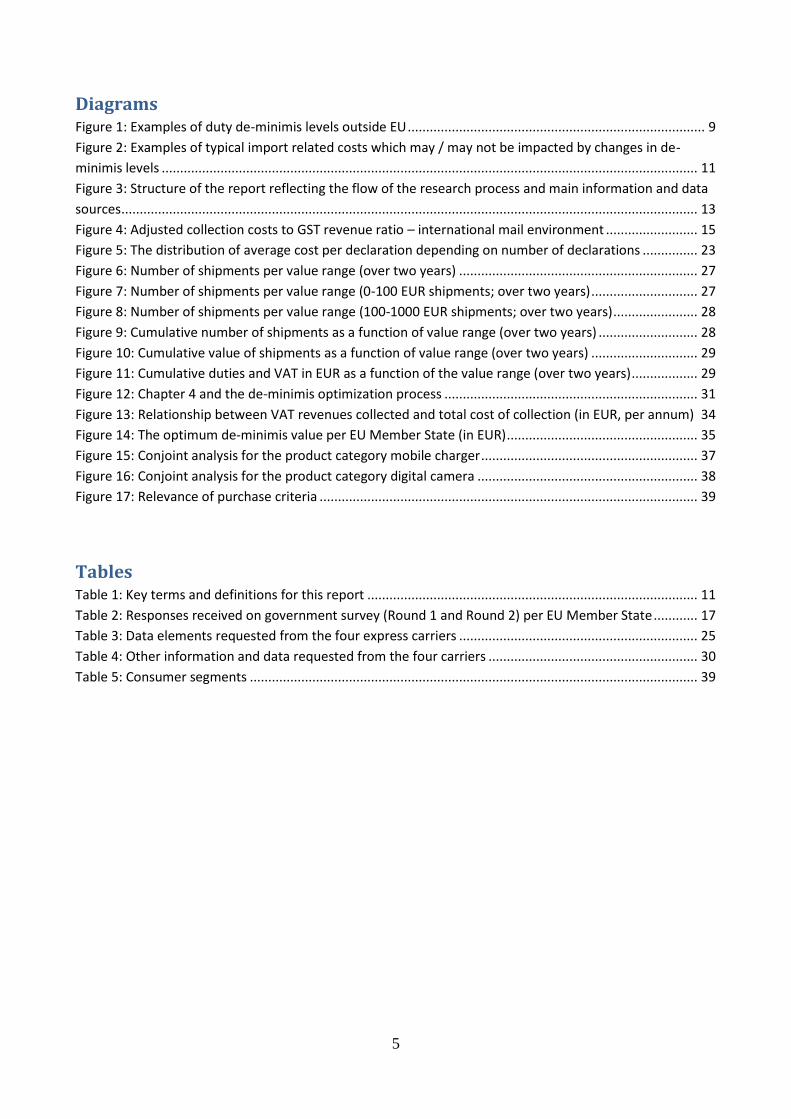
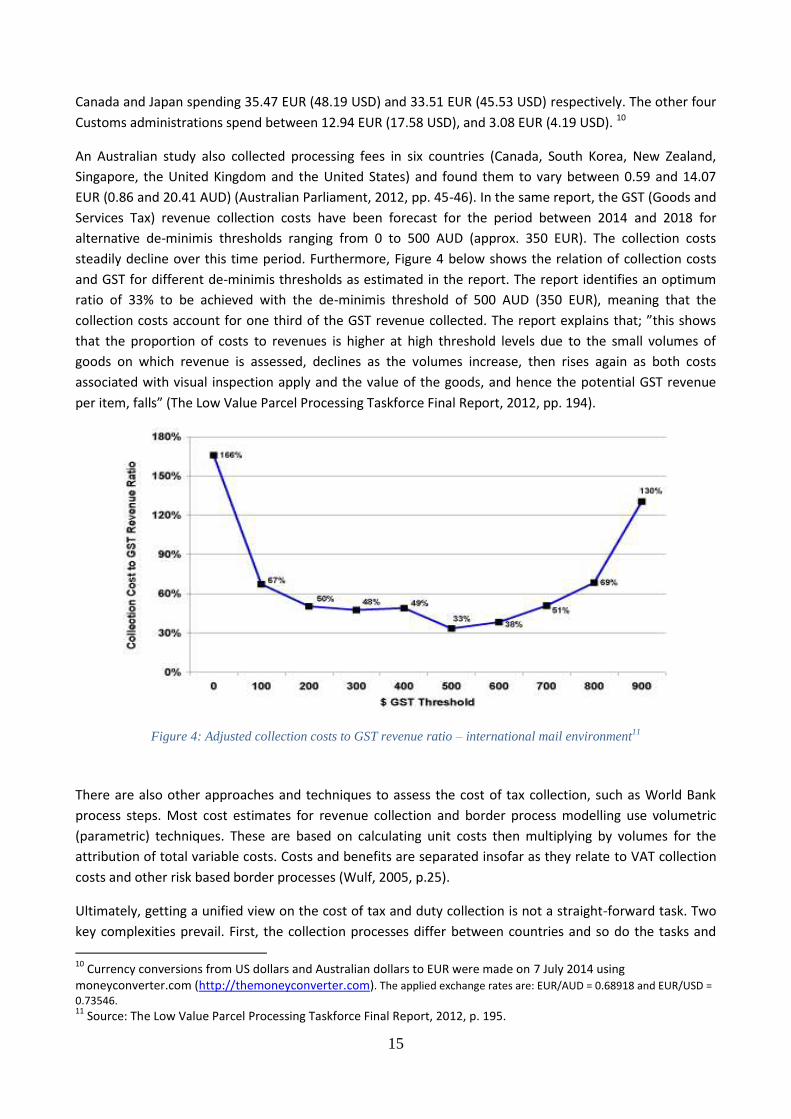
EUR (0.86 and 20.41 AUD) (Australian Parliament, 2012, pp. 45-46). In the same report, the GST (Goods and
Services Tax) revenue collection costs have been forecast for the period between 2014 and 2018 for
alternative de-minimis thresholds ranging from 0 to 500 AUD (approx. 350 EUR). The collection costs
steadily decline over this time period. Furthermore, Figure 4 below shows the relation of collection costs
and GST for different de-minimis thresholds as estimated in the report. The report identifies an optimum
ratio of 33% to be achieved with the de-minimis threshold of 500 AUD (350 EUR), meaning that the
collection costs account for one third of the GST revenue collected. The report explains that; ”this shows
that the proportion of costs to revenues is higher at high threshold levels due to the small volumes of
goods on which revenue is assessed, declines as the volumes increase, then rises again as both costs
associated with visual inspection apply and the value of the goods, and hence the potential GST revenue
per item, falls” (The Low Value Parcel Processing Taskforce Final Report, 2012, pp. 194).
Figure 4: Adjusted collection costs to GST revenue ratio – international mail environment11
There are also other approaches and techniques to assess the cost of tax collection, such as World Bank
process steps. Most cost estimates for revenue collection and border process modelling use volumetric
(parametric) techniques. These are based on calculating unit costs then multiplying by volumes for the
attribution of total variable costs. Costs and benefits are separated insofar as they relate to VAT collection
costs and other risk based border processes (Wulf, 2005, p.25).
Ultimately, getting a unified view on the cost of tax and duty collection is not a straight-forward task. Two
key complexities prevail. First, the collection processes differ between countries and so do the tasks and
10
Currency conversions from US dollars and Australian dollars to EUR were made on 7 July 2014 using moneyconverter.com (http://themoneyconverter.com). The applied exchange rates are: EUR/AUD = 0.68918 and EUR/USD =
0.73546. 11
Source: The Low Value Parcel Processing Taskforce Final Report, 2012, p. 195.
16
overheads included in the cost estimates, thus clouding the comparability. Secondly, the processes are
organized under different authorities, thus creating organizational boundaries, which constrain the
transparency of process cost (see for example Sowinski & Taelman, 2014).
2.3 Governmental data collection and analysis
2.3.1 Overview
The research team carried out two rounds of information and data collection from governmental parties
across the European Union. This was to gain deeper insights into the cost management and operational
activities as well as the national rules related to customs clearance processes across the EU27 Customs
administrations.12
Government Round 1 questionnaire: The objective of our first set of questions was to acquire baseline
data and information on the governmental costs of administering the collection of duties and VAT on
imports, in relation to small consignments. To accomplish this task, we conducted an extensive campaign
across 27 EU Member States between the 5 April and 11 May, 2013. In total, 81 registered letters were sent
to the Ministries of Finance, Customs Administrations and Government Audit offices of the 27 EU Member
States, typically targeting top management in each of the institutes. English was the language of
correspondence for Ireland, the UK, Sweden, Finland, Denmark, Cyprus, Malta, Slovak Republic, Slovenia,
Estonia, Latvia and Lithuania. For the remaining countries we opted for translated versions of the letter into
their respective local languages. In total, we received 34 replies to Round1 questionnaire, as indicated in
Table 2 below.
Government Round 2 questionnaire: The purpose of our second questionnaire was to build upon the
Round 1 questionnaire and obtain more detailed information with numerical data, where available, on
Customs annual budgets, Customs personnel, customs declarations, customs clearance processes and so
forth. In mid-February 2014, the questionnaire was sent electronically to those contact persons in the
Customs administration recommended to us by the respondents to the Round 1 questionnaire. For
countries that had indicated no contact person, we targeted the top management of those Customs
administrations. English was our sole language of correspondence for this round of communication. In
order to maximize the rate of response, the questionnaire was resent both electronically and by registered
mail, followed up by phone call reminders. This multiple approach was largely successful resulting in 15
responses, as shown in Table 2 below.
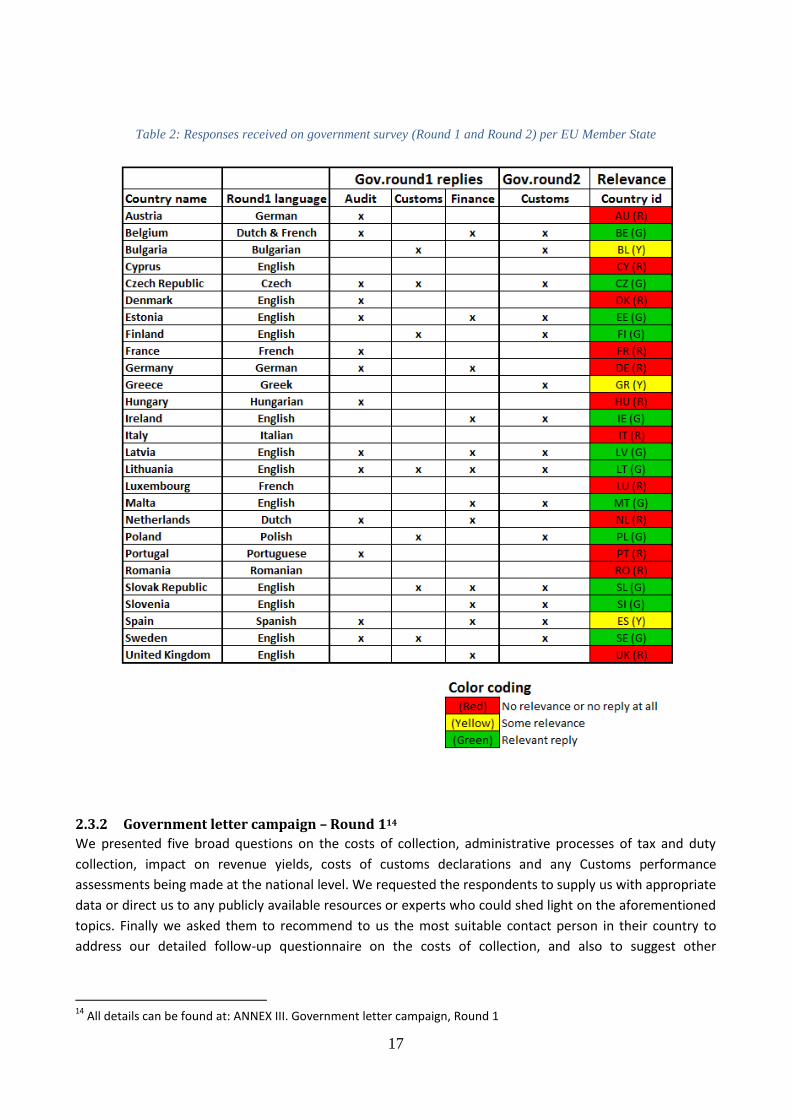
The centre column in Table 2 below, titled “Gov.round1”, indicates for each country which of the three
institutes – National Audit office, Customs Administration and Finance Ministry – replied to the Round 1
questionnaire; and the column to the left of that, titled “Gov.round2” indicates whether Customs
administration, as sole recipient of the Round 2 questionnaire, replied to us or not. The right-most column,
titled “Relevance”, provides then a qualitative view on how relevant the replies were that we received from
each country – the three colour codes used are explained at the bottom of the table.13
12
The study scope covers 27 EU Member States, due to fact that import data records were available for the research team from years 2011-12 (when Croatia was not yet a member of the EU). 13
Editorial note: Letters (R) for Red, (Y) for Yellow and (G) for Green are listed in the Relevance column, to support readers of black & white printed report.
17
Table 2: Responses received on government survey (Round 1 and Round 2) per EU Member State
2.3.2 Government letter campaign – Round 114
We presented five broad questions on the costs of collection, administrative processes of tax and duty
collection, impact on revenue yields, costs of customs declarations and any Customs performance
assessments being made at the national level. We requested the respondents to supply us with appropriate
data or direct us to any publicly available resources or experts who could shed light on the aforementioned
topics. Finally we asked them to recommend to us the most suitable contact person in their country to
address our detailed follow-up questionnaire on the costs of collection, and also to suggest other
14
All details can be found at: ANNEX III. Government letter campaign, Round 1
18
organizations, individual experts or web-resources that would help us obtain relevant information for our
study.
We received 34 responses in total, including a few negative ones either pointing out they have no data to
support our study or just declining to participate. Some positive responses led us to publicly available
financial reports not of direct relevance to our study or referred to publications in their national languages.
However, the statistical bulletin of a Customs administration contained some data on revenue and
expenditure, the number of personnel employed in the organization and so forth. Also, one of the Finance
ministries was able to share with us a useful analysis regarding the cost of tax collection in a graphical
format. Beyond the national level, some references have been made to relevant studies on small
consignments and the administrative efficiency of the Member States in customs duty collection, including
studies by the European Parliament (EP), the Organization for Economic Cooperation and Development
(OECD) and the World Customs Organization (WCO).15
With respect to governmental activities in the evaluation of tax collection processes, none of the offices
claimed to have made any such initiatives specifically in the context of consignments of negligible value.
Assessments of the collection costs of import duties and taxes and the administrative processes in contrast
to the revenue yields are not made in most of the Customs administrations. The cost incurred per customs
declaration is not calculated since it is not used as an internal performance indicator, as indicated in one
reply. Nevertheless, one Customs administration appears to be active in analyzing cost efficiency and has
made cost assessments of customs declarations. The few countries that conduct annual reviews on the
administrative efficiency of duties and tax collection processes do not make separate estimates of the costs
of collecting revenue for small consignments. The need for simplification of customs clearance procedures
has been clearly recognized by some offices. Only one country refers to ongoing internal discussions on this
subject in the context of express carrier shipments.
2.3.3 Government letter campaign – Round 216
The purpose of our second questionnaire was to add to the information obtained from the Round 1
questionnaire. The second questionnaire sought, therefore, to obtain more detailed information with
numeric data, where available, on Customs annual budgets, Customs personnel, customs declarations,
customs clearance processes and so forth. The responses are summarized below for each topic area,
referring to more detailed information in annexes.
i. Data to calculate the "marginal cost per declaration" based on annual salary, annual working hours,
overhead multiplier, and working time spent per import.
The 14 responses reflect that the average annual working hours per customs employee varies across
countries, ranging between 1421 and 2080 hours. 13 countries have responded to the question on annual
cost per employee. While one respondent does not make such cost assessments, the others have been able
to give exact figures. These range between 10,000 – 35,000 EUR. With the exception of 2 countries, estimates
of the “overhead multiplier costs” per employee such as electricity, building maintenance, IT costs etc., do
not figure in these calculations. An accurate estimate on “overhead multiplier costs” is given by only one
country where 17% is added to the annual cost per customs employee to give the full real cost per employee.
15
See Bibliography for the details. 16
All details can be found at: ANNEX IV. Government letter campaign, Round 2
19
The other respondents do not answer this question or indicate they have no data and do not include these
costs in their estimates.
With respect to working times in processing import declarations, 7 countries have provided some data. When
both VAT and duty are due, the processing time in different countries ranges between 7 seconds and 30
minutes. No differences in processing times exist for several countries that apply the same procedures for
different cases (i.e. whether both duty and VAT are due, if only one of the two is due, or if neither of the two
are due). A couple of countries, however, indicated some differences for the different scenarios. The
processing of VAT payments takes about the same time as the processing of import declarations, although
slight differences exist for a few countries.
ii. Data on the cost for customs on establishing a new VAT/EORI record for each importer (in those
countries where it is mandatory even for "once per year importers")-
14 countries have responded. While the possession of a VAT/EORI number is mandatory in some countries, in
others it is not. From the 3 respondents who have given the exact time taken to generate this, it is seen that
this plays a limited role in terms of working time for customs administrations, on the basis that it takes only a
few seconds to a maximum of 3- 5 minutes.17
iii. Data on the “budget share of import declarations department" (even if such an organizational unit
does not exist per se).
We have 11 respondents but not all have been able to answer all the detailed sub-questions. Most of them
have been able to share data on the customs annual budget and the number of full-time employees in the
organization. Around half of these have customs and tax as one integrated office, where the customs division
appears to be of smaller size: 16-33% of the total staff are employed in the customs departments; and
around one third of the total annual budget is allocated for customs. Whether or not the offices are separate
or combined, not many administrations have been able to provide data on the number of employees
engaged in the processing of import declarations. From the limited data we received, one sees large
differences in the number of people employed in the customs departments. The smallest number provided is
370 and the largest is 5371. The other administrations fall within this band.
iv. Data to calculate from annual customs budget and total number of declarations a rough average
cost per declaration.
All the 11 respondents have shared detailed data on national customs budget. The maximum budget
allocated appears to be about 178 million EUR. 12 respondents have provided us the exact number of
customs declarations made in their countries, ranging between 46,600 and 18,185,575.
v. Data to include the VAT transfer cost between customs and tax into the "total cost per
declaration".
17
Note by the research team: However, this is likely to cover the generation of EORI only, and the complete process of registration is likely to take longer since it sometimes requires physical presence of applicant in the Customs office.
20
Only 2 countries have responded to this question. The cost associated with the transfer of import VAT to tax
administrations is inconsequential as they have established prudent systems, such as commonly operated
banking arrangements.
vi. Data on "which % of customs declarations requires partial or full manual intervention by customs".
12 countries have responded. Most of these countries have fully operating electronic systems in place, for
managing at least 90 percent of the import declarations, with two countries actually reaching 100%. A big
share of these import declarations requires no manual intervention. A couple of countries appear to be
lagging behind (7% and 55%). One Member State has no electronic system in place - all import declarations
are still manually processed.
vii. Data on the direct estimate by customs on the cost per declaration.
The average annual cost per declaration is not being calculated by most countries. The 2 respondents to this
question cite it to be about 0.06 EUR and 9.60 EUR respectively, excluding data management costs.
viii. Data on the IT-system and data communication costs to the "average cost per import declaration
for customs".
National administrations do not have an overview of data management and communication costs (IT, EDI
etc.), with the exception of a few. A rough estimate of 1.31 EUR per declaration for data management costs
has been given by 1 respondent. The second country estimates it at 0.06 EUR per declaration, excluding
infrastructure (IT-support, EDI-connection etc.). The third respondent declares the overall cost for IT systems/
ICS/AIS to be 119,177 EUR, which translates to 0.22 EUR per import declaration. With respect to data
communication cost per declaration, the cost declared by the 2 Member States are also minimal, i.e.
approximately 0. 17 EUR per import declaration.
ix. Data on mandatory fee(s) per declaration for the industry or for the importer.
We received 7 replies in total. Some of these countries do not impose any mandatory fees. Others claim not
to have any data available. One customs administration levies charges under special circumstances, e.g. when
operating beyond office hours or imposing special fees for veterinary and plant border controls etc.
x. Data to feed into calculation of "how many % of the revenue collected is gone as collection costs”.
All 15 respondents have covered this question. One of them has given data only on the excise revenue
collected. From all the replies, the maximum amount of import duties, import VAT and import excise duties
collected is 6.3 billion EUR, 8.8 billion EUR and 14.5 billion EUR, respectively. Not many answers cover data on
21
customs collected VAT from importers not in possession of an EORI number. From the few replies we
received, the maximum amount collected is approximately 453 million EUR. The percentage shares of the
estimates are small, ranging between 0.017% and 1.86% of the total amount of VAT collected by the customs
administrations.
xi. Data on clearance / release times (which in certain cases could be converted to "industry costs per
declaration").
From the 12 responses received, one country claims not to be making such assessments on customs
clearance and release times. The other data collected reflects strong disparities across the EU. While over
half of the import declarations are processed within 5 minutes in several Member States, there are countries
where the average clearance times run up to 1-2 hours.
xii. Data to improve our express import data analysis in countries where "VAT deferred accounts are in
common use".
We have 12 responses for this question from which a few claim not to have any data available; but it appears
that the possibility of VAT deferred accounts exists in most of the countries, which gave us data and many
importers avail of this option. The percentage shares of import declarations following this procedure range
between 0.5% and 85%. In fact, it is a standard practice in one Member State.
xiii. Data on "total imports of value under 1000 euros per EU member state", including all logistics
sectors.
11 countries have covered this question on the share of the 4 express carriers’ (TNT+ Fedex +DHL+UPS)
import declarations out of the total number of import declarations below shipment value of 1000 EUR. Most
of the respondents claim not to have any data at hand, while 4 have provided us with estimates that vary
between 12% and 47%.
xiv. Data to improve our estimates on "B2C% share of import declarations" (as this has an important
impact on the optimal de-minimis values per country).
Here we received 11 replies but only 5 of them have been able to give proper estimates on the share of
“private person” import declarations from the total number of import declarations below the shipment value
of 1000 EUR, as most countries do not measure this. The percentage shares range between 3.6% and 43.5%.
2.3.4 Discussions on the governmental data collection and analysis
22
As explained above, the research team made a major effort to collect cost related information and data
from Customs administrations across the 27 EU Member States: this information and data would feed into
the de-minimis economic model. Numerous attempts have been made by the researchers to analyse the
data in order to produce quantified estimates on “how much it costs for Customs administrations to
process import declarations in the context of small consignments”. However, the awareness of costs
specific to import declarations turned out to be quite moderate – this can be partially due to the multitude
of roles and responsibilities with the Customs administrations across EU as well as complicated processes
behind the execution of their tasks. In addition, when considering the high variation in cost figures provided
by some of the administrations, a decision was made to use harmonized, conservative values for Customs
costs in further de-minimis calculations. Using harmonized costs across the EU27 can be – to some extent –
justified with the observation that high income (GDP per capita) countries have typically high degree of
automation in place; while low income countries have typically a lower degree of automation in place. In
other words: high automation yields less (Customs officer) working time spent per import clearance in high
salary countries, whilst low automation yields more (Customs officer) working time spent per import
clearance in low salary countries. Finally, when looking at the literature provided at the beginning of this
chapter, the research team is confident that the cost numbers used in further de-minimis calculations are
conservative.
3 Collection and analysis of industry information and data
3.1 Overview The purpose of this chapter is to explain the process and main outcomes of industry information and data
collection and analysis, as a crucial part in the overall development of the de-minimis economic model. We
start with a brief literature review (Chapter 3.2) primarily for benchmarking purposes on the cost of
Customs compliance for economic operators – in particular for importers and logistics companies (Chapter
3.2.1). This is followed by a snapshot of import and export related fees and charges in postal supply chains -
publicly available data collected by our research team - again for benchmarking purposes (Chapter 3.2.2).
The collection and analysis of express carrier import data records is explained next (Chapter 3.3) which
includes: the key steps in the data collection itself (Chapter 3.3.1); the key steps in data record verification
and corrections (Chapter 3.3.2); and some graphs to visualize the import record profiles (Chapter 3.3.3).
The last sub-chapter summarizes other information and data collected from the express carriers (Chapter
3.4), feeding later into the de-minimis economic model.
3.2 Key findings from literature on cost of customs compliance and postal
benchmarking
3.2.1 Cost of Customs compliance
Customs compliance costs have been defined as “all costs borne by Customs payers in order to comply with
the Customs regulations and the Customs administration requirements. Customs compliance costs can be
divided into labor costs (of persons engaged in Customs compliance), non-labor costs (such as the costs of
Customs forms and declarations, workshops and technical literature) and psychological costs of Customs
payers” (Bronic, 2005, p.1).
23
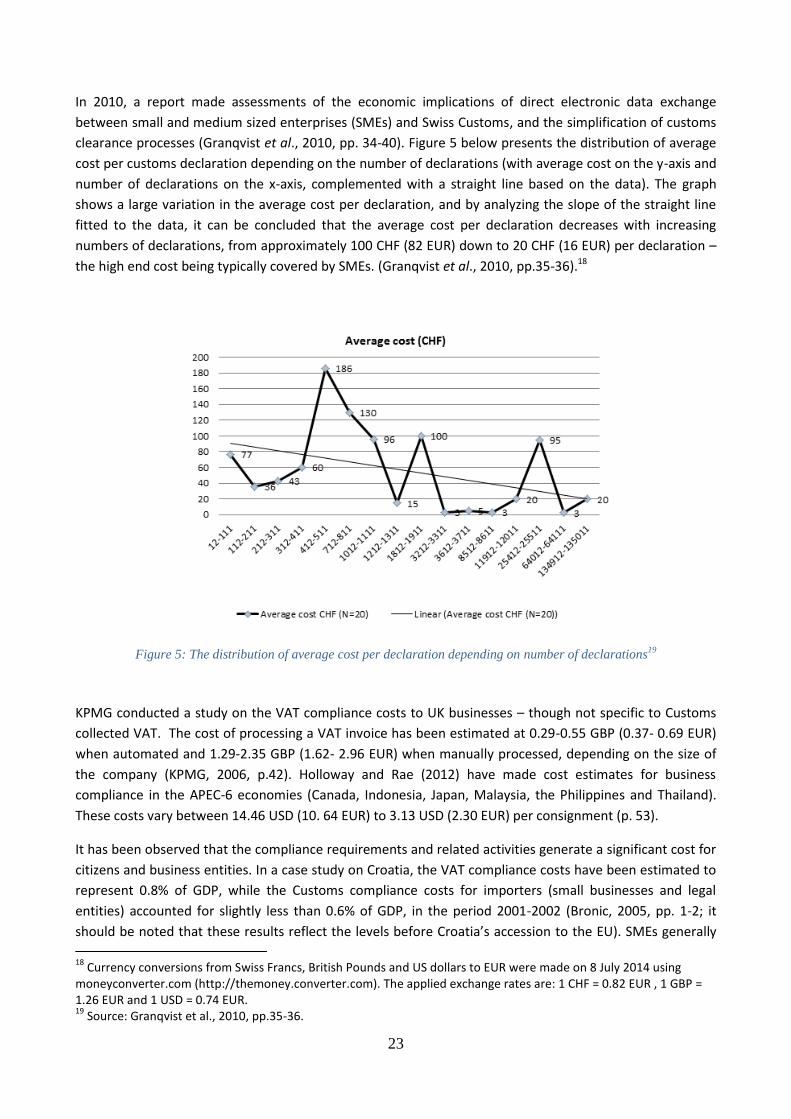
In 2010, a report made assessments of the economic implications of direct electronic data exchange
between small and medium sized enterprises (SMEs) and Swiss Customs, and the simplification of customs
clearance processes (Granqvist et al., 2010, pp. 34-40). Figure 5 below presents the distribution of average
cost per customs declaration depending on the number of declarations (with average cost on the y-axis and
number of declarations on the x-axis, complemented with a straight line based on the data). The graph
shows a large variation in the average cost per declaration, and by analyzing the slope of the straight line
fitted to the data, it can be concluded that the average cost per declaration decreases with increasing
numbers of declarations, from approximately 100 CHF (82 EUR) down to 20 CHF (16 EUR) per declaration –
the high end cost being typically covered by SMEs. (Granqvist et al., 2010, pp.35-36).18
Figure 5: The distribution of average cost per declaration depending on number of declarations19
KPMG conducted a study on the VAT compliance costs to UK businesses – though not specific to Customs
collected VAT. The cost of processing a VAT invoice has been estimated at 0.29-0.55 GBP (0.37- 0.69 EUR)
when automated and 1.29-2.35 GBP (1.62- 2.96 EUR) when manually processed, depending on the size of
the company (KPMG, 2006, p.42). Holloway and Rae (2012) have made cost estimates for business
compliance in the APEC-6 economies (Canada, Indonesia, Japan, Malaysia, the Philippines and Thailand).
These costs vary between 14.46 USD (10. 64 EUR) to 3.13 USD (2.30 EUR) per consignment (p. 53).
It has been observed that the compliance requirements and related activities generate a significant cost for
citizens and business entities. In a case study on Croatia, the VAT compliance costs have been estimated to
represent 0.8% of GDP, while the Customs compliance costs for importers (small businesses and legal
entities) accounted for slightly less than 0.6% of GDP, in the period 2001-2002 (Bronic, 2005, pp. 1-2; it
should be noted that these results reflect the levels before Croatia’s accession to the EU). SMEs generally
18
Currency conversions from Swiss Francs, British Pounds and US dollars to EUR were made on 8 July 2014 using moneyconverter.com (http://themoney.converter.com). The applied exchange rates are: 1 CHF = 0.82 EUR , 1 GBP = 1.26 EUR and 1 USD = 0.74 EUR. 19
Source: Granqvist et al., 2010, pp.35-36.
24
face a disproportionate burden of compliance costs associated with customs formalities. According to the
findings of an EU study, businesses with fewer than 250 employees shoulder 30-45 percent higher
transaction costs per consignment than larger firms (Walkenhorst and Yasui, 2003, quoted in Holloway and
Rae, 2012, p.40). This is largely due to the inability of smaller firms to profit from simplified customs
processes (Holloway and Rae, 2012, p.40).
Previous research efforts have quantified compliance costs for businesses. One such example is a study on
the total cost benefits of Customs reforms in the clearance processes for low-value consignments entering
the United States. The annual cost savings to express carriers and USPS (United States Postal Service) by
raising the de-minimis threshold to 800 USD (from the current 200 USD), is estimated at 56 million USD or
43 million EUR (Hufbauer and Wong, 2011b, pp. 10-11).
Compliance cost estimates also exist for Australia and the Russian Federation (Australian Parliament, 2012
& Gubin, 2011, p.101). According to the Australian Productivity Commission, businesses, consumers and
the government would bear a collective cost of approximately 1.4 billion EUR (2 billion AUD) in exchange
for 400 million EUR (578 million AUD) revenue generation, if the current low-value threshold of 1000 AUD
(692 EUR) was dismantled20 (Holloway and Rae, 2012, p. 44).
These studies point out the relevance of optimum de-minimis thresholds and the simplification of Customs
processes as central issues for removing logistics barriers and facilitating cross-border trade and logistics,
particularly in the context of small consignments. As these previous studies are very limited in EU coverage,
this study at hand is important in providing an assessment of the situation in the EU.
3.2.2 Postal sector import fees and charges
Postal operators in the EU Member States and in neighbouring countries charge various import process
service fees. The fee structures, criteria and levels present significant variation between countries. Charge
structures are based on different dimensions, such as importer (Hungary), shipper (Hungary), product
imported (Switzerland), shipment value (Austria), duty amount (Germany), tasks performed by Customs
(Norway), and transportation service (the UK). With such a variety of structures, a meaningful comparison
of charges and fees is difficult to perform, but certain differences are evident. Within the EU, Sweden and
UK charge higher fees (10.99 EUR and 16.95 EUR respectively), while in many other countries the fees
remain below 10 EUR. On the other hand, in Norway the fees are significantly higher. Customs clearance
and import processing fees show significant variation, from the low of 6.6 EUR in Czech Republic to 33 EUR
in neighbouring Hungary. While such differences in fees and charges are more likely to reflect
administrative heritage rather than real market and cost variation, examination of the structures and fee
levels provides an important benchmark into the further analysis of optimal de-minimis levels.
3.3 Information and data collection from the express carriers
3.3.1 Import data record collection process
20
Currency conversions from Australian and US dollars to EUR were made on 8 July 2014 using moneyconverter.com (http://themoney.converter.com). The applied exchange rate is: 1 AUD = 0.69 EUR & 1 USD = 0.74 EUR
25
Import data records from the four express carriers form a crucial component of the whole de-minimis study
and the economic model. The data record collection process started in April 2013 and was finalized in
December 2013. Four selection criteria were identified: large import volumes; data quality and accessibility;
inclusion of some smaller countries; and a minimum of eight countries. Regarding the time-period, a
request was made to receive data for each carrier-country combination for a 24 month period from January
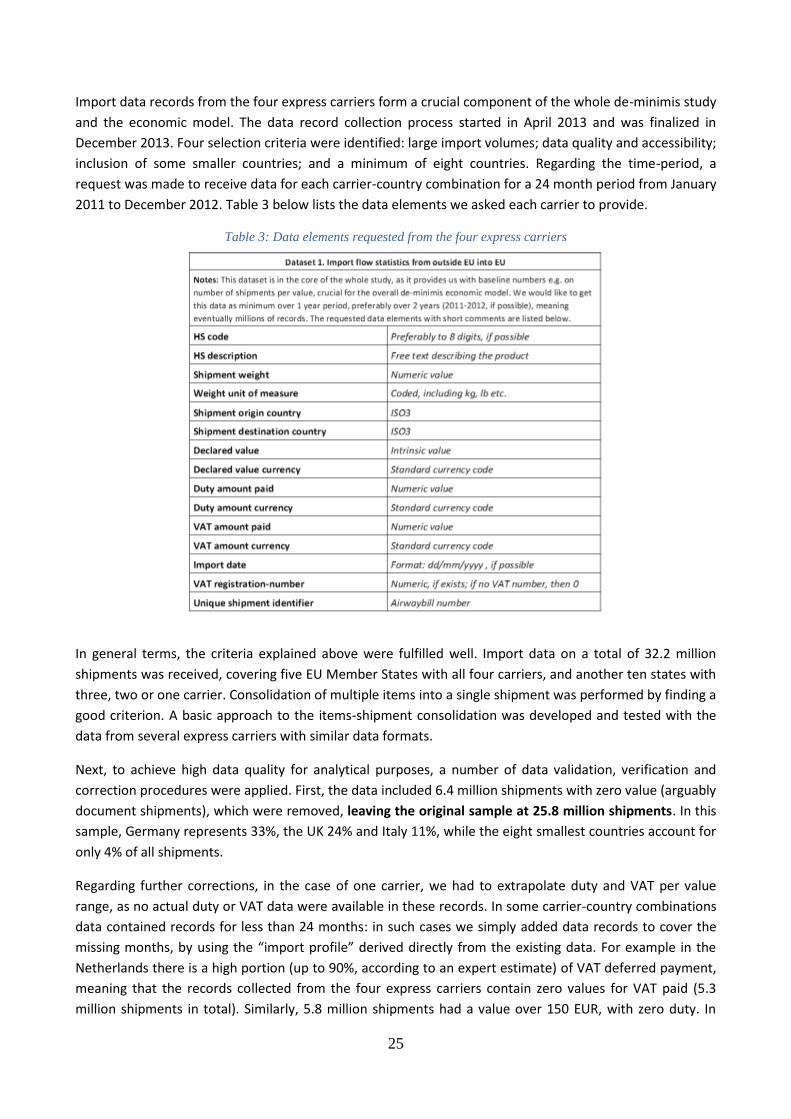
2011 to December 2012. Table 3 below lists the data elements we asked each carrier to provide.
Table 3: Data elements requested from the four express carriers
In general terms, the criteria explained above were fulfilled well. Import data on a total of 32.2 million
shipments was received, covering five EU Member States with all four carriers, and another ten states with
three, two or one carrier. Consolidation of multiple items into a single shipment was performed by finding a
good criterion. A basic approach to the items-shipment consolidation was developed and tested with the
data from several express carriers with similar data formats.
Next, to achieve high data quality for analytical purposes, a number of data validation, verification and
correction procedures were applied. First, the data included 6.4 million shipments with zero value (arguably
document shipments), which were removed, leaving the original sample at 25.8 million shipments. In this
sample, Germany represents 33%, the UK 24% and Italy 11%, while the eight smallest countries account for
only 4% of all shipments.
Regarding further corrections, in the case of one carrier, we had to extrapolate duty and VAT per value
range, as no actual duty or VAT data were available in these records. In some carrier-country combinations
data contained records for less than 24 months: in such cases we simply added data records to cover the
missing months, by using the “import profile” derived directly from the existing data. For example in the
Netherlands there is a high portion (up to 90%, according to an expert estimate) of VAT deferred payment,
meaning that the records collected from the four express carriers contain zero values for VAT paid (5.3
million shipments in total). Similarly, 5.8 million shipments had a value over 150 EUR, with zero duty. In
26
contrast, 1.7 million shipments showed a value below 150 EUR and duty greater than zero. There were also
7.0 million records with shipment values under 22 EUR and VAT values greater than 0 EUR, which should be
rare, except in such countries where VAT de-minimis is less than 22 EUR, or perhaps with some products /
HS codes where de-minimis rules do not apply.
Lastly, we identified 184,000 abnormal records and 24 outlier values. Such records have been either
corrected or removed. As indicated before, the total number of removed records is 6.4 million so the final
master database after corrections has 27.8 million records, including 2.0 million records that were added
to complement those countries with less than 24 months of data.21
Finally, for analytical purposes, the shipment data were then divided into 99 intervals – or, value ranges -
depending on the shipment value. For example interval 20-30 holds shipments with values between 20 and
30 EUR inclusively; interval 30-40 holds shipments with values between 30 and 40 EUR inclusively, and so
on up to interval 990-1000.22 In the next sub-chapter four graphs are presented to visualize the import data
characteristics; each graph having the value ranges along the x-axis.
3.3.2 Import data profiles
The industry data from the four express carriers over the two year time period can be summarized with the
help of six graphs, presented in Figures 6 to 11 below.
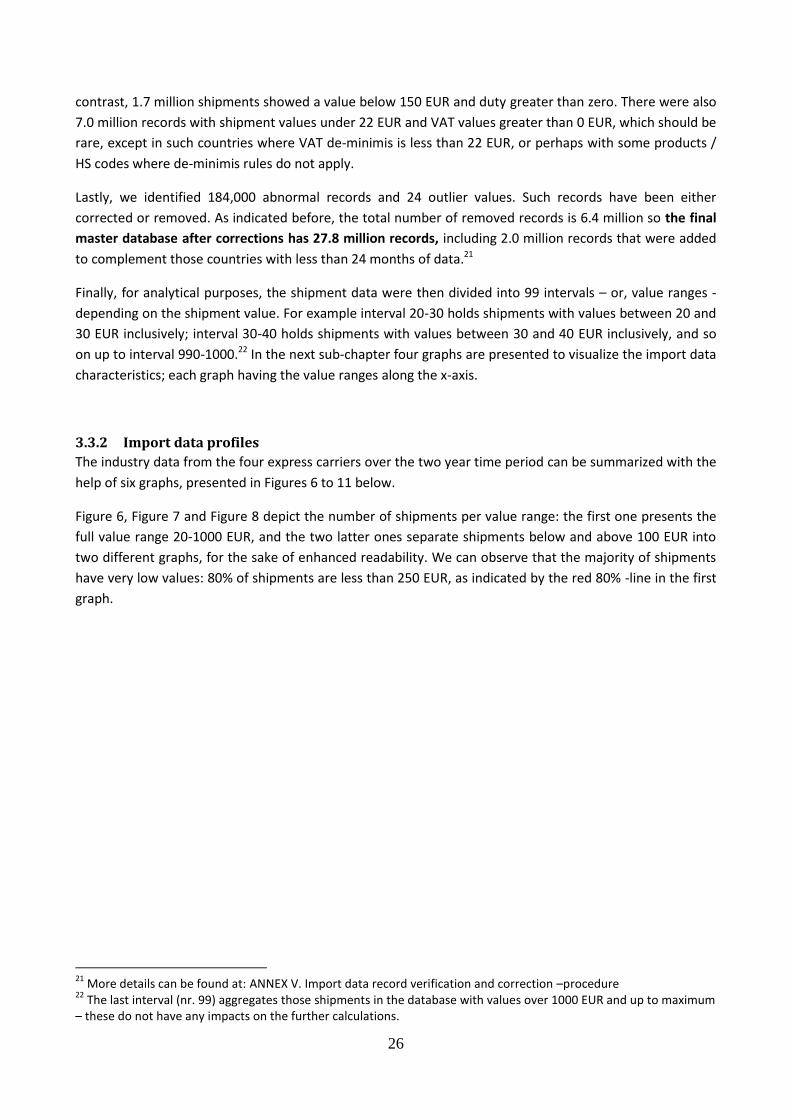
Figure 6, Figure 7 and Figure 8 depict the number of shipments per value range: the first one presents the
full value range 20-1000 EUR, and the two latter ones separate shipments below and above 100 EUR into
two different graphs, for the sake of enhanced readability. We can observe that the majority of shipments
have very low values: 80% of shipments are less than 250 EUR, as indicated by the red 80% -line in the first
graph.
21
More details can be found at: ANNEX V. Import data record verification and correction –procedure 22
The last interval (nr. 99) aggregates those shipments in the database with values over 1000 EUR and up to maximum – these do not have any impacts on the further calculations.
27
Figure 6: Number of shipments per value range (over two years)
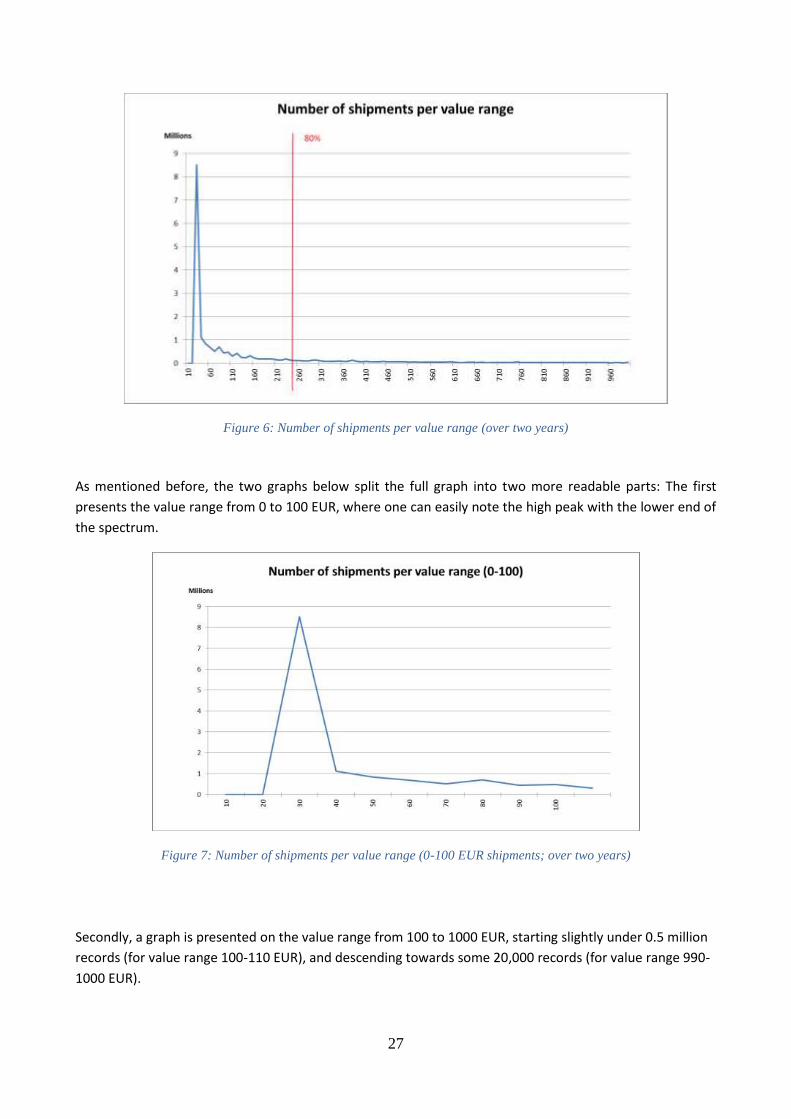
As mentioned before, the two graphs below split the full graph into two more readable parts: The first
presents the value range from 0 to 100 EUR, where one can easily note the high peak with the lower end of
the spectrum.
Figure 7: Number of shipments per value range (0-100 EUR shipments; over two years)
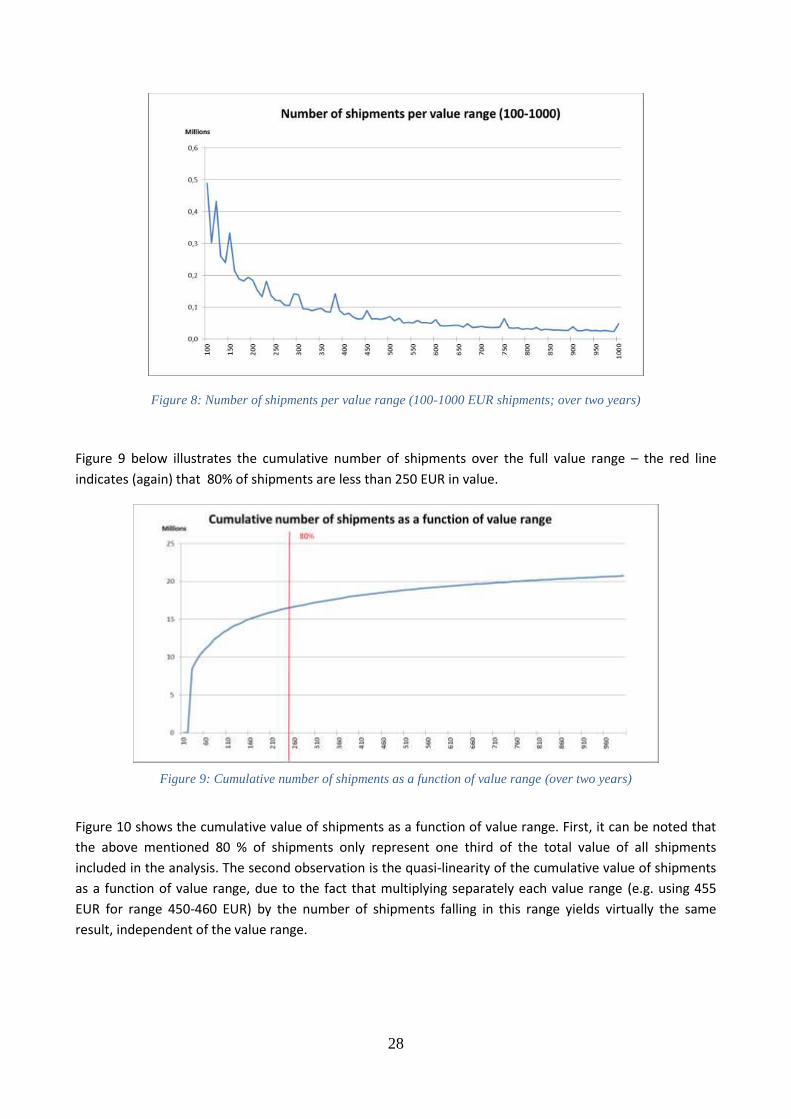
Secondly, a graph is presented on the value range from 100 to 1000 EUR, starting slightly under 0.5 million
records (for value range 100-110 EUR), and descending towards some 20,000 records (for value range 990-
1000 EUR).
28
Figure 8: Number of shipments per value range (100-1000 EUR shipments; over two years)
Figure 9 below illustrates the cumulative number of shipments over the full value range – the red line
indicates (again) that 80% of shipments are less than 250 EUR in value.
Figure 9: Cumulative number of shipments as a function of value range (over two years)
Figure 10 shows the cumulative value of shipments as a function of value range. First, it can be noted that
the above mentioned 80 % of shipments only represent one third of the total value of all shipments
included in the analysis. The second observation is the quasi-linearity of the cumulative value of shipments
as a function of value range, due to the fact that multiplying separately each value range (e.g. using 455
EUR for range 450-460 EUR) by the number of shipments falling in this range yields virtually the same
result, independent of the value range.
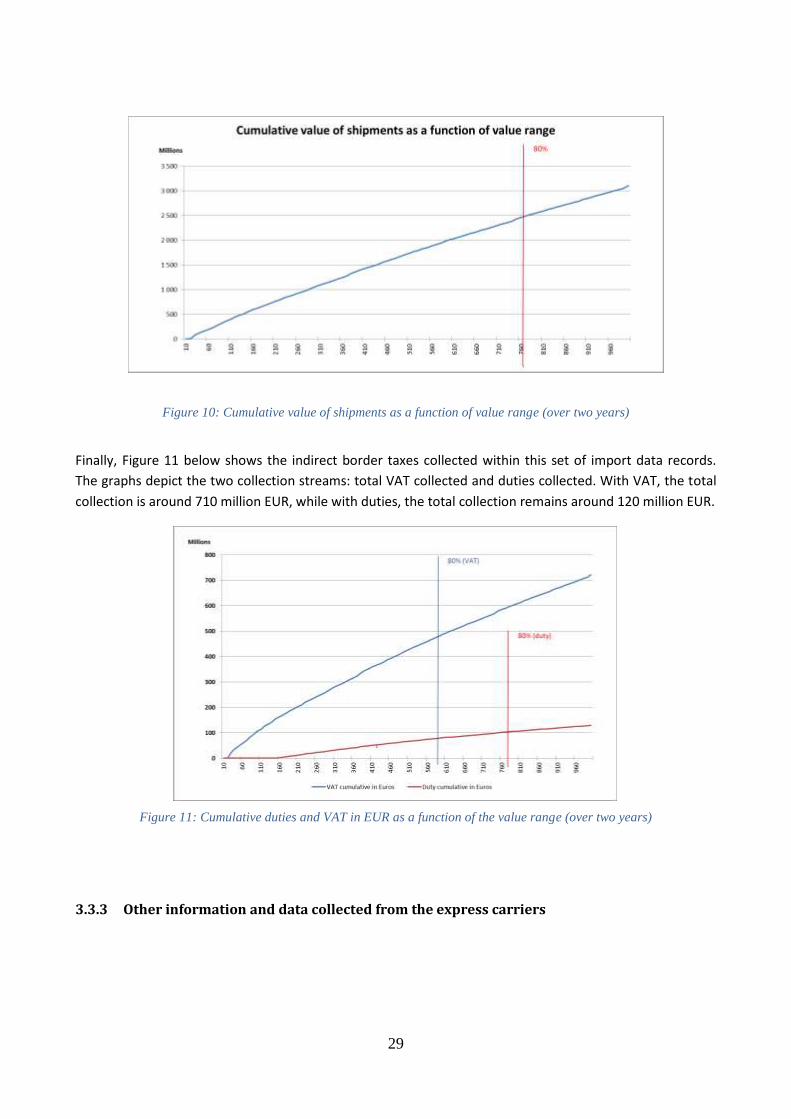
29
Figure 10: Cumulative value of shipments as a function of value range (over two years)
Finally, Figure 11 below shows the indirect border taxes collected within this set of import data records.
The graphs depict the two collection streams: total VAT collected and duties collected. With VAT, the total
collection is around 710 million EUR, while with duties, the total collection remains around 120 million EUR.
Figure 11: Cumulative duties and VAT in EUR as a function of the value range (over two years)
3.3.3 Other information and data collected from the express carriers
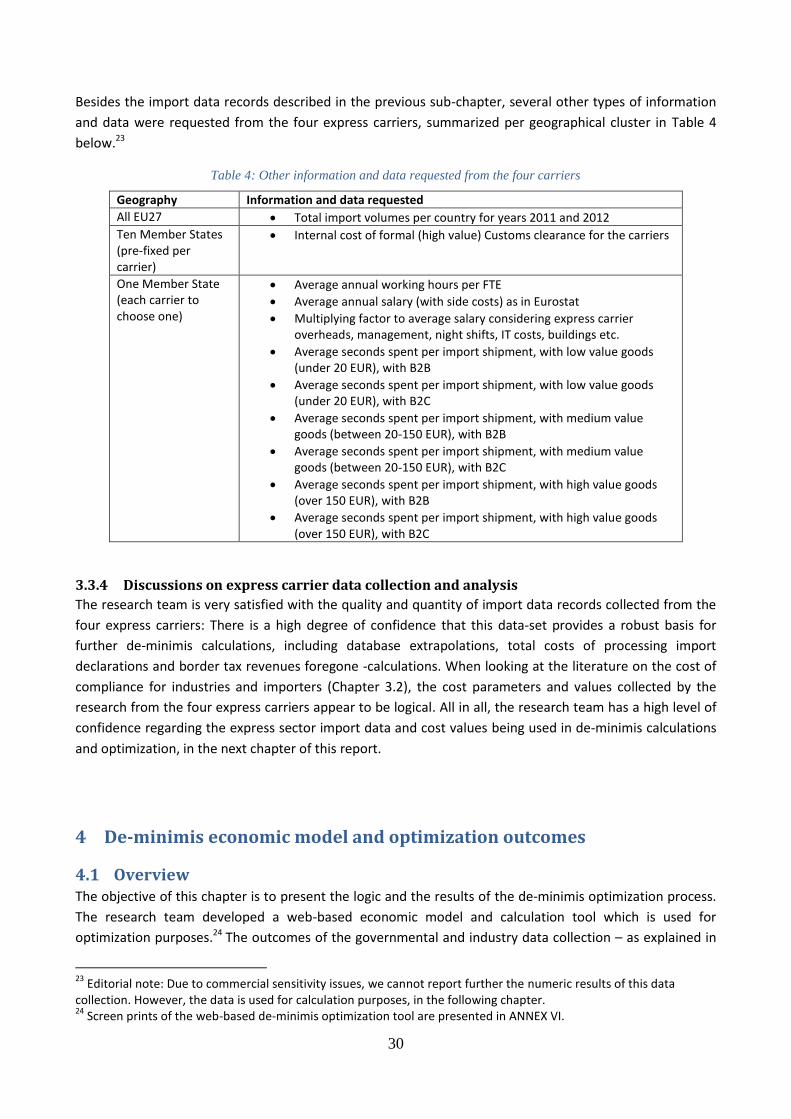
30
Besides the import data records described in the previous sub-chapter, several other types of information
and data were requested from the four express carriers, summarized per geographical cluster in Table 4
below.23
Table 4: Other information and data requested from the four carriers
Geography Information and data requested
All EU27 Total import volumes per country for years 2011 and 2012
Ten Member States (pre-fixed per carrier)
Internal cost of formal (high value) Customs clearance for the carriers
One Member State (each carrier to choose one)
Average annual working hours per FTE
Average annual salary (with side costs) as in Eurostat
Multiplying factor to average salary considering express carrier overheads, management, night shifts, IT costs, buildings etc.
Average seconds spent per import shipment, with low value goods (under 20 EUR), with B2B
Average seconds spent per import shipment, with low value goods (under 20 EUR), with B2C
Average seconds spent per import shipment, with medium value goods (between 20-150 EUR), with B2B
Average seconds spent per import shipment, with medium value goods (between 20-150 EUR), with B2C
Average seconds spent per import shipment, with high value goods (over 150 EUR), with B2B
Average seconds spent per import shipment, with high value goods (over 150 EUR), with B2C
3.3.4 Discussions on express carrier data collection and analysis
The research team is very satisfied with the quality and quantity of import data records collected from the
four express carriers: There is a high degree of confidence that this data-set provides a robust basis for
further de-minimis calculations, including database extrapolations, total costs of processing import
declarations and border tax revenues foregone -calculations. When looking at the literature on the cost of
compliance for industries and importers (Chapter 3.2), the cost parameters and values collected by the
research from the four express carriers appear to be logical. All in all, the research team has a high level of
confidence regarding the express sector import data and cost values being used in de-minimis calculations
and optimization, in the next chapter of this report.
4 De-minimis economic model and optimization outcomes
4.1 Overview The objective of this chapter is to present the logic and the results of the de-minimis optimization process.
The research team developed a web-based economic model and calculation tool which is used for
optimization purposes.24 The outcomes of the governmental and industry data collection – as explained in
23
Editorial note: Due to commercial sensitivity issues, we cannot report further the numeric results of this data collection. However, the data is used for calculation purposes, in the following chapter. 24
Screen prints of the web-based de-minimis optimization tool are presented in ANNEX VI.
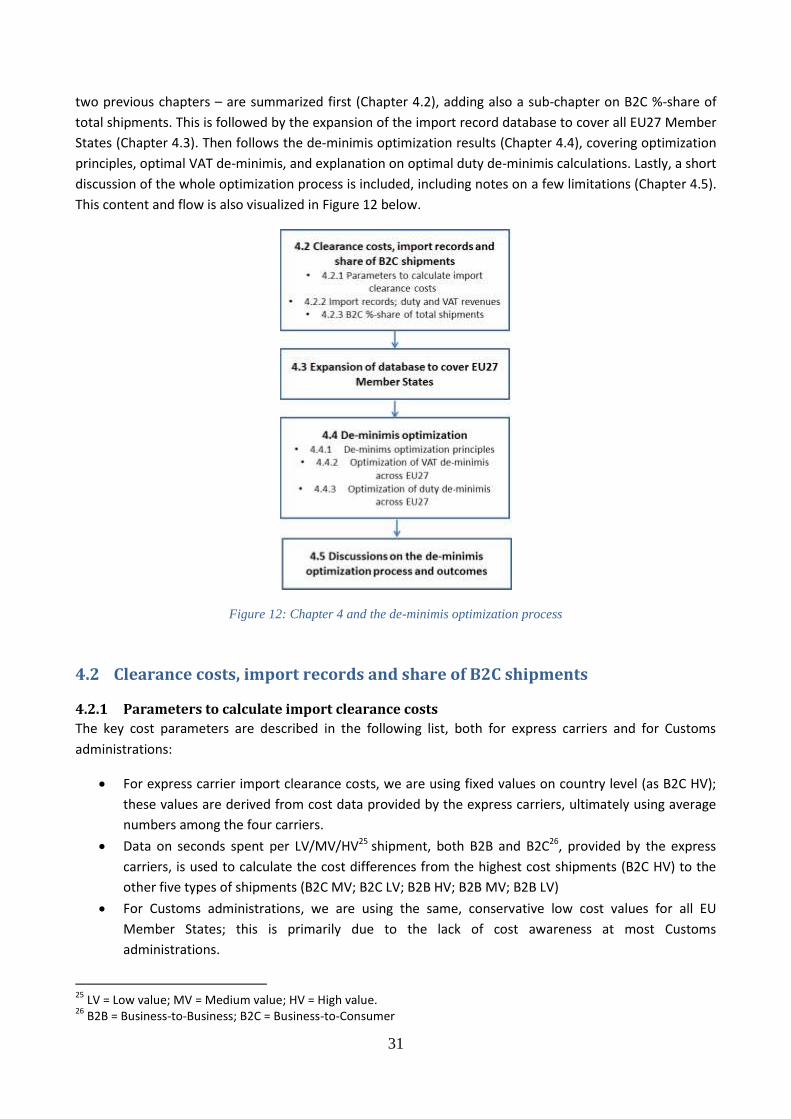
31
two previous chapters – are summarized first (Chapter 4.2), adding also a sub-chapter on B2C %-share of
total shipments. This is followed by the expansion of the import record database to cover all EU27 Member
States (Chapter 4.3). Then follows the de-minimis optimization results (Chapter 4.4), covering optimization
principles, optimal VAT de-minimis, and explanation on optimal duty de-minimis calculations. Lastly, a short
discussion of the whole optimization process is included, including notes on a few limitations (Chapter 4.5).
This content and flow is also visualized in Figure 12 below.
Figure 12: Chapter 4 and the de-minimis optimization process
4.2 Clearance costs, import records and share of B2C shipments
4.2.1 Parameters to calculate import clearance costs
The key cost parameters are described in the following list, both for express carriers and for Customs
administrations:
For express carrier import clearance costs, we are using fixed values on country level (as B2C HV);
these values are derived from cost data provided by the express carriers, ultimately using average
numbers among the four carriers.
Data on seconds spent per LV/MV/HV25 shipment, both B2B and B2C26, provided by the express
carriers, is used to calculate the cost differences from the highest cost shipments (B2C HV) to the
other five types of shipments (B2C MV; B2C LV; B2B HV; B2B MV; B2B LV)
For Customs administrations, we are using the same, conservative low cost values for all EU
Member States; this is primarily due to the lack of cost awareness at most Customs
administrations.
25
LV = Low value; MV = Medium value; HV = High value. 26
B2B = Business-to-Business; B2C = Business-to-Consumer
32
Limited data on seconds spent per LV/MV/HV shipment, both B2B and B2C, provided by some
Customs administrations, is used to calculate the cost differences from the highest cost shipments
(B2C HV) to the other five types of shipments
4.2.2 Import records; duty and VAT revenues
As explained in Chapter 3, we collected data covering a total of 25.8 million shipments over a 2 year period,
over five EU Member States, with all four carriers, and another ten states with three, two or one carrier.
We calculated the duties and VAT collected per 10 EUR value range, and visualized the import record
profiles with various graphs (Chapter 3). This unique dataset is first used as a robust basis for the database
extrapolation, followed by de-minimis optimization, as explained in the coming sub-chapters of this report.
4.2.3 B2C %-share of total shipments
The numeric values for the %-share of B2C shipments from all shipments is based on data collected from
the express carriers - in particular on VAT/EORI numbers (available versus not available in data records) and
residential versus non-residential addresses - and from the EU Customs administrations. Based on the data
collection outcomes, we have used a range of best estimations, starting with higher estimate of B2C
shipments at the low end (20-30 EUR), and finishing with a lower estimate share of at the high end (990-
1000 EUR). The share is assumed to descend linearly between these two extremes across the total value
range. This forms an important parameter for the calculations, as only B2C import VAT is to be considered
as “lost VAT revenue” in the case that de-minimis levels for VAT would be increased.
4.3 Expansion of database to cover EU27 Member States As we were able to collect import data records from all four express carriers in five EU Member States, this
became our first database. Next to that, we have partial data – with one to three carriers – from ten more
Member States, and no data from twelve Member States.27 This calls for extrapolation techniques in order
to produce our second database titled “DB-EU27”. The extrapolation process is described briefly as follows:
DB-EU27-A is built on the basis of the number of people using e-commerce buying from outside the
EU. In this procedure the total number of shipments per country where the data from one or more
of the four express carriers were missing, is complemented as follows:
o On the first step an average index is calculated with the five countries where full data is
available.
o Then the number of shipments per country is calculated as a multiplication of the index and
the number of people using e-commerce buying from third countries.
o Then an extrapolation multiplier is produced as a ratio of the number of shipments per
country and the total number of shipments from import records with non-zero value. This
multiplier is used for extrapolation of shipment values, duty and VAT revenues from the
global data profile per shipment value range.
27
The reason for not having all import records from all carries and all Member States is that this data collection was constrained due to (i) limited technical access to old data records; (ii) tight project schedule; and (iii) relatively high cost of data collection.
33
Next, the DB-EU27-B database is built on the basis of total import values per country, following the
same procedure as DB-EU27-A; the only difference being to swap the “number of people per
country using e-commerce buying from outside EU” with “total import value per country”.28
Finally, average values of DB-EU27-A and DB-EU27-B are produced as a simple average of the two,
this becoming our DB-EU27 database used in further de-minimis calculations.
This process produced the main database – DB-EU27 - used for the de-minimis optimization, as explained in
the next sub-chapter.
4.4 De-minimis optimization
4.4.1 De-minims optimization principles
In this sub-chapter we provide a simplified description of the de-minimis economic model, in the format of
a nine-step calculation description.29
i. Express carrier and Customs working time spent in one year for small consignments are calculated for LV, MV and HV.
ii. Full-time equivalent (FTE) salary costs of express carriers and Customs are calculated per shipment value range.
iii. Government balance with duty only is calculated per shipment value range as a difference between the salary cost of Customs and duty revenue.
iv. Government balance with the net effect on VAT only is calculated per shipment value range as a difference between the salary cost of Customs and VAT revenue. The percentage of VAT effect is calculated as a B2C% share from the total VAT.
v. Government balance with duty and the net effect on VAT is calculated per shipment value range as a difference between the salary costs of Customs and the sum of duty revenue and final B2C VAT revenue.
vi. Government and express carriers' balance with duty only is calculated per shipment value range as the sum of (v) and the salary costs of express carriers from (ii).
vii. Government and express carriers' balance with the net effect on VAT only is calculated per shipment value interval as a sum of (iv) and the salary costs of express carriers from (ii).
viii. Government and express carriers' balance with duty and the net effect on VAT is calculated per shipment value interval as the sum of (v) and salary cost of express carriers from (ii) plus the fixed cost per shipment both from express carriers and Customs.
ix. Cumulative government and express carriers' balance with duty and the net effect on VAT is calculated.
Lastly, the optimum de-minimis is determined as a maximum of cumulative government and express
carriers' balance with duty and the net effect on VAT, which is in the form of an inverted u-shape curve,
where the optimal value will be found at the top of the curve.
4.4.2 Optimization of VAT de-minimis across EU27
The results of the de-minimis optimization are shown in the box below:
28
EUROSTAT statistics of year 2012 was used for these DB-EU27-A and DB-EU27-B extrapolations. http://epp.eurostat.ec.europa.eu/portal/page/portal/eurostat/home/ 29
ANNEX VII contains detailed calculation formulas for the de-minimis economic model and calculation tool.
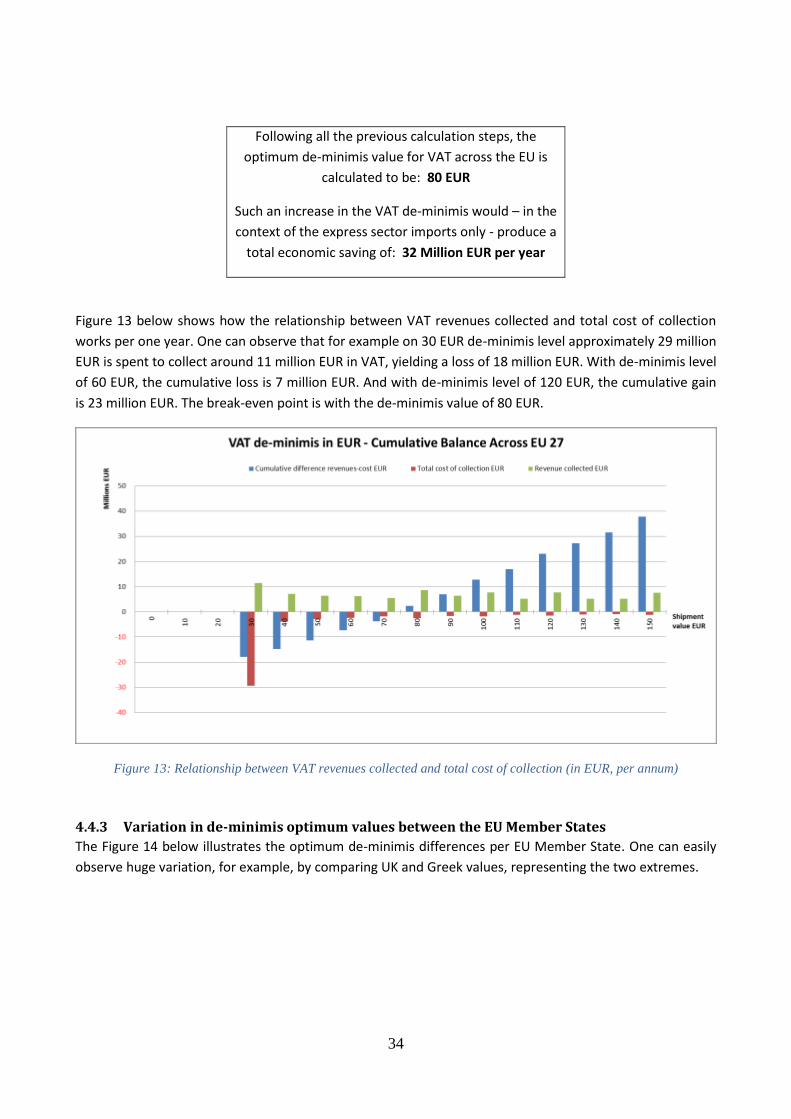
34
Following all the previous calculation steps, the
optimum de-minimis value for VAT across the EU is
calculated to be: 80 EUR
Such an increase in the VAT de-minimis would – in the
context of the express sector imports only - produce a
total economic saving of: 32 Million EUR per year
Figure 13 below shows how the relationship between VAT revenues collected and total cost of collection
works per one year. One can observe that for example on 30 EUR de-minimis level approximately 29 million
EUR is spent to collect around 11 million EUR in VAT, yielding a loss of 18 million EUR. With de-minimis level
of 60 EUR, the cumulative loss is 7 million EUR. And with de-minimis level of 120 EUR, the cumulative gain
is 23 million EUR. The break-even point is with the de-minimis value of 80 EUR.
Figure 13: Relationship between VAT revenues collected and total cost of collection (in EUR, per annum)
4.4.3 Variation in de-minimis optimum values between the EU Member States
The Figure 14 below illustrates the optimum de-minimis differences per EU Member State. One can easily
observe huge variation, for example, by comparing UK and Greek values, representing the two extremes.
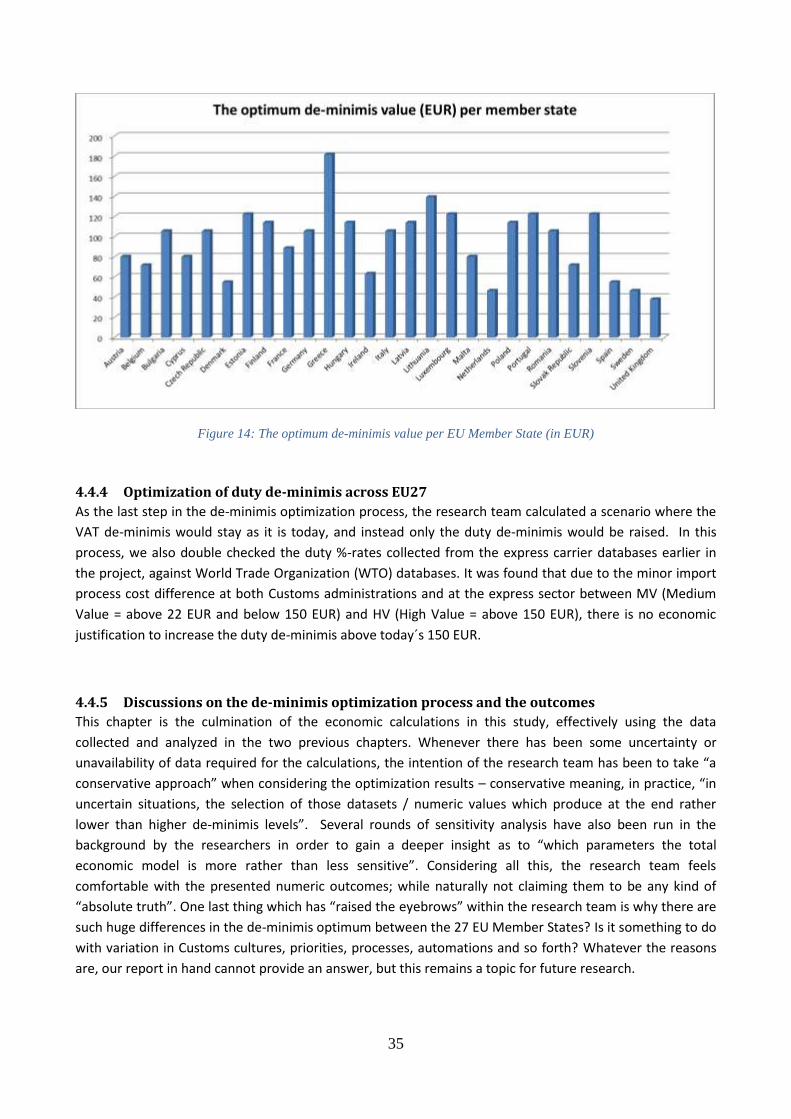
35
Figure 14: The optimum de-minimis value per EU Member State (in EUR)
4.4.4 Optimization of duty de-minimis across EU27
As the last step in the de-minimis optimization process, the research team calculated a scenario where the
VAT de-minimis would stay as it is today, and instead only the duty de-minimis would be raised. In this
process, we also double checked the duty %-rates collected from the express carrier databases earlier in
the project, against World Trade Organization (WTO) databases. It was found that due to the minor import
process cost difference at both Customs administrations and at the express sector between MV (Medium
Value = above 22 EUR and below 150 EUR) and HV (High Value = above 150 EUR), there is no economic
justification to increase the duty de-minimis above today´s 150 EUR.
4.4.5 Discussions on the de-minimis optimization process and the outcomes
This chapter is the culmination of the economic calculations in this study, effectively using the data
collected and analyzed in the two previous chapters. Whenever there has been some uncertainty or
unavailability of data required for the calculations, the intention of the research team has been to take “a
conservative approach” when considering the optimization results – conservative meaning, in practice, “in
uncertain situations, the selection of those datasets / numeric values which produce at the end rather
lower than higher de-minimis levels”. Several rounds of sensitivity analysis have also been run in the
background by the researchers in order to gain a deeper insight as to “which parameters the total
economic model is more rather than less sensitive”. Considering all this, the research team feels
comfortable with the presented numeric outcomes; while naturally not claiming them to be any kind of
“absolute truth”. One last thing which has “raised the eyebrows” within the research team is why there are
such huge differences in the de-minimis optimum between the 27 EU Member States? Is it something to do
with variation in Customs cultures, priorities, processes, automations and so forth? Whatever the reasons
are, our report in hand cannot provide an answer, but this remains a topic for future research.
36
5 Consumer behaviour study
5.1 Overview When consumers make purchase decisions, they rely on a broad set of factors. These factors are product
characteristics, such as brand, quality, and price, but also product related factors, such as delivery time,
charges for duty and tax, or dealer reputation. The purpose of this chapter is to examine the relevance of
different purchase criteria for consumers’ purchase decisions. Specifically, this chapter aims at analyzing
utility values of relevant purchase criteria in international transactions of consumer goods, and in
particular, what would be the impact of changes in de-minimis levels of duty and VAT. To achieve this goal,
the research team conducted a study among a sample of young consumers prone to use e-commerce. The
study consisted of two parts: a conjoint study as a traditional research approach in utility value studies and
a questionnaire-based consumer survey. First, we explain the empirical study (Chapter 5.2), followed then
by the results (Chapter 5.3).
5.2 Empirical study30 The conjoint study aims to determine what combination of product characteristics is most influential on
respondents’ decision making. In this part of the study, two product categories were selected based on
three relevant criteria: (1) perceived risk, (2) product familiarity, and (3) product involvement. Consumers'
purchasing decisions build upon a variety of factors. Three prominent factors involve perceived risk, that is,
the probability of making a wrong purchase decision because the product will not work properly and will
cause “hidden” costs; product familiarity, that is, the extent to which a consumer has prior experience with
and knowledge about a product; and product involvement, that is, the extent to which a specific product
has importance for a consumer. The criteria can serve as dimensions of a property space in which product
categories may be placed. To substantiate the external validity of this part of the study, two product
categories were selected: chargers and digital cameras. These product categories are not the most traded
goods online, but they differ by the three criteria and thus form a broader empirical basis for valid, reliable
results.
For both products, lists of attributes and attribute levels were developed based on two scenarios: an
increase of the de-minimis level to 40 EUR in the mobile charger category and an increase of the de-
minimis level to 200 EUR in the digital camera category. The values are tied to the product price. In both
scenarios, and from a consumer perspective, the major implication would be the withdrawal of charges for
duty and tax for corresponding products, when ordering from non-EU online shops. Hence, the conjoint
analysis addressed two main research questions:
(1) Do charges for duty and tax have an influence on consumers’ purchase decisions in general?
(2) How important are charges for duty and tax relative to other purchase decision criteria?
The second part of the study included an online survey. The primary objective of the survey is to capture
respondents’ views on global consumption, their consumption behaviour as well as their primary
experiences with the aforementioned product categories. Thus, the online survey provides a more detailed
understanding of consumers’ purchasing behaviours.
30
See ANNEX VIII for Screenshots for the consumer study (conjoint and survey)
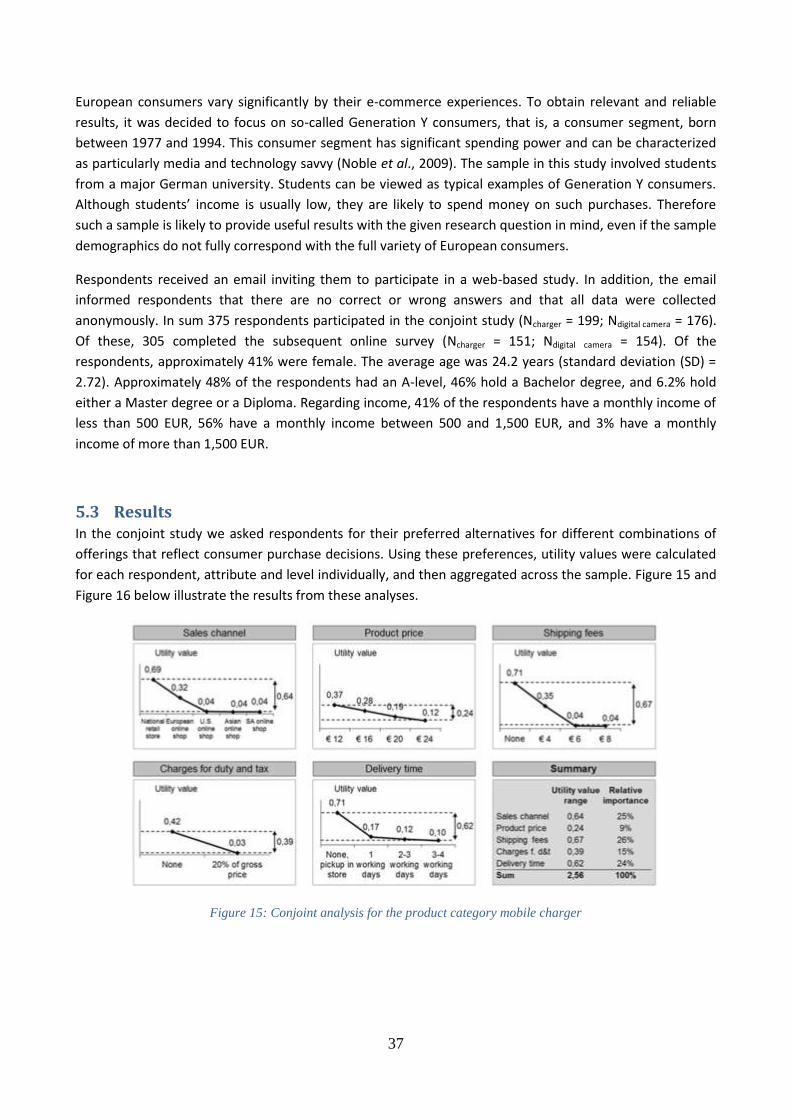
37
European consumers vary significantly by their e-commerce experiences. To obtain relevant and reliable
results, it was decided to focus on so-called Generation Y consumers, that is, a consumer segment, born
between 1977 and 1994. This consumer segment has significant spending power and can be characterized
as particularly media and technology savvy (Noble et al., 2009). The sample in this study involved students
from a major German university. Students can be viewed as typical examples of Generation Y consumers.
Although students’ income is usually low, they are likely to spend money on such purchases. Therefore
such a sample is likely to provide useful results with the given research question in mind, even if the sample
demographics do not fully correspond with the full variety of European consumers.
Respondents received an email inviting them to participate in a web-based study. In addition, the email
informed respondents that there are no correct or wrong answers and that all data were collected
anonymously. In sum 375 respondents participated in the conjoint study (Ncharger = 199; Ndigital camera = 176).
Of these, 305 completed the subsequent online survey (Ncharger = 151; Ndigital camera = 154). Of the
respondents, approximately 41% were female. The average age was 24.2 years (standard deviation (SD) =
2.72). Approximately 48% of the respondents had an A-level, 46% hold a Bachelor degree, and 6.2% hold
either a Master degree or a Diploma. Regarding income, 41% of the respondents have a monthly income of
less than 500 EUR, 56% have a monthly income between 500 and 1,500 EUR, and 3% have a monthly
income of more than 1,500 EUR.
5.3 Results In the conjoint study we asked respondents for their preferred alternatives for different combinations of
offerings that reflect consumer purchase decisions. Using these preferences, utility values were calculated
for each respondent, attribute and level individually, and then aggregated across the sample. Figure 15 and
Figure 16 below illustrate the results from these analyses.
Figure 15: Conjoint analysis for the product category mobile charger
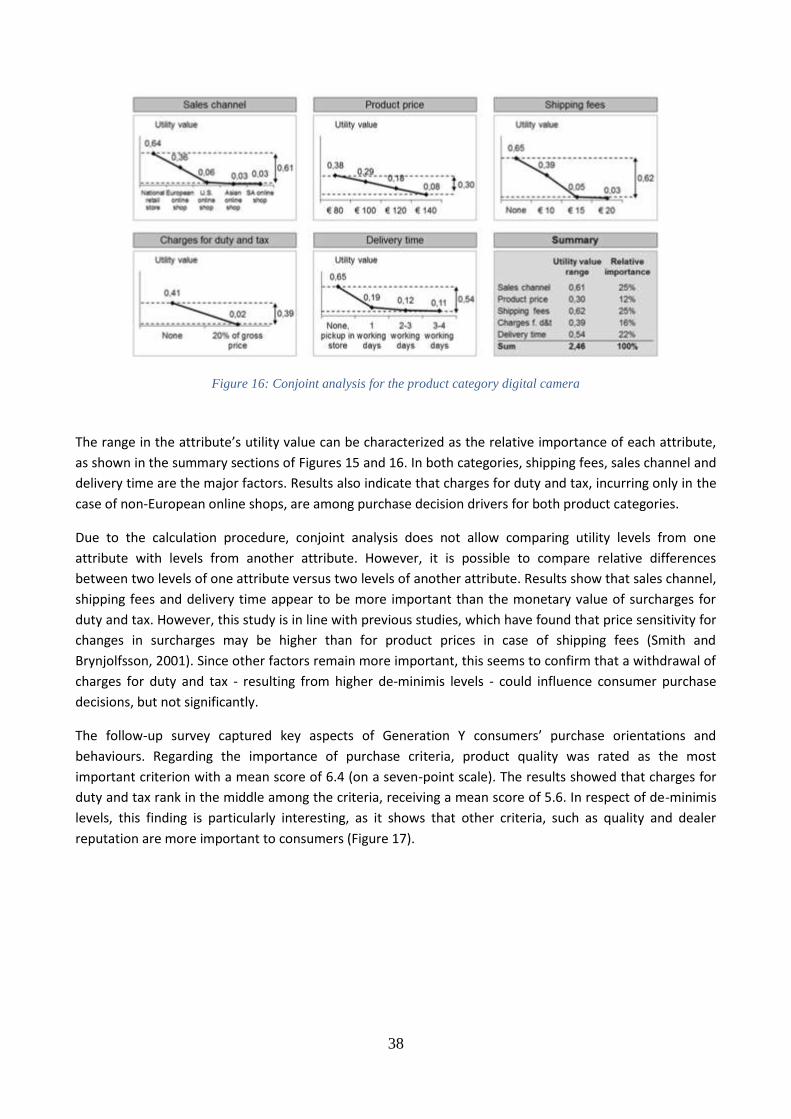
38
Figure 16: Conjoint analysis for the product category digital camera
The range in the attribute’s utility value can be characterized as the relative importance of each attribute,
as shown in the summary sections of Figures 15 and 16. In both categories, shipping fees, sales channel and
delivery time are the major factors. Results also indicate that charges for duty and tax, incurring only in the
case of non-European online shops, are among purchase decision drivers for both product categories.
Due to the calculation procedure, conjoint analysis does not allow comparing utility levels from one
attribute with levels from another attribute. However, it is possible to compare relative differences
between two levels of one attribute versus two levels of another attribute. Results show that sales channel,
shipping fees and delivery time appear to be more important than the monetary value of surcharges for
duty and tax. However, this study is in line with previous studies, which have found that price sensitivity for
changes in surcharges may be higher than for product prices in case of shipping fees (Smith and
Brynjolfsson, 2001). Since other factors remain more important, this seems to confirm that a withdrawal of
charges for duty and tax - resulting from higher de-minimis levels - could influence consumer purchase
decisions, but not significantly.
The follow-up survey captured key aspects of Generation Y consumers’ purchase orientations and
behaviours. Regarding the importance of purchase criteria, product quality was rated as the most
important criterion with a mean score of 6.4 (on a seven-point scale). The results showed that charges for
duty and tax rank in the middle among the criteria, receiving a mean score of 5.6. In respect of de-minimis
levels, this finding is particularly interesting, as it shows that other criteria, such as quality and dealer
reputation are more important to consumers (Figure 17).
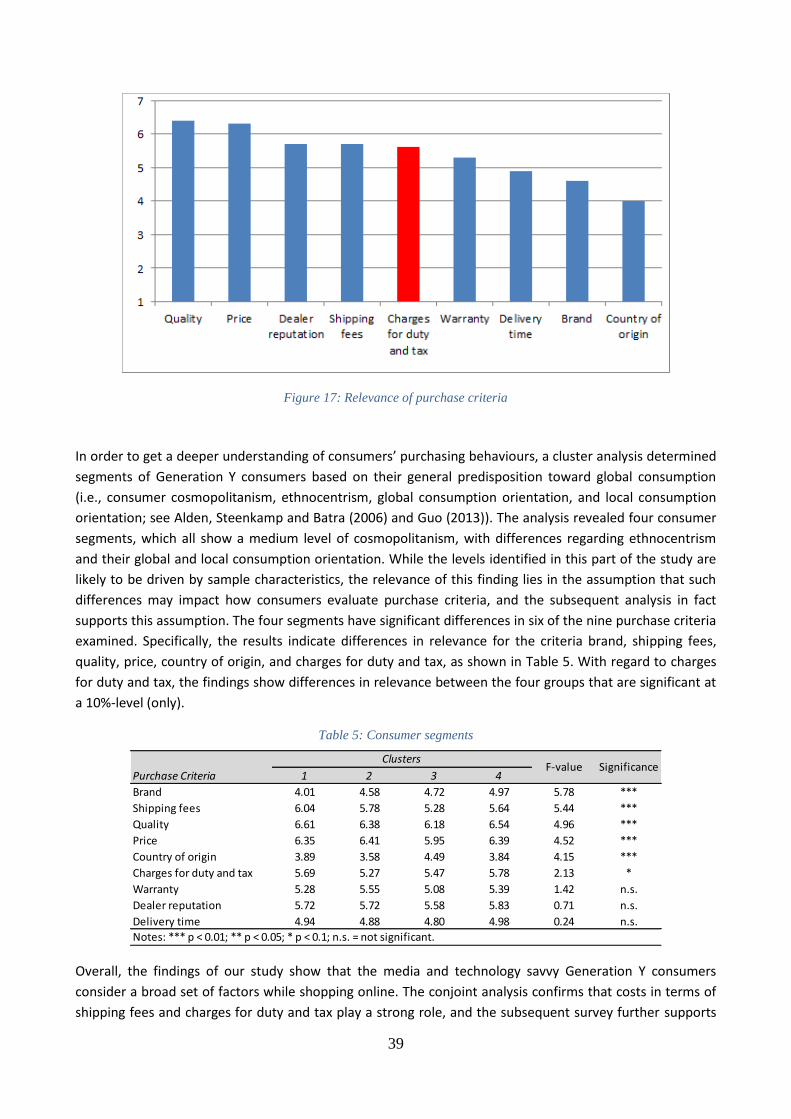
39
Figure 17: Relevance of purchase criteria
In order to get a deeper understanding of consumers’ purchasing behaviours, a cluster analysis determined
segments of Generation Y consumers based on their general predisposition toward global consumption
(i.e., consumer cosmopolitanism, ethnocentrism, global consumption orientation, and local consumption
orientation; see Alden, Steenkamp and Batra (2006) and Guo (2013)). The analysis revealed four consumer
segments, which all show a medium level of cosmopolitanism, with differences regarding ethnocentrism
and their global and local consumption orientation. While the levels identified in this part of the study are
likely to be driven by sample characteristics, the relevance of this finding lies in the assumption that such
differences may impact how consumers evaluate purchase criteria, and the subsequent analysis in fact
supports this assumption. The four segments have significant differences in six of the nine purchase criteria
examined. Specifically, the results indicate differences in relevance for the criteria brand, shipping fees,
quality, price, country of origin, and charges for duty and tax, as shown in Table 5. With regard to charges
for duty and tax, the findings show differences in relevance between the four groups that are significant at
a 10%-level (only).
Table 5: Consumer segments
Overall, the findings of our study show that the media and technology savvy Generation Y consumers
consider a broad set of factors while shopping online. The conjoint analysis confirms that costs in terms of
shipping fees and charges for duty and tax play a strong role, and the subsequent survey further supports
Purchase Criteria 1 2 3 4
Brand 4.01 4.58 4.72 4.97 5.78 ***
Shipping fees 6.04 5.78 5.28 5.64 5.44 ***
Quality 6.61 6.38 6.18 6.54 4.96 ***
Price 6.35 6.41 5.95 6.39 4.52 ***
Country of origin 3.89 3.58 4.49 3.84 4.15 ***
Charges for duty and tax 5.69 5.27 5.47 5.78 2.13 *
Warranty 5.28 5.55 5.08 5.39 1.42 n.s.
Dealer reputation 5.72 5.72 5.58 5.83 0.71 n.s.
Delivery time 4.94 4.88 4.80 4.98 0.24 n.s.
ClustersF-value Significance
Notes: *** p < 0.01; ** p < 0.05; * p < 0.1; n.s. = not significant.
40
these results. We found four Generation Y consumer segments that differ with regard to their general
attitude to shop globally. These profiles affect how consumers judge purchase criteria. Of the several
criteria examined, shipping fees and charges for duty and tax were affected by the four cluster profiles.
Thus, this study shows that while changes of de-minimis levels might affect the buying behaviour of
Generation Y consumers, such changes are not likely to be significant. Even though the sample
demographics are not fully representative of European consumers and prior research has revealed certain
inter-cultural differences in online shopping behaviour, we are confident that this first study is not
fundamentally biased. Rather, it indicates the relevance of such criteria in online purchase decisions.
Hence, we see it as solid evidence for an underlying trend that we expect to be confirmed in subsequent
research.
6 Conclusions, discussions and recommendations
6.1 Key conclusions The establishment of de-minimis thresholds for duties and tax has its roots in the basic understanding that
it is counter-productive to have a tax or duty that is more expensive to collect than the value of the tax or
duty itself. Equally, however, tax and duty rates will have significant impacts on trade, the costs of trade
and competitiveness.
In an era where e-commerce is rapidly expanding and the number of small consignments is increasing
exponentially, the spotlight on de-minimis thresholds for tax and duties has become ever more focused.
Since there are currently large differences in the de-minimis thresholds between the largest economies, it is
important to understand whether and how the thresholds should change and what would be the
consequences of such change.
This study was initiated to provide such understanding in the European context. In order to do so, three
research questions were set for this study and this report has provided answers to each one of them. These
questions and answers are summarized below.
Question 1: What are the economically optimal VAT and duty de-minimis levels for imports into the EU,
considering the cost of tax collection for public administrations and the cost of import processes and
procedures for the private sector?
Performing an extensive literature review and an analysis of a large set of empirical data has confirmed that
the costs of import processes are high both for the Customs authorities and for the importers, freight
forwarders and their supply chains. Simultaneously, the relevance of Customs collected border taxes
remains low in EU Member State budgets.31 As a conclusion we recommend the following:
VAT de-minimis should be raised to 80 EUR from the current 22 EUR.
Duty de-minimis threshold should remain at the current level of 150 EUR.
31
Regarding VAT revenues, the data from our governmental survey round 2 indicates that in some EU Member States Customs collect only 0.017% to 1.86% of total VAT revenues.
41
The recommended de-minimis optimal thresholds were calculated using the de-minimis economic model
developed in this study. This model incorporates governmental and industry data. The governmental data
were based on a literature review on the cost of tax collection for these governmental agencies, as well as
on publicly available statistics and databases. Furthermore, the research team carried out two rounds of
information and data collection from governmental parties across the European Union, in order to gain a
deep understanding of the cost of tax collection across EU27 Customs administrations.
The industry data involves an extensive database of shipment data provided by the express carriers. This
database extends over a two year time period (2011-12), containing original data from the majority of EU
Member States.
Question 2: If VAT and/or duty de-minimis levels were to increase in the future, how would consumer
behaviour change in terms of e-commerce imports from 3rd countries versus e-commerce and retail
purchases within the EU?
Our conclusion regarding the consumer buying behaviour builds on an on-line conjoint study and a survey
performed among a sample of Generation Y consumers, known to be technology and media savvy. The
findings from the study generally support the notion that such consumers consider a broad set of factors
while shopping online. Results show that charges for duty and tax are among relevant purchase decision
drivers, but they are one of the less important factors. In respect of de-minimis levels, this finding is
particularly interesting, as it shows that other criteria, such as quality and dealer reputation are more
important to consumers. Thus, this study shows that while changes of de-minimis levels might affect the
buying behaviour of consumers, such changes are not likely to be significant.
Question 3: Which other political and economic implications could follow from potential decisions in the
future to increase VAT and/or duty de-minimis levels in the EU?
The results cover a broad variety of de-minimis related policy areas and other themes, and hence allow us
to contemplate on the potential consequences of changing de-minimis levels.
While further discussions and considerations, including extracts from several expert interviews, are shared
in the next sub-chapter, we can summarize the potential implications of increased duty and VAT de-minimis
thresholds in the following way:
European consumers and small enterprises as well as e-commerce companies supplying EU
consumers will benefit most.
The logistics sector currently carries an unnecessary burden, which would be lifted.
Customs administrations are swamped under the massive e-commerce workload, which would be
relieved.
Competition effects of a de-minimis regime are debatable.
6.2 Further discussions and considerations on political and economic
implications Within this study we have explored the de-minimis topic also in a broader commercial and political context,
primarily in a qualitative manner, thus complementing the quantitative approaches applied to answer the
42
first two research questions. Below we present an analysis supported by a number of interviews and other
quotes.32
European consumers and small and medium sized enterprises, as well as e-commerce companies
supplying EU consumers, will benefit most.
Private consumers and small and medium sized enterprises (SMEs) as importers are foreseen as the main
beneficiaries if de-minimis levels were increased in the EU. This is primarily due to (i) the lower purchase
price and landed cost, and (ii) lower import processing costs, both for the freight forwarder or Customs
broker, and for the importer himself. For SMEs, reduction of de-minimis levels would be helpful, since
“simplification is critical to supply chain efficiency”, as one of the interviewed experts mentioned.33 Another
interviewee points out that ”I see specific importance of higher de-minimis levels in the context of global
value chains where intermediate products cross borders multiple times, on their conversion to become
‘final products’. Here each border crossing introduces an additional cost for the value chain – and some of
these costs could be avoided”. Furthermore, SMEs seem to suffer more than other firms, as explained by a
third expert: “SMEs have a ‘negative double-dip’ with low de-minimis levels: first, trade and customs
compliance costs are known to be relatively higher for SMEs than for bigger companies due to lack of
economies of scale, and secondly, SMEs have a tendency to order and consume relatively more small
consignments than bigger companies”.34
E-commerce companies that directly supply EU customers are seen as the second category of beneficiaries
regarding increased de-minimis levels. Simplified customs procedures and decreased prices would be likely
to attract more demand from European consumers. This in turn would play in favour of the e-commerce
companies, but also of consumers and SMEs, making buying easier and creating cost savings. Reciprocity of
de-minimis levels can be considered of high importance here, in order to provide equal opportunities for
EU-based e-commerce companies regarding their sales and exports into 3rd countries and regions, as one
respondent notes: “Nor can small companies hope to penetrate the global markets without access to fast,
efficient transport”.35
The EU could also show an example of sensible administration as one interviewee explains: “If customs and
trade together spend more money on collection of duties and taxes versus the revenue collected, it does
not make economic sense. Duties should not be collected below certain thresholds - that is clear. Also in
less developed countries where duties can form a big part of government total revenues it does not make
sense to collect duties of insignificant value; collecting low duty amounts can also become really
counterproductive, as the administrative hurdles may drive traders towards the ‘informal sector’”.
The logistics sector currently carries an unnecessary burden
The logistics sector as a whole, and express carriers and postal operators in particular, are foreseen as the
next group to benefit if the de-minimis levels were increased in the EU. The report on the taxation of the
digital economy points out that the consignments falling between 22 and 150 EUR in value create “an
unnecessary burden” for “both Customs administrations and parcel operators/couriers” (European
Commission, 2014c). Furthermore, anticipated increases in international trade and freight volumes,
32
Please visit ANNEX IX for comprehensive Expert interview –transcripts. 33
The three expert quotes on this paragraph are coded as: ERRR17, 71 and 31. 34
Note: This aspect is also strongly supported by the literature review carried out in Chapter 2 of this report. 35
This and next paragraph contain quotes from ERRR17 and 12.
43
together with lower operational costs (and potentially lower fees to their customers) will facilitate the
development and market expansion of the whole sector.
However, the sector would not be impacted in a uniform way: “De-minimis needs to be understood as a
specific issue in the context of global trade and focused on with regard to the different needs and purpose
of the modality. The rules pertaining to containerized maritime transport are different from the rules
pertaining to road transport”.36 Regarding “traditional freight forwarding business” for air, sea and land
transport, new opportunities may open, for example, in the form of consolidated shipments in the context
of e-commerce imports from 3rd countries and regions into the EU. Lastly, those logistics operators who
are today making profits on import service charges to their customers – such as “traditional customs
brokers” - may have some concerns on lower revenues and profits in the future. As one of the interviewed
experts mentioned: “Customs broker service is an additional cost for traders, especially in the countries
where it is mandatory and higher de-minimis levels would certainly reduce that cost”.
Customs administrations are swamped under the massive e-commerce workload
Regarding Customs administrations and tax authorities, “resources are not well deployed when they focus
on low value shipments” – as one of the interviewed experts mentioned.37 They are considered to create an
unnecessary burden (European Commission, 2014c). Customs authorities are indeed swamped under the
massive workload created by the burgeoning e-commerce. Hence, raising the de-minimis levels would
enable Customs to reallocate resources towards higher priorities such as:
the collection of higher revenues;
anti-fraud activities;
addressing product safety and intellectual property violations; and
supply chain security.
One should also highlight that higher de-minimis levels are not a threat to security, as all consignments are
subject to the same advance data provision requirements, independently whether they are above or under
de-minimis levels.
In many EU Member States, for example Estonia, Finland, and the Netherlands, calls have been made for
lean government as a national policy target. Simplifying customs procedures and eliminating unnecessary
duty and VAT collection would serve this purpose well. Moreover, harmonization of the VAT threshold
across the EU would appear to have significant cost saving potential through simplified procedures
(Sowinski & Taelman, 2014). It appears that most of the Member States require formal declarations to clear
and release shipments valued above the VAT threshold but below the customs duty threshold; this
situation may be attributed to the varying VAT rates that the imported goods are subject to, according to
Sowinski & Taelman (2014). In addition, only 7% of EU Member States apply a single VAT rate for this type
of consignment, according to the authors. One potential solution to this problem could be harmonization of
the VAT rate for all consignments below the 150 EUR value threshold of duty de-minimis, and for any
increased de-minimis - in each country, as this would eliminate the need for formal declarations, because a
single VAT rate could be applied to all consignments below the duty de-minimis.
Competition effects of a de-minimis regime are debatable
36
The citations on this paragraph are from experts ERRR39 and 89. 37
Expert quote by ERRR77.
44
The traditional retail sector – “bricks and mortar” - with physical store locations across EU Member States,
has some concerns related to the tax equality of the de-minimis schemes in general. At the same time, an
increasing number of such companies are either already expanding or considering to expand towards multi-
channel sales and distribution systems, potentially enabling them also to benefit from the proposed higher
de-minimis level for imports into the EU. It is an acknowledged trend that “digital technologies are
transforming physical businesses rather than annihilating them” as Rigby (2014) states in his recent Harvard
Business Review (HBR) Blog post entitled “E-Commerce Is Not Eating Retail”. However, calls have been
made to abolish the entire de-minimis regime due to competition issues. The recent report on the taxation
of the digital economy (European Commission, 2014c) recommends that “the small consignments
exemption is to be abolished… in order to create a level playing field between EU and non EU suppliers”.
Views with other stakeholders
On a national governmental level, Ministries of Finance are normally in a key position to benefit from
increased de-minimis levels: Customs and tax resources are no longer spent on collecting taxes of negligible
value where the collection cost exceeds the tax amounts collected. While we estimate that revenues
foregone would be small in relation to total collected amounts, it is possible that in some Member States
the potential loss of negligible governmental revenues is considered to be a problem per se, independent
of the “economic (non-)rationale”. However, the overall impact would be positive: “Globally it would be
beneficial, as trade flows would increase and administrative hurdles would go down – not only on trade and
logistics, but also on Customs administrations”, explains one of the experts.38 Furthermore, much of the EU
is still recovering from the consequences of the financial crisis, and facilitating trade would provide new
business opportunities, thus providing new tax revenue. Regarding other Ministries such as Transport,
Environment, Interior and Justice, the implications of higher de-minimis levels appear to be somewhat
insignificant.
At the European Commission, the main de-minimis stakeholders are DG TAXUD and DG TRADE, both of
whom appear to hold the view, at the time of the interviews (spring 2014), that the de-minimis should be
maintained at current levels. This may of course change in the future, subject to the “overall political
climate” within the European Institutions.
International organizations linked to global trade, trade facilitation, Customs administrations and related
topics – including the OECD, UNECE, ICC and WEF39 - appear to be strongly in favour of de-minimis levels
where the total cost of tax collection and trade compliance does not exceed the revenues collected.40
6.3 Final recommendations Based on all of the findings and conclusions presented above, the main recommendations of this study are
as follows:
VAT de-minimis should be raised to 80 EUR from the current 22 EUR.
Duty de-minimis threshold should remain at the current level of 150 EUR.
38
Expert ERRR33 39
Abbreviations stand for: Organization for Economic Co-operation and Development, United Nations Economic Commission for Europe, International Chamber of Commerce and World Economic Forum. 40
For a brief summary on other possible impacts linked to changing de-minimis levels, please visit ANNEX X.
45
The approximate cost savings of the recommended increase of the VAT de-minimis threshold for EU
economies – in the context of express carrier imports only – is estimated to be 32 Million EUR, while the
net effect on the total VAT revenue collected across the EU appears to remain insignificant. This change
would have a number of other side benefits on economic activity, lean-government initiatives, and Customs
authorities' improved focus on high priority tasks, among other side benefits described above.
In addition, based on the findings of this study, we recommend three specific future research actions
related to the de-minimis regime.
1. Develop an improved understanding of the costs faced by EU Customs administrations, to
enhance policy and regulatory decision making in the future
Determining the cost of VAT and duty collection across the EU Customs administrations has proven to be a
challenging task. While the CBRA research team is grateful to those, approximately 15, administrations who
replied to our in-depth questionnaire seeking to identify cost figures, significant shortcomings appear e.g.
among the captured labour and technology costs. Our recommendation for the future is to develop further
cost management approaches and techniques across EU Customs administrations as well as to increase
their transparency. Regarding future research projects, we strongly recommend to investigate this
important topic more thoroughly.
2. Include the import volume and cost aspects of all logistics operators and transport modalities, to
be able to calculate total cost savings driven by increased de-minimis levels in the future
Regarding logistics and transport modalities, the core industry data for the study in terms of import records
and processing costs were provided exclusively by the express sector. This means that – purposefully so –
the import volumes and import process costs particularly of the postal sector, but also, to a lesser extent,
freight forwarding linked to “non-express and non-postal” air, maritime, truck and rail imports, were not
taken into account in this study. From a cost saving potential perspective, higher import volumes would
naturally yield higher cost savings if de-minimis levels were increased. The actual de-minimis optimum level
would on the other hand be impacted by the import processing cost and B2C% -differences between the
various logistics sectors. Thus, we recommend seeking wider collaboration in the future across modalities
to generate a more complete view on the volumes, values and the related costs.
3. Investigate a variety of options for broader border-reform in the future
Finally, considering a 5-10 year time horizon, the authors of this report recommend a study be undertaken
of the various options for broad border-reform, going beyond the question of de-minimis levels and also
following the recommendations from the recent report on the taxation of the digital economy (European
Commission, 2014c). An example of such a study can be found in Australia (Australian Parliament, 2012).
Such a study could explore entirely new avenues, as a comment from one of the interviewed experts well
illustrates: “What about this broader border-reform idea: One could focus on cumulative imports during a
calendar year - for example if an individual or a company stays under 2000 EUR, there would be no indirect
taxes collected, independent of number of shipments”.41
41
Expert ERRR19.
46
Bibliography Alden, D.L., Steenkamp, J.B.E. and Batra, R. (2006), “Consumer attitudes toward marketplace globalization:
Structure, antecedents and consequences”, International Journal of Research in Marketing, Vol. 23, No. 3,
pp. 227-239.
Australian Parliament (2012), Low value parcel processing taskforce, Final Report.
Bronic, M. (2005), “What is the cost of Customs compliance in Croatia?”, Newsletter, Institute of Public
Finance, No. 17.
Chamber of Commerce (2013), Official Press Release from Office of Rep. Aaron Schock, available at:
http://www.legistorm.com/stormfeed/view_rss/305672/member/949.html (accessed 12 September 2014).
European Commission (2014a), “Calculation of customs duties”, available at:
http://ec.europa.eu/taxation_customs/customs/customs_duties/index_en.htm (accessed 17 July 2014).
European Commission (2014b), “General overview”, available at:
http://ec.europa.eu/taxation_customs/taxation/vat/how_vat_works/index_en.htm (accessed 17 July
2014).
European Commission (2014c), “Commission Expert Group on Taxation of the Digital Economy”, available
at:
http://ec.europa.eu/taxation_customs/resources/documents/taxation/gen_info/good_governance_matter
s/digital/report_digital_economy.pdf. (accessed 12 September 2014).
European Commission (2013), “Financial programming and budget: financial report”, available at:
http://ec.europa.eu/budget/financialreport/revenue/index_en.html (accessed 11 February 2014).
European Parliament (2013), Administrative Performance Differences Between Member States Recovering
Traditional Own Resources of the European Union, available at:
http://www.europarl.europa.eu/meetdocs/2009_2014/documents/cont/dv/studytraditionalownresources
/studytraditionalownresourcesen.pdf (accessed 11 September 2014).
Ewart, J. (2013), “International e-commerce: the downsides for NZ retail and tax revenue”, Booksellers, 21
March 2013, available at: http://www.booksellers.co.nz/book-news/international-e-commerce-downsides-
nz-retail-and-tax-revenue (accessed 7 July 2014).
French Customs (2011), “Performance measurement: the experience of French Customs”, presentation in
PICARD Conference, Geneva, 14-16 September 2011.
GEA, (2013), Overview of de minimis value regimes open to express shipments worldwide.
Granqvist, M., Hintsa, J., Lazarescu, M. and Tsikolenko, V. (2010), e-Customs study: private sector views on
potential benefits of further electronic Customs developments in Switzerland.
Gubin, A. (2011), Developing performance measurement for the Russian Customs service”, World Customs
Journal, Vol. 5 No. 2, pp. 95-105.
47
Guo, X. (2013), “Living in a global world: Influence of consumer global orientation on attitudes toward
global brands from developed versus emerging countries”, Journal of International Marketing, Vol. 21, No.
1, pp. 1-22.
Holloway, S. and Rae, J. (2012), “De-minimis thresholds in APEC”, World Customs Journal, Vol.6 No.2, pp.
31-62.
Hufbauer, G. C. and Wong, Y. (2011a), “Logistics reform for low-value shipments”, Policy Brief, No. 11-7,
Peterson Institute for International Economics.
Hufbauer, G. and Wong, Y. (2011b), Low-value imports in the APEC region: lessons from US experience,
Peterson Institute for International Economics-provisional draft, Asia-Pacific Economic Cooperation, United
States.
Jones Lang LaSalle (2013), “E-Commerce boom triggers transformation in retail logistics: driving a global
wave of demand for new logistics facilities”, Global E-Commerce and Retail Logistics.
KPMG (2006), Administrative burdens – HMRC measurement project, HMRC.
Kulisch, E. (2013), “Brokers, Forwarders & NVOs”, April 2013, available at:
http://digital.americanshipper.com/i/117907/15 (accessed 7 July 2014).
New Zealand Retailers Association, (2011), De-minimis discussion paper.
Matsuda, S. (2011), “The time release study as a performance measurement tool for a supply chain and an
international corridor”, World Customs Journal, Vol.6 No.1.
Noble, S. M., Haytko, D. L. and Phillips, J. (2009), ”What drives college-age Generation Y consumers?”,
Journal of Business Research, Vol. 62, pp. 617-628.
OECD (2010), “OECD releases draft Guidelines on the application of VAT/GST to the international trade in
services and intangibles for public consultation”, available at:
http://www.oecd.org/tax/consumption/oecdreleasesdraftguidelinesontheapplicationofvatgsttotheinternat
ionaltradeinservicesandintangiblesforpublicconsultation.htm (accessed 11 September 2014).
Rigby, D. (2014), “E-commerce is not eating retail”, available at: http://blogs.hbr.org/2014/08/e-commerce-
is-not-eating-retail/ (accessed 14 September 2014).
Smith, M.D. and Brynjolfsson, E. (n.d.), Consumer decision-making at an Internet shopbot.
Sowinski, C and Taelman, I. (2014), Uniform application of customs law in the EU – review of selected
practices in 28 EU Member States in the light of article X.3 (a) of GATT 1994, working paper
UNECE (2012), “Trade facilitation implementation guide”, available at: http://tfig.unece.org/contents/de-
minimis.htm (accessed 3 September 2013).
Williamson, M. (2011), “No change to de minimis”, 18 March 2011, available at:
http://www.beehive.govt.nz/release/no-change-de-minimis (accessed 8 July 2014).
Wulf, L.D. (2005), “Strategy for Customs modernization”, in Wulf, L.D. and Sokol, J.B. (Eds.), Customs
Modernization Handbook, The World Bank, Washington DC, pp. 3-30.
48
List of annexes
ANNEX I. Cross-border Research Association and the research team
ANNEX II. VAT- and de-minimis -levels at EU Member States
ANNEX III. Government letter campaign, Round 1
ANNEX IV. Government letter campaign, Round 2
ANNEX V. Import data record verification and correction –procedure
ANNEX VI. User interfaces for the de-minimis optimization tool
ANNEX VII. Data elements and mathematical formulas for the de-minimis
optimization tool
ANNEX VIII. Screenshots for the consumer study
ANNEX IX. Expert interview transcripts
ANNEX X. Other possible impacts of changing de-minimis levels