Embed Size (px)
Citation preview

The Implied Volatility Smirk in the VXX OptionsMarket
Sebastian A. Gehricke∗
Department of Accountancy and FinanceOtago Business School, University of Otago
PO Box 56, Dunedin 9054, New ZealandEmail: [email protected]
Jin E. ZhangDepartment of Accountancy and Finance
Otago Business School, University of OtagoDunedin 9054, New Zealand
Email: [email protected]
First version: January 2018
This version: May 17, 2018
This is the first paper to document and analyze the empirical characteristics ofthe VXX options market, providing useful information for developing a realistic VXXoption pricing model. We extend the methodology developed by Zhang and Xiang(2008) in order to study the term structure and time series of the VXX option impliedvolatility curves. The implied volatility curve is quantified through three factors; thelevel, slope and curvature. After quantifying the implied volatility curves of the VXXoptions market, we show that they are not usually a smirk, as for S&P 500 options,but rather an upward-sloping line with some convexity. As the option’s maturityincreases usually the level (exact at-the-money implied volatility) increases, the slopedecreases and curvature increases. The level and slope factors seem to mean-revert,while the curvature factor does not follow a easily identified pattern.
Keywords: Implied volatility (IV); IV smirk; VIX futures ETN; VXX; VXX options;JEL Classification Code: G13
∗Corresponding author. Tel: 0064-3-479-8060. Jin E. Zhang has been supported by an estab-lishment grant from the University of Otago and the National Natural Science Foundation of China(Project No. 71771199).

The Implied Volatility Smirk in the VXX Options Market 1
1 Introduction
This is the first paper to quantify and analyze the implied volatility (IV) curve of the
VXX options market. Quantifying the VXX’s IV curve provides the basis necessary
for creating a VXX option pricing model founded on the market’s empirical dynamics.
Understanding the dynamics of the VXX options market will help to determine the
correct starting assumptions for a pricing model. The IV has all the information of
market option prices and reflects the risk-neutral distribution of the underlying asset
returns over different horizons.
The market for trading volatility derivatives has developed swiftly over the past 15
years. The VIX index was revised in 2003 to track the IV of S&P 500 OTM options.
Later, on 26 March 2004, the CBOE launched the first futures contracts on the VIX
index providing the first access to VIX exposure, which was desirable for its possible
hedging/diversification benefits. In 2006, VIX options started to trade. In 2009,
Standard & Poor’s started calculating VIX futures indices, such as the S&P 500 VIX
Short-Term Futures Total Return index (SPVXSTR). The VIX futures indices track
a daily rebalanced position of VIX futures contracts to achieve an almost constant
maturity. Shortly after, on 29 January 2009, Barclays Capital iPath launched the
first VIX futures exchange-traded product (ETP), the VXX exchange-traded note
(ETN).1 Finally, on 28 May 2010, VXX and VXZ options markets were launched by
the CBOE. Now options markets exist for many of the popular VIX futures ETPs.
The VIX futures ETPs and their option markets have become very popular. The
VXX is the most popular VIX futures ETP with an average market cap of about $1
1An ETN is a non-securitized debt obligation, similar to a zero-coupon bond, but with a re-demption value that depends on the level of something else, i.e. the SPVXSTR index for the VXXETN.

The Implied Volatility Smirk in the VXX Options Market 2
billion and average daily dollar trading volume of $1.4 billion.2 The VXX options
market is the most prominent of the VIX futures ETP option markets and has grown
to an average daily trading volume of 328,884 and average daily open interest of
3,097,297 contracts.3 In figure 1 we can see the growth of the VXX options market
over our sample. The open interest in VXX options has grown consistently from 2010
to 2016, reaching about three million contracts recently, while the trading volume has
hovered around 300,000 contracts per day since 2013. The other VIX futures ETP
options have also grown in popularity, but their trading volume and open interest are
still quite low. This is why our study focuses on the VXX option IV curve.
The VIX futures ETPs have recently been making headlines as a spike in volatility
led to unprecedented losses in the inverse exposure ETPs, some of which were even
terminated. One article states “The problem with ETFs is that many of them appeal
to retail investors, but are really meant for institutions” (Dillian, 2018). However,
even after the increased media attention on the complexity and risk in these products,
trading activity in their options is picking up again as noted by a recent article by
Bloomberg (Kawa, 2018). These products are traded like stocks and accessible to
retail investors, but possess complexities that even academics and highly trained
institutional investors do not yet fully understand. Providing some more insight on
these products is of the utmost importance in order to avoid unexpected outcomes,
often not even considered as a possibility for retail investors.
We use the method of Zhang and Xiang (2008) to quantify the VXX IV curve
for any maturity each day by three factors; the level, slope and curvature. This
2Averages described here are taken over the last year of our sample.3For a detailed comparison between S&P 500 index (SPX), S&P 500 index ETF (SPY), VIX
and VIX futures ETP option markets, please refer to table 1.

The Implied Volatility Smirk in the VXX Options Market 3
allows us to summarize the often vast number of IV-moneyness (strike price) data
points with three numbers. We can then examine the dynamics of these factors to
draw conclusions on how the VXX options market behaves. Zhang and Xiang (2008)
also provide a link between the IV curve factors and the risk-neutral moments and
demonstrate how this can be used to calibrate option pricing models. They develop
this methodology and demonstrate its application for a very small sample, whereas
we apply the methodology to the VXX options market and extend it by studying
the term structure, time series and time series of the term structure of the quantified
IV curve. Fajardo (2017) adds a torsion factor into the polynomial regression, which
quantifies the IV curve, but this is a model based factor and we want to keep our
quantification simple. Our method captures close to 100% of the variation of the
daily VXX IV curves without this extra factor.
Although there is a growing literature on pricing volatility derivatives (Zhang and
Zhu, 2006; Zhang, Shu, and Brenner, 2010; Lu and Zhu, 2010; Chung, Tsai, Wang,
and Weng, 2011; Wang and Daigler, 2011; Zhu and Lian, 2012; Mencıa and Sentana
(2013); Huskaj and Nossman, 2013; Lian and Zhu, 2013; Bardgett, Gourier, and
Leippold, 2014; Papanicolaou and Sircar, 2014; Eraker and Wu, 2017; Gehricke and
Zhang, 2018a; and many more) and their empirical dynamics (Shu and Zhang, 2012;
Whaley, 2013; Bordonado, Molnar, and Samdal, 2017; Bollen, O’Neill, and Whaley,
2017; Gehricke and Zhang, 2018c; and many more), there is only one published paper
looking at a VIX futures ETP options market. Bao et al. (2012) provide the only study
on VXX options proposing and horse-racing several models for pricing the contracts.
The authors, however, ignore the underlying relationships of the VXX with the VIX
futures, VIX index and S&P 500 index, which are essential to understanding the VXX

The Implied Volatility Smirk in the VXX Options Market 4
options market fully.
Many studies have documented the S&P 500 option IV shape and/or its dynamics
(Rubinstein, 1985; Rubinstein, 1994; Aıt-Sahalia and Lo, 1998; Skiadopoulos, Hodges,
and Clewlow, 2000; Cont, Da Fonseca, et al., 2002; Carr and Wu, 2003; Foresi and
Wu, 2005; Garleanu, Pedersen, and Poteshman, 2009). Some authors have tried to
explain the shape/dynamics of the IV curve through other market and economic
factors (Pena, Rubio, and Serna, 1999; Pan, 2002; Dennis and Mayhew, 2002; Bollen
and Whaley, 2004). The predictability power of option market IV for the underlying
assets return has also been explored (Xing, Zhang, and Zhao, 2010; Cremers and
Weinbaum, 2010; Conrad, Dittmar, and Ghysels, 2013, Lin and Lu, 2015).
This study contributes to the literature by being the first empirical study of the
dynamics of the VXX options market. We document and provide a comprehensive
study of the VXX option IV dynamics as a starting point for developing VXX option
pricing models in the future4. We show that the IV curve of the VXX is usually an
upward-sloping line with some convexity. As the options maturity increases the at-
the-money (ATM) IV increases, the IV curve’s slope decreases and it becomes more
convex. Our quantification of the VXX’s IV curve performs well with an average r-
squared value of 94.55%. The fit is best for shorter maturity options, with an average
r-squared of 98.49% for less than and 83.65% for more than 180 days to maturity.
In the next section we describe the methodology used to quantify the IV curve
and how the IV factors can be converted to the risk-neutral moments of the VXX. In
section 3 we describe our sample data and cleaning procedure. Then in section 4 we
present the results and describe the dynamics of the VXX’s IV. Lastly, in section 5
4We plan to extend the model of (Gehricke and Zhang, 2018b) to price VXX options, using theinsights of this paper.

The Implied Volatility Smirk in the VXX Options Market 5
we conclude.
2 Methodology
2.1 Implied forward price and ATM IV
In this paper we employ the methodology developed by Zhang and Xiang (2008) in
order to summarize the VXX option IV curve (IV as a function of option moneyness),
every day and for each maturity. For this we first calculate the implied forward price
based on the ATM call and put prices as follows:5
F Tit = KATM
i,t + eri,tτi,t(cATMi,t − pATMi,t ), (1)
where F Tit is the implied forward price, KATM
i,t is the ATM strike price, ri,t is the risk
free rate, τi,t is the annualized time to maturity, cATMi,t is the ATM call option price
and pATMi,t is ATM put option price, for maturity Ti on day t.
2.2 Moneyness of options
We use the implied forward price to measure the moneyness of an option as follows:
ξ =ln(KTi
t
FTit
)σ√τi
, (2)
where KTit is the strike price we are calculating the moneyness for and F Ti
t is the
implied forward price for maturity Ti on day t. σ is the average volatility of the
underlying, which we proxy by the 30-day ATM IV.6 Lastly, τi = (Ti − t)/365 is the
annualized time to maturity of the given expiry option contracts.
5ATM is defined as the strike price where the difference between call and option prices is thesmallest. This is not exactly at the money and we will be providing an estimate of exactly ATM IVusing equation 3, which we call the “exactly ATM IV”.
6The 30 day ATM VXX IV is calculated by linearly interpolating the two nearest to 30 daymaturity ATM implied volatilities as IV τ = IV τ1w1 + IV τ2(1− w1).

The Implied Volatility Smirk in the VXX Options Market 6
2.3 Quantified IV curve
Having calculated the moneyness of the options, we can quantify the IV curve by
fitting the regression:
IV (ξ) = αo + α1 ξ + α2 ξ2, (3)
where IV is the IV and ξ is the moneyness of the option.7 The regression is fitted sep-
arately each day and for each maturity. Here, the coefficients a0, a1 and a2 are termed
the intercept, unscaled slope and unscaled curvature, respectively. We estimate this
quadratic function to the IV by minimizing the volume-weighted mean-squared error
given by:
VWMSE =
∑ξ V ol(ξ)× [IV (ξ)MKT − IV (ξ)MDL]∑
ξ V ol(ξ), (4)
where V ol(ξ) is the volume, IV (ξ)MKT is the IV from market prices and IV (ξ)MDL
is the model IV, for the option with moneyness ξ, on a particular day for a given
maturity. When estimating the IV function we only use OTM options, as is industry
practice.8 This means that when the strike price is above (below) the implied forward
price, that is, Ki,t > Fi,t (Ki,t < Fi,t), we only use call (put) options in estimating the
IV curve.
Efficiently estimating the parameters in equation (3) should allow us to describe
the entire volatility smirk for a given maturity on a certain day with just three
parameters. We then document these parameters across time and maturities in order
to describe and explore the dynamics of the VXX options market. We will present the
7The IV is supplied by OptionMetrics Ivy DB and is calculated using the Cox et al. (1979)binomial tree model and a proprietary algorithm to speed up convergence.
8This is because OTM options are more liquid and are more sensitive to pricing models.

The Implied Volatility Smirk in the VXX Options Market 7
results of the regressions with and without a constraint forcing the line to go through
the ATM IV point in section 49.
We can also present the parameters in a dimensionless form as follows:
IV (ξ) = γ0(1 + γ1ξ + γ2ξ2), (5)
where
γ0 = α0
γ1 = α0 × α1
γ2 = α0 × α2,
where γ0 is the level, γ1 is the slope and γ2 is the curvature factor. We can interpret
the level coefficient (α0 = γ0) as the exact ATM IV where moneyness is actually equal
to zero, which will be slightly different to the ATM IV available in the market data,
whose moneyness is the closest to zero available.
2.4 Risk-neutral moments
Transforming the coefficients of the regressions (α’s) to the dimensionless factors
(γ’s), as above, allows us to calculate the moments of the risk-neutral distribution of
the VXX, as in Zhang and Xiang (2008). They show that the risk-neutral standard
deviation, skewness and excess kurtosis (σ, λ1, λ2) are related to the level, slope and
9We constrain the regression to go through the ATM IV because then the fitted volatility curvegives the same price as the market for ATM options. This means that there is no arbitrage betweenthe model price and market price for ATM options.
The Implied Volatility Smirk in the VXX Options Market 8
curvature (γ0, γ1 and γ2) through the following asymptotic expansions:
γ0 =
(1− λ2
24
)σ +
λ14σ2√τ +O(σ3τ), (6)
γ1 =λ1
6(1− (λ2/24))
σ
σ+λ2(1− (λ2/24))− (λ21/2)
12(1− (λ2/24))2σ√τ +O(σσ
√τ), (7)
γ2 =λ224
σ2
σ2
1− (λ2/16)
(1− (λ2/24))2+λ1λ296
σ2√τ
σ
1− (λ2/48)
(1− (λ2/24))3+O(σ2
√τ), (8)
which we call the full approximate relationship between the VXX’s IV curve factors
and its implied risk-neutral moments.
Zhang and Xiang (2008) further show that if we ignore the second and higher-order
terms and taking σ = γ0, we have the following relationships:
γ0 ≈(
1− λ224
)σ, γ1 ≈
1
6λ1, γ2 ≈
1
24λ2
(1− λ2
16
), (9)
which we call the simpler approximate relationship.
Then if we further assume that γ2 << 1, we get the simplest approximate rela-
tionships:
γ0 ≈(
1− λ224
)σ, γ1 ≈
1
6λ1, γ2 ≈
1
24λ2. (10)
These relationships can be used to approximate the risk-neutral moments of the
VXX from the IV curve factors. Once one has the risk-neutral moments these can be
used to calibrate VXX option pricing models, as Zhang and Xiang (2008) demonstrate
for S&P 500 options.
3 Data
Our sample is from 1 June 2010 to 29 April 2016. The options data are sourced from
OptionMetrics, a widely used and very reliable source. The VXX options are Amer-
ican style; therefore, the IV is computed using an algorithm based on the binomial

The Implied Volatility Smirk in the VXX Options Market 9
tree model of Cox et al. (1979), by OptionMetrics. We obtain the Treasury yield data
from the U.S. Department of the Treasury website.10
We apply the following standard option data filters to the option data, following
previous work by Bakshi et al. (1997), Zhang and Xiang (2008) and the VIX index
option data cleaning methodology.
• We remove option quotes where the open interest, bid price or IV is zero or
missing.
• We remove option quotes with a maturity of less than six days.
In table 2 we summarize the trading activity of the VXX options market overall
and by maturity category after cleaning the data, as above. In the table we can see
that as the maturity of the options contracts increases the number of observations,
mean number of strikes, mean daily trading volume and mean open interest all de-
crease substantially. Most of the trading in VXX options happens in the shorter
maturity contracts.
4 Empirical Results
4.1 Quantified IV curve
In this section we present and analyze of the dynamics of the quantified IV curve of
the VXX options market, as well as those of the option implied VXX forward price.
Table 3 shows a summary of the implied VXX forward price, the quantified IV
curve coefficients (α0, α1 and α2) and the proportion of curves for which they are
significant, the quantified IV curve factors (γ0, γ1 and γ2), the goodness of fit of
10If there are no yield data on a day where there are option data we use the previous days value.

The Implied Volatility Smirk in the VXX Options Market 10
the regressions (R-squared) and the trading volume. The summary statistics are
provided overall and by maturity category.11 Table 4 shows the same statistics but
for the regressions that are constrained to pass through the ATM IV.
In tables 3 and 4 we can see that the mean implied VXX forward price across
the entire sample and for all maturities is 26.21. Examining the mean forward price
by maturity category shows that the implied forward price decreases as the maturity
increases, from 26.45 to 26.26, for less than 30- and more than 360-day maturities,
respectively. Looking closer we can see that the average implied forward price ini-
tially decreases with maturity, until the 180- to 360-day maturity category, and then
increases somewhat. Therefore, the term structure of the implied forward price is in
contango (downward sloping), on average. Also, the variation (standard deviation)
of the implied forward price is 9.95 overall and tends to increase as the maturity
becomes longer.
The level coefficient (α0 = γ0), which is the exact ATM IV, is 0.6873 (0.6854) on
average, for the un-constrained (constrained) regressions.12 The mean level mono-
tonically increases from 0.6445 (0.6413) to 0.7243 (0.7187), for less than 30 and more
than 360 days to maturity, respectively. Therefore, the term structure of the exact
ATM IV is usually in backwardation. Its standard deviation is 0.1338 (0.1356) over-
all and seems to decrease as maturity increases. This shows us that, on average, the
long-term projections of VXX volatility by option traders are higher than the short
term and that their long term volatility projections are more consistent throughout
the sample. This would be consistent with VXX option traders believing that ATM
11The maturity categories are based on the days to maturity of the contracts; therefore, for somedays there will be multiple maturities in one category.
12α0 = γ0 is an estimate of the exact ATM IV, whereas the market ATM IV is the IV where thecall and put prices are closest, that is, the closest available strike price to ATM.

The Implied Volatility Smirk in the VXX Options Market 11
VXX volatility mean-reverts to some long-run level. The level coefficient is significant
at the 5% level for essentially 100% of IV curves. This can be expected, as the exact
ATM implied volatility would never be zero or negative.
Looking at the slope factor we can see that, on average and over all maturity
IV curves, the curves are upward sloping, as the overall mean γ1 is positive for the
unconstrained and constrained regressions. On average, as the maturity increases
the slope becomes less steep and even turns downward sloping for maturities over 360
days. The un-constrained (constrained) slope, γ1 goes from 0.0683 (0.0671) to -0.0030
(-0.0072), for less than 30 and more than 360 days to maturity curves respectively.
The term structure of the slope factor is, on average, in contango. The unscaled slope
coefficient is significant for 99.44% of IV curves, with less than 180 and only 79.81%
of IV curves with over 180 days to maturity.
The last quantified IV curve factor is the curvature, γ2. We can see that, on
average and for all maturities, it is positive, meaning the VXX IV curves are usually
convex. However, it is also very small in magnitude, so the convexity is not very
prominent. The overall average curvature factor is 0.0023 (0.0.0031) for the un-
constrained (constrained) regression. The unscaled curvature coefficient is significant
for 64.73% (67.95%) of the quantified curves overall. The proportion of quantified
IV curves with significant curvature coefficients decreases slightly for longer-maturity
categories. The magnitude of the mean curvature factor estimates increases with
maturity, meaning that as maturity increases the IV curves tend to become more
convex. The average curvature factor is 0.0006 (0.0005) for less than 180-day and
0.0072 (0.0104) for more than 180-day maturity curves.
Constraining the regressions to fit the ATM IV exactly results in a lower level,

The Implied Volatility Smirk in the VXX Options Market 12
flatter and more convex quantified IV curves on average, overall and for most maturity
categories.
The reason both the slope and curvature become less significant and the r-squared
values become much lower for maturities over 180 days, as seen in tables 3 and 4, may
be that traders’ opinions on volatility are less reliable resulting in less consistently
shaped IV curves. The lower trading volume may also be indicative of less efficient
prices at longer maturities.
Figures 2, 3 and 4 show the IV curves, the trading volume of each contract and
the fitted line for the unconstrained regression on 27 July 2011, 2 August 2013 and
27 May 2015, respectively. Figures 5, 6 and 7 show the same information but for the
constrained quantified IV curves. We can see good examples of the usually upward-
sloping and almost linear curves at shorter maturities. As the maturity increases the
fitted lines become more convex, consistent with the mean results discussed above.
In figure 8 we show the average fitted IV curves, that is, the predicted curves
resulting from the mean factors presented in tables 3 and 4. We can clearly see the
pattern described above; as the maturity increases the IV curve’s slope decreases
and they become more convex. Most maturity average IV curves are upward-sloping
lines with some convexity, but the longer than 360 days to maturity lines look like
the IV smirk found in the S&P 500 options market. We can also see that when the
regressions are constrained to cross the ATM IV point, they become more smirked
(skewed to the left), this is most apparent in the line for maturities longer than 360
days.

The Implied Volatility Smirk in the VXX Options Market 13
4.2 Constant maturity quantified IV curve
So far we have been examining the term structure of the VXX implied forward price
and IV curves using maturity categories. However, within each maturity category
there will often be multiple curves on a given day. To confirm the findings above,
we create constant maturity implied forward prices and IV curve factors. This allows
us to precisely study the term structure and time series of the variables covering the
same horizon of traders’ expectations.
To create constant maturity implied forward prices and IV curve factors, we in-
terpolate/extrapolate them to several target maturities as follows:
F τ = F τ1w1 + F τ2(1− w1), (11)
γτ0 = γτ10 w1 + γτ20 (1− w1), (12)
γτ1 = γτ11 w1 + γτ21 (1− w1), (13)
γτ2 = γτ12 w1 + γτ22 (1− w1), (14)
where
w =τ − τ1τ2 − τ1
,
the superscript τ denotes the desired maturity, τ1 is the closest (second closest) ma-
turity to the target from below and τ2 is the closest (closest) maturity to the target
from above (below), when interpolating (extrapolating). We interpolate when there
is a maturity either side of the target and extrapolate when the available maturities
are all shorter than the target maturity.
Table 5 presents the mean and standard deviation interpolated implied VXX
forward prices and level, slope and curvature unscaled coefficients and factors, for

The Implied Volatility Smirk in the VXX Options Market 14
the un-constrained and constrained estimations. These are also presented graphically
in figure 9. From the table we confirm the previous result that, on average, the
implied VXX forward price is slightly decreasing as maturity increases. The average
constant maturity forward price goes from 26.60 to 26.35, for the 30- and 180-day
target maturity, respectively.13
In table 5 we can see that the exact ATM IV (level factor) term structure is
usually in contango. This is likely because the probability of a VXX volatility spike
becomes larger as the maturity increases, during normal times. The variation in the
exact ATM IV also decreases as time to maturity increases; this is indicative of VXX
option traders believing that VXX volatility mean-reverts.
The table also shows that the term structure of the slope factor is in contango
and the variation in the slope factor is similar for all maturities. Lastly, we can see
that the curvature factor’s term structure is almost flat and that the factor is very
close to zero. This is because we are only looking at maturities up to 180 days. From
our previous results we would expect that for maturities longer than 180 days, the
IV curves will be more convex.
We also want to study the time series of the ATM IV, forward prices and IV
curve factors. We present the time series of 30- and 180-day constant maturity ATM
IV and forward prices in figure 10. Then we present the time series of the 30- and
180-day constant maturity level, slope and curvature factors in figures 11 and 12 for
the un-constrained and constrained estimations, respectively.
From figure 10 we can see that the ATM IV varies throughout time in a mean-
13For the interpolated forward price and curve factors we only interpolate up to 180 day maturitybecause the data are often scarce and longer maturity and extrapolating further would lead toconclusions about longer maturities drawn from data on shorter maturity contracts.

The Implied Volatility Smirk in the VXX Options Market 15
reverting fashion. Referring to the difference between the 180- and 30-day ATM IV
we can see that most of the time its term structure is in backwardation, although
there are times when it is in contango. Examining the time series of the 30- and
180-day implied forward prices we can see that they vary significantly often spiking
very quickly. We can also see that the term structure of implied forward prices is
usually almost flat, with some periods of strong contango and backwardation.
Turning to the time series of the IV curve factors in figures 11 and 12, we can
firstly see that the exact ATM IV (level factor) is also mean-reverting with a usually
backwarded term structure, with times of contango. Secondly, we can see that the
slope factor also seems to mean-revert with a usually contango term structure, oc-
casionally going into backwardation. Lastly, looking at the curvature factor we can
see that it is usually very small in magnitude for the 30- or 180-day maturity. There
are also days where the curvature becomes very negative or positive, resulting in ab-
normally concave or convex curves, respectively. Looking at the difference between
the 30 and 180 day curvature factor, it is usually close to zero, indicating a flat term
structure, with some spikes.
Figure 13 shows the predicted IV curves using the mean of the interpolated factors.
We can see a similar picture as in figure 8; as maturity increases the slope decreases
and the curves become more convex. The convexity at longer maturity is not as
obvious as in section 4.1 because we cannot estimate longer constant maturity curve
factors, where the convexity would really become apparent, due to a lack of reliable
data.
The time series observations are consistent with what we found, on average, in
prior discussions. Further studying what drives the time variation in the VXX’s

The Implied Volatility Smirk in the VXX Options Market 16
implied forward price and IV curve factor and their term structures is of interest for
future research.
4.3 VXX model recommendations
Using the results from section 4.1 and 4.2 we can make recommendation for the
dynamics of a VXX option pricing model. Firstly, the model must have a upward
sloping term structure of volatility. Using the conversion from IV curve factors to the
moments of the risk-neutral distribution of the VXX, discussed in section 2.4, we can
say that the model must also exhibit positive skewness, which decreases as maturity
increases, due to the dynamics of the slope factor. Lastly, we show that kurtosis is of
the risk-neutral distribution of the VXX should be very small, unless the maturity is
very long, due to the dynamics of the curvature factor.
5 Conclusions
In this paper we document the empirical characteristics of the VXX options market
as a starting place for developing a realistic VXX option pricing model. We follow
the methodology developed by Zhang and Xiang (2008) in order to quantify the IV
curve of VXX options, through quadratic polynomial regressions. The IV curve is
quantified through three factors - the level (exact ATM IV), slope and curvature
- which we compute daily and for different maturities over a six year sample. We
extend the methodology of Zhang and Xiang (2008) by estimating constant maturity
factors, which allows us to study the time-series and term structure dynamics of the
VXX IV concisely. We quantify the IV curves with and without a constraint that the
curve has to pass through the ATM IV, resulting in a very similar average shape.

The Implied Volatility Smirk in the VXX Options Market 17
We find that the implied VXX forward price term structure is usually in back-
wardation with a kink (initially decreasing then slightly increasing with maturity).
We also show that the average exact ATM IV (level factor) increases with maturity
and estimates become less variable with longer maturities. Which could be explained
by traders expecting VXX volatility to mean-revert. The IV curves are also usually
significantly upward sloping, although as the maturity increases they becomes less
steep and even downward sloping. The IV curves are slightly convex, on average, and
become more convex as the maturity increases.
Our quantification of the VXX IV describes almost all the information contained
in VXX option prices and should therefore be used when developing a VXX option
pricing model. The term-structure of volatility of the VXX should be upward slop-
ing. The risk-neutral distribution should be positively skewed, due to the positive
slope factor, and becomes less positively skewed as the maturity increases. The risk-
neutral distribution also should exhibit only minimal kurtosis as the curvature factor
is minuscule in magnitude, for maturities less that 360 days.
We study the time series of the short end of the term structure (less than 180
days). We show that the level and slope factors seem to mean-revert through time,
while the curvature does not follow an easily observed pattern. Although the level’s
(slope’s) term structure is usually in backwardation (contango), there are times when
it goes into contango (backwardation). The shorter maturity end of the curvature’s
term structure is usually almost flat, with some short-lived moments of backwardation
or contango. Studying the drivers of the periodic shifts in the term structures is left
for future research.
The quantified VXX IV factors could also be converted to estimates of the VXX’s

The Implied Volatility Smirk in the VXX Options Market 18
risk-neutral moments, which can then be used to calibrate new VXX option pricing
models. We could use our quantified VXX IV factors to try to predict the VXX’s
returns or relate them to market and economic factors to further understand what
drives this market’s dynamics. The relationships between the SPX, VIX and VXX
option implied volatility curves is also a topic of interest as as understanding these
would allow for a comprehensive option pricing model for all three markets. These
extensions of the current work are left for future research.
References
Aıt-Sahalia, Yacine, and Andrew W Lo, 1998, Nonparametric estimation of state-
price densities implicit in financial asset prices, Journal of Finance 53, 499–547.
Bakshi, Gurdip, Charles Cao, and Zhiwu Chen, 1997, Empirical performance of al-
ternative option pricing models, Journal of Finance 52, 2003–2049.
Bao, Qunfang, Shenghong Li, and Donggeng Gong, 2012, Pricing VXX option with
default risk and positive volatility skew, European Journal of Operational Research
223, 246–255.
Bardgett, Chris, Elise Gourier, and Markus Leippold, 2014, Inferring volatility dy-
namics and risk premia from the S&P 500 and VIX markets. Available at SSRN
2296826 .
Bollen, Nicolas PB, Michael J O’Neill, and Robert E Whaley, 2017, Tail wags dog:
Intraday price discovery in VIX markets, Journal of Futures Markets 37, 431–451.

The Implied Volatility Smirk in the VXX Options Market 19
Bollen, Nicolas PB, and Robert E Whaley, 2004, Does net buying pressure affect the
shape of implied volatility functions?, Journal of Finance 59, 711–753.
Bordonado, Christoffer, Peter Molnar, and Sven R Samdal, 2017, VIX Exchange
Traded Products: Price Discovery, Hedging, and Trading Strategy, Journal of Fu-
tures Markets 37, 164–183.
Carr, Peter, and Liuren Wu, 2003, The finite moment log stable process and option
pricing, Journal of Finance 58, 753–777.
Chung, San-Lin, Wei-Che Tsai, Yaw-Huei Wang, and Pei-Shih Weng, 2011, The
information content of the S&P 500 index and VIX options on the dynamics of the
S&P 500 index, Journal of Futures Markets 31, 1170–1201.
Conrad, Jennifer, Robert F Dittmar, and Eric Ghysels, 2013, Ex ante skewness and
expected stock returns, Journal of Finance 68, 85–124.
Cont, Rama, Jose Da Fonseca, et al., 2002, Dynamics of implied volatility surfaces,
Quantitative finance 2, 45–60.
Cox, John C, Stephen A Ross, and Mark Rubinstein, 1979, Option pricing: A sim-
plified approach, Journal of Financial Economics 7, 229–263.
Cremers, Martijn, and David Weinbaum, 2010, Deviations from put-call parity and
stock return predictability, Journal of Financial and Quantitative Analysis 45, 335–
367.
Dennis, Patrick, and Stewart Mayhew, 2002, Risk-neutral skewness: Evidence from
stock options, Journal of Financial and Quantitative Analysis 37, 471–493.

The Implied Volatility Smirk in the VXX Options Market 20
Dillian, Jared, 2018, Volatility funds worked as intended, that’s the problem,
Bloomberg .
Eraker, Bjorn, and Yue Wu, 2017, Explaining the negative returns to VIX futures
and ETNs: An equilibrium approach, Journal of Financial Economics 125, 72–98.
Fajardo, Jose, 2017, A new factor to explain implied volatility smirk, Applied Eco-
nomics 49, 4026–4034.
Foresi, Silverio, and Liuren Wu, 2005, Crash-o-phobia: a domestic fear or a worldwide
concern?, Journal of Derivatives 13, 8.
Garleanu, Nicolae, Lasse Heje Pedersen, and Allen M Poteshman, 2009, Demand-
based option pricing, Review of Financial Studies 22, 4259–4299.
Gehricke, Sebastian A., and Jin E. Zhang, 2018a, Modeling VXX price, Journal of
Futures Markets, forthcoming .
Gehricke, Sebastian A., and Jin E. Zhang, 2018b, Modeling VXX under jump diffusion
with stochastic long-term mean, Working paper, Otago University .
Gehricke, Sebastian A., and Jin E. Zhang, 2018c, The VIX futures ETN market,
Working paper, Otago University .
Huskaj, Bujar, and Marcus Nossman, 2013, A term structure model for VIX futures,
Journal of Futures Markets 33, 421–442.
Kawa, Luke, 2018, Volatility sellers return to market with a vengeance, Bloomberg .
Lian, Guang-Hua, and Song-Ping Zhu, 2013, Pricing VIX options with stochastic
volatility and random jumps, Decisions in Economics and Finance 36, 71–78.

The Implied Volatility Smirk in the VXX Options Market 21
Lin, Tse-Chun, and Xiaolong Lu, 2015, Why do options prices predict stock returns?
Evidence from analyst tipping, Journal of Banking & Finance 52, 17–28.
Lu, Zhongjin, and Yingzi Zhu, 2010, Volatility components: The term structure
dynamics of VIX futures, Journal of Futures Markets 30, 230–256.
Mencıa, Javier, and Enrique Sentana, 2013, Valuation of VIX derivatives, Journal of
Financial Economics 108, 367–391.
Pan, Jun, 2002, The jump-risk premia implicit in options: Evidence from an inte-
grated time-series study, Journal of Financial Economics 63, 3–50.
Papanicolaou, Andrew, and Ronnie Sircar, 2014, A regime-switching Heston model
for VIX and S&P 500 implied volatilities, Quantitative Finance 14, 1811–1827.
Pena, Ignacio, Gonzalo Rubio, and Gregorio Serna, 1999, Why do we smile? On the
determinants of the implied volatility function, Journal of Banking & Finance 23,
1151–1179.
Rubinstein, Mark, 1985, Nonparametric tests of alternative option pricing models
using all reported trades and quotes on the 30 most active CBOE option classes
from August 23, 1976 through August 31, 1978, Journal of Finance 40, 455–480.
Rubinstein, Mark, 1994, Implied binomial trees, Journal of Finance 49, 771–818.
Shu, Jinghong, and Jin E. Zhang, 2012, Causality in the VIX futures market, Journal
of Futures Markets 32, 24–46.
Skiadopoulos, George, Stewart Hodges, and Les Clewlow, 2000, The dynamics of the
S&P 500 implied volatility surface, Review of Derivatives Research 3, 263–282.

The Implied Volatility Smirk in the VXX Options Market 22
Wang, Zhiguang, and Robert T Daigler, 2011, The performance of VIX option pricing
models: empirical evidence beyond simulation, Journal of Futures Markets 31, 251–
281.
Whaley, Robert E, 2013, Trading volatility: At what cost, Journal of Portfolio Man-
agement 40, 95–108.
Xing, Yuhang, Xiaoyan Zhang, and Rui Zhao, 2010, What does the individual op-
tion volatility smirk tell us about future equity returns?, Journal of Financial and
Quantitative Analysis 45, 641–662.
Zhang, Jin E., Jinghong Shu, and Menachem Brenner, 2010, The new market for
volatility trading, Journal of Futures Markets 30, 809–833.
Zhang, Jin E., and Yi Xiang, 2008, The implied volatility smirk, Quantitative Finance
8, 263–284.
Zhang, Jin E., and Yingzi Zhu, 2006, VIX futures, Journal of Futures Markets 26,
521–531.
Zhu, Song-Ping, and Guang-Hua Lian, 2012, An analytical formula for VIX futures
and its applications, Journal of Futures Markets 32, 166–190.

The Implied Volatility Smirk in the VXX Options Market 23
Tab
le1:
Sum
mary
of
SP
X,
SP
Y,
VIX
and
VIX
futu
res
ET
Popti
on
mark
ets
.
SP
Xop
tion
sSP
Yop
tion
sV
IXop
tion
sV
XX
opti
ons
VX
Zop
tion
sU
VX
Yop
tion
sS
VX
Yop
tion
sV
IXM
opti
ons
VIX
Yop
tion
s
Sty
leE
uro
pea
nA
mer
ican
Eu
rop
ean
Am
eric
anA
mer
ican
Am
eric
anA
mer
ican
Am
eric
anA
mer
ican
Exp
irat
ion
3rd
Fri
day
3rd
Fri
day
30d
ays
bef
ore
3rd
Fri
day
3rd
Fri
day
3rd
Fri
day
3rd
Fri
day
3rd
Fri
day
3rd
Fri
day
3rd
Fri
day
Set
tlem
ent
Cas
hP
hysi
cal
Cas
hP
hysi
cal
Physi
cal
Physi
cal
Physi
cal
Physi
cal
Physi
cal
Un
der
lyin
gS
PX
SP
YV
IXfu
ture
sw
ith
sam
em
atu
rity
VX
XV
XZ
UV
XY
SV
XY
VIX
MV
IXY
Mu
ltip
lier
$100
0×in
dex
100×
pri
ce$1
000×
ind
ex10
0×
pri
ce10
0×
pri
ce10
0×
pri
ce10
0×
pri
ce10
0×
pri
ce10
0×
pri
ce
Ave
rage
Dai
lyO
pti
onV
olu
me
1,07
1,51
72,
715,
706
643,
266
328,
884
312
91,3
4917
,254
521,
278
Ave
rage
Dai
lyO
pen
Inte
rest
12,3
88,3
9019
,429
,209
6,78
5,56
63,
097,
297
7,30
481
0,04
822
3,80
975
915
,707
Un
der
lyin
gA
v-
erag
eD
aily
Vol
-u
me
(000
,000
’s)
$1,3
45,0
80$2
4,64
1-
$1,4
446
799
257
140
Un
der
lyin
gA
v-
erag
eM
arke
tC
ap.
(000
,000
’s
$18,
527,
453
$176
,045
-$9
6553
492
476
2812
6

The Implied Volatility Smirk in the VXX Options Market 24
Tab
le2:
Sum
mary
ofth
eV
XX
opti
on
mark
et
act
ivit
y.T
his
table
show
sth
em
ean
and
med
ian
dai
lynum
ber
ofst
rike
s,tr
adin
gvo
lum
ean
dop
enin
tere
stfo
rth
eV
XX
opti
onm
arke
t.T
he
stat
isti
csar
esh
own
over
all
and
for
each
mat
uri
tyca
tego
ry.
The
stat
isti
csfo
rth
edai
lyop
enin
tere
stor
volu
me
are
calc
ula
ted
asth
em
ean/m
edia
nof
the
dai
lytr
adin
gvo
lum
efo
rea
chm
aturi
ty,
eith
erov
eral
lor
by
the
mat
uri
tyca
tego
rygr
oupin
g.
Ove
rall
By
Mat
uri
ty(d
ays)
<30
30−
9090−
180
180−
360
>36
0<
180
>18
0
Nu
mb
erof
obse
rvat
ion
s12,7
013,
226
3,68
02,
141
1,84
61,
808
9,04
73,
654
Mea
nnu
mb
erof
stri
kes
3847
4238
2621
4324
Med
ian
nu
mb
erof
stri
kes
3645
4137
2420
4222
Mea
nvo
lum
e17,0
3537,1
4919,2
296,
744
3,44
42,
745
22,6
643,
098
Med
ian
volu
me
5,31
924,3
159,
351
3,49
01,
350
1,00
010,1
141,
174
Mea
nop
enin
tere
st16
8,51
822
0,75
618
6,58
814
9,70
612
1,60
510
8,70
819
0,04
411
5,22
4M
edia
nop
enin
tere
st82,6
1390,8
3995,2
3310
0,74
531,8
1971,7
3594,1
4854,1
31

The Implied Volatility Smirk in the VXX Options Market 25
Table 3: Summary of implied volatility function estimation. This table showssummary statistics of the estimated implied volatility function:
IV (ξ) = αo + α1ξ + α2ξ2
where IV is the implied volatility and ξ is the moneyness of the option. The regressionis fitted separately each day and for each maturity. To estimate we minimize thevolume-weighted squared errors. Here, a0, a1 and a2 are the unscaled level, slopeand curvature coefficients, respectively. The mean, median and standard deviationvalues are calculated overall and by maturity categorya. The percentage of significantparameter estimates is the percentage of parameter estimates that are significant atthe 5% level of significance over the entire sample, in each maturity category. Themean volume is calculated as the mean of the daily sum of the trading volume foreach maturity, either overall or by the maturity category grouping. The volume inthis table is different than in table 2 because it includes only the OTM options used tocreate the implied volatility curves. We also present the mean and standard deviationof the forward price overall and by maturity category.
Overall By Maturity (days)
< 30 30− 90 90− 180 180− 360 > 360 < 180 > 180
MeanFTi,t 26.2128 26.4525 26.2454 25.6720 26.3190 26.2624 26.1846 26.2911a0 0.6873 0.6445 0.6847 0.7134 0.7077 0.7243 0.6770 0.7159a1 0.0998 0.1322 0.1298 0.1010 0.0683 −0.0032 0.1239 0.0330a2 0.0034 0.0034 −0.0010 0.0005 0.0038 0.0169 0.0009 0.0102γ0 0.6873 0.6445 0.6847 0.7134 0.7077 0.7243 0.6770 0.7159γ1 0.0683 0.0872 0.0900 0.0723 0.0478 −0.0030 0.0848 0.0227γ2 0.0023 0.0023 −0.0007 0.0003 0.0025 0.0119 0.0006 0.0072
Standard deviationFTi,t 9.9458 9.6291 9.3908 9.8575 10.6165 11.1207 9.5925 10.8666a0 0.1338 0.1807 0.1346 0.0988 0.0808 0.0595 0.1486 0.0716a1 0.0627 0.0358 0.0409 0.0395 0.0430 0.0627 0.0408 0.0644a2 0.0247 0.0108 0.0140 0.0159 0.0226 0.0538 0.0136 0.0416γ0 0.1338 0.1807 0.1346 0.0988 0.0808 0.0595 0.1486 0.0716γ1 0.0500 0.0423 0.0398 0.0330 0.0308 0.0462 0.0399 0.0467γ2 0.0185 0.0082 0.0106 0.0123 0.0173 0.0400 0.0103 0.0310
% significant coefficientsa0 99.99% 99.97% 100.00% 100.00% 100.00% 100.00% 99.99% 100.00%a1 94.23% 99.53% 99.75% 98.76% 90.98% 68.34% 99.44% 79.81%a2 64.73% 73.58% 69.07% 61.67% 50.98% 55.07% 68.96% 53.00%
Daily R-Squaredmean R2 94.55% 98.98% 98.88% 97.07% 91.20% 75.91% 98.49% 83.65%std. dev. R2 13.79% 2.65% 3.23% 8.17% 15.83% 24.91% 4.80% 22.17%
Daily trading volumemean Volume 14,296 29,529 16,114 5,391 3,065 2,569 18,435 2,820
aThere can be more than one expiry in the same maturity category on any given day.
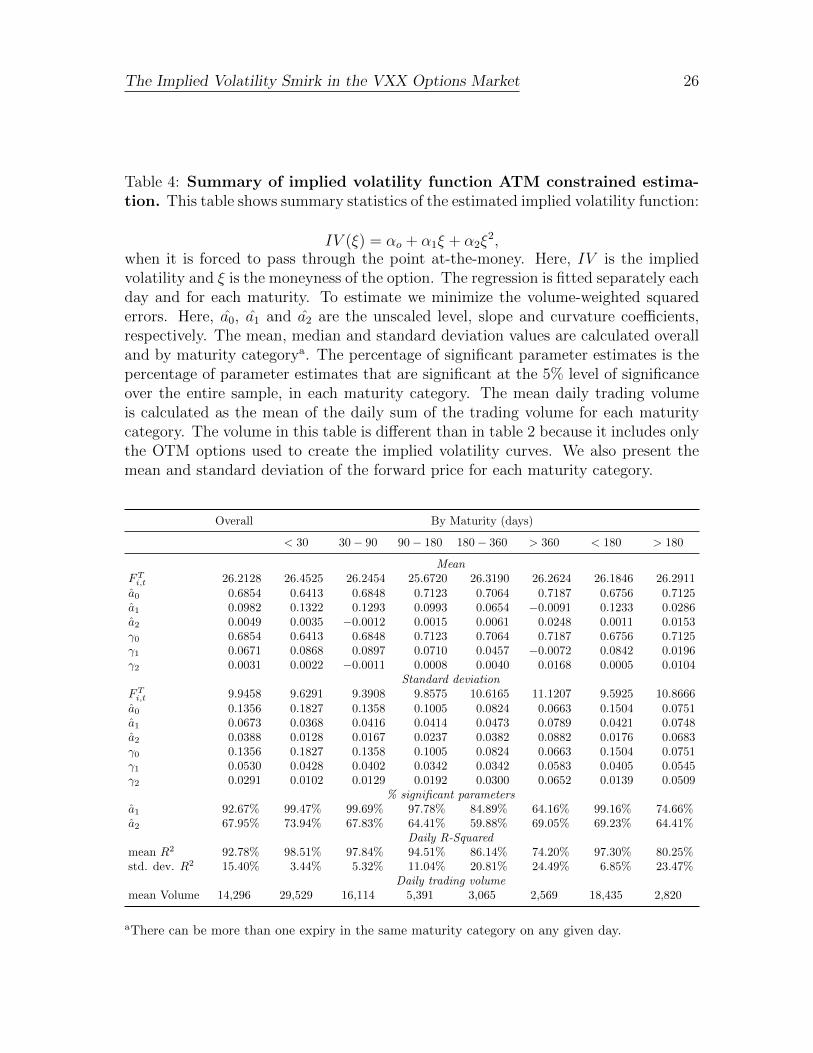
The Implied Volatility Smirk in the VXX Options Market 26
Table 4: Summary of implied volatility function ATM constrained estima-tion. This table shows summary statistics of the estimated implied volatility function:
IV (ξ) = αo + α1ξ + α2ξ2,
when it is forced to pass through the point at-the-money. Here, IV is the impliedvolatility and ξ is the moneyness of the option. The regression is fitted separately eachday and for each maturity. To estimate we minimize the volume-weighted squarederrors. Here, a0, a1 and a2 are the unscaled level, slope and curvature coefficients,respectively. The mean, median and standard deviation values are calculated overalland by maturity categorya. The percentage of significant parameter estimates is thepercentage of parameter estimates that are significant at the 5% level of significanceover the entire sample, in each maturity category. The mean daily trading volumeis calculated as the mean of the daily sum of the trading volume for each maturitycategory. The volume in this table is different than in table 2 because it includes onlythe OTM options used to create the implied volatility curves. We also present themean and standard deviation of the forward price for each maturity category.
Overall By Maturity (days)
< 30 30− 90 90− 180 180− 360 > 360 < 180 > 180
MeanFTi,t 26.2128 26.4525 26.2454 25.6720 26.3190 26.2624 26.1846 26.2911a0 0.6854 0.6413 0.6848 0.7123 0.7064 0.7187 0.6756 0.7125a1 0.0982 0.1322 0.1293 0.0993 0.0654 −0.0091 0.1233 0.0286a2 0.0049 0.0035 −0.0012 0.0015 0.0061 0.0248 0.0011 0.0153γ0 0.6854 0.6413 0.6848 0.7123 0.7064 0.7187 0.6756 0.7125γ1 0.0671 0.0868 0.0897 0.0710 0.0457 −0.0072 0.0842 0.0196γ2 0.0031 0.0022 −0.0011 0.0008 0.0040 0.0168 0.0005 0.0104
Standard deviationFTi,t 9.9458 9.6291 9.3908 9.8575 10.6165 11.1207 9.5925 10.8666a0 0.1356 0.1827 0.1358 0.1005 0.0824 0.0663 0.1504 0.0751a1 0.0673 0.0368 0.0416 0.0414 0.0473 0.0789 0.0421 0.0748a2 0.0388 0.0128 0.0167 0.0237 0.0382 0.0882 0.0176 0.0683γ0 0.1356 0.1827 0.1358 0.1005 0.0824 0.0663 0.1504 0.0751γ1 0.0530 0.0428 0.0402 0.0342 0.0342 0.0583 0.0405 0.0545γ2 0.0291 0.0102 0.0129 0.0192 0.0300 0.0652 0.0139 0.0509
% significant parametersa1 92.67% 99.47% 99.69% 97.78% 84.89% 64.16% 99.16% 74.66%a2 67.95% 73.94% 67.83% 64.41% 59.88% 69.05% 69.23% 64.41%
Daily R-Squaredmean R2 92.78% 98.51% 97.84% 94.51% 86.14% 74.20% 97.30% 80.25%std. dev. R2 15.40% 3.44% 5.32% 11.04% 20.81% 24.49% 6.85% 23.47%
Daily trading volumemean Volume 14,296 29,529 16,114 5,391 3,065 2,569 18,435 2,820
aThere can be more than one expiry in the same maturity category on any given day.
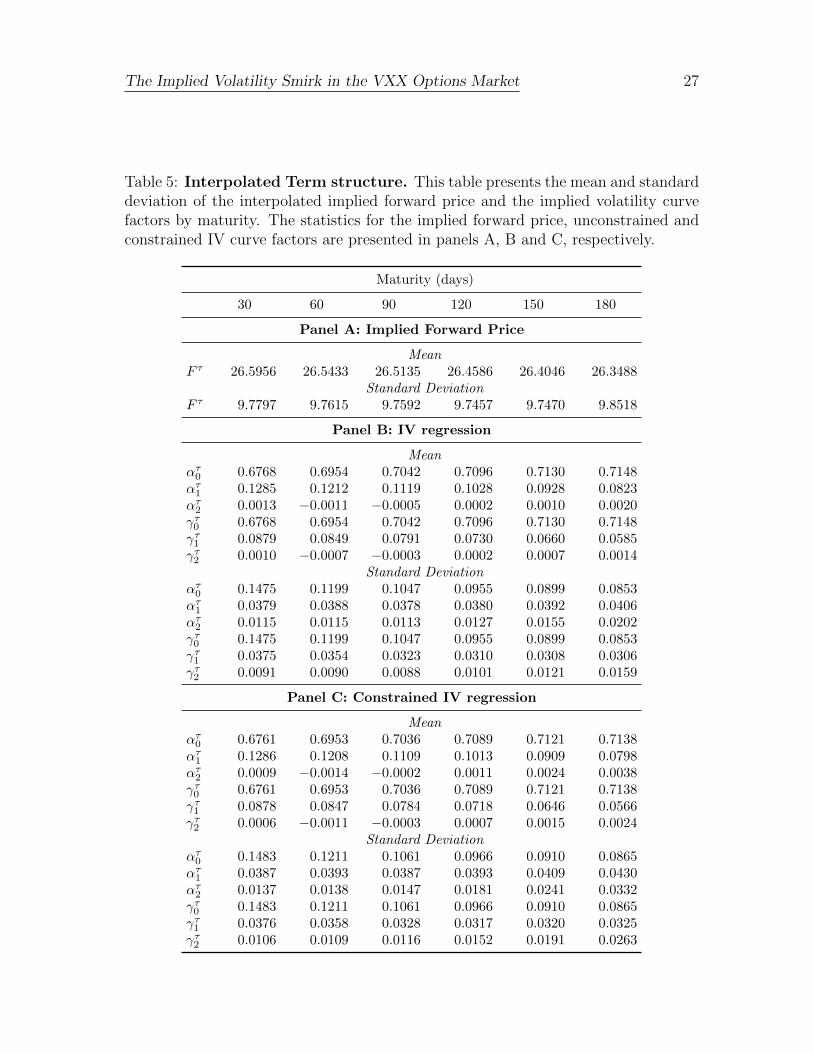
The Implied Volatility Smirk in the VXX Options Market 27
Table 5: Interpolated Term structure. This table presents the mean and standarddeviation of the interpolated implied forward price and the implied volatility curvefactors by maturity. The statistics for the implied forward price, unconstrained andconstrained IV curve factors are presented in panels A, B and C, respectively.
Maturity (days)
30 60 90 120 150 180
Panel A: Implied Forward Price
MeanF τ 26.5956 26.5433 26.5135 26.4586 26.4046 26.3488
Standard DeviationF τ 9.7797 9.7615 9.7592 9.7457 9.7470 9.8518
Panel B: IV regression
Meanατ0 0.6768 0.6954 0.7042 0.7096 0.7130 0.7148ατ1 0.1285 0.1212 0.1119 0.1028 0.0928 0.0823ατ2 0.0013 −0.0011 −0.0005 0.0002 0.0010 0.0020γτ0 0.6768 0.6954 0.7042 0.7096 0.7130 0.7148γτ1 0.0879 0.0849 0.0791 0.0730 0.0660 0.0585γτ2 0.0010 −0.0007 −0.0003 0.0002 0.0007 0.0014
Standard Deviationατ0 0.1475 0.1199 0.1047 0.0955 0.0899 0.0853ατ1 0.0379 0.0388 0.0378 0.0380 0.0392 0.0406ατ2 0.0115 0.0115 0.0113 0.0127 0.0155 0.0202γτ0 0.1475 0.1199 0.1047 0.0955 0.0899 0.0853γτ1 0.0375 0.0354 0.0323 0.0310 0.0308 0.0306γτ2 0.0091 0.0090 0.0088 0.0101 0.0121 0.0159
Panel C: Constrained IV regression
Meanατ0 0.6761 0.6953 0.7036 0.7089 0.7121 0.7138ατ1 0.1286 0.1208 0.1109 0.1013 0.0909 0.0798ατ2 0.0009 −0.0014 −0.0002 0.0011 0.0024 0.0038γτ0 0.6761 0.6953 0.7036 0.7089 0.7121 0.7138γτ1 0.0878 0.0847 0.0784 0.0718 0.0646 0.0566γτ2 0.0006 −0.0011 −0.0003 0.0007 0.0015 0.0024
Standard Deviationατ0 0.1483 0.1211 0.1061 0.0966 0.0910 0.0865ατ1 0.0387 0.0393 0.0387 0.0393 0.0409 0.0430ατ2 0.0137 0.0138 0.0147 0.0181 0.0241 0.0332γτ0 0.1483 0.1211 0.1061 0.0966 0.0910 0.0865γτ1 0.0376 0.0358 0.0328 0.0317 0.0320 0.0325γτ2 0.0106 0.0109 0.0116 0.0152 0.0191 0.0263

The Implied Volatility Smirk in the VXX Options Market 28
Figure 1: Option Volume and Open Interest. This figure shows the 10-daymoving average of the daily trading volume and open interest of the VIX, VXX,VXZ, UVXY, SVXY, VIXM and VIXY option markets.

The Implied Volatility Smirk in the VXX Options Market 29
Figure 2: IV against moneyness on 27 July 2011. This figure plots the IV ofVXX options against the moneyness for different maturities as at the close of 27 July2011. The circles are computed from market prices of out-of-the-money calls andputs. The solid line is the fitted quantified IV curve. The bar chart is the tradingvolume for the corresponding options traded on 27 July 2011.

The Implied Volatility Smirk in the VXX Options Market 30
Figure 3: IV against moneyness on 2 August 2013. This figure plots the IVof VXX options against the moneyness for different maturities as at the close of 2August 2013. The circles are computed from market prices of out-of-the-money callsand puts. The solid line is the fitted quantified IV curve. The bar chart is the tradingvolume for the corresponding options traded on 2 August 2013.
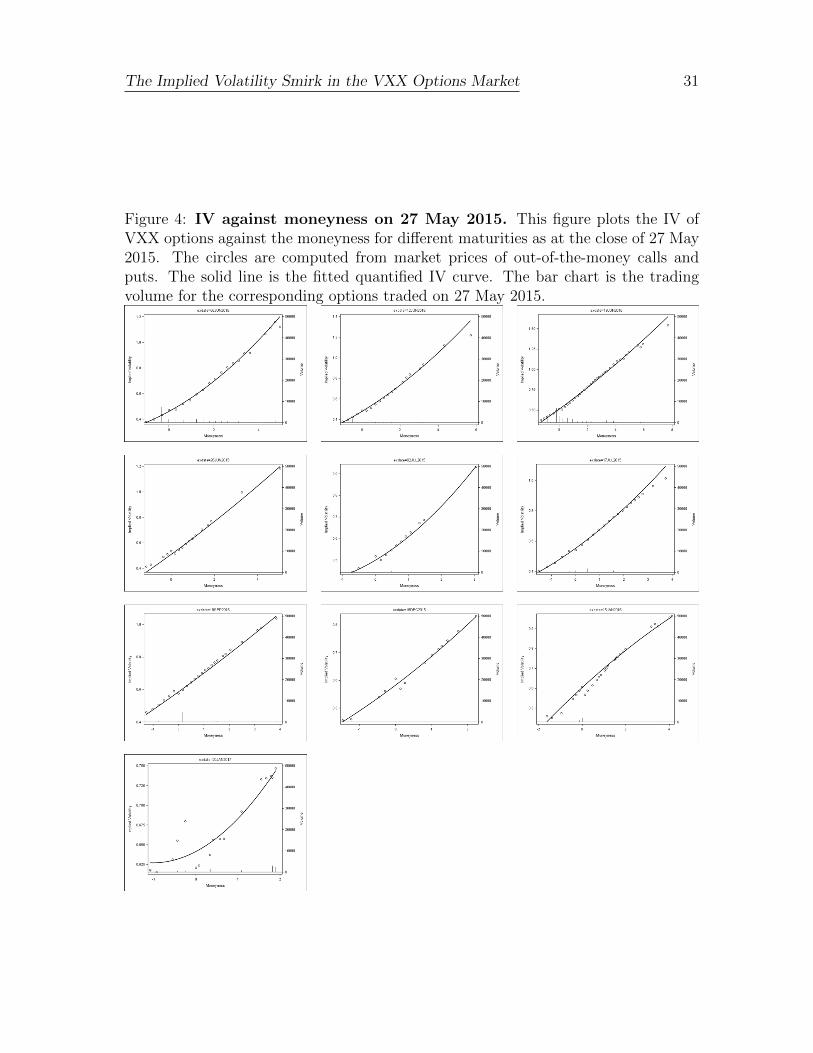
The Implied Volatility Smirk in the VXX Options Market 31
Figure 4: IV against moneyness on 27 May 2015. This figure plots the IV ofVXX options against the moneyness for different maturities as at the close of 27 May2015. The circles are computed from market prices of out-of-the-money calls andputs. The solid line is the fitted quantified IV curve. The bar chart is the tradingvolume for the corresponding options traded on 27 May 2015.

The Implied Volatility Smirk in the VXX Options Market 32
Figure 5: IV against moneyness on 29 July 2011: with restraint This figureplots the IV of VXX options against the moneyness for different maturities as at theclose on 29 July 2011. The circles are computed from market prices of out-of-the-money calls and puts. The solid line is the fitted quantified IV curve. The bar chartis the trading volume for the corresponding options traded on 29 July 2011.

The Implied Volatility Smirk in the VXX Options Market 33
Figure 6: IV against moneyness on 2 August 2013: with restraint This figureplots the IV of VXX options against the moneyness for different maturities as at theclose on 2 August 2013. The circles are computed from market prices of out-of-the-money calls and puts. The solid line is the fitted quantified IV curve. The bar chartis the trading volume for the corresponding options traded on 2 August 2013.

The Implied Volatility Smirk in the VXX Options Market 34
Figure 7: IV against moneyness on 27 May 2015: with restraint This figureplots the IV of VXX options against the moneyness for different maturities as at theclose on 27 May 2015. The circles are computed from market prices of out-of-the-money calls and puts. The solid line is the fitted quantified IV curve. The bar chartis the trading volume for the corresponding options traded on 27 May 2015.

The Implied Volatility Smirk in the VXX Options Market 35
Figure 8: IV curves from mean factors. This figure shows the IV curves predictedby the mean factors (level, slope and curvature) for different maturity categories.The top plot shows this for the unconstrained while the bottom plot shows it for theconstrained, regression.

The Implied Volatility Smirk in the VXX Options Market 36
Fig
ure
9:T
erm
stru
cture
of
mean
inte
rpola
ted
fact
ors
.T
his
figu
resh
ows
the
term
stru
cture
ofth
em
ean
inte
rpol
ated
fact
ors
(lev
el,
slop
ean
dcu
rvat
ure
)an
dth
eir
one
stan
dar
ddev
iati
onban
ds.
The
unco
nst
rain
edan
dco
nst
rain
edre
gres
sion
resu
lts
are
show
nin
the
top
and
bot
tom
row
ofplo
ts,
resp
ecti
vely
.

The Implied Volatility Smirk in the VXX Options Market 37
Figure 10: Time series of Interpolated ATM IV and forward prices. Thisfigure presents the time series of the interpolated ATM IV and forward prices for the30 day and 180 day maturities (left) and their differences (right).
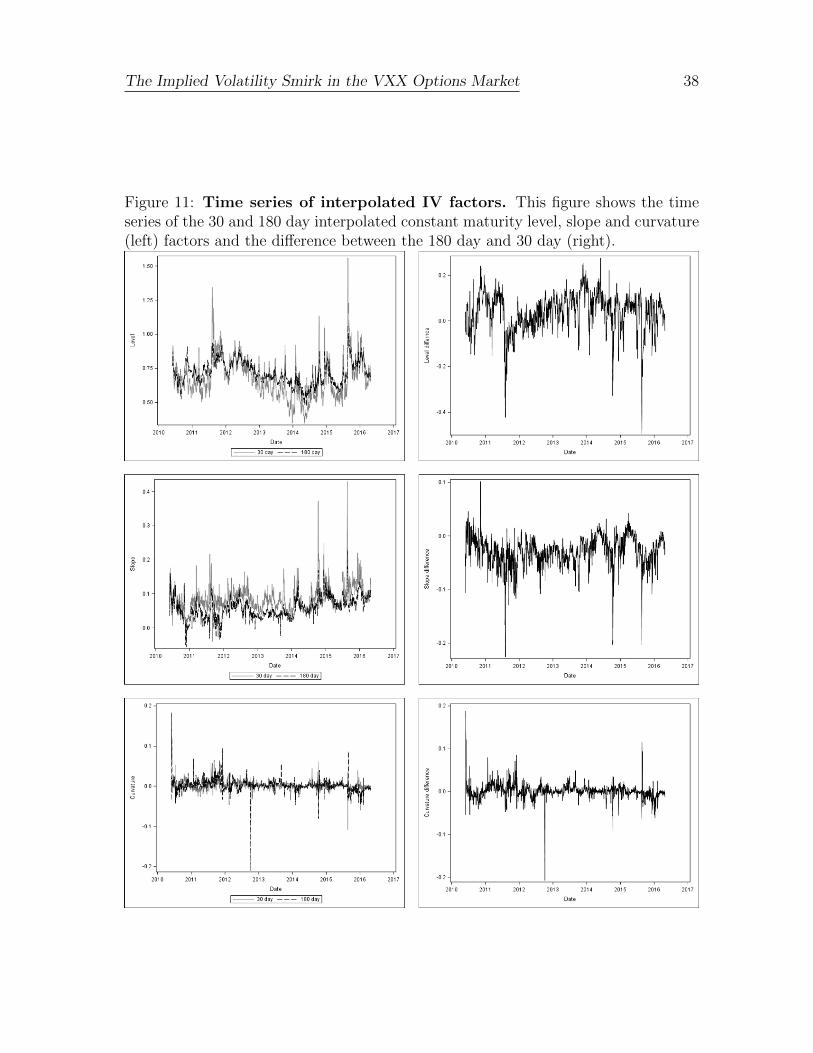
The Implied Volatility Smirk in the VXX Options Market 38
Figure 11: Time series of interpolated IV factors. This figure shows the timeseries of the 30 and 180 day interpolated constant maturity level, slope and curvature(left) factors and the difference between the 180 day and 30 day (right).

The Implied Volatility Smirk in the VXX Options Market 39
Figure 12: Time series of Interpolated coefficients: constrained. This figureshows the time series of the 30 and 180 day interpolated constant maturity level,slope and curvature (left) factors and the difference between the 180 day and 30 day(right), when the fitted curve is forced to cross the point of ATM IV.

The Implied Volatility Smirk in the VXX Options Market 40
Figure 13: IV curves from mean interpolated coefficients. This figure showsthe IV curves predicted by the mean interpolated factors (level, slope and curvature)for different maturities. The top plot shows this for the unconstrained while thebottom plot shows it for the constrained regression.


![Smile in the low moments - WordPress.com€¦ · A new expansion: moneyness Moneyness expansion: rigorous and general [De Leo et al., 2013] It involves moments of order](https://img.pdfslide.us/doc/110x75/5f2fff7abb31b558f6770799/smile-in-the-low-moments-a-new-expansion-moneyness-moneyness-expansion-rigorous.jpg)