Embed Size (px)
Citation preview
Queen Elizabeth House, University of Oxford, Mansfield Rd, OX1 3TB, UK Tel: +44 1865 281810; Fax: +44 1865 281801; http://www.crise.ox.ac.uk/
© Centre for Research on Inequality, Human Security and Ethnicity
The UK Department of International Development (DFID) supports policies,
programmes and projects to promote international development. DFID provided funds for this study as part of that objective, but the views and opinions expressed are those of the author(s) alone.
The Implications of Horizontal and Vertical Inequalities for Tax
and Expenditure Policies
Frances Stewart, Graham Brown and Alex Cobham
CRISE Working Paper No. 65
February, 2009
CRISE Working Paper No. 65
1
The Implications of Horizontal and Vertical Inequalities for Tax and Expenditure Policies Abstract This paper identifies fiscal policies, specifically tax and expenditure policies, that would contribute to reducing horizontal (or group) inequalities (HIs). It reviews how to identify relevant groups and how best to measure inequalities between them – both in income and in other dimensions. It notes the lack of adequate socioeconomic data broken down according to ethno-cultural categories in many countries, and suggests ways in which existing data may be used instead. It then looks firstly at taxation policy, and identifies changes to such policy that would contribute to reducing HIs. These include improving the progressiveness of the tax structure; tailoring taxes to group behaviour; altering the regional balance of taxation and revenue distribution; and raising the amount of tax collected to provide revenue for HI-reducing expenditures. Turning to expenditure policies, it notes that improvements in HI can be brought about through reallocation in the production, operation and consumption of publicly funded services. Policies are outlined for each category. These include: affirmative action policies changing group participation in government contracts for the construction of public facilities and in employment in the public sector; a focus on pro-poor public goods and those that favour particular groups; locating a higher proportion of public goods in regions where poor groups are concentrated; and appropriately designed transfer payments. The paper then provides an example, by reviewing the ways in which fiscal policies were used to reduce HIs in Malaysia. It concludes by setting out the processes by which the policies proposed could be put into practice.
The authors Frances Stewart is Professor of Development Economics and Director of the Centre for Research on Inequality, Human Security and Ethnicity at the University of Oxford. Graham Brown is Senior Lecturer, Economics and International Development, at the Department of Economics and International Development, University of Bath, and a CRISE Research Associate. Alex Cobham is Policy Manager at Christian Aid, but contributed this section while working as Supernumerary Fellow in Economics at St Anne's College, Oxford. (Views expressed are personal and should not be attributed to either organisation).
CRISE Working Paper No. 65
2
Table of Contents 1. Introduction .................................................................................................................3 2. The scoping exercise: Defining groups........................................................................5 3. Measurement and data issues.....................................................................................6
3.1 Measuring horizontal inequality in incomes............................................................6 3.2 Non-income dimensions of inequality ..................................................................11 3.3 Data...................................................................................................................12
4. Tax policy..................................................................................................................14 4.1 Improving the progressiveness of the tax structure..............................................16 4.2 Tailoring taxes to group behaviour.......................................................................17 4.3 Altering the regional balance of taxation and revenue distribution .......................18
5. Expenditure Policy.....................................................................................................21 6. An example of the use of fiscal policies to improve HIs: the case of Malaysia ...........26
6.1 Revenue-raising ..................................................................................................27 6.2 Government expenditure ....................................................................................29
7. Process .....................................................................................................................34 7.1 Obstacles and trade-offs......................................................................................35
8. Conclusions...............................................................................................................36 References....................................................................................................................40
List of Figures and Tables
Figure 1: Relative representation of Whites and Blacks in income category, South Africa 1996......................................................................................................................9 Figure 2: Comparison of mean incomes in within-group quintiles, South Africa 1996 ....10 Figure 3: Comparison of �-means, South Africa 1996 ...................................................11 Figure 4: Comparison of White:Black �-means ratios, South Africa 1996 and 2001 ......11 Figure 5: Relative representation of Muslims vis-à-vis Christians in Central Sulawesi, Indonesia ......................................................................................................................12 Figure 6: Government revenue, ex grants, as % GDP selected developing countries 2005 [*=2000]................................................................................................................19 Figure 7: Malaysia – Chinese:Bumiputera mean household income ratios by quintile, 1970-1999.....................................................................................................................27 Figure 8: Malaysia – Tax revenue, 1960 – 2003............................................................28 Figure 9: Malaysia – Composition of tax revenue, 1990 – 2003 ....................................28 Figure 10: Malaysia: Tax Share in Relation to Population Share ...................................29 Figure 11: Malaysia: Tax Share in Relation to Income Share ........................................29 Figure 12: Malaysia: Share of Benefits from Government Expenditure in Relation to Population Share...........................................................................................................33 Table 1: Sudan – Regional HIs (1993) and fiscal response (1996-2000) .........................5 Table 2: Malaysia – Ownership of domestically-held share capital (at par value) of limited companies by ethnic group and sector, 2004, % ................................................30 Table 3: Malaysia – Regression analysis of determinants of state development allocation, 1980-2006. ...................................................................................................32
CRISE Working Paper No. 65
3
The Implications of Horizontal and Vertical Inequalities for Tax and Expenditure Policies
By Frances Stewart, Graham Brown and Alex Cobham1
1. Introduction This paper reviews fiscal policies towards horizontal inequality. Fiscal policies include both the level and composition of taxation and expenditure; here we are primarily concerned with the composition. Societal inequality can be viewed in many ways. One important issue is the distinction between vertical (VI) and horizontal (HI) inequality (i.e. inequality among individuals and among groups); other issues are the dimension(s) in which inequality is measured (i.e. inequality of what); and whether the concern is with inequality at a point of time, or changes over time; and when one is concerned with group inequalities (HIs), the choice of groups is a critical issue. Vertical inequality consists in inequality among individuals or households, while horizontal inequality is defined as inequality among groups, typically culturally defined – e.g. by ethnicity, religion or race. The nature and extent of vertical inequality is important for a number of reasons: one is that of creating a just society; secondly, the extent of inequality, for any given national income per capita, determines the level of poverty; similarly, thirdly, happiness tends to be higher in more equal societies (Graham and Pettinato, 2002; Luttmer, 2004); fourthly, there is evidence that more equal economies grow faster (Alesina and Rodrik, 1994; World Bank, 2006); and fifthly, higher inequality is associated with higher rates of criminality (Bourgignon, 2001). Therefore developing policies to reduce VI is important. However, horizontal inequalities, rather than vertical, are particularly important in conflict-prone societies, since there is growing evidence that the nature and level of HIs are important determinants of the risk of violent conflict. Violent conflict in turn undermines development and increases poverty levels (Stewart, 2001; Collier and World Bank, 2003). Although it seems plausible that high levels of vertical inequality would generate resentment and fuel conflict, the evidence on the relationship between VI and conflict is inconclusive (Collier and Hoeffler, 2004; Auvinen & Nafziger, 1999; Lichbach, 1989). But more evidence supports the view that inter-group inequality can be a source of violent conflict (Stewart 2000; Mancini 2005; Østby 2006). Group inequality generates powerful grievances which leaders can use to mobilise people to political protest, by calling on cultural markers (a common history, language or religion) and pointing to group exploitation. Such mobilisation seems especially likely where there is political as well as economic inequality, because then not only are the group leaders excluded from formal political power, but the mass of group members are economically deprived and consequently have significant grievances. What matter, of course, are not actual inequalities but perceptions of inequality and unfairness in the system. These may not always be the same as observed inequalities, since political leaders, the media and education can affect perceptions. Nonetheless, evidence indicates that where observed inequalities are higher, conflict is more likely. 1 We are grateful for ideas and comments on previous drafts from Arnim Langer and Jim Boyce.
CRISE Working Paper No. 65
4
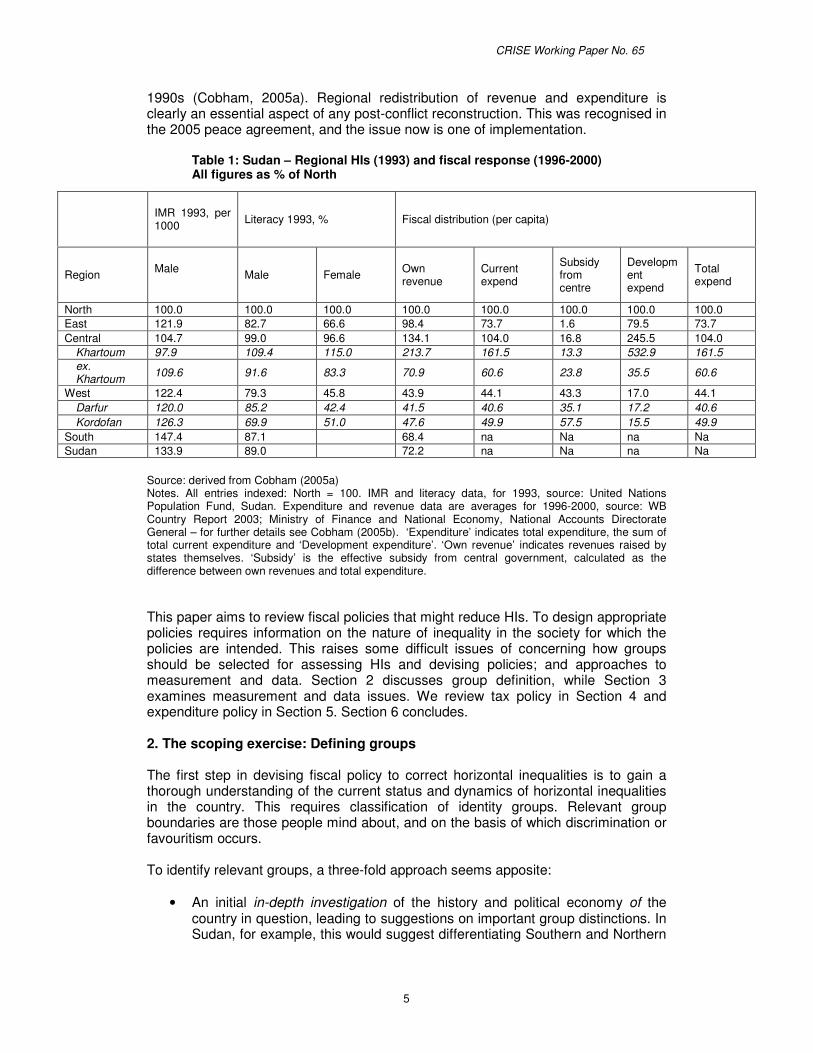
Examples where group inequalities have been a factor in provoking conflict include Côte d'Ivoire, Rwanda, Northern Ireland, Nepal, Chiapas and Sudan, to mention just a few. It is not only deprived groups that initiate conflict – richer groups may do so too to preserve their privileges, as in the Biafran case. The politically relevant HI varies across societies – for example, land was a major issue in the conflict between the white and black population in Zimbabwe, but in Northern Ireland the conflict between Protestants and Catholics involved housing and employment. Policies should be directed towards the particular dimensions of HI that cause resentment. Hence while it is important to tackle both VI and HI, for countries at risk of conflict, it is particularly vital to reduce HIs, especially where these have been a major past source of conflict. This paper is devoted to policies towards HI partly for this reason, and partly because this area is much less researched than that of reducing VI. However, reductions in one type of inequality (i.e. VI or HI) normally, but not invariably, will reduce the other so that there is some overlap in policies and the policies considered specifically to reduce HI may also reduce VI. Inequality is multidimensional. Although VI is typically measured in terms of income, and occasionally assets, the measurement of HI extends to a broad range of political, economic and social variables. For example, economic inequalities include assets (financial, natural resources, human and social capital), as well as employment and incomes; social HIs include access to services (education, health services, housing) and also outcomes in the form of human indicators (for example, life expectancy or literacy); and political HIs consist in the group distribution of political participation and control. This more encompassing approach is required because the salient HIs vary across societies: inequality in land, employment, education, and political access, for example, can provoke resentments and conflict. Fiscal policy is one important way in which governments can tackle inequality of both kinds, with taxation particularly relevant to economic inequalities and expenditure to social inequalities, though it too can affect economic inequalities. While most policies towards political inequalities lie outside the fiscal system (in constitutional arrangements, for example), decentralisation of the fiscal system, involving devolution of power over revenue raising and expenditure, can empower local groups and may thereby reduce political HIs. However, the chain that links paying taxes with holding government to account sets up a potentially powerful channel for taxation to address or to embed political inequalities. The case of Sudan illustrates the need for reform of the fiscal system to reduce HIs in a conflict context. Severe and longstanding socioeconomic and political HIs were a clear element in the decades-long North/South conflict and are also relevant to the Darfur situation. Political HIs have been sharp since (and indeed before) independence, with the ‘North’ region, comprising about 5% of the population, managing to exert a firm and continuous grip on political power. Moreover, there are also severe socioeconomic HIs. This is illustrated in Table 1, showing the infant mortality rate is systematically higher and literacy lower than in the North throughout the country (apart from in the capital, Khartoum, in the Centre), with the worst situation in the South. Literacy rates show similar disparities. The West (especially Darfur) has also suffered. Data for doctors and health visitors per person, for example, show that Darfur has just one fifth of the levels attained in the North (Cobham, 2005a). Moreover, as the table indicates, fiscal transfers far from offsetting actually reinforce these HIs, with the Western region receiving less than half that of the North – unfortunately no data are available for the South. The gaps in development expenditure are especially dramatic, and HIs did indeed widen over the
CRISE Working Paper No. 65
5
1990s (Cobham, 2005a). Regional redistribution of revenue and expenditure is clearly an essential aspect of any post-conflict reconstruction. This was recognised in the 2005 peace agreement, and the issue now is one of implementation.
Table 1: Sudan – Regional HIs (1993) and fiscal response (1996-2000) All figures as % of North
Source: derived from Cobham (2005a) Notes. All entries indexed: North = 100. IMR and literacy data, for 1993, source: United Nations Population Fund, Sudan. Expenditure and revenue data are averages for 1996-2000, source: WB Country Report 2003; Ministry of Finance and National Economy, National Accounts Directorate General – for further details see Cobham (2005b). ‘Expenditure’ indicates total expenditure, the sum of total current expenditure and ‘Development expenditure’. ‘Own revenue’ indicates revenues raised by states themselves. ‘Subsidy’ is the effective subsidy from central government, calculated as the difference between own revenues and total expenditure. This paper aims to review fiscal policies that might reduce HIs. To design appropriate policies requires information on the nature of inequality in the society for which the policies are intended. This raises some difficult issues of concerning how groups should be selected for assessing HIs and devising policies; and approaches to measurement and data. Section 2 discusses group definition, while Section 3 examines measurement and data issues. We review tax policy in Section 4 and expenditure policy in Section 5. Section 6 concludes. 2. The scoping exercise: Defining groups The first step in devising fiscal policy to correct horizontal inequalities is to gain a thorough understanding of the current status and dynamics of horizontal inequalities in the country. This requires classification of identity groups. Relevant group boundaries are those people mind about, and on the basis of which discrimination or favouritism occurs. To identify relevant groups, a three-fold approach seems apposite:
• An initial in-depth investigation of the history and political economy of the country in question, leading to suggestions on important group distinctions. In Sudan, for example, this would suggest differentiating Southern and Northern
IMR 1993, per 1000 Literacy 1993, % Fiscal distribution (per capita)
Region Male Male Female Own
revenue Current expend
Subsidy from centre
Development expend
Total expend
North 100.0 100.0 100.0 100.0 100.0 100.0 100.0 100.0 East 121.9 82.7 66.6 98.4 73.7 1.6 79.5 73.7 Central 104.7 99.0 96.6 134.1 104.0 16.8 245.5 104.0
Khartoum 97.9 109.4 115.0 213.7 161.5 13.3 532.9 161.5 ex. Khartoum 109.6 91.6 83.3 70.9 60.6 23.8 35.5 60.6
West 122.4 79.3 45.8 43.9 44.1 43.3 17.0 44.1 Darfur 120.0 85.2 42.4 41.5 40.6 35.1 17.2 40.6 Kordofan 126.3 69.9 51.0 47.6 49.9 57.5 15.5 49.9
South 147.4 87.1 68.4 na Na na Na Sudan 133.9 89.0 72.2 na Na na Na
CRISE Working Paper No. 65
6
groups while in Rwanda, the Hutus and Tutsis would emerge as clearly salient groups.
• Drawing on surveys of people’s own perceptions of identity distinctions, where available, or carrying out such a survey. Such surveys ask people which groups they feel are privileged or deprived, favoured or disfavoured by the government, and the importance of different aspects of identity to the people themselves.
• Adopting a multiple approach, taking a variety of group classifications (ethnic, regional, religious) and seeing where the main inequalities emerge.
Besides defining the significant groups, the scoping exercise should address three further questions that are relevant for policy design:
• Whether the salient groups are ranked hierarchically (where most members of one group are better off than other group(s)), or unranked, where each group contains rich and poor individuals (Horowitz, 1985). Where they are ranked hierarchically, progressive taxation will improve both VI and HI.
• Whether groups are mainly geographically concentrated, or dispersed. Where groups are geographically concentrated, the regional distribution of taxation and expenditure will affect HIs.
• Whether groups are specialised on particular activities (e.g. one group being mainly traders; another subsistence farmers; another cash crop farmers). Where groups are specialised, special taxes and incentives may assist particular groups.
Finally, it is important to understand the government’s political inclinations: notably whether the government wants to tackle inequality (of either or both kinds), or wishes to preserve inequalities. For shorthand, we describe these two types of governments as ‘willing’ or ‘unwilling’ though in fact the situation is rarely so clear cut. Working with a willing government requires assistance on policy design and execution. However, working with an unwilling government presents much more serious problems – both of legitimacy of policy interventions which are counter to government objectives, and also of the possibility of achieving much in this context. Generating and making available data on the nature of inequalities is likely to be an important step in re-framing the political context. This occurred in Sudan with the publication of the Black Book. It is clearly preferable (and has more legitimacy) if such data are generated and published internally, as in Sudan, rather than by outsiders.
3. Measurement and data issues 3.1 Measuring horizontal inequality in incomes To start with, we assume that incomes are being used as the measure of performance. As far as VI is concerned, the Gini coefficient is a helpful shorthand measure of the whole distribution – for which intuitive understanding has developed – while more information on particular areas in the distribution can be assessed by data on the decile or quintile shares. But providing summary information on HIs is more complex precisely because we are now concerned with groups. Two issues arise in particular. One is how to summarise information on group inequality for societies where there are more than two groups. The other is whether and how to
CRISE Working Paper No. 65
7
explore differences across the whole distribution of each group, or just to focus on comparisons of mean performance. On the first issue, a variety of aggregate measures can be adopted (see Stewart, Brown and Mancini, 2005, for a discussion of ways of aggregating HIs where there are more than two groups). However, presenting an aggregate figure summarising HIs for all groups is not very helpful from a policy perspective as one needs to know why and how particular groups are unequal, and aggregate measures conceal this. Consequently, the best approach in considering fiscal policy is to take each group and measure its performance first against the national performance and secondly, in comparison with major other salient groups. The second issue is very relevant to policy design. The performance of the group includes the whole distribution of the group (i.e. the performance of every member). This is most frequently represented by the average per capita performance, thus concealing distributional differences within groups. Yet from political and policy design perspectives, how groups compare at different points in the distribution is relevant. The following cases need to be distinguished:
1. Case 1, where one group outperforms another at every income level;
2. Case 2, where a group’s elite (e.g. top 5%) has incomes far higher than the elite of the other group, but the remaining 95% of the distribution have similar income levels;
3. Case 3, where both groups are broadly equal at the top, but the bottom 40% of one group is far poorer than the bottom 40% of the other;
4. Case 4, where one group has higher income levels at the top of the distribution, but lower at the bottom.
These differences have both political and policy implications. From a political perspective, in the first case, both the elite and the masses have grievances and so rebellion may be likely. Malaysia in the 1960s and Apartheid South Africa are examples. In the second case, the elite has a grievance but not the rest of the population which makes rebellion less likely.2 In the third and fourth cases, the biggest grievances will be among the lower income groups – but lacking leadership they may not rebel, unless the elite are politically disenfranchised or threatened. In that case they will find it easy to mobilise support among the lower income groups – the Rwandan situation in 1994 is an example. The differences are relevant from a policy perspective too. In the first case, policies are needed both to increase opportunities at the top (capital ownership and entrepreneurial and civil service opportunities) and to provide basic services and economic opportunities to the masses; in the second case, the focus should be on elite opportunities, while in the third and fourth cases it is a matter of improving the position of the worst off.
2 Calabar in Nigeria is an example where the elites of the Quas and the Efuts perceived themselves to be disadvantaged compared with the Efiks in political appointments and business opportunities, but the mass of the population felt they were equally treated with respect to employment and amenities. No conflict occurred there, while in neighbouring Warri where there were both elite and popular perceptions of HIs there have been recurrent violent conflicts (Ukiwo, 2008).
CRISE Working Paper No. 65
8
Group distributional data should therefore be analysed. Three useful ways of presenting the data are:
1. Comparing the proportions of each group in each income quantile relative to its proportion in the overall population. This enables one to see how far particular groups are over or underrepresented at different points in the income distribution, but does not indicate directly the extent of income disparities between groups. 2. Secondly, dividing the income distribution of each group into n quantiles and comparing group means for each quantile. This approach allows us to see how the richest quantile of one group compares with that of another, and similarly for the other quantiles. 3 3. The third approach (�-means) derived from the work of Foster4 (�-means: Appendix, Equation B6), is to calculate group means for each group at different points of the income distribution by using parametric means. The value of the parameter determines how much weight is given to different sections of the distribution. Hence the estimate of HI would vary according to the chosen value of the parameter, �. This method is conceptually similar to the second approach. The main difference is that whereas q-means are calculated on sections of the group’s income distribution, �-means are calculated over the entire range of the group’s distribution but with different portions weighted differently according to the value of �. It is in principle possible to set � such that the difference between �-means and q-means becomes negligible. For some values of α the expression reduces to more familiar statistics. For instance, it is equivalent to the arithmetic mean of achievements of all group members where 1=α , and the geometric mean where 0=α . For values of
1<α , �-means are more sensitive to population performance at low values of achievement, and increasingly so as � becomes smaller. For values of 1>α , more weight is given to higher achievements, again increasing the higher the value of �. Comparing �-means for different values of � thus indicates how HIs differ in different parts of the income distributions of the two groups and thus, like the first method, allows a comparison of group means in different quantiles of each group’s distribution of the variable of achievement.
We can illustrate these methods using income data from the 1996 and 2001 South African censuses.5 We focus on the White and Black population, without considering the other groups. In addition, reported zero incomes are excluded, which therefore underestimates the level of horizontal inequalities, as Blacks are over-represented in this category.6 The data are nonetheless sufficient to illustrate our methods. Figure 1 shows the relative representation of each group in each income category (Method 1). The picture is unsurprising; Whites are under-represented in the lower categories, Blacks in the higher categories. As Blacks constitute such a large
3 Of course, averages conceal differences. But they are also useful and intuitively comprehensible summaries. 4 See Foster and Szekely (2006) and Foster, Lopez-Calva, and Szekely (2003) for details. Foster et al. define these parametric means as “general means”. 5 Data obtained from the Integrated Public Use Microdata Series (IPUMS) at the Minnesota Population Center, University of Minnesota. 6 There are also some technical problems with the data, as they are presented in categories rather than as a continuum. Hence, quintiles have been extrapolated and intra-quintile means calculated on the basis of the categorical mid-point.
CRISE Working Paper No. 65
9
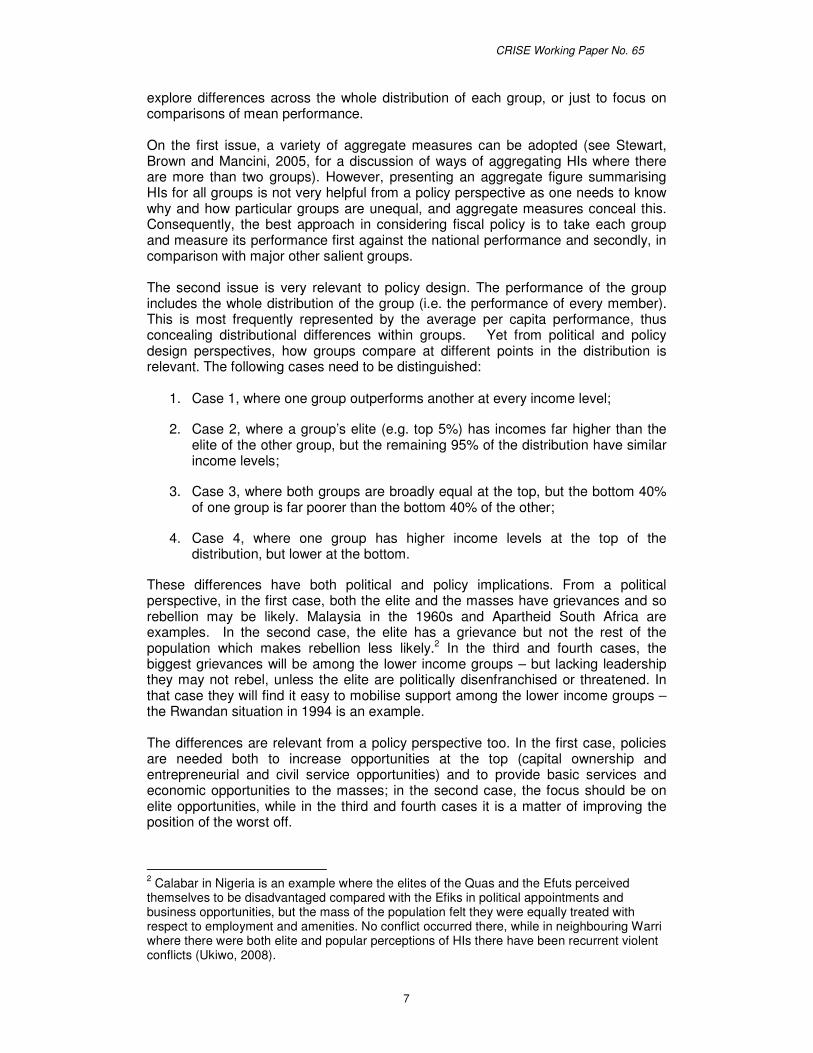
proportion of the overall population, however, it is difficult from this graph to interpret where in the distribution curve the inequality lies.
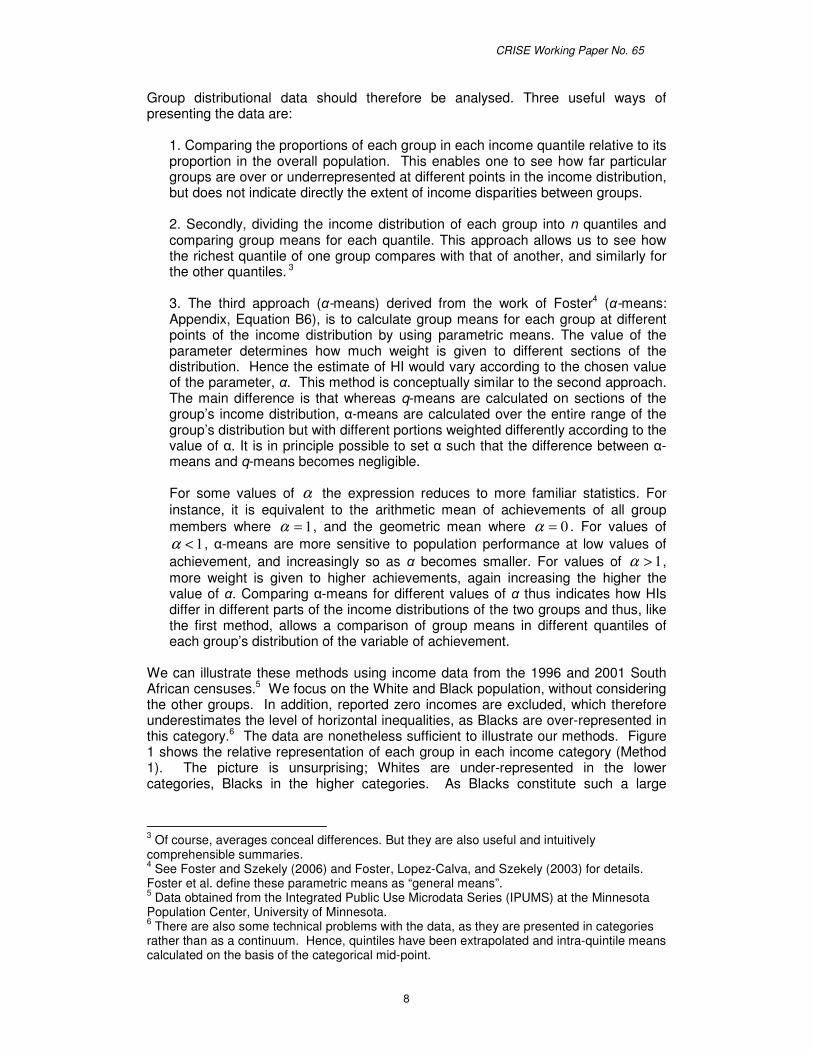
Figure 1: Relative representation of Whites and Blacks in income category, South Africa 1996 Figure 2 demonstrates Method 2 (q-means) applied to the same data, by generating within-group income quintiles and then comparing the mean of the respective quintiles across groups. As with Method 1, it is immediately clear that White incomes are substantially higher, but this method allows us to compare across quintiles more easily (the ratio) and we can see that the level of disparity is in fact highest in the second and third quintile.
CRISE Working Paper No. 65
10
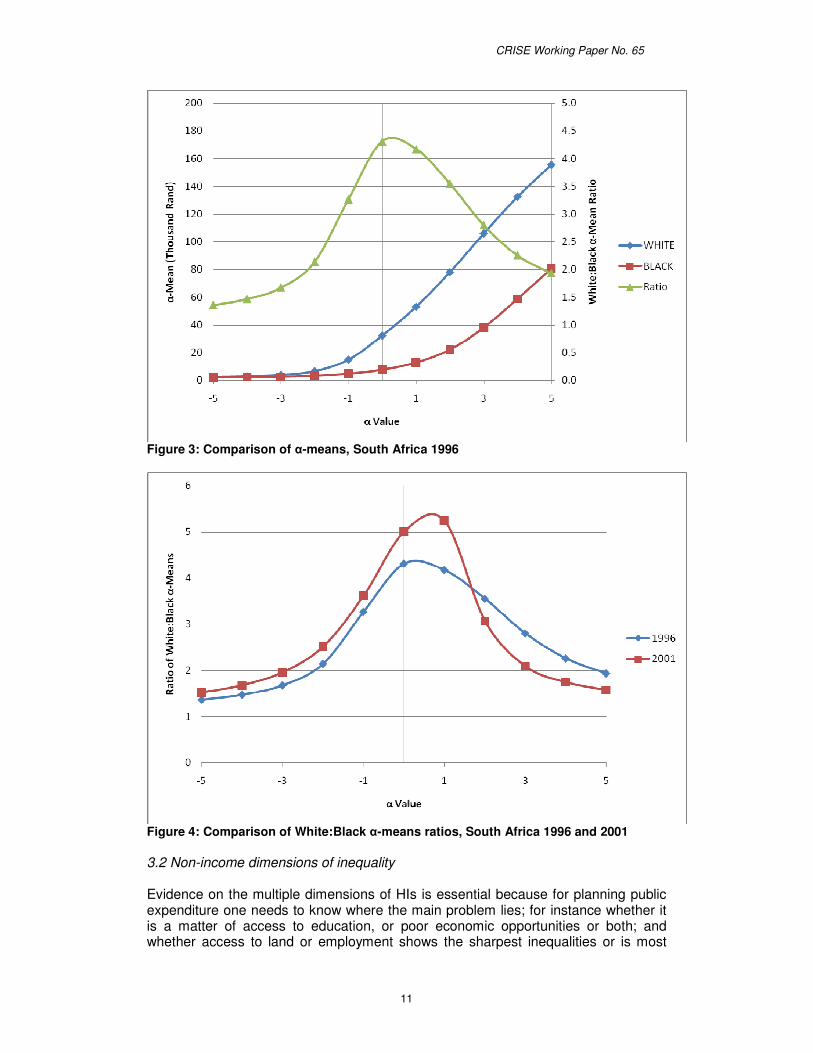
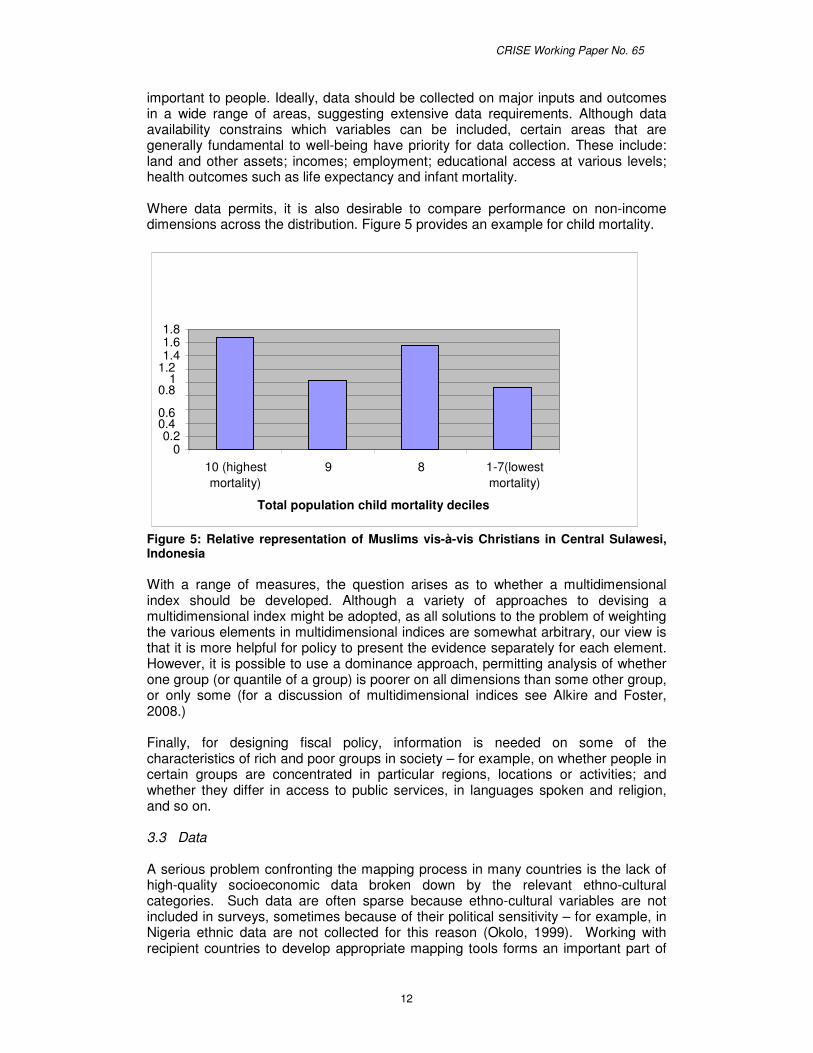
Figure 2: Comparison of mean incomes in within-group quintiles, South Africa 1996 Finally, Figure 3 shows the third method, the calculations of �-means. This confirms the broad trend demonstrated with method 2; the disparity between Whites and Blacks is highest with the geometric mean (�=0) and the standard arithmetic mean (�=1), while the level of disparity drops off both as the ratio is weighted towards lower income (�<0) and towards higher incomes (�>1). The greater flexibility of the �-means demonstrates this trend more clearly than the q-means and allows for clear comparisons across time, as Figure 4 demonstrates through a comparison of the �-means ratios in 1996 and 2001. This figure shows the changes in the White:Black disparity ratio across different sections of the distribution curve. Weighted for low incomes, the disparity in favour of the Whites has increased, as it also has, to an even greater extent, in the middle of the distribution curve. It is only where �-values are greater than 1, thus weighting for the upper end of the distribution curve, that a reduction in disparity can be seen. This confirms the broad political economy analysis of South Africa’s post-Apartheid redistribution efforts which suggest that it has essentially created a small, wealthy Black capitalist class rather than improving the relative incomes for poorer Blacks.
CRISE Working Paper No. 65
11
Figure 3: Comparison of �-means, South Africa 1996
Figure 4: Comparison of White:Black �-means ratios, South Africa 1996 and 2001 3.2 Non-income dimensions of inequality Evidence on the multiple dimensions of HIs is essential because for planning public expenditure one needs to know where the main problem lies; for instance whether it is a matter of access to education, or poor economic opportunities or both; and whether access to land or employment shows the sharpest inequalities or is most
CRISE Working Paper No. 65
12
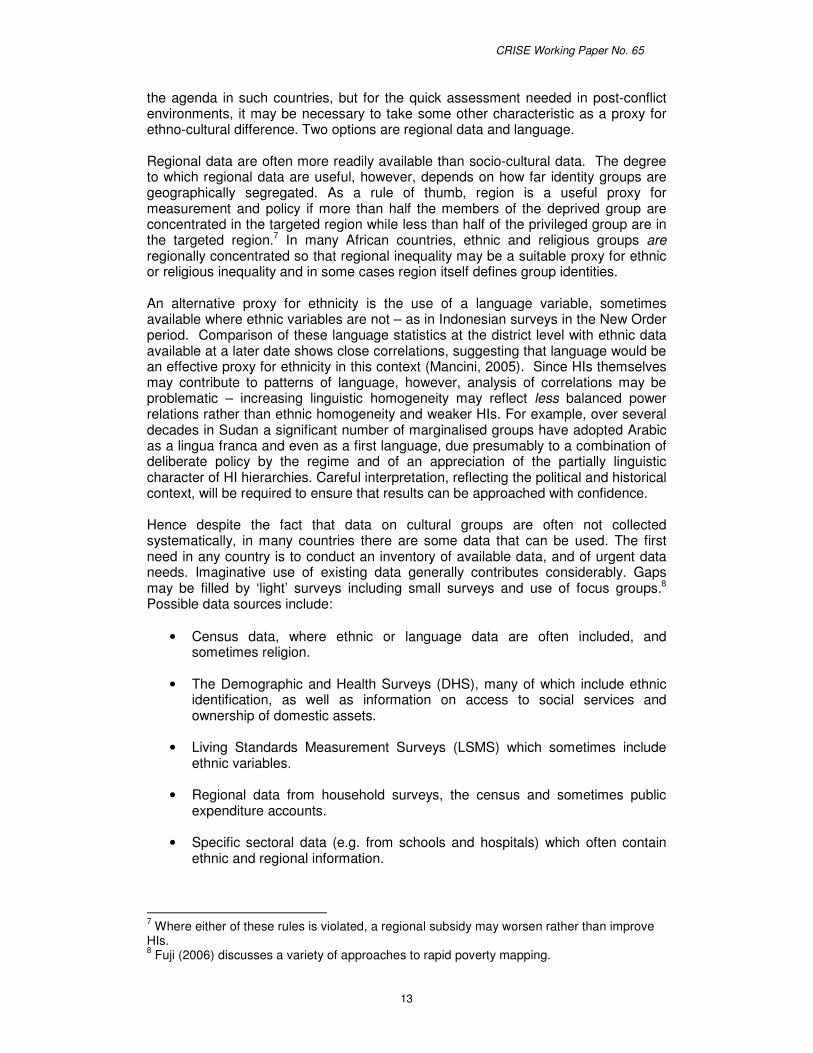
important to people. Ideally, data should be collected on major inputs and outcomes in a wide range of areas, suggesting extensive data requirements. Although data availability constrains which variables can be included, certain areas that are generally fundamental to well-being have priority for data collection. These include: land and other assets; incomes; employment; educational access at various levels; health outcomes such as life expectancy and infant mortality. Where data permits, it is also desirable to compare performance on non-income dimensions across the distribution. Figure 5 provides an example for child mortality.
Figure 5: Relative representation of Muslims vis-à-vis Christians in Central Sulawesi, Indonesia With a range of measures, the question arises as to whether a multidimensional index should be developed. Although a variety of approaches to devising a multidimensional index might be adopted, as all solutions to the problem of weighting the various elements in multidimensional indices are somewhat arbitrary, our view is that it is more helpful for policy to present the evidence separately for each element. However, it is possible to use a dominance approach, permitting analysis of whether one group (or quantile of a group) is poorer on all dimensions than some other group, or only some (for a discussion of multidimensional indices see Alkire and Foster, 2008.) Finally, for designing fiscal policy, information is needed on some of the characteristics of rich and poor groups in society – for example, on whether people in certain groups are concentrated in particular regions, locations or activities; and whether they differ in access to public services, in languages spoken and religion, and so on. 3.3 Data A serious problem confronting the mapping process in many countries is the lack of high-quality socioeconomic data broken down by the relevant ethno-cultural categories. Such data are often sparse because ethno-cultural variables are not included in surveys, sometimes because of their political sensitivity – for example, in Nigeria ethnic data are not collected for this reason (Okolo, 1999). Working with recipient countries to develop appropriate mapping tools forms an important part of
0 0.2
0.4 0.6
0.8 1
1.2 1.4 1.6 1.8
10 (highest mortality)
9 8 1-7(lowest mortality)
Total population child mortality deciles
CRISE Working Paper No. 65
13
the agenda in such countries, but for the quick assessment needed in post-conflict environments, it may be necessary to take some other characteristic as a proxy for ethno-cultural difference. Two options are regional data and language. Regional data are often more readily available than socio-cultural data. The degree to which regional data are useful, however, depends on how far identity groups are geographically segregated. As a rule of thumb, region is a useful proxy for measurement and policy if more than half the members of the deprived group are concentrated in the targeted region while less than half of the privileged group are in the targeted region.7 In many African countries, ethnic and religious groups are regionally concentrated so that regional inequality may be a suitable proxy for ethnic or religious inequality and in some cases region itself defines group identities. An alternative proxy for ethnicity is the use of a language variable, sometimes available where ethnic variables are not – as in Indonesian surveys in the New Order period. Comparison of these language statistics at the district level with ethnic data available at a later date shows close correlations, suggesting that language would be an effective proxy for ethnicity in this context (Mancini, 2005). Since HIs themselves may contribute to patterns of language, however, analysis of correlations may be problematic – increasing linguistic homogeneity may reflect less balanced power relations rather than ethnic homogeneity and weaker HIs. For example, over several decades in Sudan a significant number of marginalised groups have adopted Arabic as a lingua franca and even as a first language, due presumably to a combination of deliberate policy by the regime and of an appreciation of the partially linguistic character of HI hierarchies. Careful interpretation, reflecting the political and historical context, will be required to ensure that results can be approached with confidence. Hence despite the fact that data on cultural groups are often not collected systematically, in many countries there are some data that can be used. The first need in any country is to conduct an inventory of available data, and of urgent data needs. Imaginative use of existing data generally contributes considerably. Gaps may be filled by ‘light’ surveys including small surveys and use of focus groups.8 Possible data sources include:
• Census data, where ethnic or language data are often included, and sometimes religion.
• The Demographic and Health Surveys (DHS), many of which include ethnic identification, as well as information on access to social services and ownership of domestic assets.
• Living Standards Measurement Surveys (LSMS) which sometimes include ethnic variables.
• Regional data from household surveys, the census and sometimes public expenditure accounts.
• Specific sectoral data (e.g. from schools and hospitals) which often contain ethnic and regional information.
7 Where either of these rules is violated, a regional subsidy may worsen rather than improve HIs. 8 Fuji (2006) discusses a variety of approaches to rapid poverty mapping.
CRISE Working Paper No. 65
14
4. Tax policy This section considers tax changes that might contribute to reducing inequality. We start by presenting some general principles behind our specific proposals before discussing possible tax reform to reduce inequality. Two general problems face poorer countries in relation to tax policy: weak revenue mobilisation and a failure to address inequality. While EU countries enjoy tax revenues of around 30% of GDP, the equivalent ratio is significantly lower in poorer countries – averaging, in 2003, 16.6% of GDP in upper-middle-income countries, 13.8% in lower-middle-income countries and just 10.4% in low-income countries (Cobham, 2005c). Moreover, developing countries have a poor record of redistribution through the tax system. In a survey of developing country tax incidence, Chu, Davoodi & Gupta (2004: 267) conclude that ‘Studies of tax incidence suggest that their redistributive effects are minor in developing (and transition) countries’. The need to raise revenue is especially acute post-conflict, since conflict in general has the effect of reducing government revenue significantly, sometimes dramatically. (Gupta et al., 2005; Addison, Choudhury and Murshed, 2004). Moreover, there are particularly acute needs for finance for reconstruction. From the perspective of reducing inequality, raising revenue is also important for several reasons: first, because government expenditure is often progressive, benefiting the poor more than the rich, at least in proportion to their original incomes. It follows that in so far as taxes raised are neutral vis-à-vis income distribution, even if not progressive, higher revenue and expenditure will improve income distribution. Secondly, it is politically much easier to achieve redirection of expenditure towards particular groups if this is through extra expenditure, rather than if it involves taking some benefits away from existing groups. Finally, raising taxes also plays a political role which is especially important in post-conflict countries: those who pay taxes have a perception of having a stake in the government, particularly representative government. As Ross (2004) has argued, turning around a one-time rallying cry, there is ‘no representation without taxation’. He uses panel data to demonstrate that the greater the proportion of government expenditure financed by taxation the more representative the forms of government, suggesting that this would contribute to reduced political HIs.9 Tax compliance varies greatly across countries.10 Theoretical and experimental evidence emphasise the importance of two factors in improving tax compliance: belief in others’ compliance, and the extent of redistribution. An important finding is that agents’ willingness to pay taxes is dependent on their perceptions of others’ tax behaviour – in other words, that paying tax is a social act. Moreover, in a game (involving real payoffs) when subjects know that tax yields will be partially redistributed to all players, there are lower levels of evasion (Bosco & Mittone, 1997; Mittone, 2006). This suggests that there may be a direct connection between the redistributive objective and the revenue-raising objective in post-conflict societies. The main concern in this paper, however, is with the redistributive objective. Before coming to specific proposals, there are some general principles to which any such reform should adhere.
9 Mahon (2005) presents theory and supporting evidence for the importance here of direct tax revenues only in this regard. 10 As Adam & Bevan (2004:60) note: ‘very similar tax structures and tax rates seem to generate very different revenues in different countries’.
CRISE Working Paper No. 65
15
The primary objective of this paper is to identify fiscal measures which will reduce HI. This means improving the net position of deprived groups. The nature of these groups varies across societies, but, as noted earlier, they are often defined in religious, ethnic or racial categories. Yet it is undesirable to make tax liability dependent on a person’s religious, ethnic or racial identity. To do so enforces divisions, encourages switches in identity and undermines basic principles of tax equity. Consequently, our first principle is that while the objective is to correct HIs, identity should not be used as a basis for tax liability. This means that we need to promote reduced HIs in an indirect way, finding other general ways which differentiate groups, which can then be used to inform tax policy. Such differences might be geographical (in the case of regional HIs), occupational or by income level (for both regional and non-regional HIs). There are, of course, a number of objectives to be borne in mind in designing appropriate taxes – including revenue raising, fulfilling economic objectives (generating growth and promoting efficient allocation of resources), and social objectives, including reducing poverty. These objectives remain important, and in considering tax our second principle, therefore, is that one should not neglect such objectives in designing redistributive tax policies. Where possible taxes should be designed so as to fulfil each of the objectives; where not, any trade-off needs to be considered carefully. Countries vary greatly in their stage of development, their governance capacity, resources available to them, and in the extent and nature of inequality (both VI and HI). Consequently, our third principle is that each case has to be examined individually and no single overarching policy framework can be provided. The importance of addressing individual country circumstances is equally clear from a political economy perspective; as Di John (2006: 21) argues, ‘an overarching policy blueprint is likely to be unhelpful in creating tax capacity in historically specific contexts’. Given the principle that a person’s tax liability should not depend on his/her group membership, it is necessary to find indirect means to use the tax system to improve HIs, whereas VI can be tackled directly by increasing the progressiveness of the tax structure. Indirect approaches to using taxes to improving HI include (a) increasing the progressiveness of the tax structure; (b) identifying indirect taxes which will bear particularly heavily on privileged groups and lightly on deprived ones; and (c) changing the regional distribution of net revenue raising; How effective each of these approaches is depends on the nature of the groups. Thus progressive taxation will usually improve HIs, and will always do so where the groups are hierarchical (Horowitz, 1985), so that for each decile the income level of the deprived group(s) is below that of the privileged group(s). This is a common situation – for example, it is generally true for indigenous groups in Latin America, and is also the case for bumiputera in Malaysia and northern groups in Ghana, to mention just a few examples. Hence in general we can assume that greater progressiveness of the tax structure will reduce HIs as well as VI. The second approach – tailoring specific taxes to improve HIs – depends on the groups having distinct behaviour – for example, in where they live within a region, what they produce or what they consume. In practice, this too is quite common since there is a strong tendency for people with cultural affinities to live together in neighbourhoods; the colonial division of labour and/or regional specialisation has tended to lead to an ethnic specialisation; and cultural differences often lead to differences in consumer behaviour.
CRISE Working Paper No. 65
16
Thirdly, efforts to change the regional balance of revenue raising or distribution will improve HIs in so far as groups are regionally concentrated. This too is common, as many HIs arise from regional imbalances in development, while cultural groups are often largely concentrated in particular regions – but there are cases where such regional concentration is absent, or where some members of the deprived (or privileged) groups are regionally concentrated, but others have migrated elsewhere. Moreover, a group may be regionally concentrated but if there are also large numbers of other more privileged groups in the same region, then regional redistribution of revenue may not benefit the deprived group. For example, blacks in the US are regionally concentrated in the South, but a policy directed at improving their position by subsidies to the U.S. South might well not reach them (or fully reach them) while it would leave the many Northern blacks, also relatively deprived, unaffected or even in a worse position. As noted above, an effective regional policy towards HIs requires that more than half the members of the deprived group are concentrated in the targeted region while less than half of the privileged group are in the targeted region, assuming that any redistribution to the deprived region is distributionally neutral within the region.
4.1 Improving the progressiveness of the tax structure
The record of taxation in developing countries has not been notably successful in improving income distribution. As far as VI is concerned, reporting on a survey of tax incidence studies, Chu et al. found that one-third of cases studied had progressive taxation, seven were proportional and the remainder were proportional, or had mixed or insignificant effects (Chu et al, 2004: 254-5). Direct taxes were mostly progressive, while payroll taxes were on balance regressive, and the distributional incidence of indirect taxes was mixed. Moreover, a number of studies reported decreasing progressivity over time. However, the fact that quite a number of tax systems are progressive means that it is possible to improve VI in this way (Cobham, 2005c). Direct taxes on income, profits and capital gains are typically the most progressive part of any developed country tax system. In addition, property taxes are also typically progressive. In each case, the extent of the progressiveness depends on the design of the tax and the rates charged. Property taxes of various types are quite common, particularly as a means of raising local revenue. In some cases (e.g. Jamaica), the ‘land value tax’ has been introduced, which taxes according to the potential value of the land, rather than the actual value of property on it. Where such taxes have progressive rates (higher at high land values) they can be an important source of progressivity11, but even if they are flat rate, they remain progressive because poorer people (groups) have less property than richer ones. A simple approach to improving progressivity is to exempt all property below a certain value. Property taxes can be viewed as particularly just and appropriate in reconstruction because government expenditure to maintain and build a successful peace is likely to generate significant returns for those holding property. The start-up costs of meeting data requirements in the form of a cadastre may be onerous but have long-lasting benefits, including in improving the security of property rights. For developing countries, on average, land taxes account for 0.5% of GDP and around 18% of local government revenue, but Indonesia has a much more extensive tax with higher rates which generate two-thirds of local governments’ own revenue (Bird and Slack 2006; Kelly 2004).
11 Jamaica has a progressive land tax (see Sjoquist, 2005).
CRISE Working Paper No. 65
17
Given their administrative requirements, and the emphasis currently put by donors on indirect taxes, it is desirable also to consider how indirect taxes might be designed to be more progressive. A value-added tax which has exemptions for basic necessities (including food) can be progressive. For example, it is estimated that the VAT in Kenya in 1997 was progressive, allowing for exemptions and zero rating (Wanjala 2007). Almost half developing countries that adopt VAT exempt food (Wanjala 2007). The VAT could also incorporate higher rates on luxuries although multiple rates cause administrative complexity. An alternative is to levy particular excise taxes on luxuries. Other specific indirect taxes that are likely to improve VI and probably HI would be heavy motor vehicle duties and taxes on airlines and flights. Fuel taxes can be differentiated so as to tax the sort of fuels that richer people use and not poor people’s fuels. Similarly, food subsidies can improve distribution when specifically directed at staple foods. 4.2 Tailoring taxes to group behaviour
Three ways of differentiating groups are through their location, their productive activities and their consumption behaviour.
• Even where groups are not regionally concentrated, their tendency to be concentrated in particular districts and neighbourhoods makes it possible for revenue sharing and property taxes to be used to improve the position of deprived groups and tax more privileged groups. Where there is decentralisation and concentration at the district level, revenue-sharing formulae can be devised to improve the position of poorer districts and ipso facto of poorer groups. In the 2001 ‘Big Bang’ decentralisation in Indonesia, in which one-third of consolidated government expenditure was devolved to the districts, allocation was according to a formula based on expenditure needs12 and fiscal capacities, thus, in theory at least, involving major redistribution to poorer districts. Concentration of people (groups) of different income levels in neighbourhoods gives rise to the possibility of using property taxes to differentiate between groups (and also directing government expenditure towards deprived locations – see below).
• Specialised productive activities makes it possible to use the tax system to differentiate among groups. For example, in Ghana, cocoa is produced by relatively privileged groups and so taxing cocoa production (which has some merits from the point of view of the terms of trade, too) would help group distribution.13 In many contexts, particular groups are concentrated in trading (e.g. in both East and West Africa) and taxes on wholesale and retail trade would improve HIs. The poorest people and groups are generally not in the formal sector so that direct taxes on the formal sector will help. In Niger, for example, most people in the informal sector are of a different ethnic group from those in the government and the formal sector generally (Barlow and Snyder, 1993). Such an approach would, however, raise two concerns: that the effective barrier to formal sector participation would be raised, ceteris paribus; and that the channel of political representation, via taxation, would be strengthened (relatively) for the formal sector group over the informal sector group.
12 Expenditure needs were determined by population, area, poverty (later replaced by the inverse of HDI and regional per capita income) and costs (Hofman et al., 2006). 13 Trade taxes continue to be responsible for important shares of revenue in low-income countries; since typically large investment in customs administration is not necessary, they may be especially important for states emerging from conflict.
CRISE Working Paper No. 65
18
• Differences in consumption behaviour provide another avenue for differentiation in taxation. Muslims, for example, who form the relatively deprived groups in many societies, avoid alcohol, so they do not pay taxes on alcohol. Where HIs manifest themselves in particular areas of human development such as education or sanitation, user fees designed to fall on the type of service that the poorer groups use little (such as higher education, or heavy use of water) with appropriate exemptions may yield beneficial results.
4.3 Altering the regional balance of taxation and revenue distribution
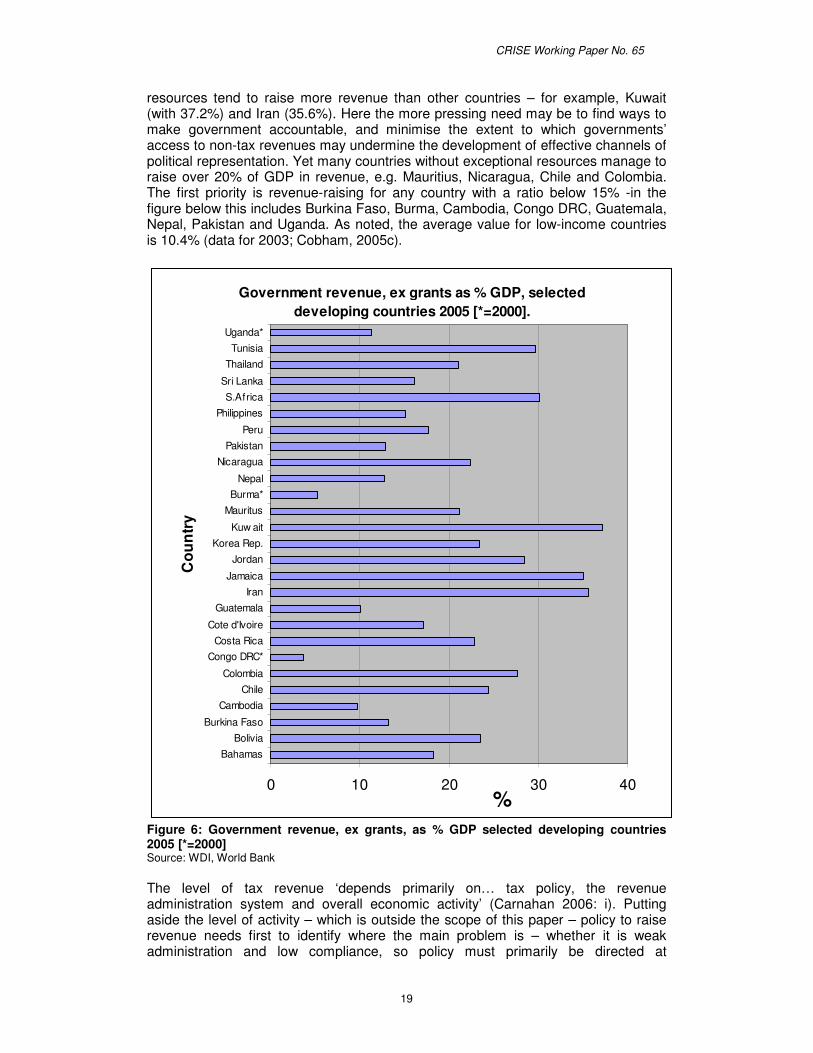
Some cases of regionally based HIs primarily reflect economic geography, while others are the outcome of political and historical factors, often including colonial policy. In general, improvements in the progressiveness of the tax policy, and the other policies already noted, will also improve regional HIs – for example, taxes on particular crops are likely to affect particular regions. How far taxes can contribute to addressing regional HIs depends on the structure of the state. In the simplest case of a unitary state, taxation should be designed to address VI and raise revenues with which to finance the expenditure to contribute to reducing HI. A federal state, or one characterised by some more limited form of decentralisation can be more responsive to regional HIs, partly because capacity for gathering data at this level is more likely to exist; and because the structure allows relatively transparent and direct transfers from central government revenues. In federal states, the formula determining the regional tax burden (revenue raising and distribution from the centre) can be designed to improve the situation of poorer regions. Nigeria, for example has an equalising element in its revenue-sharing formula. In the version decided upon 1989, the formulae for the allocation of revenue to the states was 30% equally distributed among the states, 40% according to population, 15% (inversely) for social development, and 5% for local tax effort. The net impact, however, is a slight positive correlation between transfers and per capita incomes, so the formula is not effective in correcting disparities (Ahmad and Singh, 2003). 4.4. Raising revenue Although we have identified a range of taxes that would assist in reducing HIs, the main contribution of the tax system in this connection is in raising the revenues with which to undertake HI-reducing expenditures, rather than directly reducing HIs itself. This is exemplified by the experience of Guatemala, where the peace accords of the late 1990s set out a quite ambitious programme of social expenditure which would have greatly contributed to reducing HIs. An important element was to raise revenue mobilisation from the very low level of 7.6% of GDP in 1995 to 12% by 2000. In fact, revenue rose to 10% of GDP by 2005, which is below the average of low-income developing countries (12%) and not enough to realise the economic and social objectives of the Accords or to reduce HIs substantially (data from Caumartin 2005; and World Bank, World Development Indicators). A first question that needs to be answered is whether there is scope for raising tax revenue. Comparing a country’s revenue raised as a proportion of GDP with other countries of comparable income levels gives a first indication of this (see Figure 6). Of course, there is no satisfactory guide to the ‘right’ level for the revenue ratio, but an increase would generally be justified for countries with an overall revenue ratio below 15%. If the ratio is above 25%, resources may be better secured by reallocation within the government budget. Countries with high value natural
CRISE Working Paper No. 65
19
resources tend to raise more revenue than other countries – for example, Kuwait (with 37.2%) and Iran (35.6%). Here the more pressing need may be to find ways to make government accountable, and minimise the extent to which governments’ access to non-tax revenues may undermine the development of effective channels of political representation. Yet many countries without exceptional resources manage to raise over 20% of GDP in revenue, e.g. Mauritius, Nicaragua, Chile and Colombia. The first priority is revenue-raising for any country with a ratio below 15% -in the figure below this includes Burkina Faso, Burma, Cambodia, Congo DRC, Guatemala, Nepal, Pakistan and Uganda. As noted, the average value for low-income countries is 10.4% (data for 2003; Cobham, 2005c).
Government revenue, ex grants as % GDP, selected developing countries 2005 [*=2000].
0 10 20 30 40
Bahamas
Bolivia
Burkina Faso
Cambodia
Chile
Colombia
Congo DRC*Costa Rica
Cote d'Ivoire
Guatemala
Iran
Jamaica
Jordan
Korea Rep.
Kuw ait
Mauritus
Burma*Nepal
Nicaragua
Pakistan
Peru
Philippines
S.Africa
Sri Lanka
Thailand
Tunisia
Uganda*
Cou
ntry
%
Figure 6: Government revenue, ex grants, as % GDP selected developing countries 2005 [*=2000] Source: WDI, World Bank The level of tax revenue ‘depends primarily on… tax policy, the revenue administration system and overall economic activity’ (Carnahan 2006: i). Putting aside the level of activity – which is outside the scope of this paper – policy to raise revenue needs first to identify where the main problem is – whether it is weak administration and low compliance, so policy must primarily be directed at
CRISE Working Paper No. 65
20
strengthening both, or low tax rates (or both). Of course, the underlying problem may be political resistance to greater taxation – this seems to be the situation in Guatemala. This can present a decisive obstacle. If the constraint is primarily tax administration, technical assistance and reorganisation of the administration can assist. Durand and Thorp (1998) document how administrative reforms in Peru in the early 1990s raised tax revenue from a low of 4.9% of GDP to 14%, and numbers of tax payers from 80,000 to 300,000. This was achieved by dynamic leadership of the tax administration, and radical reform of the bureaucracy including giving it considerable autonomy, which led to a review of employees, making poor employees redundant and training and retraining. Durand and Thorp identify three necessary conditions for success: political support from on top; ongoing bureaucratic regeneration, and improvements in the relationship of state and society. If the main cause of low revenue arises from low tax rates, it is helpful to identify which tax rates are notably low by international standards. By comparing revenue raised from different types of taxation in relation to GDP in the country with the average in a comparable set of countries, particularly low tax rates can be identified. The areas where a country is significantly below the average are good prima facie areas for revenue raising. Of course, the economic conditions of the country need also to be considered. For example, countries rich in mineral resources offer possibilities for revenue-raising not open to other countries. One generally neglected area is that of land taxation, which is relatively easy to administer and difficult to evade (Carnahan 2007: 12). External conditionality can be used to support revenue mobilisation – thus aid can be made conditional on increasing domestic revenue; moreover, there is considerable scope for taxing foreign nationals (including aid personnel and activities) (Carnahan, 2006; Boyce, 2007). 4.5 Political linkages A final issue to consider in the design of tax systems is the link between taxation and political representation. As noted, at the national level at least, taxation can contribute strongly to the link between citizens and state, as the act of paying taxes encourages individuals to hold the state to account for its expenditures. While groups should not be excluded wholesale from taxation on the grounds of HIs, there remains a risk that – since tax policies to reduce HIs will nevertheless have some impact in this regard – over time these groups experience a gradual weakening in their political engagement. However, this can be offset by increased benefits – which also tie people to the state – and political reforms. A further linkage concerns rates of tax compliance. As noted, these are believed to depend to a significant extent on perceptions of redistribution and of others’ compliance. Compliance rates display considerable inertia, as is apparent in the struggles even of rich countries like Italy and Portugal to increase compliance. Donors can introduce incentives for greater compliance by making matching contributions. Similarly, regionally, it is also possible to structure payments from central government to regional governments in a way that encourages compliance. By providing some element of matching funds, according to the level of taxes paid locally, such a structure would make the cost to the regional group (i.e. taxes unpaid plus matching funds) greater than the gain to the individual (the unpaid taxes). Each region’s potential tax collection would need to be assessed according to the level of economic activity, instead of treating each equally, so that existing inequalities would be reduced rather than exacerbated. The extent of redistribution would in turn further
CRISE Working Paper No. 65
21
encourage compliance, and perceptions of others’ compliance, ideally building a virtuous cycle. Non-regional HIs do not lend themselves to such a solution, and here responses may be limited to efforts to ensure transparency of both tax revenues and public expenditures, and that high-profile non-compliance is swiftly addressed.
5. Expenditure Policy In order to assess the distributional impact of the benefits of public expenditure and devise policies towards it, it is helpful to start by identifying three distinct phases of government expenditure, each of which has distributional consequences.
• Phase 1: government contracts and employment in constructing public facilities.
• Phase 2: contracts and employment in running the services.
• Phase 3: the services themselves.
The distributional incidence of each is important. The first phase is quantitatively significant since government investment frequently accounts for three-quarters or more of total investment in poor countries, amounting to 10% or more of GDP. The second phase is important as government employment often accounts for over half of formal sector employment. And the third stage is important because it determines who benefits from government services and thus gets access to, e.g., health and education, important in themselves and for contributing to improved incomes. Most studies focus on Phase 3 only in analysing the distributional impact of government expenditure – see the summary of Chu, Davoodi et al., 2000. But this is wrong not only because of the quantitative importance of the first two phases but because of their high visibility and political sensitivity. For example, in both Ghana and Nigeria a much higher proportion of people believe that their ethnicity affects their chances of getting government jobs and contracts than access to public services (Langer and Ukiwo, 2007), yet the normal analysis of the distributional impact of government expenditure would look just at the services. Phase 1 and Phase 2 are likely particularly to affect the distribution of opportunities and incomes in the upper deciles of the distribution, while Phase 2 affects the bulk of the population. It may be that for Phase 1 and 2, there are limited choices of enterprise and skill level and therefore decisions in these phases cannot change VI significantly which may be why these phases are typically ignored in the analysis of the distributional incidence of government expenditure. While choice of technique in production does influence VI – e.g. labour-intensive construction techniques offer more jobs to low-skilled and low-income people – efficiency considerations tend to override income distribution ones in both Phase 1 and Phase 2. But the situation is very different for HI. Contracts and employment are often biased in their racial (e.g. Fiji and South Africa), religious (e.g. Northern Ireland) or ethnic (e.g. Kenya and Sri Lanka) distribution. And where there is a choice, the regional location may also be biased. Hence a very important issue for public policy towards HI is to ensure appropriate group participation in each of the three phases of government expenditure. A big question, then, is what is appropriate participation. This can be interpreted in a variety of ways. At a minimum, there should be no bias against particular groups (or in favour of others) in the allocation of contracts and jobs. This implies anti-discrimination legislation and monitoring. But it may be desirable to go beyond this and to introduce some bias in favour of relatively poor groups, on the grounds of
CRISE Working Paper No. 65
22
historic discrimination so that today they cannot compete in a ‘level’ way. For example, if groups have been deprived of educational and employment opportunities by past discrimination, then eliminating current discrimination will still leave such groups disadvantaged. Moreover, in order to reduce inequality, and/or to sustain political peace, the government may wish to move beyond what would be achieved by anti-discrimination law alone. The case of Northern Ireland illustrates this. 1976 legislation prohibited discrimination on the grounds of religion, yet gross inequalities between the communities remained. Consequently, in 1987, a report14 ‘shifted the terms of the debate from concentrating on the eradication of prejudiced discrimination, to reducing unjustified structural inequality in the employment market, whether caused by discrimination or not’ (McCrudden, 2007: 73). Unavoidably, once one moves beyond anti-discrimination legislation to targeting and/or preferences and subsidies, actual targets/preferences have to be decided politically, and are somewhat arbitrary. A possible criterion would be to aim for job and contract allocation in accordance with the share of the group in total population. But this might go beyond what is feasible where history has left a group with very few skills or entrepreneurial capacity or experience. Yet it might also be less than what is required, given that public sector contracts only account for a proportion of total contracts. In some cases, targets and quotas are adopted – e.g. a Philadelphia Plan of 1969, later widely extended, required contractors to employ minority workers from 3-9% in 1970 rising to 19-26% by 1972 (depending on the precise trade). (McCrudden, 2007: 145). In other cases, a particular subsidy is given to some groups, and the group share in outcome then emerges as a result of this: for example, in South Africa, those ‘disadvantaged by unfair discrimination’ in small and medium enterprises were given price preferences (McCrudden, 2007: 246). It is noteworthy that in Northern Ireland a succession of acts referred to ‘fair participation’ but did not define it (Todd, 2007). With respect to the first phase, policies towards ensuring fairness in the allocation of government contracts have been adopted in quite a large number of countries, including Canada, Malaysia, South Africa, Northern Ireland and the US (McCrudden, 2007). Policies to achieve this include:
• Anti-discrimination employment legislation.
• Guidelines for all public decisions makers.
• Setting targets and quotas.
• Careful monitoring of progress.
• Competitive and transparent bidding procedures for contracts.
• Incentives and penalties including allocating contracts only to firms where fair employment practices are being followed.
• Providing set asides for contracts for businesses controlled by particular groups, or preferences for such groups.
Different countries have adopted different elements of these procedures and their experience sheds light on which (or which combinations) are effective, though clearly the context is important. 14 Standing Advisory Commission of Human Rights (1987).
CRISE Working Paper No. 65
23
The Northern Ireland experience shows that simply adopting anti-discriminatory law is not sufficient. Discrimination was accepted officially as a cause of conflict in a report of 1970 (Todd, 2007: 10) and the 1976 Fair Employment Act made all direct discrimination illegal in both public and private sectors and established a monitoring agency (the Fair Employment Agency). But the Act was rather weak and relied mainly on voluntary action – e.g. employers were encouraged (and after 1982 required) to sign a declaration saying they agreed with the principles of the Act. Compliance was self-regulated and research showed that few changed their behaviour (Cormack and Osborne, 1983).
Under pressure from a US-led campaign, a new Fair Employment Act was introduced in 1989. This outlawed indirect as well as direct discrimination and included more effective monitoring. A 1998 Act further strengthened the force of anti-discrimination, giving public authorities a statutory obligation to promote equality of opportunity while Codes of Practice encourage firms to take positive measures to promote balance in employment, but without actively discriminating against any group. The 1998 Act ‘provided that each ”public authority” is required, in carrying out its functions relating to Northern Ireland, to have due regard to the need to promote equality of opportunity between certain different individuals and groups’ (McCrudden, 2007: 84)15. The 1989 and 1998 legislation imposed duties on employers to register the religious composition of their labour force annually and to review their employment practices periodically to identify whether practices are fair and if not to propose remedies to the enforcement body (the Employment Commission, a reincarnation of the prior Fair Employment Commission). The Employment Commission can investigate corporate employment practices and reach legally enforceable affirmative action agreements. Access to public grants and contracts depends on compliance (McCrudden, Ford and Heath, 2004). Monitoring – by the (Fair) Employment Commission – was an important component of the policy.
Taken together, these policies seem to have been successful in bringing about a major change in the proportion of Catholics in employment. Between 1990 and 2000, employment among Catholics rose by 24% and among Protestants by only 6%. The change was sharper among firms monitored by the Fair Employment Commission, with a rise of 28% in Catholic employment and of 4% in Protestant employment.16 There was also greater integration of employment in monitored firms (data from McCrudden, Ford and Heath, 2004). However, other developments that were occurring simultaneously contributed to these changes, including improved education of Catholics and changes in the industrial composition of the economy.
US policy provides an example of the use of set asides, which give preferences in contracting to small businesses ‘owned by women, and small businesses owned and controlled by socially disadvantaged individuals, particularly ethnic minority groups’ (McCrudden 2007: 167). ‘All federal agencies were required to set percentage goals for procurement contract awards to such businesses’ (ibid: 168). From 1991, the goal was set at 5% of all contracts awarded. Similar policies have been followed in Canada with respect to aborigines.
15 Each public authority, unless specifically exempt, has to submit an equality scheme to the Equality Commission showing how it intends to fulfil the duties and the timetable for this (McCruddden, 2007: 94). 16 The proportion of managerial and professional jobs held by Catholics also rose, from 30.5% in 1971 to 35.7% in 1997 (Fair Employment Commission, 1998).
CRISE Working Paper No. 65
24
Phase 2: Similar policies contribute to ensuring fairness in employment in the running of public facilities – such as staffing of schools, health facilities and so on. Anti-discriminatory law, backed up by monitoring, can help ensure fair employment in both public and private enterprises. Again there may be targets or quotas for employment (as in the public administration in South Africa), and/or indirect policies to promote a particular group, such as imposing language requirements for employment which favour one group (Sri Lankan policy is an example), and/or special training. Of course, in the short run, there may be strong constraints on change imposed by limited skill availability in some groups. By monitoring and setting targets, these constraints can be identified and relevant training/education provided.
Phase 3 concerns the distributional incidence of publicly provided goods and services. Here five types of good can be identified.
1. Goods with non-allocable benefits. In principle, some types of expenditure
take place in a specific location and offer jobs/contracts to specific people, but the benefits are not allocable to particular people or groups (defence expenditure or debt servicing may be of that type). For this type, the question of distributional incidence arises only in the production process not in the benefits. However, it is quite difficult to find examples of this type of expenditure, since most types of expenditure have some distributional impact: for example, the propertied classes benefit more than others from defence; and groups who dominate the government benefit more than others. In so far as such non-allocable goods exist, they constitute genuine public goods. While they don’t therefore have direct implications for inequality (apart from in their production), they do indirectly because if the benefits are genuine and shared equally across the population, poorer groups gain disproportionately in relation to their incomes. But in practical terms, there are so few clear examples of this type of good, that one can’t use them to bring about major redistribution.17
2. Goods with allocable benefits across groups but not by region. This concerns goods that have national benefits, but only to people with particular characteristics – e.g. expenditure on national television which benefits only those with TV sets; or subsidies to the national airline, benefiting only those who fly; or radio broadcasts in e.g. Hausa language, which only benefit those who speak Hausa; or expenditure on particular religious ceremonies or buildings, which only benefit those of that religion (and might even disbenefit others). It is clear that these goods potentially have important distributional impact – some across income groups, some across religious or ethnic groups. Ensuring that expenditure of this type is fairly distributed could be a significant way of improving equality.
3. Goods with allocable benefits across regions but not intra-regionally. Some types of expenditure benefit certain areas/groups in production and certain geographic areas in the benefits, but the benefits are not allocable within them (e.g. expenditure to limit environmental damage). Changing the balance of this type of expenditure would directly contribute to changing HIs where groups are regionally located. In federal and decentralised systems, resource transfers from the central government to states or districts can be
17 It might be thought, for example, that expenditure on national holidays or the national football team benefits the whole nation. Yet investigation into Hungarian perceptions in Romania finds that the Hungarian population actively dislike the National Holidays and actively support the opponents of the football team (Fox, 2006).
CRISE Working Paper No. 65
25
designed to transfer more to deprived areas, thus encouraging and financing expenditures which reduce inequality. The example of Nigeria, cited earlier, illustrates. However, the record of policies towards regional development has not been good, in terms of reducing disparities. A review of seven developed and 18 developing countries finds that neither federal nor unitary states managed to reduce inequalities, although ‘Federal countries.. do better in restraining regional inequalities’ (Shankah and Shah, 2003: 1437). The policies may, however, have prevented further widening of the gaps due to economic developments.
4. Goods with allocable inter-regional and intra- regional benefits. Some types of expenditure benefit certain groups in particular locations. This category, in fact, includes much government expenditure e.g. expenditure on social services, economic infrastructure. For this type of expenditure the specific design of the projects will greatly influence its impact on inequality. Relevant aspects of project design include choice of broad category of expenditure (e.g. education generally is likely to improve inequality relative to defence expenditure), decisions as to within-sector allocations (e.g. primary education generally benefits poorer income groups compared with tertiary education), regional location (expenditure on education of any type in deprived regions would tend to benefit deprived groups), and specific intra-regional location (e.g. schools in urban slums will help deprived groups within any region more than schools in the elite areas). Major improvements in both VI and HI can, in principle, be achieved by improving the allocation of this category of goods.
5. Transfer payments. Transfer payments include direct payments to communities/households/individuals administered according to particular criteria – e.g. the poverty of the community/household/individual, or the age of individuals (children or old people), or the behaviour of individual (e.g. school attendance; employment status). These payments can and normally are designed to impinge directly on VI and can affect VI significantly. In general, group membership is not a criterion. Eligibility could depend on being a member of a deprived group – so directly affecting HI. But this is probably not desirable for the same reason that one does not want to make cultural identity a tax criterion. Nonetheless, transfer payments can be designed to affect HI indirectly on the basis of other characteristics which deprived groups have disproportionately compared with the non-deprived. Income of the individual/household or community or region is one such; size of family, employment status, and education status are others which would be likely to result in a distribution of payments that improved HIs.
In order to correct the group distribution of benefits from publicly provided goods and services, the particular constraints on achieving group equity in a country need to be identified: it may be a case of pure discrimination (e.g. towards educational admissions), which is, in principle, correctable by outlawing discrimination; it may be availability of facilities suitably located (e.g. school availability in Northern Nigeria); it might be poor quality of facilities located near to some groups (e.g. poor quality of the schools where indigenous children are concentrated in Peru – Figueroa, 2008); or it could be that the economic or social situation of some groups leads to low use of facilities – e.g. constraints on female participation in schools among some Muslim communities, or lack of money to pay for transport to health clinics among poor groups. To correct such inequalities, then, it is essential to gather good information

CRISE Working Paper No. 65
26
on the nature and extent of the inequalities and to research the causes of the inequalities.
To summarise, improvements in HI can be achieved via reallocation in the production, running and consumption of publicly funded services:
• By a policy towards participation in government contracts for the construction of public facilities, and in employment in the public sector;
• By a focus on pro-poor public goods and those that favour particular groups. E.g. subsidising radio not television, bus transport not air travel; and supporting the language and religion of poor groups;
• By locating a higher proportion of public goods in regions where poor groups are concentrated; and within regions in specific locations where poorer groups are concentrated. For example, in Lima, the white elite live in one area and indigenous migrants in another. Schools, transport, sanitation, and housing located in the slum areas of Lima would benefit indigenous people, not the white population. Any such improvements in HI would, of course, also improve VI;
• By appropriately designed transfer payments which can improve both VI and HI significantly.
For many poor developing countries, especially those in a post-conflict context, aid finances a large proportion of government expenditure – often all development expenditure and a substantial proportion of running costs too. For example, in Mozambique aid accounted for three quarters of government expenditure following the peace agreement. Thus it is vital that donors take these considerations into account – both with respect to policy dialogue and budget planning and the projects they undertake directly (Stewart and Brown, 2006).
6. An example of the use of fiscal policies to improve HIs: the case of Malaysia Malaysia has implemented comprehensive measures, fiscal and non-fiscal, in order to correct horizontal inequalities between the country’s main ethnic groups, particularly the bumiputera (an umbrella term for the Malays and other ‘indigenous’ groups) and the Chinese. Here we examine the main fiscal components of this strategy. Between 1970 and 1990, Malaysia’s fiscal policy was shaped by the overarching New Economic Policy (NEP), devised in the wake of serious ethnic rioting provoked by the 1969 general election. The NEP was expressed in terms of two broad objectives – the elimination of poverty irrespective of ethnic background, and the ‘elimination of the association between race [sic] and economic function’. Over the NEP period, Malaysia enjoyed very high average economic growth rates, and horizontal inequality reduced markedly.18 It’s successors, the National Development Policy (NDP, 1991-2000) and the current National Vision Policy (NVP, 2001-2010) retain the broad objectives of the NEP, although redistributive fervour has been reduced somewhat.
18 There remains some significant debate over how far this reduction was due to the NEP itself (see Jomo, 1986;1990; Bowie, 1994; Ishak, 1996; Rasiah and Ishak, 2001. .
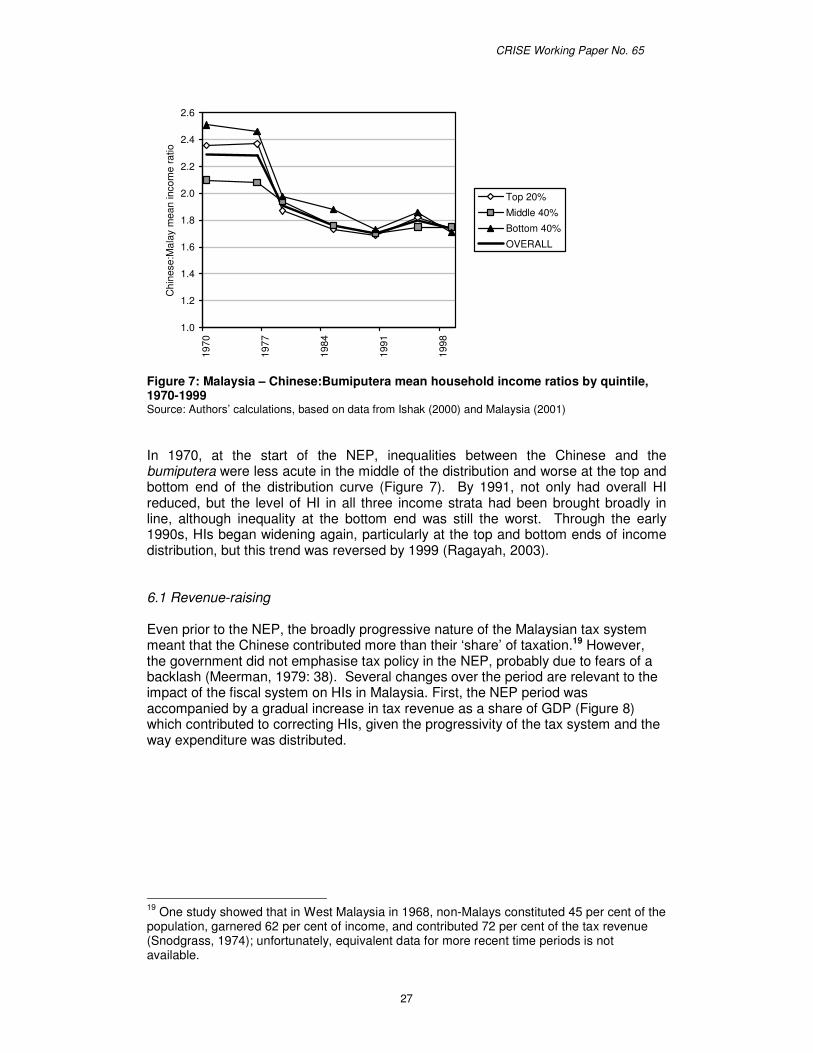
CRISE Working Paper No. 65
27
1.0
1.2
1.4
1.6
1.8
2.0
2.2
2.4
2.6
1970
1977
1984
1991
1998
Chi
nese
:Mal
ay m
ean
inco
me
ratio
Top 20%
Middle 40%
Bottom 40%
OVERALL
Figure 7: Malaysia – Chinese:Bumiputera mean household income ratios by quintile, 1970-1999 Source: Authors’ calculations, based on data from Ishak (2000) and Malaysia (2001) In 1970, at the start of the NEP, inequalities between the Chinese and the bumiputera were less acute in the middle of the distribution and worse at the top and bottom end of the distribution curve (Figure 7). By 1991, not only had overall HI reduced, but the level of HI in all three income strata had been brought broadly in line, although inequality at the bottom end was still the worst. Through the early 1990s, HIs began widening again, particularly at the top and bottom ends of income distribution, but this trend was reversed by 1999 (Ragayah, 2003). 6.1 Revenue-raising Even prior to the NEP, the broadly progressive nature of the Malaysian tax system meant that the Chinese contributed more than their ‘share’ of taxation.19 However, the government did not emphasise tax policy in the NEP, probably due to fears of a backlash (Meerman, 1979: 38). Several changes over the period are relevant to the impact of the fiscal system on HIs in Malaysia. First, the NEP period was accompanied by a gradual increase in tax revenue as a share of GDP (Figure 8) which contributed to correcting HIs, given the progressivity of the tax system and the way expenditure was distributed.
19 One study showed that in West Malaysia in 1968, non-Malays constituted 45 per cent of the population, garnered 62 per cent of income, and contributed 72 per cent of the tax revenue (Snodgrass, 1974); unfortunately, equivalent data for more recent time periods is not available.
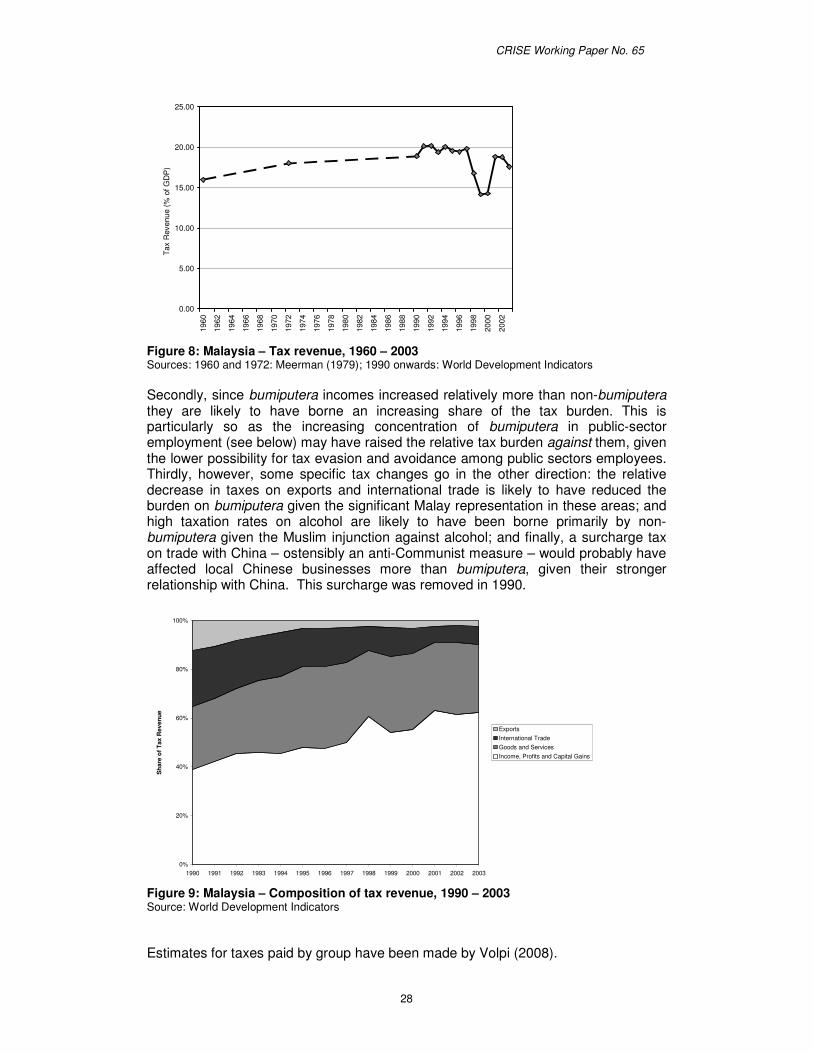
CRISE Working Paper No. 65
28
0.00
5.00
10.00
15.00
20.00
25.00
1960
1962
1964
1966
1968
1970
1972
1974
1976
1978
1980
1982
1984
1986
1988
1990
1992
1994
1996
1998
2000
2002
Tax
Rev
enue
(% o
f GD
P)
Figure 8: Malaysia – Tax revenue, 1960 – 2003 Sources: 1960 and 1972: Meerman (1979); 1990 onwards: World Development Indicators Secondly, since bumiputera incomes increased relatively more than non-bumiputera they are likely to have borne an increasing share of the tax burden. This is particularly so as the increasing concentration of bumiputera in public-sector employment (see below) may have raised the relative tax burden against them, given the lower possibility for tax evasion and avoidance among public sectors employees. Thirdly, however, some specific tax changes go in the other direction: the relative decrease in taxes on exports and international trade is likely to have reduced the burden on bumiputera given the significant Malay representation in these areas; and high taxation rates on alcohol are likely to have been borne primarily by non-bumiputera given the Muslim injunction against alcohol; and finally, a surcharge tax on trade with China – ostensibly an anti-Communist measure – would probably have affected local Chinese businesses more than bumiputera, given their stronger relationship with China. This surcharge was removed in 1990.
0%
20%
40%
60%
80%
100%
1990 1991 1992 1993 1994 1995 1996 1997 1998 1999 2000 2001 2002 2003
Sha
re o
f Tax
Rev
enue
ExportsInternational TradeGoods and ServicesIncome, Profits and Capital Gains
Figure 9: Malaysia – Composition of tax revenue, 1990 – 2003 Source: World Development Indicators Estimates for taxes paid by group have been made by Volpi (2008).
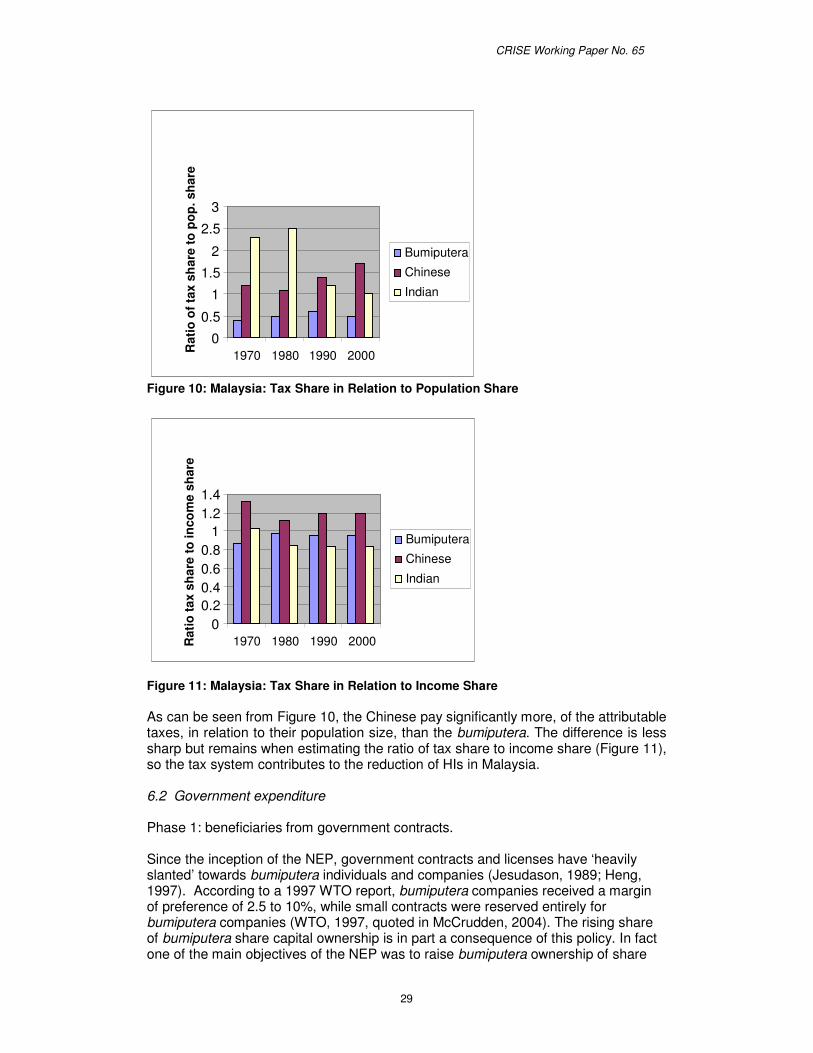
CRISE Working Paper No. 65
29
Figure 10: Malaysia: Tax Share in Relation to Population Share
Figure 11: Malaysia: Tax Share in Relation to Income Share As can be seen from Figure 10, the Chinese pay significantly more, of the attributable taxes, in relation to their population size, than the bumiputera. The difference is less sharp but remains when estimating the ratio of tax share to income share (Figure 11), so the tax system contributes to the reduction of HIs in Malaysia. 6.2 Government expenditure Phase 1: beneficiaries from government contracts. Since the inception of the NEP, government contracts and licenses have ‘heavily slanted’ towards bumiputera individuals and companies (Jesudason, 1989; Heng, 1997). According to a 1997 WTO report, bumiputera companies received a margin of preference of 2.5 to 10%, while small contracts were reserved entirely for bumiputera companies (WTO, 1997, quoted in McCrudden, 2004). The rising share of bumiputera share capital ownership is in part a consequence of this policy. In fact one of the main objectives of the NEP was to raise bumiputera ownership of share
0 0.20.40.60.8
1 1.21.4
1970 1980 1990 2000
Bumiputera
Chinese
Indian
Rat
io ta
x sh
are
to in
com
e sh
are
0
0.5
1
1.5
2
2.5
3
1970 1980 1990 2000 Rat
io o
f tax
sh
are
to p
op. s
hare
Bumiputera
Chinese
Indian
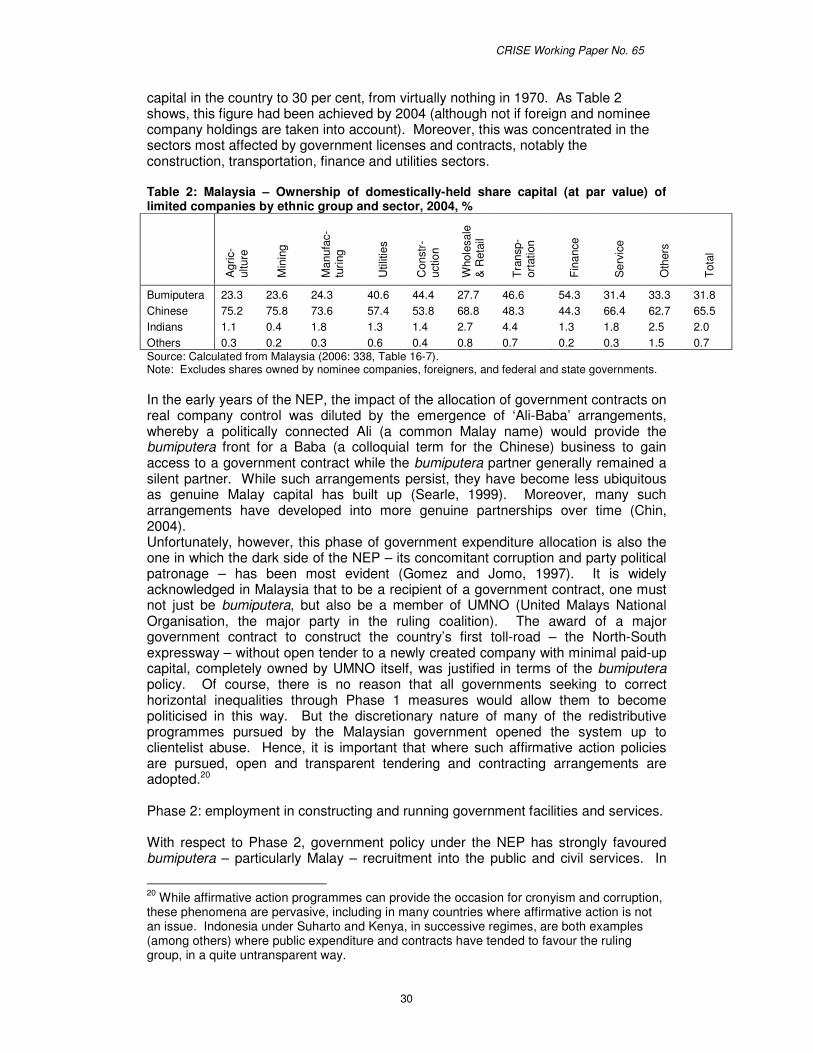
CRISE Working Paper No. 65
30
capital in the country to 30 per cent, from virtually nothing in 1970. As Table 2 shows, this figure had been achieved by 2004 (although not if foreign and nominee company holdings are taken into account). Moreover, this was concentrated in the sectors most affected by government licenses and contracts, notably the construction, transportation, finance and utilities sectors. Table 2: Malaysia – Ownership of domestically-held share capital (at par value) of limited companies by ethnic group and sector, 2004, %
Agr
ic-
ultu
re
Min
ing
Man
ufac
-tu
ring
Util
ities
Con
str-
uctio
n
Who
lesa
le
& R
etai
l
Tran
sp-
orta
tion
Fina
nce
Ser
vice
Oth
ers
Tota
l
Bumiputera 23.3 23.6 24.3 40.6 44.4 27.7 46.6 54.3 31.4 33.3 31.8 Chinese 75.2 75.8 73.6 57.4 53.8 68.8 48.3 44.3 66.4 62.7 65.5 Indians 1.1 0.4 1.8 1.3 1.4 2.7 4.4 1.3 1.8 2.5 2.0 Others 0.3 0.2 0.3 0.6 0.4 0.8 0.7 0.2 0.3 1.5 0.7 Source: Calculated from Malaysia (2006: 338, Table 16-7). Note: Excludes shares owned by nominee companies, foreigners, and federal and state governments. In the early years of the NEP, the impact of the allocation of government contracts on real company control was diluted by the emergence of ‘Ali-Baba’ arrangements, whereby a politically connected Ali (a common Malay name) would provide the bumiputera front for a Baba (a colloquial term for the Chinese) business to gain access to a government contract while the bumiputera partner generally remained a silent partner. While such arrangements persist, they have become less ubiquitous as genuine Malay capital has built up (Searle, 1999). Moreover, many such arrangements have developed into more genuine partnerships over time (Chin, 2004). Unfortunately, however, this phase of government expenditure allocation is also the one in which the dark side of the NEP – its concomitant corruption and party political patronage – has been most evident (Gomez and Jomo, 1997). It is widely acknowledged in Malaysia that to be a recipient of a government contract, one must not just be bumiputera, but also be a member of UMNO (United Malays National Organisation, the major party in the ruling coalition). The award of a major government contract to construct the country’s first toll-road – the North-South expressway – without open tender to a newly created company with minimal paid-up capital, completely owned by UMNO itself, was justified in terms of the bumiputera policy. Of course, there is no reason that all governments seeking to correct horizontal inequalities through Phase 1 measures would allow them to become politicised in this way. But the discretionary nature of many of the redistributive programmes pursued by the Malaysian government opened the system up to clientelist abuse. Hence, it is important that where such affirmative action policies are pursued, open and transparent tendering and contracting arrangements are adopted.20 Phase 2: employment in constructing and running government facilities and services. With respect to Phase 2, government policy under the NEP has strongly favoured bumiputera – particularly Malay – recruitment into the public and civil services. In
20 While affirmative action programmes can provide the occasion for cronyism and corruption, these phenomena are pervasive, including in many countries where affirmative action is not an issue. Indonesia under Suharto and Kenya, in successive regimes, are both examples (among others) where public expenditure and contracts have tended to favour the ruling group, in a quite untransparent way.
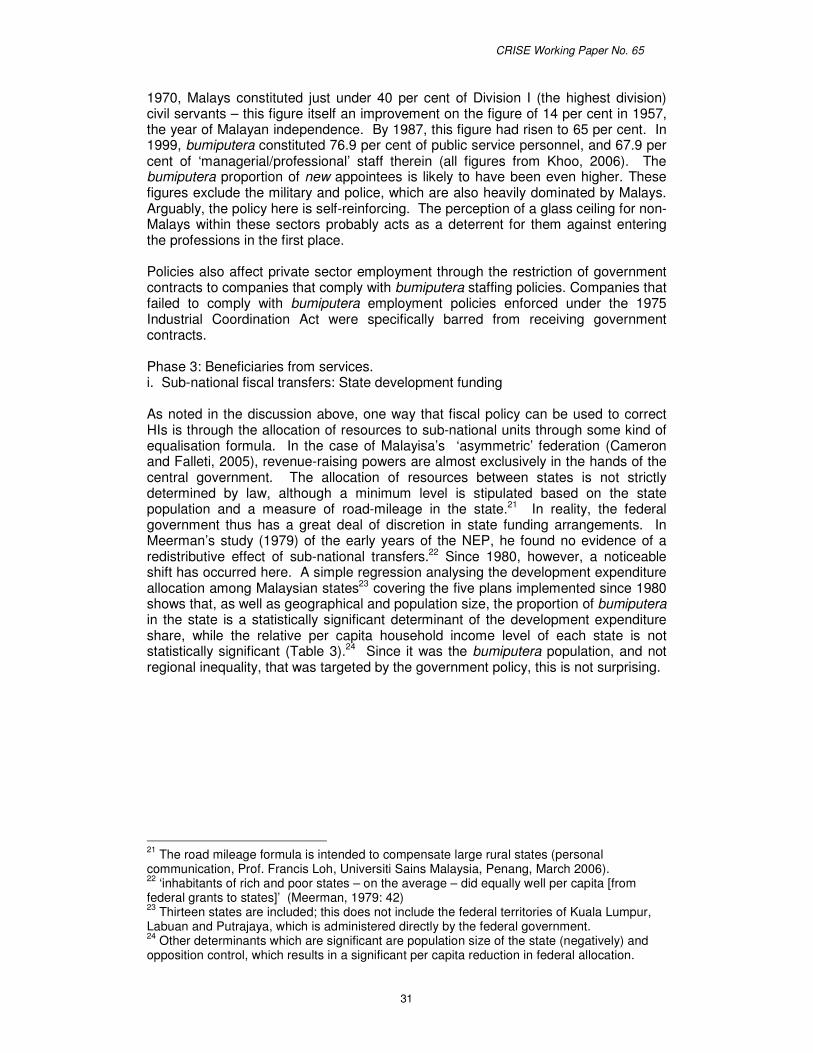
CRISE Working Paper No. 65
31
1970, Malays constituted just under 40 per cent of Division I (the highest division) civil servants – this figure itself an improvement on the figure of 14 per cent in 1957, the year of Malayan independence. By 1987, this figure had risen to 65 per cent. In 1999, bumiputera constituted 76.9 per cent of public service personnel, and 67.9 per cent of ‘managerial/professional’ staff therein (all figures from Khoo, 2006). The bumiputera proportion of new appointees is likely to have been even higher. These figures exclude the military and police, which are also heavily dominated by Malays. Arguably, the policy here is self-reinforcing. The perception of a glass ceiling for non-Malays within these sectors probably acts as a deterrent for them against entering the professions in the first place. Policies also affect private sector employment through the restriction of government contracts to companies that comply with bumiputera staffing policies. Companies that failed to comply with bumiputera employment policies enforced under the 1975 Industrial Coordination Act were specifically barred from receiving government contracts. Phase 3: Beneficiaries from services. i. Sub-national fiscal transfers: State development funding As noted in the discussion above, one way that fiscal policy can be used to correct HIs is through the allocation of resources to sub-national units through some kind of equalisation formula. In the case of Malayisa’s ‘asymmetric’ federation (Cameron and Falleti, 2005), revenue-raising powers are almost exclusively in the hands of the central government. The allocation of resources between states is not strictly determined by law, although a minimum level is stipulated based on the state population and a measure of road-mileage in the state.21 In reality, the federal government thus has a great deal of discretion in state funding arrangements. In Meerman’s study (1979) of the early years of the NEP, he found no evidence of a redistributive effect of sub-national transfers.22 Since 1980, however, a noticeable shift has occurred here. A simple regression analysing the development expenditure allocation among Malaysian states23 covering the five plans implemented since 1980 shows that, as well as geographical and population size, the proportion of bumiputera in the state is a statistically significant determinant of the development expenditure share, while the relative per capita household income level of each state is not statistically significant (Table 3).24 Since it was the bumiputera population, and not regional inequality, that was targeted by the government policy, this is not surprising.
21 The road mileage formula is intended to compensate large rural states (personal communication, Prof. Francis Loh, Universiti Sains Malaysia, Penang, March 2006). 22 ‘inhabitants of rich and poor states – on the average – did equally well per capita [from federal grants to states]’ (Meerman, 1979: 42) 23 Thirteen states are included; this does not include the federal territories of Kuala Lumpur, Labuan and Putrajaya, which is administered directly by the federal government. 24 Other determinants which are significant are population size of the state (negatively) and opposition control, which results in a significant per capita reduction in federal allocation.
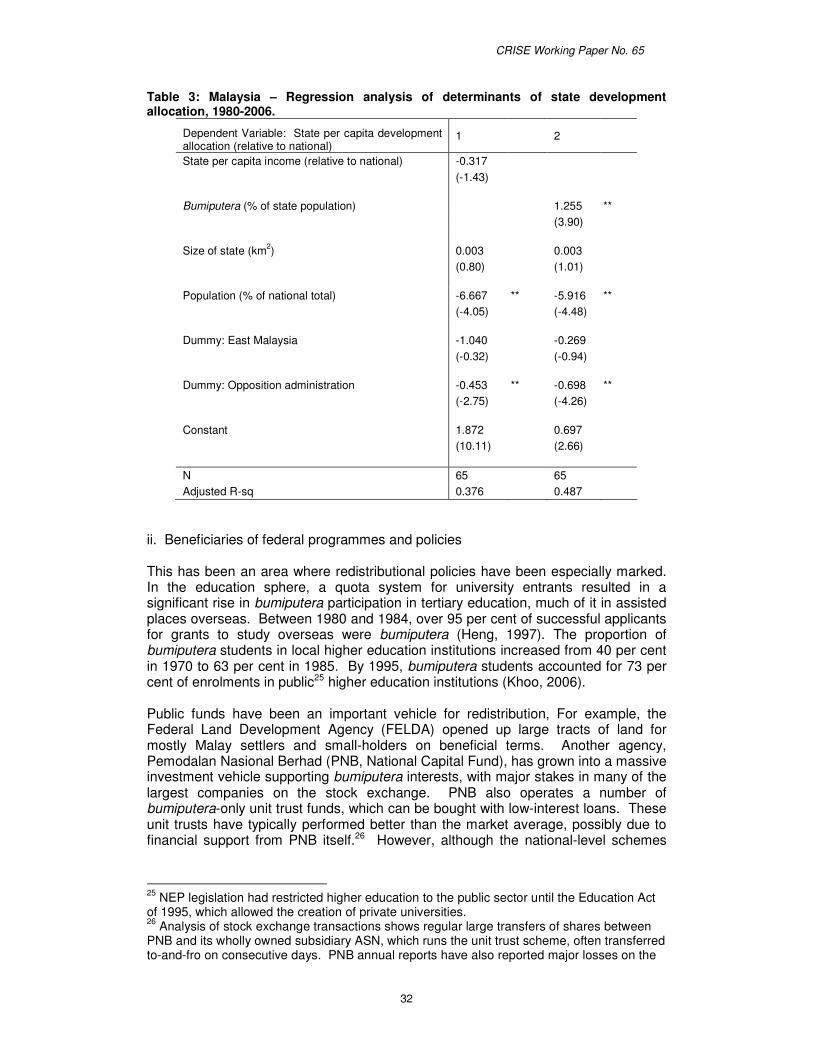
CRISE Working Paper No. 65
32
Table 3: Malaysia – Regression analysis of determinants of state development allocation, 1980-2006.
Dependent Variable: State per capita development allocation (relative to national)
1 2
State per capita income (relative to national) -0.317 (-1.43) Bumiputera (% of state population) 1.255 ** (3.90) Size of state (km2) 0.003 0.003 (0.80) (1.01) Population (% of national total) -6.667 ** -5.916 ** (-4.05) (-4.48) Dummy: East Malaysia -1.040 -0.269 (-0.32) (-0.94) Dummy: Opposition administration -0.453 ** -0.698 ** (-2.75) (-4.26) Constant 1.872 0.697 (10.11) (2.66) N 65 65 Adjusted R-sq 0.376 0.487
ii. Beneficiaries of federal programmes and policies This has been an area where redistributional policies have been especially marked. In the education sphere, a quota system for university entrants resulted in a significant rise in bumiputera participation in tertiary education, much of it in assisted places overseas. Between 1980 and 1984, over 95 per cent of successful applicants for grants to study overseas were bumiputera (Heng, 1997). The proportion of bumiputera students in local higher education institutions increased from 40 per cent in 1970 to 63 per cent in 1985. By 1995, bumiputera students accounted for 73 per cent of enrolments in public25 higher education institutions (Khoo, 2006). Public funds have been an important vehicle for redistribution, For example, the Federal Land Development Agency (FELDA) opened up large tracts of land for mostly Malay settlers and small-holders on beneficial terms. Another agency, Pemodalan Nasional Berhad (PNB, National Capital Fund), has grown into a massive investment vehicle supporting bumiputera interests, with major stakes in many of the largest companies on the stock exchange. PNB also operates a number of bumiputera-only unit trust funds, which can be bought with low-interest loans. These unit trusts have typically performed better than the market average, possibly due to financial support from PNB itself.26 However, although the national-level schemes
25 NEP legislation had restricted higher education to the public sector until the Education Act of 1995, which allowed the creation of private universities. 26 Analysis of stock exchange transactions shows regular large transfers of shares between PNB and its wholly owned subsidiary ASN, which runs the unit trust scheme, often transferred to-and-fro on consecutive days. PNB annual reports have also reported major losses on the
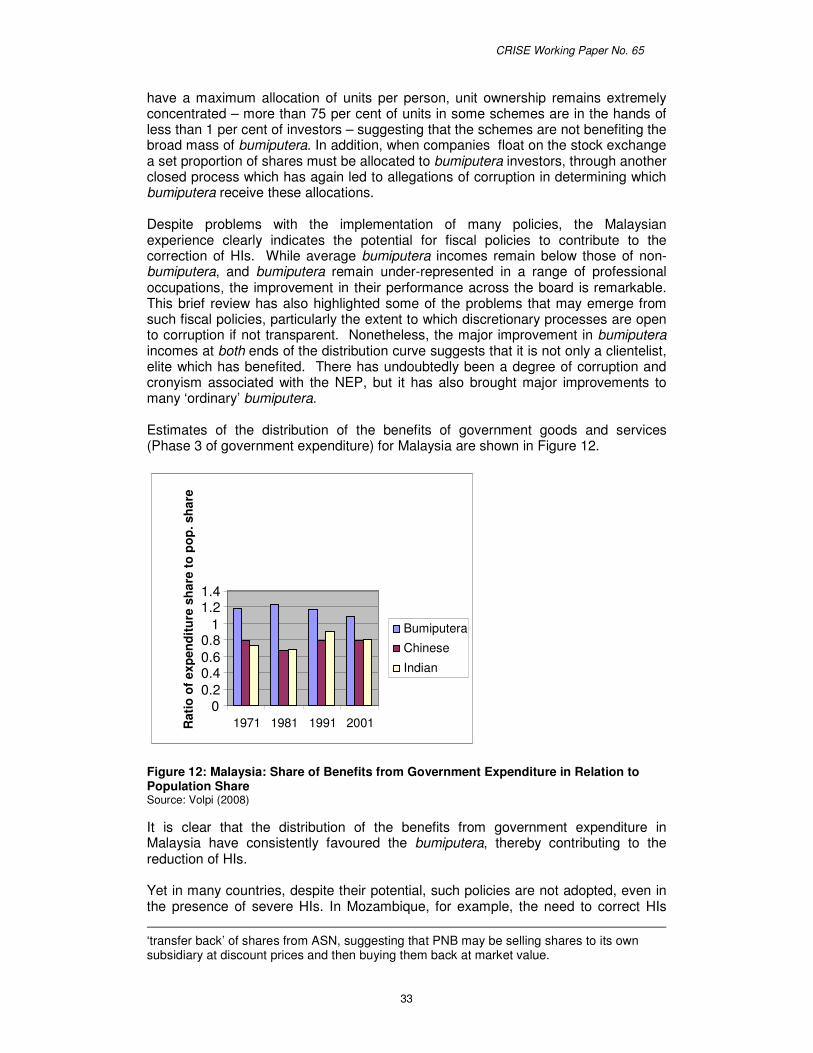
CRISE Working Paper No. 65
33
have a maximum allocation of units per person, unit ownership remains extremely concentrated – more than 75 per cent of units in some schemes are in the hands of less than 1 per cent of investors – suggesting that the schemes are not benefiting the broad mass of bumiputera. In addition, when companies float on the stock exchange a set proportion of shares must be allocated to bumiputera investors, through another closed process which has again led to allegations of corruption in determining which bumiputera receive these allocations. Despite problems with the implementation of many policies, the Malaysian experience clearly indicates the potential for fiscal policies to contribute to the correction of HIs. While average bumiputera incomes remain below those of non- bumiputera, and bumiputera remain under-represented in a range of professional occupations, the improvement in their performance across the board is remarkable. This brief review has also highlighted some of the problems that may emerge from such fiscal policies, particularly the extent to which discretionary processes are open to corruption if not transparent. Nonetheless, the major improvement in bumiputera incomes at both ends of the distribution curve suggests that it is not only a clientelist, elite which has benefited. There has undoubtedly been a degree of corruption and cronyism associated with the NEP, but it has also brought major improvements to many ‘ordinary’ bumiputera. Estimates of the distribution of the benefits of government goods and services (Phase 3 of government expenditure) for Malaysia are shown in Figure 12.
Figure 12: Malaysia: Share of Benefits from Government Expenditure in Relation to Population Share Source: Volpi (2008) It is clear that the distribution of the benefits from government expenditure in Malaysia have consistently favoured the bumiputera, thereby contributing to the reduction of HIs. Yet in many countries, despite their potential, such policies are not adopted, even in the presence of severe HIs. In Mozambique, for example, the need to correct HIs ‘transfer back’ of shares from ASN, suggesting that PNB may be selling shares to its own subsidiary at discount prices and then buying them back at market value.
0 0.20.40.60.8
1 1.21.4
1971 1981 1991 2001
Bumiputera
Chinese
Indian
Rat
io o
f exp
endi
ture
sha
re to
pop
. sha
re
CRISE Working Paper No. 65
34
was not recognised in the donor-dominated post-conflict reconstruction. While the reconstruction has been successful in other respects, HIs have been accentuated in the peace period, with government services and aid distribution being strongly skewed towards the South. Southerners (Xitsonga) are consistently better off than those from the Centre (Cisena), with twice as many with electricity, and three-quarters the infant mortality rate in 1997 (Østby, 2003). The North was even poorer. Rehabilitation post-conflict has accentuated these differences, with just 16% of households living in areas where schools were rehabilitated in the North and 20% in the Centre, compared with 37% in the South (Heltberg et al., 2003). In 1995-1997, average aid disbursements per person were $104 in the South, $72 in the Centre, and the North (the most deprived region) got just $18.5 (UNDP, 1998). However, these disparities have not (at least as yet) led to further outbreaks of violence, perhaps because this occurred in a context of sustained growth in incomes and services as a whole (Stewart, 2005). In Kenya, regional and ethnic HIs are marked, with Kikuyu being significantly better off than each of the other major groups, and over 40% better off on average than Kenyans as a whole, according to an index of household assets; likewise, Central Province and Nairobi, where Kikuyu are concentrated, are richer than the average, and the other provinces are poorer. Yet public expenditure has not corrected these inequalities, and on balance accentuated them (DHS data for 2003). The poorest regions – North Eastern, Western and Nyanza – all received well below-average allocations per head 1999/2000-2003/4. However, Central Province also received below-average allocations and some districts in Rift Valley above average, probably due to the political dominance of the Kalenjin over these years (Kiringai, 2007; Kanyinga, 2007). 7. Process This section briefly considers the processes by which the policies identified earlier could be put into effect in practice. In practical terms, few policy makers have information about the detailed distributional incidence of public expenditure, although evidence from academic studies of benefit incidence in a range of countries gives some guidance on how different types of expenditure affect VI, but not HI (see the survey by Chu et al, 2004)27 Despite the early stage of mapping of public expenditure and the problems in carrying this out, this is not a reason for inaction while waiting for improved information. Rather it suggests that imaginative use should be made of the information that is available, quick and ‘light’ surveys can be instituted to improve information, and evidence from other countries can shed light on likely distributional incidence. Abundant evidence from all over the world, for example, indicates that, in general, social sector expenditure is progressive, while the benefits from primary educational expenditure are more equally distributed than secondary or tertiary. A similar conclusion arises with roads – trunk roads in rich areas are likely to be regressive while feeder roads in poor areas are likely to be progressive. It is also known that cash transfers and food subsidies are usually progressive, although this depends on their design. Hence even without knowledge of the particular country, enough is known to improve the distributional incidence of public expenditure. In addition, a Core Welfare Indicator Survey (CWIQ) can be designed quickly and
27 McKay (2004) discusses problems with benefit-incidence studies, including their behavioural assumptions.
CRISE Working Paper No. 65
35
inexpensively to identify access to public services from the perspective of the user (McKay, 2004; Reinikka and Svensson, 2004). This can be supplemented by participatory focus groups in particular areas to get information on user access and user preferences. In some parts of the world, NGOs have begun to take an active part in discussions and monitoring of budget priorities and monitoring outcomes – for example DISHA (Developing Initiatives for Human and Social Interaction) which is a social movement in Gujerat, India, which aims to use these activities to improve the position of Dalits. Similarly, the Brazilian Institute for Social and Economic Analysis (IBASE) aims to improve democratic discussion and human rights by monitoring budgets. In Uganda, communities have been organised to monitor publicly financed activities in the Community-Based Monitoring and Evaluation System, while Fundar in Mexico analyses budgetary expenditure and acts as an advocacy group for pro-poor expenditure (information from Robinson, 2006). These activities could readily support redirection of fiscal policy towards correcting HIs. 7.1 Obstacles and trade-offs A country’s capacity and willingness influence its response to inequality in a post-conflict environment. The financial, technical and administrative capacity to monitor inequality, review tax and public expenditure incidence and institute targeted programmes and transfer payments to benefit deprived groups varies, but is, in general, especially weak in post-conflict countries. Technical assistance to build up capacity is then needed. Countries may be unwilling to address inequality for a number of reasons. In some contexts, governments may not be aware of the true extent of ethnic or religious disparities, or they may take the view that generic pro-poor policies would constitute a sufficient response to address inequality. In other cases, governments may be deliberately exclusionary. This is the most difficult case for external policy. Three approaches are appropriate: first, dialogue and policy conditionality to try and secure a more favourable attitude by the government; secondly, project and sectoral support directed at the deprived groups; and thirdly, promotion of other objectives, acceptable to the government, which would also assist the poorer groups – for example, comprehensive education and health services. Donors are able to exert considerable influence in many post-conflict situations because of the very large aid flows: for example, in 2004 aid to Mozambique amounted to 23% of GDP (de Renzio and Hanlon 2007). Thus aid alone can make a major contribution to overcoming inequalities in public expenditure.28 Implementation problems are illustrated by the experience of Guatemala, where sharp HIs have long been evident between indigenous peoples and the European and mixed population, and were an important element in provoking and sustaining the long civil war. The Peace Accords in the 1990s contained provisions to correct HIs, including an increase in tax revenue in order to support increased social expenditure, and the introduction of a trust fund to buy underused land for redistribution to tenant farmers. Yet only limited progress has been achieved. Revenue-raising was substantially below expectations which led to less social expenditure than promised, while political obstacles prevented much progress on the land redistribution (Caumartin, 2005).
28 See Stewart and Brown (2006) for a discussion of how aid may be used to reduce HIs.
CRISE Working Paper No. 65
36
8. Conclusions This paper has argued that fiscal policy could play an important role in tackling horizontal inequalities where such inequalities are severe – and indeed it already does in some countries. A first requirement, of course, is to get the objective accepted. In many multiethnic societies, this is accepted, but in many more it is not. Moreover, it does not generally form part of the donor policies, activities or dialogue. An important component of policy towards inequality is to collect available information and to institute systematic data collection on group lines for future data collection. Although the appropriate data on group characteristics, the nature of inequalities and the distributive impact of the fiscal system are often not readily available, this does not present an insuperable problem even today, as enough is generally known, or can be rapidly collected, to identify appropriate policies. The paper has outlined a variety of ways in which tax and expenditure policy can affect inequality (specific proposals are summarised in the appendix). Improving the progressiveness of both direct and indirect taxation will usually improve HI as well as contributing to improving vertical inequality. Regional tax and expenditure policies contribute to the improvement of HI where deprived groups are regionally concentrated. Similarly, within regions, both tax (especially property taxes) and expenditure (including transfer payments) may be designed to help the deprived people and locations. A number of other specific forms of taxation and expenditure will contribute to reducing HIs in particular contexts, depending on the location, economic specialisation and behaviour of different groups. Correcting HIs in the allocation of government contracts and in employment in public facilities is an important element of public policy towards HIs, especially because of the visibility of such allocations – often having more visibility than the distribution of the consumption of publicly provided goods and services. A particularly effective type of policy is to use government procurement to enforce (or encourage) the private sector to adopt egalitarian policies. This has been an important part of policies in Northern Ireland to improve religious balance in employment. The Malaysia case also illustrates how effective such policies can be in reducing horizontal inequalities. A critical function of the tax system is to mobilise increased resources because politically it is much easier to redirect expenditure to deprived groups if this can be done out of increased total expenditure, rather than at the direct expense of better-off groups. One reason that the promises of the peace accord were not realised in Guatemala was the failure to raise adequate revenue. Monitoring any such policies and their outcomes is essential so as to identify where the need for policy is particularly great, and the effectiveness of the various policies adopted. Two major problems for corrective policy are whether there is the will to correct such inequalities – which extends not only to decision making at the political level but also to implementation – and conflicts with other elements in policy, particularly economic policy, which may push in the opposite direction. Consequently, to be effective, policy needs to extend beyond the fiscal arena to other parts of economic policy-making. In conclusion, in most cases, if appropriately designed the fiscal system should be able to contribute substantially to the reduction of inequality so long as this is desired by the government. Where it is not, it is very difficult to implement policies effectively.
CRISE Working Paper No. 65
37
In addition, transparency and fairness is particularly important where such policies are being pursued so as to avoid a sense of unfair treatment by groups or individuals. This requires a public debate on the need and mechanisms for reducing HIs, publicly disseminated rules, simplicity of the system and a minimum of discretionary exemptions. Donors have an important role to play. Though they cannot change the firmly held positions of the government in power, they can promote the need to monitor and take action towards inequalities, while they could themselves help collect data on HIs; request that public expenditure reviews incorporate HI considerations; and ensure that their own expenditure contributes to correcting HIs. NGOs and communities can also contribute both by advocacy and by monitoring.
CRISE Working Paper No. 65
38
Appendix: Summary of proposals
I. Data 1. Perform an inventory of existing sources that would be helpful,
including census data, household surveys, and regional data. 2. Advise statistical offices to include an ethnic, religious, or racial
categorisation (as relevant) in data collection
3. Where no (or highly inadequate) data are available, conduct a small household survey to supplement existing data sources with a limited number of basic variables included (e.g. asset ownership; nature of employment; incomes; educational attainments; anthropometric data).
4. Stimulate the introduction of a perceptions survey, if none exists, to
elucidate attitudes towards own and others’ identities and inequalities.
5. For 3 and 4, participatory methods and the use of focus groups are helpful.
II. Taxation
1. Increasing the progressiveness of the system by:
i. Increasing the role and the progressiveness of direct taxes such as income tax and taxes on capital, including land and property taxes.
ii. Increasing the progressiveness of indirect taxes by raising rates of tax on luxuries and exempting basic goods consumed by the poor (including food and fuels that they use).
iii. Designing indirect taxes to bear more heavily on richer groups, by introducing taxes or increasing rates on activities and geographic areas where such groups are concentrated. The precise reforms will be country specific depending on the groups and their activities and location.
iv. Where groups are regionally concentrated:
1. Designing revenue sharing formulae at both district and regional level aimed at reducing the net tax burden of deprived areas and regions.
2. Varying tax rates by region, and including property
taxes by district.
3. Introducing tax exemptions for businesses in depressed regions.
2. Raising total revenue which will make a major potential contribution to
reducing inequality because it can finance expenditure directed at this objective.
3. Improving transparency in the tax system to reduce provocations caused by a sense of unfair treatment. This may be promoted by a public debate to achieve consensus on using taxation to reduce inequality, and clear rules.
CRISE Working Paper No. 65
39
III. Public expenditure
1. The construction of facilities: in this phase, allocation of contracts and employment should explicitly consider fairness among groups, with competitive and transparent bidding procedures for contracts.
2. The running of facilities: the group composition of those running
government services should be reviewed and efforts made, possibly including quotas, to ensure a fair distribution among groups; ‘fair’ employment legislation should be introduced; and technical assistance to disadvantaged groups provided.
3. The benefits from facilities: the distributional impact across individuals
and groups should be reviewed and the allocation revised to ensure a greater share of goods benefit poor groups and individuals, by switching type to pro-poor sectors, pro-poor types of activity within sectors, and pro-poor locations. Transfer payments should also be designed to ensure that deprived people/groups benefit disproportionately.
4. In federal or decentralised systems, revenue-sharing formulae should
be designed to benefit poor regions/areas.
5. Aid allocation should follow similar principles aiming for improved equality; this also applies to DDR and SSR.
6. Monitoring of public expenditure, in each of the three phases, should
review its group and individual distributional impact.
IV. Policy proposals with respect to overcoming obstacles
1. Promoting awareness of the need for such policies, and their nature. 2. Assisting governments to identify types of expenditure that will reduce
inequalities, drawing on any data that is available, well-established conclusions from other countries, and the introduction of light surveys of use of government services among households of different types.
3. Providing technical assistance in public expenditure reviews and
planning where capacity is a constraint.
4. Undertaking policy dialogue and conditionality, working with NGOs and direct inequality reducing expenditures by donors where political will is absent.
CRISE Working Paper No. 65
40
References Adam, C., and D. Bevan (2004). Fiscal policy design in low-income countries. In T. Addison and A. Roe (eds). Fiscal Policy for Development: Poverty, Reconstruction and Growth pp.46-71 Addison, T., A. Choudhury and M. Murshed (2004). The fiscal dimensions of conflict and reconstruction. In T. Addison and A. Roe (eds). Fiscal policy for development : poverty, reconstruction and growth. Basingstoke, Plagrave. Addison, T., and A. Roe (eds) (2004). Fiscal Policy for Development: Poverty, Reconstruction and Growth. Basingstoke, Palgrave Macmillan. Ahmad, E., and R. Singh (2003). Political economy of oil-revenue sharing in a developing country: Illustrations from Nigeria. IMF Working Papers 03/16. Alesina, A., and D. Rodrik (1994). Distributive politics and economic growth. Quarterly Journal of Economics 109(2): 465-90.
Alkire, S., and J. Foster (2008). Counting and multidimensional poverty measurement. OPHI Working Paper No. 7. Oxford: Oxford Poverty and Human Development Initiative, University of Oxford. Auvinen, J., and E. W. Nafziger (1999). The sources of humanitarian emergencies. Journal of Conflict Resolution 43(3): 267–290 Barlow, R., and W. Snyder. (1993). Taxation in Niger: Problems and proposals. World Development 21(7): 1179–1189 Bird, R., and E. Slack (2006). The role of the property tax in financing rural local governments in developing countries International Tax Program Paper 0608. International Tax Program, Institute for International Business, Joseph L. Rotman School of Management, University of Toronto. Bosco, L., and L. Mittone (1997). Tax Evasion and Moral Constraints: Some Experimental Evidence. Kyklos 50(3): 297-324. Bourguignon, F. (2001). Crime as a social cost of poverty and inequality: a review focussing on developing countries. In S. Yussuf, S. Evenett and W. Wu (eds) Facets of Globalization: International and Local Dimensions of Development. Washington DC, World Bank. Boyce, J. (2007). Public Finance, Aid and Post-Conflict Recovery. Background Paper for the UNDP Report on Fostering Post-Conflict Economic Recovery. New York, UNDP. Bowie, A. (1994). The dynamics of business-government relations in industrialising Malaysia. In A. MacIntyre (ed.) Business-Government Relations in Industrialising Asia.. London, Allen and Unwin: 167-94. Brown, G. and F. Stewart (2006). The implications of horizontal inequality for aid. CRISE Working Paper No. 36. Oxford, Centre for Research on Inequality, Human Security and Ethnicity, University of Oxford.
CRISE Working Paper No. 65
41
Cameron, M. A. and T. G. Falleti (2005). Federalism and the subnational separation of powers. Publius: The Journal of Federalism 35(1).
Carnahan, M. 2007. Options for revenue-raising in post-conflict environments. Public Finance in Post-Conflict Environments. A Policy Paper Series. Center on International Cooperation, Political Economy Research Institute, New York University. http://www.cic.nyu.edu/peacebuilding/docs/Revenue%20Generation%20in%20Post-Conflict%20Environments.pdf
Caumartin, C. (2005). Racism, violence, and inequality: An overview of the Guatemalan case. CRISE Working Paper No. 11. Oxford, Centre for Research on Inequality, Human Security and Ethnicity, University of Oxford. Chin, Y. W. (2004). Ethnicity and the transformation of the Ali-Baba partnership in the Chinese business culture in Malaysia. In B. K. Cheah (ed.) The Challenge of Ethnicity: Building a nation in Malaysia. Singapore, Marshall Cavendish International: 54-88.
Chu, K.-Y., H. R. Davoodi, and S. Gupta (2004). Income distribution and tax, and government social spending policies in developing countries. In G. A. Cornia (ed.) Inequality, Growth and Poverty in an Era of Liberalization and Globalization. Oxford, Oxford University Press.
Cobham, A. (2005a). Causes of conflict in Sudan: Testing The Black Book. European Journal of Development Research 17(3): 462-480. Cobham, A. (2005b). Causes of conflict in Sudan: Testing The Black Book. QEH Working Paper No. 121. Oxford: Queen Elizabeth House, University of Oxford. Cobham, A. (2005c). Taxation policy and development. OCGG Economy Section Analysis 05-01. Oxford: Oxford Council on Good Governance. Collier, P. and World Bank. (2003). Breaking the conflict trap: civil war and development policy. Washington, DC [New York]: World Bank; Oxford University Press.
Collier, P., and A. Hoeffler (2004). Greed and grievance in civil war. Oxford Economic Papers 56(4): 563–595
Cormack, R. J. and R. D. Osborne (1983). Religion, education and employment: aspects of equal opportunity in Northern Ireland. Belfast: Appletree.
Crabtree, J. and J. J. Thomas (1998). Fujimori's Peru: the political economy. London: Institute of Latin American Studies. De Renzio, Paulo and Joseph Hanlon (2007). Contested Sovereignty in Mozambique: the dilemmas of aid dependency. GEG Working Paper 2007/25. Global Economic Governance Porgramme. University College, Oxford. Di John, Jonathan (2006). The Political Economy of Taxation and Tax Reform in Developing Countries. WIDER Research Paper 2006/74. Helsinki: Anthem Press and World Institute of Development Economic Research, WIDER.
CRISE Working Paper No. 65
42
Figueroa, A. (2008). Education, labour markets and inequality in Peru. CRISE Working Paper No. 48. Oxford: Centre for Research on Inequality, Human Security and Ethnicity, University of Oxford. Graham, C. and S. Pettinato (2002). Happiness and Hardship: Opportunity and Insecurity in New Market Economies. Washington, DC: The Brookings Institution.
Gomez, E. T., and K. S. Jomo (1997). Malaysia's Political Economy: Politics, patronage and profit. Cambridge: Cambridge University Press.
Gupta, Sanjeev, Shamsuddin Tareq, Benedict Clements, Alex Segura-Ubiergo, Rina Bhattacharya and Todd Mattina (2005). Rebuilding Fiscal Institutions in Postconflict Countries. IMF Occasional Paper 247. Washington DC: IMF.
Heltberg, R., K. Simler and F. Tarp (2003) Public Spending and Poverty in Mozambique. FCND Discussion Paper 167. Washington DC: IFPRI. Heng, P. K. (1997). The New Economc Policy and the Chinese community in Peninsular Malaysia. The Developing Economies 35(3): 262-292. Hofman, Bert, Kadjatmiko, Kaiser, Kai, Sjahrir, Bambang Suharnoko. (2006). Evaluating fiscal equalization in Indonesia. Policy Research Working Paper 3911. World Bank, Poverty Reduction and Economic Management Network. Washington DC: World Bank
Horowitz, D. (1985). Ethnic Groups in Conflict. Berkeley, CA: University of California Press. Ishak, S. (1996). Pembangunan desa dan kemiskinan di Malaysia dalam tempoh Dasar Ekonomi Baru, 1972-1990 [Village development and poverty in Malaysia in the era of the New Economic Policy, 1972-1990]. In S. Muhammad Ikmal and E. Zahid. Petaling Jaya (eds) Malaysia: Critical perspectives. Persatuan Sains Sosial Malaysia: 224-264.
Ishak, S. (2000). Economic growth and income inequality in Malaysia, 1971-95. Journal of the Asia Pacific Economy 5(1/2): 112-124.
Jesudason, J. V. (1989). Ethnicity and the Economy: The state, Chinese business and multinationals in Malaysia. Singapore: Oxford University Press.
Jomo, K. S. (1986). A Question of Class: Capital, the state and uneven development in Malaya. Singapore, Oxford University Press.
Jomo, K. S. (1990). Whither Malaysia's New Economic Policy? Pacific Affairs 63(4): 469-499. Kanyinga K. (2007). Governance institutions and inequality. Readings on Inequality in Kenya. Society for International Development (SID). Nairobi: SID, 345-398 Kelly, Roy. (2004). Property Taxation in Indonesia. In Richard Bird and Enid Slack (eds), International Handbook of Land and Property Taxation, Northampton, MA: Edward Elgar.
CRISE Working Paper No. 65
43
Khoo, B. T. (2006). Ethnic structure, inequality and governance in the public sector: Malaysian experiences. UNRISD Democracy, Governance and Human Rights Programme Paper No. 20. Geneva: United Nations Research Institute for Social Development. Kiringai, J. 2007. Public spending in Kenya: an inequality perspective. Readings on Inequality in Kenya. Society for International Development (SID). Nairobi: SID, 11- 56 Langer, A. and U. Ukiwo. (2007). Ethnicity, religion and the state in Ghana and Nigeria: Perceptions from the street. CRISE Working Paper No. 34. Oxford: Centre for Research on Inequality, Human Security and Ethnicity, University of Oxford. Lichbach, M.I. (1989). An evaluation of ‘does economic inequality breed political conflict?’ studies. World Politics 41(4): 431–470. Luttmer, Erzo F.P. (2004), Neighbors as negatives: Relative earnings and wellbeing. NBER Working Paper No. W10667, Cambridge, Massachusetts: NBER. Mahon, James (2005). Liberal States and Fiscal Contracts: Aspects of the Political Economy of Public Finance. Paper presented at the annual meeting of the American Political Science Association, Washington, DC, September 1. http://www.allacademic.com/meta/p40115_index.html Malaysia (2001). Eighth Malaysia Plan, 2001 - 2005. Kuala Lumpur: National Printing Department.
Malaysia (2006). Ninth Malaysia Plan, 2006-2010. Putrajaya: The Economic Planning Unit, Prime Minister's Department.
Mancini, L. (2005). Horizontal inequality and communal violence: Evidence from Indonesian districts. CRISE Working Paper No. 22. Oxford: Centre for Research on Inequality, Human Security and Ethnicity, University of Oxford.
McCrudden, C. (2007). Buying social justice: equality, government procurement, and legal change. Oxford: Oxford University Press. McCrudden, C. (2004). Using public procurement to achieve social outcomes. Natural Resources Forum 28 (4): 257-267. McCrudden, Christopher, Ford, Robert and Heath, Anthony (2004). Legal Regulation of Affirmative Action in Northern Ireland: An Empirical Assessment Oxford Journal of Legal Studies 24 (3): 363-415. McKay, Andy (2004). Assessing the Impact of Fiscal Poverty on Poverty. In T. Addison and A. Roe (eds), Fiscal Policy for Development: Poverty, Reconstruction and Growth. Basingstoke: Palgrave-Macmillan
Meerman, J. (1979). Public Expenditure in Malaysia: Who benefits and why? Oxford: Oxford University Press. Mittone, Luigi (2006). Dynamic behaviour in tax evasion: An experimental approach. The Journal of Socio-Economics 35(5): 813-835.
CRISE Working Paper No. 65
44
Okolo, A. (1999). The Nigerian census: Problems and prospects. The American Statistician 53(4): 312–325. Østby, G. (2006). Horizontal inequalities, political environment and civil conflict: Evidence from 55 developing countries. CRISE Working Paper No. 28. Oxford: Centre for Research on Inequality, Human Security and Ethnicity, University of Oxford. Østby, G. (2003). Horizontal inequalities and civil war: Do ethnic group inequalities influence the risk of domestic armed conflict? Cand Polit. Thesis, Department of Sociology and Political Science. Norwegian University of Science and Techonology (NTNU), Trondheim, Norway.
Ragayah Haji Mat Zin (2003). Explaining The Trend In Malaysian Income Distribution. EADN Income Distribution Project. Institute of Malaysian and International Studies and the Faculty of Economics, Universiti Kebangsaan Malaysia Rasiah, R. and S. Ishak (2001). Market, government and Malaysia's New Economic Policy. Cambridge Journal of Economics 25(1): 57-78.
Reinikka, R., and Svensson, J. (2004). Local capture: Evidence from a central government transfer program in Uganda. The Quarterly Journal of Economics 119 (2): 679–705.
Robinson, M. (2006). Budget analysis and policy advocacy: the role of non-governmental public action. IDS Working Paper No. 279. Brighton: Institute of Development Studies, University of Sussex.
Ross, M. (2004). What do we know about natural resources and civil war? Journal of Peace Research 41(3): 337–356
Searle, P. (1999). The Riddle of Malaysian Capitalism: Rent-seekers or real capitalists? Honolulu: University of Hawai'i Press. Shankah, Rajah, and Shah, Anwar (2003) Bridging the Economic Divide Within Countries: A Scorecard on the Performance of Regional Policies in Reducing Regional Income Disparities. World Development 31 (8): 1421-1441.
Sjoquist, David L (2005). The Land Value Tax in Jamaica: An Analysis and Options for Reform. International Studies Program Working Paper 04-26, Andrew Young School of Policy Studies, Georgia State University.
Snodgrass, D. R. (1974). The fiscal system as an income redistribution in West Malaysia. Public Finance 20(1): 56-76.
Stewart, F. 2005. Policies towards Horizontal Inequalities in Post-Conflict Reconstruction. CRISE Working Paper No. 7. Oxford: Centre for Research on Inequality, Human Security and Ethnicity, University of Oxford. Stewart, F. (2000). Crisis Prevention: Tackling Horizontal Inequalities. Oxford Development Studies 28(3): 245-262. Stewart, F., V. Fitzgerald and Associates (2001). War and Underdevelopment: Country Experiences. Oxford: OUP.
CRISE Working Paper No. 65
45
Stewart, F., G. Brown and L. Mancini (2005). Why horizontal inequalities matter: Some implications for measurement. CRISE Working Paper No. 19. Oxford: Centre for Research on Inequality, Human Security and Ethnicity, University of Oxford. Todd, J. (2007). Beyond Inequality? Assessing the impact of fair employment, affirmative action and equality measures on conflict in Northern Ireland. Paper prepared for CRISE Workshop on Evaluating Affirmative Action: Malaysia In International Comparative Perspective, Singapore, October 22-23. Ukiwo, Ukoha (2008). Horizontal Inequalities and Ethnic Violence: Evidence from Calabar and Warri, Nigeria. In Frances Stewart (ed.) Horizontal Inequalities and Conflict: Understanding Group Violence in Multiethnic Societies. Basingstoke: Palgrave Macmillan. UNDP. (1998) Development Cooperation Report 1995-1997. Maputo: UNDP. Wanjala, Bernadette (2007). Design and performance of Kenya’s tax performance: an inequality perspective. In Society for International Development (SID) Readings on Inequality in Kenya: Sectoral Dynamics and Perspectives. Nairobi: SID. Wong, T. C. (1990). Industrial development, the New Economic Policy in Malaysia and the international division of labour. ASEAN Economic Bulletin 7(1). World Bank (2006). World Development Report 2006. Washington DC, World Bank.