Embed Size (px)
Citation preview

1
The implementation of NEMS GFS Aerosol Component 1
(NGAC) Version 1.0 for global dust forecasting at 2
NOAA/NCEP 3
4
Cheng-Hsuan Lu1.2, Arlindo da Silva3, Jun Wang2, Shrinivas Moorthi4, Mian 5
Chin3, Peter Colarco3, Youhua Tang5, Partha S. Bhattacharjee2, Shen-Po Chen1, 6
Hui-Ya Chuang4, Hann-Ming Henry Juang4, Jeffery McQueen4 and Mark Iredell4 7
[1] {University at Albany, State University of New York, Albany, NY, USA} 8
[2] {I. M. Systems Group, Inc. at NOAA/NWS National Centers for Environmental 9
Prediction, College Park, MD, USA} 10
[3] {NASA Goddard Space Flight Center, Greenbelt, MD, USA} 11
[4] {NOAA/NWS National Centers for Environmental Prediction, College Park, MD, USA} 12
[5] {NOAA/OAR Air Resources Laboratory, College Park, MD, USA} 13
Correspondence to: Cheng-Hsuan Lu ([email protected]) 14
15
Abstract 16
The NOAA National Centers for Environmental Prediction (NCEP) implemented NEMS GFS 17
Aerosol Component (NGAC) for global dust forecasting in collaboration with NASA 18
Goddard Space Flight Center (GSFC). NGAC Version 1.0 has been providing 5 day dust 19
forecasts at 1°x1° resolution on a global scale, once per day at 00:00 Coordinated Universal 20
Time (UTC), since September 2012. This is the first global system capable of interactive 21
atmosphere aerosol forecasting at NCEP. The implementation of NGAC V1.0 reflects an 22
effective and efficient transitioning of NASA research advances to NCEP operations, paving 23
the way for NCEP to provide global aerosol products serving a wide range of stakeholders as 24
well as to allow the effects of aerosols on weather forecasts and climate prediction to be 25
considered. 26
https://ntrs.nasa.gov/search.jsp?R=20170003333 2018-06-11T09:55:28+00:00Z
2
1 Introduction 1
Aerosols affect the energy balance of Earth’s atmosphere through the absorption and 2
scattering of solar and thermal radiation (Mitchell, 1971). Aerosols also affect Earth’s 3
climate through their effects on cloud microphysics, reflectance, and precipitation (Twomey, 4
1974; Albrecht, 1989; Jones et al., 1994; Lohmann et al., 2000). In addition to modulating 5
Earth’s climate and hydrological cycle (Ramanathan et al., 2001), aerosols are important for 6
atmospheric chemistry, the biosphere, and public health. Aerosols can be viewed in their role 7
as air pollutants because of their adverse health effects (Pöschl, 2005). Long range transport 8
of aerosols can affect the air quality and visibility far from the source regions (Prospero, 9
1999; Jaffe et al., 2003; Colarco et al., 2004). In addition, aerosols may play a significant role 10
in atmospheric oxidation processes (Andreae and Crutzen, 1997; Dickerson et al., 1997). 11
Large amounts of mineral dust are deposited to the oceans (Duce et al., 1991; Prospero et al., 12
1996) and the atmospheric input is found to be important for marine productivity (Chen et al., 13
2007). 14
While the importance of aerosols on climate has long been established, it is only recently that 15
the aerosol effects are being increasingly recognized as important for weather predictions 16
(Perez et al., 2006; Mulcahy et al., 2014). Haywood et al. (2005) shows that the neglect of the 17
radiative effects of mineral dust leads to systematic biases in the top-of-the-atmosphere 18
radiative budget in the UK Met Office (UKMO) numerical weather prediction (NWP) model. 19
By prescribing updated aerosol climatology in the European Centre for Medium-Range 20
Weather Forecasts (ECMWF) NWP model, a shift in the African Easterly Jet (AEJ) in better 21
agreement with observations is demonstrated in Tompkins et al. (2005) and improvements in 22
local medium-range forecast skills and global seasonal-mean are shown in Rodwell and Jung 23
(2008). A number of studies have suggested that aerosols can significantly impact severe 24
weather, such as intensifying Pacific storm track (Zhang et al., 2007; Wang et al., 2014), 25
modifying hurricane and tropical cyclones (Rosenfeld et al., 2012; Herbener et al., 2014), 26
affecting deep convective storms and tornado intensity in the U.S. (Wang et al., 2009; Saide 27
et al., 2015), and enhancing catastrophic floods in Southwest China (Fan et al., 2015). 28
Despite recent progress in atmospheric aerosol modeling, the physical processes crucial for 29
modeling aerosol effects are either poorly represented or outright missing in National Centers 30
for Environmental Prediction (NCEP) global models. The NCEP’s Global Forecast System 31
(GFS) is the cornerstone of NCEP’s operational production suite of numerical guidance. The 32
3
atmospheric forecast model used in the GFS is global spectrum model (GSM) with a 1
comprehensive physics suite (see the GFS webpage at 2
http://www.emc.ncep.noaa.gov/GFS/doc.php). Until now, the model only considers aerosol 3
radiative effects and the aerosol distributions are prescribed based on a global climatological 4
aerosol database (Hess et al., 1998). 5
Efforts to develop prognostic aerosol capability in NCEP global models have been underway 6
in the last few years, which in turn is part of NCEP’s modeling development efforts toward a 7
unified modeling framework. Specifically, NCEP is developing NOAA Environmental 8
Modeling System (NEMS) as its next-generation operational system (Black et al., 2007, 9
2009) and has collaborated with NASA/Goddard Space Flight Center (GSFC) to develop 10
NEMS GFS Aerosol Component (NGAC) for predicting the distribution of atmospheric 11
aerosols (Lu et al., 2010; 2013). NGAC is the first on-line (interactive) atmospheric aerosol 12
forecast system at NCEP. It consists of two key modeling components: (1) the GFS within 13
the NEMS architecture (NEMS GFS) and (2) the on-line aerosol module based on Goddard 14
Chemistry Aerosol Radiation and Transport (GOCART) model. The advantages for taking 15
the so-called on-line approach include: (1) consistency: no spatial -temporal interpolation and 16
the use of the same physics parameterization, (2) efficiency: lower overall CPU costs and 17
easier data management, and (3) interaction: allows for aerosol feedback to meteorology. 18
NGAC Version 1.0 (NGAC V1.0) has been implemented and became operational at NCEP 19
since September 2012. It provides real-time short-range (5 day) forecasts of dust aerosols 20
with global coverage. The development of a global aerosol forecast system in turn provides a 21
first step toward an aerosol data assimilation capability at NCEP. The rationale for 22
developing the global aerosol forecasting and data assimilation capabilities at NCEP includes: 23
(1) to improve weather forecasts and climate predictions by taking into account of aerosol 24
effects on radiation and clouds, (2) to improve the handling of satellite observations by 25
properly accounting for aerosol effects during the assimilation procedure; (3) to provide 26
aerosol (lateral and upper) boundary conditions for regional air quality predictions; and (4) to 27
provide global aerosol products to meet the stakeholder needs such as air quality, UV index, 28
visibility, ocean productivity, solar energy production, and sea surface temperature (SST) 29
retrievals. 30
Aerosol modeling, traditionally serving regional air quality and climate communities, has 31
seen rapid development at several operational and research NWP centers in the last few years 32

4
(Reid et al., 2011; Benedetti et al., 2011, 2014). This includes NCEP (discussed in this 1
paper), ECMWF (Benedetti et al., 2009; Morcrette et al., 2009), UKMO (Woodward 2001, 2
2011), Naval Research Laboratory (NRL, Zhang et al., 2008; Westphal et al., 2009), NASA 3
Global Modeling and Assimilation Office (GMAO, Colarco et al., 2010), Japan 4
Meteorological Agency (JMA, Tanaka et al., 2003), and Barcelona Supercomputing Centre 5
(BSC, Perez et al., 2011; Basart et al., 2012). In addition, the efforts to develop regional and 6
global multi-model ensemble for aerosol prediction are underway (Sessions et al., 2015), 7
offering aerosol products for research applications and eventually operational use. The 8
implementation of NGAC V1.0 at NCEP not only contributes to the NCEP production suite 9
but also to the international efforts for multi-model ensembles. 10
In this paper, we describe the development and implementation of NGAC V1.0 at NCEP. In 11
Sect. 2, we describe the model configuration. In Sect. 3, we present the operational 12
implementation of NGAC V1.0. In Sect. 4, we present the results of NGAC V1.0 forecasts 13
and the comparisons to other global aerosol models and observations. In Sect. 5, we 14
demonstrate two examples of NGAC V1.0 applications. Section 6 provides concluding 15
remarks. 16
17
2 Model configuration 18
2.1 Atmospheric model: NEMS GFS 19
The efforts to develop a unified modeling framework to streamline the interaction of forecast, 20
analysis, and post-processing systems within NCEP have been underway since late 2000 21
(Black et al., 2007, 2009). Specifically, NCEP is developing NEMS 22
(http://www.emc.ncep.noaa.gov/index.php?branch=NEMS) with a component-based 23
architecture following the Earth System Modeling Framework (ESMF, see 24
http://www.earthsystemmodeling.org). The ESMF is a community effort to promote the 25
exchange and reusability of earth system modeling components and to facilitate faster 26
knowledge transfer and technology adaptation. The ESMF collaboration involves many of 27
the major climate, weather and data assimilation efforts in the United States, including 28
NOAA/NCEP, NASA/GMAO, NRL, NOAA Geophysical Fluid Dynamics Laboratory 29
(GFDL), and the National Center for Atmospheric Research (NCAR). 30

5
The development of NEMS aims to develop a common superstructure for NCEP production 1
suite. Other motivations include: (1) to reduce overhead costs and provide a flexible 2
infrastructure in the operational environment, (2) to modularize large pieces of the systems 3
with ESMF components and interfaces, and (3) to enable NOAA contribution to the National 4
Unified Operational Prediction Capability (NUOPC) with Navy and Air Force. 5
The NEMS is organized into collections of components with standardized interfaces, arranged 6
in a hierarchical structure. Currently the GFS, the B-grid version of the Non-hydrostatic 7
Multi-scale Model (NMM-B), and the Flow-following finite-volume Icosahedral Model 8
(FIM) have been placed under the NEMS-atmosphere framework. A unified parallelized I/O 9
package is developed to handle the synchronous production and writing of history files, which 10
in turn has been linked with NCEP’s unified post-processing system. The FIM atmosphere 11
model is developed by NOAA Earth System Research Laboratory (ESRL) for global weather 12
prediction research. The NMM-B model, developed by NCEP, is the forecast model for the 13
North American Meso-scale Forecast System (NAM) providing operational meso-scale 14
weather forecasts since October 2011. The NEMS version of GFS (referred to as NEMS GFS 15
in this paper) consists of the same spectral dynamic core and physics parameterizations as the 16
operational GFS with the following exceptions. First, GFS atmospheric model has been 17
restructured to include separate components for the model’s dynamics and physics as well as 18
a coupler through which information is passed between the dynamics and physics. Despite 19
extensive use of ESMF superstructure, infrastructure and utilities in NEMS, the underlying 20
science code, however, remains the same as the operational GFS. Second, enhanced I/O and 21
post-processing capabilities are introduced in the NEMS GFS. These include an option to 22
output history files in native Gaussian grids instead of spectral grids and an option to run 23
model integration in parallel to post-processing. Third, GFS physics parameterizations have 24
been re-structured with a flexible interface, allowing it to be called by other dynamic cores. 25
This option to assemble GFS physics as the NEMS unified physics package again reflects 26
NCEP’s modeling strategy toward a unified and yet flexible modeling infrastructure. 27
The NEMS has been under active development. Efforts to incorporate non-atmospheric 28
components, e.g., ocean, wave, and sea ice models, are underway. The coupling 29
infrastructure is based on the ESMF and NUOPC Layer code and conventions. Development 30
is also made to enable emerging environmental prediction capabilities. The aerosol 31

6
forecasting capability, NGAC, discussed in this paper is virtually NEMS GFS with the 1
prognostic aerosol option turned on. 2
2.2 Aerosol model: GOCART 3
Funded mainly by NASA Earth Science programs, the GOCART model was developed to 4
simulate atmospheric aerosols (including sulfate, black carbon (BC), organic carbon (OC), 5
dust, and sea-salt), and sulfur gases (Chin et al., 2000, 2002, 2003, 2004, 2007, 2009; Ginoux 6
et al., 2001, 2004; Bian et al., 2010; Colarco et al., 2010; Kim et al., 2013). Originally 7
GOCART was developed as an off-line Constituent Transport Model (CTM), driven by 8
assimilated meteorological fields from the Goddard Earth Observing System Data 9
Assimilation System (GEOS DAS, e.g., Chin et al., 2002). As part of the GEOS Version 4 10
(GEOS-4) atmospheric model development at NASA GMAO, an ESMF compliant GOCART 11
grid component has been developed (Colarco et al., 2010). When running within versions 4 12
and 5 of GEOS (GEOS-4/5), the GOCART component provides aerosol processes such as 13
emissions, sedimentation, dry and wet deposition (Fig. 1). Dynamic sources (wind-speed 14
dependent) are considered for dimethyl sulfide (DMS), dust and sea salt. Emissions for SO2 15
and carbonaceous aerosols arise from nature and anthropogenic sources, including biogenic, 16
biofuel, anthropogenic, and biomass burning emissions. Aerosol chemistry currently uses 17
prescribed OH, H2O2, and NO3 fields for DMS and SO2 oxidations. Aerosol sinks include 18
wet removal (scavenging and rainout) and dry deposition (gravitational sedimentation and 19
surface uptake). Advection, turbulent and convective transport is outside the scope of the 20
GOCART component, being instead provided by the host atmospheric model. Unlike off-line 21
CTM, this on-line aerosol module accurately utilizes winds, convective mass flux, and eddy 22
diffusivity valid at each time step, without the need for temporal or spatial interpolation of 23
any kind. 24
Research and development efforts have further enhanced GOCART modeling capabilities. 25
The transition from off-line to on-line coupling approach mentioned above is an example. In 26
addition, the GOCART grid component now has the option to ingest daily biomass burning 27
emissions from the Quick Fire Emission Dataset (QFED, Darmenov and da Silva 2015). 28
QFED emissions are based on fire radiative power retrievals from MODIS (Moderate 29
Resolution Imaging Spectroradiometer, on board Aqua and Terra satellites). The inclusion of 30
such observation-based, time-dependent emissions is important for the model to capture the 31
large temporal-spatial variation of biomass burning emissions. 32

7
For dust, a topographic source function and mobilization scheme following Ginoux et al. 1
(2001) is used. The dust emission parameterization depends on 10 m wind, the threshold 2
velocity of wind erosion, and dust source function. The threshold velocity of wind erosion is 3
determined from dust density, particle diameter, and surface soil wetness. The dust source 4
function, representing the probability of dust uplifting, is determined from surface bareness 5
and topographical depression features. Surface bareness is identified from the 1⁰x1⁰ 6
vegetation data set derived from the Advanced Very High Resoltion Radiometer (AVHRR) 7
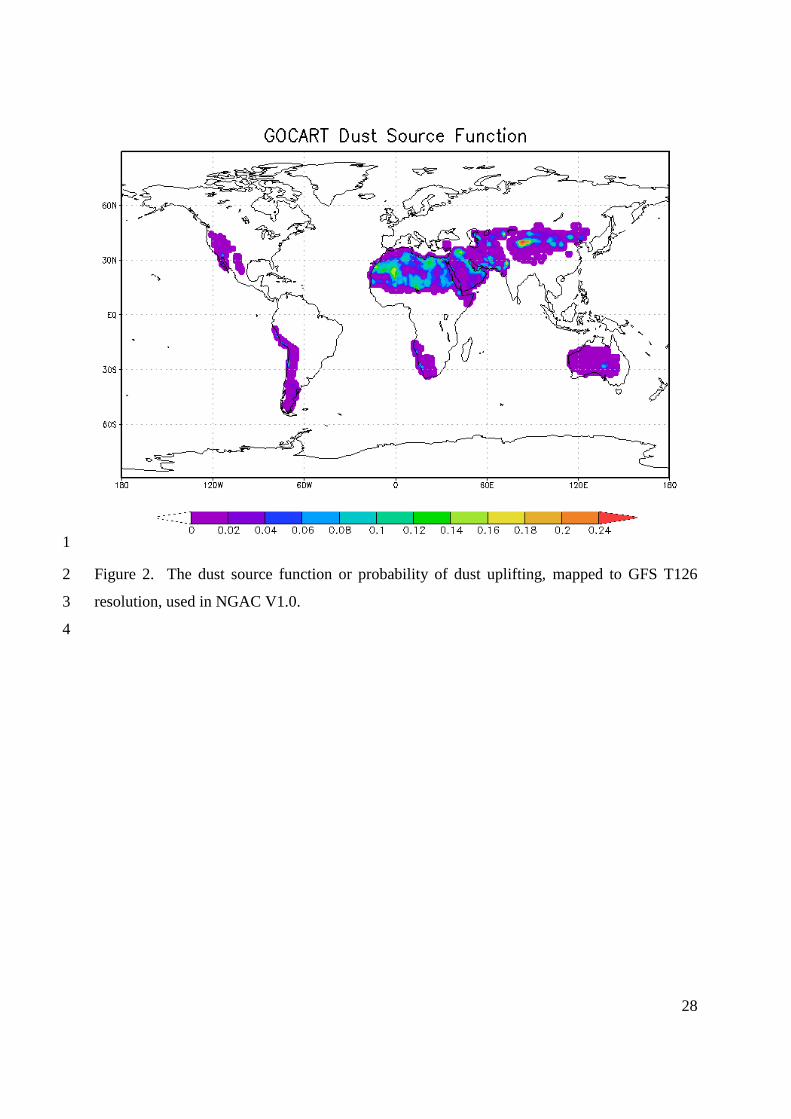
data (DeFries and Townshend, 1994). The static dust source function has been regridded on 8
the GFS native T126 Gaussian grid for NGAC V1.0 (shown in Fig. 2). The maxima of dust 9
source function are collocated with the climatologically active dust sources or so-called dust 10
hot spots. The most evident examples are the Sahara desert in north Africa, the Bodele 11
depression over Chad, the Syrian desert in mid-East, the Taklimakan desert in northwest 12
China, the Lake Eyre basin in Australia, the Sonoran desert in southwest California, the 13
Namibian sources in southwest Africa, and Patagonian desert and Andean Plateau in the 14
Andes. 15
2.3 Coupling NEMS GFS with GOCART 16
The GOCART grid component originally developed for GEOS-4/5 is fairly independent of 17
the host atmospheric model, encapsulating the basic aerosol production and loss functionality. 18
Consistent with standard ESMF architecture, the interfaces linking GOCART and NEMS 19
GFS have been isolated into coupler components. Figure 3 shows the integration run stream 20
of NGAC. Coupler components are built to transfer and transform the data between NEMS 21
GFS and GOCART. The physics-to-chemistry coupler performs several tasks including: (i) 22
the vertical flip for 3-dimensional fields, as GOCART is top-down while NEMS GFS is 23
bottom-up, (ii) unit conversion as different units are used in NEMS GFS and GOCART for 24
some fields such as precipitation rate, and (iii) the calculations for these fields needed by 25
GOCART such as inferring relative humidity and air density from ambient temperature and 26
moisture fields. After running GOCART, the chemistry-to-physics coupler transfers updated 27
3-dimensional aerosol fields and 2-dimensional aerosol diagnosis fields from GOCART to 28
NEMS GFS. 29
GOCART in GEOS-4/5 has been implemented in NEMS GFS `as is' except for emission 30
budget. As in GEOS-4/5 (Colarco et al., 2010), the spatial distribution and intensity of dust 31
sources in NGAC V1 follows from Ginoux et al. (2001). Owing to differences in the GEOS-32

8
4/5 meteorology and resolution relative to NEMS GFS, the global scaling constant for dust 1
emissions (see equation (2) in Ginoux et al. (2001)) has been adjusted from C = 0.375 µg s2 2
m-5 as in GEOS-4/5 to C = 1 µg s2 m-5 in NGAC. This adjustment is determined from 3
sensitivity experiments, allowing NGAC V1 to obtain dust emission budget comparable to 4
GEOS-4/5. Despite the ESMF flavor in how GOCART is implemented, GOCART is 5
incorporated into NEMS GFS as a column process similar to how ozone physics was 6
incorporated. It updates 3-dimensional aerosol loading after physical processes, ran at the 7
same grid as physics and dynamics, and is fully coupled with physics and dynamics at each 8
time step. 9
10
3 NGAC V1.0 operational implementation 11
A phased approach is used to manage the operational implementation of NGAC at NCEP. 12
The first phase is to produce dust-only guidance, the second phase is to produce the full suite 13
of aerosol forecasts (including dust, sea salt, sulfate, and carbonaceous aerosols), and the third 14
phase is to produce aerosol analysis using NGAC forecasts as first guess. Only the initial 15
deployment undertaken in 2012 is discussed in this paper. 16
Effective on 11 September 2012, starting with the 00:00 UTC cycle, NCEP has begun to run 17
and disseminate data from the NGAC V1.0 system at T126 L64 resolution. It provides 5 day 18
dust forecasts, once per day for the 00:00 UTC cycle. Information on accessing NGAC 19
model output is provided in the Appendix. Daily web-based presentation of NGAC V1.0 dust 20
forecasts is available at the EMC NGAC webpage: 21
http://www.emc.ncep.noaa.gov/gmb/NGAC/html/realtime.ngac.html. The website displays 22
aerosol optical depth (AOD) at 550 nm and surface mass concentrations over global domain 23
and several regional domains (e.g., trans-Atlantic region, Asia, and Continental US (CONUS) 24
regions). 25
Model configurations in NGAC V1.0 are same as those specified in operational high-26
resolution GFS runs with the following exceptions. First, NGAC uses Relaxed Arakawa-27
Schubert scheme (the RAS scheme, Moorthi and Suarez, 1992, 1999) while GFS uses 28
Simplified Arakawa-Schubert scheme (the SAS scheme, Han and Pan, 2011). Enhanced 29
tracer treatment (e.g., convective transport and tracer scavenging) has been incorporated into 30
the RAS scheme, providing critical capability needed for aerosol modeling. Second, NGAC 31

9
V1.0 is run at coarser spatial resolution (T126 L64, ~ 110 km) than GFS. In February 2015, 1
GFS was upgraded from Eulerian T574 (~ 27 km) to Semi-Lagrangian T1534 (~ 13 km). 2
NGAC V1.0, however, remains Eulerian T126 as of October 2015. Third, NGAC V1.0 3
produces history files and post-processed products concurrently while GFS produces post-4
processed products after history files being written out. 5
Dust initial conditions are taken from the 24 h NGAC V1.0 forecast from previous day while 6
meteorological initial conditions are down-scaled from high-resolution Global Data 7
Assimilation System (GDAS) analysis. Note the interaction of GOCART aerosol fields and 8
GFS's radiation package has been disabled in NGAC V1.0. This configuration that aerosols 9
are not radiatively coupled to AGCM is intended to facilitate aerosol modeling development 10
in the near term. Once the prognostic aerosol capability reaches desired maturity level, this 11
aerosol-radiation decoupled configuration will be changed allowing the aerosol direct and 12
semidirect radiative effects to be accounted for. 13
4 NGAC results 14
In this section, the results of operational NGAC V1.0 forecasts are presented. NCEP is 15
currently working toward the phase-two NGAC implementation (Lu et al., 2016). The NGAC 16
V2 includes full-suite of aerosols using near-real-time smoke emissions from satellite fire 17
products. The NGAC upgrade will produce total AOD, allowing us to evaluate NGAC results 18
beyond dust-dominated regions. Efforts are underway to evaluate experimental NGAC V2 19
with other models (ICAP MME and GSFC's GEOS-5), in-situ observations at AERONET 20
sites throughout the globe, and aerosol retrievals from multiple satellites, including MODIS, 21
Visible Infrared Imaging Radiometer Suite (VIIRS) and Cloud-Aerosol Lidar with 22
Orthogonal Polarization (CALIOP). In this paper, only concise model results are presented as 23
the paper mainly provides the programmatic aspects of NGAC development and 24
implementation. 25
4.1 Dust emissions and budget 26
Figure 4 shows the annual dust emissions calculated from the first year NGAC V1.0 27
production (the September 2012–September 2013 period). The similarity between the annual 28
dust emissions and the dust source function (shown in Fig. 2) indicates that the source 29
function is of central importance in determining dust uplifting relative to other parameters. In 30

10
the Ginoux et al. (2001) dust emission scheme, a global scaling factor (C, equal to 1 µg s2 m-1
5) is used to scale total dust flux to yield a total emission about 1800-2000 Tg yr-1. This factor 2
is adjusted to 0.375 µg s2 m-5 in GEOS-4/5 owing to differences in the GEOS-4 meteorology 3
relative to previous version of GEOS-DAS assimilated meteorology. As we adopted the on-4
line version of GOCART from GEOS-4/5 into NEMS GFS, the scaling factor is reverted back 5
to 1 µg s2 m-5 to account for the differences in AGCM and resolution (i.e., 0.25⁰ resolution for 6
GEOS-5 and ~ 1⁰ resolution for NEMS GFS). 7
Table 1 provides a summary of NGAC V1.0 calculated annual emission, burden, and lifetime 8
(or atmospheric residence time) relative to other similar global aerosol models, including 9
three versions of GOCART results and the models participating in the Aerosol Comparisons 10
between Observations and Models (AeroCom) model intercomparison studies 11
(http://aerocom.met.no/aerocomhome.html). The three GOCART results are from on-line 12
GEOS4-GOCART (Colarco et al., 2010) and off-line GOCART CTM driven by two versions 13
of GEOS DAS meteorological analyses (Chin et al., 2009; Ginoux et al., 2001). 14
Large difference (diversity) are found in emissions, burdens, and lifetimes within the 15
AeroCom models, which is primarily related to the differences in the emission 16
parameterizations, the particles sizes, the meteorological fields and model configuration used 17
in the individual models (Textor et al., 2006). The simulated total dust emissions, annual 18
burden, and lifetime in NGAC V1.0 are within the range of the AeroCom models. The annual 19
emissions are similar in NGAC V1.0 and on-line GEOS4-GOCART (1980 Tg yr-1 versus 20
1970 Tg yr-1). In NGAC V1.0, the lifetime is about one and a half days shorter than in on-line 21
GEOS4-GOCART (4.3 days versus 5.85 days) and the annual burden is about 30% lower 22
(21.9 Tg versus 31.6 Tg). The results suggest more efficient removal processes in NGAC 23
V1.0 than in GEOS4. 24
4.2 Aerosol optical depth 25
In this section we present the results of NGAC V1.0 dust distributions. We first compare 26
NGAC dust AOD to dust AOD from GEOS-5 and total AOD from MODIS onboard Terra. 27
Figure 5 shows monthly-mean dust distributions over the subtropical Atlantic region at 28
different seasons. The source regions over the Sahara and Sahel are clearly shown as well as 29
the patterns of long-range dust transport. Trade winds steer African dust westward across the 30
Atlantic ocean, covering vast areas of the North Atlantic and sometime reaching the Americas 31

11
(e.g., the Caribbean, southeastern United States, Central America, and Amazon basin). This 1
has implications for air quality, public health, climate, and biogeochemical cycle. For 2
instance, about half of the annual dust supply to the Amazon basin is emitted from a single 3
source in the Sahara, the Bodele depression (Koren et al., 2006). 4
While elevated dust off the western Africa coast is persistent through the seasons, the models 5
and satellite observations show a clear latitudinal shift of the dust plume over the tropical 6
Atlantic from winter to summer. This seasonal shift has been attributed to the movements of 7
the Inter Tropical Convergence Zone (ITCZ) which occupies its southernmost location in 8
winter and northernmost location in summer (Huser et al., 1997; Ginoux et al., 2001). The 9
results are consistent with the seasonal cycle discussed in Knippertz and Todd (2012) in 10
which detailed descriptions of meteorological processes controlling the emissions and 11
transport of African dust are provided. 12
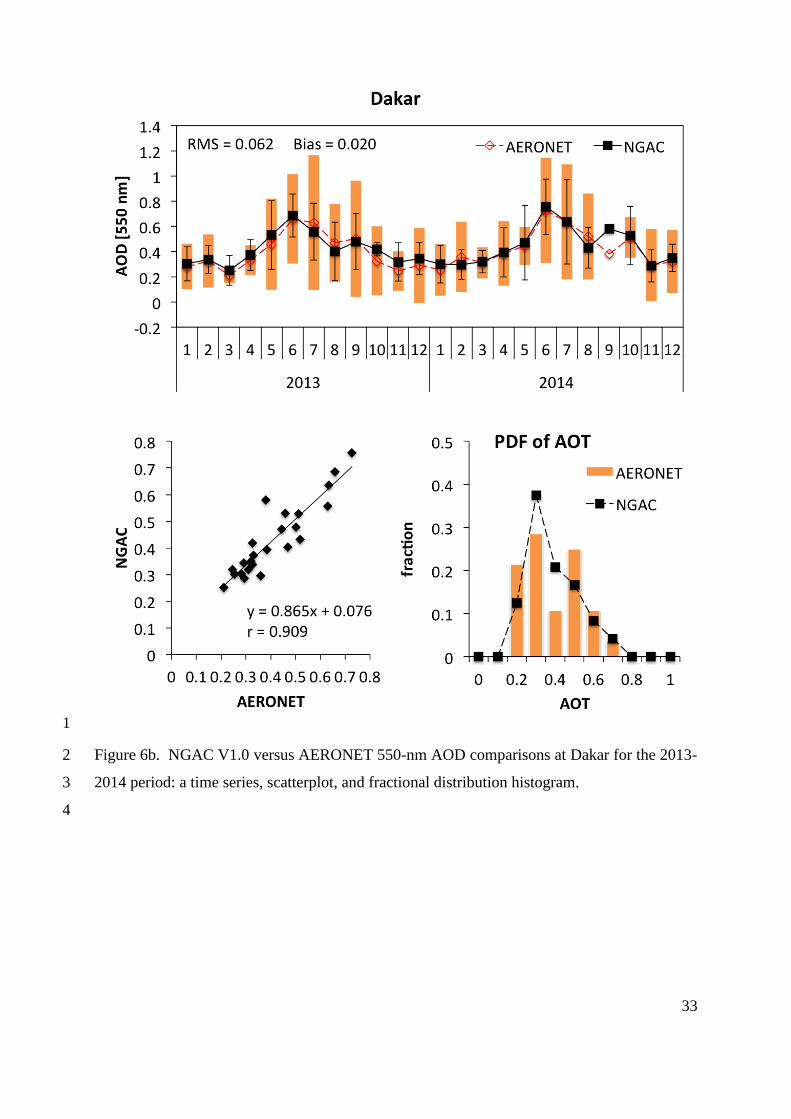
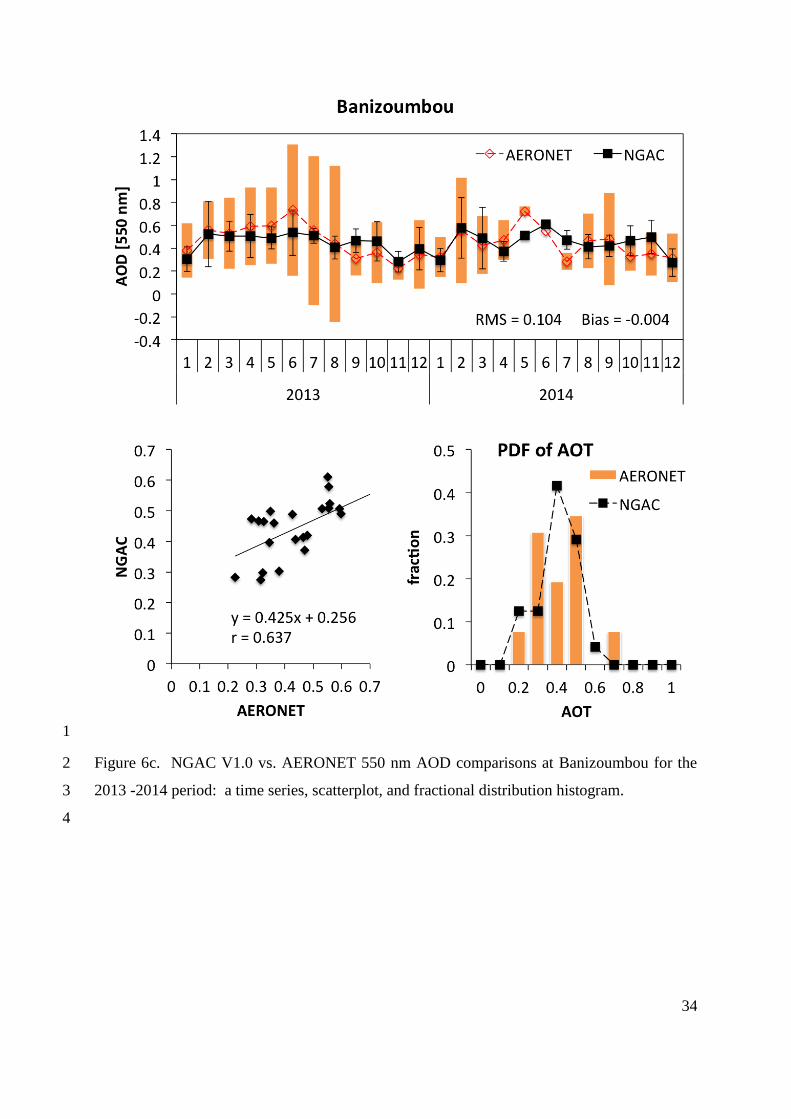
The comparison of model forecasts to L1.5 AErosol RObotic NETwork (AERONET) AOD at 13
550 nm for 2013-2014 period at six stations is shown in Fig. 6. AERONET AOD at 550 nm 14
is computed using logarithmic interpolation between AOD values at 440 nm and 675 nm. We 15
bin the AERONET observations within one-hour time window centered at NGAC synoptic 16
output times of 03:00, 06:00, 09:00, 12:00, 15:00, 18:00, 21:00, and 24:00 UTC. The 17
calculation of monthly mean requires a minimum of 5 days with valid values. We show the 18
comparison of the model AOD to AERONET observations, including the time series, a scatter 19
plot, a fractional distribution histogram (PDF) of the model and observed AOD, and some 20
statistics including mean biases, root-mean-square errors, linear fit parameters, and correlation 21
coefficients. Among the six stations included in the comparison, three sites are located in 22
dust-prone Sahara-Sahel region (Dakar, Ilorin, and Banizoumbou), one site is located in dust-23
prone Middle East area (Sede Boker), and two sites are located in tropical Atlantic Ocean 24
region (Cape Verde and La Parguera). The Dakar site is located in Senegal, North Africa near 25
the dust source region. The Ilorin site, located in Guinea Savanna zone, experiences dust and 26
episodic smoke aerosols. The Banizoumhou site, located in the Sahel region, is influenced 27
predominantly by dust transport from the Sahara. For the two ocean sites, Cape Verde is 28
influenced by dust outflow from Saharan sources while La Parguera is influenced by long-29
range transport of Saharan dust. The Middle East site, Sede Boker, is located in the Negev 30
desert of Israel and experiences mainly dust and urban aerosols. At these sites except for 31
Ilorin, NGAC V1.0 simulations are found to capture the seasonal variability in the dust 32

12
loading. Overall, NGAC V1.0 shows similar seasonal variability to and is well correlated 1
with the AERONET observations. 2
3
5 NGAC applications 4
NGAC V1.0 provides 2- and 3-dimensional aerosol products at 1⁰x1⁰ resolution on a global 5
scale. Potential usage for these aerosol products includes, but is not limited to: AOD at 340 6
nm for UV index forecasts; AOD at 550 nm for multi-model ensemble and aerosol data 7
assimilation; AOD at 860 nm for AVHRR SST retrievals; AOD at 11.1 µm for the 8
Atmospheric Infrared Sounder (AIRS) temperature retrievals; three dimensional dust mixing 9
ratios for atmospheric correction; dust column mass density, emission and removal fluxes for 10
aerosol budget study; dust deposition fluxes for ocean productivity and dust surface mass 11
concentrations for air quality. Here we present two examples of NGAC product applications. 12
5.1 Multi-model ensemble 13
The International Cooperative for Aerosol Prediction (ICAP), consisting of forecasting center 14
model developers and remote sensing data providers, began meeting in April 2010 to discuss 15
issues relevant to the operational aerosol forecasting (Benedetti, 2011; Reid et al., 2011). 16
ICAP members created a developmental global multiple-model ensemble (MME) to explore 17
probabilistic aerosol prediction and assess relative differences among models (Sessions et al., 18
2015). Consensus ICAP forecasting began in early 2011 and the experimental ICAP-MME 19
became quasi-operational for public release in 2015. Current ICAP MME products include 20
total AOD ensemble from four complete aerosol forecast models from NRL, ECMWF, JMA, 21
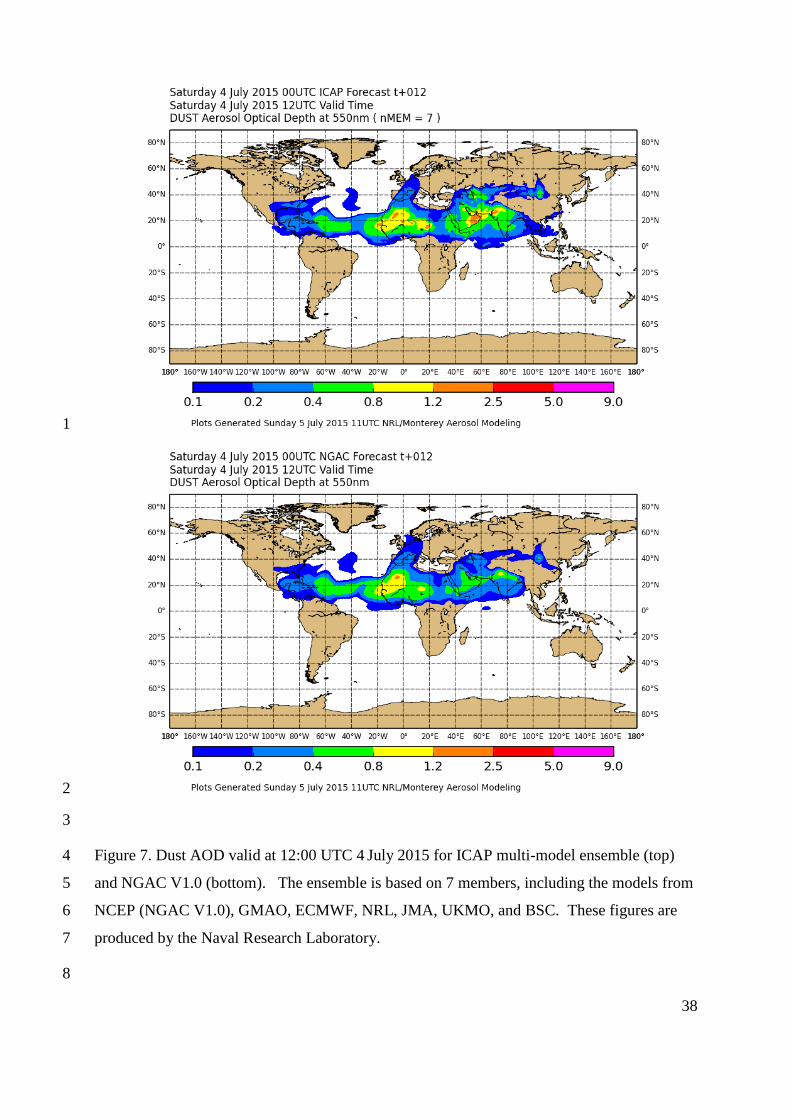
and GMAO and three dust-only models from NCEP, UKMO, and BSC. Figure 7 shows the 22
dust AOD from ICAP-MME (with 7 members) and NGAC V1.0, valid at 12:00 UTC 4 July 23
2015. Spatial pattern of dust loading from NGAC V1.0 is consistent with the ICAP-MME, 24
with elevated dust AOD located in the Sahara, the Arabian Peninsula, and Asia as well as 25
evident long range trans-Atlantic transport of Saharan dust reaching southeastern United 26
States. 27
Dust forecasts from NGAC V1.0 also contributes to the regional multi-model ensemble 28
produced by WMO Sand and Dust Storm Warning Advisory and Assessment System (SDS-29
WAS) Regional Center for Northern Africa, Middle East, and Europe, hosted at BSC, Spain 30
(http://sds-was.aemet.es). Participation in ICAP-MME and WMO SDS-WAS multi-model 31

13
ensemble provides a continuous and independent assessment of the quality of NCEP global 1
dust products. Overall, NGAC V1.0 forecasts are found to be comparable to that produced by 2
other domestic and international modeling centers. 3
5.2 Dynamic lateral boundary conditions for regional models 4
An example on using NGAC dust information to improve regional air quality forecasts is 5
presented here. Under a NOAA-EPA partnership, NOAA is undertaking the responsibility to 6
develop and maintain the National Air Quality Forecasting (AQF) system (Davidson et al. 7
2004). The AQF system is based on EPA Community Multi-scale Air Quality (CMAQ) 8
model (Byun and Schere, 2006) driven by meteorological forecasts from NCEP North 9
American Meso (NAM) Model (see the NAM webpage at 10
http://www.emc.ncep.noaa.gov/?branch=NAM). Static lateral boundary conditions (LBCs) 11
assuming no dust from outside the model boundary are currently used. 12
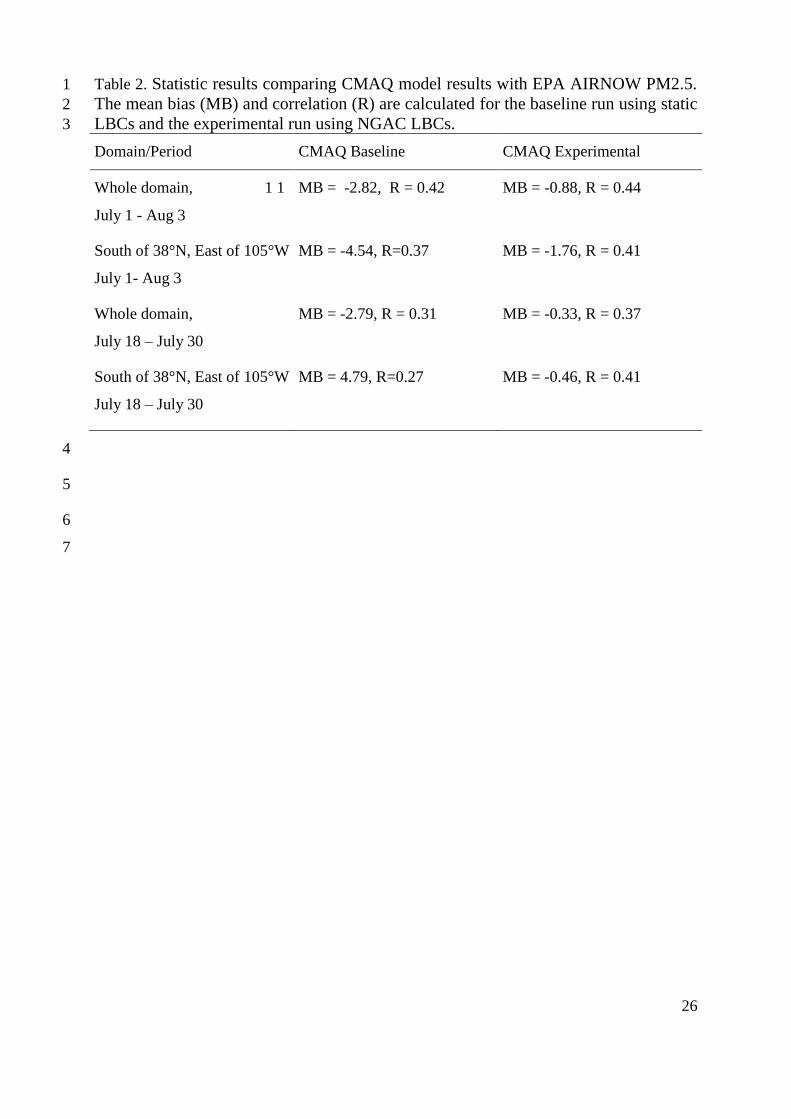
Two CMAQ runs are conducted for the July 2010 period. The baseline run uses static LBCs 13
and the experimental run uses dynamic LBCs from NGAC V1.0. Figure 8 shows the 14
observed and modeled surface Particulate Matter smaller than 2.5 micron (PM2.5) at two 15
AIRNOW stations in the southeast region. Table 2 presents the statistic results of the CMAQ 16
compared to the EPA AIRNOW PM2.5. It is found that the incorporation of dynamic LBCs 17
from NGAC V1.0 reduces model biases and improves correlation. Clearly, the inclusion of 18
long-range dust transport through dynamic LBCs leads to significant improvements in CMAQ 19
forecasts during dust intrusion episodes. 20
21
6 Conclusions 22
NASA/GMAO’s GOCART aerosol module has been implemented into NEMS GFS at NCEP 23
through NOAA/NCEP-NASA/GSFC collaborations. While NGAC has the capability to 24
forecast dust, sulfate, sea salt, and carbonaceous aerosols, the initial phase-one 25
implementation is to establish dust-only numerical guidance. NGAC Version 1.0, 26
implemented in September 2012, provides the first operational global dust forecasting 27
capability at NOAA. Its AOD product has been incorporated into global and regional multi-28
model ensemble products (ICAP and WMO SDS-WAS, respectively) in quasi-operational 29
mode. 30
14
The NGAC V1.0 dust forecasts are routinely verified using AOD observations from space-1
borne MODIS and ground-based AERONET. NGAC V1.0 results are also compared with 2
those from other similar aerosol models. It is shown that the NGAC V1.0 simulated spatial 3
distributions and seasonal variations are consistent with the observations. In addition, the 4
emissions, burdens, and lifetime of dust aerosols in NGAC V1.0 are within the range of 5
similar aerosol models. 6
While the initial NGAC implementation is limited in its scope (a dust-only system without 7
aerosol data assimilation), it laid the ground work for various aerosol-related applications. 8
Future operational benefits associated with the global aerosol forecasting system at NOAA 9
includes: 10
– Enable operational global short-range multi-species aerosol prediction. 11
– Provide the first step toward an operational aerosol data assimilation capability at 12
NCEP. 13
– Allow aerosol impacts on medium range weather forecasts to be considered. 14
– Provide global aerosol information for various applications, including satellite 15
radiance data assimilation, satellite retrievals, SST analysis, and UV-Index forecasts. 16
– Allow NCEP to explore aerosol-cloud-climate interaction in the Climate Forecast 17
System (CFS), as GFS is the atmosphere model of the CFS. 18
– Provide lateral aerosol boundary conditions for regional aerosol forecast system. 19
20
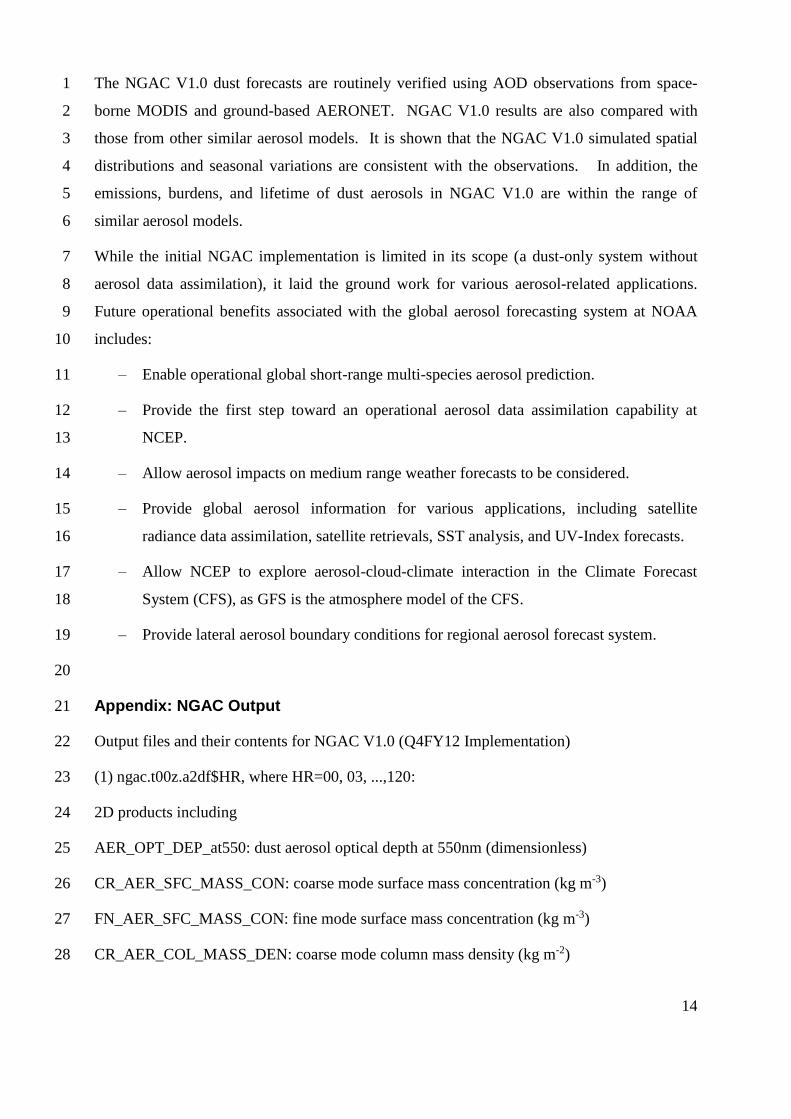
Appendix: NGAC Output 21
Output files and their contents for NGAC V1.0 (Q4FY12 Implementation) 22
(1) ngac.t00z.a2df$HR, where HR=00, 03, ...,120: 23
2D products including 24
AER_OPT_DEP_at550: dust aerosol optical depth at 550nm (dimensionless) 25
CR_AER_SFC_MASS_CON: coarse mode surface mass concentration (kg m-3) 26
FN_AER_SFC_MASS_CON: fine mode surface mass concentration (kg m-3) 27
CR_AER_COL_MASS_DEN: coarse mode column mass density (kg m-2) 28

15
FN_AER_COL_MASS_DEN: fine mode column mass density (kg m-2) 1
DUST_EMISSION_FLUX: dust emission fluxes (kg m-2 sec-1) 2
DUST_SEDIMENTATION_FLUX: dust sedimentation fluxes (kg m-2 sec-1) 3
DUST_DRY_DEPOSITION_FLUX: dust dry deposition fluxes (kg m-2 sec-1) 4
DUST_WET_DEPOSITION_FLUX: dust wet deposition fluxes (kg m-2 sec-1) 5
6
(2) ngac.t00z.a3df$HR, where HR=00, 03, ..., 120: 7
3D products at model levels including 8
PRES: pressure (Pa) 9
RH: relative humidity (%) 10
TEMP: temperature (K) 11
DUST1: dust bin1 (0.1-1 micron) mixing ratio (kg kg-1) 12
DUST2: dust bin2 (1-1.8 micron) mixing ratio (kg kg-1) 13
DUST3: dust bin3 (1.8-3 micron) mixing ratio (kg kg-1) 14
DUST4: dust bin4 (3-6 micron) mixing ratio (kg kg-1) 15
DUST5: dust bin5 (6-10 micron) mixing ratio (kg kg-1) 16
17
(3) ngac.t00z.aod_$NM, where NM=11p1um, 1p63um, 340nm, 440nm, 550nm, 660nm, 18
860nm: 19
Aerosol optical depth (dimensionless) at specified wavelengths (11.1, 1.63, 0.34, 0.44, 0.55, 20
0.66, and 0.86 micron) 21
Data and code availability 22
Products from the NCEP operational production suite are distributed and accessible to general 23
users, free of charge, in real-time (typically no later than 3 hours after the data are created) at 24
NOAA Operational Model Archive and Distribution System (NOMADS). Source code as 25
well as relevant run scripts, parameters, and fixed field files can be obtained from NCEP 26
Central Operations (NCO) ftp site at the following location: 27

16
http://www.nco.ncep.noaa.gov/pmb/codes/nwprod/ngac.v1.0.0 1
The NGAC V1.0 output is available in GRIdded Binary Version 2 (GRIB2) format on 1⁰x1⁰ 2
degree grid, with 3 hourly output out to 120 h. Users can access the NGAC V1.0 digital 3
products from NOMADS at the following location: 4
http://nomads.ncep.noaa.gov/pub/data/nccf/com/ngac 5
NGAC V1.0 output instantaneous values of 3-dimensional dust mixing ratios for five particle 6
sizes with effective radius at 1, 1.8, 3, 6, and 10 micron. The model also output time-7
averaged 2-dimensional diagnostics fields relevant to aerosol budget, such as emission fluxes. 8
These aerosol fields are written out at GFS native Gaussian grid, and post-processed to 9
GRIB2 format and regular 1⁰x1⁰ degree grid. Dust AOD at 550 nm and other selected 10
spectral is calculated from instantaneous dust distributions with aerosol optical properties 11
based on Chin et al. (2002). NGAC V1.0 GRIB2 output files and their contents are listed in 12
the Appendix. 13
14
Acknowledgements 15
The NGAC project has been supported by NASA Applied Science Program and NOAA-16
NASA-DOD Joint Center for Satellite Data Assimilation. The authors thank the principal 17
investigators of the AERONET sites (Didier Tanre for Cape Verde, Dakar, and Banizoumbou, 18
Rachel Pinker for Ilorin, Brent Holben for La Parguera, and Arnon Karnieli for Sede Boker) 19
for the efforts in establishing and maintaining AERONET sites. Brent Holben leads the 20
AERONET program and provided access to near-real-time L1.5 data set. The authors also 21
appreciate the multi-model ensemble work done by the NRL (for ICAP) and BSC (for WMO 22
SDS-WAS NA-ME-E Regional Center). The lead author C.-H. Lu is grateful for technical 23
help and/or scientific input from her NCEP EMC colleagues, Wei-Yu Yang, Perry Shafran, 24
Ho-Chun Huang, and Yuqiu Zhu. She also thanks her NCEP NCO colleagues for 25
transitioning pre-operational NGAC V1.0 system into NCEP production, including Simon 26
Hsiao, Xiaoxue Wang, Christine Caruso Magee, Jeff Ator, Boi Vuong, Rebecca Cosgrove and 27
Daniel Starosta. The pre-implementation evaluation by Walter Sessions, Nick Nalli, Andy 28
Harris, Craig Long, Gary Votaw, and Jeral Estupinan is also greatly appreciated. 29
30
31

17
References 1
Albrecht, B. A.: Aerosols, cloud microphysics and fractional cloudiness, Science, 245, 1227–2
1230, 1989. 3
Andreae, M. O. and Crutzen, P. J.: Atmospheric Aerosols: biogeochemical sources and role in 4
atmospheric chemistry, Science, 276, 1052–1054, 1997. 5
Basart, S., Pérez, C., Nickovic, S., Cuevas, E., and Baldasano, J. M.: Development and 6
evaluation of the BSC-DREAM8b dust regional model over Northern Africa, the 7
Mediterranean and the Middle East, Tellus B, 64, 18539, doi:10.3402/tellusb.v64i0.18539, 8
2012. 9
Benedetti, A., Morcrette, J.-J., Boucher, O., Dethof, A., Engelen, R. J., Fisher, M., Flentjes, 10
H., Huneeus, N., Jones, L., Kaiser, J. W., Kinne, S., Mangold, A., Razinger, M., Simmons, A. 11
J., Suttie, M., and the GEMS-AER team: Aerosol analysis and forecast in the European 12
Centre for Medium-Range Weather Forecasts Integrated Forecast System: 2. Data 13
assimilation, J. Geophys. Res., 114, D13205, doi:10.1029/2008JD011115, 2009. 14
Benedetti, A., Reid, J. S., and Colarco, P. R.: International Cooperative for Aerosol Prediction 15
(ICAP) Workshop On Aerosol Forecast Verification, B. Am. Meteorol. Soc., 92, ES48–ES53, 16
doi:10.1175/BAMS-D-11-00105.1, 2011. 17
Benedetti, A., Baldasano, J. M., Basart, S., Benincasa, F., Boucher, O., Brooks, M., Chen, J.-18
P., Colarco, P. R., Gong, S., Huneeus, N., Jones, L. T., Lu, S., Menut, L., Morcrette, J.-J., 19
Mulcahy, J., Nickovic, S., Perez Garcia-Pando, C., Reid, J. S., Sekiyama, T. T., Tanaka, T. 20
Y., Terradellas, E., Westphal, D. L., Zhang, X.-Y., and Zhou, C.-H.: Operational dust 21
forecasting, Chapter 10 in: Mineral Dust: a Key Player in the Earth System, edited by: 22
Knippertz, P. and Stuut, J.-B., Springer Publications, Dodrecht, the Netherlands, ISBN 978-23
94-017-8977-6, 121–148, doi:10.1007/978-94-017-8978-3_10, 2014. 24
Bian, H., Chin, M., Kawa, S. R., Yu, H., and Diehl, T.: Multi-scale carbon monoxide and 25
aerosol correlations from MOPITT and MODIS satellite measurements and GOCART model: 26
implication for their emissions and atmospheric evolutions, J. Geophys. Res., 115, D07302, 27
doi:10.1029/2009JD012781, 2010. 28
Black, T., Juang, H. M. H., Yang, W. Y., and Iredell, M.: An ESMF framework for NCEP 29
operational models, in: 22nd Conference on Weather Analysis and Forecasting/18th 30

18
Conference on Numerical Weather Prediction, Park City, UT, USA, 25–29 June 2007, Ameri. 1
Met. Soc., J3.1, 2007. 2
Black, T., Juang, H. M. H., and Iredell, M.: The NOAA Environmental Modeling System at 3
NCEP, Preprints, 23rd Conference on Weather Analysis and Forecasting/19th Conference on 4
Numerical Weather Prediction, Omaga, NE, USA, 1–5 June 2009, Ameri. Met. Soc., 2 A.6, 5
2009. 6
Byun, D. W. and Schere, K. L.: Review of the governing equations, computational 7
algorithms, and other components of the Models-3 Community Multiscale Air Quality 8
(CMAQ) modeling system, Appl. Mech. Rev., 59, 51-77, 2006. 9
Chen, Y., Mills, S., Street, J., Golan, D., Post, A., Jacobson, M., and Paytan, A.: Estimates of 10
atmospheric dry deposition and associated input of nutrients to Gulf of Aqaba seawater, J. 11
Geophys. Res., 112, D04309, doi:10.1029/2006JD007858, 2007. 12
Chin, M., Savoie, D. L., Huebert, B. J., Bandy, A. R., Thornton, D. C., Bates, T. S., Quinn, P. 13
K., Saltzman, E. S., and De Bruyn,W. J.: Atmospheric sulfur cycle in the global model 14
GOCART: comparison with field observations and regional budgets, J. Geophys. Res., 105, 15
24689– 24712, 2000. 16
Chin, M., Ginoux, P., Kinne, S., Torres, O., Holben, B. N., Duncan, B. N., Martin, R. V., 17
Logan, J. A., Higurashi, A., and Nakajima, T.: Tropospheric aerosol optical thickness from 18
the GOCART model and comparisons with satellite and sunphotometer measurements, J. 19
Atmos. Sci., 59, 461–483, 2002. 20
Chin, M., Ginoux, P., Lucchesi, R., Huebert, B., Weber, R., Anderson, T., Masonis, S., 21
Blomquist, B., Bandy, A., and Thornton, D.: A global aerosol model forecast for the 22
ACEAsia field experiment, J. Geophys. Res., 108, 8654, doi:10.1029/2003JD003642, 2003. 23
Chin, M., Chu, D. A., Levy, R., Remer, L. A., Kaufman, Y. J., Holben, B. N., Eck, T., and 24
Ginoux, P.: Aerosol distribution in the Northern Hemisphere during ACE-Asia: results from 25
global model, satellite observations, and sunphotometer measurements, J. Geophys. Res., 109, 26
D23S90, doi:10.1029/2004JD004829, 2004. 27
Chin, M., Diehl, T., Ginoux, P., and Malm, W.: Intercontinental transport of pollution and 28
dust aerosols: implications for regional air quality, Atmos. Chem. Phys., 7, 5501–5517, 29
doi:10.5194/acp-7-5501-2007, 2007. 30

19
Chin, M., Diehl, T., Dubovik, O., Eck, T. F., Holben, B. N., Sinyuk, A., and Streets, D. G.: 1
Light absorption by pollution, dust, and biomass burning aerosols: a global model study and 2
evaluation with AERONET measurements, Ann. Geophys., 27, 3439–3464, 3
doi:10.5194/angeo-27-3439-2009, 2009. 4
Colarco, P., Schoeberl, M., Doddridge, B., Marufu, L., Torres, O., and Welton. E.: Transport 5
of smoke from Canadian forest fires to the surface near Washington DC, J. Geophys. Res., 6
109, D06203, doi:10.1029/2003JD004248, 2004. 7
Colarco, P., da Silva, A., Chin, M., and Diehl, T.: Online simulations of global aerosol 8
distributions in the NASA GEOS-4 model and comparisons to satellite and ground-based 9
aerosol optical depth, J. Geophys. Res., 115, D14207, doi:10.1029/2009JD012820, 2010. 10
Darmenov, A. and da Silva, A. M.: The Quick Fire Emissions Dataset (QFED) – 11
Documentation of versions 2.1, 2.2 and 2.4, NASA Technical Report Series on Global 12
Modeling and Data Assimilation, NASA/TM-2015–104606, Vol. 38, 211 pp., available at: 13
http://gmao.gsfc.nasa.gov/pubs/tm/, last access: 18 December 2015. 14
Davidson, P. M., Seaman, N., Schere, K.,Wayland, R. A., Hayes, J. L., and Carey, K. F.: 15
National air quality forecasting capability: first steps toward implementation, in: Proceedings 16
of Sixth Conf. on Atmos. Chem., Ameri. Met. Soc., Seattle, WA, USA, 10–16 January 2004, 17
J2.10, 2004. 18
DeFries, R. S., and Townshend, J. R. G.: NDVI-derived land cover classification at global 19
scale, Int. J. Remote Sensing, 15, 3567-3586, 1994. 20
Dickerson, R. R., Kondragunta, S., Stenchikov, G., Civerolo, K. L., Doddrige, B. G., and 21
Holben, B. N.: The impact of aerosols on solar ultraviolet radiation and photochemical smog, 22
Science, 278, 827–830, 1997. 23
Duce, R. A.: The atmospheric input of trace species to the world ocean, Global Biogeochem. 24
Cy., 5, 193–259, 1991. 25
Fan, J., Rosenfeld, D., Yang, Y., Zhao, C., Leung, L. R., and Li, Z.: Substantial contribution 26
of anthropogenic air pollution to catastrophic floods in Southwest China, Geophys. Res. Lett., 27
42, 6066–6075, doi:10.1002/2015GL064479, 2015. 28

20
Ginoux, P., Chin, M., Tegen, I., Prospero, J., Holben, B., Dubovik, O., and Lin, S.-J.: Sources 1
and global distributions of dust aerosols simulated with the GOCART model, J. Geophys. 2
Res., 106, 20255–20273, 2001. 3
Ginoux, P., Prospero, J., Torres, O., and Chin, M.: Long-term simulation of dust distribution 4
with the GOCART model: correlation with the North Atlantic Oscillation, Environ. Modell. 5
Softw., 19, 113–128, 2004. 6
Han, J. and Pan, H.-L.: Revision of convection and vertical diffusion schemes in the NCEP 7
global forecast system, Weather Forecast., 26, 520–533, 2011. 8
Haywood, J. M., Allan, R. P., Culverwell, I., Slingo, T., Milton, S., Edwards, J., and 9
Clerbaux, N.: Can desert dust explain the outgoing longwave radiation anomaly over the 10
Sahara during July 2003?, J. Geophys. Res., 110, D05105, doi:10.1029/2004JD005232, 2005. 11
Herbener, S. R., van den Heever, S. C., Carrió, G. G., Saleeby, S. M., William, R., and 12
Cotton, W. R.: Aerosol indirect effects on idealized tropical cyclone dynamics. J. Atmos. Sci., 13
71, 2040–2055, doi:10.1175/JAS-D-13-0202.1. 2014. 14
Hess, M., Koepke, P., and Schult, I.: Optical properties of aerosols and clouds: the software 15
package OPAC, B. Am. Meteorol. Soc., 79, 831–844, 1998. 16
Huneeus, N., Schulz, M., Balkanski, Y., Griesfeller, J., Prospero, J., Kinne, S., Bauer, S., 17
Boucher, O., Chin, M., Dentener, F., Diehl, T., Easter, R., Fillmore, D., Ghan, S., Ginoux, P., 18
Grini, A., Horowitz, L., Koch, D., Krol, M. C., Landing, W., Liu, X., Mahowald, N., Miller, 19
R., Morcrette, J.-J., Myhre, G., Penner, J., Perlwitz, J., Stier, P., Takemura, T., and Zender, C. 20
S.: Global dust model intercomparison in AeroCom phase I, Atmos. Chem. Phys., 11, 7781–21
7816, doi:10.5194/acp-11-7781-2011, 2011. 22
Husar, R., B., Prospero, J. M., and Stowe, L. L.: Characterization of tropospheric aerosols 23
over the oceans with the NOAA advanced very high resolution radiometer optical thickness 24
operational products, J. Geophys. Res., 102, 16889–16909, 1997. 25
Jaffe, D., McKendry, I., Anderson, T., and Price, H.: Six “new” episodes of trans-Pacific 26
transport of air pollutants, Atmos. Environ., 37, 391–404, 2003. 27
Jones, D., Robarts, D. L., and Slingo, A.: A climate model study of indirect radiative forcing 28
by anthropogenic sulphate aerosols, Nature, 370, 450–453, 1994. 29
21
Kim, D., Chin, M., Bian, H., Tan, Q., Brown, M. E., Zheng, T., You, R., Diehl, T., Ginoux, 1
P., and Kucsera, T.: The effect of the dynamic surface bareness to dust source function, 2
emission, and distribution, J. Geophys. Res., 118, 1–16, doi:10.1029/2012JD017907, 2013. 3
Knippertz, P. and Todd, M. C.: Mineral dust aerosols over the Sahara: meteorological controls 4
on emission and transport and implications for modeling, Rev. Geophys., 50, RG1007, 5
doi:10.1029/2011RG000362, 2012. 6
Koren, I., Kaufman, Y. J., Washington, R., Todd, M. C., Rudich, Y., Vanderlei Martins, J., 7
and Resenfeld, D.: The Bodele depressions: a single spot in the Sahara that provides most of 8
the mineral dust to the Amazon forecast, Environ. Res. Lett., 1, 014005, doi:10.1088/1748-9
9326/1/1/014005, 2006. 10
Lohmann, U., Feichter, J., Penner, J., and Leaitch, R.: Indirect effect of sulfate and 11
carbonacerous aerosols: a mechanistic treatment, J. Geophys. Res., 105, 12193–12206, 2000. 12
Lu, S., Huang, H.-C., Hou, Y.-T., Tang, Y., McQueen, J., da Silva, A., Chin, M., Joseph, E., 13
and Stockwell, W.: Development of NCEP Global Aerosol Forecasting System: an overview 14
and its application for improving weather and air quality forecasts, in: NATO Science for 15
Peace and Security Series: Air Pollution Modelling and Its Application XX, Springer 16
Publications, Dordrecht, the Netherlands, ISBN 978-90-481-3810-4, 451–454, 17
doi:10.1007/978-90-481-3812-8, 2010. 18
Lu, S., da Silva, A., Chin, M., Wang, J., Moorthi, S., Juang, H., Chuang, H.-Y., Tang, Y., 19
Jones, L., Iredell, M., and McQueen, J.: The NEMS GFS Aerosol Component: NCEP’s 20
Global Aerosol Forecast System, NCEP Office Note 472, Washington DC, USA, 26 pp., 21
available at: http://www.lib.ncep.noaa.gov/ncepo_cenotes/2010s/ (last access: 18 December 22
2015), 2013. 23
Lu, S., Wang, J., Bhattacharjee, P., Zhang, X., Kondragunta, S., da Silva, A., McQueen, J., 24
Moorthi, S., Hou, Y., and Tallapragada, V.: The implementation of NEMS GFS Aerosol 25
Component (NGAC) version 2: Global aerosol forecasting at NCEP using satellite-based 26
smoke emissions, 5-8, Joint Center for Satellite Data Assimilation Quarterly, 53, available at: 27
http://www.jcsda.noaa.gov/news.php (last access: 24 April 2016), doi;10.7289/V50C4SS7, 28
2016. 29
Mitchell Jr., J.: The effect of atmospheric aerosols on climate with special references to 30
temperature near the earth’s surface, J. Appl. Meteorol., 10, 703–714, 1971. 31

22
Moorthi, S. and Suarez, M. J.: Relaxed Arakawa–Schubert: a parameterization of moist 1
convection for general circulation models, Mon. Weather Rev., 120, 978–1002, 1992. 2
Moorthi, S. and Suarez, M. J.: Documentation of Version 2 of Relaxed Arakawa–Schubert 3
Cumulus Parameterization With Moist Downdrafts, NOAA Technical report NWS/NCEP 99-4
01, NOAA/NCEP, College Park, MD, USA, 44 pp., 1999. 5
Morcrette, J.-J., Boucher, O., Jones, L., Salmond, D., Bechtold, P., Beljaars, A., Benedetti, A., 6
Bonet, A., Kaiser, J. W., Razinger, M., Schulz, M., Serrar, S., Simmons, A. J., Sofiev, M., 7
Suttie, M., Tompkins, A. M., and Untch, A.: Aerosol analysis and forecast in the European 8
Centre for Medium-Range Weather Forecasts Integrated Forecast System: forward modeling, 9
J. Geophys. Res., 114, D06206, doi:10.1029/2008JD011235, 2009. 10
Mulcahy, J. P., Walters, D. N., Bellouin, N., and Milton, S. F.: Impacts of increasing the 11
aerosol complexity in the Met Office global numerical weather prediction model, Atmos. 12
Chem. Phys., 14, 4749–4778, doi:10.5194/acp-14-4749-2014, 2014. 13
Pérez, C., Nickovic, S., Pejanovic, G., Baldasano, J. M., and Ozsoy, E.: Interactive dust 14
radiation modeling: a step to improve weather forecasts, J. Geophys. Res., 11, D16206, 15
doi:10.1029/2005JD006717, 2006. 16
Pérez, C., Haustein, K., Janjic, Z., Jorba, O., Huneeus, N., Baldasano, J. M., Black, T., Basart, 17
S., Nickovic, S., Miller, R. L., Perlwitz, J. P., Schulz, M., and Thomson, M.: Atmospheric 18
dust modeling from meso to global scales with the online NMMB/BSC-Dust model– Part 1: 19
Model description, annual simulations and evaluation, Atmos. Chem. Phys., 11,13001–13027, 20
doi:10.5194/acp-11-13001-2011, 2011. 21
Pöschl, U.: Atmospheric aerosols: composition, transformation, climate, and health effects, 22
Angew. Chem. Int. Edit., 44, 7520–7540, doi:10.1002/anie.200501122, 2005. 23
Prospero, J.: Long-term measurements of the transport of African mineral dust to the 24
southeastern United States: implications for regional air quality, J. Geophys. Res., 104, 25
15917–15927, 1999. 26
Prospero, J. M., Barrett, K., Church, T., Dentener, F., Duce, R. A., Galloway, J. N., Levy II, 27
H., Moody, J., and Quinn, P.: Atmospheric deposition of nutrients to the North Atlantic basin, 28
Biogeochemistry, 35, 27–73, 1996. 29

23
Ramanathan, V., Crutzen, P. J., Kiehl, J. T., and Rosenfeld, D.: Aerosol, climate, and the 1
hydrological cycle, Science, 294, 2119–2124, 2001. 2
Reid, J. S., Benedetti, A., Colarco, P. R., and Hansen, J. A.: International Operational Aerosol 3
Observability Workshop, B. Am. Meteorol. Soc., 92, ES21–ES24, 4
doi:10.1175/2010BAMS3183.1, 2011. 5
Rodwell, M. J. and Jung, T.: Understanding the local and global impacts of model physics 6
changes: an aerosol example, Q. J. Roy. Meteor. Soc., 134, 1479–1497, doi:10.1002/qj.298, 7
2008. 8
Rosenfeld, D., Woodley, W. L., Khain, A., Cotton, W. R., Carrió, G., Ginis, I., and Golden, J. 9
H.: Aerosol effects on microstructure and intensity of tropical cyclones, B. Am. Meteorol. 10
Soc., 93, 987–1001, 2012. 11
Saide, P. E., Spak, S. N., Pierce, R. B., Otkin, J. A., Schaack, T. K., Heidinger, A. K., da 12
Silva, A. M., Kacenelenbogen, M., Redemann, J., and Carmichael, G. R.: Central American 13
biomass burning smoke can increase tornado severity in the U.S., Geophys. Res. Lett., 42, 14
956–965, doi:10.1002/2014GL062826, 2015. 15
Sessions, W. R., Reid, J. S., Benedetti, A., Colarco, P. R., da Silva, A., Lu, S., Sekiyama, T., 16
Tanaka, T. Y., Baldasano, J. M., Basart, S., Brooks, M. E., Eck, T. F., Iredell, M., Hansen, J. 17
A., Jorba, O. C., Juang, H.-M. H., Lynch, P., Morcrette, J.-J., Moorthi, S., Mulcahy, J., 18
Pradhan, Y., Razinger, M., Sampson, C. B., Wang, J., and Westphal, D. L.: Development 19
towards a global operational aerosol consensus: basic climatological characteristics of the 20
International Cooperative for Aerosol Prediction Multi-Model Ensemble (ICAP-MME), 21
Atmos. Chem. Phys., 15, 335–362, doi:10.5194/acp-15-335-2015, 2015. 22
Tanaka, T. Y., Orito, K., Sekiyama, T. T., Shibata, K., Chiba, M., and Tanaka, H.: 23
MASINGAR, a global tropospheric aerosol chemical transport model coupled with 24
MRI/JMA98 GCM: model description, Pap. Meteorol. Geophys., 53, 119–138, 2003. 25
Textor, C., Schulz, M., Guibert, S., Kinne, S., Balkanski, Y., Bauer, S., Berntsen, T., Berglen, 26
T., Boucher, O., Chin, M., Dentener, F., Diehl, T., Easter, R., Feichter, H., Fillmore, D., 27
Ghan, S., Ginoux, P., Gong, S., Grini, A., Hendricks, J., Horowitz, L., Huang, P., Isaksen, I., 28
Iversen, I., Kloster, S., Koch, D., Kirkevåg, A., Kristjansson, J. E., Krol, M., Lauer, A., 29
Lamarque, J. F., Liu, X., Montanaro, V., Myhre, G., Penner, J., Pitari, G., Reddy, S., Seland, 30
Ø., Stier, P., Takemura, T., and Tie, X.: Analysis and quantification of the diversities of 31

24
aerosol life cycles within AeroCom, Atmos. Chem. Phys., 6, 1777–1813, doi:10.5194/acp-6-1
1777-2006, 2006. 2
Tompkins, A. M., Cardinali, C., Morcrette, J. J., and Rodwell, M.: Influence of aerosol 3
climatology on forecasts of the African Easterly Jet, Geophys. Res. Lett., 32, L10801, 4
doi:10.1029/2004GL022189, 2005. 5
Twomey, S.: Pollution and the planetary albedo, Atmos. Environ., 8, 1251–1256, 1974. 6
Wang, J., van den Heever, S. C., and Reid, J. S: Central American biomass burning aerosols 7
and severe weather over the south central United States, Environ. Res. Lett., 4, 015003, 8
doi:10.1088/1748-9326/4/1/015003, 2009. 9
Wang, Y., Wang, M., Zhang, R., Ghan, S., Lin, Y., Hu, J., Pan, B., Levy, M., Jiang, J., and 10
Molina, M.: Assessing the effects of anthropogenic aerosols on Pacific storm track using a 11
multiscale global climate model, P. Natl. Acad. Sci. USA, 111, 6894–6899, 12
doi:10.1073/pnas.1403364111, 2014. 13
Westphal, D. L., Curtis, C. A., Liu, M., and Walker, A. L.: Operational aerosol and dust storm 14
forecasting, in: WMO/GEO Expert Meeting on an International Sand and Dust Storm 15
Warning System, IOP Conf. Series: Earth and Environ. Science, 7–9 November 2007, 16
Barcelona Supercomputing Center (BSC), Barcelona, Spain, 7, doi:10.1088/1755-17
1307/7/1/012007, 2009. 18
Woodward, S.: Modeling the atmospheric life cycle and radiative impact of mineral dust in 19
the Hadley Centre climate model, J. Geophys. Res., 106, 18155–18166, 20
doi:10.1029/2000JD900795, 2001. 21
Woodward, S.: Mineral Dust in HadGEM2, Tech. Note 87, Hadley Cent., Met Office, Exeter, 22
UK, 2011. 23
Zhang, J., Reid, J. S., Westphal, D. L., Baker, N., and Hyer, E. J.: A system for operational 24
aerosol optical depth data assimilation over global oceans, J. Geophys. Res., 113, D10208, 25
doi:10.1029/2007JD009065, 2008. 26
Zhang, R., Li, G., Fan, J., Wu, D. L., and Molina, M.: Intensification of Pacific storm track 27
linked to Asian pollution, P. Natl. Acad. Sci. USA, 104, 5295–5299, 28
doi:10.1073/pnas.0700618104, 2007. 29
30

25
1
2
Table 1. Global annual emissions, annual burden and lifetime for dust aerosolsa. 3
4
Emissions
(Tg yr-1)
Burden
(Tg)
Lifetime
(day)
NGAC V1.0 1980 21.9 4.3
On-line GEOS4 1970 31.6 5.85
Off-line GEOS4 3242 38.4 4.33
Off-line GEOS 1604-1956 31-40 6.6-7.3
AeroCom 1123 [514 – 4313] 15.8 [6.8 – 29.5 ] 4.6 [1.6 – 7.1]
5
aNote: the top number is the NGAC V1.0 results from September 2012–September 2013, the 6
second number is the results of on-line GEOS4-GOCART simulations (Table 1 in Colarco et 7
al., 2010), the third number is the results of off-line GEOS4-GOCART model (Table 1 in 8
Colarco et al., 2010 which in turn is provided by Mian Chin using the off-line GEOS4-9
GOCART model described in Chin et al., 2009), the fourth number is the results of off-line 10
GEOS-GOCART model (Table 2 in Ginoux et al., 2001), and the fifth number is the average 11
of the AeroCom models with the range of the models in parentheses (Table 3 in Huneeus et 12
al., 2011). 13
14
26
Table 2. Statistic results comparing CMAQ model results with EPA AIRNOW PM2.5. 1
The mean bias (MB) and correlation (R) are calculated for the baseline run using static 2
LBCs and the experimental run using NGAC LBCs. 3
Domain/Period CMAQ Baseline CMAQ Experimental
Whole domain, 1 1
July 1 - Aug 3
MB = -2.82, R = 0.42 MB = -0.88, R = 0.44
South of 38°N, East of 105°W
July 1- Aug 3
MB = -4.54, R=0.37 MB = -1.76, R = 0.41
Whole domain,
July 18 – July 30
MB = -2.79, R = 0.31 MB = -0.33, R = 0.37
South of 38°N, East of 105°W
July 18 – July 30
MB = 4.79, R=0.27 MB = -0.46, R = 0.41
4
5
6
7

27
1
Figure 1. Schematic summary of the GOCART aerosol module as adapted and being 2
implemented in GEOS-4/5 at GMAO and NEMS GFS at NCEP. 3
4
28
1
Figure 2. The dust source function or probability of dust uplifting, mapped to GFS T126 2
resolution, used in NGAC V1.0. 3
4

29
1
Figure 3. Primary integration runstream of NGAC. 2
3
4

30
1
Figure 4. Annaul dust emissions (in g m-2 yr-1) over the September 2012–September 2013 2
period. 3
4

31
1
Figure 5. Comparisons of monthly-mean MODIS total AOD (left), NGAC V1.0 dust AOD 2
(middle), and GEOS5 dust AOD (right) at 550 nm for October 2012, January 2013, April 3
2013, and July 2013 periods. 4
5

32
1 2
Figure 6a. NGAC V1.0 versus L1.5 AERONET 550-nm AOD comparisons at Cape Verde 3
for the 2013-2014 period: a time series, scatterplot, and fractional distribution histogram. In 4
the time series, the model monthly means and standard deviation about the mean are shown in 5
the black symbols and lines. The AERONET monthly means and standard deviation about 6
the mean are shown in the red shading and orange bars. In the PDF plot, the model is 7
indicated by the black symbols and line, and the AERONET observations are indicated by 8
orange bars. 9
33
1
Figure 6b. NGAC V1.0 versus AERONET 550-nm AOD comparisons at Dakar for the 2013-2
2014 period: a time series, scatterplot, and fractional distribution histogram. 3
4
34
1
Figure 6c. NGAC V1.0 vs. AERONET 550 nm AOD comparisons at Banizoumbou for the 2
2013 -2014 period: a time series, scatterplot, and fractional distribution histogram. 3
4

35
1 Figure 6d. NGAC V1.0 vs. AERONET 550 nm AOD comparisons Ilorin for the 2013 -2014 2
period: a time series, scatterplot, and fractional distribution histogram. 3
4

36
1 Figure 6e. NGAC V1.0 vs. AERONET 550 nm AOD comparisons at Sede Boker for the 2
2013 -2014 period: a time series, scatterplot, and fractional distribution histogram. 3
4

37
1
Figure 6f. NGAC V1.0 vs. AERONET 550 nm AOD comparisons at La Parguera for the 2
2013 -2014 period: a time series, scatterplot, and fractional distribution histogram. 3
4
38
1
2
3
Figure 7. Dust AOD valid at 12:00 UTC 4 July 2015 for ICAP multi-model ensemble (top) 4
and NGAC V1.0 (bottom). The ensemble is based on 7 members, including the models from 5
NCEP (NGAC V1.0), GMAO, ECMWF, NRL, JMA, UKMO, and BSC. These figures are 6
produced by the Naval Research Laboratory. 7
8

39
1
2
3
Figure 8. Time series of PM2.5 from EPA AIRNOW observations (black dot), CMAQ 4
baseline run using static LBCs (green dot) and CMAQ experimental run using NGAC LBCs 5
(blue square) at Miami, FL (top panel) and Kenner, LA (bottom panel). 6
7
8