Embed Size (px)
Citation preview
The Implementation of Micro
Hydro Projects in Remote Villages
in Developing Countries:
An Interdisciplinary Approach
Sari Murni, M.Sc
This thesis is presented for the degree of Doctor of Philosophy
Murdoch University
Western Australia
2014

ii

iii
I declare that this thesis is my own account of my research and contains as
its main content work which has not previously been submitted for a
degree at any tertiary education institution.
Sari Murni

iv
v
Abstract
An established body of literature now exists in the field of rural electrification projects
in developing countries. Much of this literature has focused on the factors that
influence the degree of success of projects and on their outcomes in terms of their
impacts on the communities that they are used to supply. There are, however, large
differences in rural electrification programs depending on the technologies used, and
the amount of information in the literature that is focused on rural electrification of
remote villages based on the installation of micro hydro systems (MHSs) is quite
small.
This study looks at the planning and implementation of MHSs in remote villages close
to the international border of Malaysia and Indonesia on the island of Borneo. Two
case studies are presented – villages in Ba’kelalan in Sarawak and villages across the
border in Krayan in North Kalimantan. The villages used as case studies are similar in
terms of geography, ethnicity and religion, but differ in terms of economics and the
policy frameworks in which they operate because they are located on different sides of
a shared national border. The benefit of using a study area that includes micro hydro
schemes on either side of a national border is that it is able to throw more light on the
differences that policy frameworks make to the success of a micro hydro scheme. The
premise upon which this research is found is that the planning, construction and
implementation of MHS in remote areas such as this are complex and the aim of the
research is therefore to obtain a ‘whole picture’ understanding of micro hydro scheme
projects undertaken as rural electrification projects in order to attain a better
understanding of the factors that affect the level of success and as failure of these
micro hydro projects.
Data was collected through field surveys in which questionnaires and energy audits
were administered to householders, while interviews were held with village headmen,
village micro hydro committees, manufacturers, and with government and non-
government organisations. Further quantitative data was gained from the resource
assessment as well as supply and demand measurements for some of the micro hydro
systems in the study area.
vi
Based on the results of the field survey, the research defines critical activities
associated with the MHS implementation process and factors/issues associated with
each critical activity then been proposed to provide a framework which to guide future
MHS implementation. One key finding from the study is that the degree of success of
micro hydro projects in the research area was not determined by the existence of
national or state government policy and reasons for this are suggested.
One recommendation from this study is that in order for a micro hydro project to be
successful, its planning and implementation need to be well thought out. While the
existence of guidelines, roadmaps or frameworks for MHS implementation is helpful
in that they provide a process for developing a very carefully planned and detailed
project management plan, the design and management of the projects vary
considerably due to the uniqueness of micro hydro sites, and the differences in the
local/community cultures and social systems.
vii
Acknowledgements
This thesis would not have been possible without the contributions of many different
people, in their different ways. I take this opportunity to express my gratitude to the
people who have been instrumental in the successful completion of this project, only
some of whom it is possible to mention here.
First of all, praise to Allah the Almighty for the wisdom and perseverance that he
bestowed upon me during this research project, and indeed, throughout my life.
I would like to express my sincere appreciation to my supervisors; Dr. Jonathan Whale
and Dr. Tania Urmee, for support, guidance and advice throughout the research
project, as well as their pains-taking effort in reviewing the drafts, all of which are
greatly appreciated. A great deal of thanks goes to my third supervisor Mr. John
Davis who helped me sharpen my social points of view and adding to my technical
background and also for ‘the sweet treat’- conversation after our meetings.
Furthermore, I would also like to acknowledge with deep appreciation the crucial role
of my external supervisor, Prof. David Harries; for his excellent guidance, patience,
leading me to develop this interdisciplinary study and for providing both academic and
non-academic support right through to the end of the study. I greatly appreciate his
wisdom, way of thinking and generosity.
I would like to express my gratitude to Dr. Jayl Langub and Dr. Daniel Chew from
Unimas, Malaysia, and I Ketut Ardhana from LIPI, Indonesia, who shared their own
information regarding the research area, assisted in my application for a researcher visa
and introduced me to local people in Ba’kelalan and Long Bawan. Very special thanks
go to Marianne Kornaat and Zwanette Salomons, whose desire to help the community
in Ba’kelalan initiated this project – a spirit that always lifts my enthusiasm. My hope
is that in finishing this study I have given something to them, even though it is a small
offering. This study gave me extraordinary experiences, from having discussions with
a Minister of State, and a Director General on the one hand, while on other occasions I
was living for a couple of weeks at a time with local people in a pristine environment,
without any electricity, learning how to live a simple life in Borneo. For these
extraordinary experiences, I am extremely grateful. I greatly appreciate the efforts of
Dawat Mutang and family in Ba’Kelalan and Yagung Bangau, Kepala Adat in Long

viii
Bawan, for their tireless help during the fieldtrip; to Samuel S. Padan, the Long Bawan
sub-district officer, who continues to keep in-touch and who provided me with updated
information right through to the end of the study. I would also like to thank all
participants who so willingly gave their precious time by sharing their stories or by
participating in the survey.
I would not have been able to undertake this study without the financial assistance
provided by Directorate General of Higher Education through Muhammadiyah
University of Surakarta, Indonesia and a Murdoch University Post-Graduate Students’
Association (MUPSA) completion scholarship. I am very grateful for those supports.
I wish to express my very special gratitude to my late father, Sariman, who always
encouraged me to study abroad but who unfortunately passed away before he could see
me complete this study -this thesis is dedicated to you, and to my mother, Ratna, for
her unequivocal support, prayers and for encouraging me with her best wishes.
I am grateful beyond words to my husband, Ichwan Murtopo for his patience, for
always standing by me and for providing invaluable support, and to my dearest
‘cheerleaders’, Aditya, Tifani, Nanda, Rizqi and Isabila. Thank you for understanding
our situation, for being so independent and for cheering my days with your love,
laughter and loudness. Without you I could not have survived the process, including
the fieldtrips it involved, and especially the final few months’ sprint to the finish of
this ‘marathon.’
For those who have had contributed to this thesis and are not mentioned above, I thank
all of you with profound gratitude.
ix
Dedication
For my late father, Sariman
and
for my children: Aditya, Tifani, Nanda, Rizqi, Isabila

x
xi
Acronyms
4WD Four Wheel Drive
AC Alternating Current
ADB Asian Development Bank
AEPC Alternative Energy Promotion Centre
am Ante Meridiem
Amp Ampere
APAEC The ASEAN Plan of Action for Energy Cooperation
ASEAN The Association of South-East Asian Nations
AUD Australian Dollar
BAPPENAS Badan Perencanaan Pembangunan Nasional (the National
Development Planning Agency of Indonesia)
BELB Bekalan Elektrik Luar Bandar (Rural Electricity Supply Scheme)
CFL Compact Fluorescent Light
DC Direct Current
E East
EE&C Energy Efficiency and Conservation
ELC Electronic Load Controller
FiT Feed-in-Tariff
GEF-SGP the Global Environment Facility-Small Grants Programme
GIZ Deutsche Gesellschaft für Internationale Zusammenarbeit (the German
Organisation for Technical Cooperation)
GOI Government of Indonesia
GOM Government of Malaysia
GTZ Deutsche Gesellschaft für Technische Zusammenarbeit (the German
Organisation for Technical Cooperation)
GW gigawatt
hh household
HPP Harga Pokok Penjualan (Price setting for National Cost and Supply)
xii
IBEKA Institut Bisnis dan Ekonomi Kerakyatan (People Centred Business and
Economic Institute)
IDB Inter-American Development Bank
IDR Indonesian Rupiah
IMIDAP Integrated Microhydro Development and Application Project
JAMP Joint ASEAN Mini Hydro Power Programmes
JKR Jabatan Kerja Raya (Public Work Department)
K symbol for thousands used in unit of currency
KeTTHA Kementerian Tenaga, Teknologi Hijau dan Air (the Ministry of Energy,
Green Technology and Water)
kW kilowatt
kWh kilowatt hour
LED Light Emitting Diode
LPG Liquid Petroleum Gas
MCB Miniature Circuit Breaker
m.s-1
metre per second
MEMR Ministry of Energy and Mineral Resources
MHC Micro Hydro Committee
MHS Micro Hydro Scheme
MNRE the Ministry of New & Renewable Energy
MOU Memorandum of Understanding
MS Excel Microsoft Excel
MST Ministry of Science and Technology
MW megawatt
MWe megawatt/s of electrical output
MYR Malaysian Ringgit
N North
NASA the National Aeronautics and Space Administration
n.d. no date
NGO Non-Government Organisations
O&M Operation and Maintenance
xiii
PACOS Partners of Community Organisation
PETRONAS Petroliam Nasional Berhad (Malaysia's National Petroleum
Corporation)
Ph.D. Doctor of Philosophy
PIUKKU Pemegang Izin Usaha Ketenaga Listrikan untuk Kepentingan Umum
(Off-Grid Electricity Business)
PLN Perusahaan Listrik Negara (State Electric Company of Indonesia)
pm post meridiem
PMO the Prime Minister’s Office
PNPM Program Nasional Pemberdayaan Masyarakat (National Program for
Community Empowerment)
PROLISDES Program Listrik Perdesaan (Rural Electrification Program)
PSK tersebar Pembangkit Skala Kecil Tersebar (Small Distributed Generation)
PV Photovoltaic
RC Rotary Club
R&D Research and Development
RE Renewable Energy
REDP Nepal Rural Energy Development Program
RET Renewable Energy Technology
RETF Renewable Electricity Trust Fund
RUKN Rencana Umum Ketenagalistrikan Nasional (National Electricity
Master Plan)
SCORE the Sarawak Corridor of Renewable Energy
SEB Sarawak Energy Berhard
SERN the Sustainable Energy Regulation Network
SHP Small Hydro Projects
SHS Solar Home Systems
SME Small Medium Enterprise
SPSS Statistical Package for the Social Sciences
SREP Small Renewable Energy Power
TDL Tarif Dasar Listrik (Basic Electricity Tariff)
xiv
TNB Tenaga Nasional Berhad (Electric Power Utility in Malaysia)
TONIBUNG TObpinai NIngkokoton koBUruon kampuNG (a community-based
organisation based in Penampang, Sabah)
TV television
UNDP United Nations Development Programme
UNESCAP the Economic and Social Commission for Asia and the Pacific
USA the United States of America
USAID the United States Agency for International Development
UU Undang-undang (Indon. pl.) legislation or laws
W watt
Wh watt hour
Currency Equivalents
Currency rate used in this thesis is:
USD 1 = AUD 1.1
AUD 1 = MYR 3
= IDR 8,500
xv
List of Publications
Parts of the work presented in this thesis have been published in:
1. Murni, S., Whale, J., Davis, J., Urmee, T. & Harries, D., 2010. Status of
Rural Electrification in the 'Heart of Borneo': Role of Micro Hydro Projects.
Solar2010, 48th AuSES Annual Conference. Canberra ACT, Australia.
2. Murni, S., Whale, J., Urmee, T., Davis, J. & Harries, D., 2012. The Role of
Micro Hydro Power Systems in Remote Rural Electrification: a Case Study in
the Bawan Valley, Borneo. Procedia Engineering, Vol. 49, pp. 189-196.
3. Murni, S., Whale, J., Urmee, T., Davis, J. K. & Harries, D., 2013. Learning
from Experience: A Survey of Existing Micro-hydropower Projects in
Ba'kelalan, Malaysia. Renewable Energy, Vol. 60, pp. 88-97.
4. Murni, S., Urmee, T., Whale, J., Davis, J. & Harries, D., 2014. The
Implementation of Microhydro Projects in Remote Villages on the Border of
Indonesia and Malaysia: Lessons Learnt. International Conference and Utility
Exhibition on Green Energy for Sustainable Development (ICUE 2014).
Pattaya, Thailand.

xvi
xvii
Table of Contents
Title
Declaration iii
Abstract v
Acknowledgements vii
Dedication ix
Acronym xi
Currency Equivalent xiv
List of Publications xv
Table of Content xvii
List of Figures xxv
List of Tables xxix
PART I: RESEARCH QUESTIONS, AIMS, METHODOLOGY
AND LITERATURE REVIEW
1
Chapter 1: Introduction……………………………………………… 3
1.1 Introduction………………………………………………………… 3
1.2 Definition of micro hydro…………………………………………. 5
1.3 The Need for the study……………………………………………. 5
1.4 Research contribution…………………………………………....... 9
1.5 Research questions, aim and objectives………………………….. 10
1.6 Thesis structure……………………………………………………. 11
Chapter 2: Methodology…………………………………………….. 13
Overview………………………………………………………………… 13
2.1 Introduction………………………………………………………… 13
2.2 Interdisciplinary study…………………………………………….. 14
2.3 Conceptual model for analysis……………………………………. 17
2.4 Case study approach……………………………………………… 18
2.5 Stages in the research project……………………………………... 20
2.5.1 Desktop research……………………………………………... 21
xviii
2.5.2 Field survey………………………………………………… 22
2.6 Field survey techniques……………………………………. 23
2.6.1 Site observations……………………………………………. 24
2.6.2 Householder survey questionnaire………………………….. 25
2.6.3 Household energy audits………………………………...…. 25
2.6.4 Key informant interviews…………………………………... 26
2.6.5 Focus group discussions……………………………………. 26
2.7 Target respondent group………………………………………… 27
2.8 Sample size………………………………………………………. 28
2.9 Ethical conduct of the research…………………………………. 30
2.10 Data analysis……………………………………………………. 31
Chapter 3 The Literature Review….……………………………….. 33
Overview……………………………………………………………… 33
3.1 Rural electrification in developing countries…………………… 34
3.1.1 Rural electrification using renewable energy in ASEAN
nations……………………………………………………..
38
3.2 Rural electrification programs based on micro hydro systems…… 41
3.2.1 A brief history of hydroelectricity technology………………... 42
3.2.2 Drivers on MHS rural electrification programs………………... 43
3.2.3 Issues associated with MHS rural electrification programs…... 44
3.3.4 Designing village-scale MHS projects………………………... 52
General………………………………………………………… 52
Key issues in designing and implementing an MHS…………. 54
(a) Engineering………………..………………………………. 54
(i) Resource assessment…………………………………... 54
(ii) Demand-supply outlook………………………………. 57
(iii) System design………………………………………… 59
(iv) Local capacity and technical support…………………. 60
(b) Social aspects……………………………………………… 61
(i) Community participation………………….…………… 61
(ii) Ownership……………………………………………... 63
(c) Management……………………………………………….. 64
(i) Business model of village-scale MHS…………………. 64
xix
(d) Environmental aspects…………………………………….. 65
PART II: CASE STUDIES…………………………………………… 69
Chapter 4: Background Information on Case Study Area…………. 71
Overview………………………………………………………………… 71
4.1 Energy situation and energy policies in Malaysia and Indonesia...... 71
4.1.1 Malaysia……………………………………………………….. 71
4.1.2 Indonesia……………………………………………………… 79
4.2 Implementation of MHS in Malaysia and Indonesia……………….. 86
4.2.1 Malaysia……………………………………………………….. 86
4.2.2 Indonesia………………………………………………………. 87
4.3 The Borneo Highlands – The ‘Heart of Borneo’……………………. 90
4.4 Ba’kelalan - Sarawak…………………..…………………………… 93
4.4.1 Geography and demography………………………………….. 93
4.4.2 Village structure………………………………………………. 94
4.4.3 Current energy situation………………………………………. 95
4.4.4 Renewable energy resources…………………………………... 97
4.4.5 Existing micro hydro projects…………………………………. 100
4.5 Krayan – North Kalimantan…………………………………………. 102
4.5.1 Geography and demography………………………………….. 102
4.5.2 Village structure………………………………………………. 103
4.5.3 Current energy situation………………………………………. 105
4.5.4 Renewable energy resources…………………………………... 107
4.5.5 Existing micro hydro projects…………………………………. 107
Chapter 5 A Case Study in the ‘Heart of Borneo’: Ba’kelalan……. 111
Overview………………………………………………………………… 111
5.1 Introduction…………………………………………………………. 111
5.2 Socio-economic and energy information…………………………… 113
5.2.1 Demographic information……………………………………... 113
5.2.2 Income survey…………………………………………………. 116
5.2.3 Expenditure survey…………………………………………….. 118
5.2.4 Current energy usage and patterns……………….……………. 120
5.3 Evaluation of micro hydro projects………………………………… 123
xx
5.3.1 Policy and design……………………………………………… 123
(a) Resource assessment………………………………………. 123
(b) Number of household connected………………………….. 126
(c) Stakeholder engagement in the MHS projects…………….. 127
(d) Funding……………………………………………………. 128
5.3.2 Implementation……………………………………………….. 130
(a) Installation………………………………………………… 130
(b) Community involvement………………………………….. 130
5.3.3 Operation……………………………………………………… 132
(a) Load management……………………………………….. 132
(b) Operation and maintenance……………………….……... 137
(c) Electricity tariff………………………………………….. 139
5.3.4 Evaluation……………………………………………………. 140
(a) MHS performance: available power vs. consumed power 140
(b) Problems with the MHS……..…………………………. 143
(c) Main benefits of MHS …………………………………. 144
(d) End users’ satisfaction…………………………………… 145
(e) Appliances and capacity to pay…………………………. 146
(f) Future projects…………………………………………… 148
(g) MHS impacts within community………………………... 150
(h) MHS impacts on broader community…………………… 154
5.4 Summary…………………………………………………………… 156
Chapter 6 A Case Study in the ‘Heart of Borneo’: Krayan….…….... 159
Overview………………………………………………………………… 159
6.1 Introduction…………………………………………………………. 159
6.2 Socio-economic and energy information…………………………… 160
6.2.1 Demographic information……………………………………... 161
6.2.2 Income survey…………………………………………………. 163
6.2.3 Expenditure survey…………………………………………….. 165
6.2.4 Current energy usage and patterns……………….……………. 167
6.3 Evaluation of micro hydro projects………………………………… 170
6.3.1 Policy and design……………………………………………… 171
(a) Resource assessment………………………………………. 171
xxi
(b) Number of household connected………………………….. 172
(c) Stakeholder engagement in the MHS projects…………….. 172
(d) Funding……………………………………………………. 173
(e) Site investigation 174
6.3.2 Implementation……………………………………………….. 176
(a) Installation………………………………………………… 176
(b) Community involvement………………………………….. 176
6.3.3 Operation……………………………………………………… 177
(a) Load management……………………………………….. 177
(b) Electricity tariff …………………………………………. 179
(c) Operation and maintenance …………………………….. 180
6.3.4 Evaluation……………………………………………………. 183
(a) Main benefits of MHS…...………………………………. 183
(b) End users’ satisfaction…………………………………… 185
(c) Appliances and capacity to pay…………………………. 186
(d) Future projects…………………………………………… 188
(e) MHS impacts within the community…………..………... 189
(f) MHS impacts on broader community…………………… 193
6.4 Summary…………………………………………………………….. 197
PART III: DISCUSSION AND CONCLUSION……………………. 201
Chapter 7 Discussion………………………………………………….. 203
Overview………………………………………………………………… 203
7.1 Introduction………………………………………………………….. 203
7.2 Policy and design……………………………………………………. 204
7.2.1 Hydro resource assessment……………………………………. 204
7.2.2 Current energy usage pattern………………………………….. 207
7.2.3 Electricity demand…………………………………………….. 209
7.2.4 Stakeholders…………………………………………………… 213
7.2.5 Funding………………………………………………………... 215
7.2.6 Government policy…………………………………………….. 217
7.3 Implementation………………………………………………………. 221
7.3.1 Community participation………………………………………. 221
xxii
7.3.2 Ownership……………………………………………………... 223
7.4 Operation…………………………………………………………….. 225
7.4.1 Social enterprise………………………………………………. 225
7.4.2 Capacity building……………………………………………... 226
7.5 Evaluation……………………………………………………………. 229
7.5.1 Available power and load factor………………………………. 229
7.5.2 End users’ satisfaction…………………………………………. 231
7.5.3 Capacity to pay………………………………………………… 232
7.5.4 MHS impacts…………………………………………………... 234
7.6 Synthesis…………………………………………………………….. 238
7.6.1 Comparing the two government projects with the two
non-government projects………………………………………
240
7.6.2 Comparing the Malaysian government projects with the
Indonesian government projects………………………………
241
7.6.1 Comparing the two projects in Malaysia with the two
Projects in Indonesia…..………………………………………
242
7.7 Revised conceptual diagram for the MHS implementation………... 243
7.8 Drawing a ‘whole picture’ of an MHS implementation…………… 249
7.8.1 Framework diagram for the implementation of MHS in remote
areas…………………………………………………………...
249
(a) Discern support…………………………………………… 253
(b) Organisational design…………………………………….. 253
(c) Technical design………………………………………….. 254
(d) Implementation…………………………………………… 255
(e) Operation…………………………………………………. 255
(f) Evaluation…………………………………………………. 256
7.8.2 Systemic model for MHS implementation…………………….. 257
Chapter 8 Summary and Conclusion…………………………………. 261
Overview………………………………………………………………… 261
8.1 Answering the research questions………………………………….. 261
8.1.1 Reason for the limited success of some MHS programs in the
‘Heart of Borneo’……………………………………………..
263
8.1.2 Key issues in implementing a successful MHS in remote rural
areas…………………………………………………………….
264
8.2 Lessons learned…………………………………………………….. 266
xxiii
8.3 Limitations of the study……………………………………………… 268
8.4 Recommendations for future research……………………………… 270
References……………………………………………………………….. 273
Appendices………………………………………………………………. 285
Appendix 1. Information letter……………………….…………………. 287
Appendix 2. Household questionnaire…………………..………………. 289
Appendix 3. Manufacturer/distributor questionnaire……………………. 295
Appendix 4. Focus questions for O&M personnel……….....…………... 299
Appendix 5. Focus questions for community leader ………………….… 301
Appendix 6. Focus questions for the headmen….……….....………….... 303
Appendix 7. Focus questions for Government official….....………..…... 305
Appendix 8. Synchronisation process for the web diagram…………..….. 307

xxiv
xxv
List of Figures
Figure 2.1 Conceptual model of MHS project development………………. 18
Figure 2.2 The four stages of the research project…………………………. 21
Figure 2.3 Flow chart of field survey techniques used…………………….... 24
Figure 3.1 Project positioning based on community participation………… 62
Figure 3.2 Spectrum of property rights (relating to natural resources)…….. 64
Figure 4.1 Malaysia energy demands by sector in 2011………………...…. 72
Figure 4.2 Indonesia energy cosumption by sector included biomass in
2012……………………………………………………………..
80
Figure 4.3 (a) Heart of Borneo, (b). Forest loss in Borneo, (c). Sketch map
of villages in research area……………………………………..
91
Figure 4.4 Six lokasi in the Ba’kelalan area……………………………….. 93
Figure 4.5 Village structure in Ba’kelalan………………………………… 94
Figure 4.6 Logging road linking Ba’kelalan – Lawas prior to 2011……… 96
Figure 4.7 The Krayan, Nunukan Regency, in North Kalimantan………… 103
Figure 4.8 Village structure in Krayan…………………………………..… 104
Figure 4.9 Transporting merchandise from Ba’kelalan via motorcycle…… 106
Figure 5.1 Age distribution of respondents in Buduk Bui and Buduk Nur.. 113
Figure 5.2 Household size of responding household in Buduk Bui and
Buduk Nur………………………………………………………
114
Figure 5.3 Educational levels of respondents in Buduk Bui and Buduk Nur 115
Figure 5.4 Source of income of respondents in Buduk Bui and Buduk Nur 116
Figure 5.5 Annual estimated household incomes derived from crops and
livestock of respondents in Buduk Bui and Buduk Nur ……….
117
Figure 5.6 Average monthly expenditure per person of respondents in
Buduk Bui and Buduk Nur……………………………………...
118
Figure 5.7 Average monthly expenditure for main household items per
occupant of responding households in Buduk Bui and Buduk
Nur ……………………………………………………………...
119
Figure 5.8 Average monthly expenditure (AUD) on energy for key
activities shown per occupant of responding households in
xxvi
Buduk Bui and Buduk Nur …………………………….……… 119
Figure 5.9 Distribution of daily load in Buduk Bui and Buduk Nur……… 122
Figure 5.10 Average monthly rainfall in Ba’kelalan on the period 2004 –
2010…………………………………………………………….
125
Figure 5.11 Average annual rainfall in Ba’kelalan on the period 2004 –
2010…………………………………………………………….
125
Figure 5.12 Community involvements in MHS project in Buduk Bui and
Buduk Nur…………………………...…………………….........
132
Figure 5.13 Load distribution system in Buduk Nur………………………... 133
Figure 5.14
Conceptual diagram of the power distribution lines from the
Buduk Nur MHS turbine to the Clinic and supported
households………………………………………………………
135
Figure 5.15 Available and consumed power observation in Buduk Nur……. 141
Figure 5.16 Performances of MHS in Buduk Nur…………………………... 141
Figure 5.17 Main benefit of MHS in Buduk Bui and Buduk Nur ………….. 145
Figure 5.18 Satisfactions on MHS in Buduk Bui and Buduk Nur ...………... 146
Figure 5.19 Expected additional electricity cost in Buduk Bui and Buduk
Nur ……………………………………………………………..
148
Figure 5.20 Institutional arrangment for future project in Buduk Bui and
Buduk Nur ……………………………………………………...
149
Figure 5.21 Expected contribution for future project in Buduk Bui and
Buduk Nur ……………………………………………………...
150
Figure 5.22 The social impact of micro hydro in community in Buduk Bui
and Buduk Nur ………………………………..………………..
151
Figure 5.23 The social impact of micro hydro in household in Buduk Bui
and Buduk Nur ………………………………..…………..……
152
Figure 5.24 The impact of micro hydro on out migration in Buduk Bui and
Buduk Nur………………………………………………………
153
Figure 5.25 The impact of micro hydro systems on income in Buduk Bui
and Buduk Nur ……………………………….…………………
154
Figure 6.1 Age distribution of respondents in Liang Butan and Tang
Paye……………………………………………………………..
161
Figure 6.2 Household size of responding households in Liang Butan and
Tang Paye....................................................................................
162
xxvii
Figure 6.3 Education level of respondents in Liang Butan and Tang Paye... 163
Figure 6.4 Source of income of respondents in Liang Butan and Tang Paye 164
Figure 6.5 Annual estimated income of respondents in Liang Butan and
Tang Paye……………………………………………………….
165
Figure 6.6 Average monthly expenditure per person in Liang Butan and
Tang Paye……………………………………………………….
166
Figure 6.7 Average monthly expenditure per household occupant for main
household items in Liang Butan and Tang Paye………………..
167
Figure 6.8 Breakdown of monthly average energy expenditure of
household occupant in Liang Butan and Tang Paye……………
168
Figure 6.9 Average daily load in responding households in Liang Butan
and Tang Paye ………………………………………………….
170
Figure 6.10 Powerhouse and three cascade settling ponds in Tang Paye…. 175
Figure 6.11 Community involvements in the MHS project in Liang Butan
and Tang Paye…………………………………………………..
177
Figure 6.12 Power house for Romayo I MHS………………………………. 183
Figure 6.13 MHS main benefit in Liang Butan and Tang Paye…………….. 184
Figure 6.14 Satisfactions on MHS in Liang Butan and Tang Paye…………. 185
Figure 6.15 Additional electricity cost in Liang Butan and Tang Paye……... 187
Figure 6.16 Institutional arrangement for future project in Liang Butan and
Tang Paye……………………………………………………….
188
Figure 6.17 Expected contribution for future project in Liang Butan and
Tang Paye……………………………………………………….
189
Figure 6.18 Social impact of MHS in the community in Liang Butan and
Tang Paye……………………………………………………..
190
Figure 6.19 Social impact of micro hydro in household in Liang Butan and
Tang Paye……………………………………………………….
191
Figure 6.20 Impact of micro hydro on out migration in Liang Butan and
Tang Paye……………………………………………………….
192
Figure 6.21 The impact of micro hydro on income in Liang Butan and Tang
Paye……………………………………………………………
193
Figure 7.1 Case studies project positioning based on community
participation……………………………………………………..
222
Figure 7.2 Reconceptualisation for MHS implementation life cycle………. 245
xxviii
Figure 7.3 Spider web diagram of the MHS implementation process…….. 247
Figure 7.4 Web diagram for all four case studies in this research………… 248
Figure 7.5 Critical activities per each stage over the MHS implementation
life cycle………………………………………………………..
251
Figure 7.6 Framework on critical issues that contribute to activities over
the MHS implementation life cycle…………………………….
252
Figure 7.7 Systemic model of MHS implementation ……………………... 258
xxix
List of Tables
Table 2.1 Disciplines and issues examined in this research……………….. 16
Table 2.2 Sample size per village case study……………………………… 29
Table 3.1 Electricity access in selected developing countries in 2008 34
Table 3.2 Installed capacity by technology in the Peruvian electricity
system in 2009…………………………………………………..
37
Table 3.3 Electrification rate of ASEAN member countries……………… 38
Table 3.4 ASEAN renewable energy resources and utilization…………… 39
Table 3.5 Barriers to the implementation of MHS projects in Indonesia…. 51
Table 4.1 Primary energy supply and its share for power generation in
Malaysia in 1980 and 2008………………………………………
72
Table 4.2 Evolutionary timeline of energy policies and initiatives in
Malaysia…………………………………………………………
74
Table 4.3 Mechanisms used to support and promote the use of renewable
energy in Malaysia………………………………………………
75
Table 4.4 SREP approved project as on February 2010…………………… 76
Table 4.5 Primary energy supply and its share for power generation in
Indonesia in 2000 and 2011…………………………………….
80
Table 4.6 Government institutions that working on electricity programs,
its role and authority…………………………………….............
82
Table 4.7 Indonesian policies, laws and regulations on renewable energy 84
Table 4.8 Existing micro hydro implementation programs in Indonesia...... 89
Table 4.9 Villages and lokasi in Ba’kelalan……………………………….. 95
Table 4.10 Profile of MHS in Ba’kelalan at the time of this research study.. 101
Table 4.11 Lokasi and village in Krayan sub-district engaged in this study... 105
Table 4.12 Profile of MHS in Krayan at the time of this research study…… 109
Table 5.1. Energy sources and average monthly consumption per
household………………………………………………………..
120
Table 5.2. Estimated MHS power output………………………………….. 124
Table 5.3. Overview of funding arrangement for Buduk Bui and Buduk
xxx
Nur MHS……………………………………………………….. 129
Table 5.4. The result of a focus group in Buduk Nur discussing options to
exploit excess power during the non-peak periods………………
142
Table 6.1. Unit prices of energy resources in Liang Butan (as of November
2010)…………………………………………………
169
Table 6.2. Costs of main energy resources (excluding micro hydro
electricity) in Liang Butan (as of November 2010) ……………..
169
Table 6.3 Problems found in Liang Butan’s MHS………………………… 182
Table 7.1 Hydro resources assessment in Ba’kelalan and Krayan………… 207
Table 7.2 Monthly expenditure of the households and expenditure on
energy……………………………………………………………
208
Table 7.3 Load per household in village case study……………………… 210
Table 7.4 Stakeholder and community involvement for MHS project in
Ba’kelalan and Krayan………………………………………….
215
Table 7.5 Funding scheme for MHS project in Ba’kelalan and Krayan…... 216
Table 7.6 Government role in MHS project in Ba’kelalan and Krayan…… 221
Table 7.7 Community participation intensity and MHS project position for
Ba’kelalan and Krayan…………………………………………..
223
Table 7.8 MHS project’s type in Ba’kelalan and Krayan…………………. 224
Table 7.9 Operation and maintenance for MHS in Ba’kelalan and Krayan 228
Table 7.10 Summary of survey finding……………………………………... 239
Table 7.11 Contributing issues within each stage in the MHS
implementation…………………………………………………..
246
1
PART I:
RESEARCH QUESTIONS, AIMS,
METHODOLOGY AND LITERATURE
REVIEW
Chapter 1: Introduction
Chapter 2: Methodology
Chapter 3: The literature review

Chapter 1: Introduction 2
Chapter 1: Introduction 3
Chapter 1
Introduction
1.1 Introduction
Many of those living in rural and remote communities in developing countries are not
connected to a main electricity grid and use diesel or petrol generators to meet their
electricity requirements. Dependence on these fuels not only contributes to greenhouse
gas emissions, but also means access that these communities have to electricity can be
quite limited and that these communities are exposed to increases in diesel and petrol
prices. The use of renewable energy resources to meet the electricity requirements of
such communities reduces both emissions and the community’s vulnerability to
increasing petrol and diesel prices and also provides opportunities for increasing the
access that these communities have to electricity. Renewable energy electricity
generation projects, however, have high initial capital costs and these communities are
usually unable to afford such costs. It is therefore common for renewable energy
projects used for rural and remote electrification programs in developing countries to
be funded through capital grants provided by either donor organisations or by
governments.
From the perspective of all of the parties involved, it is clearly important that these
government or NGO funded projects are as successful as possible. Reductions in
greenhouse gas emissions benefit all. Those providing the funding: governments and
donor organisations, obviously want the funds they provide to be used to achieve the
best outcomes possible. Those responsible for planning and implementing the
programme or project want the project or programme aims to be met. The members of
the communities served by these renewable energy systems want to obtain the
Chapter 1: Introduction 4
maximum benefits that the project can deliver, such as increased electricity supply,
reduced expenditure on electricity or energy, cleaner lighting or reduced exposure to
diesel and petrol price increases.
Many renewable energy programmes and projects have been implemented over the
past decades to achieve these outcomes. However, not all of these projects and
programmes are reported to have been equally successful and some have been
unsuccessful. A considerable amount of research has been devoted to understanding
the reasons for the lack of success of some renewable energy rural electrification
programs and to explain why some programmes are more successful than others, what
key factors determine the success of these programmes and projects, and how to
improve the success rate of such projects or programmes. The outcomes of this
research effort includes guidelines and roadmaps (WEC, 2004; The World Bank, 2005;
UNCTAD, 2010; ARE, 2011) to assist those designing, planning and implementing
these programmes. Some of these guidelines are general and are not technology
specific, while others are intended to guide the planning and implementation of
renewable energy rural electrification programmes based on specific technologies,
such as wind (ARE, 2012) and solar photovoltaic (PV) home systems (IEA-PVPS,
2003; Urmee and Harries, 2011). The focus of this study is on how micro hydro
scheme (MHS) projects are planned, implemented and managed in developing
countries and the reasons for their lack of success or relatively low rate of success. In
spite of a substantial amount of prior research in the field of renewable energy, rural
development projects and some published guidelines, there is solid justification for this
research project, but before presenting that, it is necessary to define what this study
means by the term ‘micro hydro’.
Chapter 1: Introduction 5
1.2 Definition of micro hydro
Hydro power harnesses the potential energy available across a pressure head of water
created either from a reservoir, natural or man-made, or from the flow of a river down
a mountainside. Hydro schemes are classified according to their installed capacity.
However, the terms and the capacities used in these classifications systems vary from
one country to another and there is no agreed definition that is accepted and used the
world over (IEA, 2000).
The classification system used in the USA is based on a scale ranging from pico,
through micro, mini, small, and medium to large (AUSAID, 2000). European countries
refer to large, small, mini, and micro hydro power but their meanings vary from one
European country to another. This has resulted in a lack of clarity and confusion. For
example, a recent best practice guideline jointly published by the Indonesian Ministry
of Energy and Mineral Resources (MEMR) and Deutsche Gesellschaft für
Internationale Zusammenarbeit (GIZ) uses both micro and mini synonymously and
without defining either term (MEMR and GIZ, 2011). To avoid confusion the term
‘micro hydro system’ as used in this study, is clearly defined as a hydro scheme whose
installed capacity is 100 kW or less.
1.3 The need for the study
Every study has its own entry point into the field of research. In the case of this study
it was a request to Murdoch University by a couple of Australian tourists who have
been visiting a village community in the highlands of Borneo over a period of time to
assess the opportunities for renewable energy electricity generation projects in the
village community. The site was visited by a team of researchers from Murdoch
University who conducted hydro resource assessment. While undertaking this
Chapter 1: Introduction 6
assessment it became clear that there was a mismatch between what could be supplied
from the available renewable energy resources and the community’s expectations. It
also became apparent that this was not an isolated case. A number of MHSs had been
installed in the region, and some were operating satisfactorily, while others were not.
These systems ranged in size from a few kilowatts to 100 kW, but what appeared to be
occurring was that the construction of an MHS in one village in the region had led to
interest in the construction of MHS in other villages in the region, and the
community’s expectations of what an MHS could deliver were not based on their
hydrological resources but on what other MHSs delivered. The funding sources used to
construct these MHSs were also mixed, some having been funded by government and
others funded by NGOs, community organisations or private. In summary, a diverse
range of types and sizes of MHSs and funding sources was found, and the projects had
varying success rates. This observation prompted several questions: How were these
MHSs being planned, implemented, operated and maintained? What, if any, guidelines
were being used to inform the design, planning and implementation of these MHSs?
Why were some successful, while others appeared, or were reported, to be less
successful?
As further information about these projects and how they had or were being
implemented was obtained, it also became apparent that many issues were involved in
the planning and implementation of these MHSs and the planning and implementation
process is very complex. The question that arose concerned the degree to which any
existing guidelines recognised this complexity and how useful were those guidelines as
the basis for planning and implementation of rural electrification programmes based on
MHS technology.
Chapter 1: Introduction 7
The argument that underpins this research project is that MHS projects are complex
and that in order to understand the reasons why a particular MHS project is successful
or not, and in order to plan MHSs in a way that they are successful, it is necessary to
understand the entire process, including planning, implementation, management and
the outcome, in order to get a ‘whole picture’ of MHS implementation. Previous
studies that have been undertaken in this field have not taken this ‘whole picture’
approach. This study, by contrast, takes the view that in order to answer the key
questions above, it is necessary to understand not only the processes used to install
these MHSs, but to also understand who is involved in the planning phase, what their
objectives are and what issues they need to confront. It is necessary to also understand,
how the installation of the MHS is funded, how the MHS is operated and maintained
and by whom, and the sources of the ongoing funding required for the operation and
maintenance. The position taken in this study is that obtaining an understanding of
these things may appear to be straightforward or simple, but it is in fact not so. It is
intuitive, for example, that planning a successful MHS project requires careful
evaluation of the hydro resources available. It is also obvious that the amount of
electricity that can be generated is limited, so an assessment of the electricity loads
required to meet the demand of the end users is required in order to determine whether
the hydro resources on their own are sufficient to meet the load. It is clear that in order
to effectively manage the electricity loads, the whole process of system design needs to
be based on an understanding of community expectations and the capacity to manage
future use and aspirations. It seems obvious that, in addition to load management, the
operation and maintenance, as well as the replacement of the MHS at the end of its
economic life, involves questions of funding and how users pay for the electricity
supplied from an MHS. It is logical that all these issues need to be examined in
Chapter 1: Introduction 8
relation to stakeholders’ willingness to pay for the electricity. Yet this does not always
seem to be the case.
However, determining why these critical issues are not adequately factored into the
design process is not simple. The starting position adopted in this study is that projects
involving the use of MHS are far more complex than they often appear. Rural
electrification projects using Solar Home Systems (SHSs) involve installation of stand-
alone SHS on individual households, so the operation and maintenance (O&M) of
these systems becomes the sole responsibility of those individual householders. In
contrast, the O&M of a village-scale MHS is far more complex, as it requires all
community members to cooperate and work together. This complex task requires
agreement to be reached at a community level, which in turn involves overcoming the
heterogeneity of individual interests and preventing any individual interest from
derailing the common interest (Hardin, 1968). This suggests that the factors for success
of village-scale MHS projects are likely to be substantively different to those required
for projects involving single unit-single maintenance bundles, such as SHS based on
individual household PV systems.
Trying to make sense of this complexity is not something that can be achieved easily.
What initiated this study was the variety in the MHS projects and programs that
existed in the highlands of Borneo. They are diverse in terms of installed capacities,
the funding sources used, the stakeholders involved, ownership models, the processes
that have been put into place for O&M, and the allocation of electricity to the members
of the communities that they supply. Here, therefore, was a microcosm of all different
types of MHS projects and this range in MHS projects in a single region offered the
potential to gain greater insights into their complexities and therefore, to answer the
fundamental research questions stated above. There was one other appealing factor.
Chapter 1: Introduction 9
This mix of MHS projects with significantly different characteristics was located in a
border region. This meant that the policy frameworks within which they were
undertaken differed. This presented an opportunity to study the differences that various
factors make to the success of an MHS project, including its policy framework.
1.4 Research contribution
While there is now an established body of literature that focuses on the factors for
success and the impact of renewable energy systems used for rural electrification
projects in various developing countries, relatively few studies have focused on
projects or programmes involving the installation of MHS in particular. Furthermore,
the research that has been undertaken in this field to date has assumed that these
projects are relatively simple and that obtaining an understanding of the reasons for
their relative success or failure is reasonably straight forward. The contribution that
this study makes is, firstly, that its starting premise is that these projects are in fact
complex and that in order to gain an understanding of the projects a ‘whole picture’
view of the planning, design, implementation is required. Secondly, by undertaking a
study of MHS projects in an area with a (relatively) large range of MHS types, their
comparison within a single area assists in gaining an understanding of these complex
projects. Thirdly, this study looks at rural electrification through MHS in remote
villages close to the international border between Malaysia and Indonesia on the island
of Borneo. Ba’kelalan in Sarawak, Malaysia and Krayan, in North Kalimantan,
Indonesia are located adjacent to each other in the highland region of Borneo. The
villages in these two regions are similar in geography, ethnicity and religion, but differ
in their economic and political conditions because of their location in Malaysia and
Indonesia and the different policies that apply to them in consequence. By using a
study area that includes MHS on either side of an international border, this study is
Chapter 1: Introduction 10
able to throw more light on the differences that policy frameworks make to the success
of an MHS.
1.5 Research questions, aim and objectives
In summary, the research questions underpinning this study are:
1. What are critical reasons behind the reported lack of success of some rural
electrification projects based on the use of MHSs?
2. What are the key issues that need to be addressed in order to ensure that rural
electrification projects involving the use of MHS are successful?
In order to make this research more meaningful, the aim of the research is stated here
as:
To obtain a ‘whole picture’ understanding of MHS projects undertaken as rural
electrification projects in order to attain a better understanding of the factors
that affect the level of success of these MHS projects.
The objectives of the research are:
1. To evaluate the planning, design and implementation process of MHS projects in a
remote area.
2. To assess the roles of the various stakeholders involved in project planning,
implementation and management and the impacts that their involvement has on a
MHS project.
3. To examine how the national energy policy framework in which an MHS is
undertaken impacts on the planning and implementation processes, and on the
overall outcomes of an MHS project.
4. To identify factors that determine the success of an MHS in a remote area.
Chapter 1: Introduction 11
1.6 Thesis structure
This thesis is structured in three parts, with Part One encompassing the first three
chapters. The preceding sections of this chapter have provided some initial background
information to the study and introduced the argument that projects based on the
installation of MHSs are relatively complex in their nature. This has been used to
explain why the research was needed and the contribution that it makes to the existing
body of knowledge, and to state explicitly the aim and the objectives of this thesis.
Chapter Two sets out the methodological framework used in this investigation to
address the research questions. The methodology is based on the adoption of an
interdisciplinary approach and the use of case studies. The steps followed in
undertaking the study are explained in detail. The target survey respondents are
described and the methods for selecting the sample and determining sample sizes are
explained.
The results of a literature review are presented in Chapter Three. A body of literature
in the field of renewable energy electrification in general and the MHS project
particularly was obtained from published articles, books and reports and used to assess
what is already known about the ways in which these programmes are designed,
planned and implemented and what factors determine the degree to which they are
successful.
Part Two of the study focuses on the case studies. Chapter Four provides background
information on the case study area, ‘the Heart of Borneo’. The chapter starts by
describing the renewable energy policies and the implementation of MHS projects in
Malaysia and Indonesia and then follows with information regarding the geography
and demographic situations, current energy needs and resources in the area. Finally
Chapter 1: Introduction 12
existing MHS projects in both Ba’kelalan in Sarawak (Malaysia) and in Krayan, North
Kalimantan (Indonesia) are described.
Surveys of MHS users and stakeholders were carried out for the case studies using a
variety of quantitative and qualitative research methods and the results are presented in
Chapters Five and Six. Chapter Five presents the results for the Buduk Bui lokasi1 and
Buduk Nur lokasi in Ba’kelalan, Malaysia, while the results for the villages of Liang
Butan village and Tang Paye lokasi in Krayan, Indonesia are presented in Chapter Six.
Part Three comprises the discussion of the survey results and the conclusions drawn
from the study. In Chapter Seven, the results of the survey analysis are presented. The
analysis uses both quantitative and qualitative methods. The qualitative data is used to
assist in explaining the results obtained from the quantitative data. Chapter Seven
discusses the results of the analysis both per case study and in cross-case analysis to
provide a framework and a ‘whole picture’ of an MHS project undertaken in a remote
rural area. The goal of this framework is to inform those responsible for the planning
and implementation of MHS projects in remote rural areas how to increase the
likelihood of project success.
Chapter 8 presents the conclusions drawn from the study, reiterates its limitations and
suggests possibilities for further research in that would throw further light on the
research questions.
1 Lokasi is an Indonesian term referring to distinct areas where peoples are located. Within a lokasi there
may be several villages, also use in Malaysia.
Chapter 2: Methodology 13
Chapter 2
Methodology
Overview
This chapter outlines the methodological framework used to address the research
questions. The justification for approaching the research question through
interdisciplinary study and the use of case studies is described in detail. The conceptual
model used to guide data collection and analysis is described and the steps followed in
identifying survey respondents, selecting the sample and determining sample sizes
explained. Detail information on both quantitative and qualitative instruments used to
collect the data is also provided.
2.1 Introduction
In order to address the research questions and the complexity associated with the rural
electrification of micro hydro projects, an interdisciplinary approach was considered to
be necessary. To make best use of the rich information obtained through this
interdisciplinary approach, and tease out “how” and “why” MHS implementation in
rural areas is so varied, the core units of research are case studies. Four case studies,
two in Malaysia and two in Indonesia, were chosen in order to see the effects of
national policies and funding sources on the procedures of project planning,
implementation and management in an MHS. A government scheme in Buduk Nur and
a community-based project in Buduk Bui were chosen as case studies on the
Malaysian side, and on the Indonesian side of the border, Romayo I, funded by the
Government, and Tang Paye, a community-based project, were selected. Although the
Chapter 2: Methodology 14
Romayo I MHS was not working during the period when data was collected (as
explained in section 2.5.2), this MHS was retained as a case since this is the only MHS
in the study area that was funded by the Government of Indonesia (GOI).
Several different instruments (site observation, questionnaires, energy audits,
interviews, focus group discussion and documentation review) were used in field work
to collect both quantitative and qualitative data. Interviews were held with key
informants, including the headman, regional chief, representatives of funding bodies,
equipment manufacturer/distributors, and government agency staff members. A sample
of households connected to each of the four MHSs was randomly selected and the
householders were invited to participate in a survey. Questionnaires, including energy
audits, were distributed to the head of those households that agreed to participate. The
sample size for survey respondents in each case study was chosen to meet the
statistical significance requirements of a 10% margin of error and a 90% confidence
level.
The data was analysed using techniques appropriate to the type of data. Quantitative
data were analysed using Microsoft Excel and Statistical Package for the Social
Science (SPSS) software, while qualitative data were transcribed and used to address
questions of how and why a situation appears to have developed.
2.2 Interdisciplinary study
‘Multidisciplinary’ and ‘interdisciplinary’ are terms that have a fundamental difference
in meaning, but are frequently considered to be identical, or nearly the same. The term
“multidisciplinary” is most commonly applied to research in which a research team,
with members drawn from various academic disciplines, collaborates to study a topic
from the team members’ various perspectives, without much interaction between them.
Chapter 2: Methodology 15
Interdisciplinary research, on the other hand, refers to study that has a focus on the
research outcomes results obtained through integration of several disciplines (Snaz-
Menendez et al., 2001). An effective illustration to this difference suggested by Allen
Repko, is to consider a “bowl of fruit” as an image of the concept of
multidisciplinarity, and contrast that with the image of a fruit “smoothie” representing
interdisciplinarity (Repko, 2011). In the former, each discipline functions in its
distinct way, and the combined effect is only seen in the whole package (bowl),
whereas in the latter, the result is a new product.
To see how micro hydro technology is tailored for the needs of a particular
community, technical factors, including the design, load distribution, process of
knowledge transfer and operation and maintenance (O&M), all need to be assessed.
However, other aspects of the system and its setting, such as social, economic,
environmental, organisational and political issues, also need to be investigated. In this
research, the social factors driving the community’s role in project conception and
inception, as well as the MHS impact and community perception of the project were
investigated. The economic aspects of the investigation focused on the ongoing costs
of operating and maintaining the systems in those cases in which the responsibility for
O&M of the MHS is handed over to the community. The project also examined the
economic benefits of MHSs, particularly in relation to the productive use of energy
from the systems. All of these aspects are closely related to the institutional
arrangements and the leadership provided by the key stakeholders involved in the
projects.
Some of these key aspects are influenced by government policies, not only those
relating directly to the energy sector, but also other policies relating to rural
development more generally. The four different case studies are compared to examine
Chapter 2: Methodology 16
the roles of these policies. Some of the issues that arise from the case studies need to
be examined in the interdisciplinary way already described. These issues were
evaluated as part of a rigorous and holistic attempt to understand the key factors for
MHS implementation in remote rural areas. Table 2.1 shows some of the relationships
between the various academic disciplines and the issues of primary interest in this
study.
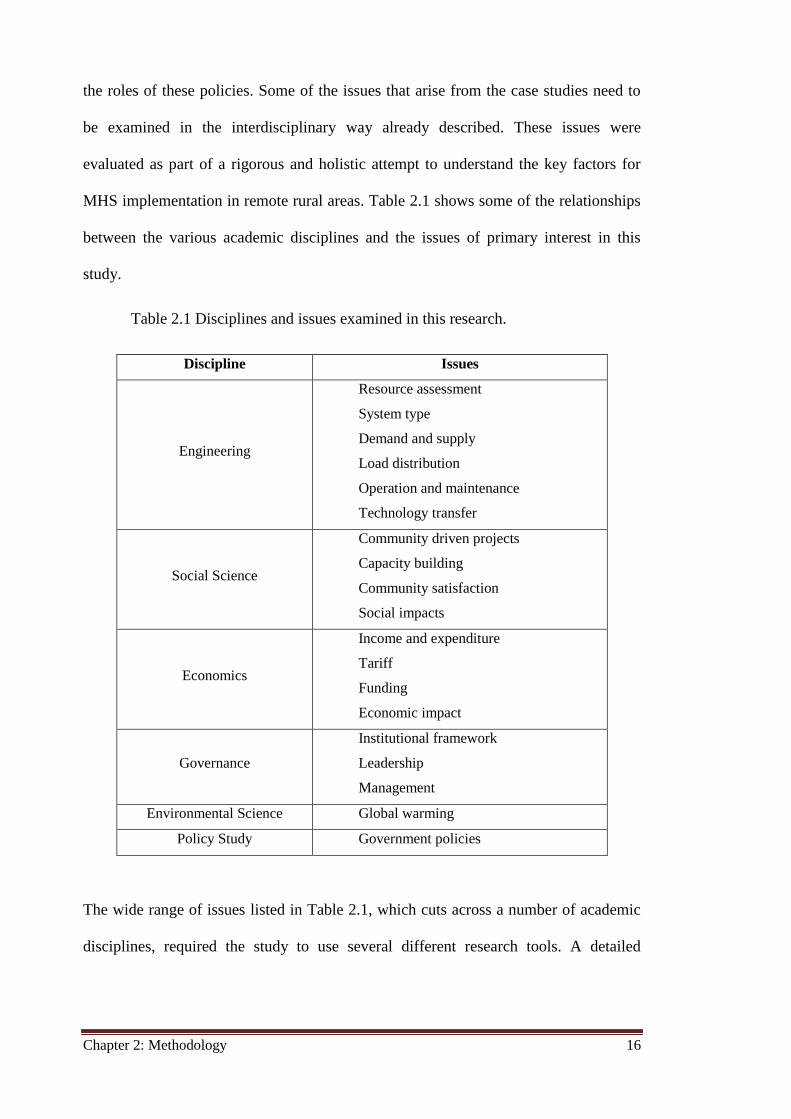
Table 2.1 Disciplines and issues examined in this research.
Discipline Issues
Engineering
Resource assessment
System type
Demand and supply
Load distribution
Operation and maintenance
Technology transfer
Social Science
Community driven projects
Capacity building
Community satisfaction
Social impacts
Economics
Income and expenditure
Tariff
Funding
Economic impact
Governance
Institutional framework
Leadership
Management
Environmental Science Global warming
Policy Study Government policies
The wide range of issues listed in Table 2.1, which cuts across a number of academic
disciplines, required the study to use several different research tools. A detailed
Chapter 2: Methodology 17
description of these tools is presented in the following sections, which explain the
research design.
2.3 Conceptual model for analysis
The construction of any MHS in a village is a unique process, with a defined timescale
and budget, and it is conceptualised as a project. As a project, the development of
MHS has four management stages: conception phase, definition phase, execution
phase and operation, maintenance and evaluation phase (Nicholas, 2004). Gransberg
and Ellicott (1997) suggest that the procurement of a project can be further split into
five phases: concept, design and feasibility study, construction, commissioning, close
out and warranty activities.
In each of the four case studies of this research, the MHS project received funding
from a sponsor or some other party. This created a need for effective fund management
to deal with the specific challenges with respect to governance, accountability,
compliance and efficiency in the fund life cycle. Price Waterhouse Cooper (PWC)
(n.d.) proposed a fund life cycle that includes assess, design, set-up, operate and
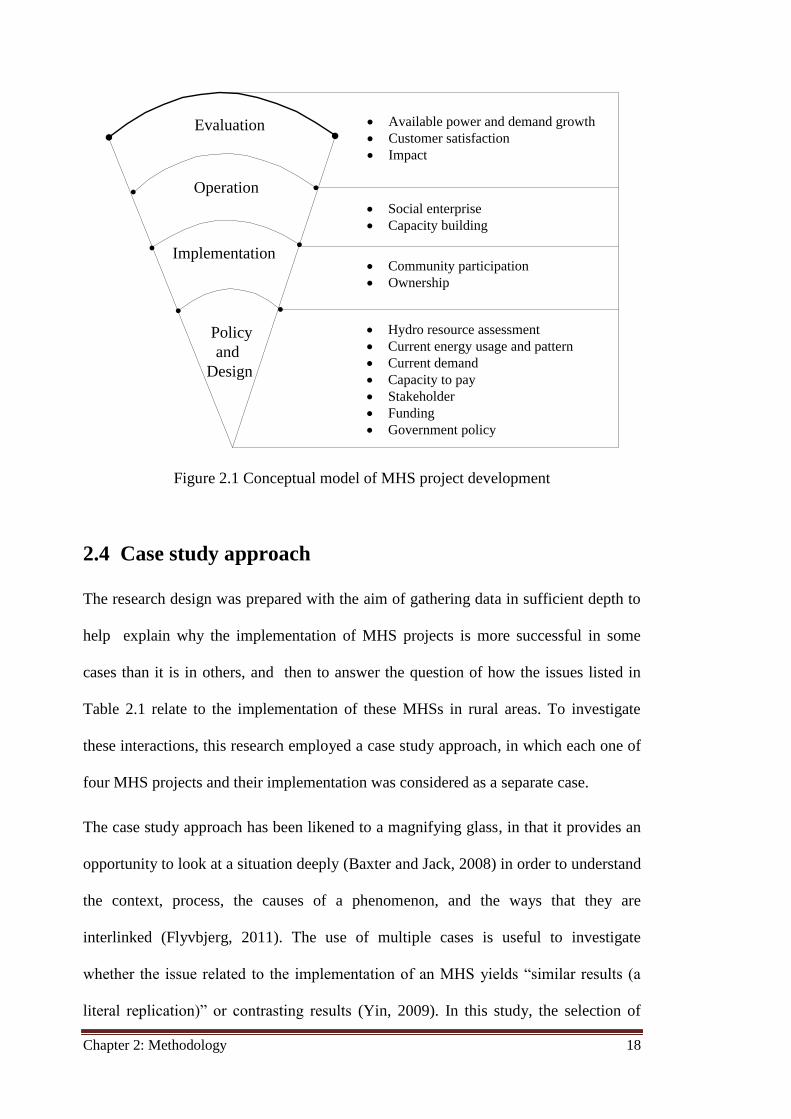
improve, and exit. This research proposed a conceptual model for MHS Project
Development (Figure 2.1) that could be used for analysing the data. The main
components of this model are policy and design, implementation, operation, and
evaluation. The issues of importance when considering MHS project implementation
listed in Table 2.1 were allocated to the relevant phase or component of this model
(Figure 2.1).
Chapter 2: Methodology 18
Policy
and
Design
Implementation
Operation
Evaluation
· Hydro resource assessment
· Current energy usage and pattern
· Current demand
· Capacity to pay
· Stakeholder
· Funding
· Government policy
· Community participation
· Ownership
· Social enterprise
· Capacity building
· Available power and demand growth
· Customer satisfaction
· Impact
Figure 2.1 Conceptual model of MHS project development
2.4 Case study approach
The research design was prepared with the aim of gathering data in sufficient depth to
help explain why the implementation of MHS projects is more successful in some
cases than it is in others, and then to answer the question of how the issues listed in
Table 2.1 relate to the implementation of these MHSs in rural areas. To investigate
these interactions, this research employed a case study approach, in which each one of
four MHS projects and their implementation was considered as a separate case.
The case study approach has been likened to a magnifying glass, in that it provides an
opportunity to look at a situation deeply (Baxter and Jack, 2008) in order to understand
the context, process, the causes of a phenomenon, and the ways that they are
interlinked (Flyvbjerg, 2011). The use of multiple cases is useful to investigate
whether the issue related to the implementation of an MHS yields “similar results (a
literal replication)” or contrasting results (Yin, 2009). In this study, the selection of
Chapter 2: Methodology 19
four cases with some key differences (scale, the national policy context and funding
source) was used to maximise the opportunities for these similarities and contrasts to
emerge between cases.
One way in which this study attempted to increase the reliability of comparative
analysis of the cases was to use a common survey instrument to collect the main data.
A survey is a good tool that allows controllability, deductibility, repeatability across
each case study (Gable, 1994). In order to build a case study, this survey engaged both
quantitative and qualitative approaches using different data collection instruments,
including site observations, questionnaires, energy audits, interviews, and focus group
discussions. This combination enables the researcher to gather data from a variety of
sources with different points of view, so that light will be shed on the research question
from many angles or, as Baxter and Jack (2008 p.544) have phrased it, to
“see…through a variety of lenses”.
The important step when using a multi-case method is the convergence of the data to
obtain an overall understanding of MHS projects rather than the individual case
studies. That is, to identify the important or contributing factors that influence the
individual case study and to then determine the degree to which that factor is also a
contributing factor in the other case studies (Baxter and Jack, 2008). This means that in
the analysis stage, each of the case studies needs to be treated as a single case, while
the conclusions are built using the combined information.
The MHSs used for the case studies were selected on the basis of information obtained
from a preliminary fieldtrip undertaken in 2009. At that time four (4) MHSs had been
established in Ba’kelalan, Sarawak, and each one of these had used funding obtained
from a different source: government, NGO, community-based and private. Four MHSs
Chapter 2: Methodology 20
had also been installed in Krayan, North Kalimantan, two of which were funded by the
government and the two of which were community-based projects.
The MHS projects selected as case studies were chosen to maximise the possibility of
being able to detect any effects of different national policies and funding source on the
procedures used in project planning, implementation and management. In Ba’kelalan,
on the Malaysian side of the border, the two cases chosen were a government MHS
project in Buduk Nur lokasi and a community based project in Buduk Bui lokasi. On
the Indonesian side, the two cases chosen were Romayo I, a government-funded
project serving three lokasi in the Krayan sub-district (Pa Betung, Kampung Baru and
Long Bawan), and a community-based MHS project in Tang Paye lokasi.
During the preliminary field survey, the Romayo I MHS was operating as designed.
During the two subsequent field visits and the period between the two field trips,
however, that particular MHS was not operating due to alternator failure. The MHS
was nonetheless retained as a case study as it is the only government MHS in the
Krayan area.
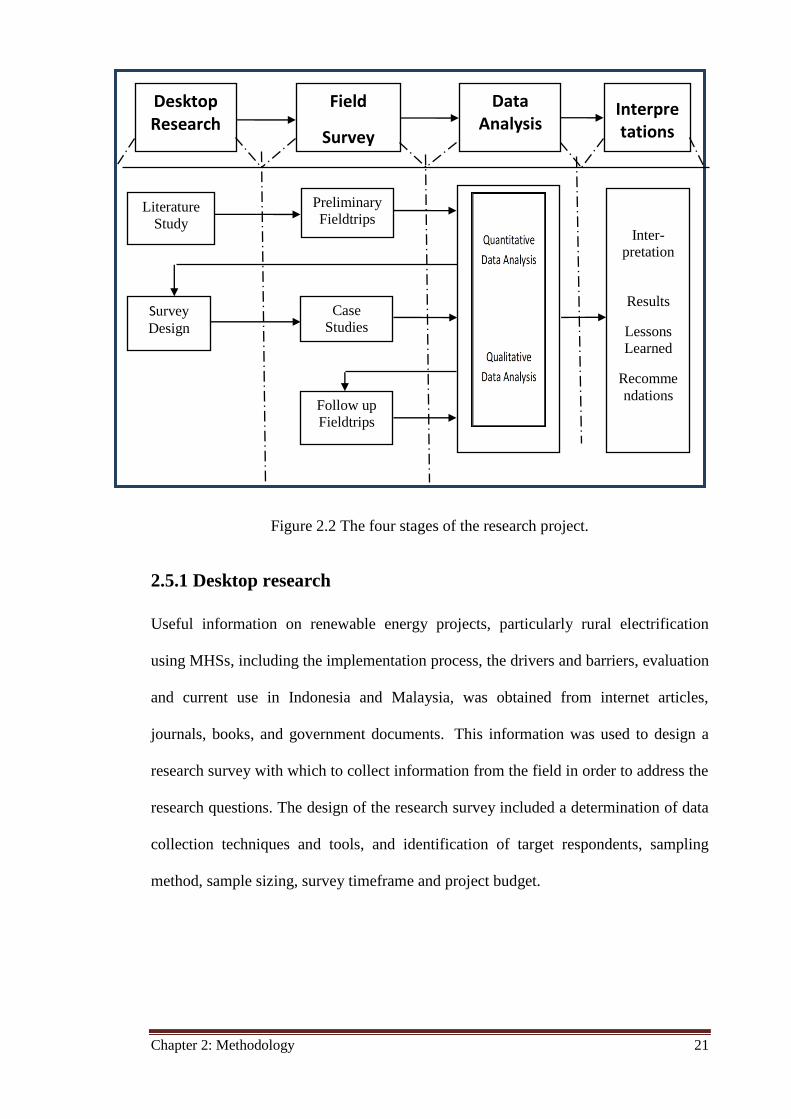
2.5 Stages in the research project
The research activities undertaken in this study were undertaken in four stages, which
are shown diagrammatically in Figure 2.2 and are explained in detail in the following
sections.
Chapter 2: Methodology 21
Figure 2.2 The four stages of the research project.
2.5.1 Desktop research
Useful information on renewable energy projects, particularly rural electrification
using MHSs, including the implementation process, the drivers and barriers, evaluation
and current use in Indonesia and Malaysia, was obtained from internet articles,
journals, books, and government documents. This information was used to design a
research survey with which to collect information from the field in order to address the
research questions. The design of the research survey included a determination of data
collection techniques and tools, and identification of target respondents, sampling
method, sample sizing, survey timeframe and project budget.
Literature Study
Preliminary
Fieldtrips
Survey
Design
Case
Studies
Follow up
Fieldtrips
Inter-
pretation
Results
Lessons
Learned
Recomme
ndations
Interpretations
Data Analysis
Field
Survey
Desktop Research
Chapter 2: Methodology 22
2.5.2 Field survey
The survey was conducted over the course of a number of field trips undertaken during
the period from September 2009 to March 2012. In September – October 2009, a
preliminary fieldtrip was used to identify the renewable energy projects that already
existed in the research area. Information on the financial arrangements and the
community involvement in these projects was also obtained. A prototype questionnaire
was field tested by distributing copies to 15 respondents in the Buduk Nur lokasi in
Malaysia and 5 respondents in Long Bawan lokasi in Indonesia.
The questionnaire was revised on the basis of the information gathered in the
preliminary fieldtrip. In particular, the language of the questionnaire was simplified in
order to be more appropriate to the target community’s literacy level. The field test
also demonstrated that the respondents preferred the questionnaire to be administered
verbally, rather than requiring respondents to fill in their own responses. This finding
was valuable in planning the length of subsequent fieldtrips. Based on the information
obtained from the preliminary fieldtrip, the case study method with four cases was
chosen rather than attempting to investigate all the existing MHSs in the research area,
as that would not have been realistic in the timeframe of a Ph.D. study.
The main body of data for the case studies was collected in field research conducted
from October to December 2010; using different techniques to obtain as much
information as possible, including site observations, questionnaires, energy audits, and
interviews. The survey was conducted largely as planned, but required a degree of
adaptation due to the unpredictability of actual conditions in the field. For instance,
schedules were rearranged due to weather constraints and local people sometimes
suggested alternate respondents be consulted as key informants for the research.
Chapter 2: Methodology 23
The main drivers behind the decision to conduct a third fieldtrip were the need to
clarify some data obtained during the second fieldtrip and the hope of capturing some
data relating to the operation of the Romayo I MHS. Unfortunately, the alternator of
the Romayo I MHS had not been repaired at the time that the third fieldtrip was
undertaken. The Romayo I MHS was kept as a case study due to its importance as a
government project and the information gathered from the villagers relating to when
the Romayo I MHS was working was considered to be relevant and useful. Another
driver for the follow-up fieldtrip was a reply received from a Malaysian government
official (national level) agreeing to be interviewed. The third fieldtrip took place in
February and March, 2012.
2.6 Field survey techniques
The following data collection techniques were applied during the field survey:
· Site observations,
· Questionnaires for householders,
· Energy audits,
· Interviews with key informants
· Focus group discussions
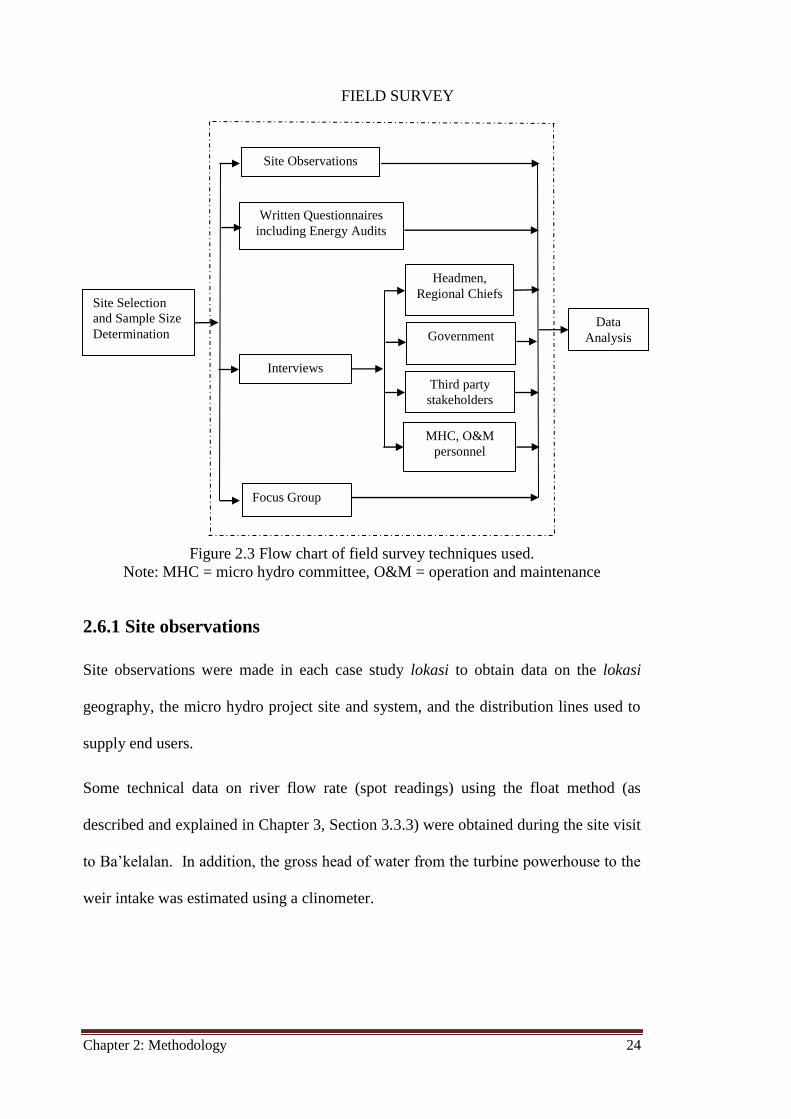
Figure 2.3 shows the detailed activities undertaken during the field survey, with the
field survey techniques highlighted within the dotted boundary area of Figure 2.3.
Chapter 2: Methodology 24
Figure 2.3 Flow chart of field survey techniques used.
Note: MHC = micro hydro committee, O&M = operation and maintenance
2.6.1 Site observations
Site observations were made in each case study lokasi to obtain data on the lokasi
geography, the micro hydro project site and system, and the distribution lines used to
supply end users.
Some technical data on river flow rate (spot readings) using the float method (as
described and explained in Chapter 3, Section 3.3.3) were obtained during the site visit
to Ba’kelalan. In addition, the gross head of water from the turbine powerhouse to the
weir intake was estimated using a clinometer.
Site Observations
Site Selection
and Sample Size
Determination
Third party
stakeholders
Headmen,
Regional Chiefs
Data
Analysis
Interviews
Written Questionnaires
including Energy Audits
Government
MHC, O&M
personnel
Focus Group
FIELD SURVEY
Chapter 2: Methodology 25
2.6.2 Householder survey questionnaire
A questionnaire written in Bahasa Indonesian2 was used in this study to obtain
information from householders. The questionnaire covered seven key areas:
background information, energy audit, energy vulnerability, current renewable energy
projects, further renewable energy projects and expectations. The questionnaire used
different types of questions, including dichotomous (yes/no) questions (Research
Methods Knowledge Base, n.d) multiple choice questions, typical five-level Likert-
scale questions (strongly disagree, disagree, neither agree nor disagree, agree, strongly
agree) and open-ended questions. The wide range of question type allowed as much
data as possible to be obtained and gave respondents (the heads of the sample of
households) the opportunity to express their opinions on particular matters.
While initially designed so that respondents would enter the data themselves, the
questionnaire was modified in consideration of the relatively low literacy rates among
respondents. The questionnaire was administered verbally by the researcher using the
written questions. Respondents often required explanations to ensure that they
understood what the questions were asking. One benefit of this conversational method
of administering the questionnaire was that the respondents often felt free to express
their opinions and provided valuable additional information that helped the researcher
understand the situation in each lokasi.
2.6.3 Household energy audits
A household energy audit was conducted at the time of the survey visit to obtain data
on household current energy use and load profiles. A stock take of appliances owned
and used by the householders, including the power rating of each appliance, the most
2 The official languages (bahasa) of Indonesia and Malaysia are almost identical and one is readily
understood by speakers of the opposite language.
Chapter 2: Methodology 26
common time of day the appliance was used and the frequency and duration of use,
were included in the audit. Normally such an audit involves visual inspection of the
appliances and their technical specification plates. However, in some households,
respondents were reluctant to consent to the researcher examining their appliances.
This may have been due to their desire for privacy, but it is also possible that those
households were using power from the MHS to operate appliances additional to the
lights and television set approved by their micro hydro committee (MHC). To respect
the respondents’ wishes, 40% of the energy audits were limited to the inventory of
appliances provided by the respondents.
2.6.4 Key informant interviews
Due to the wide range of respondents to be interviewed, a semi-structured interview
format was used as a tool to ask key informants similar questions, while permitting
flexibility of dialogue. All the key informants were asked similar questions, which
proved to be helpful in analysing the data for recurring themes and for the triangulation
of responses. Key informants were also asked some more specialised questions that
specifically related to their particular role(s) in the MHS project. All interviews were
recorded with the interviewees’ consent, and all recorded interviews were transcribed.
2.6.5 Focus group discussions
When analysing data from the early field trip, it was observed that in Buduk Bui and
Buduk Nur most of the power produced by the MHS during daytime was not being
utilised and was instead being dumped. In order to explore the possible options for
utilising the excess power produced during the non-peak periods, a focus group
discussion, with participation from the village headman, MHC and the technician, was
Chapter 2: Methodology 27
held in Buduk Nur during the follow-up fieldtrip. Due to time constraints, the focus
group discussion could not be held in Buduk Bui. Instead, members of the MHC in
Buduk Bui were individually interviewed in order to obtain data on that issue.
2.7 Target respondent group
For each of the case studies, a sample of householders living in premises connected to
the MHS was surveyed, and the head of the household was the targeted respondent for
the questionnaire used in this survey. In this culture the head of the household is man
that meant that the targeted respondents were all male.In addition since the males of
the village were involved in fulfilling the household energy requirement e.g collecting
the wood, planning the budget for the household etc. they were seen to be the people
who would have best knowledge on household energy use. Since, in most of the lokasi
the head of the household was involved in working in the fields, administering the
questionnaire was planned to be undertaken during the seasonal quiet time after
planting. However, some of the household heads had off-farm jobs or travelled during
this “down” time. Consequently it was difficult to meet with all of the household heads
identified as participants in the questionnaire. In these cases, next senior person,
usually the wife of the head of household, was recruited as the respondent. In addition
to the household respondents to the questionnaire, other stakeholders in each of the
MHS projects were interviewed in their capacity as key informants. The key
informants included:
· The village headmen,
· The Regional Chief: Penghulu or Ketua Adat,
· Representatives of government agencies with responsibility for energy policy
and/or rural electrification programs (e.g. Ministry of Energy, Ministry of
Chapter 2: Methodology 28
Rural Development, Ministry of Transmigration, and Ministry of
Disadvantaged Areas),
· Representatives of government departments at various levels, including sub-
district, regency, provincial/state and national levels,
· The staff of the public health clinic in Buduk Nur,
· Electricity authorities (Sarawak Energy Berhard (SEB) and Indonesia National
Electricity Board (PLN)),
· Third party stakeholders in the micro hydro projects, including manufacturers
or suppliers and funding agencies (e.g. PNPM, IMIDAP),
· The lokasi micro hydro committees (MHCs) and O&M personnel.
2.8 Sample size
Accurate data can be obtained by surveying the entire population, but for large
populations such an approach is impractical or infeasible due to cost and time
constraints (Gleason, 1981; Langley, 1970). This is the situation with each of the case
studies in this research and sample households were surveyed in each of the lokasi, the
samples being selected to be as representative of the population as possible.
Choosing the sampling method and determining the sample size are important to
ensure the accuracy of the data. Determining an appropriate sample size that
statistically represents the population accurately and avoids wasting resources (time
and money) is critical in the research survey design. This study employed the stratified
random sampling technique, a method that groups members of a population into strata,
and then takes samples from each stratum (Lapin, 1980).
The population in each case was all of the households in the lokasi. Considering the
time and budget constraints, this study applied a margin of error of 10% and a level of
confidence of 90%, except in Buduk Nur, where the sample achieved 10% margin of
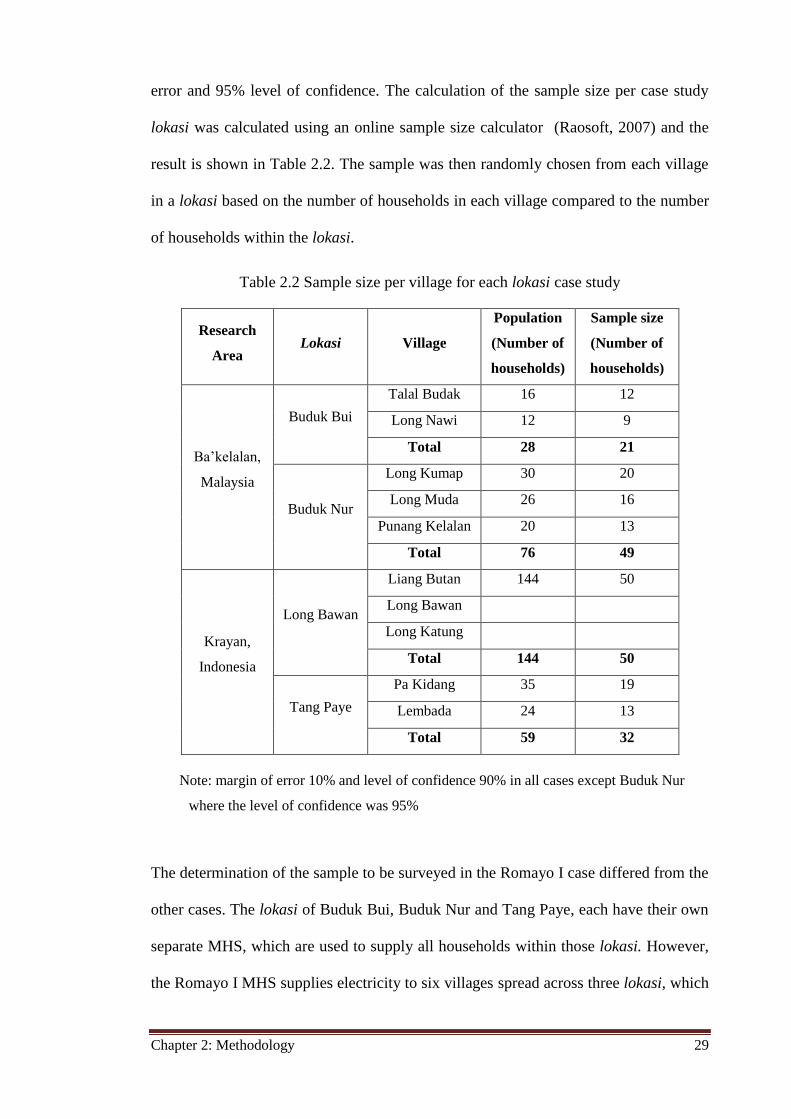
Chapter 2: Methodology 29
error and 95% level of confidence. The calculation of the sample size per case study
lokasi was calculated using an online sample size calculator (Raosoft, 2007) and the
result is shown in Table 2.2. The sample was then randomly chosen from each village
in a lokasi based on the number of households in each village compared to the number
of households within the lokasi.
Table 2.2 Sample size per village for each lokasi case study
Research
Area Lokasi Village
Population
(Number of
households)
Sample size
(Number of
households)
Ba’kelalan,
Malaysia
Buduk Bui
Talal Budak 16 12
Long Nawi 12 9
Total 28 21
Buduk Nur
Long Kumap 30 20
Long Muda 26 16
Punang Kelalan 20 13
Total 76 49
Krayan,
Indonesia
Long Bawan
Liang Butan 144 50
Long Bawan
Long Katung
Total 144 50
Tang Paye
Pa Kidang 35 19
Lembada 24 13
Total 59 32
Note: margin of error 10% and level of confidence 90% in all cases except Buduk Nur
where the level of confidence was 95%
The determination of the sample to be surveyed in the Romayo I case differed from the
other cases. The lokasi of Buduk Bui, Buduk Nur and Tang Paye, each have their own
separate MHS, which are used to supply all households within those lokasi. However,
the Romayo I MHS supplies electricity to six villages spread across three lokasi, which
Chapter 2: Methodology 30
together comprise a total of 430 households. With the Romayo I MHS was not
working at the time that the household surveys were administered, the questionnaire
was not administered to households of all six villages electrified by Romayo I MHS,
but was distributed in Liang Butan village only. The rationale for this decision was that
the population served by this particular MHS is two to five times that of the other case
study populations (Table 2.2). Liang Butan is the largest of the villages served by the
Romayo I MHS. It is also located at the farthest end of the electricity line from that
generator so can be considered the most vulnerable or extreme case (Flyvbjerg, 2011)
within the larger case of the Romayo I MHS. A random sample of households from
Liang Butan was thus chosen for participation in the survey.
2.9 Ethical conduct of the research
To comply with the National Statement on Ethical Conduct in Human Research
(Australian Government, 2013), approval from the Murdoch University Ethics
Committee was compulsory for this study. This approval was granted and was
reviewed annually.
To ensure that all participants’ involvement in this study was voluntary, an information
letter was provided to the potential recruit and his/her consent was requested and
obtained before each interview, questionnaire or energy audit was undertaken.
Interviews were recorded only if the interviewees consented to this. In the case that an
interviewee did not consent to his/her voice being recorded, hand written notes of the
interview were made instead. While the participants were informed of their right to
withdraw from the study at any stage, none did so.
All data obtained is stored electronically and will be held by the University for five
years from the completion of the research study.
Chapter 2: Methodology 31
2.10 Data analysis
Using the conceptual model shown in Figure 2.1, the analysis of the data was based on
the type of data, and in particular whether it was quantitative or qualitative.
Quantitative data received in response to the questionnaire was analysed using the
SPSS software (Green et al., 2000; Mujis, 2004). The results of the SPSS frequency
analysis, were used to understand the demographic profile of the households and their
incomes and expenditures, particularly their energy expenses. Data from the energy
audits, such as household energy consumption, average daily load and daily load
pattern, were analysed using MS Excel, which was convenient for performing
calculations and using graphs to visualise the data in a presentable way.
Qualitative data from both the questionnaires and the interviews were transcribed,
translated into English and analysed. This qualitative data helped to explain the
quantitative data, providing insights into how and why the phenomena occurred. The
qualitative data analysis was undertaken in two ways: Firstly, case studies were
analysed to identify in-depth correlations between issues (Table 2.1) in each case
study. Secondly, all case studies were also examined using cross-case analysis in order
to understand the similarities and differences of the correlations between issues among
the case studies following the approach proposed by Yin (2009).

Chapter 2: Methodology 32
Chapter 3: The Literature Review 33
Chapter 3
The Literature Review
Overview
A comprehensive review of published articles, books and reports in the field of
renewable energy electrification programs in developing countries was undertaken as a
part of this study in order to understand what is already known about the ways in
which these programmes are designed, planned and implemented and what factors
determine the degree to which they are successful. The results of the literature review
are presented in three parts.
The first section summarises the findings of the literature relating the use of renewable
electrification programs in developing countries.
Because the case studies used in this research are located in Malaysia and Indonesia
and both of these two countries are members of the Association of South-East Asian
Nations (ASEAN), the second section covers the energy policies of and renewable
energy electrification programs undertaken in countries within the ASEAN region.
The third section focuses on rural electrification program based on the use of micro-
hydro systems (MHSs) including the technical, economic, social and environmental
issues associated with programs that use this technology and that previous research and
reports have identified as issues that need to be considered in designing a village-scale
hydro power project in remote and rural areas and the barriers to the successful
implementation of MHS projects.
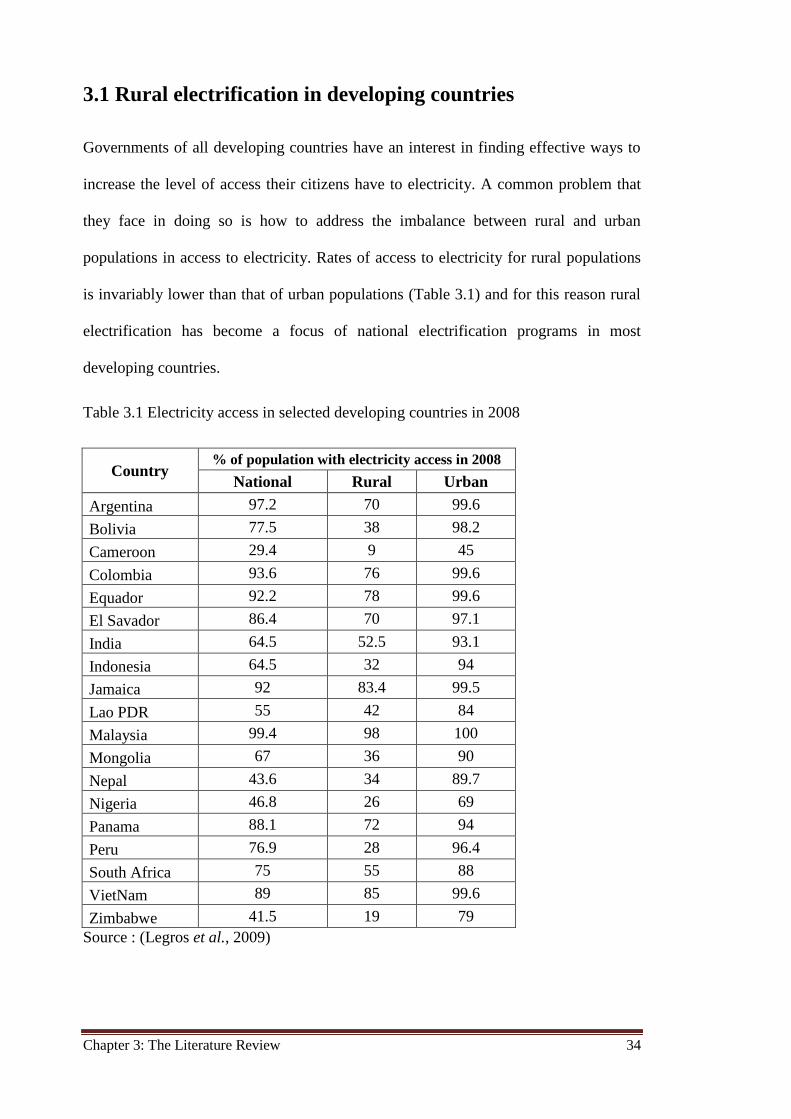
Chapter 3: The Literature Review 34
3.1 Rural electrification in developing countries
Governments of all developing countries have an interest in finding effective ways to
increase the level of access their citizens have to electricity. A common problem that
they face in doing so is how to address the imbalance between rural and urban
populations in access to electricity. Rates of access to electricity for rural populations
is invariably lower than that of urban populations (Table 3.1) and for this reason rural
electrification has become a focus of national electrification programs in most
developing countries.
Table 3.1 Electricity access in selected developing countries in 2008
Country % of population with electricity access in 2008
National Rural Urban
Argentina 97.2 70 99.6
Bolivia 77.5 38 98.2
Cameroon 29.4 9 45
Colombia 93.6 76 99.6
Equador 92.2 78 99.6
El Savador 86.4 70 97.1
India 64.5 52.5 93.1
Indonesia 64.5 32 94
Jamaica 92 83.4 99.5
Lao PDR 55 42 84
Malaysia 99.4 98 100
Mongolia 67 36 90
Nepal 43.6 34 89.7
Nigeria 46.8 26 69
Panama 88.1 72 94
Peru 76.9 28 96.4
South Africa 75 55 88
VietNam 89 85 99.6
Zimbabwe 41.5 19 79
Source : (Legros et al., 2009)
Chapter 3: The Literature Review 35
The two strategies available to governments to increase rural electrification rates are to
extend the main grids, increasing the areas that they cover and the use of stand-alone,
off-grid, small generation systems. Most rural households are clustered in small groups
that do not have the scale to justify investment in extending the grid to them. They are
often located long distances away from the grid. This means that providing these
communities with access to electricity by extending the national grid is either
technically impractical or is cost prohibitive, or both. In these situations, the alternative
option of using stand-alone power supply systems often represents the more practical
and lower cost option.
In implementing this option many of the systems deployed have been small diesel or
petrol generators. The use of diesel or petrol generators renders these communities
highly vulnerable to oil price rises, which are unpredictable and can be rapid and large.
These communities therefore tend to be keen to exploit any opportunities for
generating electricity from renewable energy resources as they are both free and are
locally available (Zahnd et al., 2006).
The governments of many developing countries have developed national renewable
energy rural electrification programs. In India, for example, a number of policies are
aimed at promoting renewable energy. There is a separate ministry responsible for
renewable energy, the Ministry of New & Renewable Energy (MNRE), which
encourages both the public and private sectors to develop small hydro projects (SHPs)
and offers financial support. To date, the government has supported the construction
of 228 SHPs with a combined total capacity of 1,230 MW, all of which have been
developed by entrepreneurs who perceived them to be attractive business opportunities
(Saxena and Kumar, 2010). In 2010, the total installed SHP capacity was 2,820 MW,
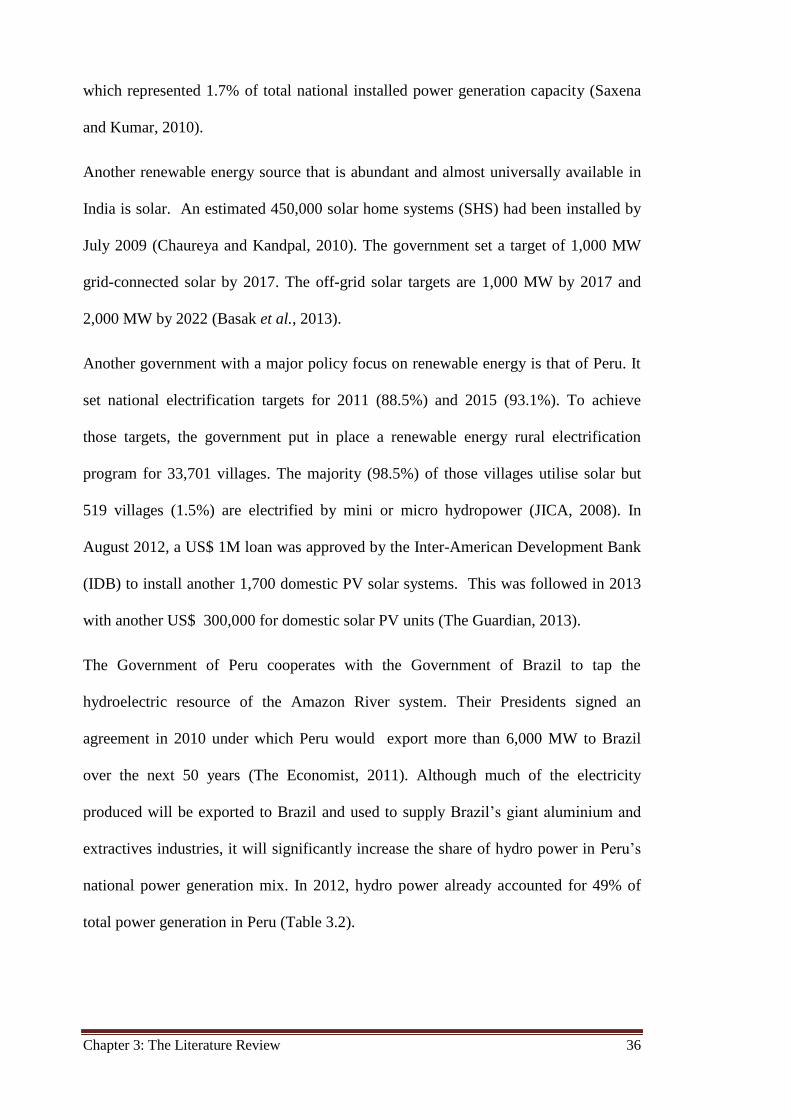
Chapter 3: The Literature Review 36
which represented 1.7% of total national installed power generation capacity (Saxena
and Kumar, 2010).
Another renewable energy source that is abundant and almost universally available in
India is solar. An estimated 450,000 solar home systems (SHS) had been installed by
July 2009 (Chaureya and Kandpal, 2010). The government set a target of 1,000 MW
grid-connected solar by 2017. The off-grid solar targets are 1,000 MW by 2017 and
2,000 MW by 2022 (Basak et al., 2013).
Another government with a major policy focus on renewable energy is that of Peru. It
set national electrification targets for 2011 (88.5%) and 2015 (93.1%). To achieve
those targets, the government put in place a renewable energy rural electrification
program for 33,701 villages. The majority (98.5%) of those villages utilise solar but
519 villages (1.5%) are electrified by mini or micro hydropower (JICA, 2008). In
August 2012, a US$ 1M loan was approved by the Inter-American Development Bank
(IDB) to install another 1,700 domestic PV solar systems. This was followed in 2013
with another US$ 300,000 for domestic solar PV units (The Guardian, 2013).
The Government of Peru cooperates with the Government of Brazil to tap the
hydroelectric resource of the Amazon River system. Their Presidents signed an
agreement in 2010 under which Peru would export more than 6,000 MW to Brazil
over the next 50 years (The Economist, 2011). Although much of the electricity
produced will be exported to Brazil and used to supply Brazil’s giant aluminium and
extractives industries, it will significantly increase the share of hydro power in Peru’s
national power generation mix. In 2012, hydro power already accounted for 49% of
total power generation in Peru (Table 3.2).
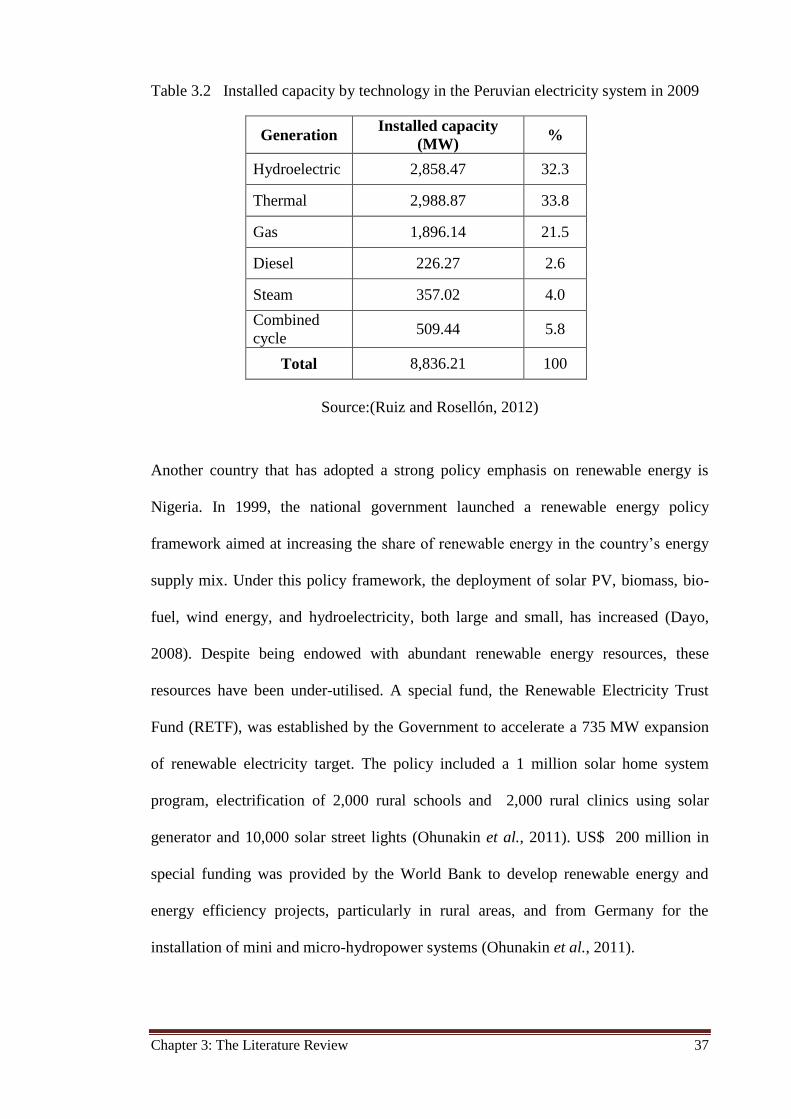
Chapter 3: The Literature Review 37
Table 3.2 Installed capacity by technology in the Peruvian electricity system in 2009
Generation Installed capacity
(MW) %
Hydroelectric 2,858.47 32.3
Thermal 2,988.87 33.8
Gas 1,896.14 21.5
Diesel 226.27 2.6
Steam 357.02 4.0
Combined
cycle 509.44 5.8
Total 8,836.21 100
Source:(Ruiz and Rosellón, 2012)
Another country that has adopted a strong policy emphasis on renewable energy is
Nigeria. In 1999, the national government launched a renewable energy policy
framework aimed at increasing the share of renewable energy in the country’s energy
supply mix. Under this policy framework, the deployment of solar PV, biomass, bio-
fuel, wind energy, and hydroelectricity, both large and small, has increased (Dayo,
2008). Despite being endowed with abundant renewable energy resources, these
resources have been under-utilised. A special fund, the Renewable Electricity Trust
Fund (RETF), was established by the Government to accelerate a 735 MW expansion
of renewable electricity target. The policy included a 1 million solar home system
program, electrification of 2,000 rural schools and 2,000 rural clinics using solar
generator and 10,000 solar street lights (Ohunakin et al., 2011). US$ 200 million in
special funding was provided by the World Bank to develop renewable energy and
energy efficiency projects, particularly in rural areas, and from Germany for the
installation of mini and micro-hydropower systems (Ohunakin et al., 2011).
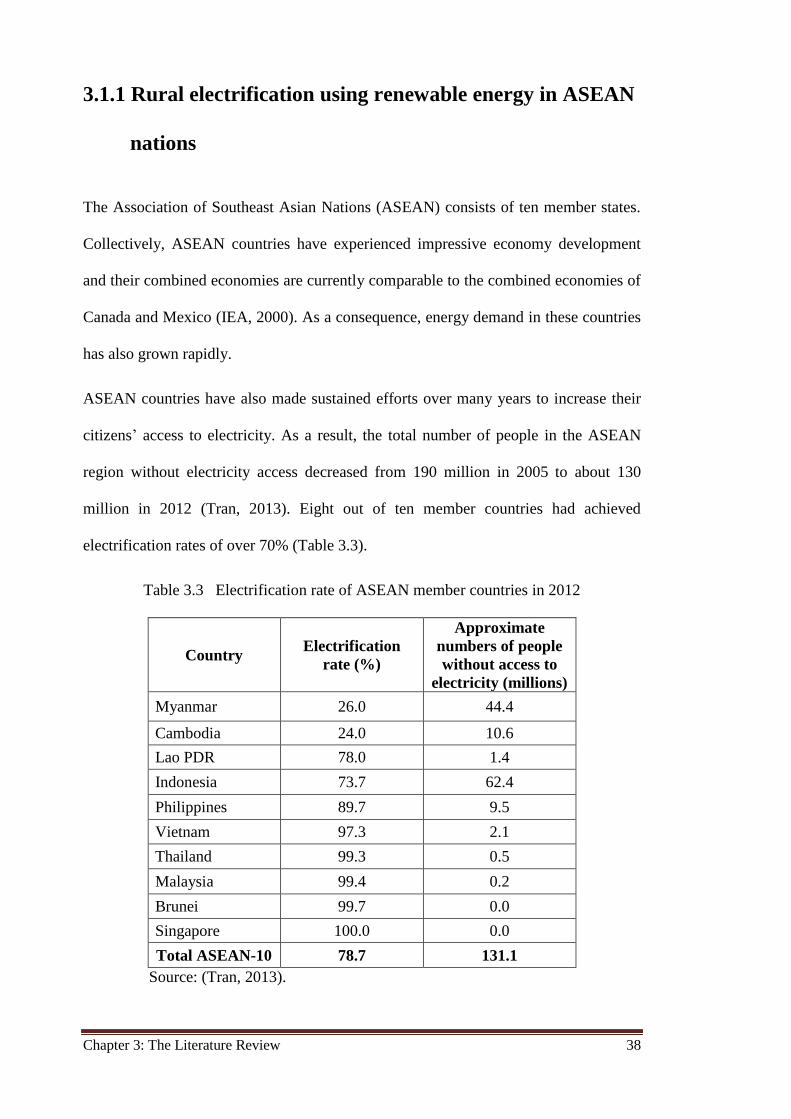
Chapter 3: The Literature Review 38
3.1.1 Rural electrification using renewable energy in ASEAN
nations
The Association of Southeast Asian Nations (ASEAN) consists of ten member states.
Collectively, ASEAN countries have experienced impressive economy development
and their combined economies are currently comparable to the combined economies of
Canada and Mexico (IEA, 2000). As a consequence, energy demand in these countries
has also grown rapidly.
ASEAN countries have also made sustained efforts over many years to increase their
citizens’ access to electricity. As a result, the total number of people in the ASEAN
region without electricity access decreased from 190 million in 2005 to about 130
million in 2012 (Tran, 2013). Eight out of ten member countries had achieved
electrification rates of over 70% (Table 3.3).
Table 3.3 Electrification rate of ASEAN member countries in 2012
Country Electrification
rate (%)
Approximate
numbers of people
without access to
electricity (millions)
Myanmar 26.0 44.4
Cambodia 24.0 10.6
Lao PDR 78.0 1.4
Indonesia 73.7 62.4
Philippines 89.7 9.5
Vietnam 97.3 2.1
Thailand 99.3 0.5
Malaysia 99.4 0.2
Brunei 99.7 0.0
Singapore 100.0 0.0
Total ASEAN-10 78.7 131.1
Source: (Tran, 2013).
Chapter 3: The Literature Review 39
In their efforts to increase access to electricity, most of ASEAN member states have
renewable energy projects, as they are endowed with significant renewable energy
sources, including solar, wind, hydro, biomass and geothermal (Table 3.4).
However, the utilisation of renewable resources by ASEAN countries remains
relatively low and varies significantly from one country to another. In regard to solar
power, ASEAN countries are located in a tropical region and all have high levels of
solar radiation (the average daily solar radiation being greater than 4.5 kWh/m2)
(Lidula et al., 2007). Of the ASEAN member states, Thailand has the largest total
installed solar power capacity, but even in that country installed capacity is only 6 MW
(Table 3.4).
Table 3.4 ASEAN renewable energy resources and utilisation
Note: The unit for solar radiation is number of hours of sunshine per day
Sources: (Karki et al., 2005; Lidula et al., 2007; Hasan et al., 2012)
The ASEAN countries with significant wind resources are Cambodia, Laos,
Philippines, Thailand and Vietnam, but installed capacity is currently less than 5% of
the full economic potential. Laos, Indonesia, Malaysia, the Philippines, Thailand and
Vietnam also have significant hydro- resources, but less than 20% of the potentially
exploitable resources have been harnessed (Table 3.4) so far.
Resources Utilization Resources Utilization Resources Utilization Resources Utilization Resources Utilization
Cambodia 5 (6-9 h) 700 kW 120 10,300 21 700
Indonesia 4.8 5 MW 0.5 27,000 802 75,000 5420 49,810 312
Lao PDR 4.5 - 4.7 285 kW 2.7 18,000 1515
Malaysia 4.5 1.5 MWp 0.15 29,000 2184 29,000 211
The Philippines 5.1 1 MW 7404 1.18 2,600 1,931 13,097 2,867 20
Thailand 5.1 6 MW 52 0.5 5.3 1 700 139 7,000 560
Vietnam 5 (4 - 5.9 h) 0.6 MW 8.7 340 2,750 265 50 50
Biomass (MW)
Country
Solar (kWh/m2) Wind (MW) Geothermal (MW) Hydropower (MW)
Chapter 3: The Literature Review 40
Most ASEAN countries produce significant quantities of agricultural waste, including
rice husk, rice straw, bagasse and oil palm waste, but the utilisation of these crop waste
biomass resources for electricity generation remains very low.
Among the ASEAN countries Indonesia has the largest geothermal resources.
However, only 3% of its full potential is currently harnessed. Table 3.4 shows that the
Philippines, by contrast, has harnessed approximately 74% of the geothermal potential
that exists in that country. Overall, the utilisation of renewable energy in ASEAN
remains far below than its technical potential.
The greatest barrier to increased reliance on renewable energy in these countries is the
high capital cost (USD/W) relative to that of conventional fossil-fuelled power plants
(Maslog, 2012b). Other barriers for ASEAN countries are the limited access to
advanced renewable energy conversion technologies, the subsidisation of fossil fuelled
power, the lack of infrastructure, institutional barriers, and the absence of government
support (Dulal et al., 2013).
ASEAN countries cooperate in their attempt to address these barriers, including by
developing policies on renewable energy, through a Centre for Energy and
implementing activities through the ASEAN Plan of Action for Energy Cooperation
(APAEC) (Lidula et al., 2007).
Some ASEAN countries have introduced renewable energy legislation and policies and
financial assistance programmes, but the degree to which these measures have been
adopted varies significantly. At the weak end of the spectrum are Brunei Darussalam
and Singapore, neither of which has established any policies for renewable energy.
Brunei Darussalam has an abundance of oil and natural gas reserves, and has not
devoted significant policy attention to renewable energy to date. Singapore, on the
other hand, has no economically viable indigenous energy resources other than solar
Chapter 3: The Literature Review 41
and all electricity is supplied via imported conventional fossil fuel resources (Lidula et
al., 2007). Toward the other extreme end of the spectrum is the Philippines, which has
developed the greatest number of renewable energy policy instruments (Lidula et al.,
2007). As a result, 74% the total available geothermal and 33% of total available
hydroelectric resources are harnessed (Tables 3.4.), which is higher than the rates in
other ASEAN member countries. This has made the Philippines the leader in the
region in terms of harnessing these two renewable energy resources and renewable
energy utilisation in general (Maslog, 2012a).
All but two members of ASEAN have large hydro resources, and lower installation
cost per Watt of micro hydro project relative to any other renewable energy resources
(Abdullah, 2005) this makes hydro power an attractive option for their rural
electrification programs.
3.2 Rural electrification programs based on micro hydro
systems
There are tens of thousands of hydropower plants in the “micro” range operating
successfully in China, and significant numbers operate in a wide range of countries
such as Nepal, Sri Lanka, Pakistan, Vietnam and Peru. Their experiences show that in
certain circumstances micro hydro can be profitable in financial terms, and that even
unprofitable plants can exhibit strong positive impacts on the lives of poor people
(Holland et al., 2005). This section starts with a brief history of hydroelectric
technology and then looks at some of the drivers and barriers surrounding
implementing MHS in developing countries.
Chapter 3: The Literature Review 42
3.2.1 A brief history of hydroelectric technology
Unlike most new renewable energy technologies, hydroelectricity is a mature
technology that has been around, delivering electricity to households for over a
century. There were three initial steps to the development of hydroelectric technology.
The first was the development of commercial electric DC motors, which became
available in 1871. The second was Pelton’s invention in the late 1870s of a hydraulic
turbine that used a free-jet impulse system to turn a wheel, which Pelton patented in
1880 (Old Pelton, n.d). The Pelton wheel became widely used to provide mechanical
power for mining operations. The third step in developing hydroelectric technology
was simply to couple a motor to a Pelton wheel. The first person to do so was William
George Armstrong in 1878. He coupled a DC electric motor to a Pelton hydraulic drive
to make the world's first hydroelectric power scheme at Cragside in
Northumberland, England (IEA, n.d). He used the electricity to operate a single arc
lamp in his art gallery (Era-energy, n.d).
The subsequent diffusion and adoption of hydroelectric technology was very rapid. By
1881 hydroelectric plants were operating in remote mining towns such as Mt. Bishoff
in Tasmania (Harries, 2011) and near Niagara Falls in the USA, where the Schoelkopf
Power Station No. 1 was built (Era-energy, n.d). On September 30, 1882 the
first Edison 12.5 kW hydroelectric power plant began operating on the Fox River at
the Vulcan Street Plant, Appleton, Wisconsin, USA to light two paper mills and a
residence (Kumar et al., 2011).
By 1886, 45 hydroelectric power plants had been constructed in the U.S.A. and
Canada. In 1896 Nikola Tesla built the Niagara Falls hydroelectric power system. By
1889 there were 200 hydroelectric schemes in the USA alone (Era-energy, n.d).
Chapter 3: The Literature Review 43
The first hydro power plant in India was a 130 kW system built in 1887 in Darjeeling
(Saxena and Kumar, 2010). In 1902, a 4.5 MW scheme built near Sivasamudram Falls
on the Cauvery River in Karnataka was the first major power station in India
(Srinivararao et al., 2012).
A small hydroelectric plant was built on the Krka falls in Croatia in 1895 to supply
electricity for lighting in the City of Sibenik (Delimar et al., 2007).
Many countries in Africa have a rich history of small scale hydropower. The first
system built in South Africa was a 300 kW station on the slopes of Table Mountain,
which was commissioned in 1895. In Tanzania, more than 16 small hydropower
systems which were installed by church missions in the 1960s and 1970s are still
operating. In Zimbabwe commercial farmers in the Eastern Highlands of the country
installed hydro stations as early as the 1930s (Klunne, 2010).
3.2.2 Drivers on MHS rural electrification programs
Various benefits from MHS have been reported by scholars. Annemarije et al., (2011)
reported that MHS have increased social interactions due to an increased feeling of
security provided by street lighting. While Gurung et al. (2011) found MHS to have a
positive impact on education. That micro hydro systems can benefit small scale
enterprises has been reported by other studies: home embroidery industries (UNDP,
2009), battery charging services (Kirubi et al., 2009), corn grinding and pumping
groundwater for irrigation (Pandey, 2009). Another positive impact of MHS is the
improvement in health resulting from reduced indoor smoke (Manuswamy et al.,
2011).
While the average cost of electricity produced using a diesel generator has been
reported to be approximately nine times the cost from an MHS (Sánchez et al., 2006),
Chapter 3: The Literature Review 44
it has also been reported that after an MHS was commissioned, the amount of money
flowing out of the community to purchase fuels decreased considerably (González et
al., 2009).
3.2.3 Issues associated with MHS rural electrification
programs
Many government-funded MHS have been established in remote areas, but the
performance of these projects is not well documented. As a result of these reporting
weaknesses, feasibility studies, business and implementation plans, including
procurement documents and construction plans of the demonstration sites are not able
to be used to guide the planning and implementation of future MHS projects. This has
reduced the capacity of those involved in the implementation of new MHS projects in
remote areas to learn from the experience of others.
Like many developing countries, Nepal could not exploit huge hydro-electricity
potential due to deficiencies in technical and financial capability (Gurung et al.,
2011b). In countries such as Peru and Bhutan, the barriers have been political and
economic in nature (Horn and Espinoza, 1995; ADC, 2001). While other countries,
such as Malaysia for example, have focussed more on large hydro power instead of
micro hydro (Sovacool and Bulan, 2012) or on biomass/biofuel (Sovacool and
Drupady, 2011).
Indonesia is one country that provides progressive support, including national policy
and associated programs, to promote renewable energy deployment, and especially
MHS. A number of international funding agencies, e.g the World Bank, ADB, GTZ,
AUSAID provided support to MHSs projects across the country (UNDP, 2006). Yet
Chapter 3: The Literature Review 45
the number of projects implemented and total share of hydro power in national power
generation is not significant (only about 2%) (Hasan et al., 2012).
The research that has been undertaken on projects and programmes involving the
installation of MHSs reported that many MHS projects are successful and provide
significant benefits to the community for whom they are used to supply energy. These
benefits include improved quality of life and the creation of income-generating
opportunities (Pandey, 2009; UNDP Indonesia, 2009; Kirubi et al., 2009), reducing the
hours women spend doing housework (Gurung et al., 2011c; Balakrishnan, 2006;
Maier, 2007), improved indoor air quality and health (Manuswamy et al., 2011), and
increased opportunities for learning and education (Gurung et al., 2011c). The
research has also shown that many projects involving hydroelectric schemes installed
in developing countries over recent years are in a poor state of repair or neglect and are
not operating well (Tsephel, n.d; IEA, 2000; Sánchez et al., 2006).
Some of the research findings point to substantive differences between programmes
based on MHSs and programmes based on other types of renewable energy
technologies. One of issues raised emerging from this research is the observation that,
like other renewable energy projects and programmes, MHS projects constructed for
remote rural electrification have high up-front capital costs, so they tend to be
constructed with finance provided by public grants (government funds) or from non-
government organisations (NGOs). Once installed, the responsibility for operating and
maintaining the MHS is often handed over to the communities which use the
electricity they supply, but have limited budgets for operation and maintenance.
Furthermore, donor-funded MHS projects are planned and executed within timeframes
designed to meet the needs of the donor rather than those of the communities.
Obtaining approvals for MHS projects can be subject to long delays, but once approval
Chapter 3: The Literature Review 46
has been received the pressure on the donor to spend the funds from its annual/project
budget as quickly as possible can result on project commencing without proper
feasibility studies or planning.
Other research findings suggest that the answers to the fundamental research questions
of this thesis stated above may be related to the processes by which these small hydro
schemes have been installed (Klunne and Michael, 2009). Managing an MHS project
as a self-managed project often turns out to be socially challenging for the community.
The character of local community institutions, the unique nature of each community’s
circumstances and levels of experience of local organising groups all influence the
local capacity to establish, maintain and enforce community-based management
(Lynch and Harwell, 2002). Furthermore, the almost universal requirement that users
cover the operating and maintenance costs of the MHS requires that they adopt a
community-based business model in order to raise the funds and coordinate
maintenance, to ensure the continued operation of the MHS into the future.
External factors also influence these community institutional arrangements. These may
be local, regional and national policies and related regulatory frameworks. Some of
these are deliberately supportive of micro hydro, helping projects be more viable and
sustainable into the long-term. In Malaysia, for example, a national-level policy and
strategy have been established promoting renewable energy in general (Sovacool and
Drupady, 2011; Ong et al., 2011). However, these policies often fail to be translated
into action at the grass-root level, or to accelerate the deployment of micro hydro
project for rural electrification.
The body of literature on renewable energy rural electrification programs in
developing countries includes several guidelines and roadmaps. However, these
general guidelines and roadmaps may not be completely applicable to programmes
Chapter 3: The Literature Review 47
mostly based on MHS technology. One reason is that stand-alone solar home systems
(SHSs) on individual houses or small businesses constitute the largest and most
ubiquitous types of rural electrification program being implemented in developing
countries. This has meant that much of the work used to develop these guidelines and
roadmaps has been based on research results that relate primarily to these SHS
technologies. How applicable are these guidelines and roadmaps for renewable energy
rural electrification programmes or projects based on other renewable energy
conversion technologies, such as wind turbines, bioenergy, geothermal or
hydroelectric. The differences between solar radiation and other renewable energy
resources on the one hand, and between SHS and these other renewable energy
generation technologies on the other, are not minor.
In fact, rural electrification programs based on SHSs even differ from one another in
many important ways. These differences include the government energy policy
frameworks in which they are developed, planned and implemented, their objectives or
aims, the amounts of funding provided, the financing mechanisms used, the
stakeholders involved, the training provided to technicians that install and maintain the
systems, the training provided to the householders that use the systems, the equipment
used, the roles of the various stakeholders, and the national and local cultures of the
communities in which they are implemented. This creates a degree of scepticism over
the extent to which a single set of rules, processes, guidelines or a roadmap can be
formulated that, if followed, would guarantee the success of all SHS programmes
(Urmee, 2009). It follows that the uncertainty over the degree to which these rules,
processes, guidelines or roadmaps are applicable or relevant to programmes or projects
which are based in other renewable energy technologies is even less certain.
Chapter 3: The Literature Review 48
There are three major differences between SHS programmes and programmes based on
other forms of renewable energy generation. Firstly, other renewable energy resources
tend to be less evenly distributed than solar energy resources within a given region. All
regions tend to have some level of solar radiation that can be used to operate SHSs,
and these solar insolation levels tend to be relatively uniform over large geographic
areas. The wind, biomass, geothermal and hydro-electric resources in a geographic
area, by contrast, tend to be far more variable and far less uniform.
Secondly, solar radiation levels are variable (seasonally and over the short term) and
intermittent (diurnal). Other renewable energy resources are also variable and
intermittent, but to both greater and less degrees. Wind resources may be less variable
over the course of a day, but more variable over the course of a year. Biomass and
hydro resources may be stable over a day or month, but far more seasonally variable.
Thirdly, rural electrification programs based on most other renewable energy
technologies, such as biomass, wind, geothermal or micro hydro, tend to involve
village scale electrification projects rather than stand-alone household systems. The
use of village scale generation projects creates a host of issues that are not issues in the
case of stand-alone SHS programmes.
These key differences between small-scale solar and other renewable energy projects
mean the results of research based on SHS programmes are unlikely to be able to
provide complete answers to the questions of why projects based on other renewable
energy generation technologies are less successful than are others and are therefore
likely to be less useful in terms of providing guidance as to how such projects can be
undertaken in ways that make them more successful.
The fundamental research questions underpinning this research project are therefore
the same common questions that have steered much of the research that has been
Chapter 3: The Literature Review 49
undertaken in this field to date: why are some programmes or projects more successful
than others, what are the factors that determine programme or project success and how
can these programmes and projects be made more successful. The difference is that
this study asks these same questions in relation to those projects that are based on the
installation of micro hydro systems in particular as it was suspected that the answers to
these questions may differ depending on which renewable energy technologies are
being deployed.
One of features that distinguish projects involving MHS from projects involving other
types of renewable energy resources and conversion technologies is that the capacity to
utilise MHSs is restricted to those communities located in elevated regions and with
significant rainfall (Gurung et al., 2011b). Where hydro resources are available, they
offer an opportunity to generate electricity at a unit cost lower than the cost of
generating electricity from other renewable energy sources, such as wind, solar PV or
biomass. Like almost all renewable energy resources, however, they are variable, but
they are characterised by less short term variability and intermittency than are wind or
solar resources (UNIDO, 2010; Ahmad et al., 2011).
While the research undertaken on renewable energy electrification projects or
programmes that are based on renewable energy resources technologies other than
small scale solar systems is significantly less in quantity than is that based on SHS,
research based on rural electrification programs and projects based on these other
renewable energy technologies has been undertaken. In the case of projects involving
the deployment of MHSs, the research that has been used to tackle these questions has
been based on either techno-economic (Kaldellis et al., 2005), socio-economic
(Gurung et al., 2011a), socio-technical systems (Sovacool et al., 2011) or learning-
based approaches (Drinkwaard et al., 2010). Furthermore, much of the research has
Chapter 3: The Literature Review 50
not been confined to micro hydro, but has focused on hydro-electric systems in general
(Khennas and Barnett, 2000) or on mini hydro projects (ADB, 1998). The very
significant differences that scale makes to funding, planning, construction and O&M
of hydro-electric schemes means that its value in terms of informing those
implementing MHS projects on how they can be made more successful, the value of
the research results are limited.
Barriers to the development of micro hydro systems that have been identified and
reported in the literature published in this field are presented in Table 3.5.
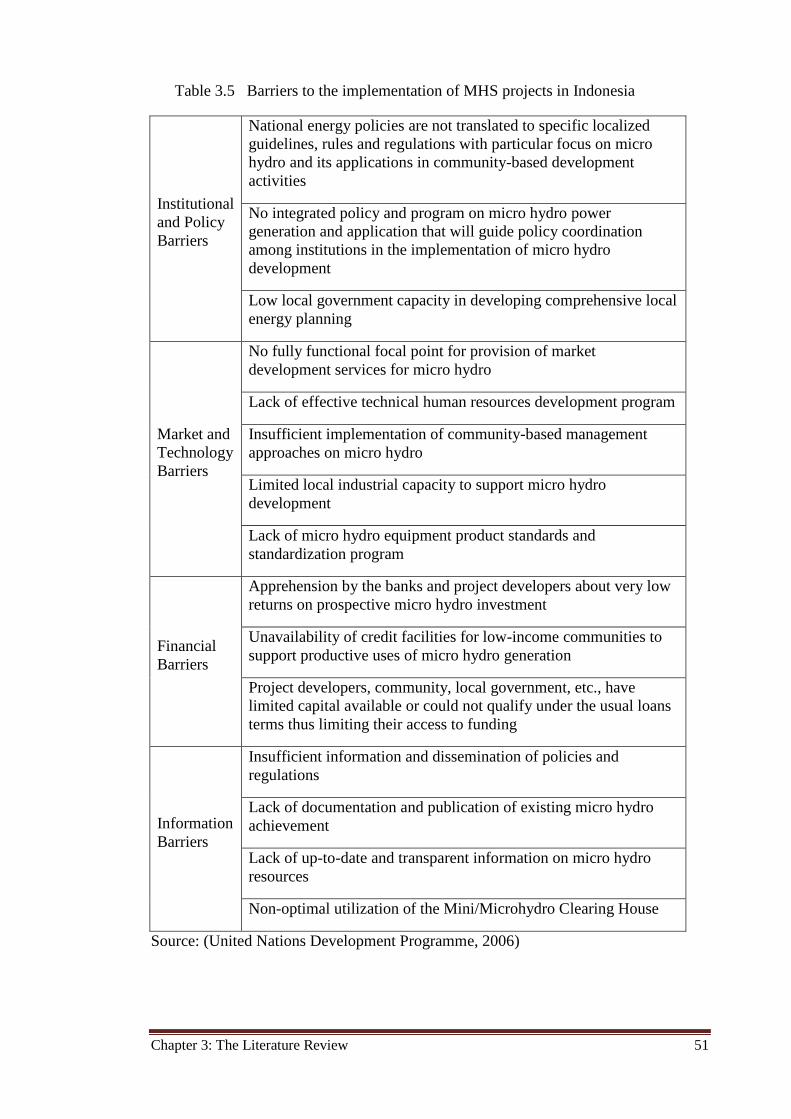
Chapter 3: The Literature Review 51
Table 3.5 Barriers to the implementation of MHS projects in Indonesia
Institutional
and Policy
Barriers
National energy policies are not translated to specific localized
guidelines, rules and regulations with particular focus on micro
hydro and its applications in community-based development
activities
No integrated policy and program on micro hydro power
generation and application that will guide policy coordination
among institutions in the implementation of micro hydro
development
Low local government capacity in developing comprehensive local
energy planning
Market and
Technology
Barriers
No fully functional focal point for provision of market
development services for micro hydro
Lack of effective technical human resources development program
Insufficient implementation of community-based management
approaches on micro hydro
Limited local industrial capacity to support micro hydro
development
Lack of micro hydro equipment product standards and
standardization program
Financial
Barriers
Apprehension by the banks and project developers about very low
returns on prospective micro hydro investment
Unavailability of credit facilities for low-income communities to
support productive uses of micro hydro generation
Project developers, community, local government, etc., have
limited capital available or could not qualify under the usual loans
terms thus limiting their access to funding
Information
Barriers
Insufficient information and dissemination of policies and
regulations
Lack of documentation and publication of existing micro hydro
achievement
Lack of up-to-date and transparent information on micro hydro
resources
Non-optimal utilization of the Mini/Microhydro Clearing House
Source: (United Nations Development Programme, 2006)
Chapter 3: The Literature Review 52
3.2.4 Designing village-scale MHS projects
General
The term ‘village-scale MHS’ as used in this study is an off-grid MHS that is used to
supply electricity to a limited number of households (usually all of the households in a
village or a number of villages) and for which the operation and maintenance of the
system is the responsibility of the community (end users).
The development of a successful MHS is a complex process that involves natural,
technical, social and economic factors. The literature produced to date on this topic
includes guidelines, research findings discussing the barriers to successful
implementation of successful MHS projects, assessments of the impacts of MHS,
reports on programs and best practice recommendations. From this body of literature
the clear message is that the success of an MHS project starts with the design.
Hydroelectric systems are extremely site specific. No two hydro-electric systems are
likely to ever be built the same, since every site has unique characteristics that
translate into particular design and construction requirements (Lejeune and Hui, 2012).
The design of a successful village-scale MHS in a rural area must not only address
technical issues, but many other disciplines, including economics and environmental
and institutional frameworks (ESHA, 2004). Based on studies of hydropower in Nepal,
Sovacool et al. concluded that political, social and culture issues are just as important
as the technical and economic issues (Sovacool et al., 2011).
Nor should the development of a hydropower plant be considered a simple process. In
the words of Sovacool et al. (2011), “deploying the hardware is only one small piece
of the overall hydropower puzzle”. Spreading social awareness, promoting community
ownership, moulding efficacious regulations, minimising corruption, addressing
Chapter 3: The Literature Review 53
poverty, and improving institutional capacity are all issues that need to be considered.
It has been asserted that the most crucial factor is community development. In its
broadest sense this includes organisational development, environmental management,
technology promotion, community empowerment, capital formation and skill
enhancement (Singh, 2010). Tri Mumpuni, director of the non-profit organisation
People Centred Business and Economic Institute (IBEKA), argued that the most
critical factor of village-scale MHS is preparing the community to run the MHS by
building an organisation that can motivate the community (Mi, 2011). To Mumpuni, a
socially prepared project means that every single person in the community has been
approached via a village meeting, and the project has been discussed very intensely by
the members of the community.
Khennas and Burnett, on the other hand, reported the most critical factors/lessons
learned from studies undertaken in Sri Lanka, Nepal, Peru, Mozambique and
Zimbabwe, include clear programme and project objectives, correctly sized plant,
appropriate standards, the form of ownership, the creation of an effective business-like
style of management , the capacity for the project to be financially self-sustaining with
cash generating (usually day time) end-uses which increase the use of the plant (load
factor) (Khennas and Barnett, 2000). A United Nations Development Programme
study reported that barriers to developing micro hydro in Indonesia, included
institutional and policy, market and technology, financial and information
impediments (UNDP-GEF, 2006).
Equity is another important social factor that is reported to be relevant to the
management of hydroelectric projects. Differences in access to electricity within a
small community can be a trigger for dispute and render a project vulnerable to a
‘tragedy of the common’ fate (USAID, 2011). Shashidharan (1998) and Pattrick

Chapter 3: The Literature Review 54
(1998) stated that one of lessons learnt from past rural programs was that more often
than not, programme and project planners have been more focused on engineering or
technical issues than they have been on other issues, such as social appropriateness.
That is, they have not taken on board the message of Hardin’s classic study, which was
that not every problem can be solved by technical solutions alone, and that some
human problems have no technical solution (Hardin, 1968).
One way to find a solution to a social dilemma such as the social equity issues related
to an MHS is via a binding commitment between the parties. However this can be
achieved only through communication. Communication creates trust among group
members and trust increases the ability to form commitments that can be used to
handle these types of social dilemmas (Lokhorst et al., 2009). According to one
researcher “A deeper understanding of the internal coordination mechanisms occurring
within communities of practice has to include the co-evolution of norms, leadership
and trust” (Muller, 2006). Achieving communication and coordination within a group,
however, is not always easy. Community leaders can emerge who are able to help
members communicate with each other.
Key issues in designing and implementing an MHS
(a) Engineering
(i) Resource Assessment
The basic engineering principle underpinning hydroelectric systems is the conversion
of the kinetic energy in flowing water into mechanical energy through turning a
turbine, and the conversion of that mechanical energy into electrical energy using a
generator connected to the turbine shaft. The total power produced depends primarily
on two parameters, the head (meters) and the flow rate (cubic meters per second)
(ESHA, 2004). The higher the pressure head of water, the greater the supply of power
Chapter 3: The Literature Review 55
that can be generated. Similarly, the greater the volume of water sent through the
turbine, the greater the amount of power that can be produced. In other words, hydro
power generation capacity is directly proportional to the head and to the flow rate.
The volume of water flowing in the stream is highly significant in term of determining
the amount of power that can be generated. Maintaining the availability and the
continuity of water flow is therefore critical to ensuring the steady output of a hydro
project. Due to the seasonal changes in weather, flow rates can vary considerably over
the course of a year. The amount of power that the hydro system can deliver could
exceed demand during the rainy season, while not being capable of reliably meeting
demand during the dry season, when low stream flows result in a drop in the efficiency
of the MHS and possibly failure of the MHS, or no output if stream flows are too low
(New, 2004). A flow duration curve captures this drop and is the most useful means to
estimate a site’s potential and calculate annual energy output (ESHA, 2004).
The traditional method used for measuring the flow rate is referred to as the ‘bucket
method’. A container (often a bucket) is used to capture the flowing water and the time
it takes to fill the container is measured. The volume of the container (litres) divided
by the time taken to fill the container (seconds) gives the flow rate (litres/second).
Another very simple method is known as the velocity-area method. This method uses a
floating object. Using a largely submerged object located in the centre of the stream
flow, the time, t (seconds) elapsed for the floating object to transverse a certain length,
L (metres) from the reference point is recorded, The estimated cross sectional area of
the stream, A, multiplied by the length, L, and time, t, gives the flow rate (Flow rate =
A x L x t). A third and more reliable method is the weir method. This method uses a
low wall or dam constructed across the stream and the water is channelled through a
notch in the wall. As the notch has known dimensions, the cross sectional area is
Chapter 3: The Literature Review 56
accurately calculated and hence the greater accuracy of this method (ESHA, 2004).
The measurement of flow rate using a reliable method is essential, since a lack of
accurate flow rate data will result in poor decision making and can result in an MHS
project incurring financial losses (Odiyo et al., 2012).
Ideally, to guarantee that power is available all year round, the calculation of the
design flow should use the minimum flow rate over the year and a reliable
measurement method should be used in order to look at the consistency of the flow
(ESHA, 2004). Seasonal variations in stream flows, both over a year (ESHA, 2004)
and over the longer term (e.g. a decade) are also required in order to accurately
estimate the output (Kaldellis et al., 2005).
Where river basins are ungauged, the estimation of runoff based on the rainfall data
would be possible with help from supporting data including slope and catchment area,
evaporation, temperature and soil texture and structure (NRCS, 2004). It has also been
suggested that a regional flow duration curve based on data from the nearest gauged
river in the region should be used for ungauged rivers (Castellarin et al., 2004; Viola et
al., 2010). However, Dudhani et al. point out that flow rates can vary considerably
from river to river and argue that further research is therefore required on the use of
other potential methods for determining flow rates, such as those using remote sensing
data, to determine which are best for such situations (Dudhani et al., 2006).
Determining river flows is now made more complicated by climate change. The life
time of an MHS is approximately 30 years and even where historical flow data is
available, global warming and its potential impact on rainfall and runoff represent an
additional factor that now needs to be considered when designing an MHS. Global
warming trends which are accompanied by changes in global precipitation (IPCC,
2001) and temperature (Bajracharya, 2012) can have impact on regional river run-off
Chapter 3: The Literature Review 57
and rainfall pattern (Smith, 1995). The third assessment report of the IPCC, forecast
that temperatures in the tropical regions of Asia are expected to rise by between 2 and
8 degrees Celsius over the next 40 years and that increasing temperature will further
increase variations in climate, including decreased rainfall (IPCC, 2001). Although the
impact of global and regional climate change on river flow remains uncertain, accurate
determination of micro hydro capacity now requires both long-term hydrological data
and a better understanding of the likely impacts of climate change.
All of this hydrological data is used to determine the system’s capacity and to calculate
the firm energy, which is crucial to know prior to developing an MHS, especially when
it will be the sole electricity supply system in an isolated area (ESHA, 2004). It is also
important that the micro hydro plant be sized correctly in order to maximize the
efficiency and cost savings, (USAID, 2011) and to identify the availability of system
to meet the mean energy, firm and non-firm energy (Yermoli and Krishnan, n.d).
Moreover, sizing the system appropriately is also important in order to maximize the
benefit-cost ratio, as the cost of hydro plant is nearly directly proportional to its
installed capacity (Yermoli and Krishnan, n.d)
(ii) Demand-supply outlook
In order to install the correct system capacity, accurate estimates of electricity demand
are essential. Total demand can be calculated by multiplying the number of users and
the estimated average use of electricity per user (USAID, 2011). The typical load per
household may differ from one area or village to another and there is no standard load.
It is therefore important to identify household characteristics, including electricity
usage patterns, to identify and determine the local base and peak loads.
The proposed electricity use, e.g. replacing non-renewable energy usage for domestic
purposes, lighting a public facility, or for productive activities may contribute to the
Chapter 3: The Literature Review 58
village life in the future. Yet, in some cases, the capacity of an MHS calculated at the
planning stage is insufficient to meet changes in demand, changes in the types of end
user and their individual load setting. As a rule of thumb, demand is likely to grow
after the first year of the installation of an MHS. In anticipation of this growth in
demand, one common practice is to oversize the MHS by 30% in terms of capacity,
mainly in the wiring and batteries (USAID, 2011). For reasons of simplicity and cost
minimization, MHS used for rural electrification are usually designed as instantaneous
systems with no storage. The absence of any storage device means that the
instantaneous system will not be able to increase its power supply to meet an increase
in demand. Balancing the power supply and the demand load therefore needs to be
carefully considered. When designing an MHS it is crucial that the base load and the
peak load be identified to ensure that the system operates effectively (IEA, 2000).
Load factor is an indicator of MHS efficiency. Low load factors (under 0.4), which
means low utilisation rates, have been reported in Nepal and Zimbabwe (Gurung et al.,
2011b). However cases in which MHS load factors have been increased by using the
excess power to increase economic productivity and generate increased income have
also been reported in Nepal (Pandey, 2009), Indonesia (UNDP Indonesia, 2009) and
Kenya (Kirubi et al., 2009). Ideally, the load factor should be taken into account at the
planning stage in order to generate power supply in accordance with different types of
loads (Hosseini et al., 2005).
Load factor can be managed using demand side management, including using energy
efficiency measures. In Nepal (Irvine-Halliday and Crain, 2000), compact fluorescent
lights (CFLs) have been used to reduce power consumption and the excess power used
to charge batteries. However, understanding the local culture and behaviour is
important. Poor people, for example, tend to choose the lowest upfront investment
Chapter 3: The Literature Review 59
rather than higher investment that pays off over time. This ‘economics of poverty’ can
become an obstacle for demand management (USAID, 2011).
Another approach to dealing with load factor is by adjusting peak loads according to
seasonal supply trends. For example, Nafziger (1996) describes an MHS where peak
load in winter was likely to occur at night time for lighting and cooking devices, while
in summer, peak load would be in the daytime as result of using fans and refrigerators.
Providing demand management training in the planning stage of an MHS project
seems to have the potential to help communities.
Another issue that needs to be considered is the planning associated with expansion of
electricity grids. An MHS could be abandoned if the village is subsequently connected
to the main electricity grid. Between 1982 and 2001, MHSs were used to supply
electricity to fifty nine villages in Thailand that were subsequently connected to the
main grid. Fifty three percent of these MHS projects were abandoned as a consequence
of the villages being connected to the grid (Greacen, 2004). Not all MHSs are
abandoned if the villages that they supplied were connected to the grid at a later stage.
Micro hydro Cinta Mekar in Subang, Indonesia, for example, continued to be operated
and the excess electricity generated was sold into the grid (Sulistyowati, 2012).
(iii) System Design
Designing an MHS is an exercise in compromising between the aims, impacts and
costs. There are several different types of hydropower projects, each having specific
design characteristics that enable them to serve particular energy needs (base load,
peak load or both) and to supply different types of services (domestic, industrial or
commercial, etc.). Obviously, these distinctions will be compounded with the technical
differences (run of river, reservoir and multipurpose) and lead to widely different
impacts, both environmental and social (IEA, 2000).
Chapter 3: The Literature Review 60
Depending on the topographic circumstances and river characteristics, run of river
plants can be designed using either large flow rates with low head, or small flow rates
with high head. The selection of the turbine type is then based on a combination of the
river discharge and head (Lejeune and Hui, 2012). One advantage of run of river
system is that the flow pattern of the river remains essentially unchanged, which
reduces downstream impacts of the project. The absence of any sizable reservoir helps
minimise both the social and the environmental impacts (IEA, 2000). Another benefit
of run of river schemes is that there may be multiple MHS opportunities for producing
electricity along the river. One mini grid comprising seven micro hydro plants ranging
from 9 to 26 kW with total output power of 132 kW, has been successfully developed
in Nepal on one river (Pokhrel et al., 2013)
(iv) Local capacity and technical support
Most of the operation and maintenance of village-scale used for rural electrification is
undertaken by the community. One of the primary reasons for this is that outsourcing
would be expensive due the high transportation cost and the time required to visit the
sites (Greacen, 2004). Therefore, capacity development is important in the operation
and maintenance of MHS, and should be embedded in the planning of the project.
Various studies have revealed that untrained operators (Tsephel, n.d) and poor
maintenance (IEA, 2000) were key factors in failures of MHS. Hence, the training of
local operators and also the end users is essential to ensure that the components are
used correctly and will last throughout the whole projected lifetime (USAID, 2011).
The training program should not only focus on knowledge, skills and attitudes, but also
on critical thinking and communicative action (Engkoeswara, 1998).
It has been frequently reported that MHS projects are not running properly due to a
lack of appropriate knowledge and skills (IEA, 2000; Sánchez et al., 2006; USAID,
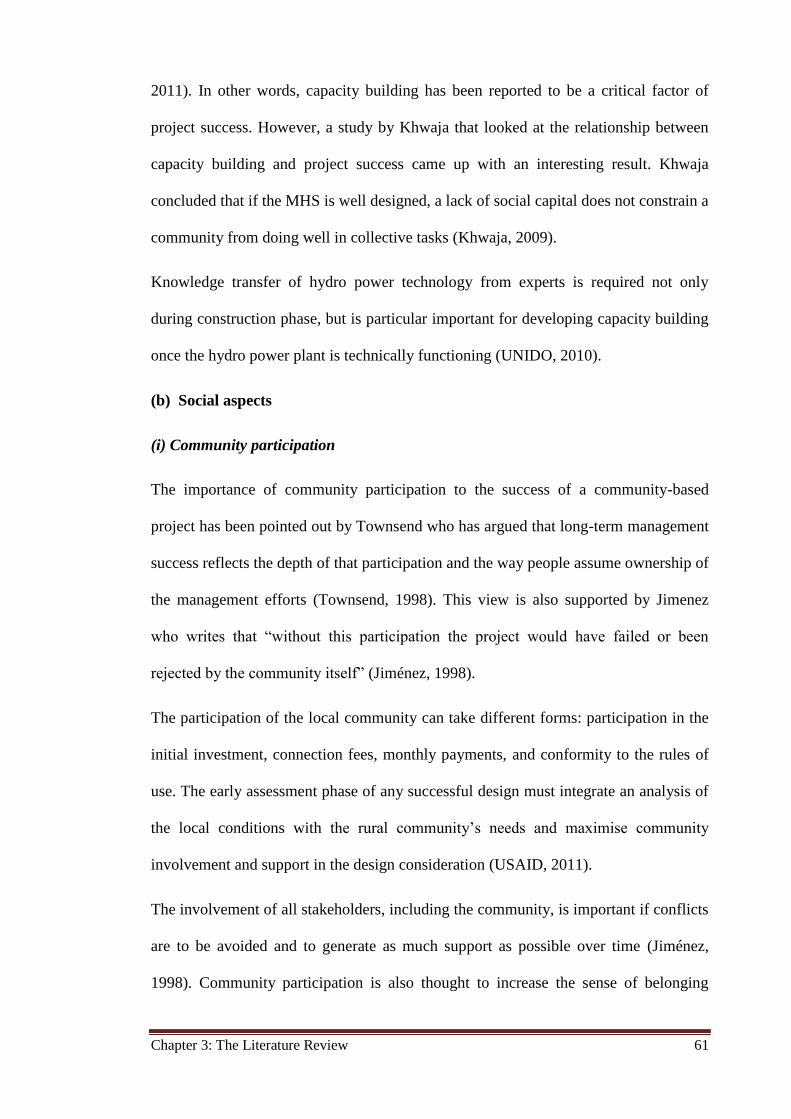
Chapter 3: The Literature Review 61
2011). In other words, capacity building has been reported to be a critical factor of
project success. However, a study by Khwaja that looked at the relationship between
capacity building and project success came up with an interesting result. Khwaja
concluded that if the MHS is well designed, a lack of social capital does not constrain a
community from doing well in collective tasks (Khwaja, 2009).
Knowledge transfer of hydro power technology from experts is required not only
during construction phase, but is particular important for developing capacity building
once the hydro power plant is technically functioning (UNIDO, 2010).
(b) Social aspects
(i) Community participation
The importance of community participation to the success of a community-based
project has been pointed out by Townsend who has argued that long-term management
success reflects the depth of that participation and the way people assume ownership of
the management efforts (Townsend, 1998). This view is also supported by Jimenez
who writes that “without this participation the project would have failed or been
rejected by the community itself” (Jiménez, 1998).
The participation of the local community can take different forms: participation in the
initial investment, connection fees, monthly payments, and conformity to the rules of
use. The early assessment phase of any successful design must integrate an analysis of
the local conditions with the rural community’s needs and maximise community
involvement and support in the design consideration (USAID, 2011).
The involvement of all stakeholders, including the community, is important if conflicts
are to be avoided and to generate as much support as possible over time (Jiménez,
1998). Community participation is also thought to increase the sense of belonging
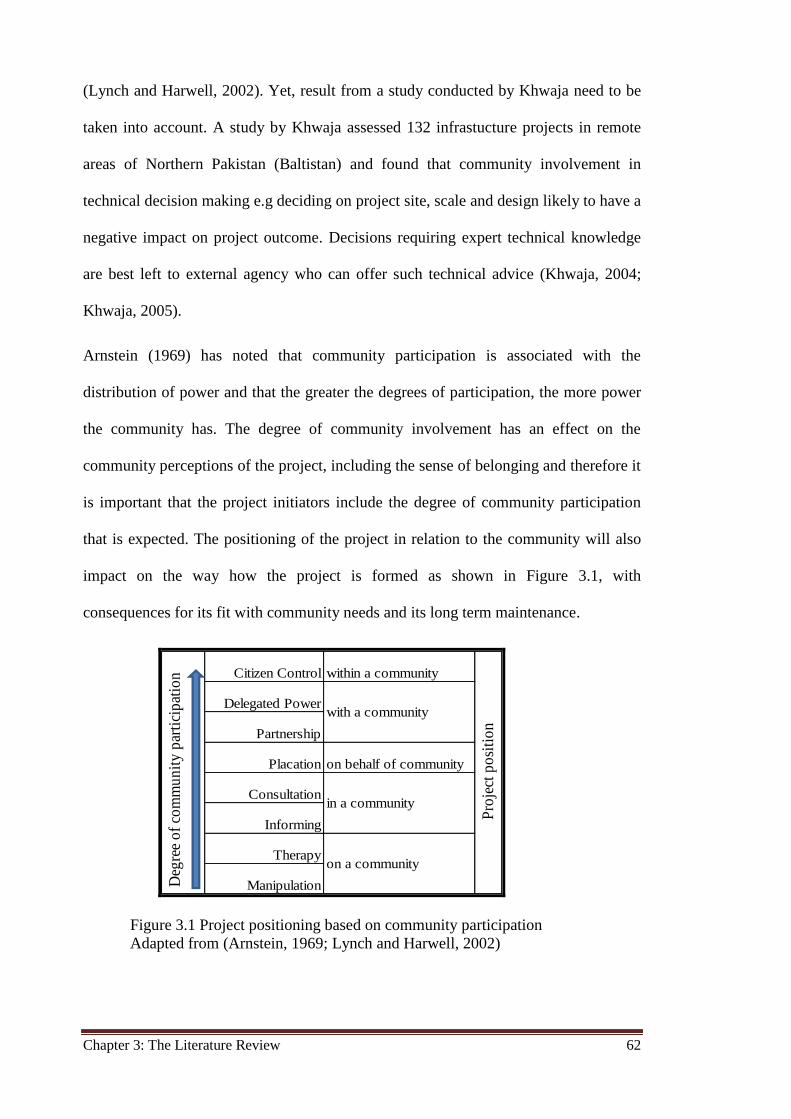
Chapter 3: The Literature Review 62
(Lynch and Harwell, 2002). Yet, result from a study conducted by Khwaja need to be
taken into account. A study by Khwaja assessed 132 infrastucture projects in remote
areas of Northern Pakistan (Baltistan) and found that community involvement in
technical decision making e.g deciding on project site, scale and design likely to have a
negative impact on project outcome. Decisions requiring expert technical knowledge
are best left to external agency who can offer such technical advice (Khwaja, 2004;
Khwaja, 2005).
Arnstein (1969) has noted that community participation is associated with the
distribution of power and that the greater the degrees of participation, the more power
the community has. The degree of community involvement has an effect on the
community perceptions of the project, including the sense of belonging and therefore it
is important that the project initiators include the degree of community participation
that is expected. The positioning of the project in relation to the community will also
impact on the way how the project is formed as shown in Figure 3.1, with
consequences for its fit with community needs and its long term maintenance.
Citizen Control within a community
Delegated Power
Partnership
Placation on behalf of community
Consultation
Informing
Therapy
Manipulation
Pro
ject
po
siti
on
on a community
in a community
with a community
Deg
ree
of
com
mu
nit
y p
arti
cip
atio
n
Figure 3.1 Project positioning based on community participation
Adapted from (Arnstein, 1969; Lynch and Harwell, 2002)
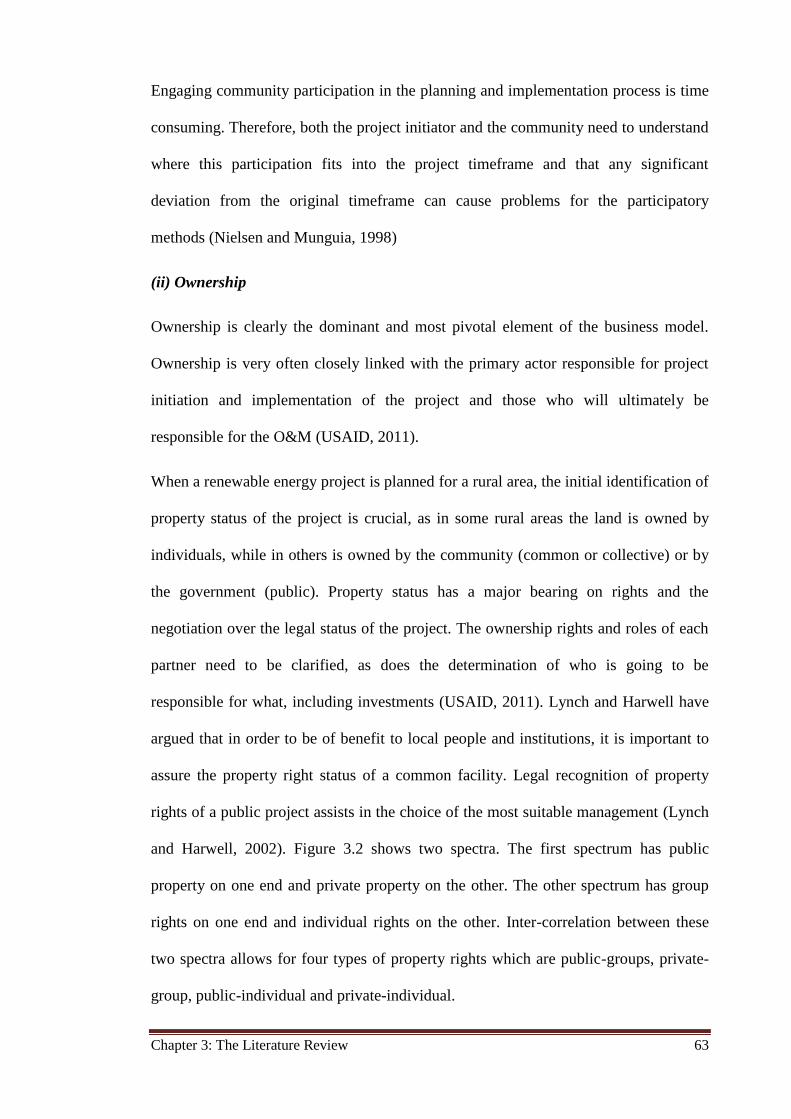
Chapter 3: The Literature Review 63
Engaging community participation in the planning and implementation process is time
consuming. Therefore, both the project initiator and the community need to understand
where this participation fits into the project timeframe and that any significant
deviation from the original timeframe can cause problems for the participatory
methods (Nielsen and Munguia, 1998)
(ii) Ownership
Ownership is clearly the dominant and most pivotal element of the business model.
Ownership is very often closely linked with the primary actor responsible for project
initiation and implementation of the project and those who will ultimately be
responsible for the O&M (USAID, 2011).
When a renewable energy project is planned for a rural area, the initial identification of
property status of the project is crucial, as in some rural areas the land is owned by
individuals, while in others is owned by the community (common or collective) or by
the government (public). Property status has a major bearing on rights and the
negotiation over the legal status of the project. The ownership rights and roles of each
partner need to be clarified, as does the determination of who is going to be
responsible for what, including investments (USAID, 2011). Lynch and Harwell have
argued that in order to be of benefit to local people and institutions, it is important to
assure the property right status of a common facility. Legal recognition of property
rights of a public project assists in the choice of the most suitable management (Lynch
and Harwell, 2002). Figure 3.2 shows two spectra. The first spectrum has public
property on one end and private property on the other. The other spectrum has group
rights on one end and individual rights on the other. Inter-correlation between these
two spectra allows for four types of property rights which are public-groups, private-
group, public-individual and private-individual.
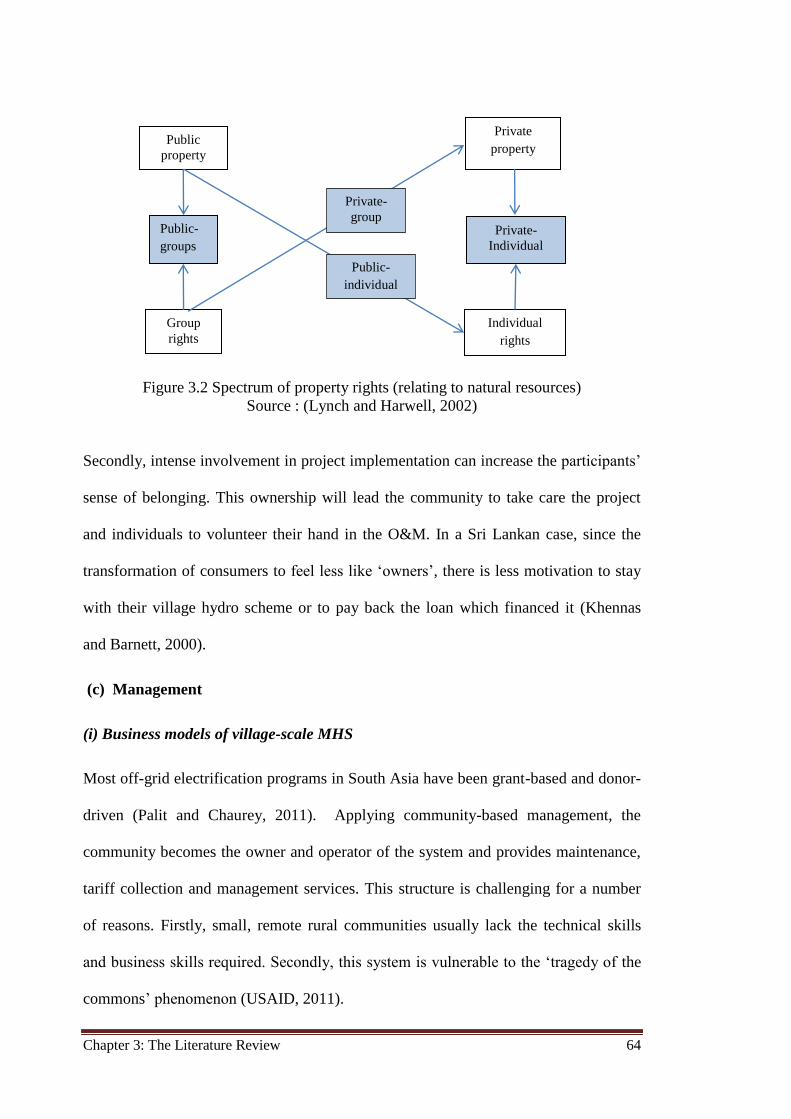
Chapter 3: The Literature Review 64
Figure 3.2 Spectrum of property rights (relating to natural resources)
Source : (Lynch and Harwell, 2002)
Secondly, intense involvement in project implementation can increase the participants’
sense of belonging. This ownership will lead the community to take care the project
and individuals to volunteer their hand in the O&M. In a Sri Lankan case, since the
transformation of consumers to feel less like ‘owners’, there is less motivation to stay
with their village hydro scheme or to pay back the loan which financed it (Khennas
and Barnett, 2000).
(c) Management
(i) Business models of village-scale MHS
Most off-grid electrification programs in South Asia have been grant-based and donor-
driven (Palit and Chaurey, 2011). Applying community-based management, the
community becomes the owner and operator of the system and provides maintenance,
tariff collection and management services. This structure is challenging for a number
of reasons. Firstly, small, remote rural communities usually lack the technical skills
and business skills required. Secondly, this system is vulnerable to the ‘tragedy of the
commons’ phenomenon (USAID, 2011).
Private
property
Private-
Individual
Individual
rights
Public-
groups
as
Group
rights
Public
property
Private-
group
Public-
individual
Chapter 3: The Literature Review 65
Load management may result in problems of a “Tragedy of Commons” type (Hardin,
1968) caused by “free riding” when the MHS projects focussed more on technical
issues and have overlooked the social issues (Shashidharan, 1998) in the planning
stage. Since the incorporation of social engineering into project planning is difficult,
project planners often opt to ignore the social-climatic-geomorphologic (Shashidharan,
1998) in community and social issues, including equity and social justice
(Chakraborty, 1998).
From another point of view, load management problems can also be called social
dilemmas (Kollock, 1998; Probst et al., 1999; Dijk et al., 2003; Mulder et al., 2006;
Herrmann et al., 2008; Bischoff, 2007; Lokhorst et al., 2009; Zettler et al., 2013;
Kugler and Bornstein, 2013). Social dilemmas can be handled by encouraging
cooperation among community members. This cooperation can be formed by using
feelings of shame or honour (Jacquet et al., 2011) or in other terms, using a sanction
system (Mulder et al., 2006). Another way to achieve this is by setting a commitment
that can be reached through communication (Lokhorst et al., 2009).
In term of ensuring project sustainability, setting appropriate tariffs is probably the
most important factor. A sustainable rural electrification tariff must at least cover the
running and replacement costs (break even tariff), even though the opportunity for
profit is key to attracting private operators (financially viable tariffs) (USAID, 2011).
Tariffs must also be set to achieve a balance between commercial viability and
consumers’ ability and willingness to pay.
(d) Environmental aspects
Fresh water is unevenly distributed. Some regions of the world have insufficient,
whereas others have an overabundance. In regard to hydroelectric power, the
characteristics of the location: desert, mountainous area, tropical forest, agricultural
Chapter 3: The Literature Review 66
valleys, urban area, populated or unpopulated, becomes a major concern in terms of
land use transformation and changes to river flow patterns that may generate
significant local impacts (IEA, 2000).
Although the advantages of hydro-electric include zero emissions, a proven and
reliable technology, and also possibility to integrate it with other purposes, MHS
projects need to take into account the availability and the stability of water through the
whole year. As hydro power systems rely on water input, flow variation between
seasons may result in total power generation. In tropical monsoonal regions, heavy
rainfall during the wet season may result in excess power production, while decreasing
flows or even drying up of the river during the dry season will cause interruptions to
power supply.
Climate change has become more apparent and some studies have focused on the
impact of climate change on water resources. Jun Xia (2010) found that the amount of
surface water at the Hai River in North China has decreased 40% over 20 year. Similar
results have also been reported by Page et.al. (2009), who found a reduction in
precipitation of around 10% to 30% and a decrease in flow rates of around 20% to
40% during summer and autumn in four main river basins in France.
Iimi evaluated the impacts of climate change on hydro power schemes in Sri Lanka,
India and Vietnam and concluded that “The climate change impacts in principal differ
from location to location; but as far as the selected three projects are concerned,
hydrological discharges tend to increase with rainfall and decrease with temperature”
(Iimi, 2007).
It is important to bear in mind that the impacts of climate change will vary from one
place to another, and that it is now important to take account of the potential impacts of
Chapter 3: The Literature Review 67
climate change on the river flow in a particular area in which hydro power is planned
so as to prevent any problems in the near future.
In summary, the literature published in this field makes it clear that understanding the
development of micro hydro systems in remote or rural areas as the basis of rural
electrification programmes requires an interdisciplinary approach. Each of the
disciplines involved covers one or more issues, and some of the issues are covered by
more than a single discipline. The various disciplines and issues that need to be
engaged in developing MHS as identified in the literature are:
1. Engineering: Resource assessment, type of system, demand, supply, load
distribution, operation and maintenance, training/technology transfer.
2. Social Science: Community drivers, capacity building, community satisfaction,
social impact.
3. Economics: Local economic characteristic, business model, tariff, funding,
economy impact.
4. Organisational: Institutional framework, leadership, management.
5. Environmental Science: Climate change.
6. Political Science: Government policies

Chapter 3: The Literature Review 68
69
PART II: CASE STUDIES
Chapter 4: Background information on case
study area
Chapter 5: A case study from the ‘Heart of
Borneo’: Ba’kelalan
Chapter 6: A case study from the ‘Heart of
Borneo’: Krayan

70
Chapter 4: Background information on case study area 71
Chapter 4
Background information on case studies area
Overview
This chapter presents background information on the case study area and the regions in
which the case studies used in this thesis are located. This information includes the
energy supply and demand situation and Malaysian and Indonesian government rural
development, energy and renewable energy policies. More detailed information on the
two villages located close to the common border is provided. For both regions, the
descriptions include geographic and demographic information as well as a summary of
their energy supply and use, and the availability of renewable energy resources. This
provides an explanation of the role of electricity produced from micro hydro resources
in the energy mix in these regions. The micro-hydro schemes that have been installed
in the two regions are also described. The purpose of this background information is to
facilitate an understanding of the case study areas and to begin to understand some of
the complexity that is inherent in the planning and implementing MHS projects in
these remote areas.
4.1 Energy situation and energy policies in Malaysia and
Indonesia
4.1.1 Malaysia
With positive economic growth in Malaysia, total national energy demand in 2011 was
4.8% above that of the previous year (Suruhanjaya Tenaga, 2013). The two primary
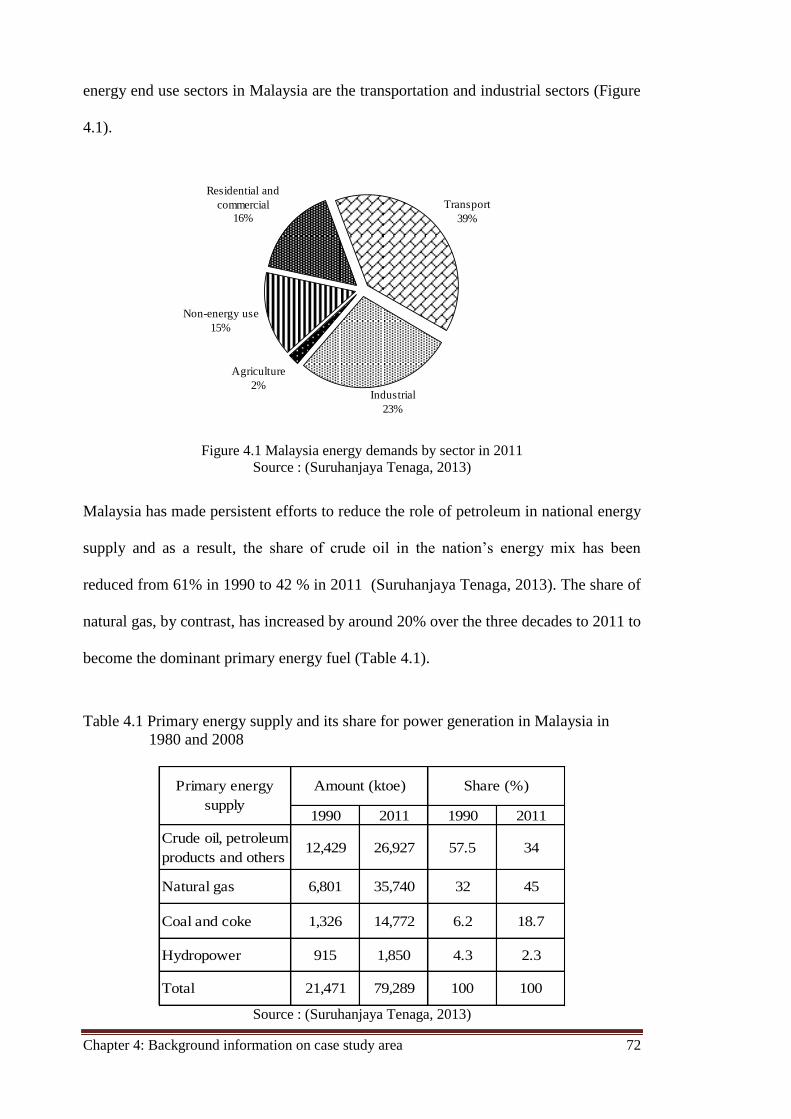
Chapter 4: Background information on case study area 72
energy end use sectors in Malaysia are the transportation and industrial sectors (Figure
4.1).
Figure 4.1 Malaysia energy demands by sector in 2011
Source : (Suruhanjaya Tenaga, 2013)
Malaysia has made persistent efforts to reduce the role of petroleum in national energy
supply and as a result, the share of crude oil in the nation’s energy mix has been
reduced from 61% in 1990 to 42 % in 2011 (Suruhanjaya Tenaga, 2013). The share of
natural gas, by contrast, has increased by around 20% over the three decades to 2011 to
become the dominant primary energy fuel (Table 4.1).
Table 4.1 Primary energy supply and its share for power generation in Malaysia in
1980 and 2008
1990 2011 1990 2011
Crude oil, petroleum
products and others12,429 26,927 57.5 34
Natural gas 6,801 35,740 32 45
Coal and coke 1,326 14,772 6.2 18.7
Hydropower 915 1,850 4.3 2.3
Total 21,471 79,289 100 100
Primary energy
supply
Amount (ktoe) Share (%)
Source : (Suruhanjaya Tenaga, 2013)
Industrial
23%
Agriculture
2%
Non-energy use
15%
Residential and
commercial
16%
Transport
39%
Chapter 4: Background information on case study area 73
In Malaysia, the responsibility for developing and implementing energy policy and
planning is shared by several agencies, including the Ministry of Energy, Green
Technology and Water (KeTTHA), the Energy Commission (Suruhanjaya Tenaga), the
Economic Planning Unit, and the Prime Minister’s Office (PMO), with the PMO
primarily concerned with petroleum-based resources as assigned under PETRONAS
(Academy of Science Malaysia, 2013). A lack of coordination between institutions has
negatively impacted on the implementation of energy efficiency and conservation
(EE&C) and renewable initiatives.
The evolution of the energy sector in Malaysia is supported by various energy policies
and initiatives that aim to ensure adequate energy supply to meet demand. The
economic crisis in 1998 triggered the Government of Malaysia (GOM) to recognise
renewable energy as a fifth fuel in the nation’s electricity generation mix (Hashim and
Ho, 2011). Since the 8th Malaysia Plan, the GOM has launched several policy
initiatives aimed at accelerating the uptake of renewable energy. The evolution of
energy policies in Malaysia is shown in Table 4.2 and the mechanisms used to promote
renewable energy development in Malaysia are shown in Table 4.3.
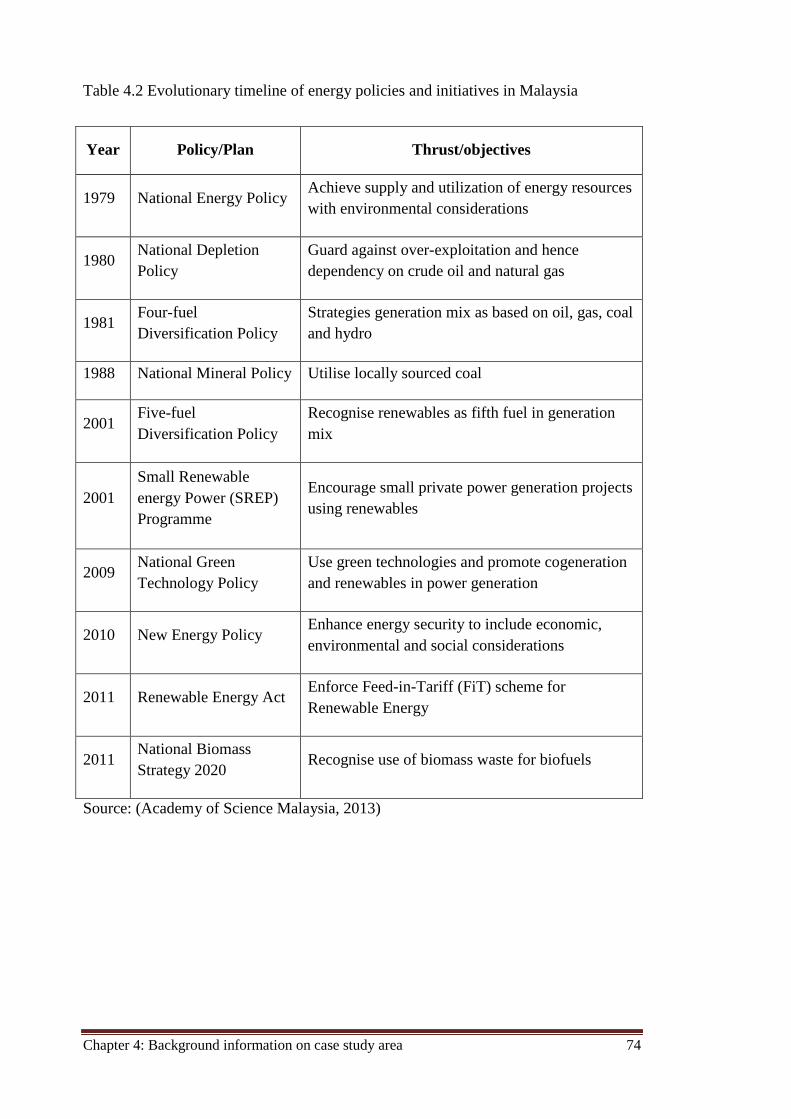
Chapter 4: Background information on case study area 74
Table 4.2 Evolutionary timeline of energy policies and initiatives in Malaysia
Year Policy/Plan Thrust/objectives
1979 National Energy Policy Achieve supply and utilization of energy resources
with environmental considerations
1980 National Depletion
Policy
Guard against over-exploitation and hence
dependency on crude oil and natural gas
1981 Four-fuel
Diversification Policy
Strategies generation mix as based on oil, gas, coal
and hydro
1988 National Mineral Policy Utilise locally sourced coal
2001 Five-fuel
Diversification Policy
Recognise renewables as fifth fuel in generation
mix
2001
Small Renewable
energy Power (SREP)
Programme
Encourage small private power generation projects
using renewables
2009 National Green
Technology Policy
Use green technologies and promote cogeneration
and renewables in power generation
2010 New Energy Policy Enhance energy security to include economic,
environmental and social considerations
2011 Renewable Energy Act Enforce Feed-in-Tariff (FiT) scheme for
Renewable Energy
2011 National Biomass
Strategy 2020 Recognise use of biomass waste for biofuels
Source: (Academy of Science Malaysia, 2013)
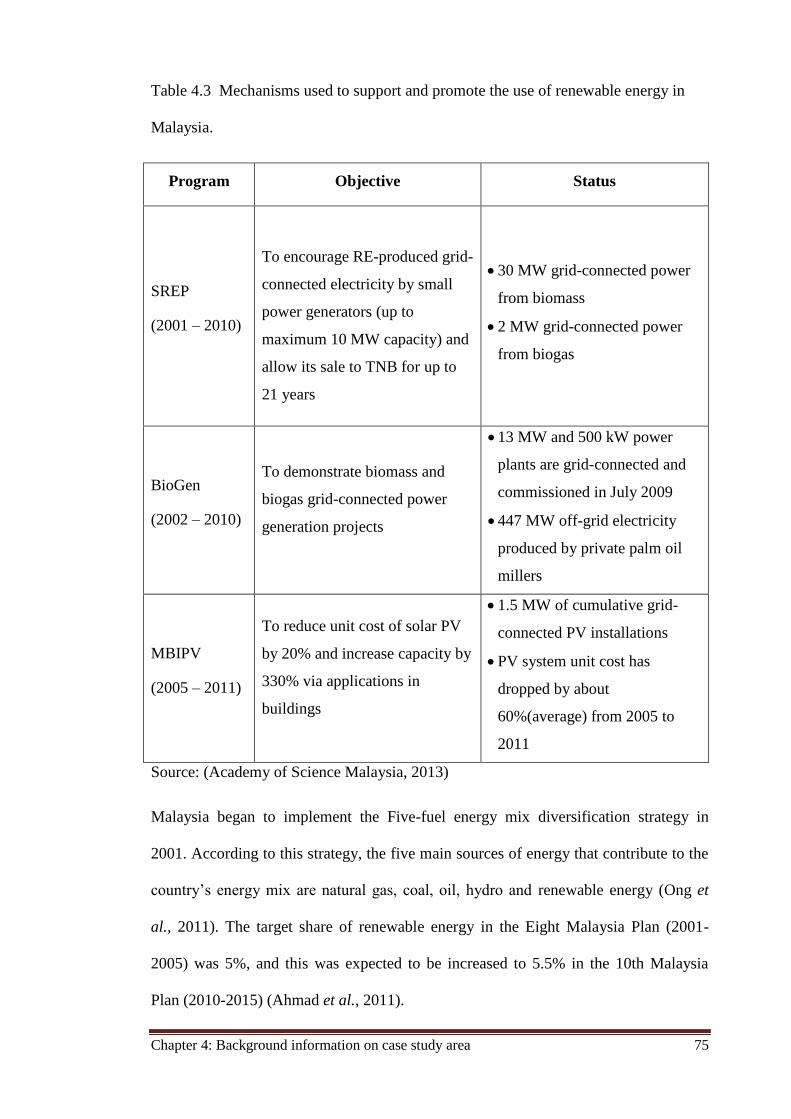
Chapter 4: Background information on case study area 75
Table 4.3 Mechanisms used to support and promote the use of renewable energy in
Malaysia.
Program Objective Status
SREP
(2001 – 2010)
To encourage RE-produced grid-
connected electricity by small
power generators (up to
maximum 10 MW capacity) and
allow its sale to TNB for up to
21 years
· 30 MW grid-connected power
from biomass
· 2 MW grid-connected power
from biogas
BioGen
(2002 – 2010)
To demonstrate biomass and
biogas grid-connected power
generation projects
· 13 MW and 500 kW power
plants are grid-connected and
commissioned in July 2009
· 447 MW off-grid electricity
produced by private palm oil
millers
MBIPV
(2005 – 2011)
To reduce unit cost of solar PV
by 20% and increase capacity by
330% via applications in
buildings
· 1.5 MW of cumulative grid-
connected PV installations
· PV system unit cost has
dropped by about
60%(average) from 2005 to
2011
Source: (Academy of Science Malaysia, 2013)
Malaysia began to implement the Five-fuel energy mix diversification strategy in
2001. According to this strategy, the five main sources of energy that contribute to the
country’s energy mix are natural gas, coal, oil, hydro and renewable energy (Ong et
al., 2011). The target share of renewable energy in the Eight Malaysia Plan (2001-
2005) was 5%, and this was expected to be increased to 5.5% in the 10th Malaysia
Plan (2010-2015) (Ahmad et al., 2011).
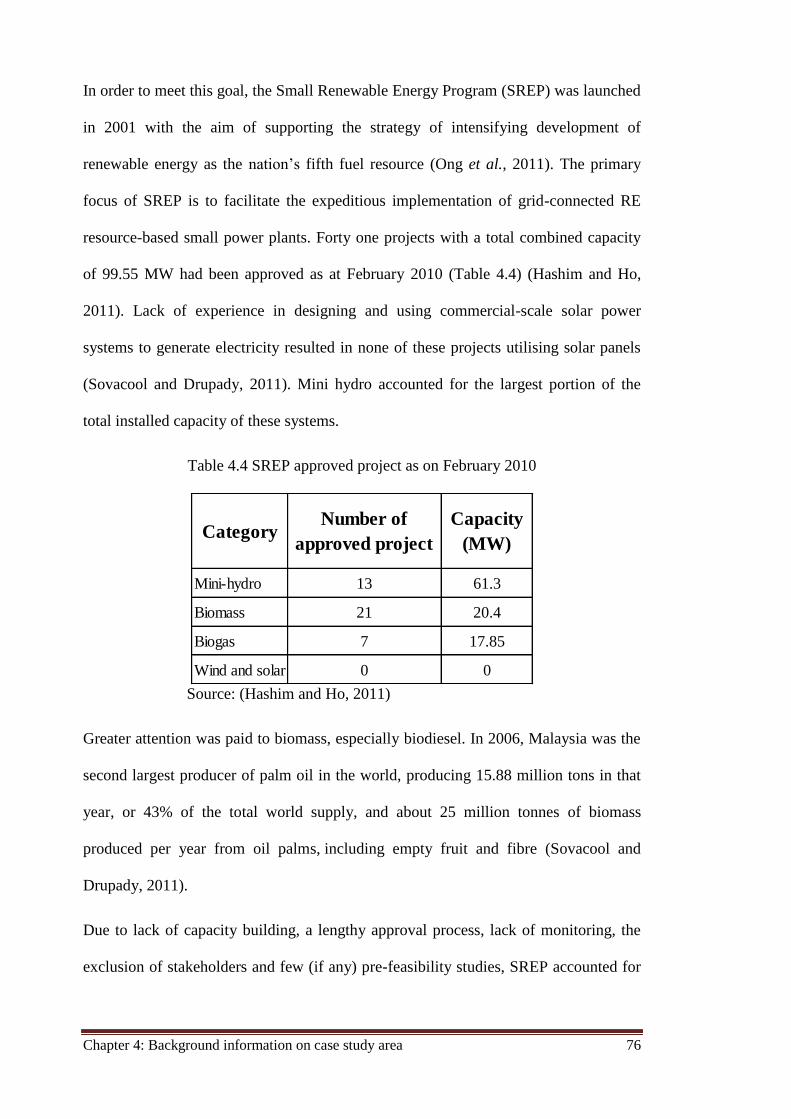
Chapter 4: Background information on case study area 76
In order to meet this goal, the Small Renewable Energy Program (SREP) was launched
in 2001 with the aim of supporting the strategy of intensifying development of
renewable energy as the nation’s fifth fuel resource (Ong et al., 2011). The primary
focus of SREP is to facilitate the expeditious implementation of grid-connected RE
resource-based small power plants. Forty one projects with a total combined capacity
of 99.55 MW had been approved as at February 2010 (Table 4.4) (Hashim and Ho,
2011). Lack of experience in designing and using commercial-scale solar power
systems to generate electricity resulted in none of these projects utilising solar panels
(Sovacool and Drupady, 2011). Mini hydro accounted for the largest portion of the
total installed capacity of these systems.
Table 4.4 SREP approved project as on February 2010
Source: (Hashim and Ho, 2011)
Greater attention was paid to biomass, especially biodiesel. In 2006, Malaysia was the
second largest producer of palm oil in the world, producing 15.88 million tons in that
year, or 43% of the total world supply, and about 25 million tonnes of biomass
produced per year from oil palms, including empty fruit and fibre (Sovacool and
Drupady, 2011).
Due to lack of capacity building, a lengthy approval process, lack of monitoring, the
exclusion of stakeholders and few (if any) pre-feasibility studies, SREP accounted for
CategoryNumber of
approved project
Capacity
(MW)
Mini-hydro 13 61.3
Biomass 21 20.4
Biogas 7 17.85
Wind and solar 0 0
Chapter 4: Background information on case study area 77
only 12 MW compared to a 500 MW target in 2005 and only 61.7 MW compared to a
350 MW target in 2010 (Sovacool and Drupady, 2011).
Another attempt to promote renewable energy is Malaysia’s plan to tap about 29 MW
of its potential hydro resources with most of the focus being on developing large-scale
hydro projects, especially in Sarawak. Although development of mini hydro-electric
plants is a part of the plan at the nationwide level, less support is available for the
development of micro hydro power plants. The state government of Sarawak plans to
increase its hydro capacity to 3,500 MW by 2015, 7723 MW by 2020 and 20 GW by
2030 through the Sarawak Corridor of Renewable Energy (SCORE) programme in
order to transform Sarawak into a developed state by the year 2020 (Sovacool and
Bulan, 2012). These mega hydro projects will produce excess power that will be
exported to Sabah and the Malay Peninsula. This program, however, will not connect
the interior of Sarawak to this grid, since many of the remote communities in Sarawak
are located more than 10 km from the grid, which has been deemed the maximum
distance for connection to the grid. The electrification of remote communities will rely
instead on the rural electrification program.
In relation to rural electrification, the Ministry of Rural Development, as the
coordinator and planner of rural development programs and strategies, provides
electricity for traditional villages and remote areas under the Bekalan Elektrik Luar
Bandar (BELB) or rural electrification program, which either connects the villages to a
grid or provides a stand-alone power supply system. In order to reduce the gap
between the electrification coverage of Sabah–Sarawak and Peninsular Malaysia, this
program offered financial support based on two strategies:
1. Grid connection with the limitation of 33 kV delivery line for the villages with a
large number of dwellings, including schools, clinics and other facilities;
Chapter 4: Background information on case study area 78
2. Utilising alternative resources, such as solar photovoltaic, diesel generator sets, or
solar hybrid for villages located a distance of 10 km or more from the nearest 11 kV
grid line and for which there is no plan for a grid connection within the next five
years (Ministry of Rural Development, 2008). Under this scheme, the villagers need
to cover the cost of house wiring and meters, and the users pay for their electricity
in line with national electricity tariff. The operation and maintenance of this scheme
is handled by the State Electricity Board.
Borhanazad et.al (2013) reported that of the 37 rural electrification projects
established by the Department of Rural Development between 2004 to 2010, all but
one are solar-MHS hybrid systems. The exception is the system installed in Pulau
Perhentian Kecil, Trengganu, which is a wind turbine - solar hybrid system
(Borhanazad et al., 2013).
Another attempt to lift the use of renewable energy, especially hydro, was made by the
Tenaga Nasional Bhd (TNB) to complete the rehabilitation of its 26 mini hydro-
powered plants by mid-2011 after taking them over from Projass Engineering Sdn Bhd
(The Star, 2010; Liang, 2010). Again, the focus of this program is on mini hydro-
powered plants and there has been no focus on micro hydro plant.
Availability of material on government policies, reports and studies relating to micro
hydro project is limited. What is available is presented here. A survey of micro hydro
potential in Sarawak was carried out by the Sarawak Energy R&D, which surveyed
104 sites in 8 divisions in Sarawak to identify the hydro potential. In Limbang
Division two villages of Ba’kelalan, namely Long Ritan and Buduk Nur have potential
of 50 kW and 134 kW respectively (Sarawak Energy, n.d). Raman et al., (2009)
undertook hydro potential survey in Peninsula Malaysia found that 109 sites had micro
hydro potential of 20.4 MW in total.
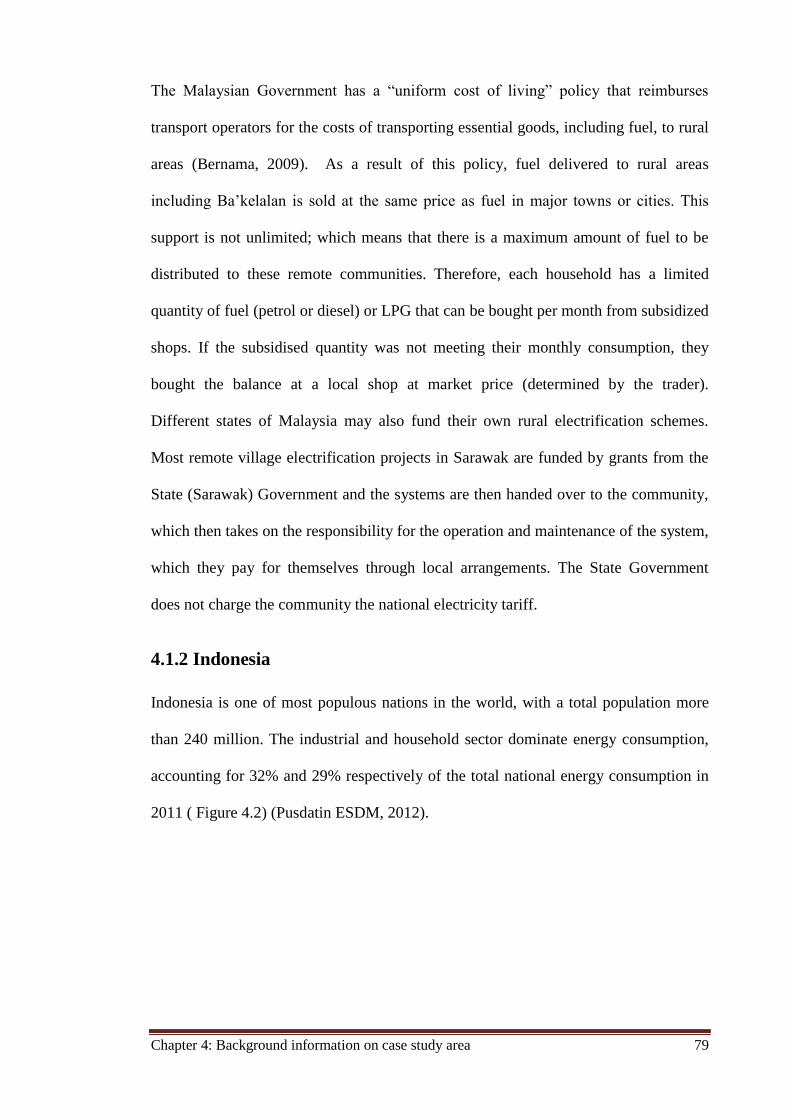
Chapter 4: Background information on case study area 79
The Malaysian Government has a “uniform cost of living” policy that reimburses
transport operators for the costs of transporting essential goods, including fuel, to rural
areas (Bernama, 2009). As a result of this policy, fuel delivered to rural areas
including Ba’kelalan is sold at the same price as fuel in major towns or cities. This
support is not unlimited; which means that there is a maximum amount of fuel to be
distributed to these remote communities. Therefore, each household has a limited
quantity of fuel (petrol or diesel) or LPG that can be bought per month from subsidized
shops. If the subsidised quantity was not meeting their monthly consumption, they
bought the balance at a local shop at market price (determined by the trader).
Different states of Malaysia may also fund their own rural electrification schemes.
Most remote village electrification projects in Sarawak are funded by grants from the
State (Sarawak) Government and the systems are then handed over to the community,
which then takes on the responsibility for the operation and maintenance of the system,
which they pay for themselves through local arrangements. The State Government
does not charge the community the national electricity tariff.
4.1.2 Indonesia
Indonesia is one of most populous nations in the world, with a total population more
than 240 million. The industrial and household sector dominate energy consumption,
accounting for 32% and 29% respectively of the total national energy consumption in
2011 ( Figure 4.2) (Pusdatin ESDM, 2012).
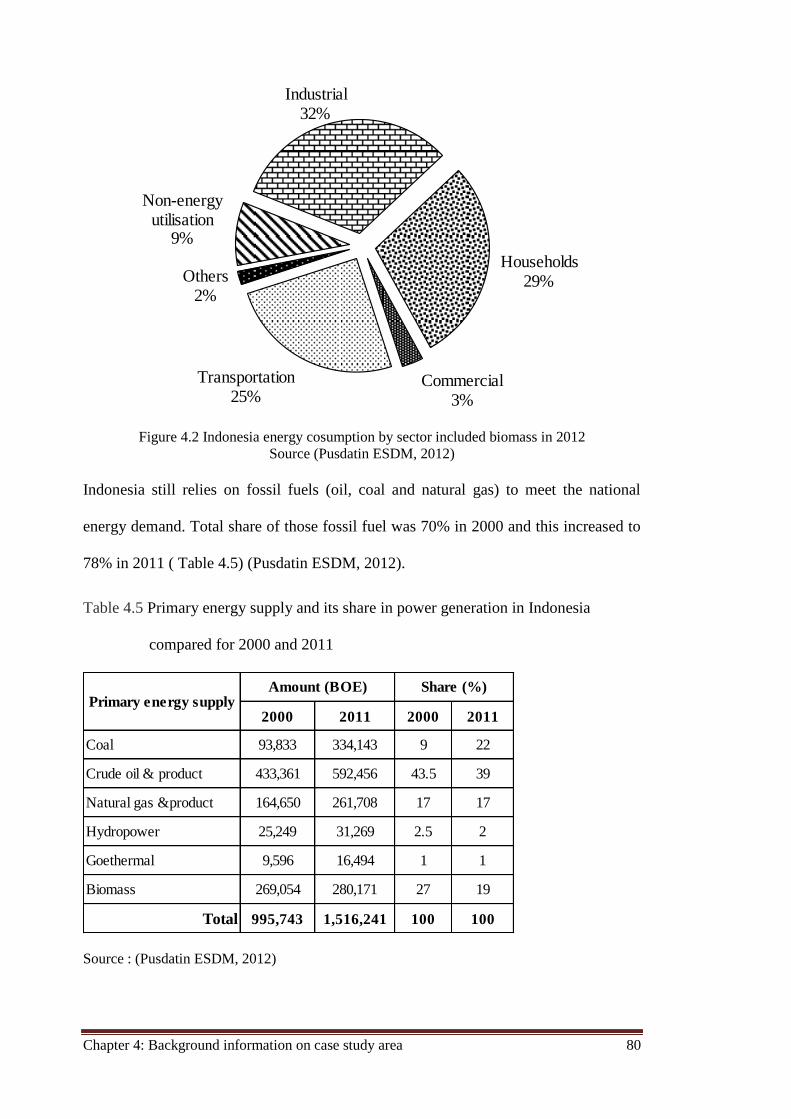
Chapter 4: Background information on case study area 80
Figure 4.2 Indonesia energy cosumption by sector included biomass in 2012
Source (Pusdatin ESDM, 2012)
Indonesia still relies on fossil fuels (oil, coal and natural gas) to meet the national
energy demand. Total share of those fossil fuel was 70% in 2000 and this increased to
78% in 2011 ( Table 4.5) (Pusdatin ESDM, 2012).
Table 4.5 Primary energy supply and its share in power generation in Indonesia
compared for 2000 and 2011
Source : (Pusdatin ESDM, 2012)
Transportation25%
Others2%
Non-energy utilisation
9%
Industrial 32%
Households29%
Commercial3%
2000 2011 2000 2011
Coal 93,833 334,143 9 22
Crude oil & product 433,361 592,456 43.5 39
Natural gas &product 164,650 261,708 17 17
Hydropower 25,249 31,269 2.5 2
Goethermal 9,596 16,494 1 1
Biomass 269,054 280,171 27 19
Total 995,743 1,516,241 100 100
Amount (BOE) Share (%)Primary energy supply
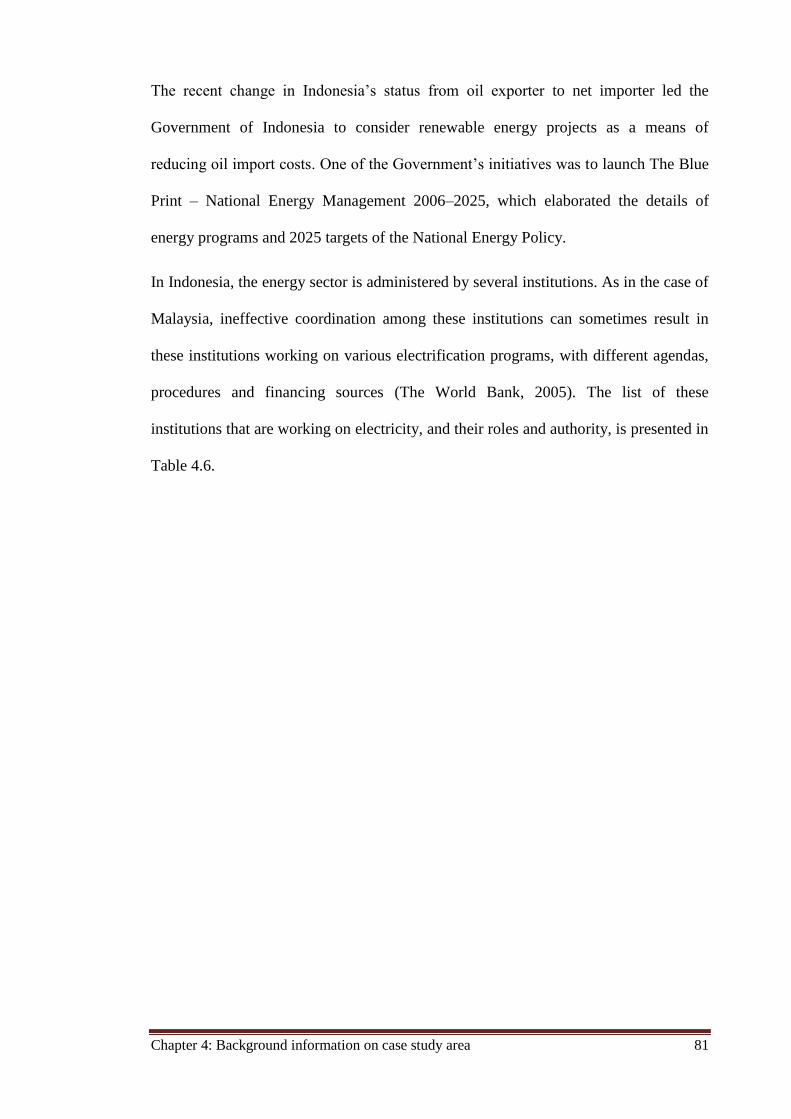
Chapter 4: Background information on case study area 81
The recent change in Indonesia’s status from oil exporter to net importer led the
Government of Indonesia to consider renewable energy projects as a means of
reducing oil import costs. One of the Government’s initiatives was to launch The Blue
Print – National Energy Management 2006–2025, which elaborated the details of
energy programs and 2025 targets of the National Energy Policy.
In Indonesia, the energy sector is administered by several institutions. As in the case of
Malaysia, ineffective coordination among these institutions can sometimes result in
these institutions working on various electrification programs, with different agendas,
procedures and financing sources (The World Bank, 2005). The list of these
institutions that are working on electricity, and their roles and authority, is presented in
Table 4.6.
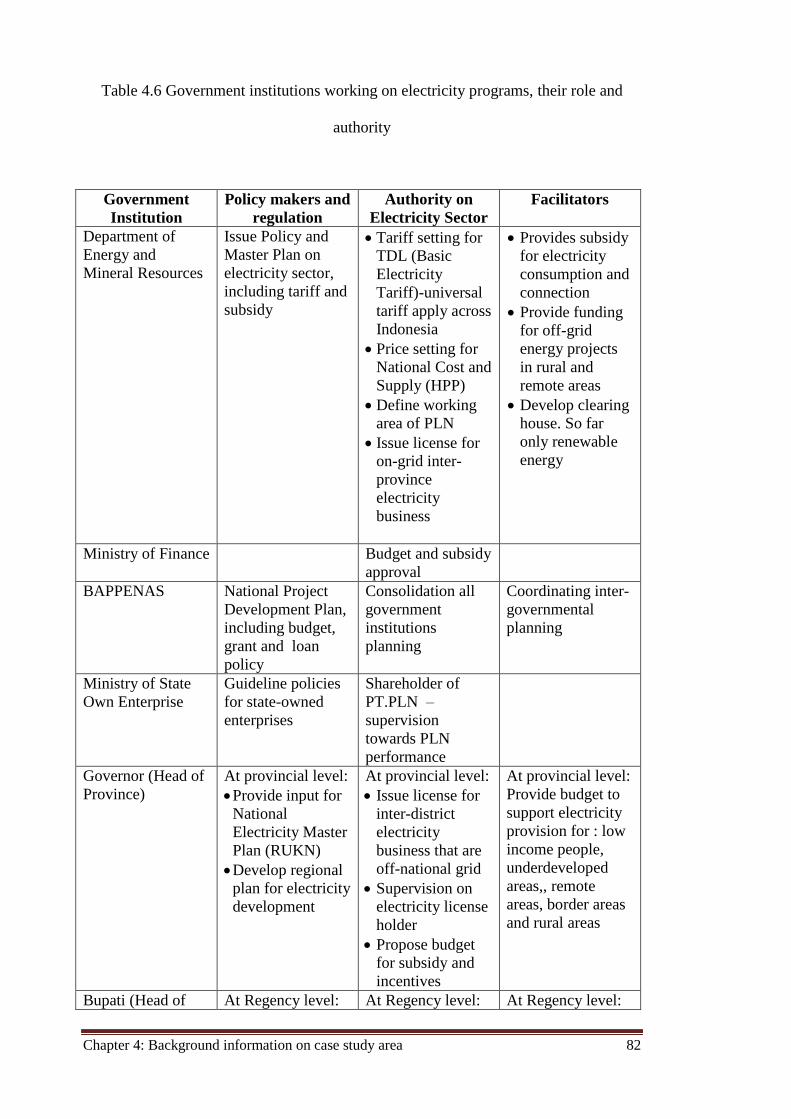
Chapter 4: Background information on case study area 82
Table 4.6 Government institutions working on electricity programs, their role and
authority
Government
Institution
Policy makers and
regulation
Authority on
Electricity Sector
Facilitators
Department of
Energy and
Mineral Resources
Issue Policy and
Master Plan on
electricity sector,
including tariff and
subsidy
· Tariff setting for
TDL (Basic
Electricity
Tariff)-universal
tariff apply across
Indonesia
· Price setting for
National Cost and
Supply (HPP)
· Define working
area of PLN
· Issue license for
on-grid inter-
province
electricity
business
· Provides subsidy
for electricity
consumption and
connection
· Provide funding
for off-grid
energy projects
in rural and
remote areas
· Develop clearing
house. So far
only renewable
energy
Ministry of Finance Budget and subsidy
approval
BAPPENAS National Project
Development Plan,
including budget,
grant and loan
policy
Consolidation all
government
institutions
planning
Coordinating inter-
governmental
planning
Ministry of State
Own Enterprise
Guideline policies
for state-owned
enterprises
Shareholder of
PT.PLN –
supervision
towards PLN
performance
Governor (Head of
Province)
At provincial level:
· Provide input for
National
Electricity Master
Plan (RUKN)
· Develop regional
plan for electricity
development
At provincial level:
· Issue license for
inter-district
electricity
business that are
off-national grid
· Supervision on
electricity license
holder
· Propose budget
for subsidy and
incentives
At provincial level:
Provide budget to
support electricity
provision for : low
income people,
underdeveloped
areas,, remote
areas, border areas
and rural areas
Bupati (Head of At Regency level: At Regency level: At Regency level:
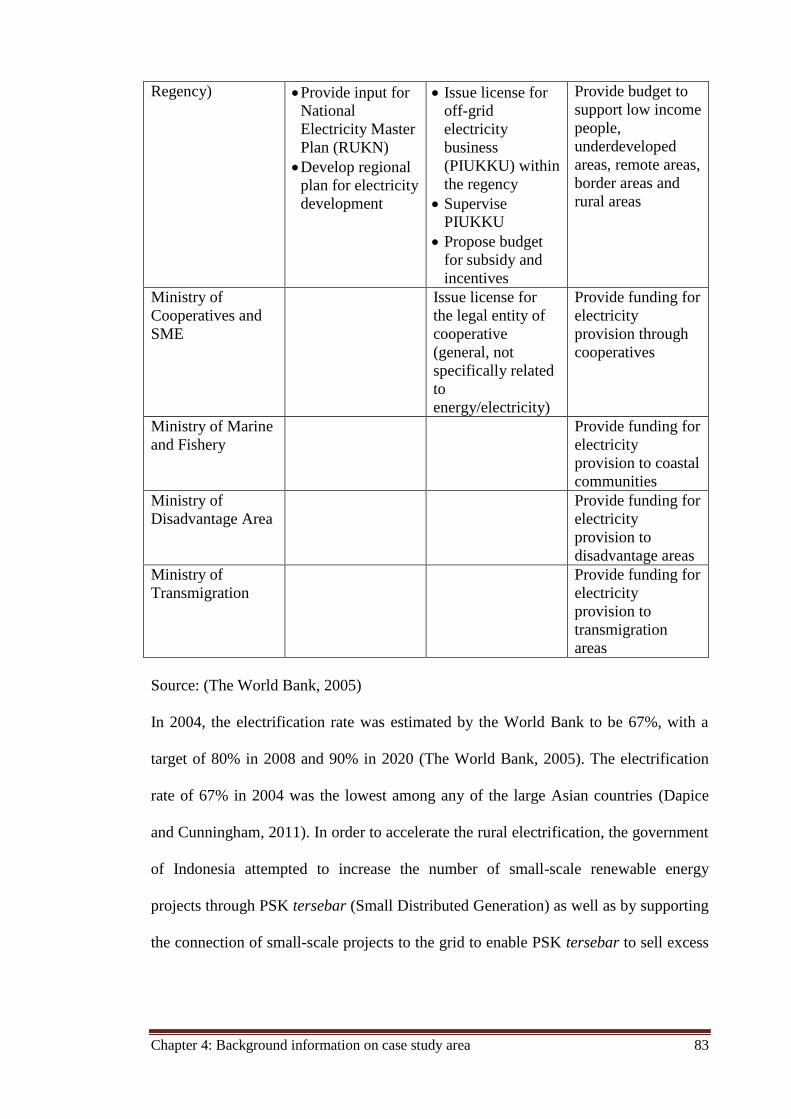
Chapter 4: Background information on case study area 83
Regency) · Provide input for
National
Electricity Master
Plan (RUKN)
· Develop regional
plan for electricity
development
· Issue license for
off-grid
electricity
business
(PIUKKU) within
the regency
· Supervise
PIUKKU
· Propose budget
for subsidy and
incentives
Provide budget to
support low income
people,
underdeveloped
areas, remote areas,
border areas and
rural areas
Ministry of
Cooperatives and
SME
Issue license for
the legal entity of
cooperative
(general, not
specifically related
to
energy/electricity)
Provide funding for
electricity
provision through
cooperatives
Ministry of Marine
and Fishery
Provide funding for
electricity
provision to coastal
communities
Ministry of
Disadvantage Area
Provide funding for
electricity
provision to
disadvantage areas
Ministry of
Transmigration
Provide funding for
electricity
provision to
transmigration
areas
Source: (The World Bank, 2005)
In 2004, the electrification rate was estimated by the World Bank to be 67%, with a
target of 80% in 2008 and 90% in 2020 (The World Bank, 2005). The electrification
rate of 67% in 2004 was the lowest among any of the large Asian countries (Dapice
and Cunningham, 2011). In order to accelerate the rural electrification, the government
of Indonesia attempted to increase the number of small-scale renewable energy
projects through PSK tersebar (Small Distributed Generation) as well as by supporting
the connection of small-scale projects to the grid to enable PSK tersebar to sell excess
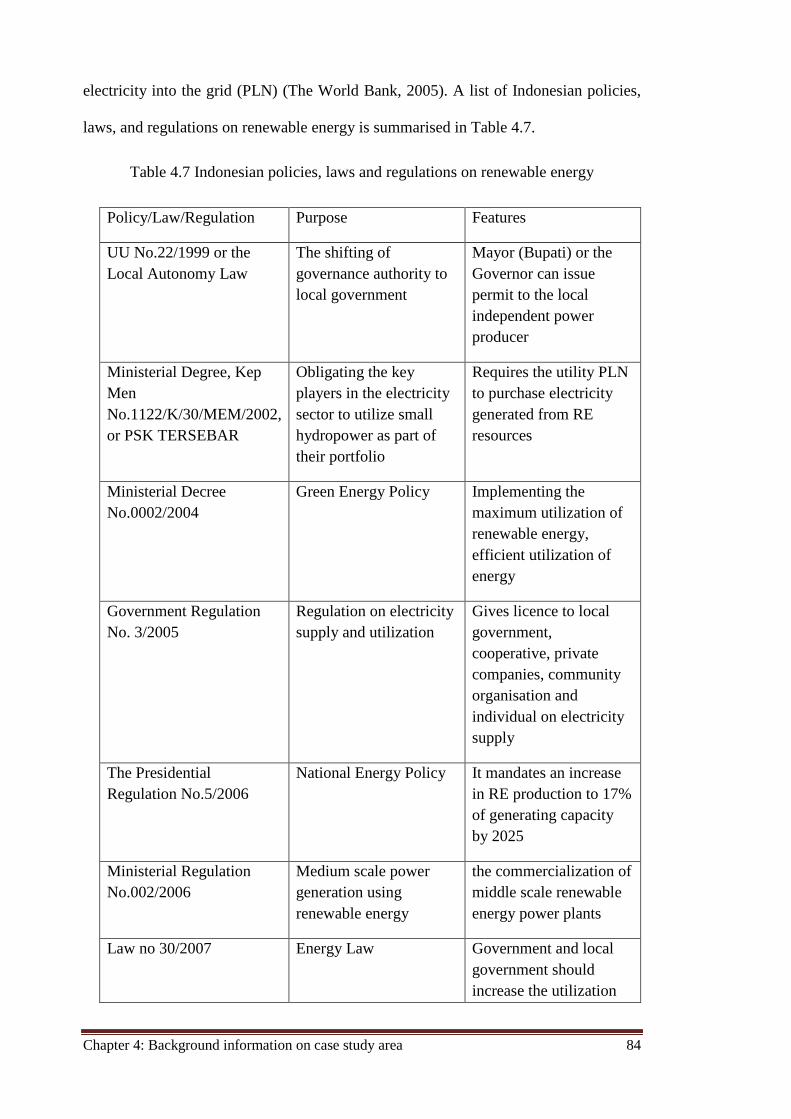
Chapter 4: Background information on case study area 84
electricity into the grid (PLN) (The World Bank, 2005). A list of Indonesian policies,
laws, and regulations on renewable energy is summarised in Table 4.7.
Table 4.7 Indonesian policies, laws and regulations on renewable energy
Policy/Law/Regulation Purpose Features
UU No.22/1999 or the
Local Autonomy Law
The shifting of
governance authority to
local government
Mayor (Bupati) or the
Governor can issue
permit to the local
independent power
producer
Ministerial Degree, Kep
Men
No.1122/K/30/MEM/2002,
or PSK TERSEBAR
Obligating the key
players in the electricity
sector to utilize small
hydropower as part of
their portfolio
Requires the utility PLN
to purchase electricity
generated from RE
resources
Ministerial Decree
No.0002/2004
Green Energy Policy Implementing the
maximum utilization of
renewable energy,
efficient utilization of
energy
Government Regulation
No. 3/2005
Regulation on electricity
supply and utilization
Gives licence to local
government,
cooperative, private
companies, community
organisation and
individual on electricity
supply
The Presidential
Regulation No.5/2006
National Energy Policy It mandates an increase
in RE production to 17%
of generating capacity
by 2025
Ministerial Regulation
No.002/2006
Medium scale power
generation using
renewable energy
the commercialization of
middle scale renewable
energy power plants
Law no 30/2007 Energy Law Government and local
government should
increase the utilization
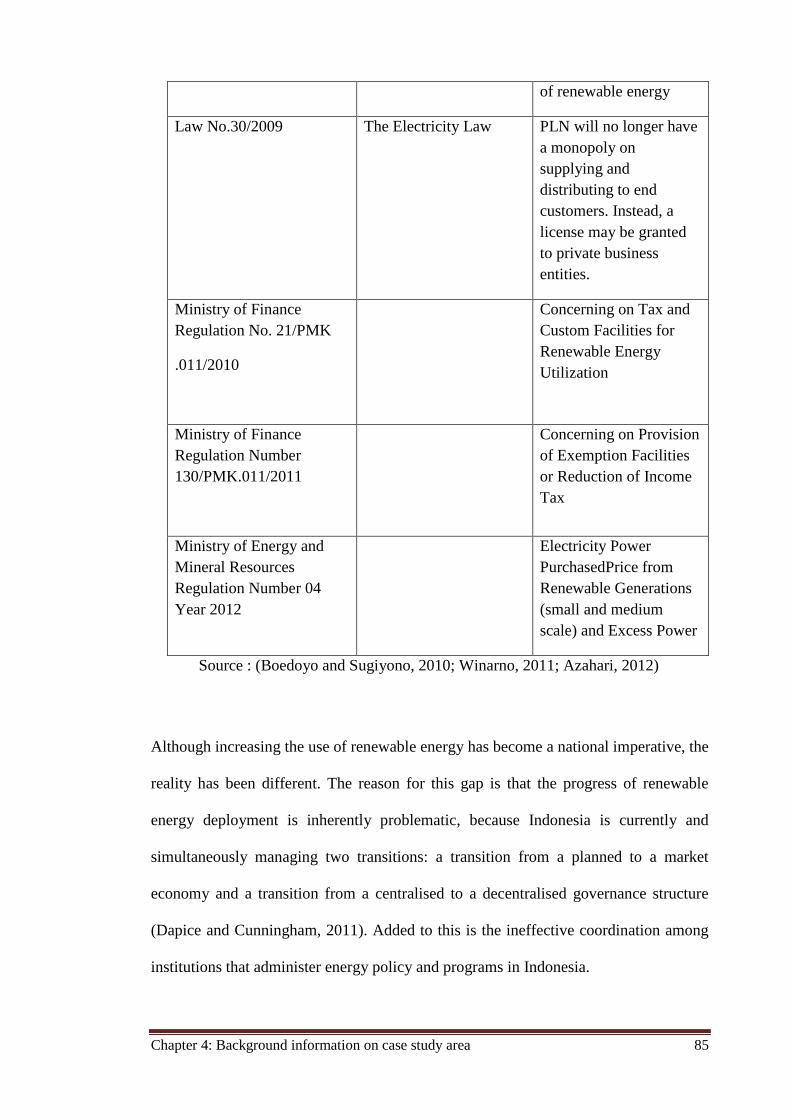
Chapter 4: Background information on case study area 85
of renewable energy
Law No.30/2009 The Electricity Law PLN will no longer have
a monopoly on
supplying and
distributing to end
customers. Instead, a
license may be granted
to private business
entities.
Ministry of Finance
Regulation No. 21/PMK
.011/2010
Concerning on Tax and
Custom Facilities for
Renewable Energy
Utilization
Ministry of Finance
Regulation Number
130/PMK.011/2011
Concerning on Provision
of Exemption Facilities
or Reduction of Income
Tax
Ministry of Energy and
Mineral Resources
Regulation Number 04
Year 2012
Electricity Power
PurchasedPrice from
Renewable Generations
(small and medium
scale) and Excess Power
Source : (Boedoyo and Sugiyono, 2010; Winarno, 2011; Azahari, 2012)
Although increasing the use of renewable energy has become a national imperative, the
reality has been different. The reason for this gap is that the progress of renewable
energy deployment is inherently problematic, because Indonesia is currently and
simultaneously managing two transitions: a transition from a planned to a market
economy and a transition from a centralised to a decentralised governance structure
(Dapice and Cunningham, 2011). Added to this is the ineffective coordination among
institutions that administer energy policy and programs in Indonesia.
Chapter 4: Background information on case study area 86
The lack of capacity or understanding in micro hydro technology, especially at the
provincial and regency levels of government, which have been given more autonomy
to conduct programs, has meant that provincial and regency governments continue to
prefer to use diesel generators rather than renewable energy resources, including micro
hydro.
Indonesia is an archipelago consisting of over 17,500 islands with sixty percent of the
population living in rural areas (about 180 sub-districts and 42,000 villages). This
archipelagic geography has hindered the progress of rural electrification in Indonesia
as grid extension programs are difficult and expensive (Dapice and Cunningham,
2011). The adoption of decentralised electricity supply systems therefore often offers a
lower cost alternative. This alternative also has the added benefit of improving local
energy independence by using locally available resources (Boedoyo and Sugiyono,
2010).
4.2 Implementation of MHS in Malaysia and Indonesia
4.2.1 Malaysia
There are limited references to micro hydro projects in Malaysia. Some projects that
have been successfully documented are presented here. Since 1991, Jabatan Kerja
Raya (JKR) (Public Works Department), Sarawak has contributed to the renewable
energy project by installing solar photovoltaic cells in public facilities, such as clinics,
schools and community halls in remote areas like Bario, Long Banga and Long Akah
and using micro hydro in Telok Melano and Bario (Min et al., 2011). NGOs including
Green Empowerment, The Borneo Project, The Long Lawen Community, the PACOS
Trust, Sahabat Alam Malaysia, Seacology - Friends of Malaysia, and Energreen
Foundation raised funds for a 10 kW MHS in Long Lawen, Sarawak. Initiated in 1999
Chapter 4: Background information on case study area 87
and commissioned in 2001, this MHS serves 70 households that were translocated to
Long Lawen due to the construction of the Bakun Dam (Green Empowerment and
Richards, 2004). The PACOS Trust, a community based NGO, and Era Wira Sdn. Bhd
developed two 5 kW MHSs that were initiated in 2003 and ready to serve communities
in Kampong Terian, Papar, Sabah and Kampong Bantul, Pensiangan, Sabah in 2005
(Lasimbang, 2009). Another MHS built in Sarawak was the 30 kW MHS in Abok
Mawang village, that was commissioned in May 2007 (Anyi et al., 2010). This project
enabled people living in Abok Mawang village to enjoy cheap electricity from the
MHS. As a result, neighbouring villages soon developed an interest constructing their
own MHS. In 2009, a 40 kW MHS was built in kampong Bario Asal, Sarawak
(Lasimbang, 2009). A collaboration between TONIBUNG and other parties
successfully developed MHS in Long Lamai, Ulu Baram, Sarawak, Kampung
Babalitan, Sabah, Tanjung Rambai, West Malaysia (Wynn, 2013).
TONIBUNG and Era Wira Sdn. Bhd, with the help of the UNDP’s Global
Environment Facility Small Grants Programme (GEF SGP) helped to develop eleven
community-based micro-hydro projects, mainly in Sabah and Sarawak and including
Kampong Buayan, Penampang, Sabah (2008-2010), Pagalungan Sub District
(Kampong Inakaak), Pensiangan, Sabah (2010-2012), Tapang Pungga Longhouse,
Sarawak in 2011 (subsequently renovated during 2012-2014), Ulu Papar village,
(2012-2014) (The GEF-SGP, n.d)
4.2.2 Indonesia
Indonesia is endowed throughout the country with abundant hydro potential which is
suitable for both small and micro systems. It has been reported that approximately 700
MW of total hydro capacity is economically feasible from about 6,000 in the mini
hydropower range (Hasan et al., 2012). Realising this opportunity, the GOI has
Chapter 4: Background information on case study area 88
supported the concept of constructing mini and micro hydro projects in selected areas.
Between 2007 and 2010, with donor funding from UNDP-GEF, the Integrated Micro-
hydro Development and Application Program (IMIDAP) assisted the Government of
Indonesia to enhance capacity building, including technical training and business
planning development for local micro hydro developers, workshops and private or
community-based users (United Nations Development Programme, 2006)
Over the past two decades, the People-Centred Business and Economic Institute
(IBEKA), a non-governmental organisation that develops small hydropower projects,
has built 50 micro hydro projects with capacities ranging from 5 to 400 kilowatts that
supply power to up to 800 households (Schonhardt, 2011). By the year 2010 over 223
turbines of various capacities and types were produced by PT Heksa Prakarsa Teknik
to support MHS projects throughout the nation (Raharjo, 2011).
Micro hydropower schemes have been implemented in Indonesia with the support of
various programmes, including government and non-government programmes. An
indication of these many micro hydro implementation programs and their funding
sources are shown in Table 4.8.
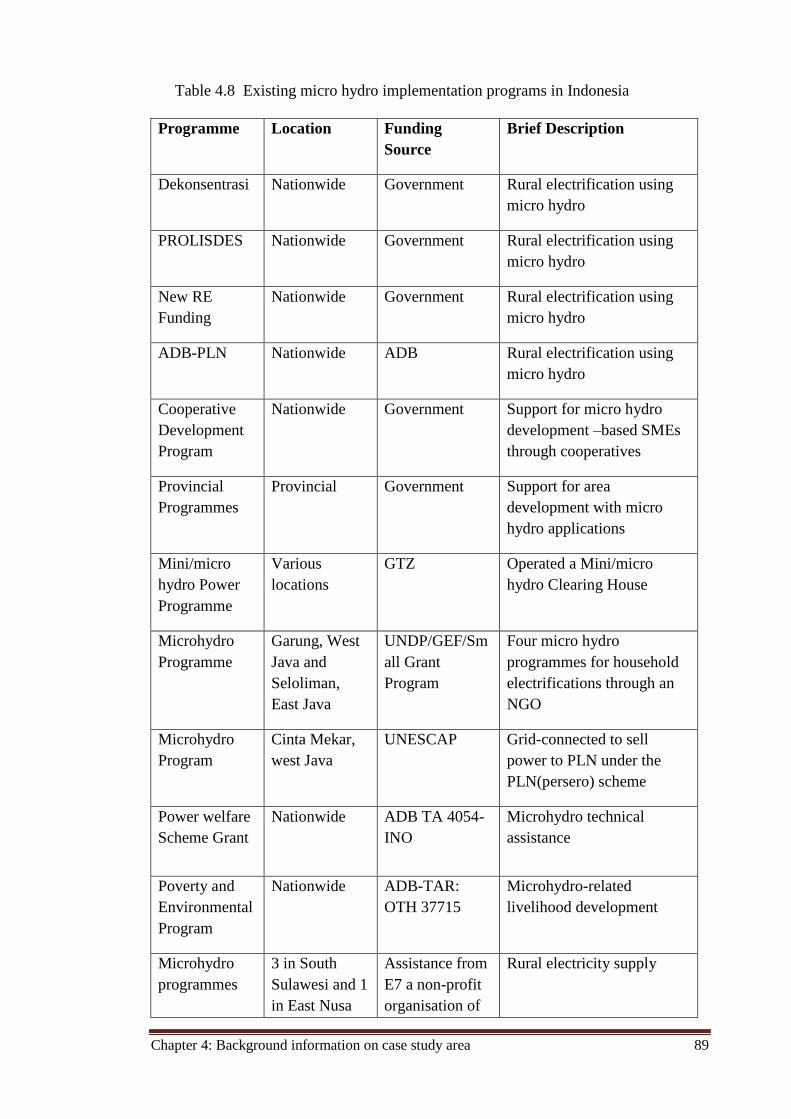
Chapter 4: Background information on case study area 89
Table 4.8 Existing micro hydro implementation programs in Indonesia
Programme Location Funding
Source
Brief Description
Dekonsentrasi Nationwide Government Rural electrification using
micro hydro
PROLISDES Nationwide Government Rural electrification using
micro hydro
New RE
Funding
Nationwide Government Rural electrification using
micro hydro
ADB-PLN Nationwide ADB Rural electrification using
micro hydro
Cooperative
Development
Program
Nationwide Government Support for micro hydro
development –based SMEs
through cooperatives
Provincial
Programmes
Provincial Government Support for area
development with micro
hydro applications
Mini/micro
hydro Power
Programme
Various
locations
GTZ Operated a Mini/micro
hydro Clearing House
Microhydro
Programme
Garung, West
Java and
Seloliman,
East Java
UNDP/GEF/Sm
all Grant
Program
Four micro hydro
programmes for household
electrifications through an
NGO
Microhydro
Program
Cinta Mekar,
west Java
UNESCAP Grid-connected to sell
power to PLN under the
PLN(persero) scheme
Power welfare
Scheme Grant
Nationwide
ADB TA 4054-
INO
Microhydro technical
assistance
Poverty and
Environmental
Program
Nationwide ADB-TAR:
OTH 37715
Microhydro-related
livelihood development
Microhydro
programmes
3 in South
Sulawesi and 1
in East Nusa
Assistance from
E7 a non-profit
organisation of
Rural electricity supply
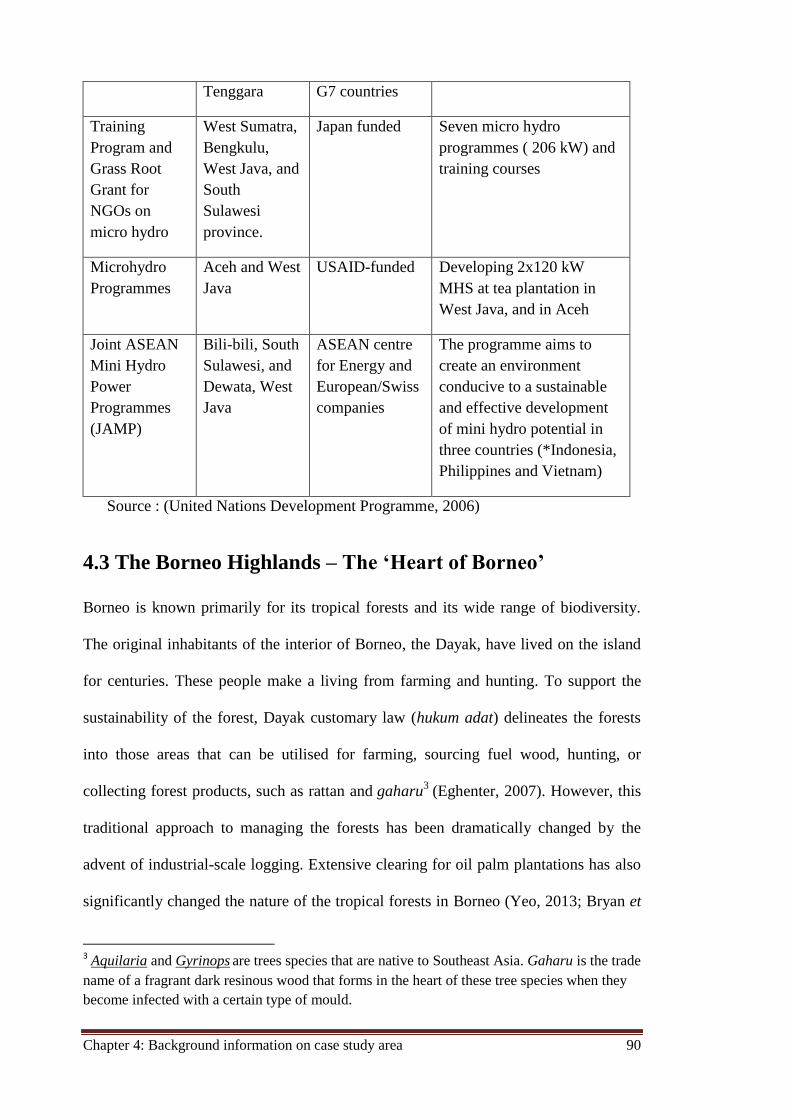
Chapter 4: Background information on case study area 90
Tenggara G7 countries
Training
Program and
Grass Root
Grant for
NGOs on
micro hydro
West Sumatra,
Bengkulu,
West Java, and
South
Sulawesi
province.
Japan funded Seven micro hydro
programmes ( 206 kW) and
training courses
Microhydro
Programmes
Aceh and West
Java
USAID-funded Developing 2x120 kW
MHS at tea plantation in
West Java, and in Aceh
Joint ASEAN
Mini Hydro
Power
Programmes
(JAMP)
Bili-bili, South
Sulawesi, and
Dewata, West
Java
ASEAN centre
for Energy and
European/Swiss
companies
The programme aims to
create an environment
conducive to a sustainable
and effective development
of mini hydro potential in
three countries (*Indonesia,
Philippines and Vietnam)
Source : (United Nations Development Programme, 2006)
4.3 The Borneo Highlands – The ‘Heart of Borneo’
Borneo is known primarily for its tropical forests and its wide range of biodiversity.
The original inhabitants of the interior of Borneo, the Dayak, have lived on the island
for centuries. These people make a living from farming and hunting. To support the
sustainability of the forest, Dayak customary law (hukum adat) delineates the forests
into those areas that can be utilised for farming, sourcing fuel wood, hunting, or
collecting forest products, such as rattan and gaharu3
(Eghenter, 2007). However, this
traditional approach to managing the forests has been dramatically changed by the
advent of industrial-scale logging. Extensive clearing for oil palm plantations has also
significantly changed the nature of the tropical forests in Borneo (Yeo, 2013; Bryan et
3 Aquilaria and Gyrinops
are trees species that are native to Southeast Asia. Gaharu is the trade
name of a fragrant dark resinous wood that forms in the heart of these tree species when they
become infected with a certain type of mould.
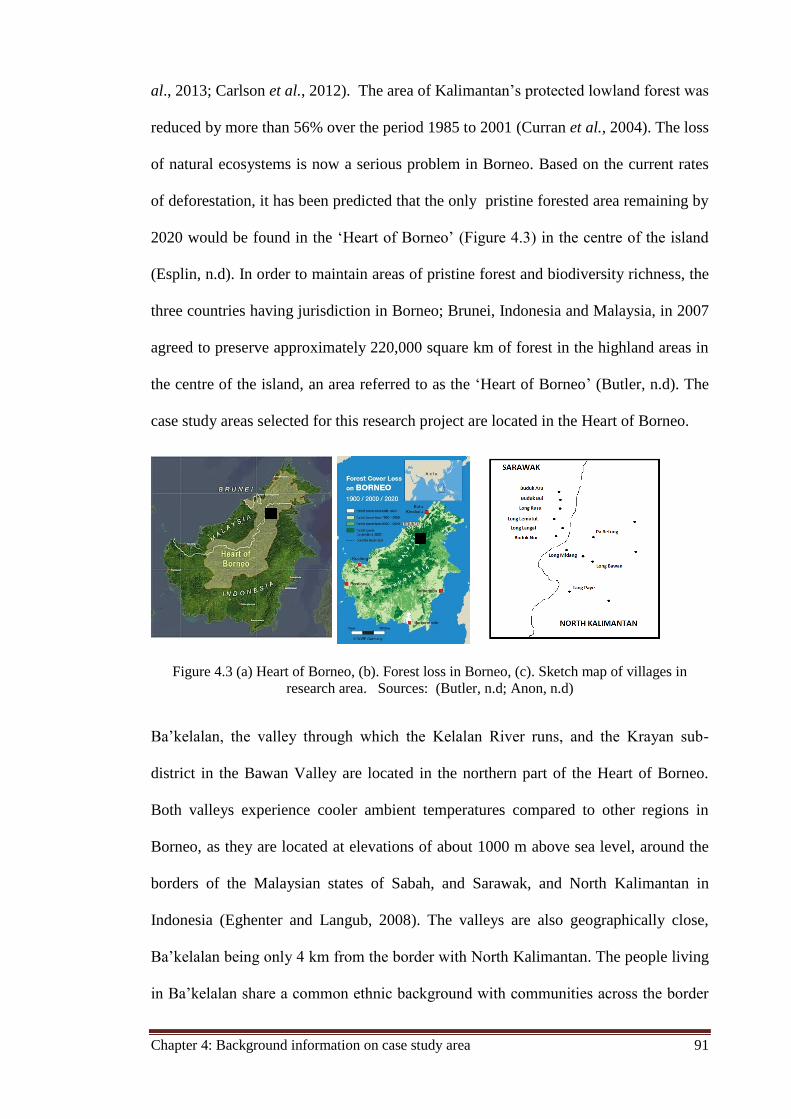
Chapter 4: Background information on case study area 91
al., 2013; Carlson et al., 2012). The area of Kalimantan’s protected lowland forest was
reduced by more than 56% over the period 1985 to 2001 (Curran et al., 2004). The loss
of natural ecosystems is now a serious problem in Borneo. Based on the current rates
of deforestation, it has been predicted that the only pristine forested area remaining by
2020 would be found in the ‘Heart of Borneo’ (Figure 4.3) in the centre of the island
(Esplin, n.d). In order to maintain areas of pristine forest and biodiversity richness, the
three countries having jurisdiction in Borneo; Brunei, Indonesia and Malaysia, in 2007
agreed to preserve approximately 220,000 square km of forest in the highland areas in
the centre of the island, an area referred to as the ‘Heart of Borneo’ (Butler, n.d). The
case study areas selected for this research project are located in the Heart of Borneo.
Figure 4.3 (a) Heart of Borneo, (b). Forest loss in Borneo, (c). Sketch map of villages in
research area. Sources: (Butler, n.d; Anon, n.d)
Ba’kelalan, the valley through which the Kelalan River runs, and the Krayan sub-
district in the Bawan Valley are located in the northern part of the Heart of Borneo.
Both valleys experience cooler ambient temperatures compared to other regions in
Borneo, as they are located at elevations of about 1000 m above sea level, around the
borders of the Malaysian states of Sabah, and Sarawak, and North Kalimantan in
Indonesia (Eghenter and Langub, 2008). The valleys are also geographically close,
Ba’kelalan being only 4 km from the border with North Kalimantan. The people living
in Ba’kelalan share a common ethnic background with communities across the border
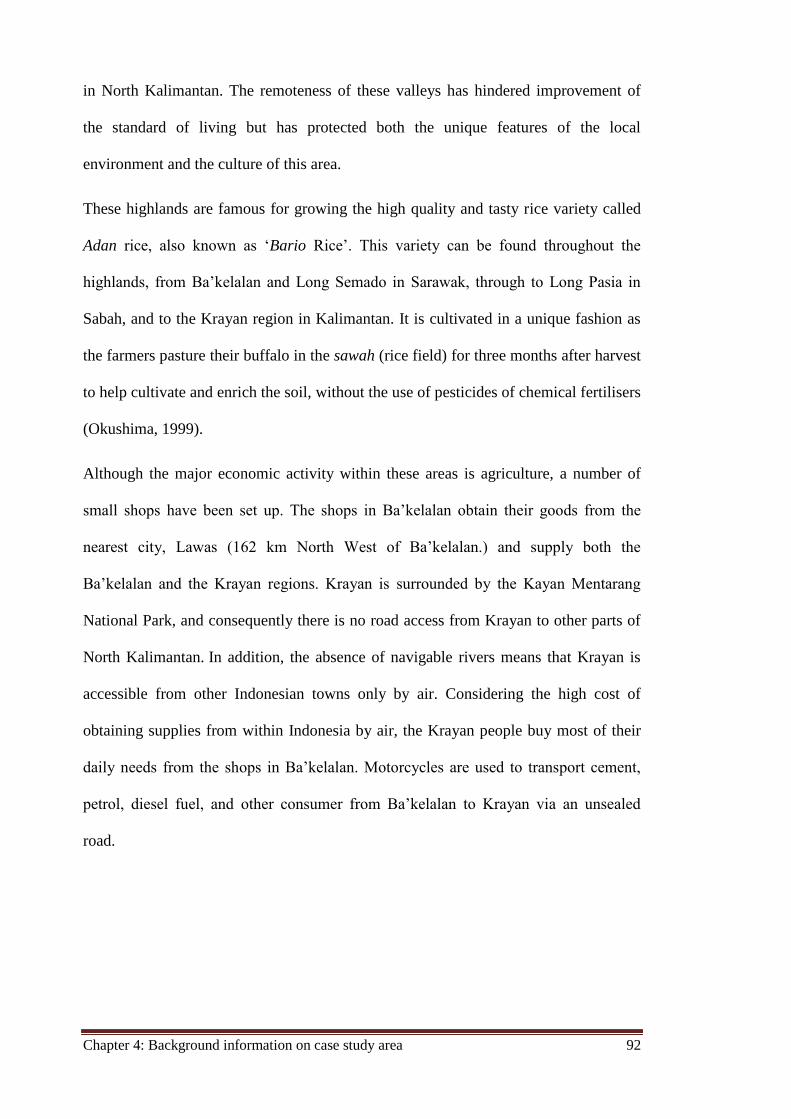
Chapter 4: Background information on case study area 92
in North Kalimantan. The remoteness of these valleys has hindered improvement of
the standard of living but has protected both the unique features of the local
environment and the culture of this area.
These highlands are famous for growing the high quality and tasty rice variety called
Adan rice, also known as ‘Bario Rice’. This variety can be found throughout the
highlands, from Ba’kelalan and Long Semado in Sarawak, through to Long Pasia in
Sabah, and to the Krayan region in Kalimantan. It is cultivated in a unique fashion as
the farmers pasture their buffalo in the sawah (rice field) for three months after harvest
to help cultivate and enrich the soil, without the use of pesticides of chemical fertilisers
(Okushima, 1999).
Although the major economic activity within these areas is agriculture, a number of
small shops have been set up. The shops in Ba’kelalan obtain their goods from the
nearest city, Lawas (162 km North West of Ba’kelalan.) and supply both the
Ba’kelalan and the Krayan regions. Krayan is surrounded by the Kayan Mentarang
National Park, and consequently there is no road access from Krayan to other parts of
North Kalimantan. In addition, the absence of navigable rivers means that Krayan is
accessible from other Indonesian towns only by air. Considering the high cost of
obtaining supplies from within Indonesia by air, the Krayan people buy most of their
daily needs from the shops in Ba’kelalan. Motorcycles are used to transport cement,
petrol, diesel fuel, and other consumer from Ba’kelalan to Krayan via an unsealed
road.
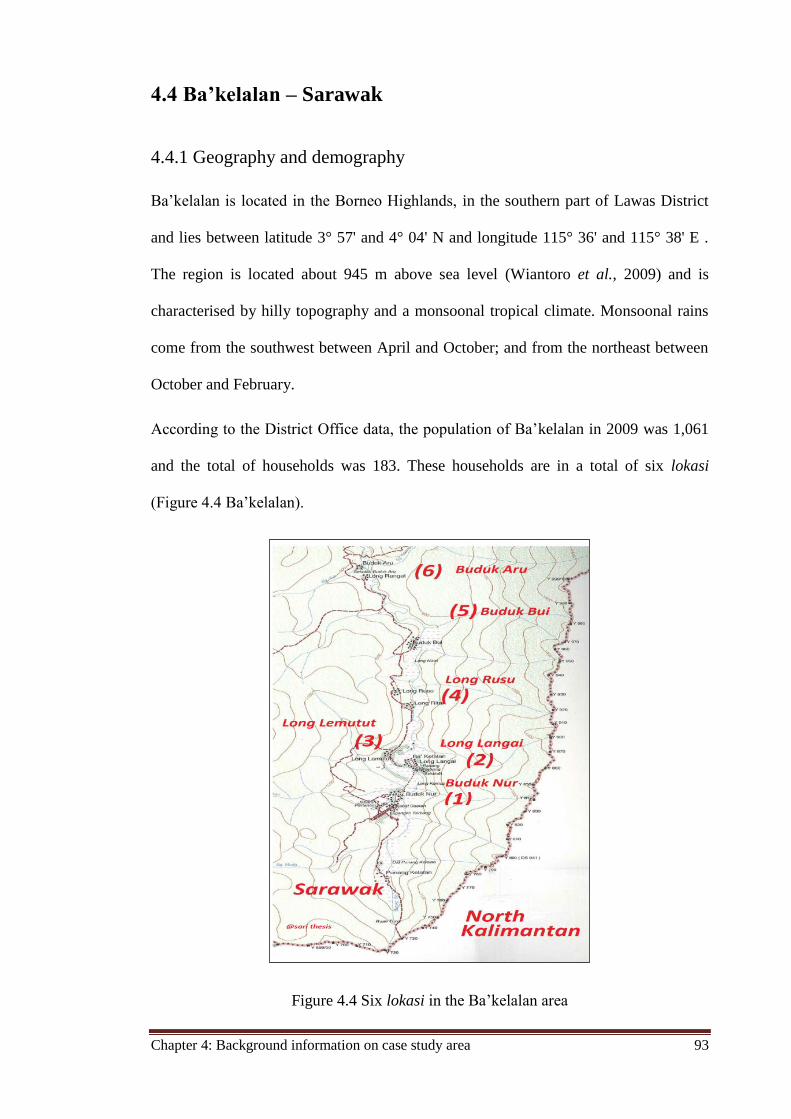
Chapter 4: Background information on case study area 93
4.4 Ba’kelalan – Sarawak
4.4.1 Geography and demography
Ba’kelalan is located in the Borneo Highlands, in the southern part of Lawas District
and lies between latitude 3° 57' and 4° 04' N and longitude 115° 36' and 115° 38' E .
The region is located about 945 m above sea level (Wiantoro et al., 2009) and is
characterised by hilly topography and a monsoonal tropical climate. Monsoonal rains
come from the southwest between April and October; and from the northeast between
October and February.
According to the District Office data, the population of Ba’kelalan in 2009 was 1,061
and the total of households was 183. These households are in a total of six lokasi
(Figure 4.4 Ba’kelalan).
Figure 4.4 Six lokasi in the Ba’kelalan area
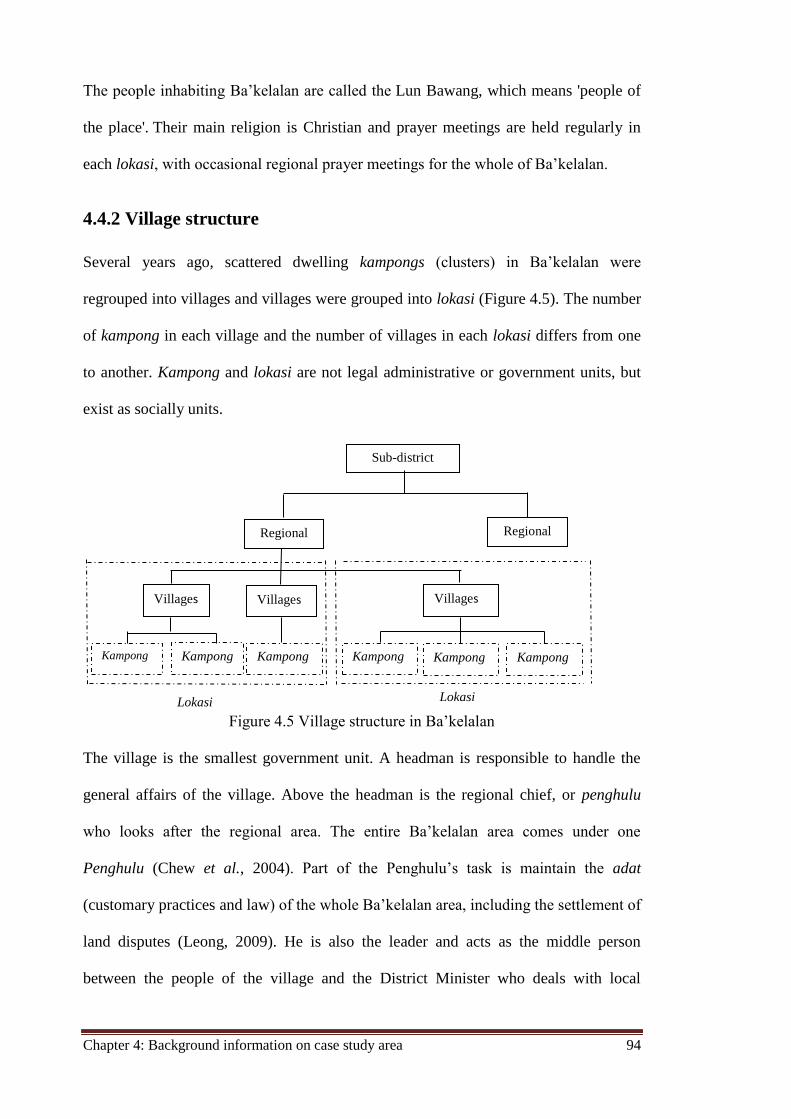
Chapter 4: Background information on case study area 94
The people inhabiting Ba’kelalan are called the Lun Bawang, which means 'people of
the place'. Their main religion is Christian and prayer meetings are held regularly in
each lokasi, with occasional regional prayer meetings for the whole of Ba’kelalan.
4.4.2 Village structure
Several years ago, scattered dwelling kampongs (clusters) in Ba’kelalan were
regrouped into villages and villages were grouped into lokasi (Figure 4.5). The number
of kampong in each village and the number of villages in each lokasi differs from one
to another. Kampong and lokasi are not legal administrative or government units, but
exist as socially units.
Figure 4.5 Village structure in Ba’kelalan
The village is the smallest government unit. A headman is responsible to handle the
general affairs of the village. Above the headman is the regional chief, or penghulu
who looks after the regional area. The entire Ba’kelalan area comes under one
Penghulu (Chew et al., 2004). Part of the Penghulu’s task is maintain the adat
(customary practices and law) of the whole Ba’kelalan area, including the settlement of
land disputes (Leong, 2009). He is also the leader and acts as the middle person
between the people of the village and the District Minister who deals with local
Sub-district
Regional
Villages
Kampong Kampong Kampong
s
Kampong
s
Villages Villages
Kampong
s
Kampong
s
Regional
Lokasi Lokasi
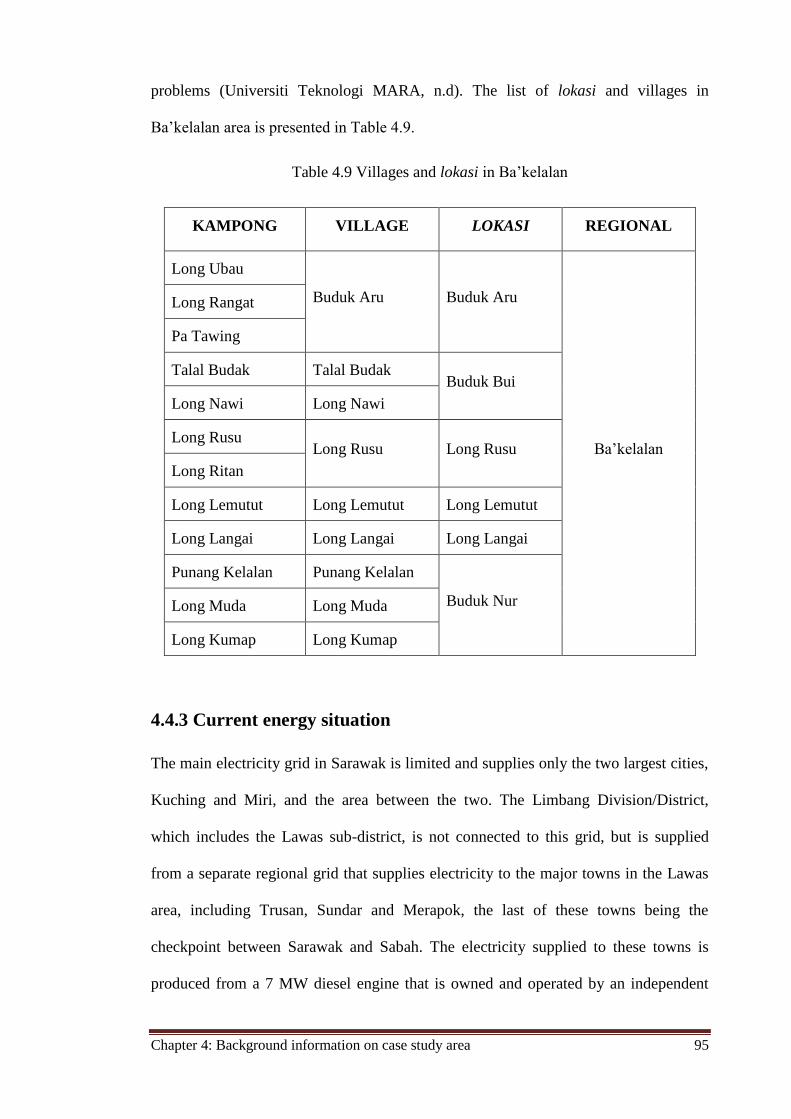
Chapter 4: Background information on case study area 95
problems (Universiti Teknologi MARA, n.d). The list of lokasi and villages in
Ba’kelalan area is presented in Table 4.9.
Table 4.9 Villages and lokasi in Ba’kelalan
KAMPONG VILLAGE LOKASI REGIONAL
Long Ubau
Buduk Aru Buduk Aru
Ba’kelalan
Long Rangat
Pa Tawing
Talal Budak Talal Budak Buduk Bui
Long Nawi Long Nawi
Long Rusu Long Rusu Long Rusu
Long Ritan
Long Lemutut Long Lemutut Long Lemutut
Long Langai Long Langai Long Langai
Punang Kelalan Punang Kelalan
Buduk Nur Long Muda Long Muda
Long Kumap Long Kumap
4.4.3 Current energy situation
The main electricity grid in Sarawak is limited and supplies only the two largest cities,
Kuching and Miri, and the area between the two. The Limbang Division/District,
which includes the Lawas sub-district, is not connected to this grid, but is supplied
from a separate regional grid that supplies electricity to the major towns in the Lawas
area, including Trusan, Sundar and Merapok, the last of these towns being the
checkpoint between Sarawak and Sabah. The electricity supplied to these towns is
produced from a 7 MW diesel engine that is owned and operated by an independent
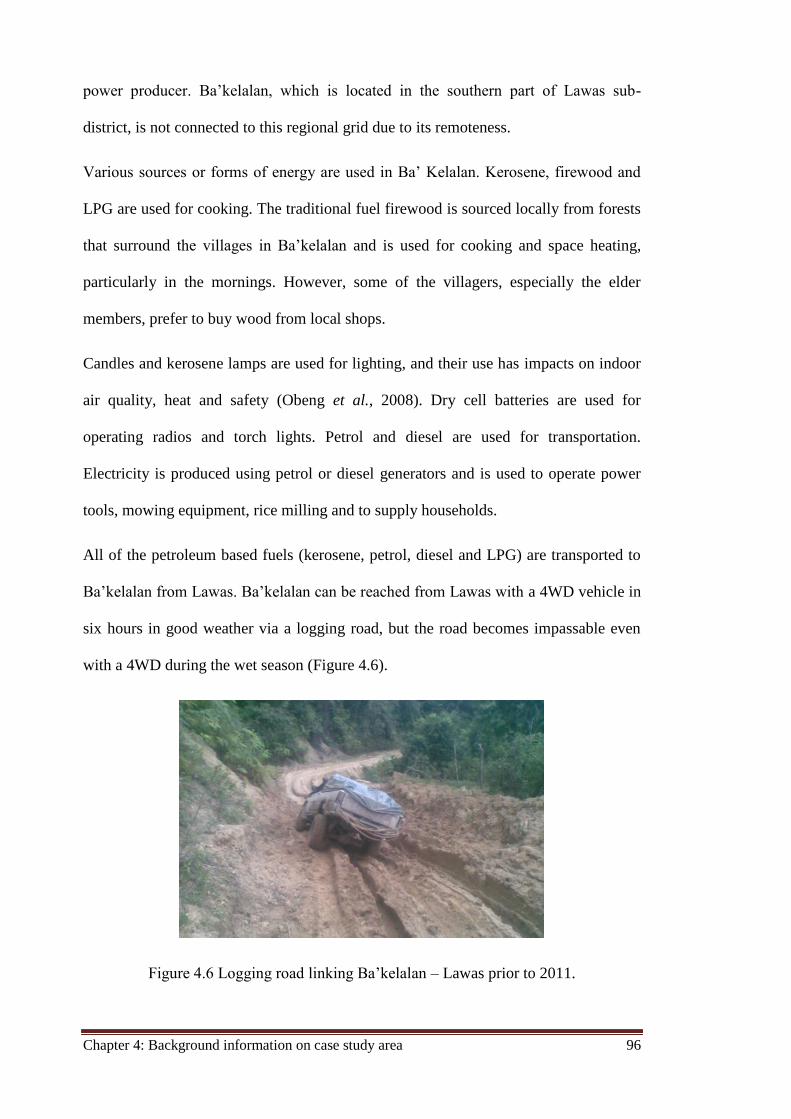
Chapter 4: Background information on case study area 96
power producer. Ba’kelalan, which is located in the southern part of Lawas sub-
district, is not connected to this regional grid due to its remoteness.
Various sources or forms of energy are used in Ba’ Kelalan. Kerosene, firewood and
LPG are used for cooking. The traditional fuel firewood is sourced locally from forests
that surround the villages in Ba’kelalan and is used for cooking and space heating,
particularly in the mornings. However, some of the villagers, especially the elder
members, prefer to buy wood from local shops.
Candles and kerosene lamps are used for lighting, and their use has impacts on indoor
air quality, heat and safety (Obeng et al., 2008). Dry cell batteries are used for
operating radios and torch lights. Petrol and diesel are used for transportation.
Electricity is produced using petrol or diesel generators and is used to operate power
tools, mowing equipment, rice milling and to supply households.
All of the petroleum based fuels (kerosene, petrol, diesel and LPG) are transported to
Ba’kelalan from Lawas. Ba’kelalan can be reached from Lawas with a 4WD vehicle in
six hours in good weather via a logging road, but the road becomes impassable even
with a 4WD during the wet season (Figure 4.6).
Figure 4.6 Logging road linking Ba’kelalan – Lawas prior to 2011.
Chapter 4: Background information on case study area 97
The supply of fuel can therefore be intermittent during the wet season, especially
during events of sustained high rainfall. During periods of fuel shortages Ba’kelalan
fuel prices can increase to double the normal price. In 2011, road work between Long
Luping and Ba’kelalan was undertaken, which significantly improved transportation
logistics and reduced transport time and fuel costs (Borneopost, 2010).
Solar panels have been installed in Ba’kelalan, but to a very limited extent. A small
solar array was built to operate the lights and computers in the public library and a
public telephone kiosk. A small number of households have installed small solar
arrays. The only solar water heater that has been installed was installed on a lodge
(The Apple Lodge) (Microsolar, 2006). The solar water heater was found to be
working, but, most of the solar PV systems were found to be not performing well. The
reasons for this included environmental, meteorological (cloud), poor installation and
improper system use (Anyi et al., 2010).
Micro hydro systems (MHS) installed in the region supply electricity to six villages.
Some of these are so small that they supply enough electricity for lighting and
televisions only. Furthermore, as the climate in Ba’kelalan is tropical monsoonal,
rainfall is seasonal and in the dry season river flow rates are much reduced and MHS
output is reduced. During extreme dry conditions, the MHS need to be taken out of
service and the villagers use their diesel generators to meet their electricity
requirements.
4.4.4 Renewable energy resources
The main renewable energy resources available in Ba’kelalan are solar, wind, biomass
and hydro. Borneo is located in the equator which has high solar radiation. However,
Ba’kelalan has lower than average solar radiation levels due to its location in a
highland valley with a low number of clear sky days per year. Based on NASA data,
Chapter 4: Background information on case study area 98
the average solar radiation level in the Ba’kelalan area is approximately 5 kWh/m2/day
or 1825 kWh/m2/year (NASA, n.d). The average wind speeds in most areas in Borneo
are relatively low and according to the World Wind Atlas data, the average wind speed
in Ba’kelalan and the surrounding area is less than 4 m.s-1
at 50m (Sander and Partner,
2002), which is too low to operate most commercially available wind turbines.
As a by-product of rice production, several sources of biomass, such as paddy straw
and rice husk, are available in Ba’kelalan. Paddy straw and rice husks from the paddy
fields are available during harvest, but the long distances between the paddy fields and
the villages is the main constraint on the utilisation of this potential energy source.
Furthermore, as there is a single harvest per year only, the paddy straw would need to
be stored in large quantities.
Current utilisation of biomass energy resources in Malaysia is still limited despite there
being large potential (Lidula et al., 2007). The main reason is the high cost of straw-
based power generation relative to that of coal-based power generation (Liu et al.,
2010) and difficulty of processing straw-based fuel due to the high alkali contents of
the ash (Eriksson and Kjellström, 2010). Another constraint is that straw production is
not centralised, which means that it is costly to collect. Furthermore, the cultivation
methods, fertilizers used, harvesting time, and locations are variable and those
influence the characteristics of the rice straw which has impacts when using it as a fuel
for generating electricity (Shen et al., 1998).
The electricity that can be generate from 51.5 thousand tonnes (equivalent to 788 TJ)
paddy straw was about 5 MWe at continuous generation with 20% overall conversion
efficiency (Hiloidhari and Baruah, 2011). However, the calculated electricity
generation costs vary depend on power plant capacities, which was 0.0676 USD/kWh
at 20 MWe and rising to 0.0889 USD/kWh at 5 MWe (Delivand et al., 2011).
Chapter 4: Background information on case study area 99
Comparable to rice straw, the utilisation of rice husk for electricity generation is
relatively well-developed in many regions due to its wide availability at rice mills. In
contrast, the procurement of rice straw is more difficult, as various logistic aspects
need to be considered, including handling and collection from fields (Lim et al., 2012).
Furthermore, the technology of utilising rice husk to produce heat and electricity is
well established. Rice husk gasification technologies have been developed and
perfected over the last thirty years and are now widely used especially in India, China,
Brazil and Vietnam (Akgün and Luukkanen, 2012).
The choice of process production is critical to the production efficiency. Gasification,
for example, is considered to have a higher efficiency than direct combustion (Thao et
al., 2011). As an illustration, the unit cost of electricity produced by rice husk gasifier-
dual fuel engine-generator system ranges from US 0.06/kWh to US 0.5 /kWh (Kapur
et al., 1996).
Rise husks also have the largest potential to be converted into energy. About 2 kg of
rice husk is needed to generate 1 kWh electricity (Abe et al., 2007). It also has a
positive impact on rural development due to opportunities of utilising local resources.
Despite the benefits described above, the greatest constraint of utilising rice husk is the
higher investment costs compared to conventional electricity generation schemes and
the energy conversion efficiency of rice husk relative to conventional electricity
generation processes is also quite low (Sookkumnerd et al., 2005).
The other potential source of biomass fuel in Ba’kelalan is cattle (buffalo) manure.
However, cattle are grazed in areas relatively distant from the village and they are
moved to the paddy fields only once the rice has been harvested to help cultivate the
land. Cattle manure collection would therefore be difficult.
Chapter 4: Background information on case study area 100
Based on study at four farms, an average of 5,295 kWh of electricity per day was able
to be produced from 69 tons of manure per day, seven tons of which consisted of
volatile solids (Wang et al., 2011). Converting cow manure to the electricity on farms
was technically feasible, but the economic returns depend highly on many things such
as the base electricity price and the premium rate. In addition, power generation
through the anaerobic digestion using cattle dung is still limited due to the need to
transport the manure long distances which makes its use as fuel is impractical, while
the long-term storage of manure can result in loss of methane, carbon dioxide and
ammonia into the air (Combs, n.d).
Micro hydro resources represent another energy resource. Ba’kelalan is located in a
mountainous valley through which the Kelalan River and its many smaller tributaries
flow. Not all of those tributaries are suitable for micro hydro schemes: some have
limited flow rates, others have insufficient flow rates during the dry season, and yet
others are too distant from a village to be harnessed for hydro power. There are,
however, some streams for which micro hydro is a feasible option.
4.4.5 Existing micro hydro projects
At the time this research was being undertaken, six micro hydro systems had been built
in Ba’kelalan (Table 4.10). These systems have been or are being funded through a
range of funding support mechanisms or schemes, including government, NGO,
community-based and private funding. The projects also serve a range of purposes,
they differ in their output capacities and the processes in place for maintaining and
managing the micro hydro plants also differ.
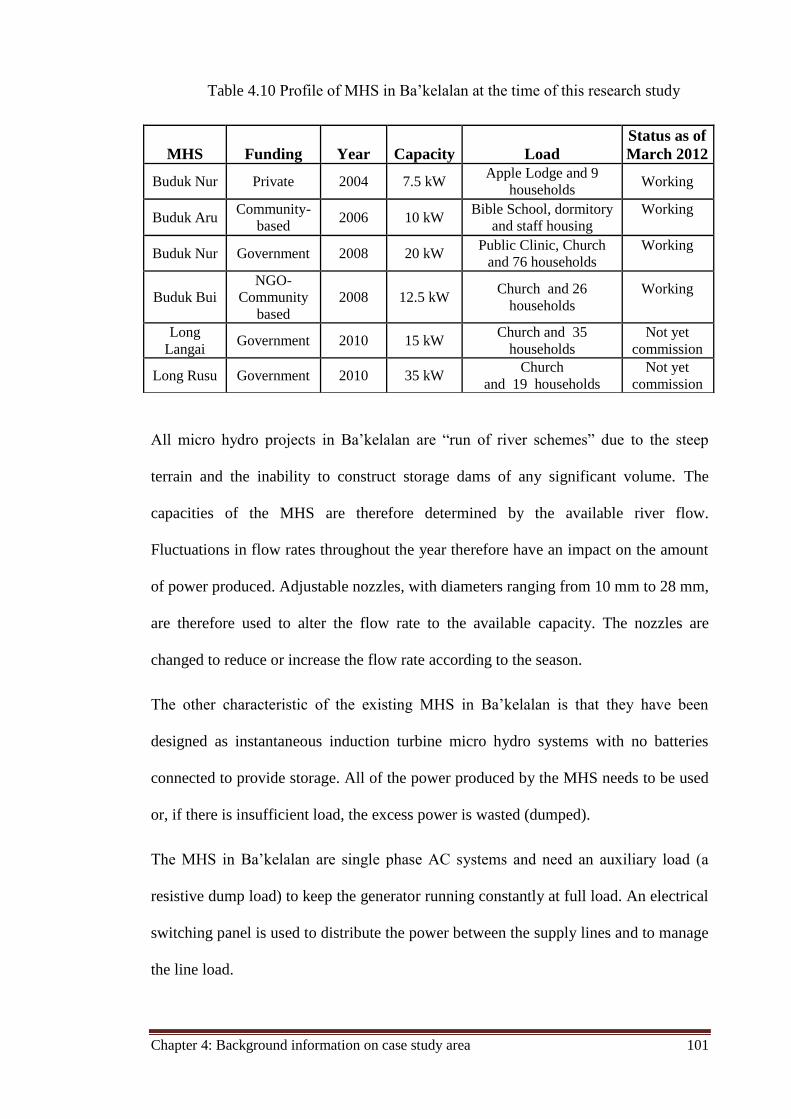
Chapter 4: Background information on case study area 101
Table 4.10 Profile of MHS in Ba’kelalan at the time of this research study
All micro hydro projects in Ba’kelalan are “run of river schemes” due to the steep
terrain and the inability to construct storage dams of any significant volume. The
capacities of the MHS are therefore determined by the available river flow.
Fluctuations in flow rates throughout the year therefore have an impact on the amount
of power produced. Adjustable nozzles, with diameters ranging from 10 mm to 28 mm,
are therefore used to alter the flow rate to the available capacity. The nozzles are
changed to reduce or increase the flow rate according to the season.
The other characteristic of the existing MHS in Ba’kelalan is that they have been
designed as instantaneous induction turbine micro hydro systems with no batteries
connected to provide storage. All of the power produced by the MHS needs to be used
or, if there is insufficient load, the excess power is wasted (dumped).
The MHS in Ba’kelalan are single phase AC systems and need an auxiliary load (a
resistive dump load) to keep the generator running constantly at full load. An electrical
switching panel is used to distribute the power between the supply lines and to manage
the line load.
MHS Funding Year Capacity Load
Status as of
March 2012
Buduk Nur Private 2004 7.5 kW Apple Lodge and 9
households Working
Buduk Aru Community-
based 2006 10 kW
Bible School, dormitory
and staff housing
Working
Buduk Nur Government 2008 20 kW Public Clinic, Church
and 76 households
Working
Buduk Bui
NGO-
Community
based
2008 12.5 kW Church and 26
households
Working
Long
Langai Government 2010 15 kW
Church and 35
households
Not yet
commission
Long Rusu Government 2010 35 kW Church
and 19 households
Not yet
commission
Chapter 4: Background information on case study area 102
The MHS projects in Ba’kelalan are Government, NGO, community or privately-
funded (see Table 4.10). The MHS in Buduk Nur (20 kW scheme), Long Langai and
Long Rusu are funded by the Government, while the MHS in Buduk Bui is funded by
a grant provided by an NGO (the Rotary Foundation). A total of USD 41,500 (AUD
45,650 ) was raised by Rotary for this project (Pereira, 2008). The MHS in Buduk Aru
is funded by the community, and the MHS in Buduk Nur (7.5 kW scheme) was
constructed as a privately funded scheme.
4.5 Krayan – North Kalimantan
4.5.1 Geography and demography
The Bawan Valley on the North Kalimantan side of the border lies between latitude 3°
40' and 4° 20' N and longitudes 115° 35' and 116° 5' E and comprises two sub-districts
(kecamatan): Krayan and Krayan Selatan (Figure 4.7). This study focuses on the
Krayan sub-district, which consists of 65 villages with total population of 7430
(Langub and Chew, 2009). The indigenous people living in Krayan are called Lun
Dayeh, meaning 'people of the interior'. This group has kinship with the Lun Bawang
people in Ba’kelalan, and they share the same language and culture. In the past, they
lived communally in longhouses, but in recent years families prefer to live in their own
individual houses. As with the Lun Bawang in Ba’kelalan, Lun Dayeh is Christian.
(Chew et al., 2004).
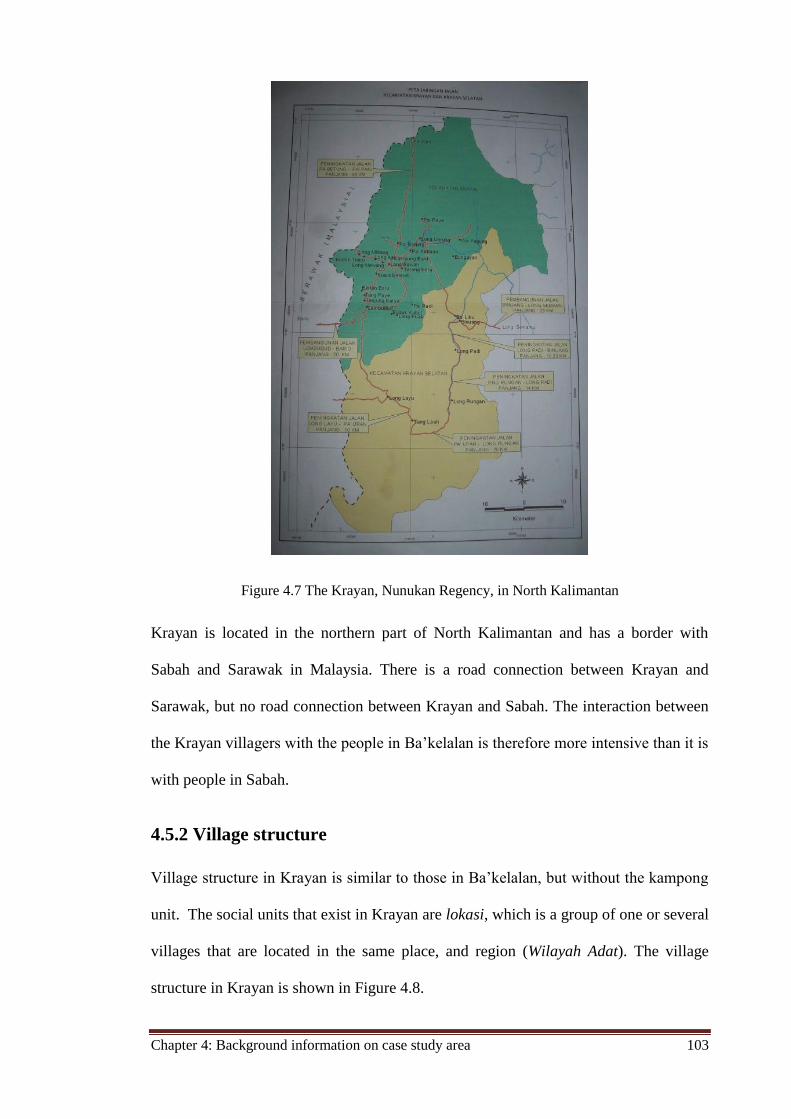
Chapter 4: Background information on case study area 103
Figure 4.7 The Krayan, Nunukan Regency, in North Kalimantan
Krayan is located in the northern part of North Kalimantan and has a border with
Sabah and Sarawak in Malaysia. There is a road connection between Krayan and
Sarawak, but no road connection between Krayan and Sabah. The interaction between
the Krayan villagers with the people in Ba’kelalan is therefore more intensive than it is
with people in Sabah.
4.5.2 Village structure
Village structure in Krayan is similar to those in Ba’kelalan, but without the kampong
unit. The social units that exist in Krayan are lokasi, which is a group of one or several
villages that are located in the same place, and region (Wilayah Adat). The village
structure in Krayan is shown in Figure 4.8.
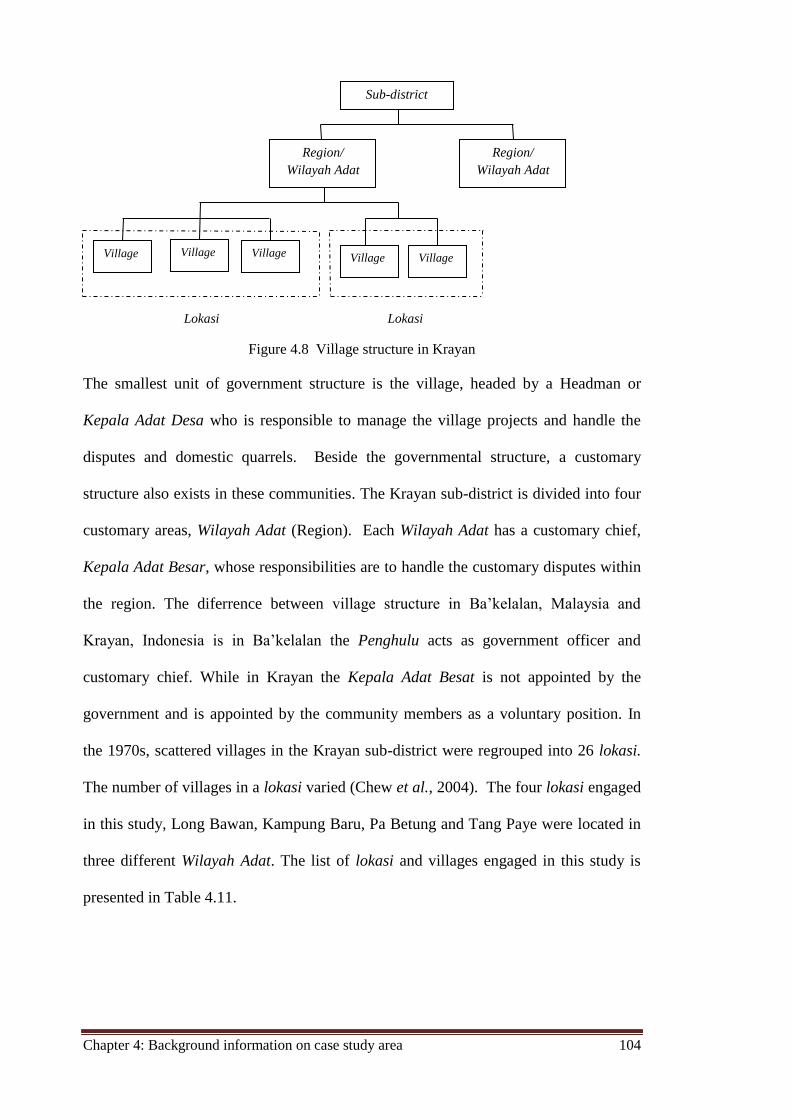
Chapter 4: Background information on case study area 104
Figure 4.8 Village structure in Krayan
The smallest unit of government structure is the village, headed by a Headman or
Kepala Adat Desa who is responsible to manage the village projects and handle the
disputes and domestic quarrels. Beside the governmental structure, a customary
structure also exists in these communities. The Krayan sub-district is divided into four
customary areas, Wilayah Adat (Region). Each Wilayah Adat has a customary chief,
Kepala Adat Besar, whose responsibilities are to handle the customary disputes within
the region. The diferrence between village structure in Ba’kelalan, Malaysia and
Krayan, Indonesia is in Ba’kelalan the Penghulu acts as government officer and
customary chief. While in Krayan the Kepala Adat Besat is not appointed by the
government and is appointed by the community members as a voluntary position. In
the 1970s, scattered villages in the Krayan sub-district were regrouped into 26 lokasi.
The number of villages in a lokasi varied (Chew et al., 2004). The four lokasi engaged
in this study, Long Bawan, Kampung Baru, Pa Betung and Tang Paye were located in
three different Wilayah Adat. The list of lokasi and villages engaged in this study is
presented in Table 4.11.
Sub-district
Region/
Wilayah Adat
Village
s
Village
s Village
s
Lokasi Lokasi
Village
s Village
s
Region/
Wilayah Adat

Chapter 4: Background information on case study area 105
Table 4.11 Lokasi and village in Krayan sub-district engaged in this study
Village Lokasi Region Sub-district
Long Bawan
Long Bawan Wilayah Adat
Krayan Darat
Krayan
Long Katung
Liang Butan
Lembada Tang Paye
Wilayah Adat
Krayan
Belawit Pa Kidang
Kampung Baru Kampung Baru
Wilayah Adat
Krayan Hilir Pa Betung
Pa Betung Long Sepayang
Some lokasi have the same name as the village, such as Long Bawan and Pa Betung.
In this study, when it is written as Long Bawan or Pa Betung it refers to Long Bawan
lokasi, and Pa Betung lokasi; with the term lokasi often been eliminated. Otherwise, it
is written as Long Bawan village or Pa Betung village to clarify what unit it refers to.
4.5.3 Current energy situation
Krayan is land-locked and its remoteness has hindered the capacity of the Government
to provide public facilities, including electrification. Villagers usually use candles,
kerosene lamps or electricity generators for lighting. Due to the high price of fuel (both
diesel and petrol), only the wealthiest villagers are able to run generators on a daily
basis.
For cooking purposes, the people in Krayan use firewood, kerosene and LPG.
Firewood can be obtained from forested areas surrounding the villages, although
people from villages that are quite far from the forest, such as Long Bawan, prefer to
buy firewood from the shops in Long Bawan rather than spending much time and
energy gathering wood from the forest. Historically, wood could be collected from
these forested areas for free, irrespective of ownership. As more migrants settled in the
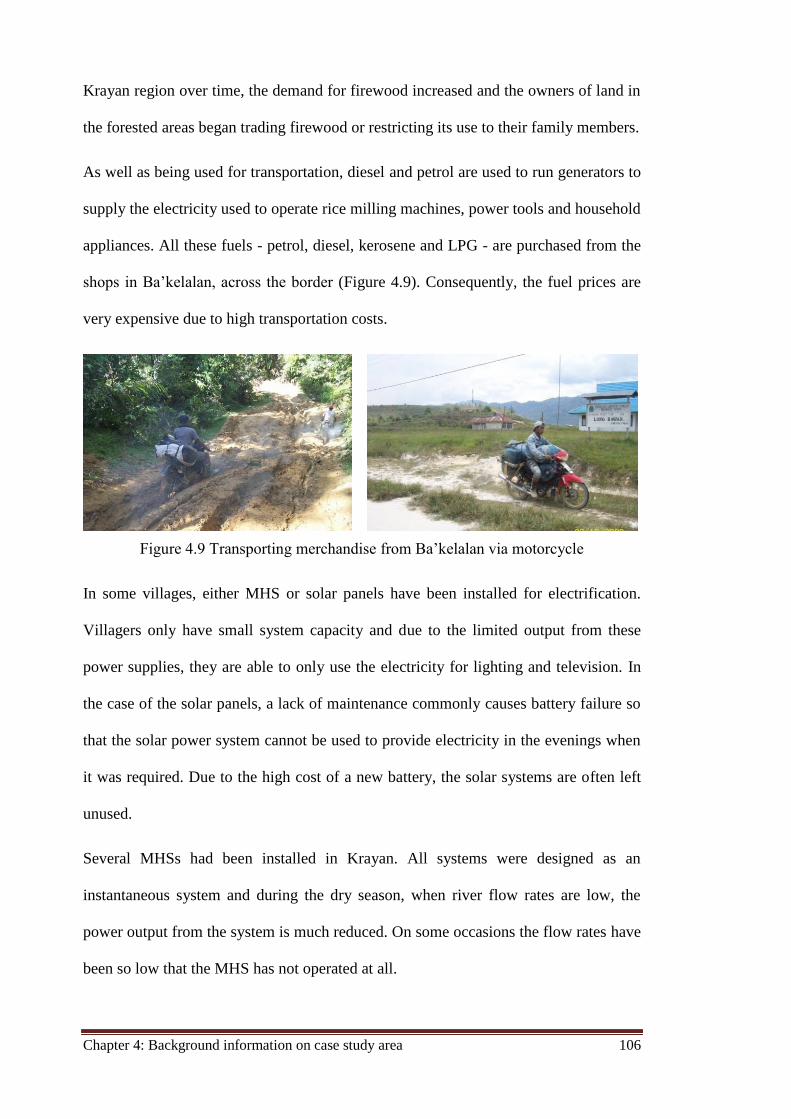
Chapter 4: Background information on case study area 106
Krayan region over time, the demand for firewood increased and the owners of land in
the forested areas began trading firewood or restricting its use to their family members.
As well as being used for transportation, diesel and petrol are used to run generators to
supply the electricity used to operate rice milling machines, power tools and household
appliances. All these fuels - petrol, diesel, kerosene and LPG - are purchased from the
shops in Ba’kelalan, across the border (Figure 4.9). Consequently, the fuel prices are
very expensive due to high transportation costs.
Figure 4.9 Transporting merchandise from Ba’kelalan via motorcycle
In some villages, either MHS or solar panels have been installed for electrification.
Villagers only have small system capacity and due to the limited output from these
power supplies, they are able to only use the electricity for lighting and television. In
the case of the solar panels, a lack of maintenance commonly causes battery failure so
that the solar power system cannot be used to provide electricity in the evenings when
it was required. Due to the high cost of a new battery, the solar systems are often left
unused.
Several MHSs had been installed in Krayan. All systems were designed as an
instantaneous system and during the dry season, when river flow rates are low, the
power output from the system is much reduced. On some occasions the flow rates have
been so low that the MHS has not operated at all.
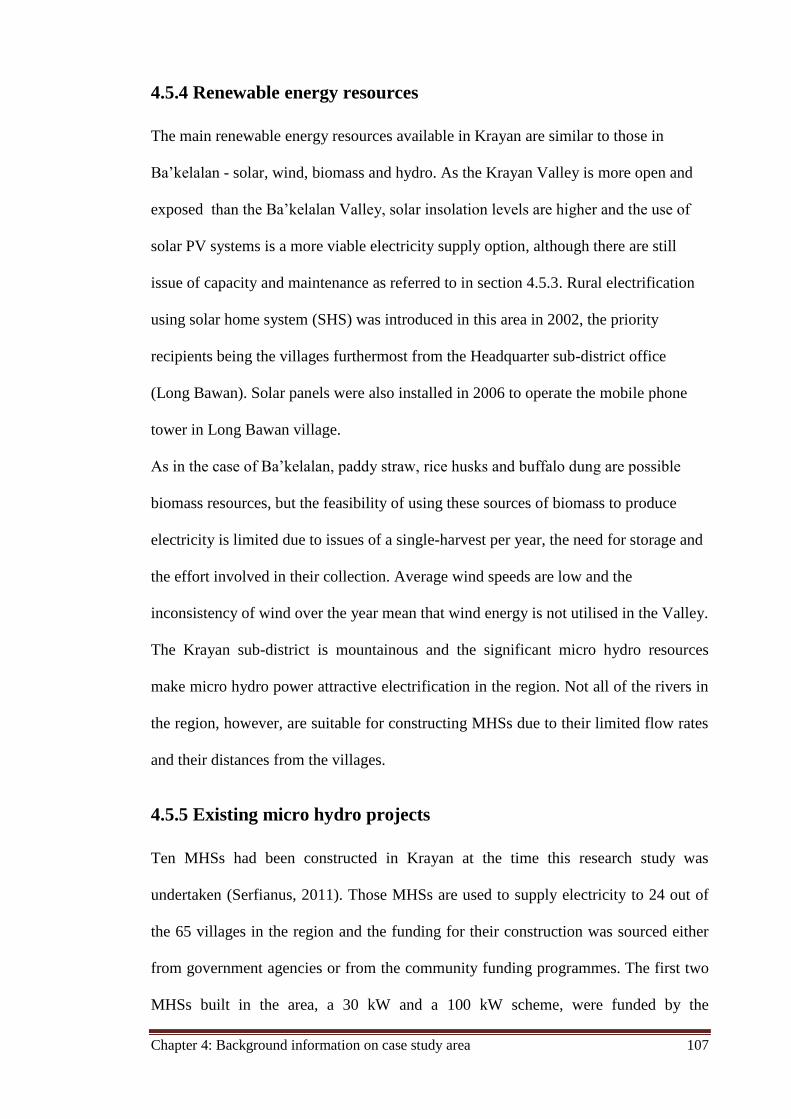
Chapter 4: Background information on case study area 107
4.5.4 Renewable energy resources
The main renewable energy resources available in Krayan are similar to those in
Ba’kelalan - solar, wind, biomass and hydro. As the Krayan Valley is more open and
exposed than the Ba’kelalan Valley, solar insolation levels are higher and the use of
solar PV systems is a more viable electricity supply option, although there are still
issue of capacity and maintenance as referred to in section 4.5.3. Rural electrification
using solar home system (SHS) was introduced in this area in 2002, the priority
recipients being the villages furthermost from the Headquarter sub-district office
(Long Bawan). Solar panels were also installed in 2006 to operate the mobile phone
tower in Long Bawan village.
As in the case of Ba’kelalan, paddy straw, rice husks and buffalo dung are possible
biomass resources, but the feasibility of using these sources of biomass to produce
electricity is limited due to issues of a single-harvest per year, the need for storage and
the effort involved in their collection. Average wind speeds are low and the
inconsistency of wind over the year mean that wind energy is not utilised in the Valley.
The Krayan sub-district is mountainous and the significant micro hydro resources
make micro hydro power attractive electrification in the region. Not all of the rivers in
the region, however, are suitable for constructing MHSs due to their limited flow rates
and their distances from the villages.
4.5.5 Existing micro hydro projects
Ten MHSs had been constructed in Krayan at the time this research study was
undertaken (Serfianus, 2011). Those MHSs are used to supply electricity to 24 out of
the 65 villages in the region and the funding for their construction was sourced either
from government agencies or from the community funding programmes. The first two
MHSs built in the area, a 30 kW and a 100 kW scheme, were funded by the
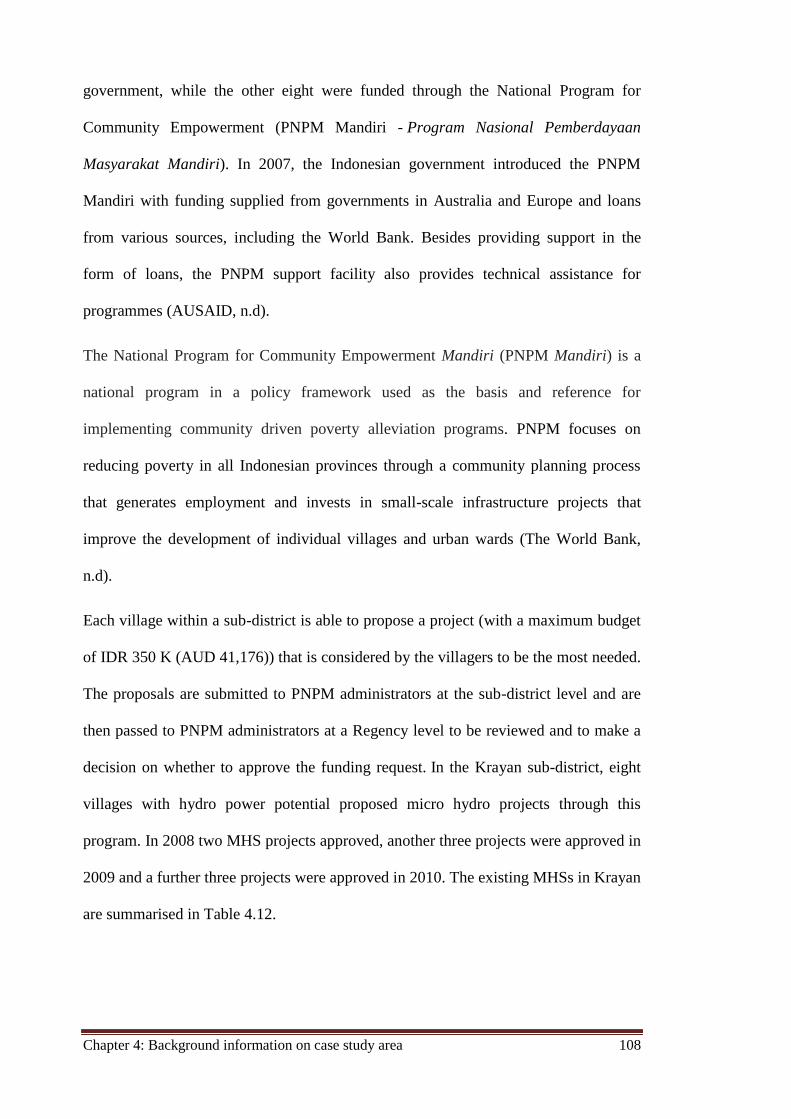
Chapter 4: Background information on case study area 108
government, while the other eight were funded through the National Program for
Community Empowerment (PNPM Mandiri - Program Nasional Pemberdayaan
Masyarakat Mandiri). In 2007, the Indonesian government introduced the PNPM
Mandiri with funding supplied from governments in Australia and Europe and loans
from various sources, including the World Bank. Besides providing support in the
form of loans, the PNPM support facility also provides technical assistance for
programmes (AUSAID, n.d).
The National Program for Community Empowerment Mandiri (PNPM Mandiri) is a
national program in a policy framework used as the basis and reference for
implementing community driven poverty alleviation programs. PNPM focuses on
reducing poverty in all Indonesian provinces through a community planning process
that generates employment and invests in small-scale infrastructure projects that
improve the development of individual villages and urban wards (The World Bank,
n.d).
Each village within a sub-district is able to propose a project (with a maximum budget
of IDR 350 K (AUD 41,176)) that is considered by the villagers to be the most needed.
The proposals are submitted to PNPM administrators at the sub-district level and are
then passed to PNPM administrators at a Regency level to be reviewed and to make a
decision on whether to approve the funding request. In the Krayan sub-district, eight
villages with hydro power potential proposed micro hydro projects through this
program. In 2008 two MHS projects approved, another three projects were approved in
2009 and a further three projects were approved in 2010. The existing MHSs in Krayan
are summarised in Table 4.12.
Chapter 4: Background information on case study area 109
Table 4.12 Profile of MHS in Krayan at the time of this research study
All of the MHSs in Krayan are designed as run-of-river schemes to avoid the need for
constructing a dam. Some of the water is fed through an intake weir and through the
powerhouse before being returned to the river. This design means that power output
from the system is dependent on the available river flow rate.
The other characteristic of MHS in Krayan is that all of the systems are instantaneous
systems that include no form of storage. Any of the excess power that is produced by
the system but that is not used by the villagers is therefore dumped.
4 The six villages electrified by Romayo I MHS are located in three lokasi: Pa Betung, Kampung Baru
and Long Bawan
MHS Capacity
(kW)
Village and
Household served Funding Year
Status as of March
2012
Romayo I
30 6
4villages, 430 hh
National
Budget 2004
Not working since July
2011
Romayo II 100 6 villages, 430 hh National
Budget 2008
Not working
( not yet
commissioned)
Tang Paye 7.5 2 villages, 59 hh PNPM 2008 Working
Pa Kebuan 7.5 3 villages, 57 hh PNPM 2008 Working
Long Puak 7.5 3 villages, 37 hh PNPM 2009 Working
Buduk
Kubul 7.5 3 villages, 43 hh PNPM 2009 Working
Long
Umung 7.5 6 villages, 91 hh PNPM 2009
Not commission yet
due to insufficient
cable/wiring
Pa Padi 7.5 2 villages, 61 hh PNPM 2010 Not working well due
to insufficient head
Wa Yagung 7.5 1 village, 40 hh
PNPM 2010
Not working well due
to insufficient head
Pa Raye 7.5 1 village, 37 hh
PNPM 2010
Not working well due
to insufficient head

Chapter 4: Background information on case study area 110
Chapter 5: A case study from the ‘Heart of Borneo’: Ba’kelalan 111
Chapter 5
A Case Study from the ‘Heart of Borneo’:
Ba’kelalan
Overview
The case study described in this chapter presents the results of the research survey in
Ba’kelalan, Malaysia. Quantitative and qualitative data were gathered using a
questionnaire, an energy audit, semi-structured interviews, and a focus group
discussion. A site survey was also undertaken and river flow rate taken. These primary
data were supplemented by reviewing the literature.
The survey focused on two separate MHS projects in Buduk Bui and Buduk Nur.
These two MHSs5 were chosen for this case study because of their differences in terms
of ways that they were established and are operated, thereby providing greater
opportunities for understanding the factors that influence the success of an MHS
project.
The results of the research are presented in two main parts. The first part presents data
describing the socio-economic structure and culture of the area as well as the energy
situation. The second part presents an evaluation of the two MHS projects.
5.1 Introduction
This case study includes two MHSs, one installed in Buduk Nur and the other in
Buduk Bui. Buduk Bui and Buduk Nur are located in remote mountainous terrain in
5 At the time that this study was undertaken, there were six MHSs in Ba’kelalan: the Apple Lodge MHS
in Buduk Nur, the Clinic MHS in Buduk Nur and MHSs in Buduk Aru, Buduk Bui, Long Langai, and
Long Rusu.
Chapter 5: A case study from the ‘Heart of Borneo’: Ba’kelalan 112
the Kelalan Valley (Ba’kelalan) and are located near tributaries of the Kelalan River.
Buduk Bui and Buduk Nur are 5 km apart, and one can be reached from the other in
about 30 minutes by motorcycle (Figure 4.4). Buduk Bui consists of two small villages
and most of the villagers are farmers. There are few business activities and this
contributes to the lack of interest of many young people in living in the village. The
situation is slightly different in Buduk Nur as it is the central lokasi for the Ba’kelalan
area and a number of public service offices and the airstrip are located in Buduk Nur. It
is also a hub for business trade with villages across the border in Indonesia. This has
resulted in migration to Buduk Nur from other villages in Ba’kelalan by those seeking
to set up businesses trading with those on the Indonesian side of the border.
The Buduk Bui MHS was installed on the Tanid River to serve all 28 households in
Buduk Bui. This 12.5 kW capacity MHS was designed as a run-of river system. The
source of most of the funding for this MHS, USD 41,500, was the Rotary Club (RC) of
Kuching acting as the Host Rotary Club.
The ‘Clinic scheme’ in Buduk Nur is a 20 kW scheme that was fully funded by the
Ministry of Health and was constructed on the Sarui Laut River with initial purpose of
electrifying the public clinic. The community subsequently approached the Ministry of
Health and requested access to the electricity generated by the MHS. The Ministry
agreed to supply some of the electricity produced by the MHS to operate lights in
every household in the village. The MHS is designed as a run-of river system and
supplies electricity to the public health clinic and all 67 households in Buduk Nur.
The MHSs in both Buduk Bui and Buduk Nur were designed as instantaneous
induction turbine MHSs with no batteries connected to provide storage. The reason of
choosing these MHSs was explained in Chapter 2 section 2.4.
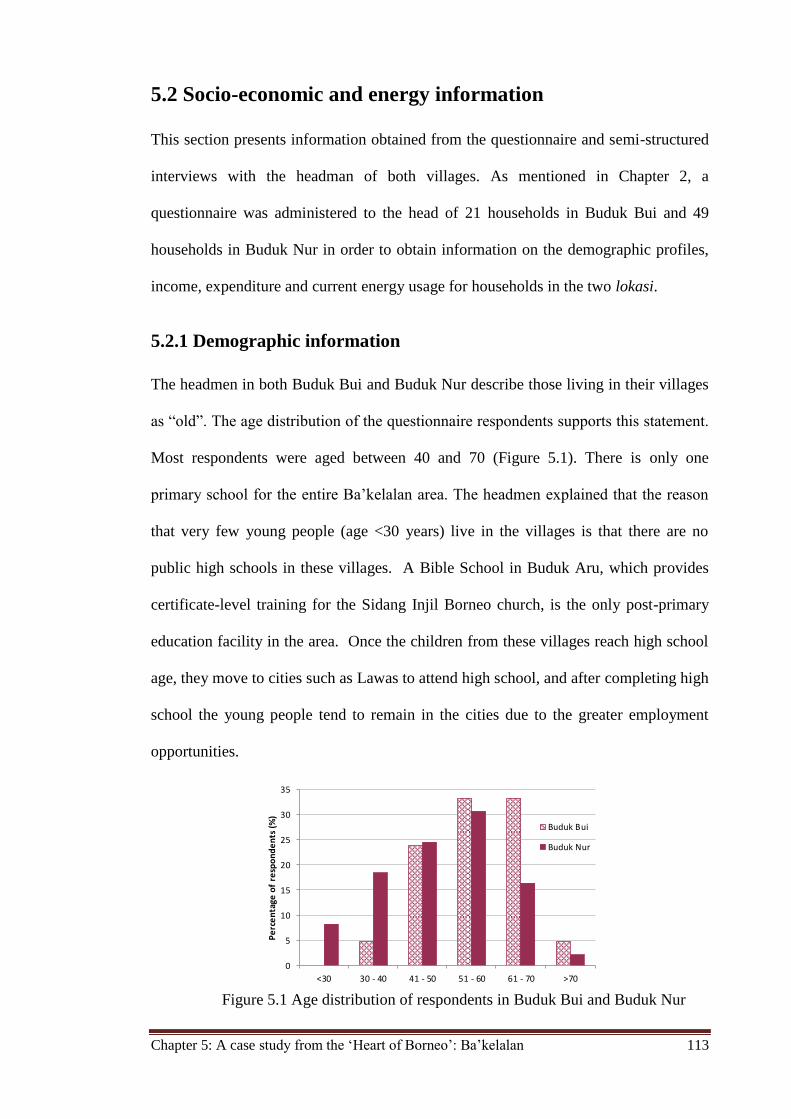
Chapter 5: A case study from the ‘Heart of Borneo’: Ba’kelalan 113
5.2 Socio-economic and energy information
This section presents information obtained from the questionnaire and semi-structured
interviews with the headman of both villages. As mentioned in Chapter 2, a
questionnaire was administered to the head of 21 households in Buduk Bui and 49
households in Buduk Nur in order to obtain information on the demographic profiles,
income, expenditure and current energy usage for households in the two lokasi.
5.2.1 Demographic information
The headmen in both Buduk Bui and Buduk Nur describe those living in their villages
as “old”. The age distribution of the questionnaire respondents supports this statement.
Most respondents were aged between 40 and 70 (Figure 5.1). There is only one
primary school for the entire Ba’kelalan area. The headmen explained that the reason
that very few young people (age <30 years) live in the villages is that there are no
public high schools in these villages. A Bible School in Buduk Aru, which provides
certificate-level training for the Sidang Injil Borneo church, is the only post-primary
education facility in the area. Once the children from these villages reach high school
age, they move to cities such as Lawas to attend high school, and after completing high
school the young people tend to remain in the cities due to the greater employment
opportunities.
Figure 5.1 Age distribution of respondents in Buduk Bui and Buduk Nur
0
5
10
15
20
25
30
35
<30 30 - 40 41 - 50 51 - 60 61 - 70 >70
Pe
rce
nta
ge o
f re
spo
nd
en
ts (
%)
Buduk Bui
Buduk Nur
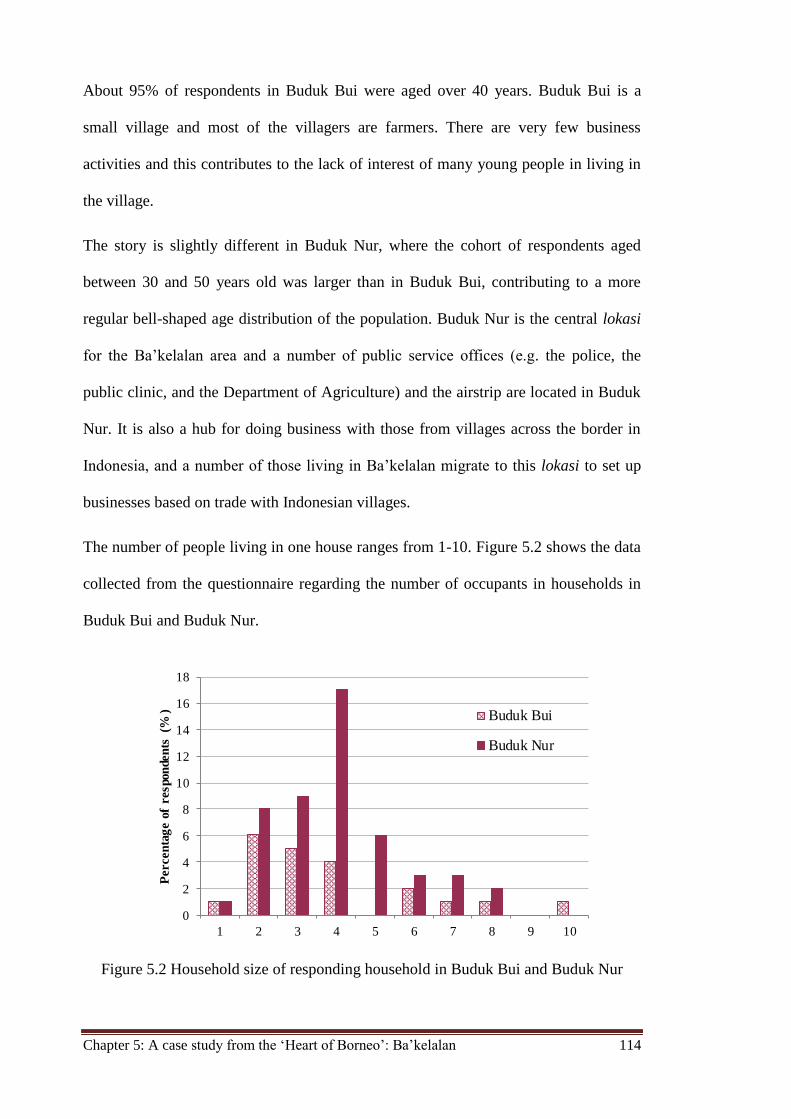
Chapter 5: A case study from the ‘Heart of Borneo’: Ba’kelalan 114
About 95% of respondents in Buduk Bui were aged over 40 years. Buduk Bui is a
small village and most of the villagers are farmers. There are very few business
activities and this contributes to the lack of interest of many young people in living in
the village.
The story is slightly different in Buduk Nur, where the cohort of respondents aged
between 30 and 50 years old was larger than in Buduk Bui, contributing to a more
regular bell-shaped age distribution of the population. Buduk Nur is the central lokasi
for the Ba’kelalan area and a number of public service offices (e.g. the police, the
public clinic, and the Department of Agriculture) and the airstrip are located in Buduk
Nur. It is also a hub for doing business with those from villages across the border in
Indonesia, and a number of those living in Ba’kelalan migrate to this lokasi to set up
businesses based on trade with Indonesian villages.
The number of people living in one house ranges from 1-10. Figure 5.2 shows the data
collected from the questionnaire regarding the number of occupants in households in
Buduk Bui and Buduk Nur.
Figure 5.2 Household size of responding household in Buduk Bui and Buduk Nur
0
2
4
6
8
10
12
14
16
18
1 2 3 4 5 6 7 8 9 10
Percen
tag
e o
f respon
den
ts (%
) Buduk Bui
Buduk Nur
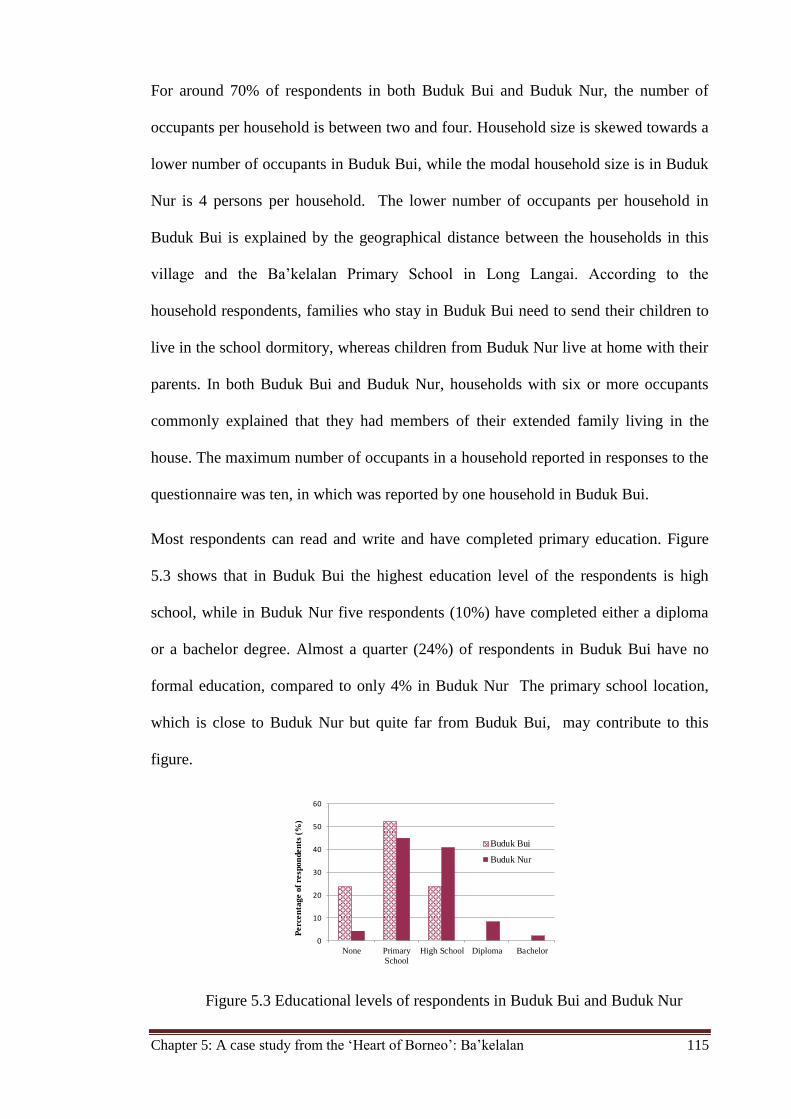
Chapter 5: A case study from the ‘Heart of Borneo’: Ba’kelalan 115
For around 70% of respondents in both Buduk Bui and Buduk Nur, the number of
occupants per household is between two and four. Household size is skewed towards a
lower number of occupants in Buduk Bui, while the modal household size is in Buduk
Nur is 4 persons per household. The lower number of occupants per household in
Buduk Bui is explained by the geographical distance between the households in this
village and the Ba’kelalan Primary School in Long Langai. According to the
household respondents, families who stay in Buduk Bui need to send their children to
live in the school dormitory, whereas children from Buduk Nur live at home with their
parents. In both Buduk Bui and Buduk Nur, households with six or more occupants
commonly explained that they had members of their extended family living in the
house. The maximum number of occupants in a household reported in responses to the
questionnaire was ten, in which was reported by one household in Buduk Bui.
Most respondents can read and write and have completed primary education. Figure
5.3 shows that in Buduk Bui the highest education level of the respondents is high
school, while in Buduk Nur five respondents (10%) have completed either a diploma
or a bachelor degree. Almost a quarter (24%) of respondents in Buduk Bui have no
formal education, compared to only 4% in Buduk Nur The primary school location,
which is close to Buduk Nur but quite far from Buduk Bui, may contribute to this
figure.
Figure 5.3 Educational levels of respondents in Buduk Bui and Buduk Nur
0
10
20
30
40
50
60
None Primary
School
High School Diploma Bachelor
Perc
en
tage o
f re
spon
den
ts (
%)
Buduk Bui
Buduk Nur
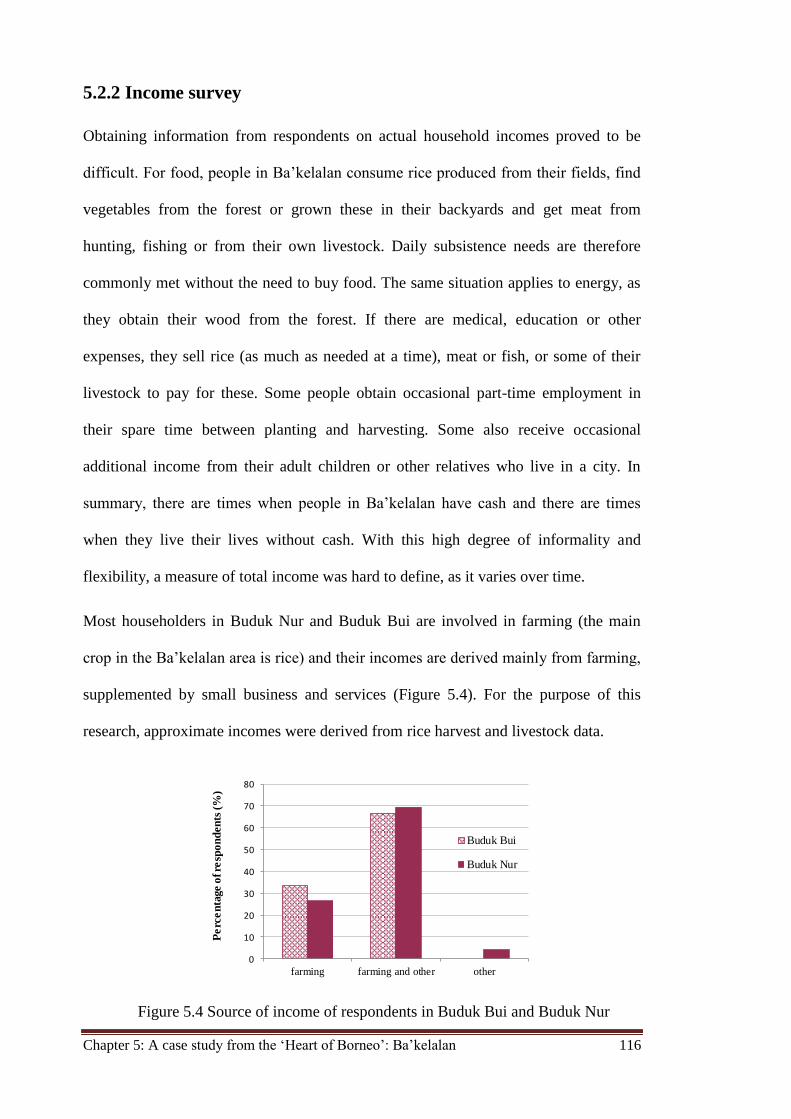
Chapter 5: A case study from the ‘Heart of Borneo’: Ba’kelalan 116
5.2.2 Income survey
Obtaining information from respondents on actual household incomes proved to be
difficult. For food, people in Ba’kelalan consume rice produced from their fields, find
vegetables from the forest or grown these in their backyards and get meat from
hunting, fishing or from their own livestock. Daily subsistence needs are therefore
commonly met without the need to buy food. The same situation applies to energy, as
they obtain their wood from the forest. If there are medical, education or other
expenses, they sell rice (as much as needed at a time), meat or fish, or some of their
livestock to pay for these. Some people obtain occasional part-time employment in
their spare time between planting and harvesting. Some also receive occasional
additional income from their adult children or other relatives who live in a city. In
summary, there are times when people in Ba’kelalan have cash and there are times
when they live their lives without cash. With this high degree of informality and
flexibility, a measure of total income was hard to define, as it varies over time.
Most householders in Buduk Nur and Buduk Bui are involved in farming (the main
crop in the Ba’kelalan area is rice) and their incomes are derived mainly from farming,
supplemented by small business and services (Figure 5.4). For the purpose of this
research, approximate incomes were derived from rice harvest and livestock data.
Figure 5.4 Source of income of respondents in Buduk Bui and Buduk Nur
0
10
20
30
40
50
60
70
80
farming farming and other other
Pe
rce
nta
ge o
f re
spo
nd
en
ts (
%)
Buduk Bui
Buduk Nur
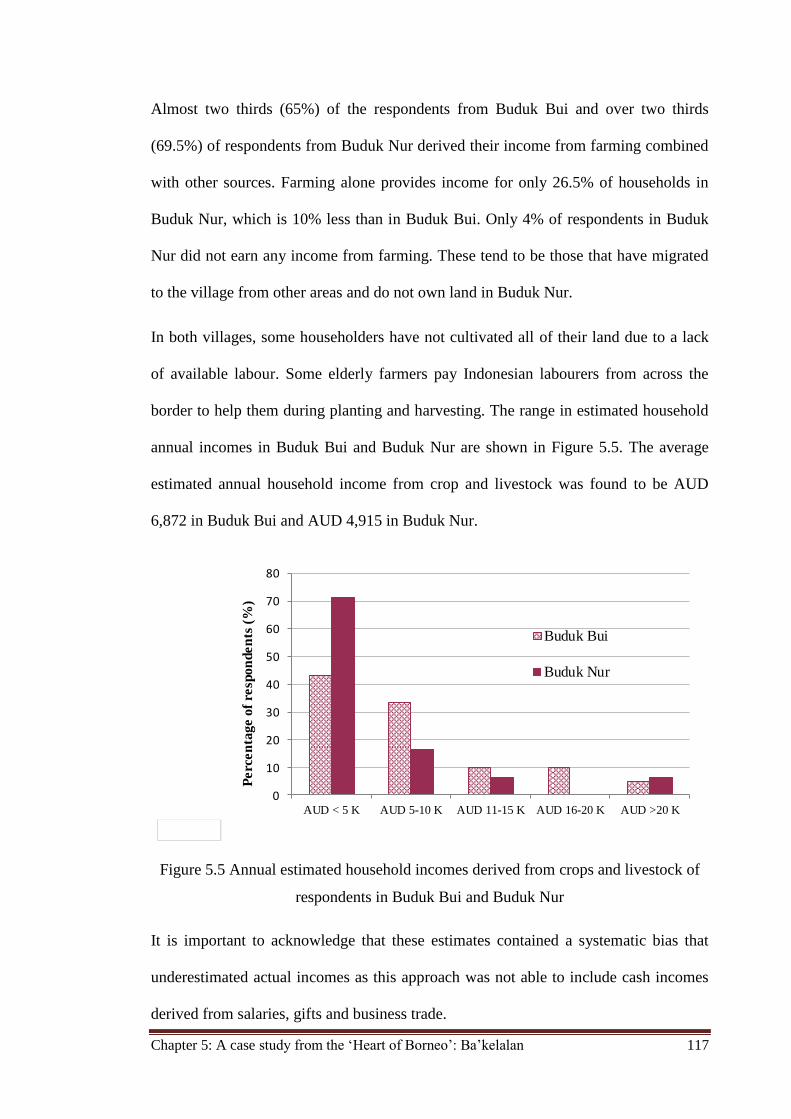
Chapter 5: A case study from the ‘Heart of Borneo’: Ba’kelalan 117
Almost two thirds (65%) of the respondents from Buduk Bui and over two thirds
(69.5%) of respondents from Buduk Nur derived their income from farming combined
with other sources. Farming alone provides income for only 26.5% of households in
Buduk Nur, which is 10% less than in Buduk Bui. Only 4% of respondents in Buduk
Nur did not earn any income from farming. These tend to be those that have migrated
to the village from other areas and do not own land in Buduk Nur.
In both villages, some householders have not cultivated all of their land due to a lack
of available labour. Some elderly farmers pay Indonesian labourers from across the
border to help them during planting and harvesting. The range in estimated household
annual incomes in Buduk Bui and Buduk Nur are shown in Figure 5.5. The average
estimated annual household income from crop and livestock was found to be AUD
6,872 in Buduk Bui and AUD 4,915 in Buduk Nur.
Figure 5.5 Annual estimated household incomes derived from crops and livestock of
respondents in Buduk Bui and Buduk Nur
It is important to acknowledge that these estimates contained a systematic bias that
underestimated actual incomes as this approach was not able to include cash incomes
derived from salaries, gifts and business trade.
0
10
20
30
40
50
60
70
80
AUD < 5 K AUD 5-10 K AUD 11-15 K AUD 16-20 K AUD >20 K
Pe
rce
nta
ge
of
resp
on
de
nts
(%
)
Buduk Bui
Buduk Nur
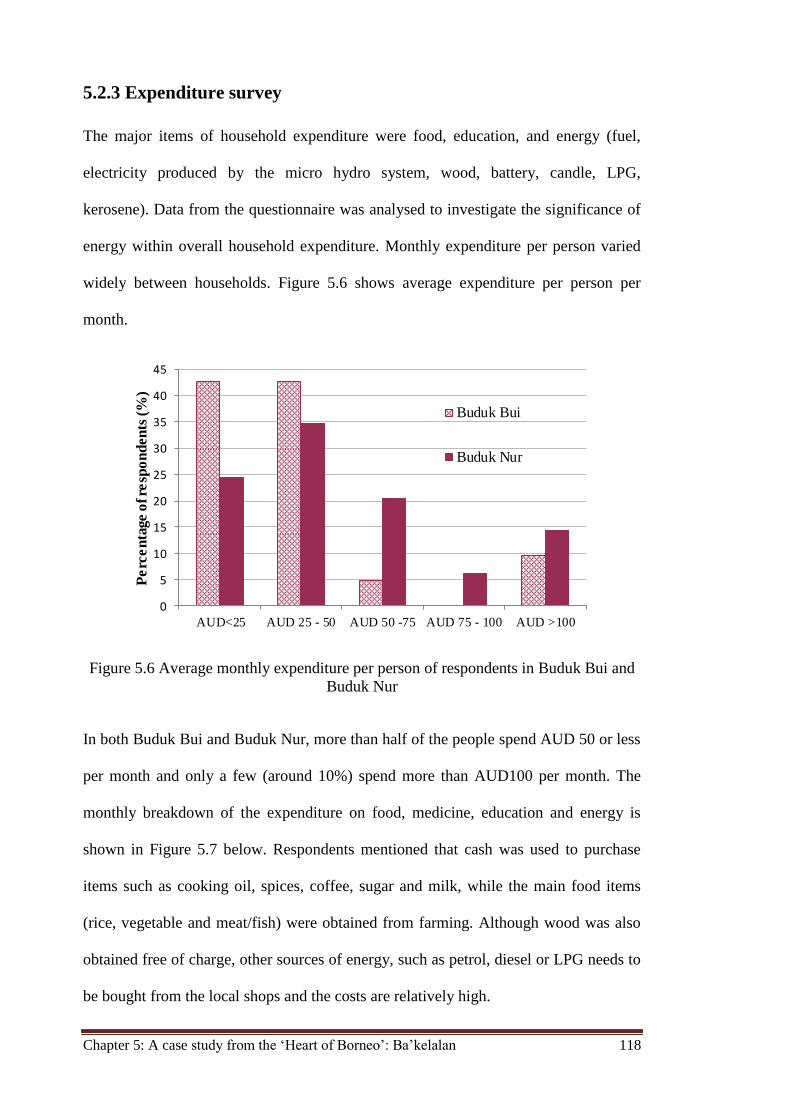
Chapter 5: A case study from the ‘Heart of Borneo’: Ba’kelalan 118
5.2.3 Expenditure survey
The major items of household expenditure were food, education, and energy (fuel,
electricity produced by the micro hydro system, wood, battery, candle, LPG,
kerosene). Data from the questionnaire was analysed to investigate the significance of
energy within overall household expenditure. Monthly expenditure per person varied
widely between households. Figure 5.6 shows average expenditure per person per
month.
Figure 5.6 Average monthly expenditure per person of respondents in Buduk Bui and
Buduk Nur
In both Buduk Bui and Buduk Nur, more than half of the people spend AUD 50 or less
per month and only a few (around 10%) spend more than AUD100 per month. The
monthly breakdown of the expenditure on food, medicine, education and energy is
shown in Figure 5.7 below. Respondents mentioned that cash was used to purchase
items such as cooking oil, spices, coffee, sugar and milk, while the main food items
(rice, vegetable and meat/fish) were obtained from farming. Although wood was also
obtained free of charge, other sources of energy, such as petrol, diesel or LPG needs to
be bought from the local shops and the costs are relatively high.
0
5
10
15
20
25
30
35
40
45
AUD<25 AUD 25 - 50 AUD 50 -75 AUD 75 - 100 AUD >100
Pe
rce
nta
ge o
f re
spo
nd
en
ts (
%)
Buduk Bui
Buduk Nur
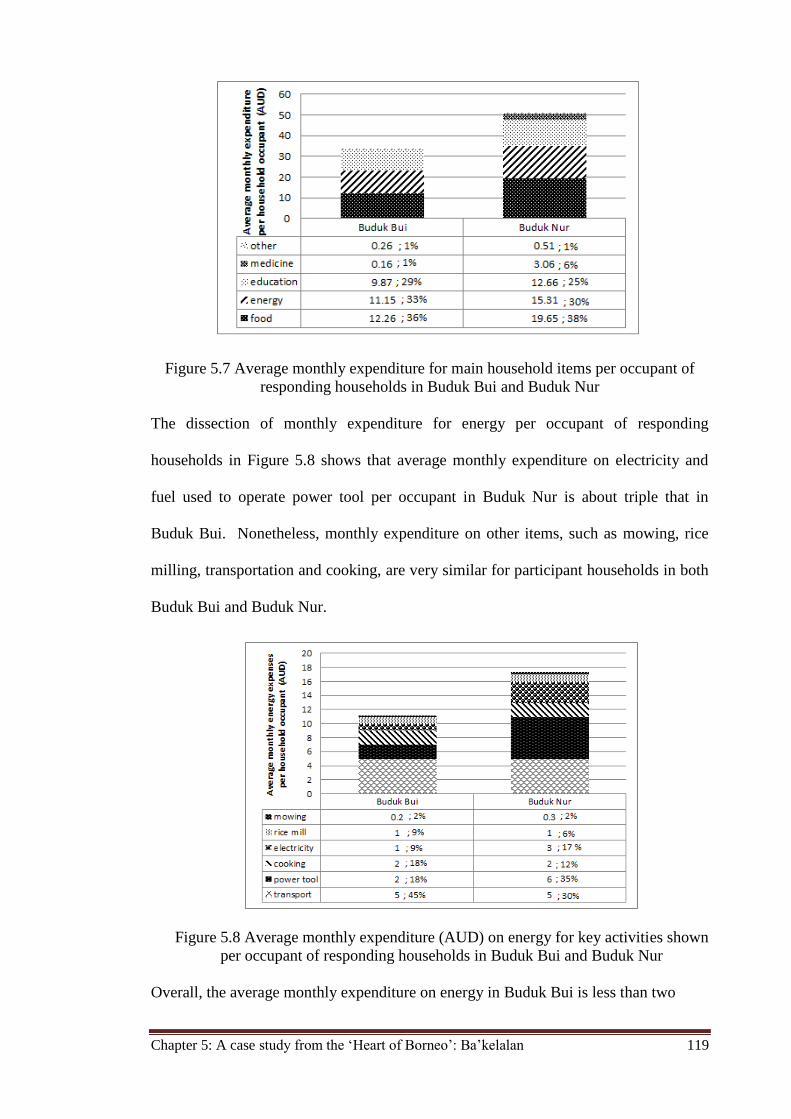
Chapter 5: A case study from the ‘Heart of Borneo’: Ba’kelalan 119
Figure 5.7 Average monthly expenditure for main household items per occupant of
responding households in Buduk Bui and Buduk Nur
The dissection of monthly expenditure for energy per occupant of responding
households in Figure 5.8 shows that average monthly expenditure on electricity and
fuel used to operate power tool per occupant in Buduk Nur is about triple that in
Buduk Bui. Nonetheless, monthly expenditure on other items, such as mowing, rice
milling, transportation and cooking, are very similar for participant households in both
Buduk Bui and Buduk Nur.
Figure 5.8 Average monthly expenditure (AUD) on energy for key activities shown
per occupant of responding households in Buduk Bui and Buduk Nur
Overall, the average monthly expenditure on energy in Buduk Bui is less than two
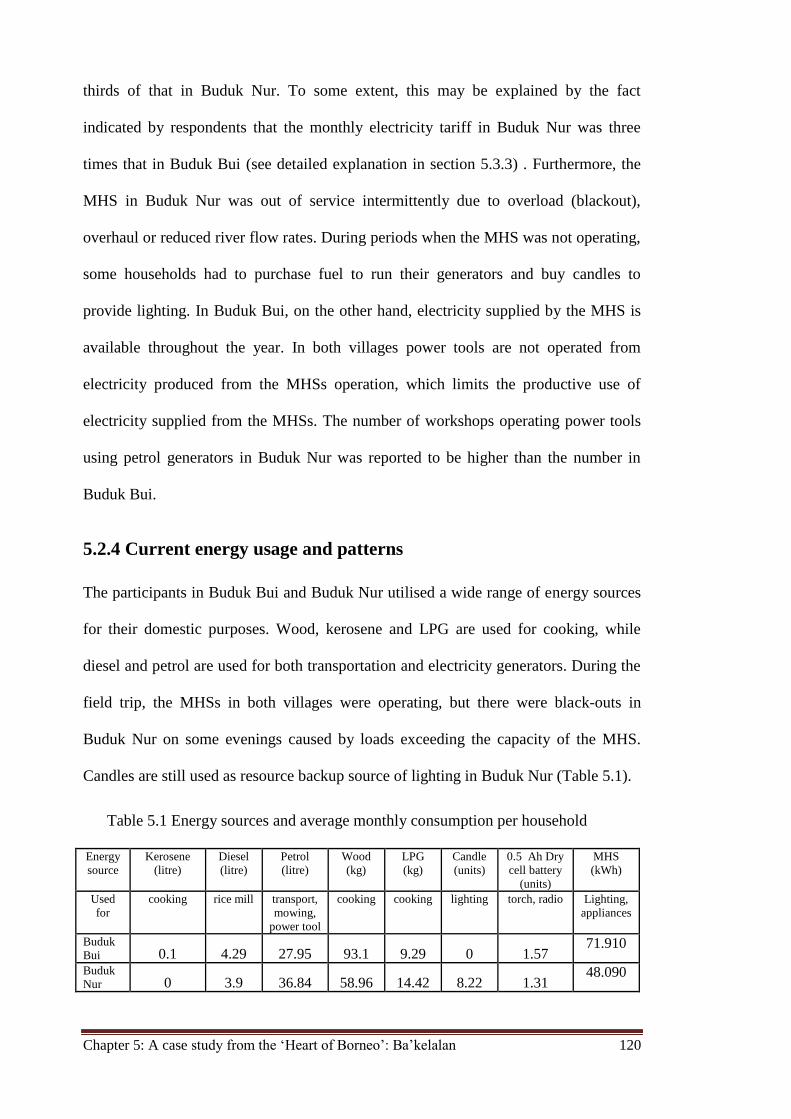
Chapter 5: A case study from the ‘Heart of Borneo’: Ba’kelalan 120
thirds of that in Buduk Nur. To some extent, this may be explained by the fact
indicated by respondents that the monthly electricity tariff in Buduk Nur was three
times that in Buduk Bui (see detailed explanation in section 5.3.3) . Furthermore, the
MHS in Buduk Nur was out of service intermittently due to overload (blackout),
overhaul or reduced river flow rates. During periods when the MHS was not operating,
some households had to purchase fuel to run their generators and buy candles to
provide lighting. In Buduk Bui, on the other hand, electricity supplied by the MHS is
available throughout the year. In both villages power tools are not operated from
electricity produced from the MHSs operation, which limits the productive use of
electricity supplied from the MHSs. The number of workshops operating power tools
using petrol generators in Buduk Nur was reported to be higher than the number in
Buduk Bui.
5.2.4 Current energy usage and patterns
The participants in Buduk Bui and Buduk Nur utilised a wide range of energy sources
for their domestic purposes. Wood, kerosene and LPG are used for cooking, while
diesel and petrol are used for both transportation and electricity generators. During the
field trip, the MHSs in both villages were operating, but there were black-outs in
Buduk Nur on some evenings caused by loads exceeding the capacity of the MHS.
Candles are still used as resource backup source of lighting in Buduk Nur (Table 5.1).
Table 5.1 Energy sources and average monthly consumption per household
Energy
source
Kerosene
(litre)
Diesel
(litre)
Petrol
(litre)
Wood
(kg)
LPG
(kg)
Candle
(units)
0.5 Ah Dry
cell battery
(units)
MHS
(kWh)
Used
for
cooking rice mill transport,
mowing,
power tool
cooking cooking lighting torch, radio Lighting,
appliances
Buduk
Bui 0.1 4.29 27.95 93.1 9.29 0 1.57 71.910
Buduk
Nur 0 3.9 36.84 58.96 14.42 8.22 1.31 48.090
Chapter 5: A case study from the ‘Heart of Borneo’: Ba’kelalan 121
Responses to the energy audit questions were based on the currently working MHSs.
The description of sources of energy for routine uses and average monthly
consumption per household, calculated from the questionnaire data, are shown in Table
5.1. The average monthly household consumption of electricity supplied by the MHS
in Buduk Bui is almost 50% higher than in the electricity supplied by the MHS in
Buduk Nur. Information obtained from interviews with the MHCs of both of the lokasi
revealed that one reason for the greater household consumption of electricity in Buduk
Bui is that householders in Buduk Bui were advised to draw approximately 250 W
from the system while household in Buduk Nur were advised to draw only 100 W due
to a lower MHS capacity per household in Buduk Nur. These limits are not enforced
by the MHCs and are merely suggested limits. Nor were any current limiting devices
used in the households at the time of energy audit. A second reason is that the MHC in
Buduk Bui encouraged villagers to leave lights on all night. This is discussed further in
section 5.3.3.
An energy audit was carried out for each respondent household to understand the
electricity needs and usage patterns in the two villages. In some cases, respondents
declined permission for audits to be undertaken and instead provided a list of
appliances used in the household. The range of appliances used in the audited
households included washing machines, refrigerators, freezers, electric kettles, rice
cookers, toasters, electric ovens, computers and blenders.
The energy audits indicated that peak loads occurred during the evenings (6.00 pm –
9.00 pm) and early mornings (5.30 am – 7.30 am) and that loads were a minimum
during the non-peak hours (8.00 am – 5.00 pm and 11.00 pm – 5.00 am). In Buduk
Nur, the peak load on the MHS was 11.239 kW and the minimum load was 1.801 kW,
while in Buduk Bui the peak load on the MHS was 4.726 kW and the minimum load
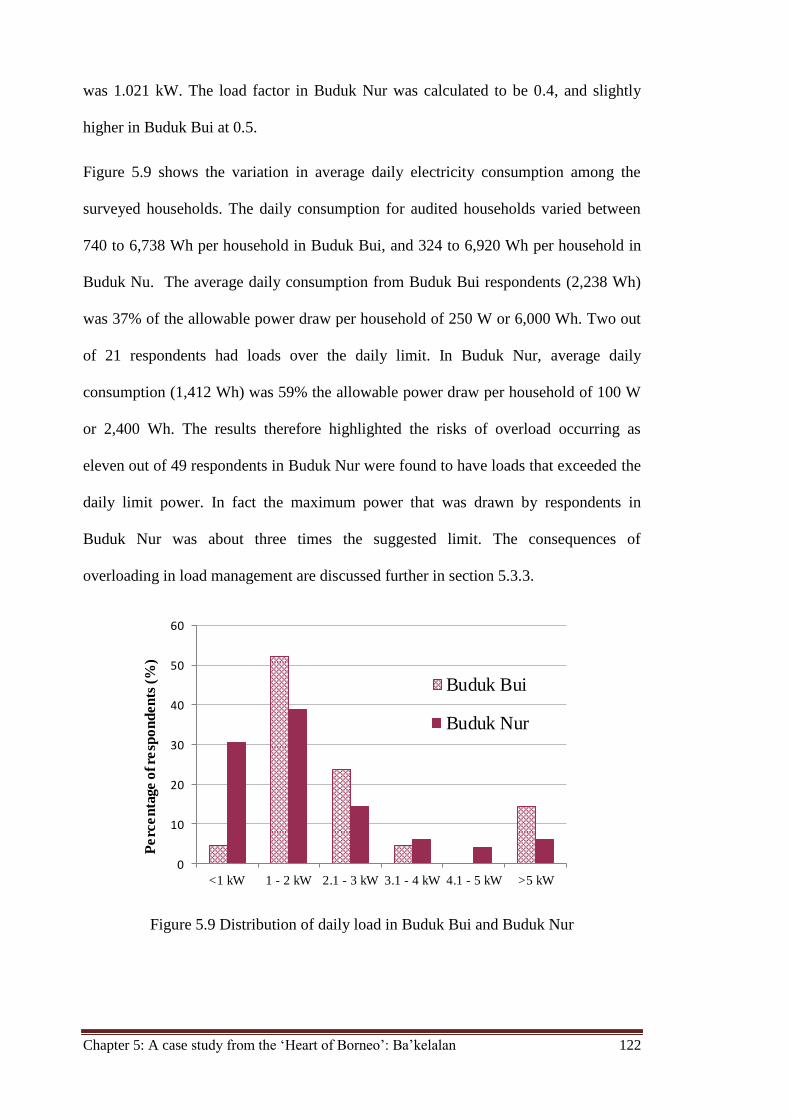
Chapter 5: A case study from the ‘Heart of Borneo’: Ba’kelalan 122
was 1.021 kW. The load factor in Buduk Nur was calculated to be 0.4, and slightly
higher in Buduk Bui at 0.5.
Figure 5.9 shows the variation in average daily electricity consumption among the
surveyed households. The daily consumption for audited households varied between
740 to 6,738 Wh per household in Buduk Bui, and 324 to 6,920 Wh per household in
Buduk Nu. The average daily consumption from Buduk Bui respondents (2,238 Wh)
was 37% of the allowable power draw per household of 250 W or 6,000 Wh. Two out
of 21 respondents had loads over the daily limit. In Buduk Nur, average daily
consumption (1,412 Wh) was 59% the allowable power draw per household of 100 W
or 2,400 Wh. The results therefore highlighted the risks of overload occurring as
eleven out of 49 respondents in Buduk Nur were found to have loads that exceeded the
daily limit power. In fact the maximum power that was drawn by respondents in
Buduk Nur was about three times the suggested limit. The consequences of
overloading in load management are discussed further in section 5.3.3.
Figure 5.9 Distribution of daily load in Buduk Bui and Buduk Nur
0
10
20
30
40
50
60
<1 kW 1 - 2 kW 2.1 - 3 kW 3.1 - 4 kW 4.1 - 5 kW >5 kW
Pe
rce
nta
ge o
f re
spo
nd
en
ts (
%)
Buduk Bui
Buduk Nur
Chapter 5: A case study from the ‘Heart of Borneo’: Ba’kelalan 123
5.3 Evaluation of micro hydro projects
The MHSs installed in Buduk Bui and Buduk Nur were evaluated using that
conceptual model described in the Methodology chapter. The results are analysed
against the framework of policy and design, implementation, operation and evaluation.
5.3.1 Policy and design
(a) Resource assessment
The designer reported that hydro resources for the MHSs in Buduk Bui and Buduk Nur
were both estimated using the simple bucket method in which water is collected in a
bucket placed below a temporary weir. Furthermore, these spot readings were taken
during the dry season and estimates of variations in flow rates throughout the year
were based on anecdotal information provided by the villagers about differences in
flow rates during the dry and wet seasons. No hydrological long-term data for the
region was available to the system designer to verify or more accurately estimate these
flow rates. In both cases, the hydraulic head was calculated using a clinometer. The
system designer used the calculated hydraulic head and estimated flow rate to calculate
the available power in the streams.
Although the method of resource assessment was known from the interview with the
designer, no quantitative data was made available. In order to obtain this data, spot
reading data were taken during the field visits to Buduk Nur and Buduk Bui. Flow
velocity was measured using a float method and the net-head was measured with a
Clinometer. Estimates of MHS power output was calculated using flow rate and head
data.
The measurement of flow rates at Sarui Laut River in Buduk Nur was taken in October
2009. At that time of measurement the flow rate at this river was reduced due to long
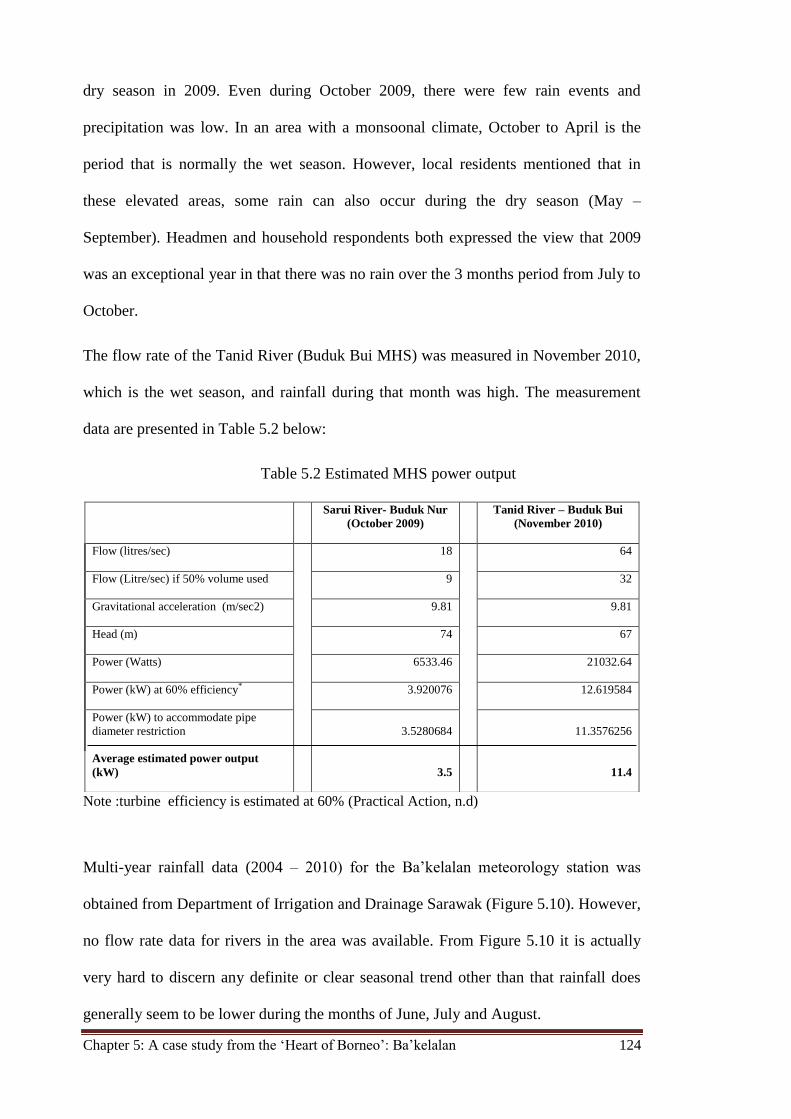
Chapter 5: A case study from the ‘Heart of Borneo’: Ba’kelalan 124
dry season in 2009. Even during October 2009, there were few rain events and
precipitation was low. In an area with a monsoonal climate, October to April is the
period that is normally the wet season. However, local residents mentioned that in
these elevated areas, some rain can also occur during the dry season (May –
September). Headmen and household respondents both expressed the view that 2009
was an exceptional year in that there was no rain over the 3 months period from July to
October.
The flow rate of the Tanid River (Buduk Bui MHS) was measured in November 2010,
which is the wet season, and rainfall during that month was high. The measurement
data are presented in Table 5.2 below:
Table 5.2 Estimated MHS power output
Note :turbine efficiency is estimated at 60% (Practical Action, n.d)
Multi-year rainfall data (2004 – 2010) for the Ba’kelalan meteorology station was
obtained from Department of Irrigation and Drainage Sarawak (Figure 5.10). However,
no flow rate data for rivers in the area was available. From Figure 5.10 it is actually
very hard to discern any definite or clear seasonal trend other than that rainfall does
generally seem to be lower during the months of June, July and August.
Sarui River- Buduk Nur
(October 2009)
Tanid River – Buduk Bui
(November 2010)
Flow (litres/sec) 18 64
Flow (Litre/sec) if 50% volume used 9 32
Gravitational acceleration (m/sec2) 9.81 9.81
Head (m) 74 67
Power (Watts) 6533.46 21032.64
Power (kW) at 60% efficiency* 3.920076 12.619584
Power (kW) to accommodate pipe
diameter restriction 3.5280684 11.3576256
Average estimated power output
(kW) 3.5 11.4
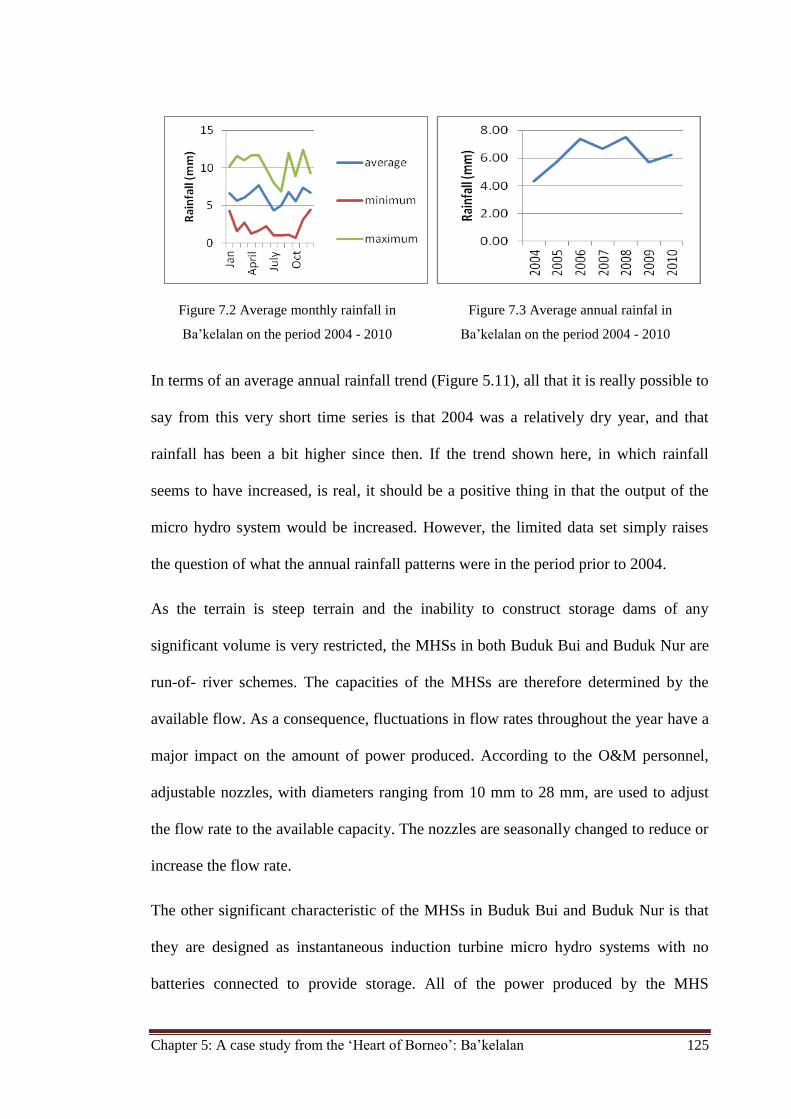
Chapter 5: A case study from the ‘Heart of Borneo’: Ba’kelalan 125
In terms of an average annual rainfall trend (Figure 5.11), all that it is really possible to
say from this very short time series is that 2004 was a relatively dry year, and that
rainfall has been a bit higher since then. If the trend shown here, in which rainfall
seems to have increased, is real, it should be a positive thing in that the output of the
micro hydro system would be increased. However, the limited data set simply raises
the question of what the annual rainfall patterns were in the period prior to 2004.
As the terrain is steep terrain and the inability to construct storage dams of any
significant volume is very restricted, the MHSs in both Buduk Bui and Buduk Nur are
run-of- river schemes. The capacities of the MHSs are therefore determined by the
available flow. As a consequence, fluctuations in flow rates throughout the year have a
major impact on the amount of power produced. According to the O&M personnel,
adjustable nozzles, with diameters ranging from 10 mm to 28 mm, are used to adjust
the flow rate to the available capacity. The nozzles are seasonally changed to reduce or
increase the flow rate.
The other significant characteristic of the MHSs in Buduk Bui and Buduk Nur is that
they are designed as instantaneous induction turbine micro hydro systems with no
batteries connected to provide storage. All of the power produced by the MHS
Figure 7.2 Average monthly rainfall in
Ba’kelalan on the period 2004 - 2010
Figure 7.3 Average annual rainfal in
Ba’kelalan on the period 2004 - 2010
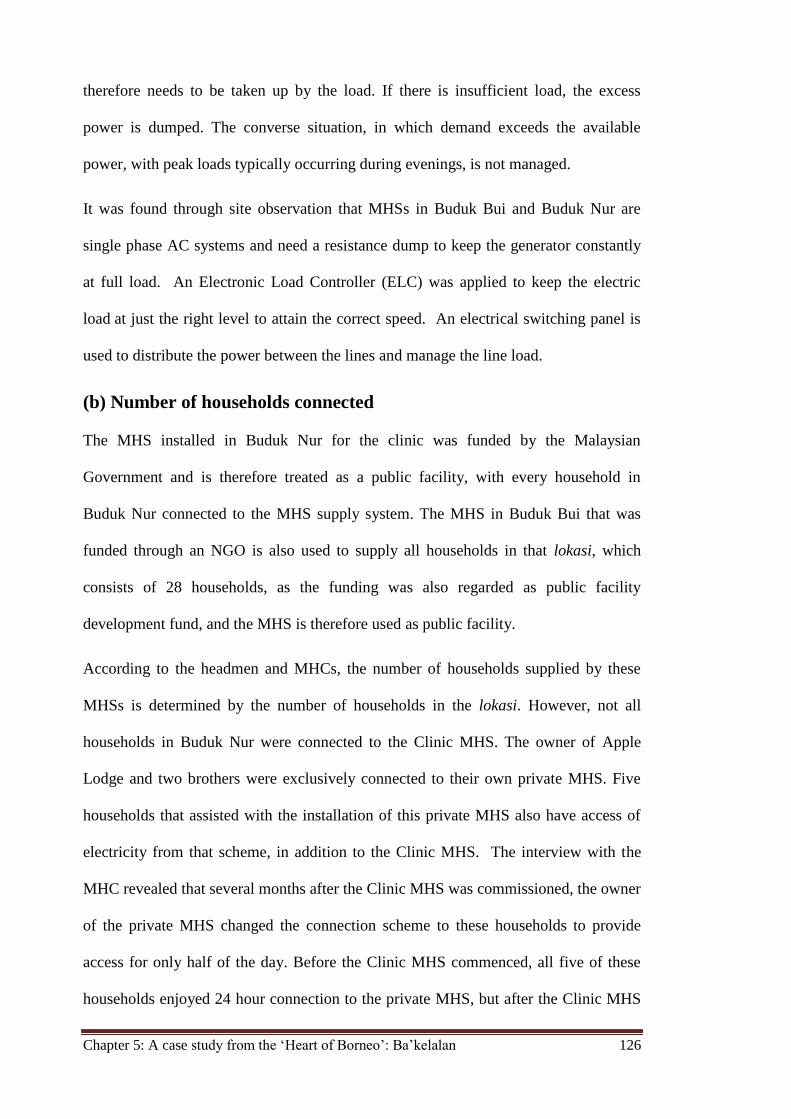
Chapter 5: A case study from the ‘Heart of Borneo’: Ba’kelalan 126
therefore needs to be taken up by the load. If there is insufficient load, the excess
power is dumped. The converse situation, in which demand exceeds the available
power, with peak loads typically occurring during evenings, is not managed.
It was found through site observation that MHSs in Buduk Bui and Buduk Nur are
single phase AC systems and need a resistance dump to keep the generator constantly
at full load. An Electronic Load Controller (ELC) was applied to keep the electric
load at just the right level to attain the correct speed. An electrical switching panel is
used to distribute the power between the lines and manage the line load.
(b) Number of households connected
The MHS installed in Buduk Nur for the clinic was funded by the Malaysian
Government and is therefore treated as a public facility, with every household in
Buduk Nur connected to the MHS supply system. The MHS in Buduk Bui that was
funded through an NGO is also used to supply all households in that lokasi, which
consists of 28 households, as the funding was also regarded as public facility
development fund, and the MHS is therefore used as public facility.
According to the headmen and MHCs, the number of households supplied by these
MHSs is determined by the number of households in the lokasi. However, not all
households in Buduk Nur were connected to the Clinic MHS. The owner of Apple
Lodge and two brothers were exclusively connected to their own private MHS. Five
households that assisted with the installation of this private MHS also have access of
electricity from that scheme, in addition to the Clinic MHS. The interview with the
MHC revealed that several months after the Clinic MHS was commissioned, the owner
of the private MHS changed the connection scheme to these households to provide
access for only half of the day. Before the Clinic MHS commenced, all five of these
households enjoyed 24 hour connection to the private MHS, but after the Clinic MHS
Chapter 5: A case study from the ‘Heart of Borneo’: Ba’kelalan 127
commenced, the owner of the private MHS only gave them access at night. The excess
electricity produced by the MHS power above the owner’s needs (1.5 kW) during the
day is sold to the operator of a mobile telecommunications tower that, until that time,
had been powered by a diesel generator.
(c) Stakeholder engagement in the MHS projects
The numbers of stakeholders and their roles in the MHS case studies were quite
different, and this reflects the different origins of the project ideas. In Buduk Bui, the
community initiated a project to meet their perceived need for electricity, whereas in
Buduk Nur, the initiative came from the operational needs of the government health
clinic. These differences in origins influenced the way similar sets of stakeholders
engaged with the projects. In both projects, the manufacturer of the micro-hydro
systems also supplied the equipment to the sites, and so is referred to here as the
“supplier”.
According to the MHC, one village member who lives in Kuching and is active in the
Rotary Club (RC) approached the RC to help his village of origin, Buduk Bui, by
funding an MHS project to electrify the village. The RC expressed interest in
providing a grant to help the community offset the cost of an MHS provided that the
community would also contribute toward the cost of constructing the project. At the
planning stage, the community was involved in activities such as looking for an
appropriate river to be harnessed; helping the supplier to undertake the resource
assessment and choosing the site for the powerhouse, which turned out to be on private
land. The capacity determination, turbine type, system type and budget allocation were
jointly decided by the supplier and the funding body
In Buduk Nur, the Ministry of Health was responsible for the project which was
installed to supply electricity for the clinic. The government respondent indicated that
Chapter 5: A case study from the ‘Heart of Borneo’: Ba’kelalan 128
the Ministry took the initiative for the project and worked together with the Sarawak
Public Utility Department in the implementation of the project. The Government
respondent mentioned that neither the Sub-district Office nor the Divisional Office was
involved in the planning stage for the MHS in Buduk Nur.
The headmen mentioned that when the Ministry of Health decided to install an MHS to
electrify the Public Clinic in Buduk Nur, it was at that stage that they then discussed
the matter with the community and the outcome of those discussions was that the
villagers also wanted access to electricity from the MHS. The headmen passed on the
request to the government officials and the Ministry agreed to supply sufficient
electricity from the scheme if in return, the villagers would take responsibility for
operation and maintenance (O&M) of the MHS.
Questionnaire respondents indicated that in a manner similar to what happened with
the Buduk Bui MHS, the community in Buduk Nur was involved in identifying an
appropriate river to be harnessed; helping the supplier undertake the resource
assessment and choosing the location of the powerhouse, which was also on private
land. The capacity, turbine type, system type and budget allocation were all decided by
supplier in collaboration with the funding body.
(d) Funding
The funding of MHSs in Buduk Bui and Buduk Nur came from different sources. It
was found through the literature review that a total of USD 41,500 (AUD 45,650)
funding for MHS in Buduk Bui was donated by the Rotary Foundation, the major part
from Kuching as the Host Club and Raffles City Rotary Club as the International
Partner. Community respondents in Buduk Bui did not know the total cost for their
MHS. The headman mentioned that Rotary asked the community to contribute MYR
20,000 (AUD 6,667) in order to complete the project. Rotary, as the funding body,
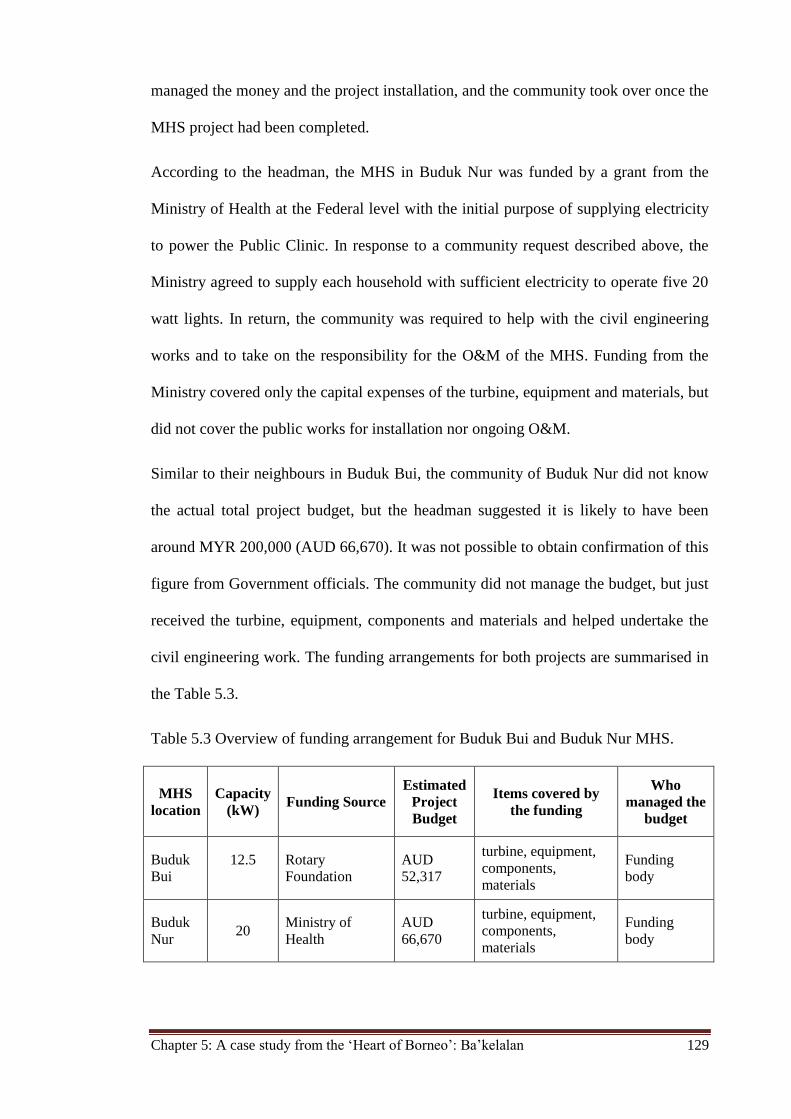
Chapter 5: A case study from the ‘Heart of Borneo’: Ba’kelalan 129
managed the money and the project installation, and the community took over once the
MHS project had been completed.
According to the headman, the MHS in Buduk Nur was funded by a grant from the
Ministry of Health at the Federal level with the initial purpose of supplying electricity
to power the Public Clinic. In response to a community request described above, the
Ministry agreed to supply each household with sufficient electricity to operate five 20
watt lights. In return, the community was required to help with the civil engineering
works and to take on the responsibility for the O&M of the MHS. Funding from the
Ministry covered only the capital expenses of the turbine, equipment and materials, but
did not cover the public works for installation nor ongoing O&M.
Similar to their neighbours in Buduk Bui, the community of Buduk Nur did not know
the actual total project budget, but the headman suggested it is likely to have been
around MYR 200,000 (AUD 66,670). It was not possible to obtain confirmation of this
figure from Government officials. The community did not manage the budget, but just
received the turbine, equipment, components and materials and helped undertake the
civil engineering work. The funding arrangements for both projects are summarised in
the Table 5.3.
Table 5.3 Overview of funding arrangement for Buduk Bui and Buduk Nur MHS.
MHS
location
Capacity
(kW) Funding Source
Estimated
Project
Budget
Items covered by
the funding
Who
managed the
budget
Buduk
Bui
12.5
Rotary
Foundation
AUD
52,317
turbine, equipment,
components,
materials
Funding
body
Buduk
Nur 20
Ministry of
Health
AUD
66,670
turbine, equipment,
components,
materials
Funding
body
Chapter 5: A case study from the ‘Heart of Borneo’: Ba’kelalan 130
5.3.2 Implementation
(a) Installation
The projects to install the MHSs were implemented by the communities, manufacturer,
and the funding agencies. According to Government respondents, poor infrastructure,
such as bad roads (especially during wet weather), disrupted the logistics and
implementation of the public works. As a consequence, the project deadlines were not
met as the logistic planning was sometimes not effective.
A lack of infrastructure also meant that following the commissioning of the systems,
fault finding and repairs were time consuming and costly. According to the designer,
the aim was to install a reliable and robust system to minimise problems after
commissioning. He also said it is better to always use one brand so that spare parts are
more readily available and easier to obtain, thereby reducing the time and cost of
maintenance.
O&M personnel for both case studies interviewed for this research said that training
for the MHC was organised.In Buduk Bui only on-site training was provided while in
Buduk Nur both off-site and on-site training was given. The training focused on the
basic skills required to address technical problems, such as joining pipes, cleaning
blocked pipes, identifying different parts of the turbine and how to replace the parts.
(b) Community involvement
The nature of community involvement in these projects is closely related to the
funding arrangements. Most community involvement was the contribution to site
works during the construction phase and later on for O&M. Since the project in Buduk
Bui was a community-based initiative, the community was involved in funding,
planning, civil works and O&M. In Buduk Nur, the community was involved in
planning, civil works and the O&M too, but did not contribute to fund-raising.
Chapter 5: A case study from the ‘Heart of Borneo’: Ba’kelalan 131
From the questionnaire it was found that at the planning stage, both communities were
involved in activities such as looking for an appropriate river to be harnessed; helping
the manufacturer/supplier conduct resource assessment and choosing the location for
the powerhouse (which includes negotiating permission from landowners). The
manufacturer, who is also the supplier, and the funding body determined the system
capacity, turbine type, system type and developed the project budget.
In both Buduk Bui and Buduk Nur, the communities were involved in installing the
MHSs. The funding from outside sources covered only the costs of the equipment,
including hydro-turbine set, electrical switching panel, electrical cable, the cement and
steel to build the dam and other construction equipment needed to complete the
project.
During the civil works phases of Buduk Nur and the Buduk Bui MHSs, the villagers
contributed their labour as volunteers due to the limited funding that was made
available. The headmen invited all households in the villages to help and scheduled a
day for the civil works. Although it was voluntary community service, those
households unable to attend were required to pay compensation to ensure equity in the
community. In Buduk Bui a household paid MYR 20 per day and MYR 25 per day in
Buduk Nur.
Most respondents had participated in the MHS projects. In both Buduk Bui and Buduk
Nur, less than 20% of respondents were not able to participate in the civil works due to
sickness or business commitments. The MHC in Buduk Nur stated that business
operators preferred to pay the compensation and continue running their business. The
levels of community involvement in aspects of the MHS construction projects are
shown in the Figure 5.12.
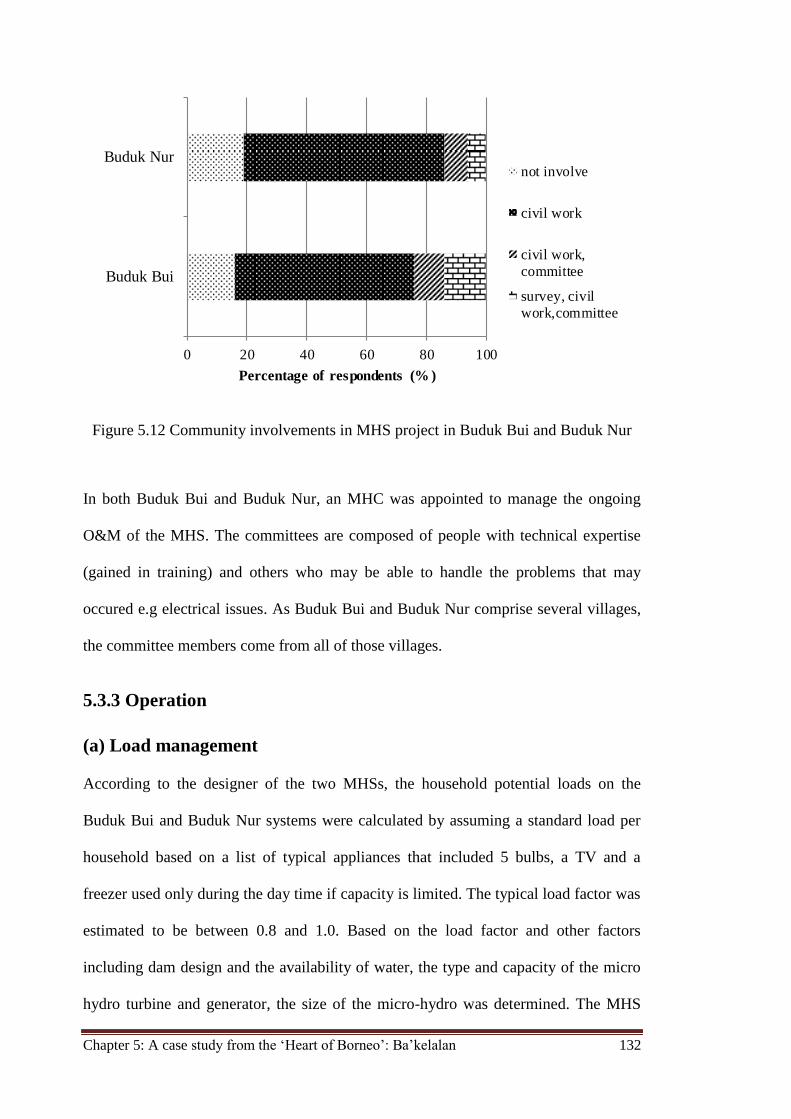
Chapter 5: A case study from the ‘Heart of Borneo’: Ba’kelalan 132
Figure 5.12 Community involvements in MHS project in Buduk Bui and Buduk Nur
In both Buduk Bui and Buduk Nur, an MHC was appointed to manage the ongoing
O&M of the MHS. The committees are composed of people with technical expertise
(gained in training) and others who may be able to handle the problems that may
occured e.g electrical issues. As Buduk Bui and Buduk Nur comprise several villages,
the committee members come from all of those villages.
5.3.3 Operation
(a) Load management
According to the designer of the two MHSs, the household potential loads on the
Buduk Bui and Buduk Nur systems were calculated by assuming a standard load per
household based on a list of typical appliances that included 5 bulbs, a TV and a
freezer used only during the day time if capacity is limited. The typical load factor was
estimated to be between 0.8 and 1.0. Based on the load factor and other factors
including dam design and the availability of water, the type and capacity of the micro
hydro turbine and generator, the size of the micro-hydro was determined. The MHS
0 20 40 60 80 100
Buduk Bui
Buduk Nur
Percentage of respondents (% )
not involve
civil work
civil work,
committee
survey, civil
work,committee
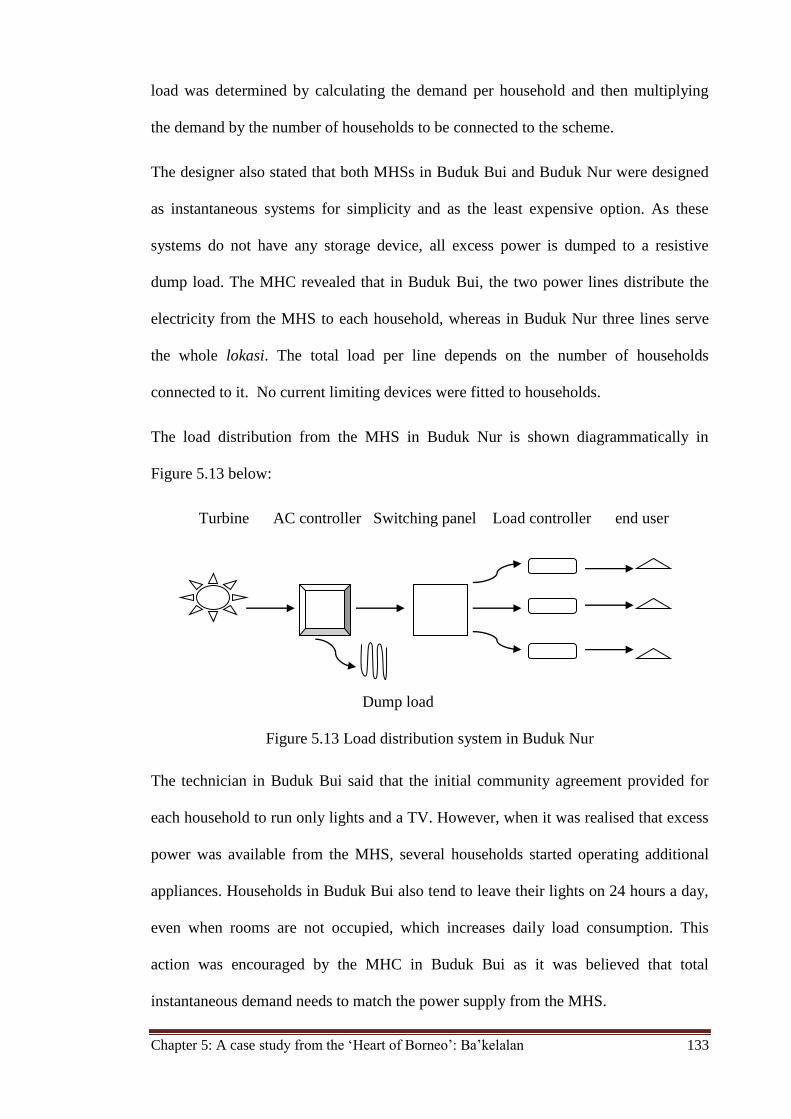
Chapter 5: A case study from the ‘Heart of Borneo’: Ba’kelalan 133
load was determined by calculating the demand per household and then multiplying
the demand by the number of households to be connected to the scheme.
The designer also stated that both MHSs in Buduk Bui and Buduk Nur were designed
as instantaneous systems for simplicity and as the least expensive option. As these
systems do not have any storage device, all excess power is dumped to a resistive
dump load. The MHC revealed that in Buduk Bui, the two power lines distribute the
electricity from the MHS to each household, whereas in Buduk Nur three lines serve
the whole lokasi. The total load per line depends on the number of households
connected to it. No current limiting devices were fitted to households.
The load distribution from the MHS in Buduk Nur is shown diagrammatically in
Figure 5.13 below:
Turbine AC controller Switching panel Load controller end user
Dump load
Figure 5.13 Load distribution system in Buduk Nur
The technician in Buduk Bui said that the initial community agreement provided for
each household to run only lights and a TV. However, when it was realised that excess
power was available from the MHS, several households started operating additional
appliances. Households in Buduk Bui also tend to leave their lights on 24 hours a day,
even when rooms are not occupied, which increases daily load consumption. This
action was encouraged by the MHC in Buduk Bui as it was believed that total
instantaneous demand needs to match the power supply from the MHS.
Chapter 5: A case study from the ‘Heart of Borneo’: Ba’kelalan 134
Under the initial agreement with the Ministry of Health, the Clinic in Buduk Nur gave
participating households access to its MHS power supply on condition they only run a
maximum of 5 light bulbs per household.
In the period before the Clinic MHS was installed, villagers already owned a range of
different electrical appliances. Respondents indicated that some of these appliances
were operated using portable generator power, but some people found this to be too
expensive for regular operation so they simply had electrical appliances in their homes
that were not operated. With the advent of ‘cheap’ electricity from Clinic MHS, some
people began to operate all the appliances they possessed that had long been idle. In
extreme cases, some people ignored the agreement with the funding body and bought
additional appliances. The resulting overload often causes black-outs in particular
lines. Aside from the inconvenience of the blackouts themselves, respondents believed
that there was often a difference in power quality between the three lines in this
system.
Furthermore, the differences in the use of appliances caused jealousy between
villagers. One household respondent in Buduk Nur stated that it was especially unfair
that some people operated their freezers and were therefore able to obtain income from
selling meat or ice. Although the MHS had operated less than a year (commissioned in
May 2010), when the survey was conducted in October 2010, people were already
breaking the rules and attempting to use all of their appliances. It is hard for the
management committee to administer sanctions, as no current limit devices are fitted to
households. The O&M personnel informed that if a black-out occurs on one of the
lines, it is hard to know which house had the excess load. This situation was getting
worse and blackouts could even occur more than 3 times in one night. When that
happens, the people who look after the limit box (regulator) turn off the power to that
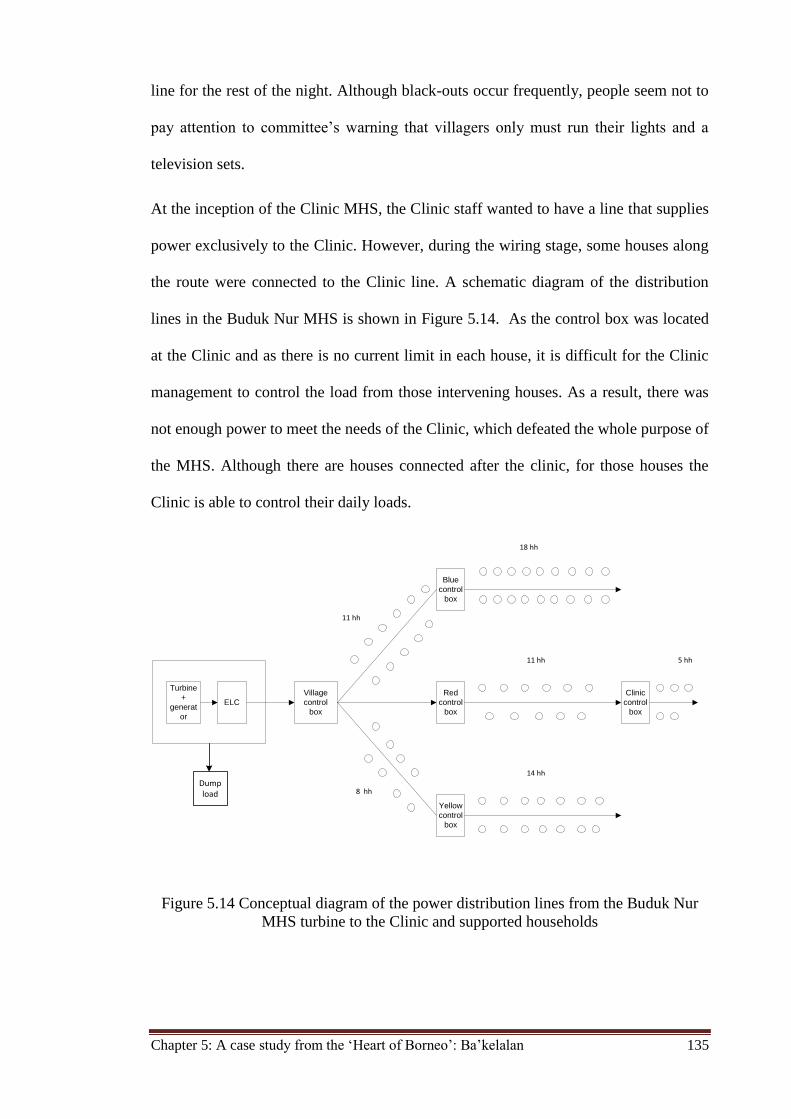
Chapter 5: A case study from the ‘Heart of Borneo’: Ba’kelalan 135
line for the rest of the night. Although black-outs occur frequently, people seem not to
pay attention to committee’s warning that villagers only must run their lights and a
television sets.
At the inception of the Clinic MHS, the Clinic staff wanted to have a line that supplies
power exclusively to the Clinic. However, during the wiring stage, some houses along
the route were connected to the Clinic line. A schematic diagram of the distribution
lines in the Buduk Nur MHS is shown in Figure 5.14. As the control box was located
at the Clinic and as there is no current limit in each house, it is difficult for the Clinic
management to control the load from those intervening houses. As a result, there was
not enough power to meet the needs of the Clinic, which defeated the whole purpose of
the MHS. Although there are houses connected after the clinic, for those houses the
Clinic is able to control their daily loads.
Turbine
+
generat
or
ELC
Village
control
box
Blue
control
box
Red
control
box
Yellow
control
box
Clinic
control
box
18 hh
11 hh 5 hh
14 hh
11 hh
8 hhDump load
Figure 5.14 Conceptual diagram of the power distribution lines from the Buduk Nur
MHS turbine to the Clinic and supported households
Chapter 5: A case study from the ‘Heart of Borneo’: Ba’kelalan 136
As a consequence of the unstable voltage, the Clinic’s vaccine freezer had not been
working since September 2010, yet the ultimate aim of electrifying the public clinic
was to enable operation of a vaccine freezer. The freezer was designed to be operated
using LPG as an alternate energy source. However, LPG is very costly and during the
wet season LPG shortages occurred frequently. According to the Clinic staff, about 15
kg LPG is used each month at a cost of about AUD 8 /month.
The Clinic staff found it was hard to negotiate with the villagers, to keep them
adhering to the rule to operating only lights, which is especially important for houses
on Clinic power-line. During the dry season, the river flow decreased to the point that
there was sufficient electricity to supply only the clinic (in August 2010 the only line
operating was the clinic line). However, this caused inequity issues in relation to
household users, because the 11 houses connected to the clinic line also continued to
enjoy electricity supply from the MHS, while the houses on the other lines had to
spend more money on alternative fuels.
From the follow-up fieldtrip, it was found that to overcome the overloading situation,
in 2011 the Micro-Hydro Committee had meetings with all villagers in Buduk Nur and
agreed to fit current limiting devices to each house to control the loads. The cost of
each device was MYR 40 (AUD 13.3) and each household was to be charged.
Unfortunately only 44 units were available at that time. The MHC bought the 44 units
and ordered the rest. The 44 units were fitted to houses on the yellow line and part of
blue line (Figure 5.14).
The MHC informed that several days after the current limiters were fitted, people from
those households started to complain. Several people wanted to know why they could
no longer operate all of their appliances. One respondent stated that after receiving an
explanation from the Committee regarding how the current limiting device works, he
Chapter 5: A case study from the ‘Heart of Borneo’: Ba’kelalan 137
regretted agreeing to fit it and wanted to return to the previous (physically) unlimited
connection. The committee postulated that some households were already removing
the limit devices themselves. However, there was a positive impact of this whole
affair, in that some villagers understood the very real limits to the power supply,
especially those businessmen who changed their practice of stealing power to using
their own generators after this event.
(b) Operation and maintenance
The MHSs in Buduk Bui and Buduk Nur are operated and maintained by villagers.
Each lokasi appointed a committee that is responsible for operation and maintenance
of its MHS. The MHC mentioned committee includes a chairman, secretary, treasurer,
technicians and some additional members. Daily operations of the MHS are carried out
by the technicians, but if a problem occurs they report it to the chairman. If the
chairman thinks that the problem can be handled by the committee, the chairman calls
that committee member who is nominated as the “expert” in Buduk Nur and or
“express” in Buduk Bui, who then proceeds to fix the problem. If the problem needs
assistance from more people to resolve, such as clearing debris from the weir or
clearing the path along the river between the weir and the turbine, the chairman calls
all the village residents to come and help as a form of gotong royong (traditional
voluntary community service). If a problem is related to the turbine or electronics and
cannot be solved, they telephone the supplier for advice or help.
Operation and maintenance training was provided externally by the turbine supplier for
Buduk Nur. One member of the MHC went for one week of training. According to this
person, the training included MHS operation and pipe installation, but no training was
provided on either wiring or load distribution. When the Sarawak Energy Berhard
(SEB) installed the electric switching panel and wiring from the turbine to village,
Chapter 5: A case study from the ‘Heart of Borneo’: Ba’kelalan 138
some committee members were invited to attend on-site training. In Buduk Bui, on-site
training was provided for only committee members. The content included turbine
operation and maintenance and wiring.
The MHC in Buduk Bui mentioned that the committee has not strictly followed the
maintenance schedule stipulated in the manufacturer’s O&M manual. Rather, the usual
approach taken is to do nothing unless a problem occurs and to then to fix the problem.
In Buduk Nur, there is no maintenance guide and the official approach of the
committee is to fix problems if and when they occur using the knowledge obtained in
their training. The O&M personnel also acknowledge that the cost of outsourcing the
maintenance work was very expensive and it becomes another problem for the
villagers as they do not have the money at hand to pay for repairs. According to the
O&M personnel in Buduk Bui and Buduk Nur, the training that was provided to
increase the community’s knowledge of the systems was not enough and they have to
perform their Operation and Management tasks on the basis of trial and error.
In Buduk Nur monthly expenses for O&M were MYR100 (AUD 33.3), incurred as
honoraria given to two committee members (MYR 50/AUD 16.7 each) who have
responsibility to fix any problems. Since there is no scheduled maintenance, there is no
monthly or yearly budget for which funds are set aside. The monthly O&M expenses
were purely determined by monthly honoraria for technicians and any repairs or
component replacements that had occurred during the month.
The MHC informed that in 2010 the circuit board for the Electronic Load Controller
(ELC) for Clinic MHS was replaced twice, but the first one (June 2010) was still under
warranty and so came free of charge. Another replacement in September 2010 cost
MYR 1,668 (AUD 556), which arose from the spare part itself, MYR 1000 (AUD
334); transport, MYR 308 (AUD 103); and allowance, MYR 360 (AUD 120). In 2011
Chapter 5: A case study from the ‘Heart of Borneo’: Ba’kelalan 139
the circuit board was replaced once (in November) and the total cost was MYR 2,000
(AUD 668).
(c) Electricity tariff
In Buduk Bui, the electricity from the MHS was provided to connected households
free of charge in the first few months. The MHC informed that after considering the
long distance volunteer technicians need to go to check or clean the hydro intake;
people started thinking about paying the people taking care of those tasks. People also
started to think about maintenance, so the MHC with agreement from the villagers
imposed a levy of MYR 5 (AUD 1.7) per month per household, with the exception of
the Pastor. The funds received are managed by the Committee treasurer.
In Buduk Nur, a slightly different tariff scheme was developed. When the Public
Clinic in Buduk Nur agreed to share its electricity with the villagers, it handed over the
MHS operation and maintenance responsibility to the village. The MHC mentioned
that the micro hydro in Buduk Nur commenced operation in May 2010, 2 years
delayed from installation due to faulty wiring. During the first months these villagers
also obtained electricity free of cost, until October 2010. That is when a component
(circuit board) needed to be replaced. In order to cover the cost, a once-off levy of
MYR 50 per household, which was to be paid in monthly instalments of MYR 10
(AUD 3.3) over 5 months (May-October), was announced. Just as in Buduk Bui, the
Pastor was exempted from this levy. One respondent of the survey paid more than the
standard levy. She had to pay MYR 20 for each of the five months as she runs a
business operating three freezers.
The determination of electricity charges in both Buduk Bui and Buduk Nur was done
through consensus of MHC and all villagers. MHC and headman in Buduk Nur
considered the monthly electricity bill to be affordable by everyone. Some elderly
Chapter 5: A case study from the ‘Heart of Borneo’: Ba’kelalan 140
people no longer work and rely on remittances from their children for cash. They
spend almost no cash on food, as they grow their own rice and vegetables are relatively
easy to get. These few people face problems with cash flows.
A revenue collection problem was reported in Buduk Nur. In the early months of the
scheme, the bill was regularly taken to each house by the treasurer and paid by
villagers on the spot. As the MHS had intermittent service, the person designated to
collect the user fee was reluctant to take the bill and no longer called on houses
regularly each month, but after an interval of around three months. The villagers were
then given what they felt was a large bill for three months’ supply, which they
considered to be expensive. Another issue was inadequate financial management and
book keeping, which resulted in poor documentation of transactions either from
collector or treasurer. Consequently it became hard to find out what funds the
committee had at any time. The resulting perceptions of lack of transparency on the
part of the committee made villagers reluctant to pay their electricity bills.
5.3.4 Evaluation
(a) MHS performance: available power vs. consumed power
In order to look at the performances of the MHS, an observation at power house in
Buduk Nur was done over the follow-up fieldtrip. It was in March 2012; a shift from
wet to dry season. The observation was made in the morning between 6.00 to 8.00 am,
at midday at 12.15 to 2.15 pm and in the evening over period of 6.00 to 8.00 pm.
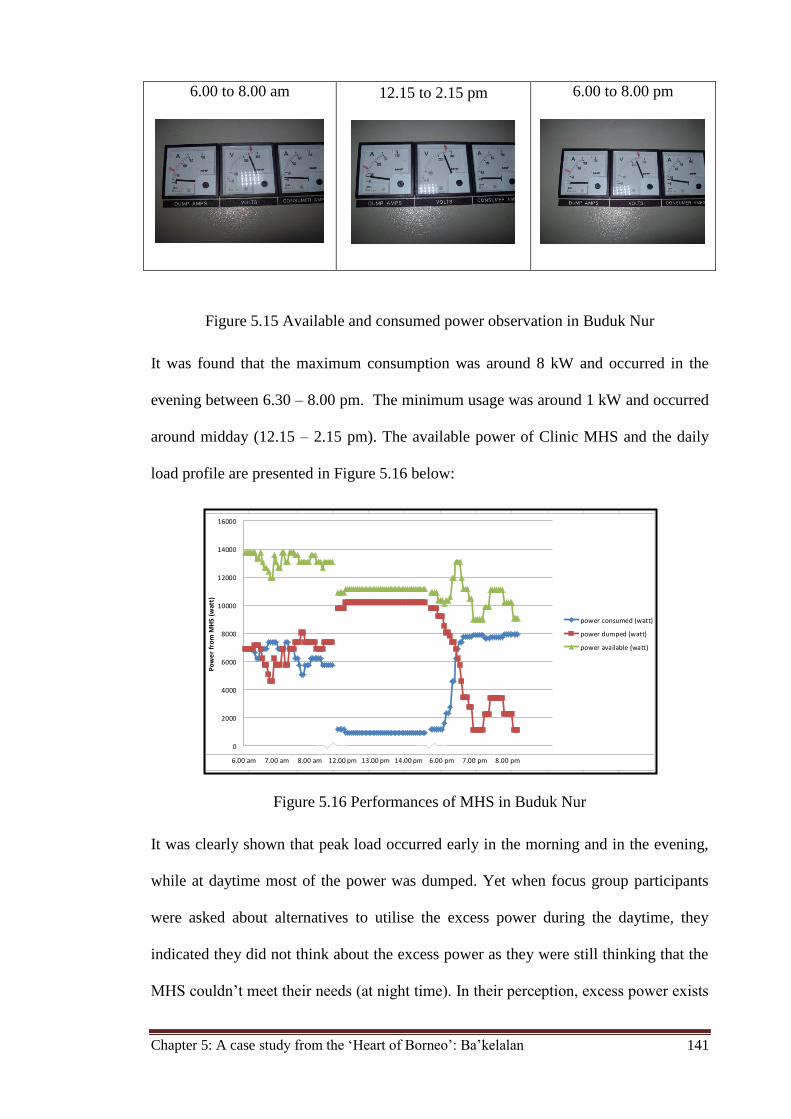
Chapter 5: A case study from the ‘Heart of Borneo’: Ba’kelalan 141
6.00 to 8.00 am
12.15 to 2.15 pm
6.00 to 8.00 pm
Figure 5.15 Available and consumed power observation in Buduk Nur
It was found that the maximum consumption was around 8 kW and occurred in the
evening between 6.30 – 8.00 pm. The minimum usage was around 1 kW and occurred
around midday (12.15 – 2.15 pm). The available power of Clinic MHS and the daily
load profile are presented in Figure 5.16 below:
Figure 5.16 Performances of MHS in Buduk Nur
It was clearly shown that peak load occurred early in the morning and in the evening,
while at daytime most of the power was dumped. Yet when focus group participants
were asked about alternatives to utilise the excess power during the daytime, they
indicated they did not think about the excess power as they were still thinking that the
MHS couldn’t meet their needs (at night time). In their perception, excess power exists
0
1
2
3
4
5
6
7
8
9
6.00 am 7.00 am 8.00 am 12.00 pm 13.00 pm 14.00 pm 6.00 pm 7.00 pm 8.00 pm
Series1
0
2000
4000
6000
8000
10000
12000
14000
16000
Po
we
r fr
om
MH
S (w
att)
power consumed (watt)
power dumped (watt)
power available (watt)
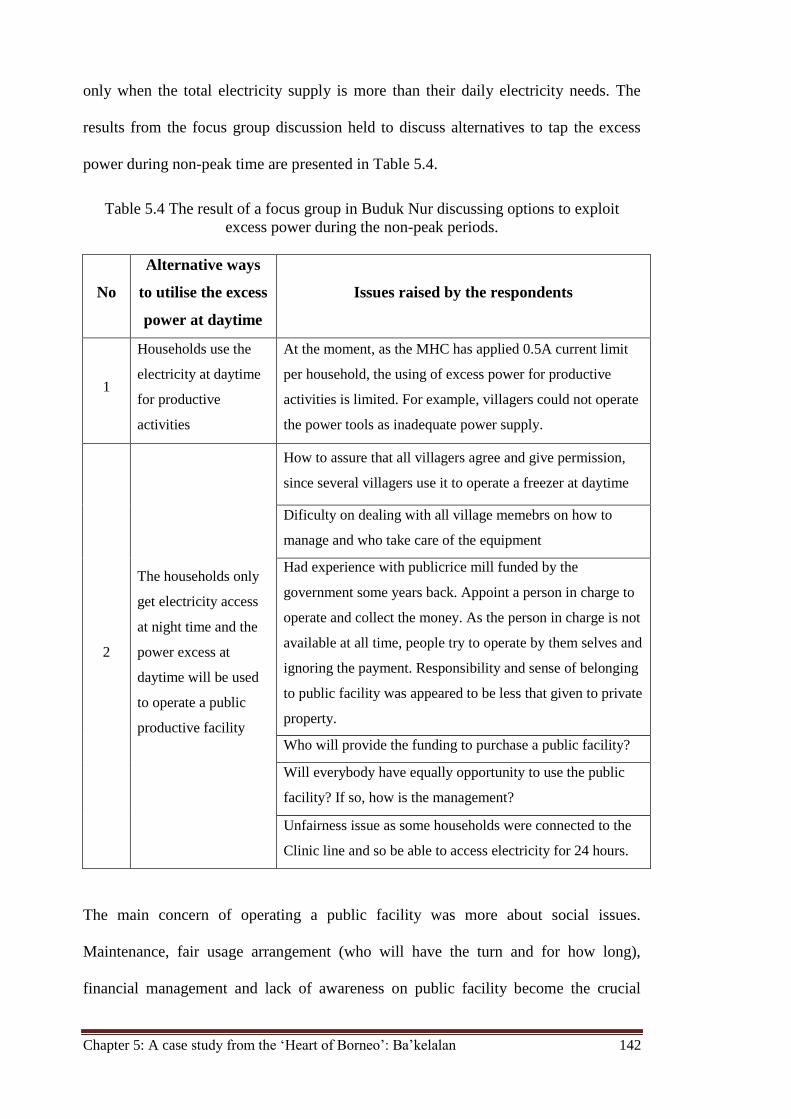
Chapter 5: A case study from the ‘Heart of Borneo’: Ba’kelalan 142
only when the total electricity supply is more than their daily electricity needs. The
results from the focus group discussion held to discuss alternatives to tap the excess
power during non-peak time are presented in Table 5.4.
Table 5.4 The result of a focus group in Buduk Nur discussing options to exploit
excess power during the non-peak periods.
No
Alternative ways
to utilise the excess
power at daytime
Issues raised by the respondents
1
Households use the
electricity at daytime
for productive
activities
At the moment, as the MHC has applied 0.5A current limit
per household, the using of excess power for productive
activities is limited. For example, villagers could not operate
the power tools as inadequate power supply.
2
The households only
get electricity access
at night time and the
power excess at
daytime will be used
to operate a public
productive facility
How to assure that all villagers agree and give permission,
since several villagers use it to operate a freezer at daytime
Dificulty on dealing with all village memebrs on how to
manage and who take care of the equipment
Had experience with publicrice mill funded by the
government some years back. Appoint a person in charge to
operate and collect the money. As the person in charge is not
available at all time, people try to operate by them selves and
ignoring the payment. Responsibility and sense of belonging
to public facility was appeared to be less that given to private
property.
Who will provide the funding to purchase a public facility?
Will everybody have equally opportunity to use the public
facility? If so, how is the management?
Unfairness issue as some households were connected to the
Clinic line and so be able to access electricity for 24 hours.
The main concern of operating a public facility was more about social issues.
Maintenance, fair usage arrangement (who will have the turn and for how long),
financial management and lack of awareness on public facility become the crucial
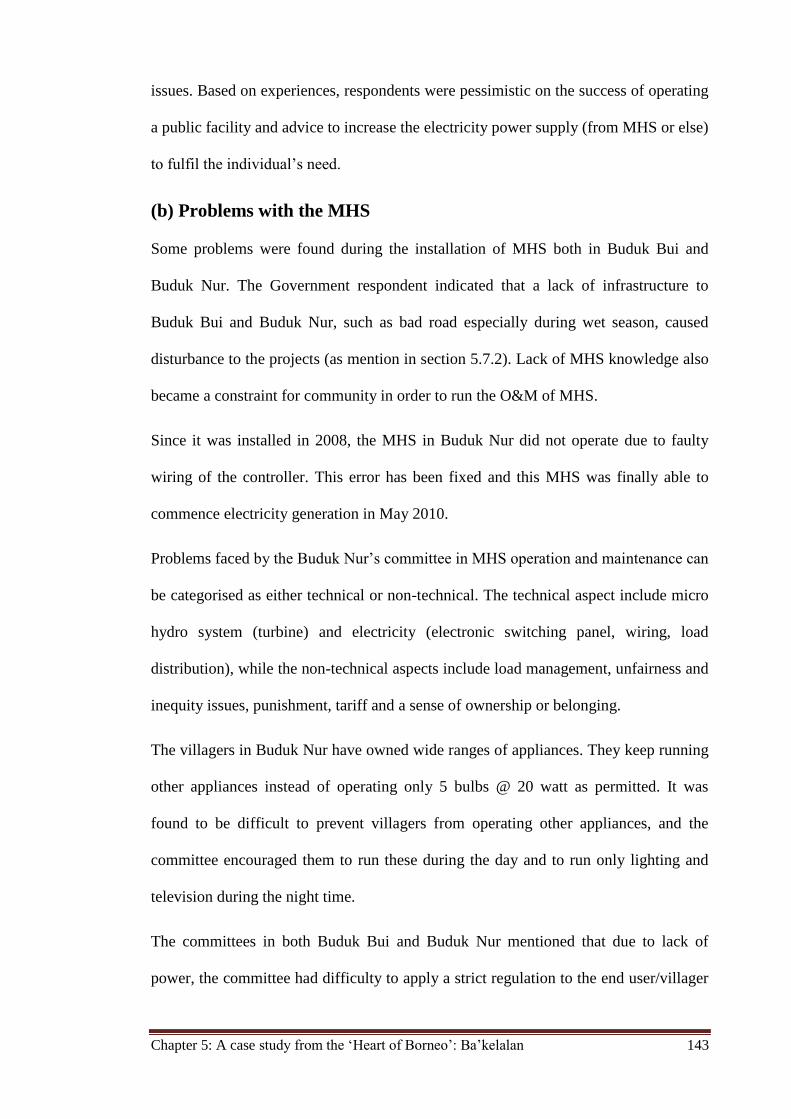
Chapter 5: A case study from the ‘Heart of Borneo’: Ba’kelalan 143
issues. Based on experiences, respondents were pessimistic on the success of operating
a public facility and advice to increase the electricity power supply (from MHS or else)
to fulfil the individual’s need.
(b) Problems with the MHS
Some problems were found during the installation of MHS both in Buduk Bui and
Buduk Nur. The Government respondent indicated that a lack of infrastructure to
Buduk Bui and Buduk Nur, such as bad road especially during wet season, caused
disturbance to the projects (as mention in section 5.7.2). Lack of MHS knowledge also
became a constraint for community in order to run the O&M of MHS.
Since it was installed in 2008, the MHS in Buduk Nur did not operate due to faulty
wiring of the controller. This error has been fixed and this MHS was finally able to
commence electricity generation in May 2010.
Problems faced by the Buduk Nur’s committee in MHS operation and maintenance can
be categorised as either technical or non-technical. The technical aspect include micro
hydro system (turbine) and electricity (electronic switching panel, wiring, load
distribution), while the non-technical aspects include load management, unfairness and
inequity issues, punishment, tariff and a sense of ownership or belonging.
The villagers in Buduk Nur have owned wide ranges of appliances. They keep running
other appliances instead of operating only 5 bulbs @ 20 watt as permitted. It was
found to be difficult to prevent villagers from operating other appliances, and the
committee encouraged them to run these during the day and to run only lighting and
television during the night time.
The committees in both Buduk Bui and Buduk Nur mentioned that due to lack of
power, the committee had difficulty to apply a strict regulation to the end user/villager

Chapter 5: A case study from the ‘Heart of Borneo’: Ba’kelalan 144
in terms of managing the household load, particularly in Buduk Nur. The committees
in both villages could not apply penalties as they did not know which households were
overloading the systems and no current limit devices were applied. The only thing that
the committee could do was to encourage villagers to obey the initial agreement of
using the electricity for lighting and television only.
The technical aspects facing in Buduk Nur are blocked pipes, loose pipes, burned
circuit boards, black outs, and reduced capacity during dry season. Of these problems,
the committee needed to call the supplier to help fix the burnt circuit board. In Buduk
Bui, there are not many major problems in MHS operation and maintenance. The
turbine has worked well since November 2008. The problems that do occur include
blocked pipes, short circuits, black outs and burnt circuit board.
The clinic staff mentioned that the lack of legal agreement between Clinic and the
villager in Buduk Nur caused difficulties in forcing the villagers to run the light and
television only as per the initial agreement. Another issue was a conflict of interest.
The Government respondent mentioned that this conflict of interest had caused the
MHS project in Ba’kelalan to be postponed. The consent of a land owner to use his
land for the government MHS project became a barrier for the Government to set up an
MHS, although the equipment had been delivered to the site and was ready to be
installed. Providentially, this did not appear to be an issue in the cases of the Buduk
Bui MHS and the Clinic MHS in Buduk Nur.
(c) Main benefits of MHS
In term of main benefit of MHS, a majority (71%) of respondents in Buduk Bui but
only 51% in Buduk Nur stated that the main benefit of MHS had been improved
lighting. Respondents indicated that the other main benefit of the MHS was increased
quality of life (easier life), increased information/entertainment, saving money,
Chapter 5: A case study from the ‘Heart of Borneo’: Ba’kelalan 145
increased business opportunities and improved health. It was understandable that the
two last benefits mentioned above were only stated by respondents in Buduk Nur and
that electricity in Buduk Nur is used to support a larger range of productive activities
than in Buduk Bui. A respondent in Buduk Nur also stated that 24 hour electricity from
the MHS, made it easier for the Public Clinic to provide the equipment (nebulizer) for
the emergency treatment for asthma. Figure 5.17 shows the main reported benefits of
the MHSs in Buduk Bui and Buduk Nur.
Figure 5.17 Main benefits of MHS in Buduk Bui and Buduk Nur
(d) End users’ satisfaction
When respondents were asked about their satisfaction of the MHSs, most respondents
in Buduk Bui (90%) confirmed that they were satisfied, 5% stated that they were
dissatisfied and 5% stated that they considered their satisfaction to be fair. The
dissatisfaction related to concerns over the limited availability of power. While in
Buduk Nur the figure was different; more than half respondents (51%) stated that they
were dissatisfied, 8% stated that their satisfaction was fair and 37% stated that they
were satisfied with the current MHS. There was an interesting finding here that
0 20 40 60 80
health
business opportunity
save money
info/entertainment
easy life
lighting
Percentage of respondents (%)
Buduk Nur
Buduk Bui
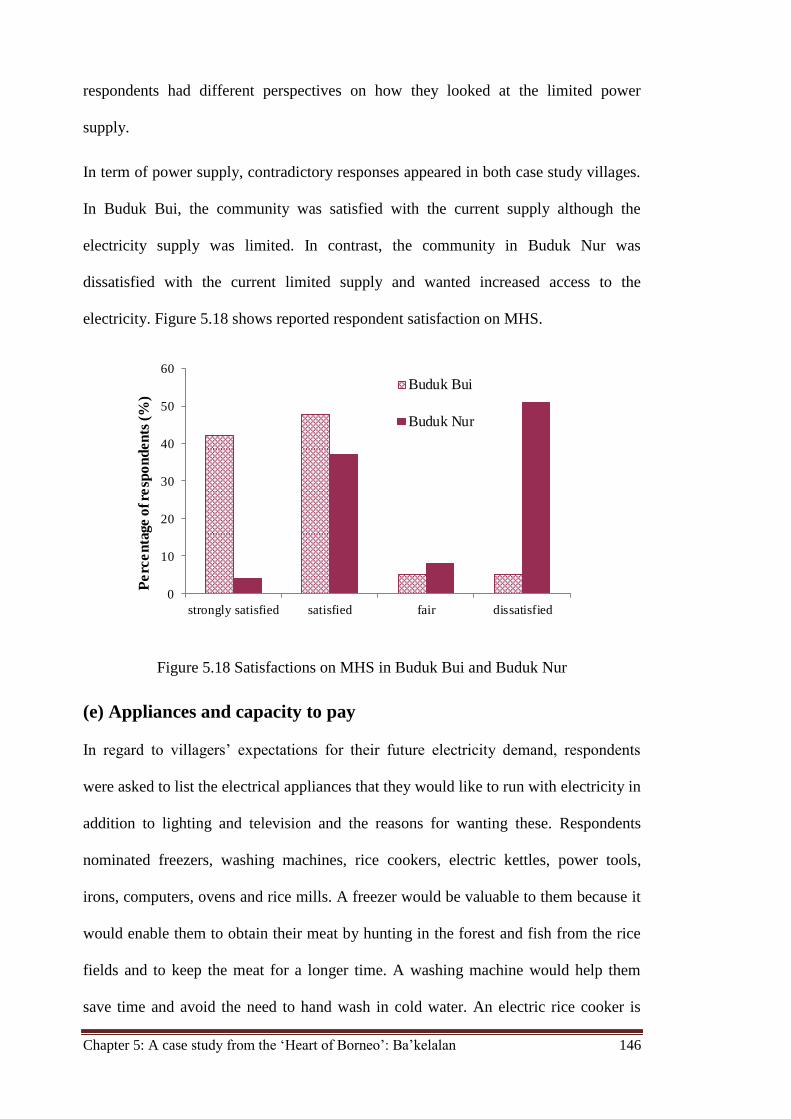
Chapter 5: A case study from the ‘Heart of Borneo’: Ba’kelalan 146
respondents had different perspectives on how they looked at the limited power
supply.
In term of power supply, contradictory responses appeared in both case study villages.
In Buduk Bui, the community was satisfied with the current supply although the
electricity supply was limited. In contrast, the community in Buduk Nur was
dissatisfied with the current limited supply and wanted increased access to the
electricity. Figure 5.18 shows reported respondent satisfaction on MHS.
Figure 5.18 Satisfactions on MHS in Buduk Bui and Buduk Nur
(e) Appliances and capacity to pay
In regard to villagers’ expectations for their future electricity demand, respondents
were asked to list the electrical appliances that they would like to run with electricity in
addition to lighting and television and the reasons for wanting these. Respondents
nominated freezers, washing machines, rice cookers, electric kettles, power tools,
irons, computers, ovens and rice mills. A freezer would be valuable to them because it
would enable them to obtain their meat by hunting in the forest and fish from the rice
fields and to keep the meat for a longer time. A washing machine would help them
save time and avoid the need to hand wash in cold water. An electric rice cooker is
0
10
20
30
40
50
60
strongly satisfied satisfied fair dissatisfied
Pe
rce
nta
ge o
f re
spo
nd
en
ts (
%)
Buduk Bui
Buduk Nur
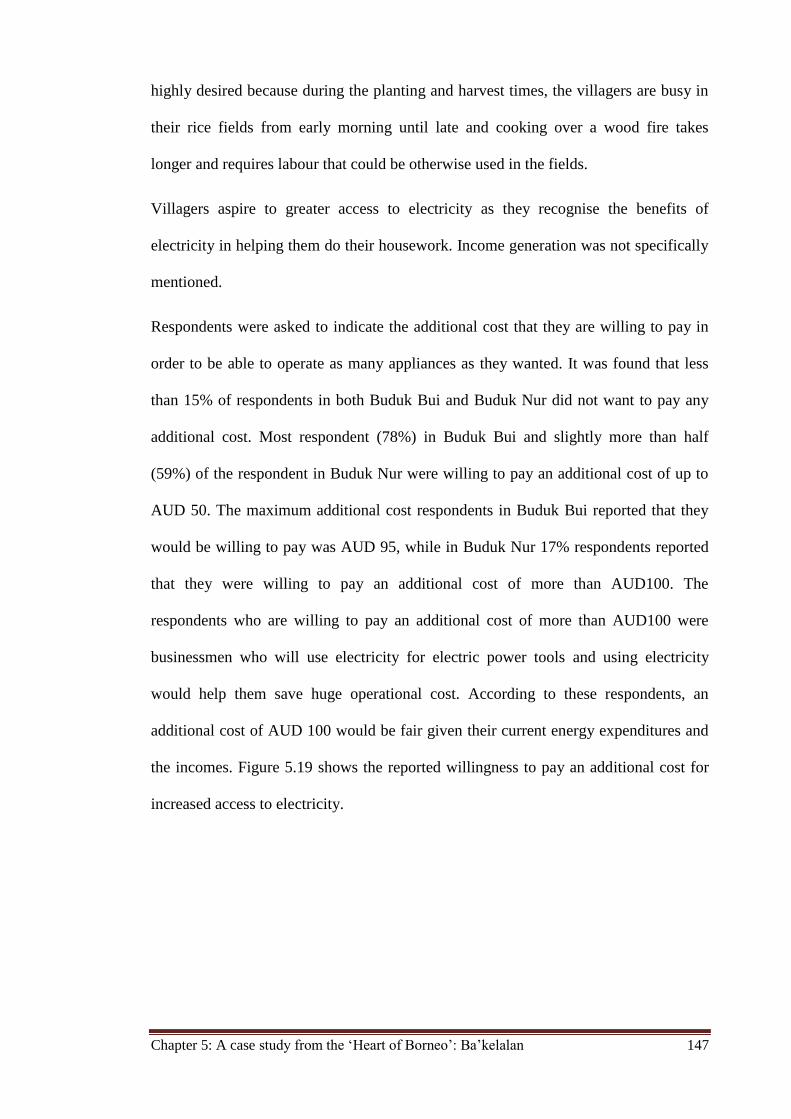
Chapter 5: A case study from the ‘Heart of Borneo’: Ba’kelalan 147
highly desired because during the planting and harvest times, the villagers are busy in
their rice fields from early morning until late and cooking over a wood fire takes
longer and requires labour that could be otherwise used in the fields.
Villagers aspire to greater access to electricity as they recognise the benefits of
electricity in helping them do their housework. Income generation was not specifically
mentioned.
Respondents were asked to indicate the additional cost that they are willing to pay in
order to be able to operate as many appliances as they wanted. It was found that less
than 15% of respondents in both Buduk Bui and Buduk Nur did not want to pay any
additional cost. Most respondent (78%) in Buduk Bui and slightly more than half
(59%) of the respondent in Buduk Nur were willing to pay an additional cost of up to
AUD 50. The maximum additional cost respondents in Buduk Bui reported that they
would be willing to pay was AUD 95, while in Buduk Nur 17% respondents reported
that they were willing to pay an additional cost of more than AUD100. The
respondents who are willing to pay an additional cost of more than AUD100 were
businessmen who will use electricity for electric power tools and using electricity
would help them save huge operational cost. According to these respondents, an
additional cost of AUD 100 would be fair given their current energy expenditures and
the incomes. Figure 5.19 shows the reported willingness to pay an additional cost for
increased access to electricity.
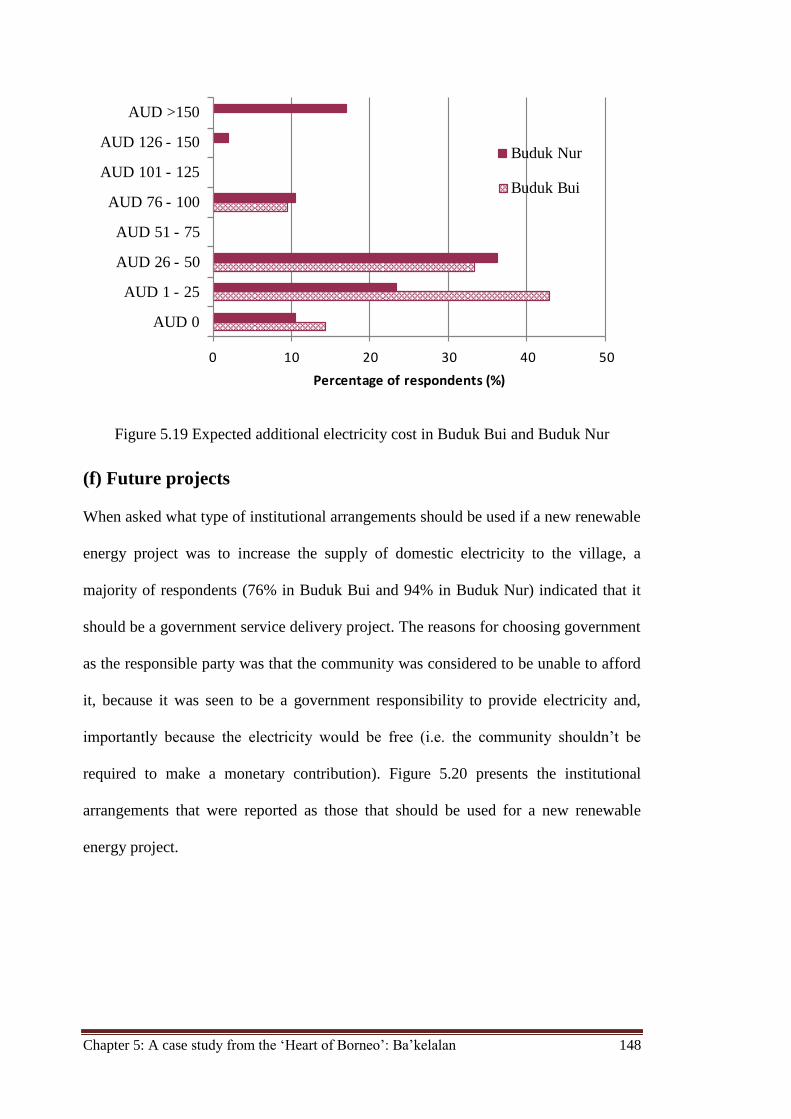
Chapter 5: A case study from the ‘Heart of Borneo’: Ba’kelalan 148
Figure 5.19 Expected additional electricity cost in Buduk Bui and Buduk Nur
(f) Future projects
When asked what type of institutional arrangements should be used if a new renewable
energy project was to increase the supply of domestic electricity to the village, a
majority of respondents (76% in Buduk Bui and 94% in Buduk Nur) indicated that it
should be a government service delivery project. The reasons for choosing government
as the responsible party was that the community was considered to be unable to afford
it, because it was seen to be a government responsibility to provide electricity and,
importantly because the electricity would be free (i.e. the community shouldn’t be
required to make a monetary contribution). Figure 5.20 presents the institutional
arrangements that were reported as those that should be used for a new renewable
energy project.
0 10 20 30 40 50
AUD 0
AUD 1 - 25
AUD 26 - 50
AUD 51 - 75
AUD 76 - 100
AUD 101 - 125
AUD 126 - 150
AUD >150
Percentage of respondents (%)
Buduk Nur
Buduk Bui

Chapter 5: A case study from the ‘Heart of Borneo’: Ba’kelalan 149
Figure 5.20 Institutional arrangment for future project in Buduk Bui and Buduk Nur
Investigating willingness to contribute in the future project, respondents were asked in
an open-ended question to indicate willingness to contribute in the future project and if
so how much. Contrasting figures were found in both case studies. In Buduk Bui, there
was an approximately balanced response in term of willingness to contribute which
was not found in Buduk Nur. Fifty-two percent of respondents in Buduk Bui were
willing to make money contributions while 48% of respondents did not want to
contribute. On the other hand, most respondents in Buduk Nur (69%) stated that the
community should not be required to make a monetary contribution. These responses
were aligned with the financial mechanisms used to build the MHS in the village.
Respondents from the village with the private and community based project saw a need
for a money contribution from the community, while respondents from the village in
which the MHS had been funded by the government considered that the government
should pay all activities in MHS funding scheme, including the civil work (in Long
Langai and Long Rusu projects). Based on those experiences, most respondents stated
that the future project should be fully funded by the government. However, as having a
community based project, some respondents in Buduk Bui thought that making a
0 20 40 60 80 100
Government
Private business
other
Percentage of respondents (%)
Buduk Nur
Buduk Bui
Chapter 5: A case study from the ‘Heart of Borneo’: Ba’kelalan 150
monetary contribution to a public facility project was fair. Figure 5.21 shows the
willingness to contribute in the future project.
Figure 5.21 Expected contribution for future project in Buduk Bui and Buduk Nur
(g) MHS impacts within community
Respondents were asked about the impact of MHS on social cohesion. About a quarter
of the respondent in both Buduk Bui and Buduk Nur mentioned that their interaction
with the neighbours had increased as the electricity from micro-hydro is not very
costly and available all the time. So during the neighbours visit, people do not need to
turn on the generator as before. This cheap electricity also eases villagers/committee to
invite people to have a meeting.
About a quarter of respondents in Buduk Nur mentioned that they had less interaction
with people as increased entertainment in their homes meant that they now preferred to
stay at home. This also had a large impact on the café as less people now visit the
Café. Children also prefer to stay home and watch TV. In Buduk Bui, about 5 %
mentioned that they now have less interaction with people and prefer to stay at home.
The preference to stay at home extended to less people now also going to night prayer
0 20 40 60 80
AUD 0
AUD 1 - 100
AUD 101 -200
AUD 201 - 300
AUD 301 - 400
AUD >400
Percentage of respondents (%)
Buduk Nur
Buduk Bui
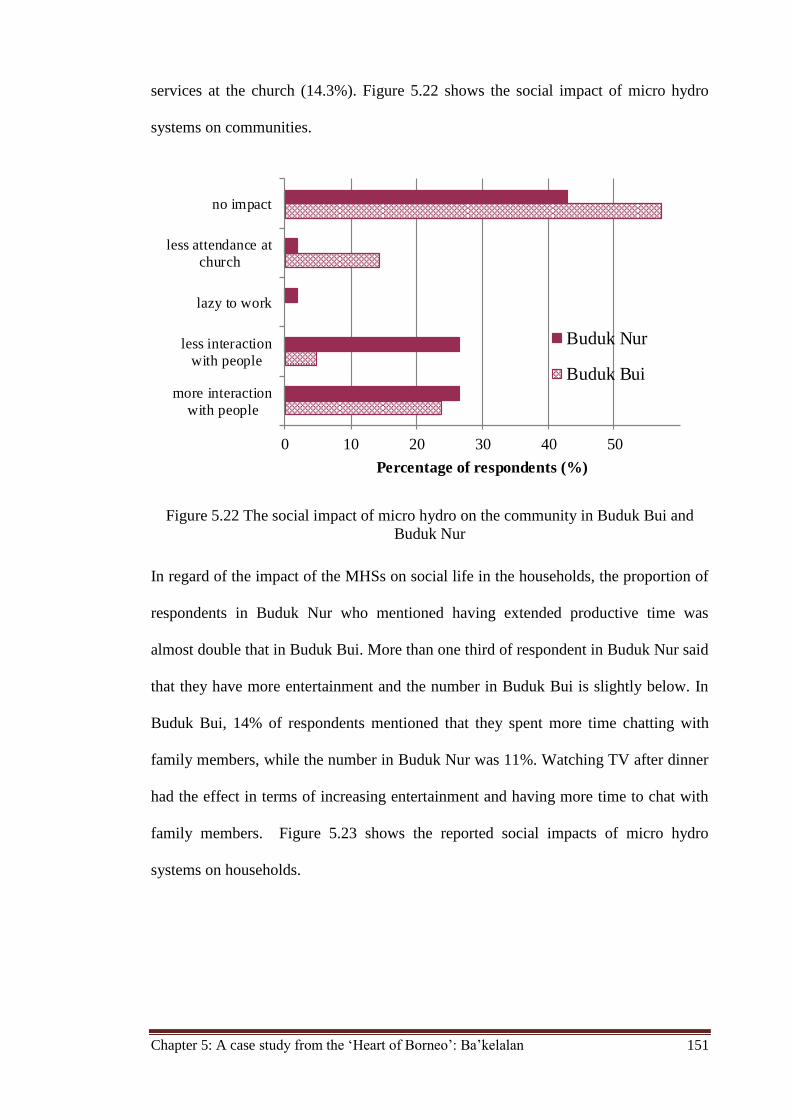
Chapter 5: A case study from the ‘Heart of Borneo’: Ba’kelalan 151
services at the church (14.3%). Figure 5.22 shows the social impact of micro hydro
systems on communities.
Figure 5.22 The social impact of micro hydro on the community in Buduk Bui and
Buduk Nur
In regard of the impact of the MHSs on social life in the households, the proportion of
respondents in Buduk Nur who mentioned having extended productive time was
almost double that in Buduk Bui. More than one third of respondent in Buduk Nur said
that they have more entertainment and the number in Buduk Bui is slightly below. In
Buduk Bui, 14% of respondents mentioned that they spent more time chatting with
family members, while the number in Buduk Nur was 11%. Watching TV after dinner
had the effect in terms of increasing entertainment and having more time to chat with
family members. Figure 5.23 shows the reported social impacts of micro hydro
systems on households.
0 10 20 30 40 50
more interaction
with people
less interaction
with people
lazy to work
less attendance at
church
no impact
Percentage of respondents (%)
Buduk Nur
Buduk Bui
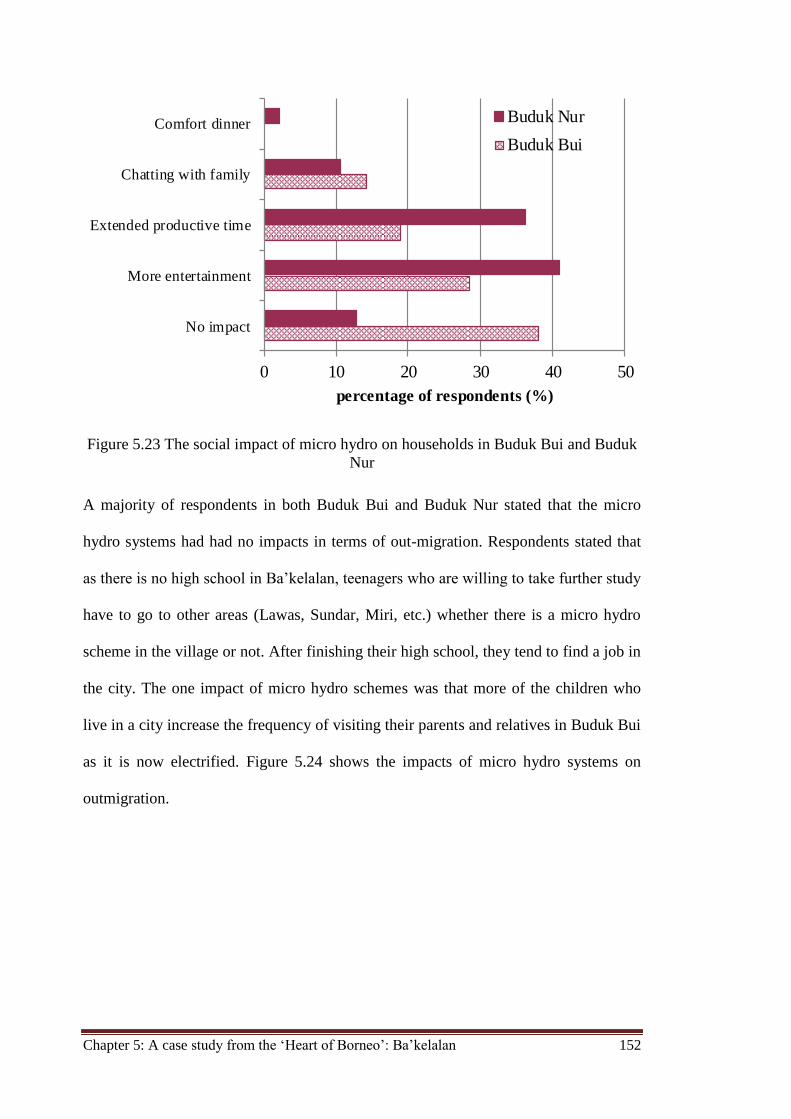
Chapter 5: A case study from the ‘Heart of Borneo’: Ba’kelalan 152
Figure 5.23 The social impact of micro hydro on households in Buduk Bui and Buduk
Nur
A majority of respondents in both Buduk Bui and Buduk Nur stated that the micro
hydro systems had had no impacts in terms of out-migration. Respondents stated that
as there is no high school in Ba’kelalan, teenagers who are willing to take further study
have to go to other areas (Lawas, Sundar, Miri, etc.) whether there is a micro hydro
scheme in the village or not. After finishing their high school, they tend to find a job in
the city. The one impact of micro hydro schemes was that more of the children who
live in a city increase the frequency of visiting their parents and relatives in Buduk Bui
as it is now electrified. Figure 5.24 shows the impacts of micro hydro systems on
outmigration.
0 10 20 30 40 50
No impact
More entertainment
Extended productive time
Chatting with family
Comfort dinner
percentage of respondents (%)
Buduk Nur
Buduk Bui
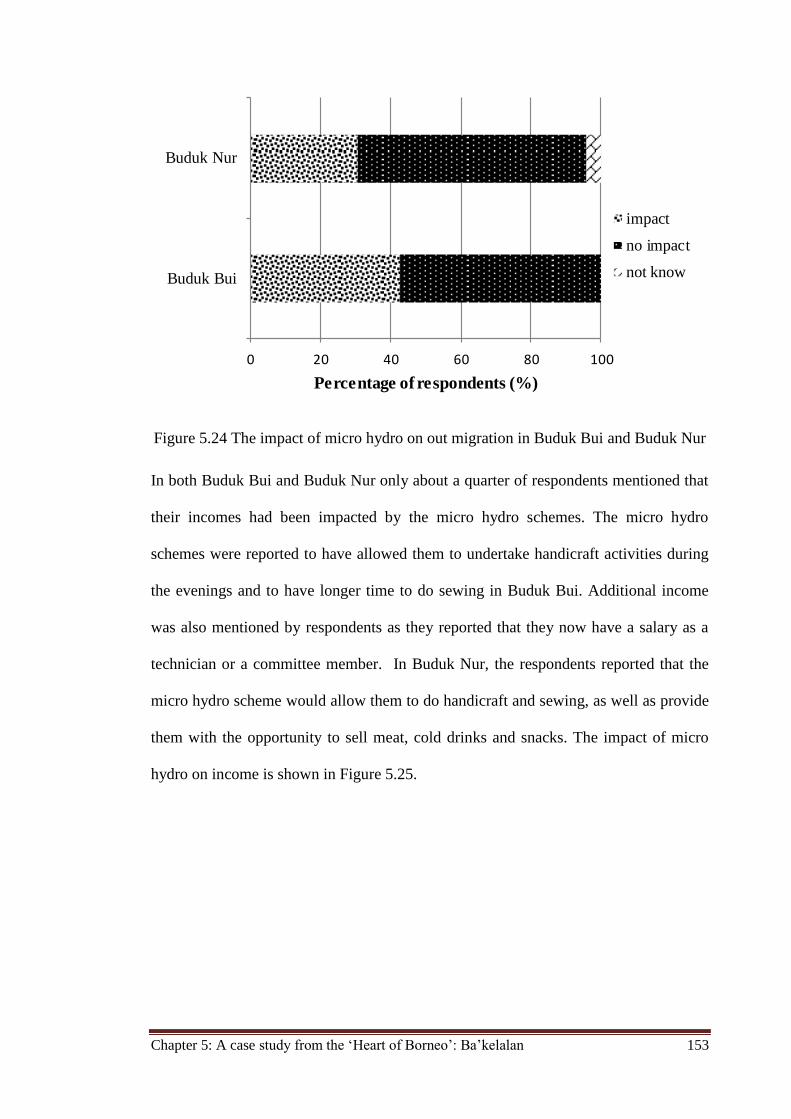
Chapter 5: A case study from the ‘Heart of Borneo’: Ba’kelalan 153
Figure 5.24 The impact of micro hydro on out migration in Buduk Bui and Buduk Nur
In both Buduk Bui and Buduk Nur only about a quarter of respondents mentioned that
their incomes had been impacted by the micro hydro schemes. The micro hydro
schemes were reported to have allowed them to undertake handicraft activities during
the evenings and to have longer time to do sewing in Buduk Bui. Additional income
was also mentioned by respondents as they reported that they now have a salary as a
technician or a committee member. In Buduk Nur, the respondents reported that the
micro hydro scheme would allow them to do handicraft and sewing, as well as provide
them with the opportunity to sell meat, cold drinks and snacks. The impact of micro
hydro on income is shown in Figure 5.25.
0 20 40 60 80 100
Buduk Bui
Buduk Nur
Percentage of respondents (%)
impact
no impact
not know
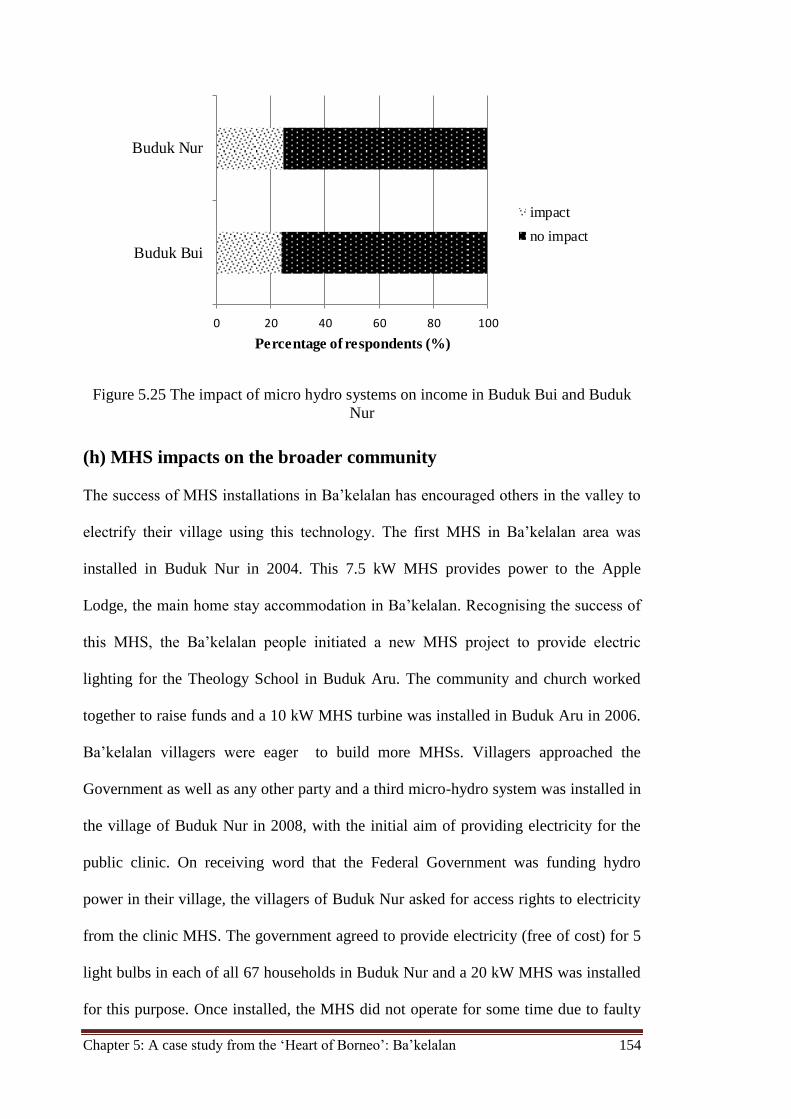
Chapter 5: A case study from the ‘Heart of Borneo’: Ba’kelalan 154
Figure 5.25 The impact of micro hydro systems on income in Buduk Bui and Buduk
Nur
(h) MHS impacts on the broader community
The success of MHS installations in Ba’kelalan has encouraged others in the valley to
electrify their village using this technology. The first MHS in Ba’kelalan area was
installed in Buduk Nur in 2004. This 7.5 kW MHS provides power to the Apple
Lodge, the main home stay accommodation in Ba’kelalan. Recognising the success of
this MHS, the Ba’kelalan people initiated a new MHS project to provide electric
lighting for the Theology School in Buduk Aru. The community and church worked
together to raise funds and a 10 kW MHS turbine was installed in Buduk Aru in 2006.
Ba’kelalan villagers were eager to build more MHSs. Villagers approached the
Government as well as any other party and a third micro-hydro system was installed in
the village of Buduk Nur in 2008, with the initial aim of providing electricity for the
public clinic. On receiving word that the Federal Government was funding hydro
power in their village, the villagers of Buduk Nur asked for access rights to electricity
from the clinic MHS. The government agreed to provide electricity (free of cost) for 5
light bulbs in each of all 67 households in Buduk Nur and a 20 kW MHS was installed
for this purpose. Once installed, the MHS did not operate for some time due to faulty
0 20 40 60 80 100
Buduk Bui
Buduk Nur
Percentage of respondents (%)
impact
no impact
Chapter 5: A case study from the ‘Heart of Borneo’: Ba’kelalan 155
wiring of the controller. This error was fixed and this MHS was finally able to
commence electricity generation in May 2010. A fourth MHS was set up with Rotary
Club assistance in the village of Buduk Bui. The community also contributed
financially at the request of the donor funding. Villages that do not have an MHS
continue to asking for grants and in 2011 the Government constructed MHSs for Long
Langai and Long Rusu.
Several remote clusters that do not have access to available rivers were still ‘in the
dark’. These clusters looked at solar as an alternative. Solar panels are quite a familiar
site in Ba’kelalan as many solar panels have been used to generate power to public
facilities, such as public telephone unit, library, public internet kiosk, and for
commercial uses (Mas Wing Airways for ticketing) while a solar water heater is used
to provide hot water at the Apple Lodge.
The non-electrified clusters in Ba’kelalan proposed a solar panel grant to the
Government but unfortunately have not received a response. Since the late 1990s, the
Ministry of Rural Development has undertaken the provision of photovoltaic systems
for rural electrification. Villages in remotes areas in the Lawas District, such as
Ba’kelalan, Long Luping and Long Semado, however, did not receive any funding.
Since the Ba’kelalan people have daily contact with Krayan, North Kalimantan in
trading purposes, experience in one area will spread quickly to other side, including the
story of MHS with any issues related. During the preliminary fieldtrip, the MHS in
Buduk Nur was not working while Romayo I MHS in Indonesia was working. Over
the survey period, the opposite situation occurred: the Romayo I MHS was not
working while MHS in Buduk Nur was working. This impacted on the fuel trade
between Ba’kelalan and the Indonesian villages. As the fuel demand increased in
Krayan, the Ba’kelalan traders set a higher price (almost 250%).
Chapter 5: A case study from the ‘Heart of Borneo’: Ba’kelalan 156
5.4 Summary
The MHS in Buduk Bui and Buduk Nur differ significantly in terms of planning,
installation and operation and maintenance. The numbers and roles of stakeholders in
the two MHS projects, including community involvement, also vary in both systems.
This differences in implementation depended on the funding arrangements.
The inability of the MHS, particularly in Buduk Nur, to supply constant power,
especially during the dry season, is a consequence of the use of an unreliable method
to determine the project capacity in the design stage. Both MHS case studies were not
designed on the basis of long-term river flow rate data, but on spot readings during a
single dry season. As these spot readings did not accurately capture the flow patterns
during the dry season, there were inadequacies in design which mean that the system in
Buduk Nur was unable to generate during low river flow periods.
Neither of the two MHSs was designed on the basis of robust assessments of either
current or projected electricity demand or fluctuations in demand as they were
designed as instantaneous systems. Consequently, power shortages occurred during the
peak periods in the evenings, but a lot of excess power is untapped during the day.
The load factors for both systems in Buduk Nur and Buduk Bui was far below the
designer’s expectations due to low consumption of micro hydro power during the non-
peak hours. One possible way of improving load factor would be to use the micro
hydro power during the day for income generating activities, such as rice-drying or
rice-milling. Based on experiences, respondents were pessimistic on the success of
operating a public facility based on their concerns relating to social issues in operating
a public facility. Load promotion in Buduk Bui has been more successful, but the
challenge for the community is to find uses that add to their quality of life.
Chapter 5: A case study from the ‘Heart of Borneo’: Ba’kelalan 157
Problems of overloading at peak times, possibly from use of unauthorised appliances,
need to be addressed. Besides the technical aspects, this will involve looking at how to
distribute power equally to the community due to limited supply, social issues in this
load management such as “fair price” and equity in electricity access. These are all
important issues that will need to be considered.
Villagers in Buduk Nur waited for up to 2 years for systems to be delivered and the
O&M of the MHS in both Buduk Bui and Buduk Nur is a “trial and error” process.
This may indicate that capacity building was wanting in the implementation of these
MHSs and that capacity building should be embedded in the planning of new projects.
Although the responsibility of O&M lies with the community, most rural communities
lack sufficient expertise in terms of both project management and technical skills.
The MHS benefits for villagers have been increased and improved lighting, and more
access to television and radio that has helped them to increase educational or health-
related information. The MHSs have also benefited women in reducing their labour
and increasing their leisure time and their ability to interact with other members of the
community or other household members or to get involved in income generating
activities. A further benefit has been a major reduction in energy expenditure through
use of an MHS, which has meant that the members of these communities now have
greater disposable incomes.
One overlooked factor is how to collect from users and to manage tariffs. Find an
effective means of collecting funds for maintenance can help to ensure that micro-
hydro systems are kept operating with a minimum of down time and that community
(customer) faith in these systems is maintained.

Chapter 5: A case study from the ‘Heart of Borneo’: Ba’kelalan 158
Chapter 6: A case study from the ‘Heart of Borneo’: Krayan 159
Chapter 6
A Case Study from the Heart of Borneo: Krayan
Overview
This Chapter presents the results of the survey of the case study MHSs in Krayan:
Romayo I and Tang Paye. The process followed for undertaking the surveys was the
same as for Ba’kelalan as described in Chapter 5. Both qualitative and quantitative
data were collected using various methods, including questionnaires, energy audits,
semi-structure interviews and site observation.
The chapter begins by providing socio-economic information on the socio-economic
structure and culture of the area, as well as by presenting a picture of the energy
situation for the villagers in this area. The second part then evaluates the Romayo I and
Tang Paye MHSs.
6.1 Introduction
The Krayan sub-district consists of 65 villages clustered in 26 lokasi. The Tang Paye
lokasi and the Long Bawan lokasi are located 20 km apart (Figure 4.7) and are
connected by an unsealed road. The two lokasi are surrounded by the Kayan
Mentarang National Park, which isolates the Krayan from other parts of North
Kalimantan and has ruled out the option of providing those living in these areas with
access to electricity by extending the national grid.
Romayo I was installed with initial aim of electrifying the Long Bawan lokasi, where
the sub-district office is located. The only suitable river, the Romayo River, is located
14 km from Long Bawan and is under the jurisdiction of Pa Betung lokasi.
Furthermore, the distribution line supplying the electricity from the powerhouse to
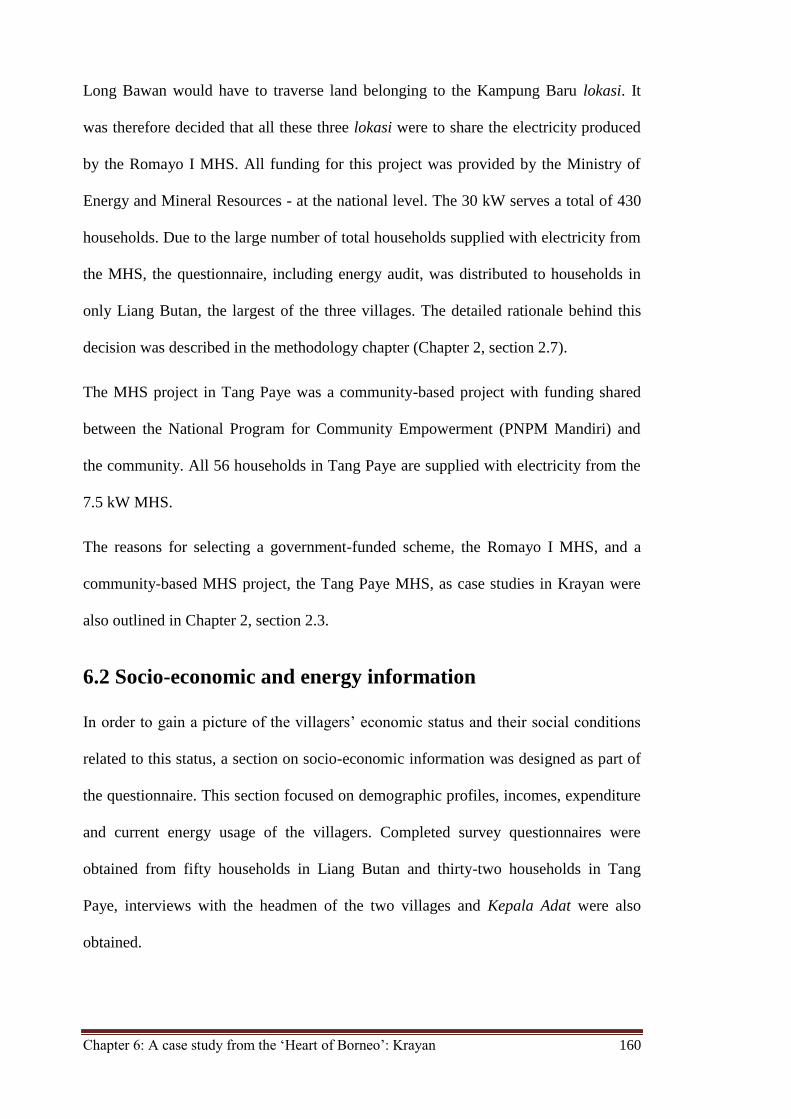
Chapter 6: A case study from the ‘Heart of Borneo’: Krayan 160
Long Bawan would have to traverse land belonging to the Kampung Baru lokasi. It
was therefore decided that all these three lokasi were to share the electricity produced
by the Romayo I MHS. All funding for this project was provided by the Ministry of
Energy and Mineral Resources - at the national level. The 30 kW serves a total of 430
households. Due to the large number of total households supplied with electricity from
the MHS, the questionnaire, including energy audit, was distributed to households in
only Liang Butan, the largest of the three villages. The detailed rationale behind this
decision was described in the methodology chapter (Chapter 2, section 2.7).
The MHS project in Tang Paye was a community-based project with funding shared
between the National Program for Community Empowerment (PNPM Mandiri) and
the community. All 56 households in Tang Paye are supplied with electricity from the
7.5 kW MHS.
The reasons for selecting a government-funded scheme, the Romayo I MHS, and a
community-based MHS project, the Tang Paye MHS, as case studies in Krayan were
also outlined in Chapter 2, section 2.3.
6.2 Socio-economic and energy information
In order to gain a picture of the villagers’ economic status and their social conditions
related to this status, a section on socio-economic information was designed as part of
the questionnaire. This section focused on demographic profiles, incomes, expenditure
and current energy usage of the villagers. Completed survey questionnaires were
obtained from fifty households in Liang Butan and thirty-two households in Tang
Paye, interviews with the headmen of the two villages and Kepala Adat were also
obtained.
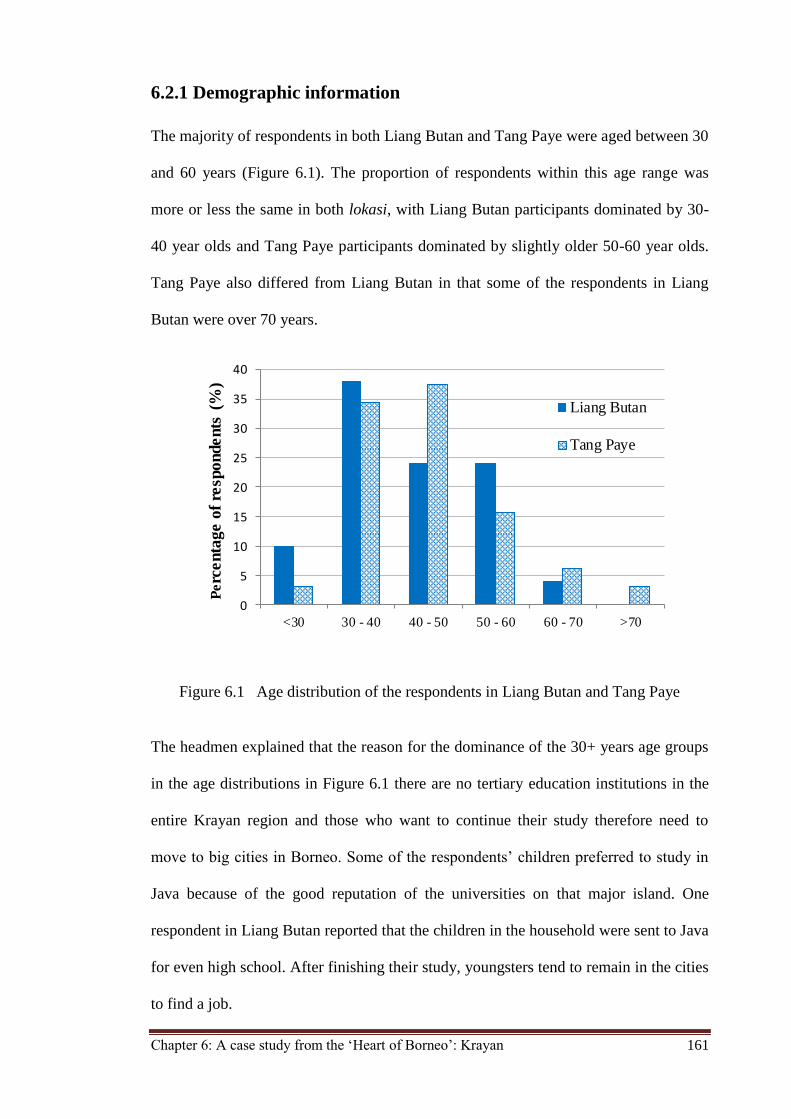
Chapter 6: A case study from the ‘Heart of Borneo’: Krayan 161
6.2.1 Demographic information
The majority of respondents in both Liang Butan and Tang Paye were aged between 30
and 60 years (Figure 6.1). The proportion of respondents within this age range was
more or less the same in both lokasi, with Liang Butan participants dominated by 30-
40 year olds and Tang Paye participants dominated by slightly older 50-60 year olds.
Tang Paye also differed from Liang Butan in that some of the respondents in Liang
Butan were over 70 years.
Figure 6.1 Age distribution of the respondents in Liang Butan and Tang Paye
The headmen explained that the reason for the dominance of the 30+ years age groups
in the age distributions in Figure 6.1 there are no tertiary education institutions in the
entire Krayan region and those who want to continue their study therefore need to
move to big cities in Borneo. Some of the respondents’ children preferred to study in
Java because of the good reputation of the universities on that major island. One
respondent in Liang Butan reported that the children in the household were sent to Java
for even high school. After finishing their study, youngsters tend to remain in the cities
to find a job.
0
5
10
15
20
25
30
35
40
<30 30 - 40 40 - 50 50 - 60 60 - 70 >70
Perc
en
tag
e o
f re
spon
den
ts (
%)
Liang Butan
Tang Paye
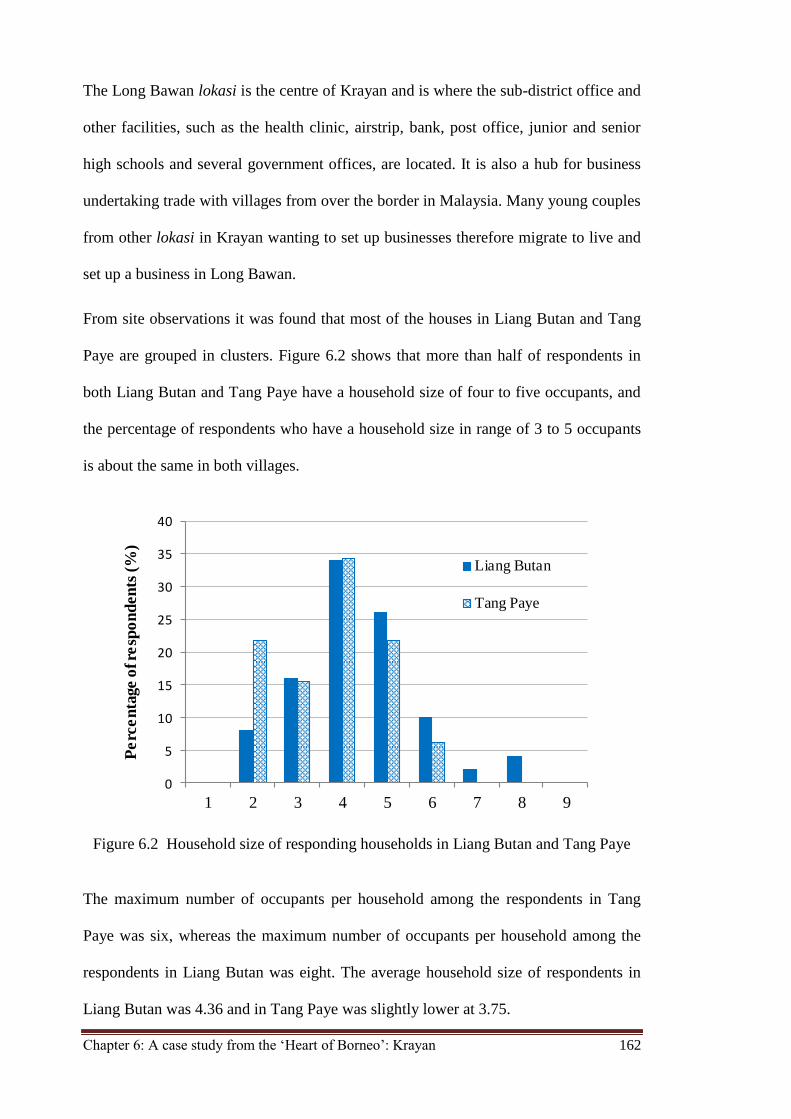
Chapter 6: A case study from the ‘Heart of Borneo’: Krayan 162
The Long Bawan lokasi is the centre of Krayan and is where the sub-district office and
other facilities, such as the health clinic, airstrip, bank, post office, junior and senior
high schools and several government offices, are located. It is also a hub for business
undertaking trade with villages from over the border in Malaysia. Many young couples
from other lokasi in Krayan wanting to set up businesses therefore migrate to live and
set up a business in Long Bawan.
From site observations it was found that most of the houses in Liang Butan and Tang
Paye are grouped in clusters. Figure 6.2 shows that more than half of respondents in
both Liang Butan and Tang Paye have a household size of four to five occupants, and
the percentage of respondents who have a household size in range of 3 to 5 occupants
is about the same in both villages.
Figure 6.2 Household size of responding households in Liang Butan and Tang Paye
The maximum number of occupants per household among the respondents in Tang
Paye was six, whereas the maximum number of occupants per household among the
respondents in Liang Butan was eight. The average household size of respondents in
Liang Butan was 4.36 and in Tang Paye was slightly lower at 3.75.
0
5
10
15
20
25
30
35
40
1 2 3 4 5 6 7 8 9
Pe
rce
nta
ge o
f re
spo
nd
en
ts (
%)
Liang Butan
Tang Paye
Chapter 6: A case study from the ‘Heart of Borneo’: Krayan 163
The public high schools (both junior and senior high schools) are located in Long
Bawan village, which is within walking distance from Liang Butan, but not from Tang
Paye. Beside the public high school, there is also a private senior high school, which is
located in Liang Butan, and a Theology School in Kampung Baru lokasi, which is
located approximately 1 km from Liang Butan. These schools have no boarding
dormitories and the students from other villages need to either travel back and forth or
rent a room in Long Bawan. The Kepala Adat mentioned that some villages have their
own “village house” in one of the villages in Long Bawan lokasi that is used to provide
rooms for let for those pupils from the village.
The highest level of education for 60-65% was high school and about 15% had
completed a diploma or a bachelor degree. As shown in Figure 6.3, there are no
significant differences between the Liang Butan and Tang Paye results.
Figure 6.3 Education level of respondents in Liang Butan and Tang Paye
6.2.2 Income survey
Income for a typical villager in Krayan is not based on a regular salary and varies over
time. This situation is similar to that of the villagers in Ba’kelalan (see detail in section
0
10
20
30
40
50
60
70
80
None Primary
School
High School Diploma Bachelor
Pe
rce
nta
ge o
f re
spo
nd
en
ts (
%)
Liang Butan
Tang Paye
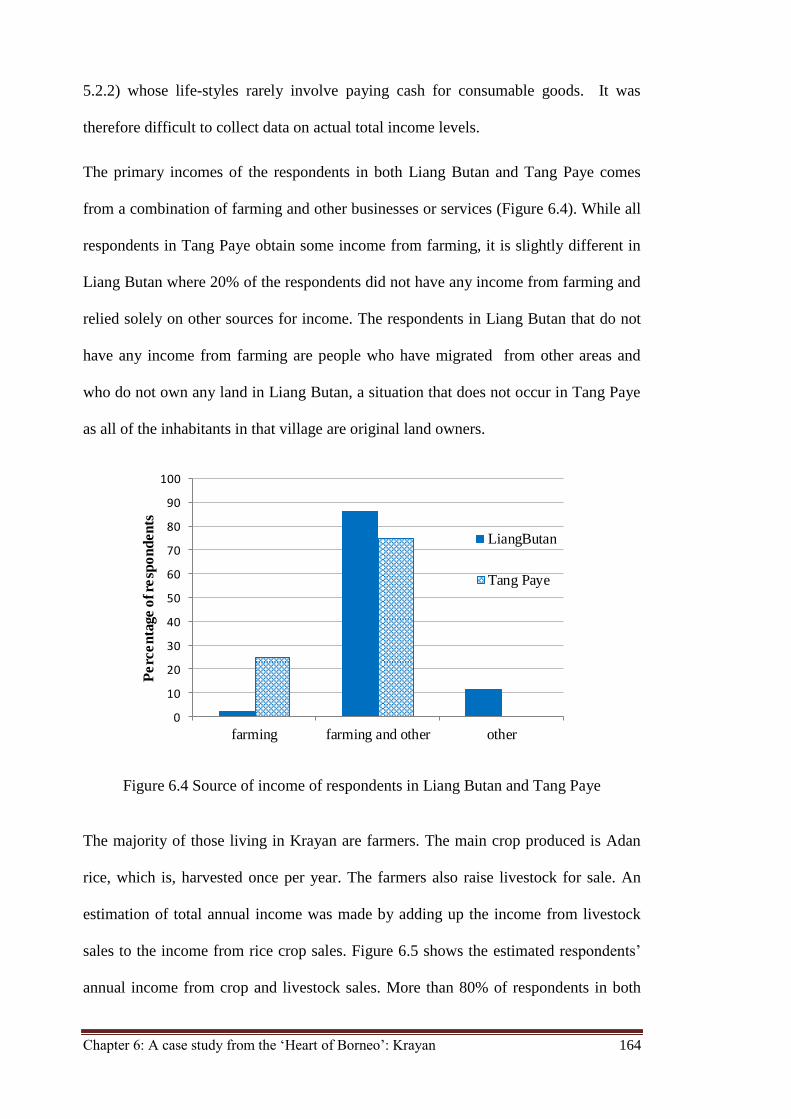
Chapter 6: A case study from the ‘Heart of Borneo’: Krayan 164
5.2.2) whose life-styles rarely involve paying cash for consumable goods. It was
therefore difficult to collect data on actual total income levels.
The primary incomes of the respondents in both Liang Butan and Tang Paye comes
from a combination of farming and other businesses or services (Figure 6.4). While all
respondents in Tang Paye obtain some income from farming, it is slightly different in
Liang Butan where 20% of the respondents did not have any income from farming and
relied solely on other sources for income. The respondents in Liang Butan that do not
have any income from farming are people who have migrated from other areas and
who do not own any land in Liang Butan, a situation that does not occur in Tang Paye
as all of the inhabitants in that village are original land owners.
Figure 6.4 Source of income of respondents in Liang Butan and Tang Paye
The majority of those living in Krayan are farmers. The main crop produced is Adan
rice, which is, harvested once per year. The farmers also raise livestock for sale. An
estimation of total annual income was made by adding up the income from livestock
sales to the income from rice crop sales. Figure 6.5 shows the estimated respondents’
annual income from crop and livestock sales. More than 80% of respondents in both
0
10
20
30
40
50
60
70
80
90
100
farming farming and other other
Pe
rce
nta
ge o
f re
spo
nd
en
ts
LiangButan
Tang Paye
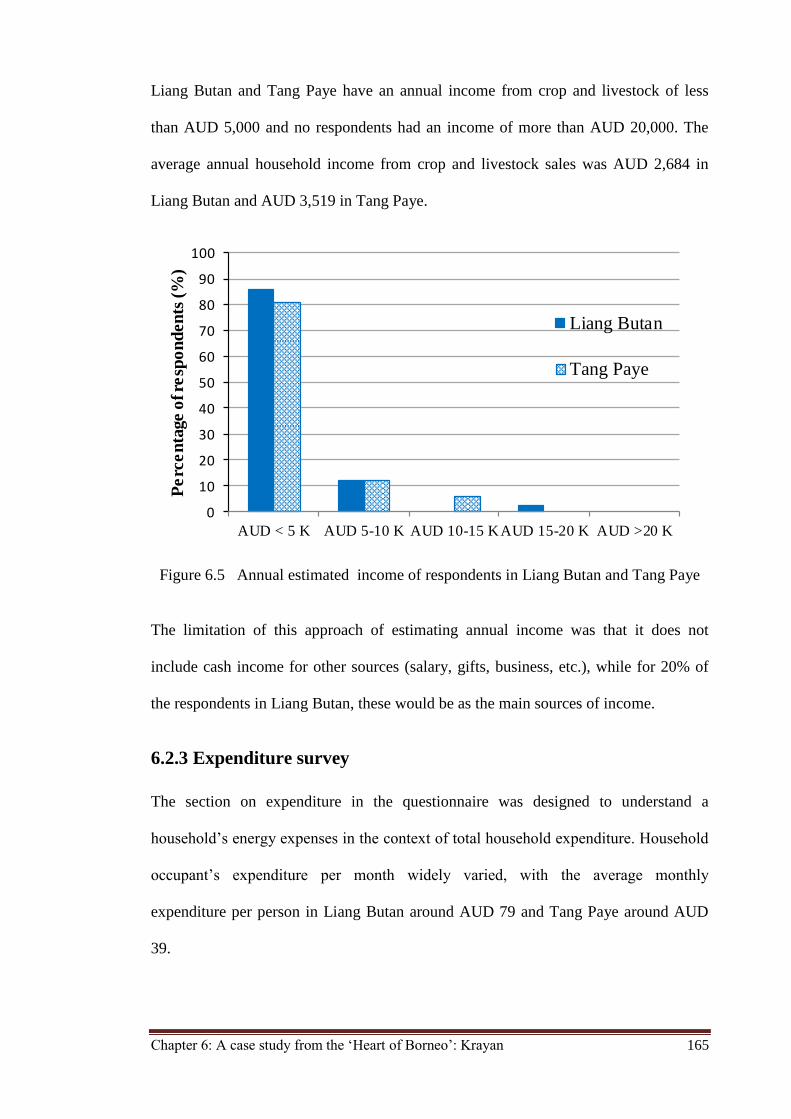
Chapter 6: A case study from the ‘Heart of Borneo’: Krayan 165
Liang Butan and Tang Paye have an annual income from crop and livestock of less
than AUD 5,000 and no respondents had an income of more than AUD 20,000. The
average annual household income from crop and livestock sales was AUD 2,684 in
Liang Butan and AUD 3,519 in Tang Paye.
Figure 6.5 Annual estimated income of respondents in Liang Butan and Tang Paye
The limitation of this approach of estimating annual income was that it does not
include cash income for other sources (salary, gifts, business, etc.), while for 20% of
the respondents in Liang Butan, these would be as the main sources of income.
6.2.3 Expenditure survey
The section on expenditure in the questionnaire was designed to understand a
household’s energy expenses in the context of total household expenditure. Household
occupant’s expenditure per month widely varied, with the average monthly
expenditure per person in Liang Butan around AUD 79 and Tang Paye around AUD
39.
0
10
20
30
40
50
60
70
80
90
100
AUD < 5 K AUD 5-10 K AUD 10-15 KAUD 15-20 K AUD >20 K
Pe
rce
nta
ge o
f re
spo
nd
en
ts (
%)
Liang Butan
Tang Paye
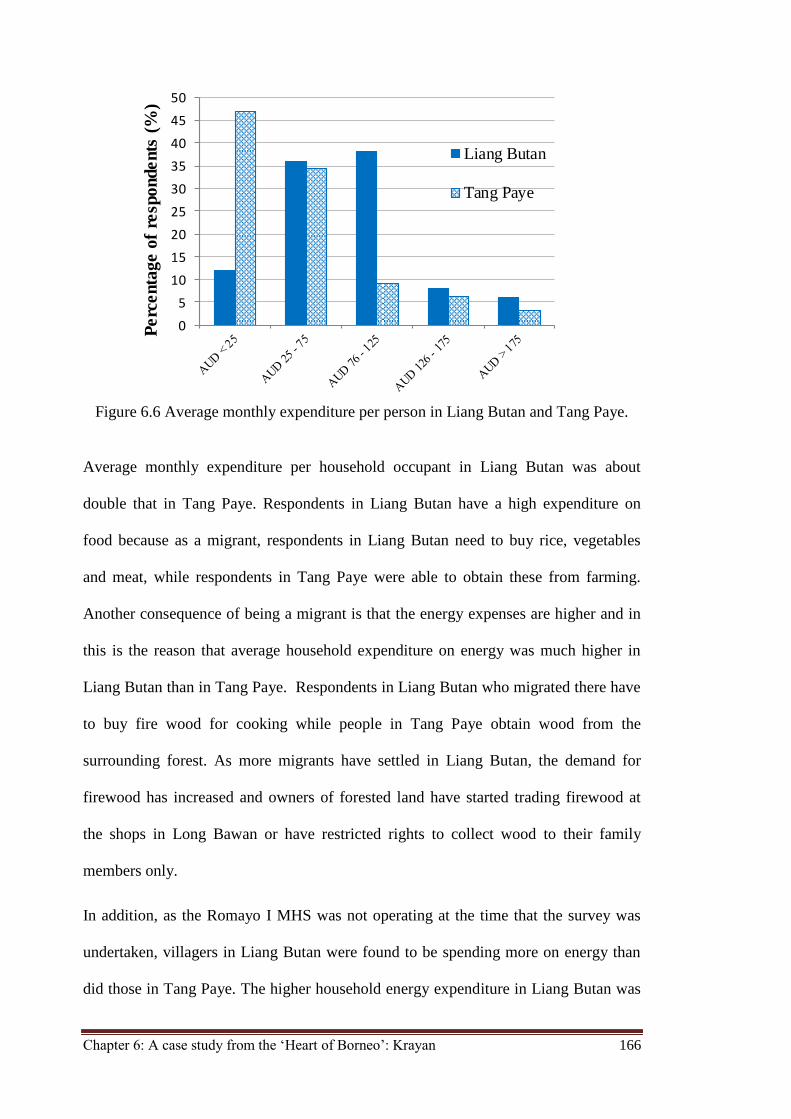
Chapter 6: A case study from the ‘Heart of Borneo’: Krayan 166
Figure 6.6 Average monthly expenditure per person in Liang Butan and Tang Paye.
Average monthly expenditure per household occupant in Liang Butan was about
double that in Tang Paye. Respondents in Liang Butan have a high expenditure on
food because as a migrant, respondents in Liang Butan need to buy rice, vegetables
and meat, while respondents in Tang Paye were able to obtain these from farming.
Another consequence of being a migrant is that the energy expenses are higher and in
this is the reason that average household expenditure on energy was much higher in
Liang Butan than in Tang Paye. Respondents in Liang Butan who migrated there have
to buy fire wood for cooking while people in Tang Paye obtain wood from the
surrounding forest. As more migrants have settled in Liang Butan, the demand for
firewood has increased and owners of forested land have started trading firewood at
the shops in Long Bawan or have restricted rights to collect wood to their family
members only.
In addition, as the Romayo I MHS was not operating at the time that the survey was
undertaken, villagers in Liang Butan were found to be spending more on energy than
did those in Tang Paye. The higher household energy expenditure in Liang Butan was
0
5
10
15
20
25
30
35
40
45
50
Perc
enta
ge o
f re
spondents
(%
)Liang Butan
Tang Paye
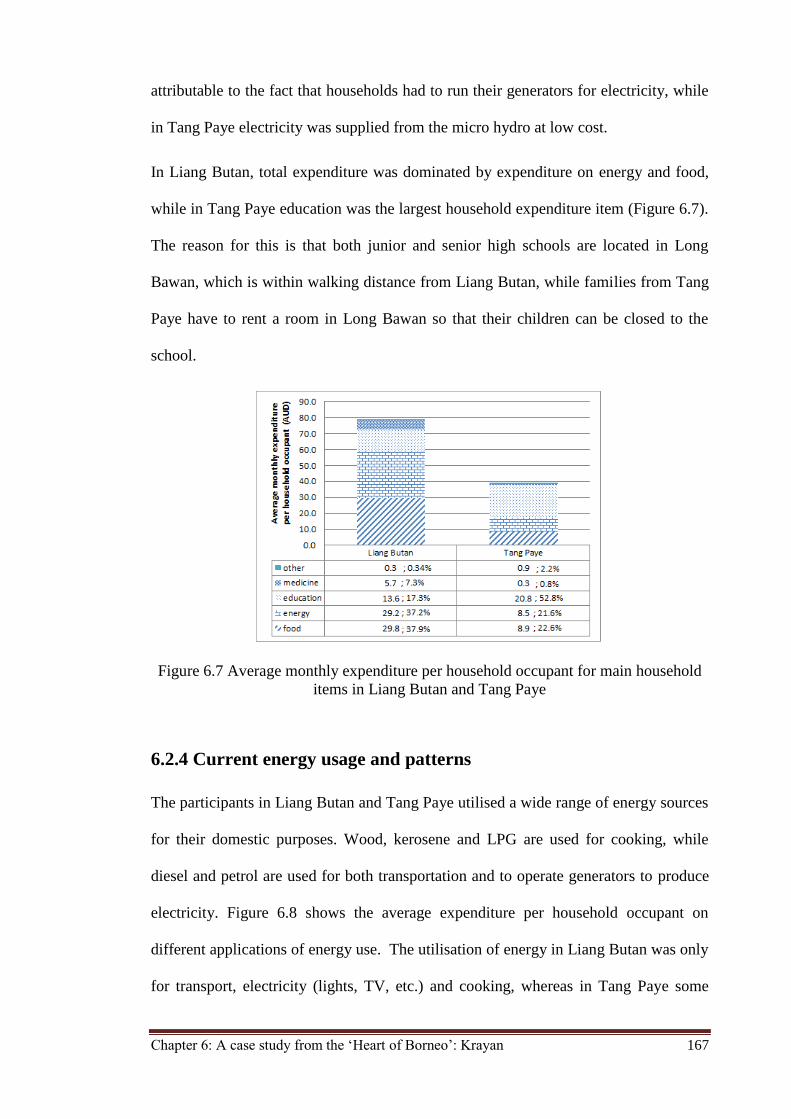
Chapter 6: A case study from the ‘Heart of Borneo’: Krayan 167
attributable to the fact that households had to run their generators for electricity, while
in Tang Paye electricity was supplied from the micro hydro at low cost.
In Liang Butan, total expenditure was dominated by expenditure on energy and food,
while in Tang Paye education was the largest household expenditure item (Figure 6.7).
The reason for this is that both junior and senior high schools are located in Long
Bawan, which is within walking distance from Liang Butan, while families from Tang
Paye have to rent a room in Long Bawan so that their children can be closed to the
school.
Figure 6.7 Average monthly expenditure per household occupant for main household
items in Liang Butan and Tang Paye
6.2.4 Current energy usage and patterns
The participants in Liang Butan and Tang Paye utilised a wide range of energy sources
for their domestic purposes. Wood, kerosene and LPG are used for cooking, while
diesel and petrol are used for both transportation and to operate generators to produce
electricity. Figure 6.8 shows the average expenditure per household occupant on
different applications of energy use. The utilisation of energy in Liang Butan was only
for transport, electricity (lights, TV, etc.) and cooking, whereas in Tang Paye some
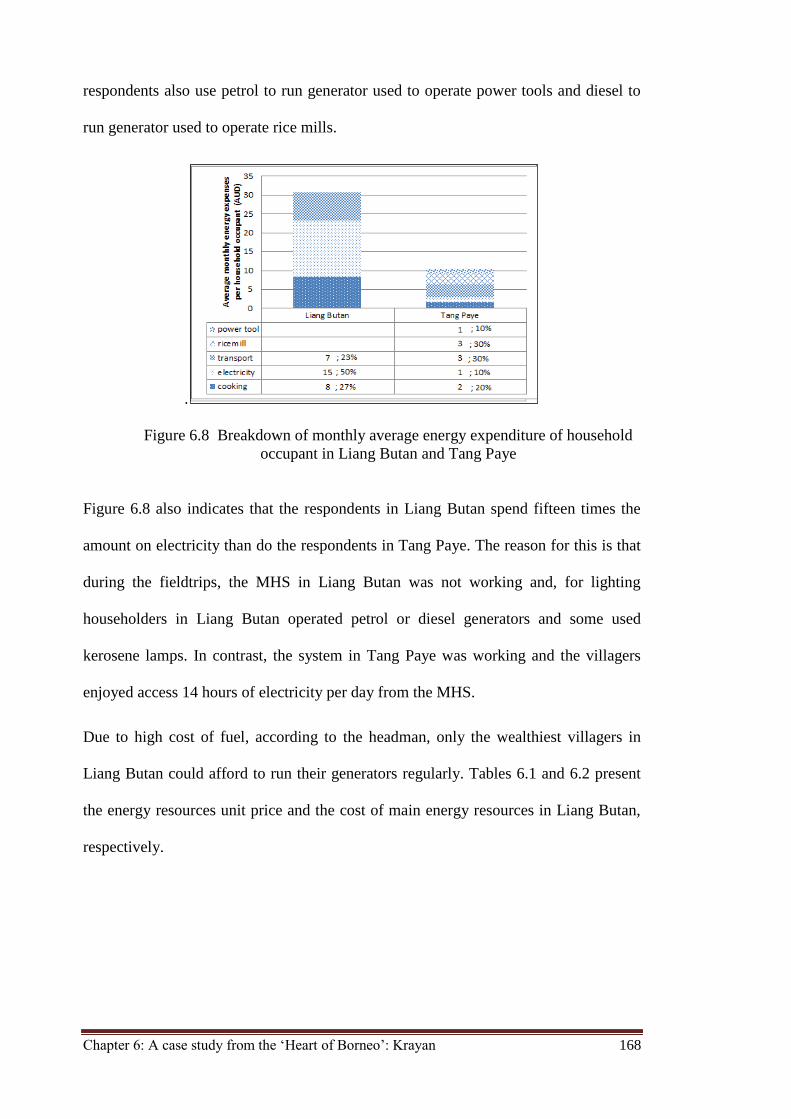
Chapter 6: A case study from the ‘Heart of Borneo’: Krayan 168
respondents also use petrol to run generator used to operate power tools and diesel to
run generator used to operate rice mills.
.
Figure 6.8 Breakdown of monthly average energy expenditure of household
occupant in Liang Butan and Tang Paye
Figure 6.8 also indicates that the respondents in Liang Butan spend fifteen times the
amount on electricity than do the respondents in Tang Paye. The reason for this is that
during the fieldtrips, the MHS in Liang Butan was not working and, for lighting
householders in Liang Butan operated petrol or diesel generators and some used
kerosene lamps. In contrast, the system in Tang Paye was working and the villagers
enjoyed access 14 hours of electricity per day from the MHS.
Due to high cost of fuel, according to the headman, only the wealthiest villagers in
Liang Butan could afford to run their generators regularly. Tables 6.1 and 6.2 present
the energy resources unit price and the cost of main energy resources in Liang Butan,
respectively.
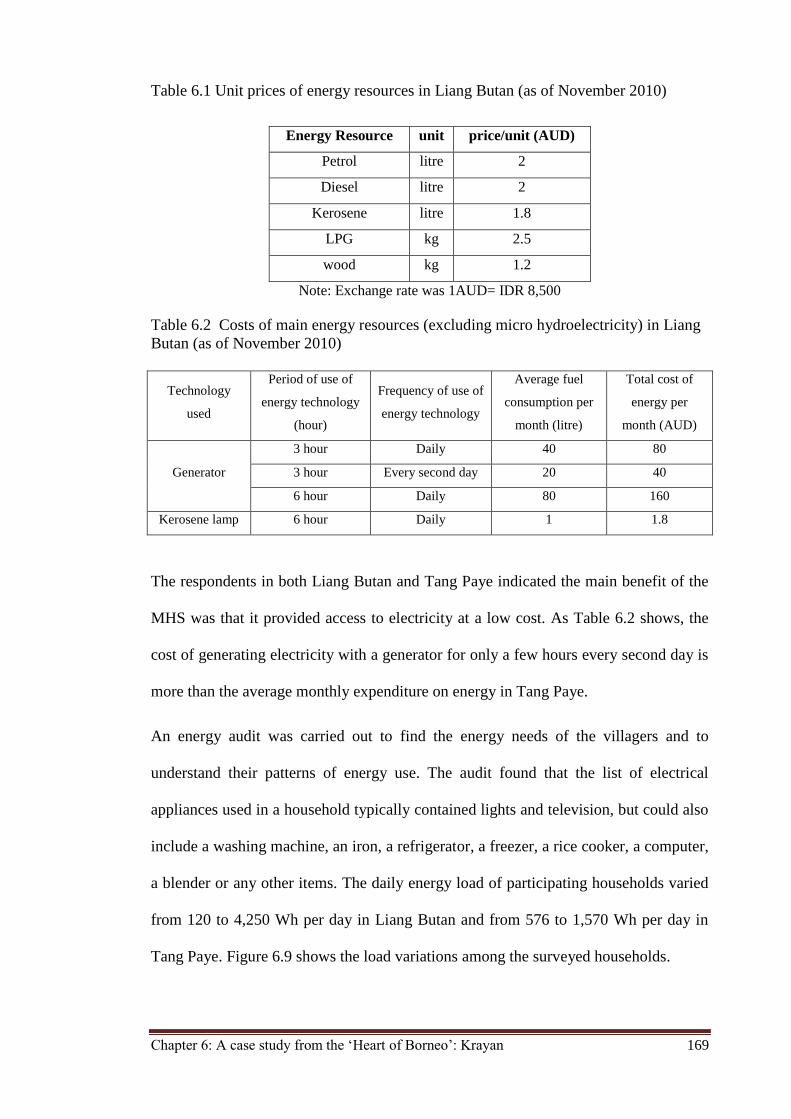
Chapter 6: A case study from the ‘Heart of Borneo’: Krayan 169
Table 6.1 Unit prices of energy resources in Liang Butan (as of November 2010)
Energy Resource unit price/unit (AUD)
Petrol litre 2
Diesel litre 2
Kerosene litre 1.8
LPG kg 2.5
wood kg 1.2
Note: Exchange rate was 1AUD= IDR 8,500
Table 6.2 Costs of main energy resources (excluding micro hydroelectricity) in Liang
Butan (as of November 2010)
Technology
used
Period of use of
energy technology
(hour)
Frequency of use of
energy technology
Average fuel
consumption per
month (litre)
Total cost of
energy per
month (AUD)
Generator
3 hour Daily 40 80
3 hour Every second day 20 40
6 hour Daily 80 160
Kerosene lamp 6 hour Daily 1 1.8
The respondents in both Liang Butan and Tang Paye indicated the main benefit of the
MHS was that it provided access to electricity at a low cost. As Table 6.2 shows, the
cost of generating electricity with a generator for only a few hours every second day is
more than the average monthly expenditure on energy in Tang Paye.
An energy audit was carried out to find the energy needs of the villagers and to
understand their patterns of energy use. The audit found that the list of electrical
appliances used in a household typically contained lights and television, but could also
include a washing machine, an iron, a refrigerator, a freezer, a rice cooker, a computer,
a blender or any other items. The daily energy load of participating households varied
from 120 to 4,250 Wh per day in Liang Butan and from 576 to 1,570 Wh per day in
Tang Paye. Figure 6.9 shows the load variations among the surveyed households.
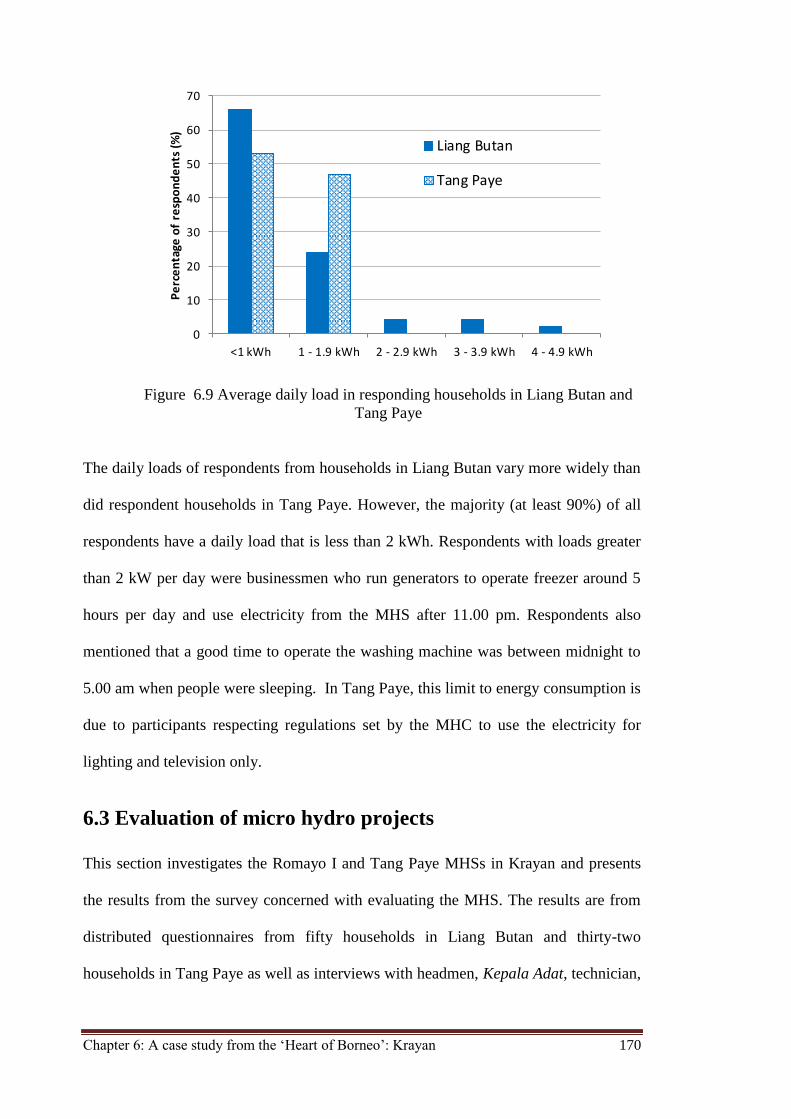
Chapter 6: A case study from the ‘Heart of Borneo’: Krayan 170
Figure 6.9 Average daily load in responding households in Liang Butan and
Tang Paye
The daily loads of respondents from households in Liang Butan vary more widely than
did respondent households in Tang Paye. However, the majority (at least 90%) of all
respondents have a daily load that is less than 2 kWh. Respondents with loads greater
than 2 kW per day were businessmen who run generators to operate freezer around 5
hours per day and use electricity from the MHS after 11.00 pm. Respondents also
mentioned that a good time to operate the washing machine was between midnight to
5.00 am when people were sleeping. In Tang Paye, this limit to energy consumption is
due to participants respecting regulations set by the MHC to use the electricity for
lighting and television only.
6.3 Evaluation of micro hydro projects
This section investigates the Romayo I and Tang Paye MHSs in Krayan and presents
the results from the survey concerned with evaluating the MHS. The results are from
distributed questionnaires from fifty households in Liang Butan and thirty-two
households in Tang Paye as well as interviews with headmen, Kepala Adat, technician,
0
10
20
30
40
50
60
70
<1 kWh 1 - 1.9 kWh 2 - 2.9 kWh 3 - 3.9 kWh 4 - 4.9 kWh
Pe
rce
nta
ge o
f re
spo
nd
en
ts (
%)
Liang Butan
Tang Paye
Chapter 6: A case study from the ‘Heart of Borneo’: Krayan 171
micro hydro committee and government official at sub-district, regency and province
level.
6.3.1 Policy and design
(a) Resource assessment
The capacity of a run-of-river MHS, such as those that serve Liang Butan and Tang
Paye, was determined by the available heads and river flow rates. The power produced
therefore fluctuates, based on seasonal flow throughout the year. In both case study
sites, no long-term flow rate data exists to support the estimations of seasonal flow rate
variability over a year or a longer-term period, such as a decade. Both technicians and
MHCs mentioned that the hydro resource assessment at Liang Butan and Tang Paye
were undertaken using a spot reading method during the dry season. The determination
of average annual flow rates was based on qualitative data provided by the community
and adjustments were made to the spot readings to take into account the seasonal
variations.
Interviews with headmen, Kepala Adat, and government staff revealed that these
systems were designed on the operating principal that the output of the system is
dependent on the available resource and whatever electricity is produced will be
equally distributed to the end users. Both the government and the communities agreed
that it would be good to harness the water resource and to have cheap electricity. One
respondent in Liang Butan stated that “the important thing is getting electricity, no
matter how small it is”, whilst another said “if there is a potential water resource, just
harness it, rather than buying petrol every day as petrol is very costly” .
From the site investigations it was found that both schemes incorporate an
instantaneous induction turbine into the system design, with no storage incorporated in
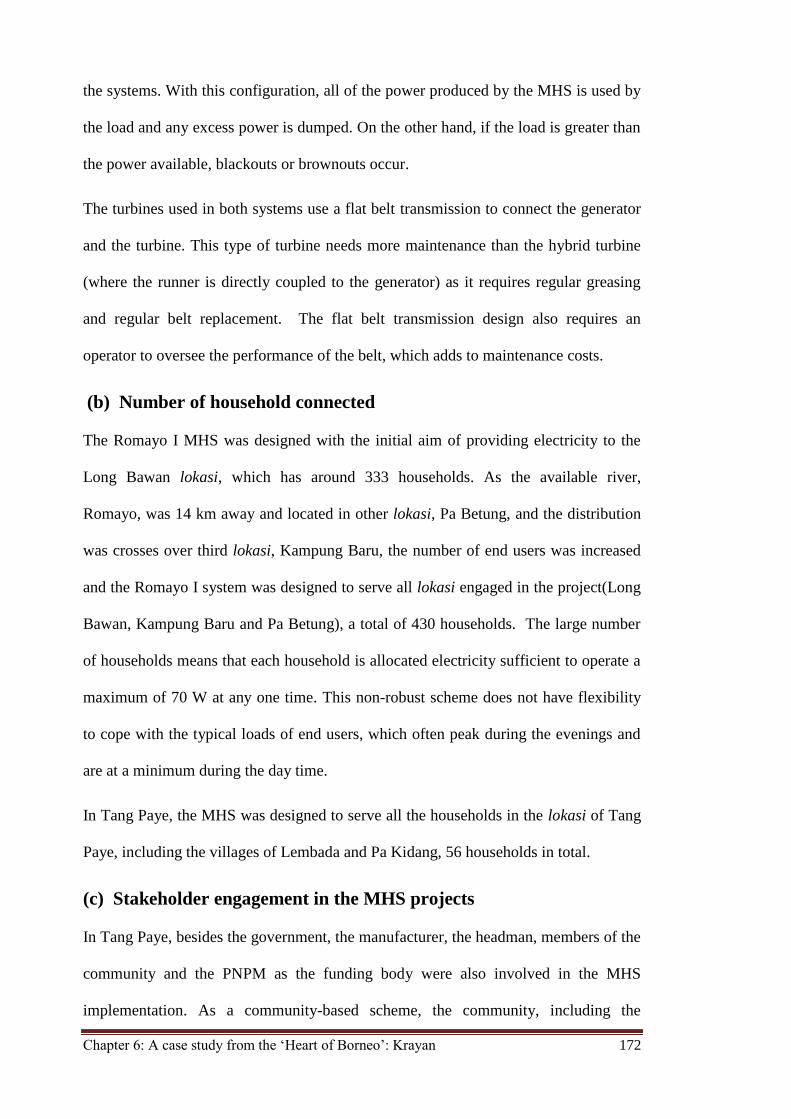
Chapter 6: A case study from the ‘Heart of Borneo’: Krayan 172
the systems. With this configuration, all of the power produced by the MHS is used by
the load and any excess power is dumped. On the other hand, if the load is greater than
the power available, blackouts or brownouts occur.
The turbines used in both systems use a flat belt transmission to connect the generator
and the turbine. This type of turbine needs more maintenance than the hybrid turbine
(where the runner is directly coupled to the generator) as it requires regular greasing
and regular belt replacement. The flat belt transmission design also requires an
operator to oversee the performance of the belt, which adds to maintenance costs.
(b) Number of household connected
The Romayo I MHS was designed with the initial aim of providing electricity to the
Long Bawan lokasi, which has around 333 households. As the available river,
Romayo, was 14 km away and located in other lokasi, Pa Betung, and the distribution
was crosses over third lokasi, Kampung Baru, the number of end users was increased
and the Romayo I system was designed to serve all lokasi engaged in the project(Long
Bawan, Kampung Baru and Pa Betung), a total of 430 households. The large number
of households means that each household is allocated electricity sufficient to operate a
maximum of 70 W at any one time. This non-robust scheme does not have flexibility
to cope with the typical loads of end users, which often peak during the evenings and
are at a minimum during the day time.
In Tang Paye, the MHS was designed to serve all the households in the lokasi of Tang
Paye, including the villages of Lembada and Pa Kidang, 56 households in total.
(c) Stakeholder engagement in the MHS projects
In Tang Paye, besides the government, the manufacturer, the headman, members of the
community and the PNPM as the funding body were also involved in the MHS
implementation. As a community-based scheme, the community, including the
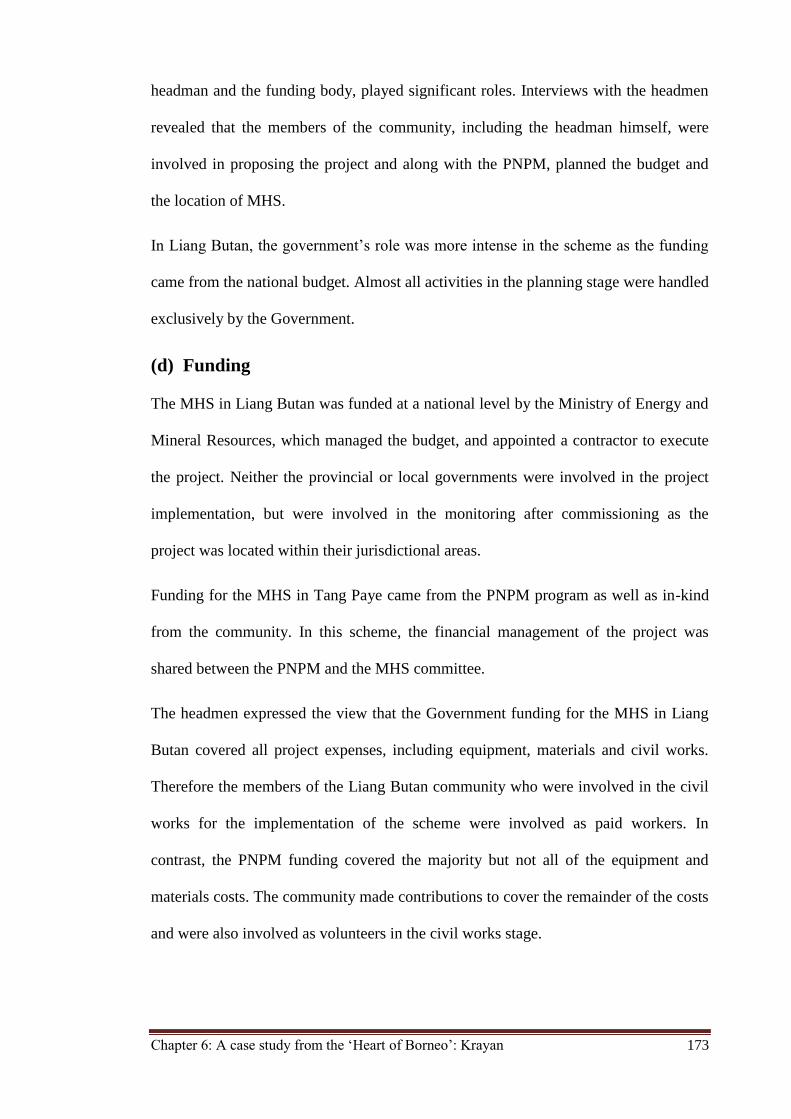
Chapter 6: A case study from the ‘Heart of Borneo’: Krayan 173
headman and the funding body, played significant roles. Interviews with the headmen
revealed that the members of the community, including the headman himself, were
involved in proposing the project and along with the PNPM, planned the budget and
the location of MHS.
In Liang Butan, the government’s role was more intense in the scheme as the funding
came from the national budget. Almost all activities in the planning stage were handled
exclusively by the Government.
(d) Funding
The MHS in Liang Butan was funded at a national level by the Ministry of Energy and
Mineral Resources, which managed the budget, and appointed a contractor to execute
the project. Neither the provincial or local governments were involved in the project
implementation, but were involved in the monitoring after commissioning as the
project was located within their jurisdictional areas.
Funding for the MHS in Tang Paye came from the PNPM program as well as in-kind
from the community. In this scheme, the financial management of the project was
shared between the PNPM and the MHS committee.
The headmen expressed the view that the Government funding for the MHS in Liang
Butan covered all project expenses, including equipment, materials and civil works.
Therefore the members of the Liang Butan community who were involved in the civil
works for the implementation of the scheme were involved as paid workers. In
contrast, the PNPM funding covered the majority but not all of the equipment and
materials costs. The community made contributions to cover the remainder of the costs
and were also involved as volunteers in the civil works stage.
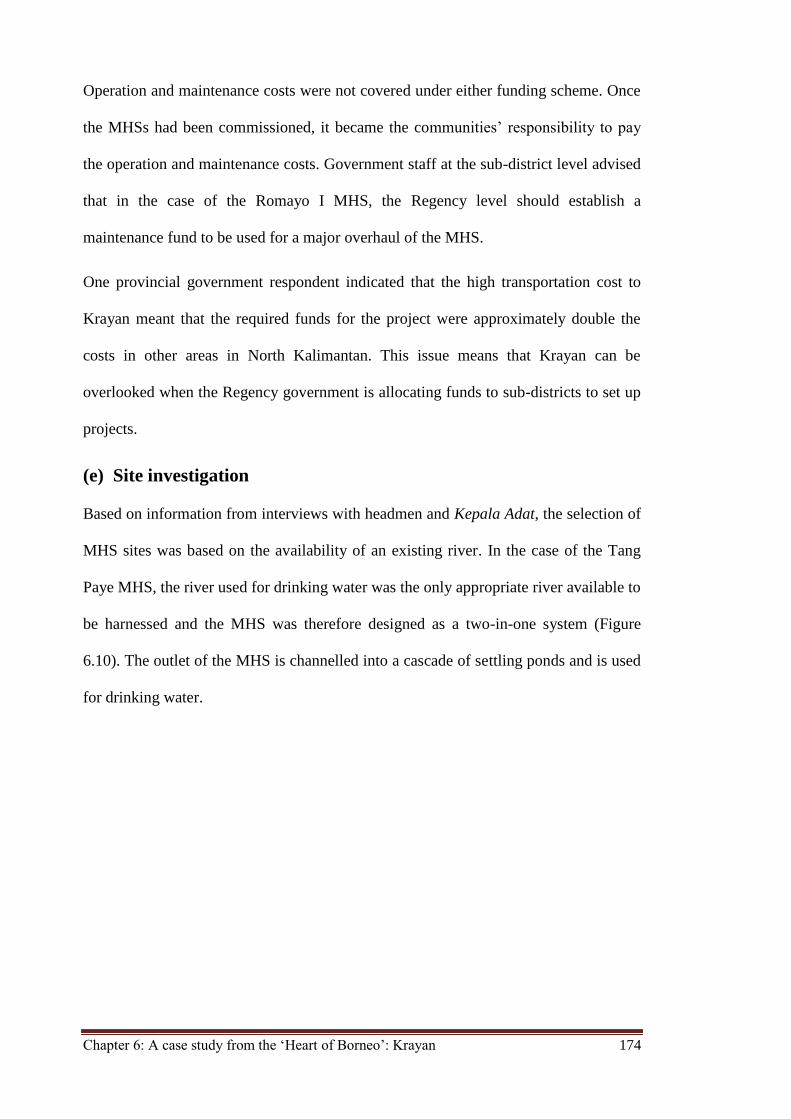
Chapter 6: A case study from the ‘Heart of Borneo’: Krayan 174
Operation and maintenance costs were not covered under either funding scheme. Once
the MHSs had been commissioned, it became the communities’ responsibility to pay
the operation and maintenance costs. Government staff at the sub-district level advised
that in the case of the Romayo I MHS, the Regency level should establish a
maintenance fund to be used for a major overhaul of the MHS.
One provincial government respondent indicated that the high transportation cost to
Krayan meant that the required funds for the project were approximately double the
costs in other areas in North Kalimantan. This issue means that Krayan can be
overlooked when the Regency government is allocating funds to sub-districts to set up
projects.
(e) Site investigation
Based on information from interviews with headmen and Kepala Adat, the selection of
MHS sites was based on the availability of an existing river. In the case of the Tang
Paye MHS, the river used for drinking water was the only appropriate river available to
be harnessed and the MHS was therefore designed as a two-in-one system (Figure
6.10). The outlet of the MHS is channelled into a cascade of settling ponds and is used
for drinking water.
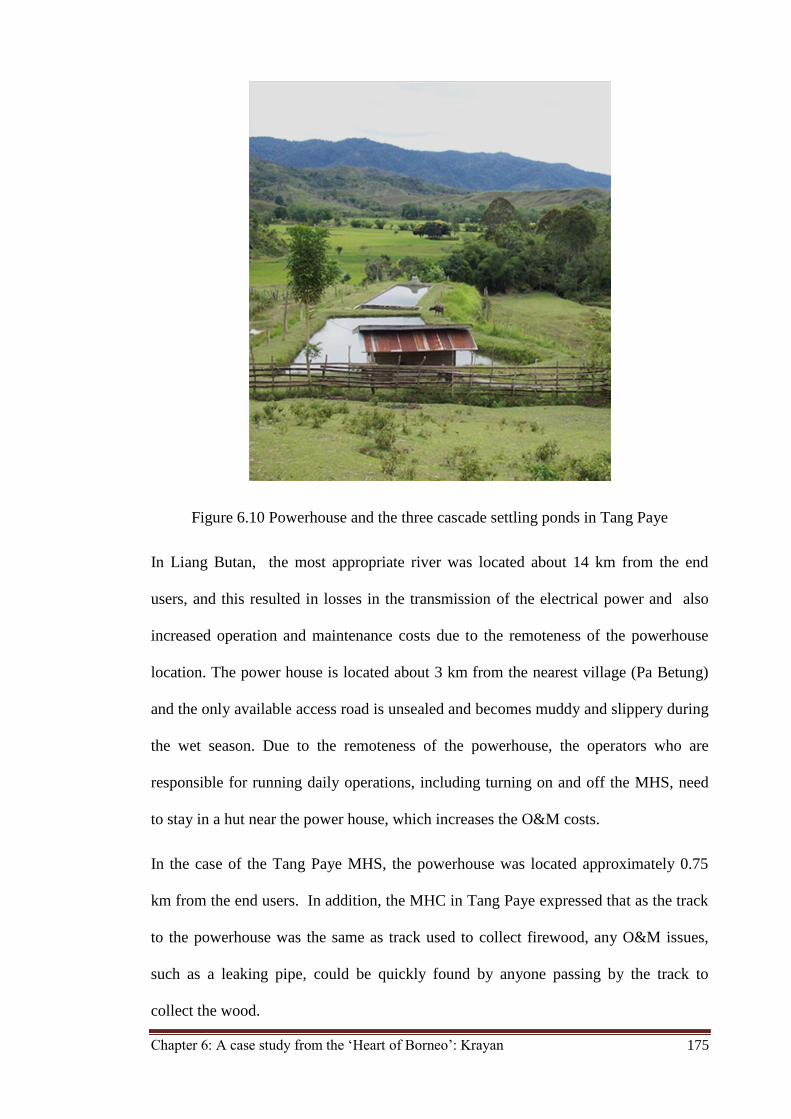
Chapter 6: A case study from the ‘Heart of Borneo’: Krayan 175
Figure 6.10 Powerhouse and the three cascade settling ponds in Tang Paye
In Liang Butan, the most appropriate river was located about 14 km from the end
users, and this resulted in losses in the transmission of the electrical power and also
increased operation and maintenance costs due to the remoteness of the powerhouse
location. The power house is located about 3 km from the nearest village (Pa Betung)
and the only available access road is unsealed and becomes muddy and slippery during
the wet season. Due to the remoteness of the powerhouse, the operators who are
responsible for running daily operations, including turning on and off the MHS, need
to stay in a hut near the power house, which increases the O&M costs.
In the case of the Tang Paye MHS, the powerhouse was located approximately 0.75
km from the end users. In addition, the MHC in Tang Paye expressed that as the track
to the powerhouse was the same as track used to collect firewood, any O&M issues,
such as a leaking pipe, could be quickly found by anyone passing by the track to
collect the wood.
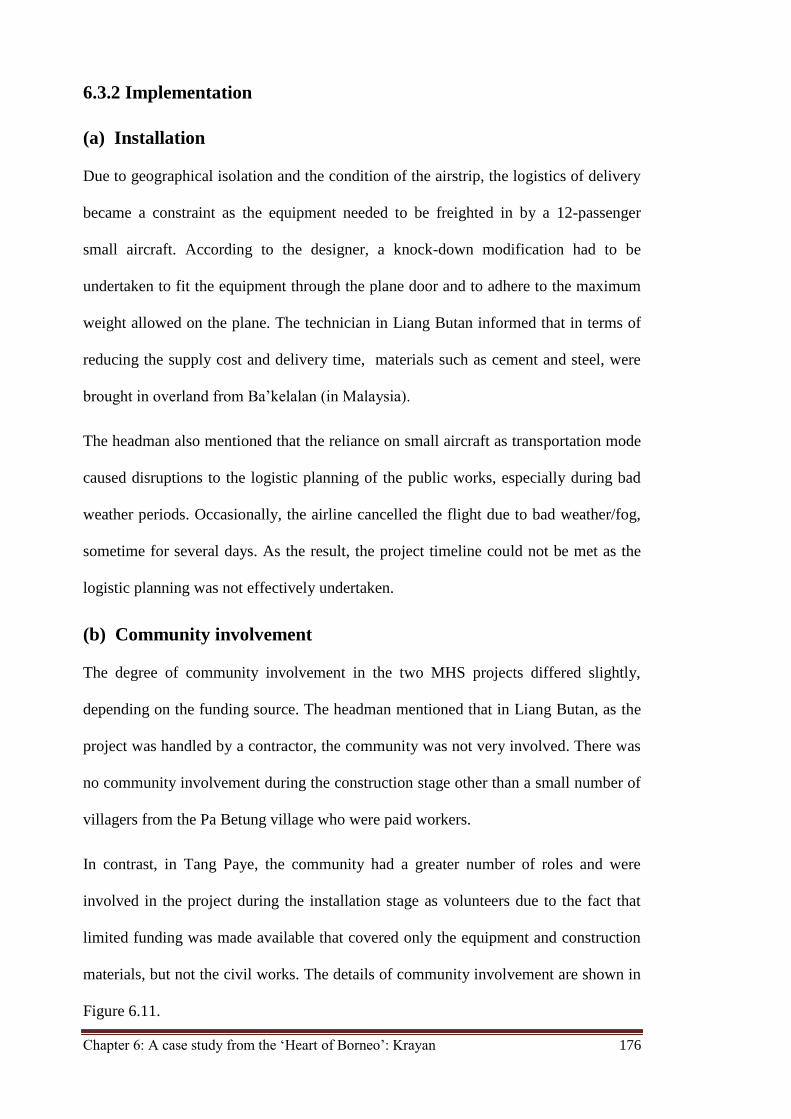
Chapter 6: A case study from the ‘Heart of Borneo’: Krayan 176
6.3.2 Implementation
(a) Installation
Due to geographical isolation and the condition of the airstrip, the logistics of delivery
became a constraint as the equipment needed to be freighted in by a 12-passenger
small aircraft. According to the designer, a knock-down modification had to be
undertaken to fit the equipment through the plane door and to adhere to the maximum
weight allowed on the plane. The technician in Liang Butan informed that in terms of
reducing the supply cost and delivery time, materials such as cement and steel, were
brought in overland from Ba’kelalan (in Malaysia).
The headman also mentioned that the reliance on small aircraft as transportation mode
caused disruptions to the logistic planning of the public works, especially during bad
weather periods. Occasionally, the airline cancelled the flight due to bad weather/fog,
sometime for several days. As the result, the project timeline could not be met as the
logistic planning was not effectively undertaken.
(b) Community involvement
The degree of community involvement in the two MHS projects differed slightly,
depending on the funding source. The headman mentioned that in Liang Butan, as the
project was handled by a contractor, the community was not very involved. There was
no community involvement during the construction stage other than a small number of
villagers from the Pa Betung village who were paid workers.
In contrast, in Tang Paye, the community had a greater number of roles and were
involved in the project during the installation stage as volunteers due to the fact that
limited funding was made available that covered only the equipment and construction
materials, but not the civil works. The details of community involvement are shown in
Figure 6.11.
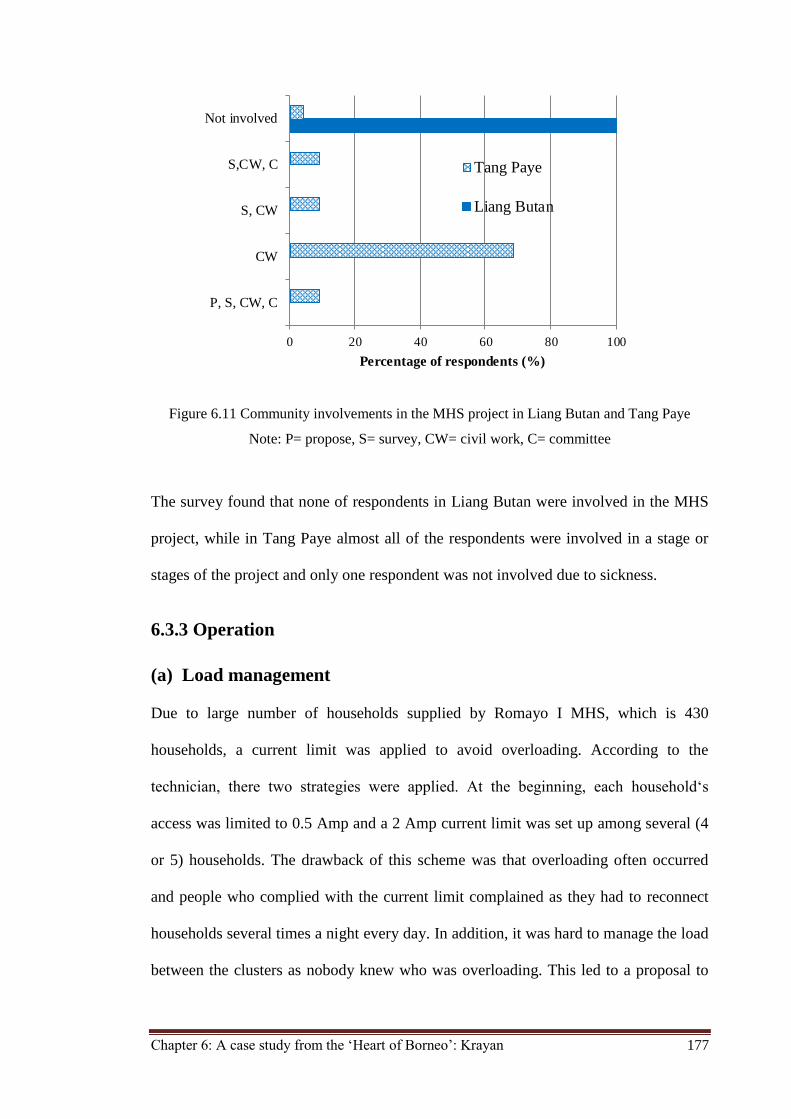
Chapter 6: A case study from the ‘Heart of Borneo’: Krayan 177
Figure 6.11 Community involvements in the MHS project in Liang Butan and Tang Paye
Note: P= propose, S= survey, CW= civil work, C= committee
The survey found that none of respondents in Liang Butan were involved in the MHS
project, while in Tang Paye almost all of the respondents were involved in a stage or
stages of the project and only one respondent was not involved due to sickness.
6.3.3 Operation
(a) Load management
Due to large number of households supplied by Romayo I MHS, which is 430
households, a current limit was applied to avoid overloading. According to the
technician, there two strategies were applied. At the beginning, each household‘s
access was limited to 0.5 Amp and a 2 Amp current limit was set up among several (4
or 5) households. The drawback of this scheme was that overloading often occurred
and people who complied with the current limit complained as they had to reconnect
households several times a night every day. In addition, it was hard to manage the load
between the clusters as nobody knew who was overloading. This led to a proposal to
0 20 40 60 80 100
P, S, CW, C
CW
S, CW
S,CW, C
Not involved
Percentage of respondents (%)
Tang Paye
Liang Butan
Chapter 6: A case study from the ‘Heart of Borneo’: Krayan 178
limit individual households and the technician was subsequently asked to install either
a 1 Amp, 2 Amp or 3 Amp limit, depending on the householder’s request.
The fact that villager could not get access electricity to operate their appliances led the
villager to bypass the current limiting device. This resulted in the safe load limit being
exceeded and as a consequence, blackouts and/or brownouts occurred, especially over
the period of 7.00 – 11.00 pm. The technician, sub-district officer, headmen, Kepala
Adat and some community members inspected some of the houses to see whether
appliances other than lights and televisions were being operated. Where additional
appliances were found to be plugged in, electricity supply to the house was cut as a
punishment by disconnecting the wires. However, this penalty proved to be ineffective
as the householders simply reconnected the wires.
According to the technician, another strategy used was to split the total 430 households
into 2 clusters to distribute the load. Pa Betung lokasi (45 hh), Kampung Baru lokasi
(52 hh) and Liang Butan village (144 hh) ,with total 241 hh was created as one cluster,
and Pa Betung lokasi (45 hh), Long Bawan village (107 hh) and Long Katung village
(82 hh) with total 234 hh was created as another cluster. Pa Betung, where the river
located, has the privilege of access to electricity each day. The households in the two
clusters alternate their access to electricity by having access on every second day. With
this scheme, each household is able to draw around 125 W. However, these combined
methods did not fix the problem as villagers continued to bypass the current limiting
devices.
The interview with the MHC revealed that most households in Tang Paye have access
of 1Amp electricity, but that the three households of the headmen of two villages and
one of the secretaries had 2 Amp limits. All households are advised to operate a
maximum of 5 lights and a television set and not to operate other appliances. To
Chapter 6: A case study from the ‘Heart of Borneo’: Krayan 179
distribute the load, they split the power into 3 lines. Two lines serve 20 households, 5
street lights @ 20 watt per lamp and a church. The other lines serve 19 households, 5
street lights @ 20 watt per lamp and the government office (headmen office). The
problem of bypassing the current limiting device was not reported except once when a
householder attempted to turn on other appliances that ended up causing a black out.
The committee identified the household that overloaded and advised the householder
not to do it again. Other villagers learnt from this case and the villagers were happy to
have cheap electricity even if limited to 1Amp.
(b) Electricity tariffs
Both MHSs were handed over the communities after commissioning the project. As a
consequence, the community took on the responsibility for operation and maintenance,
including raising funds to meet the O&M costs. To cover those costs, householders
were charged a tariff according to their use of electricity.
The technician in Liang Butan informed that the monthly electricity supply charge
varies according to the limit of the installed circuit breaker. Households are charged
IDR 15,000 (AUD 1.8) per month for a 1Amp limit; IDR 30,000 (AUD 3.5) for a 2
Amp limit and IDR 60,000 (AUD 7) per month for a 3 Amp limit. The money is
collected and managed by the technician. From the questionnaire it was found that
some respondents indicated that they were dissatisfied with this arrangement as
sometimes they pay in advance for a quarter or semester. Furthermore, the MHS on
occasion does not provide electricity continuously and sometimes is not operating for
weeks, but they do not receive a refund. In contrast, another household respondent
reported that an understanding of difficulty in handling the O&M in remote MHS
location after visiting the MHS site and afterward she never complained if the MHS
was not working for several days or if a blackout was not fixed promptly, considering
Chapter 6: A case study from the ‘Heart of Borneo’: Krayan 180
how low her monthly electricity bill is. This reveals the importance of increasing
awareness among the users on how these systems work.
Insufficient budgets to cover all operation and maintenance cost including paying
technician and operators, components replacements and maintaining the facilities were
reported by the technician. Poor maintenance of 3 km road from Pa Betung village to
the power house made it difficult for the operator to go to the power house. The lack of
maintenance funds had also resulted in postponing the components replacement.
Sometime the operator/technician noticed that a component needed to be replaced, but
as the money was unavailable they waited until the component had failed.
The tariff scheme in Tang Paye is slightly different. The monthly electricity charge is
determined by the appliances used. Villagers are allowed to operate a maximum of five
lights and a television. The tariff for operating three lights is IDR 10,000 (AUD 1.2)
per month. The additional tariff for operating one additional light is IDR 5,000 (AUD
0.6). The tariff for operating a television is an additional IDR 20,000 (AUD 2.4) per
month. The money is collected and managed by the MHS committee.
(c) Operation and maintenance
Based on interview with O&M personnel and MHC, it was found that the operation
and maintenance of MHS in both Liang Butan and Tang Paye is undertaken by the
trained community. However the circumstances were slightly different. The O&M in
Liang Butan is undertaken by the technician and operators. The trained technician has
full responsibility for all O&M, including mechanical and electrical matters, while the
two operators are responsible for the daily operation in powerhouse, including turning
the turbine on and off, greasing the turbine and clearing the intake. Neither received
any formal training and the only training that they received was from the trained
technician. The technician is based in Long Bawan and the operators are based in Pa
Chapter 6: A case study from the ‘Heart of Borneo’: Krayan 181
Betung (the power house). According to the O&M personnel, operators did not stay
long in this position because of the low wages.
In Tang Paye, MHS committee is responsible for the O&M, with the committee
members coming from different villages in Tang Paye and include a chairman, a
secretary, a treasurer, technician and helpers. One of the committee members attended
a 3-day MHS training course that was held in Long Bawan. Three days of basic
training were provided by the PNPM program prior to the project commissioning to
support the person selected to run the Operation and Maintenance (O&M) of the Tang
Paye MHS. The trained person then transferred his knowledge to other members. If a
problem arises that could not be handled by the committee, they consult with the
technician of the Romayo I MHS.
The MHSs in both villages have overnight operating hours between 5.00 pm and 6.00
am. The reason for this, according to the technician, was that the main purpose of the
power from the MHS was for lighting at night. The decision not to operate the MHS
during day time was different in the two villages. In Liang Butan the villagers believed
that the flow rates are insufficient for 24 hour operation. In Tang Paye, the decision
was also based on safety issues. As the adults worked during the day and children were
attending school, the villagers agreed to turn off the MHS to prevent the risks of young
children at home being electrocuted as a result of any electricity faults. However, on
occasions, such as communal prayer at church, marriages and funerals, the MHS in
Tang Paye is used to support the event free of charge.
Some problems were recognised during the MHS operation and maintenance. The
Romayo I (Liang Butan) MHS had more problems than did the Tang Paye MHS. In
Liang Butan, many problems were identified during the O&M and some problems
prevented the MHS from operating smoothly. The problems can be split into two
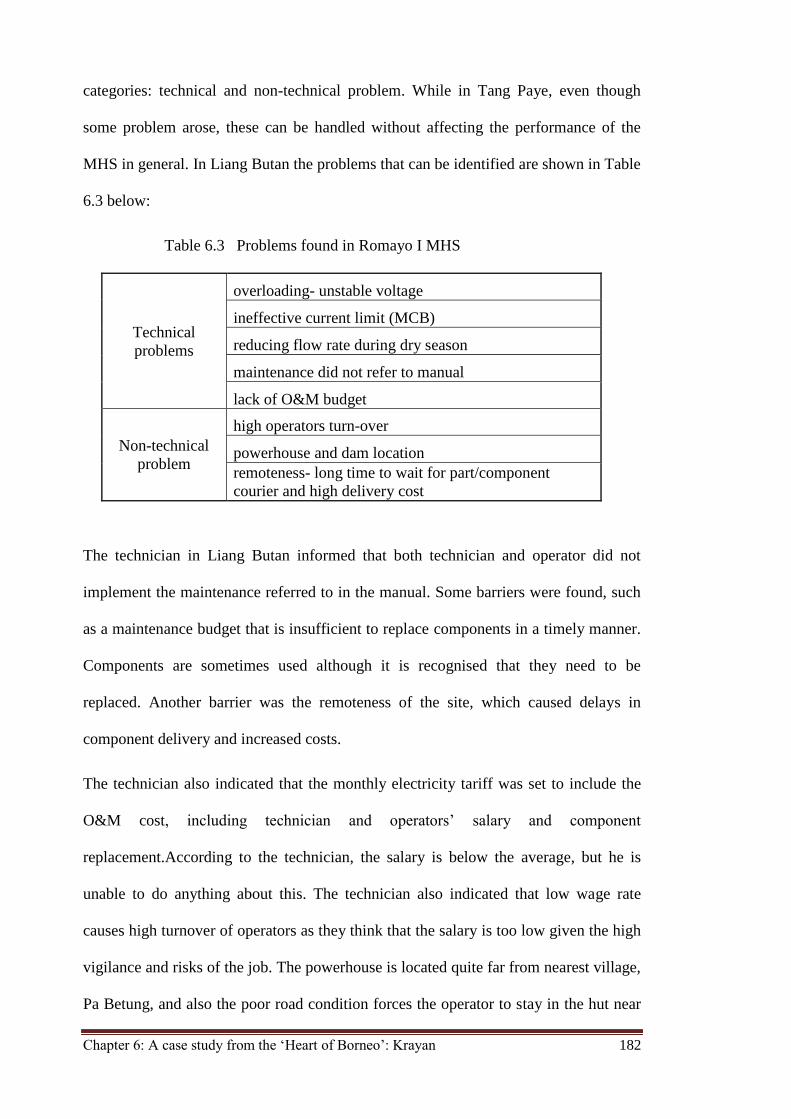
Chapter 6: A case study from the ‘Heart of Borneo’: Krayan 182
categories: technical and non-technical problem. While in Tang Paye, even though
some problem arose, these can be handled without affecting the performance of the
MHS in general. In Liang Butan the problems that can be identified are shown in Table
6.3 below:
Table 6.3 Problems found in Romayo I MHS
Technical
problems
overloading- unstable voltage
ineffective current limit (MCB)
reducing flow rate during dry season
maintenance did not refer to manual
lack of O&M budget
Non-technical
problem
high operators turn-over
powerhouse and dam location
remoteness- long time to wait for part/component
courier and high delivery cost
The technician in Liang Butan informed that both technician and operator did not
implement the maintenance referred to in the manual. Some barriers were found, such
as a maintenance budget that is insufficient to replace components in a timely manner.
Components are sometimes used although it is recognised that they need to be
replaced. Another barrier was the remoteness of the site, which caused delays in
component delivery and increased costs.
The technician also indicated that the monthly electricity tariff was set to include the
O&M cost, including technician and operators’ salary and component
replacement.According to the technician, the salary is below the average, but he is
unable to do anything about this. The technician also indicated that low wage rate
causes high turnover of operators as they think that the salary is too low given the high
vigilance and risks of the job. The powerhouse is located quite far from nearest village,
Pa Betung, and also the poor road condition forces the operator to stay in the hut near
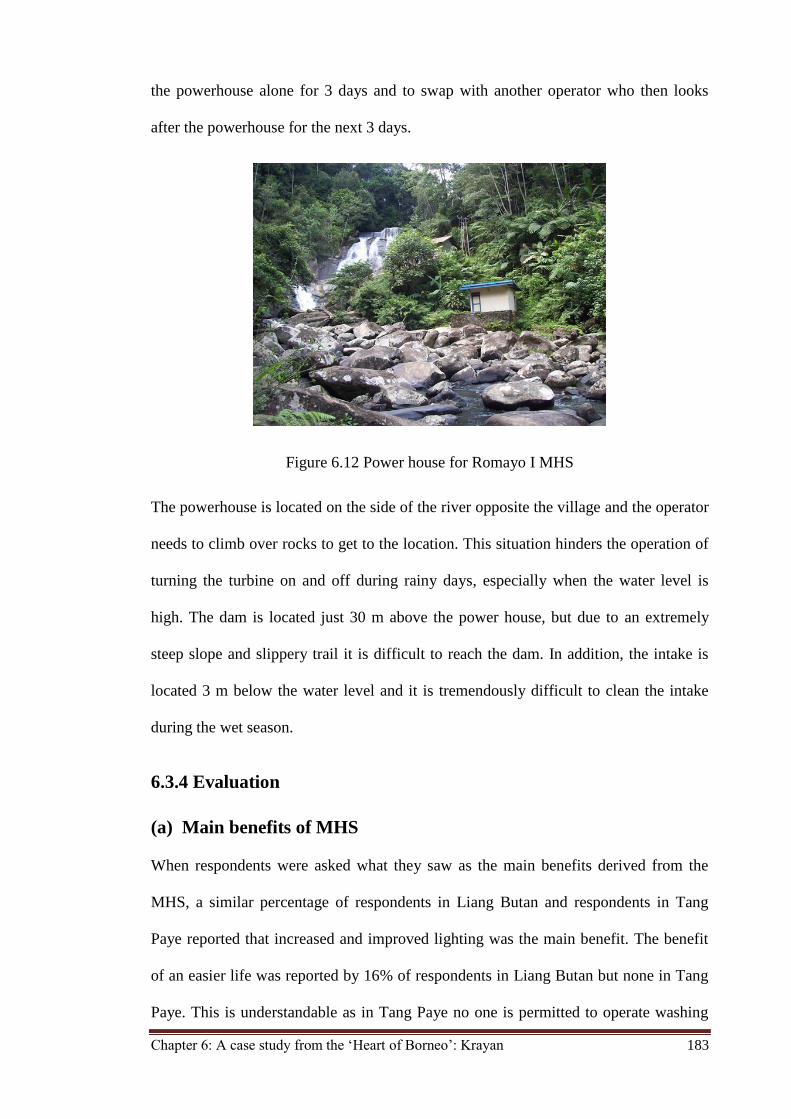
Chapter 6: A case study from the ‘Heart of Borneo’: Krayan 183
the powerhouse alone for 3 days and to swap with another operator who then looks
after the powerhouse for the next 3 days.
Figure 6.12 Power house for Romayo I MHS
The powerhouse is located on the side of the river opposite the village and the operator
needs to climb over rocks to get to the location. This situation hinders the operation of
turning the turbine on and off during rainy days, especially when the water level is
high. The dam is located just 30 m above the power house, but due to an extremely
steep slope and slippery trail it is difficult to reach the dam. In addition, the intake is
located 3 m below the water level and it is tremendously difficult to clean the intake
during the wet season.
6.3.4 Evaluation
(a) Main benefits of MHS
When respondents were asked what they saw as the main benefits derived from the
MHS, a similar percentage of respondents in Liang Butan and respondents in Tang
Paye reported that increased and improved lighting was the main benefit. The benefit
of an easier life was reported by 16% of respondents in Liang Butan but none in Tang
Paye. This is understandable as in Tang Paye no one is permitted to operate washing
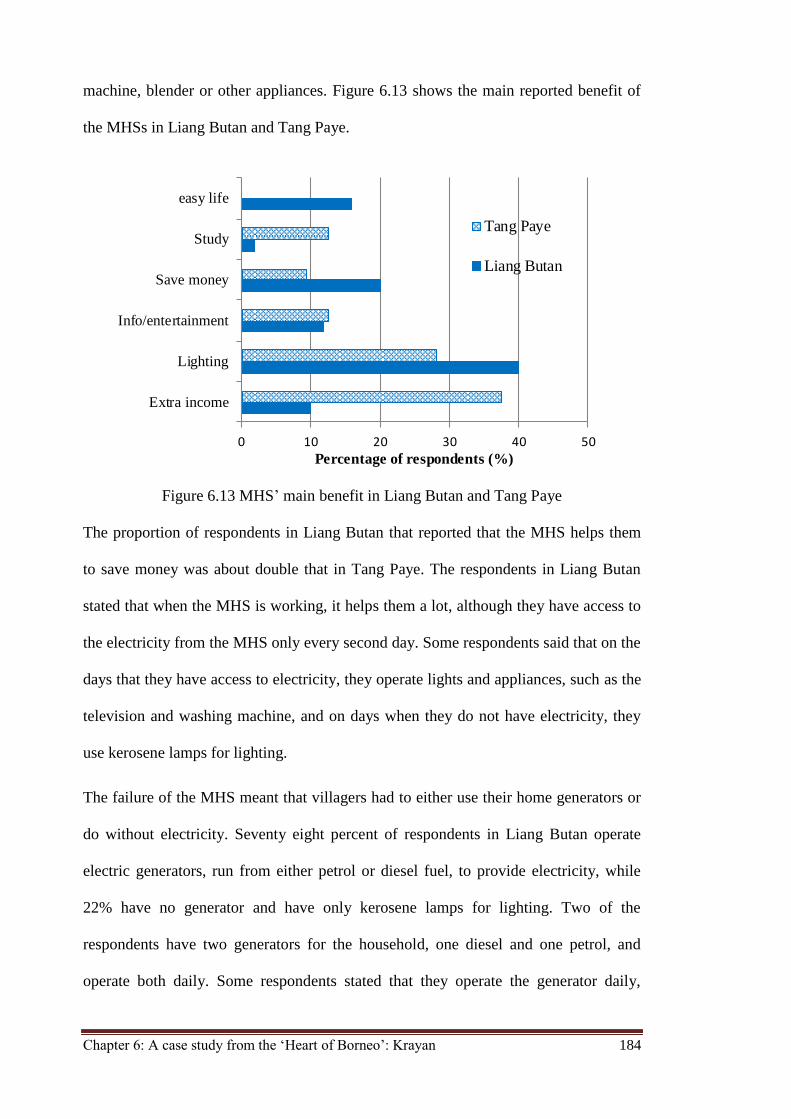
Chapter 6: A case study from the ‘Heart of Borneo’: Krayan 184
machine, blender or other appliances. Figure 6.13 shows the main reported benefit of
the MHSs in Liang Butan and Tang Paye.
Figure 6.13 MHS’ main benefit in Liang Butan and Tang Paye
The proportion of respondents in Liang Butan that reported that the MHS helps them
to save money was about double that in Tang Paye. The respondents in Liang Butan
stated that when the MHS is working, it helps them a lot, although they have access to
the electricity from the MHS only every second day. Some respondents said that on the
days that they have access to electricity, they operate lights and appliances, such as the
television and washing machine, and on days when they do not have electricity, they
use kerosene lamps for lighting.
The failure of the MHS meant that villagers had to either use their home generators or
do without electricity. Seventy eight percent of respondents in Liang Butan operate
electric generators, run from either petrol or diesel fuel, to provide electricity, while
22% have no generator and have only kerosene lamps for lighting. Two of the
respondents have two generators for the household, one diesel and one petrol, and
operate both daily. Some respondents stated that they operate the generator daily,
0 10 20 30 40 50
Extra income
Lighting
Info/entertainment
Save money
Study
easy life
Percentage of respondents (%)
Tang Paye
Liang Butan
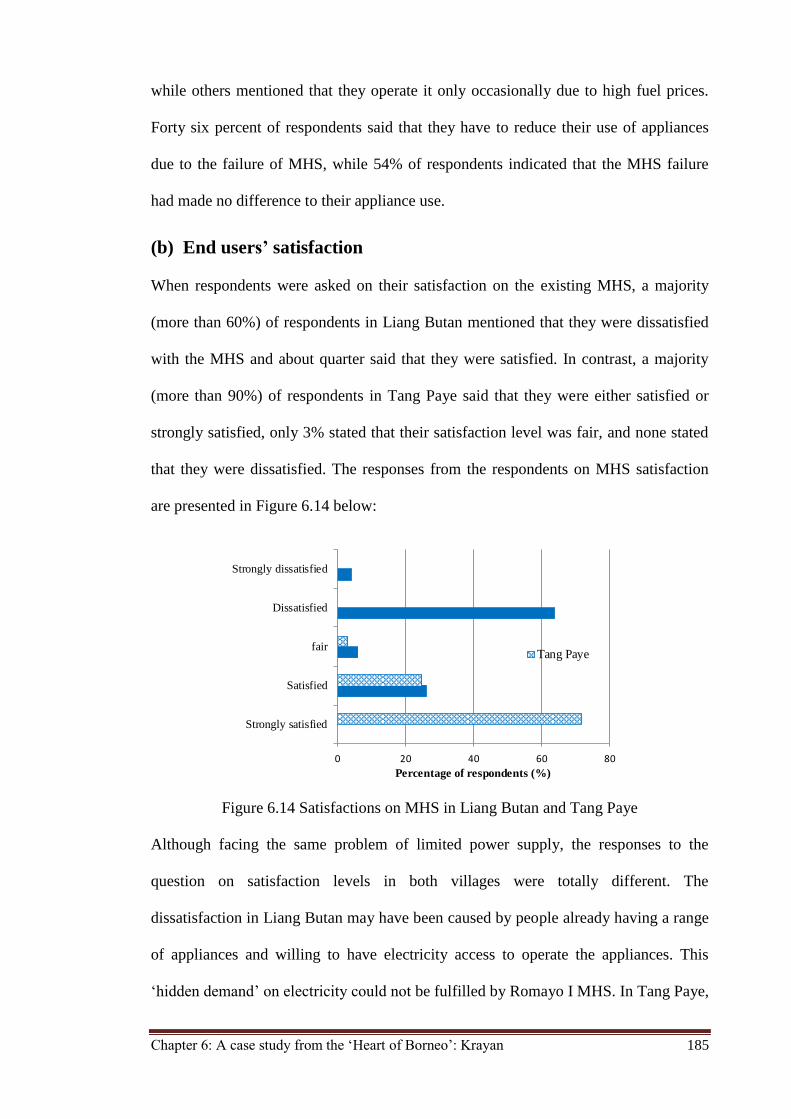
Chapter 6: A case study from the ‘Heart of Borneo’: Krayan 185
while others mentioned that they operate it only occasionally due to high fuel prices.
Forty six percent of respondents said that they have to reduce their use of appliances
due to the failure of MHS, while 54% of respondents indicated that the MHS failure
had made no difference to their appliance use.
(b) End users’ satisfaction
When respondents were asked on their satisfaction on the existing MHS, a majority
(more than 60%) of respondents in Liang Butan mentioned that they were dissatisfied
with the MHS and about quarter said that they were satisfied. In contrast, a majority
(more than 90%) of respondents in Tang Paye said that they were either satisfied or
strongly satisfied, only 3% stated that their satisfaction level was fair, and none stated
that they were dissatisfied. The responses from the respondents on MHS satisfaction
are presented in Figure 6.14 below:
Figure 6.14 Satisfactions on MHS in Liang Butan and Tang Paye
Although facing the same problem of limited power supply, the responses to the
question on satisfaction levels in both villages were totally different. The
dissatisfaction in Liang Butan may have been caused by people already having a range
of appliances and willing to have electricity access to operate the appliances. This
‘hidden demand’ on electricity could not be fulfilled by Romayo I MHS. In Tang Paye,
0 20 40 60 80
Strongly satisfied
Satisfied
fair
Dissatisfied
Strongly dissatisfied
Percentage of respondents (%)
Tang Paye
Chapter 6: A case study from the ‘Heart of Borneo’: Krayan 186
by contrast, the householders did not previously have any electric appliances and
having electricity encouraged them to buy television sets as the operational cost
became affordable. Respondents in Tang Paye reported that the benefits that they
enjoyed from having access to cheaper electricity were greater despite the limited
access. This finding shows that end user’s demand needs to be considered in designing
the MHS, including load management.
(c) Appliances and capacity to pay
To investigate the electricity demand in the future, respondents were asked what
additional appliances beside lights and television they would like to be able to use and
the reasons for doing so. In Liang Butan, respondents nominated a freezer, washing
machine, power tool, photocopier machine, rice cooker and electric kettle. A freezer
would enable them to earn an extra income by selling meat and ice. A washing
machine would help them save time and labour. Power tool and photocopier machine
were mentioned by the respondents who run a business/workshop as it would enable
them to expand their businesses. They currently use smart printers to copy and print
photos.
The survey results in Tang Paye were very different. In general, the respondents were
satisfied with the current situation and doubted that they would be able to afford other
appliances. Six percent of respondents stated that they would not have any additional
appliances as they could not afford to buy them. Six percent of respondents reported
that they would buy television sets. The appliances that other respondents mentioned
were freezers, washing machines and rice cookers. Only one respondent mentioned
power tools.
In accordance with operating additional appliances, respondents were asked to indicate
how much additional cost they would be willing to pay to operate as many appliances
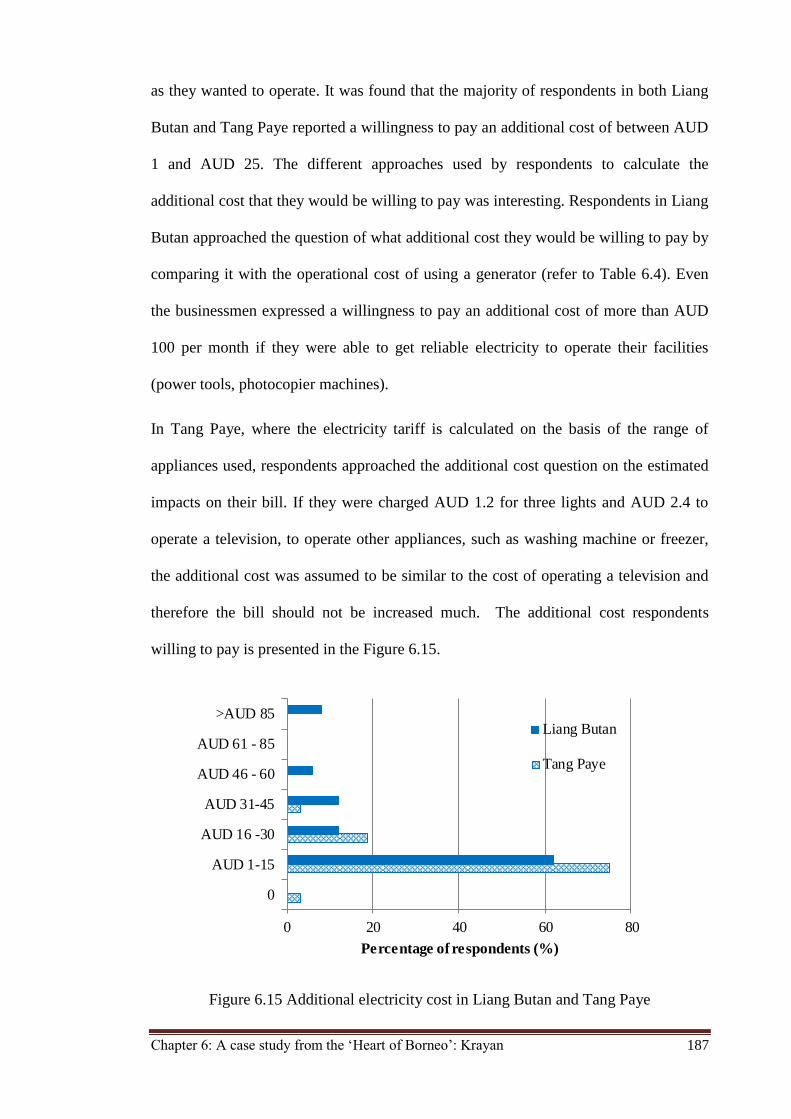
Chapter 6: A case study from the ‘Heart of Borneo’: Krayan 187
as they wanted to operate. It was found that the majority of respondents in both Liang
Butan and Tang Paye reported a willingness to pay an additional cost of between AUD
1 and AUD 25. The different approaches used by respondents to calculate the
additional cost that they would be willing to pay was interesting. Respondents in Liang
Butan approached the question of what additional cost they would be willing to pay by
comparing it with the operational cost of using a generator (refer to Table 6.4). Even
the businessmen expressed a willingness to pay an additional cost of more than AUD
100 per month if they were able to get reliable electricity to operate their facilities
(power tools, photocopier machines).
In Tang Paye, where the electricity tariff is calculated on the basis of the range of
appliances used, respondents approached the additional cost question on the estimated
impacts on their bill. If they were charged AUD 1.2 for three lights and AUD 2.4 to
operate a television, to operate other appliances, such as washing machine or freezer,
the additional cost was assumed to be similar to the cost of operating a television and
therefore the bill should not be increased much. The additional cost respondents
willing to pay is presented in the Figure 6.15.
Figure 6.15 Additional electricity cost in Liang Butan and Tang Paye
0 20 40 60 80
0
AUD 1-15
AUD 16 -30
AUD 31-45
AUD 46 - 60
AUD 61 - 85
>AUD 85
Percentage of respondents (%)
Liang Butan
Tang Paye
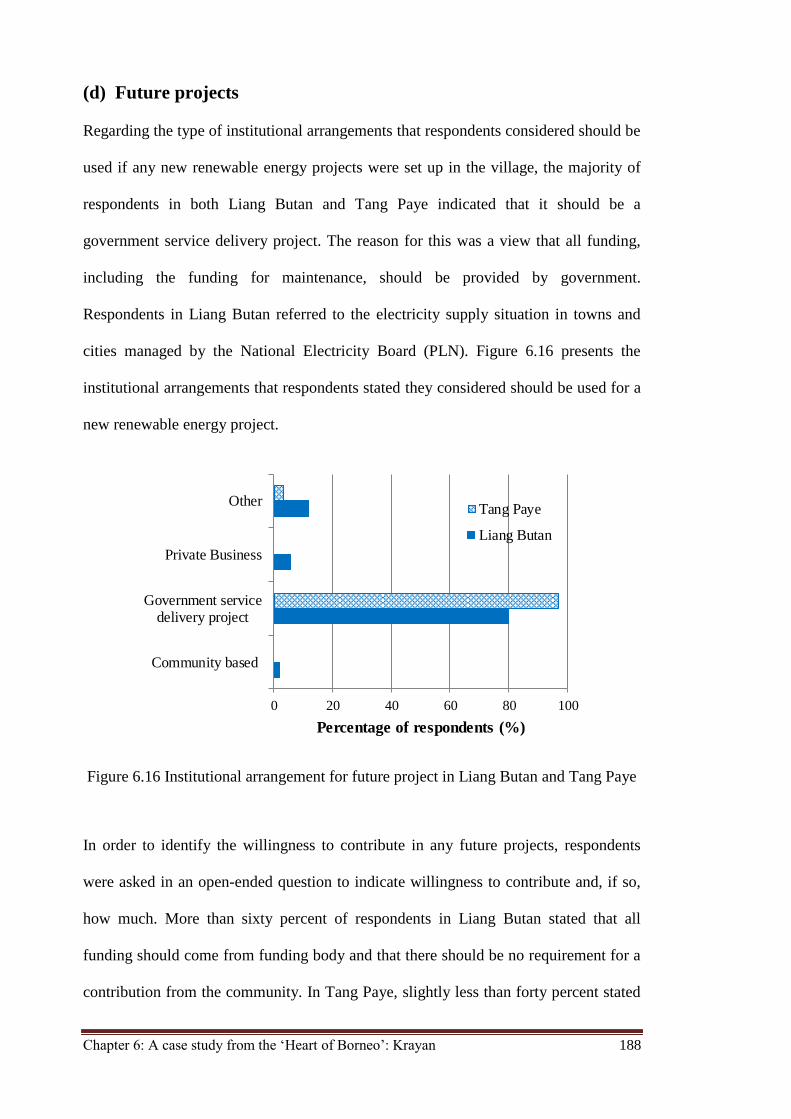
Chapter 6: A case study from the ‘Heart of Borneo’: Krayan 188
(d) Future projects
Regarding the type of institutional arrangements that respondents considered should be
used if any new renewable energy projects were set up in the village, the majority of
respondents in both Liang Butan and Tang Paye indicated that it should be a
government service delivery project. The reason for this was a view that all funding,
including the funding for maintenance, should be provided by government.
Respondents in Liang Butan referred to the electricity supply situation in towns and
cities managed by the National Electricity Board (PLN). Figure 6.16 presents the
institutional arrangements that respondents stated they considered should be used for a
new renewable energy project.
Figure 6.16 Institutional arrangement for future project in Liang Butan and Tang Paye
In order to identify the willingness to contribute in any future projects, respondents
were asked in an open-ended question to indicate willingness to contribute and, if so,
how much. More than sixty percent of respondents in Liang Butan stated that all
funding should come from funding body and that there should be no requirement for a
contribution from the community. In Tang Paye, slightly less than forty percent stated
0 20 40 60 80 100
Community based
Government servicedelivery project
Private Business
Other
Percentage of respondents (%)
Tang Paye
Liang Butan
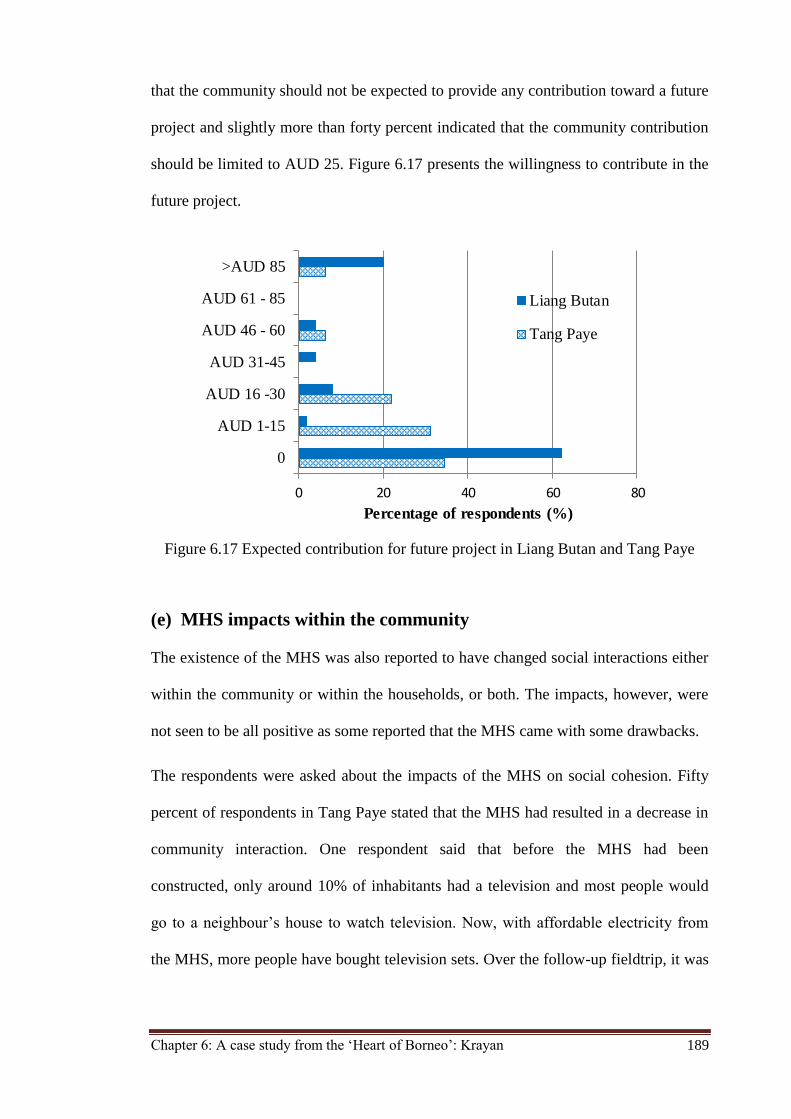
Chapter 6: A case study from the ‘Heart of Borneo’: Krayan 189
that the community should not be expected to provide any contribution toward a future
project and slightly more than forty percent indicated that the community contribution
should be limited to AUD 25. Figure 6.17 presents the willingness to contribute in the
future project.
Figure 6.17 Expected contribution for future project in Liang Butan and Tang Paye
(e) MHS impacts within the community
The existence of the MHS was also reported to have changed social interactions either
within the community or within the households, or both. The impacts, however, were
not seen to be all positive as some reported that the MHS came with some drawbacks.
The respondents were asked about the impacts of the MHS on social cohesion. Fifty
percent of respondents in Tang Paye stated that the MHS had resulted in a decrease in
community interaction. One respondent said that before the MHS had been
constructed, only around 10% of inhabitants had a television and most people would
go to a neighbour’s house to watch television. Now, with affordable electricity from
the MHS, more people have bought television sets. Over the follow-up fieldtrip, it was
0 20 40 60 80
0
AUD 1-15
AUD 16 -30
AUD 31-45
AUD 46 - 60
AUD 61 - 85
>AUD 85
Percentage of respondents (%)
Liang Butan
Tang Paye
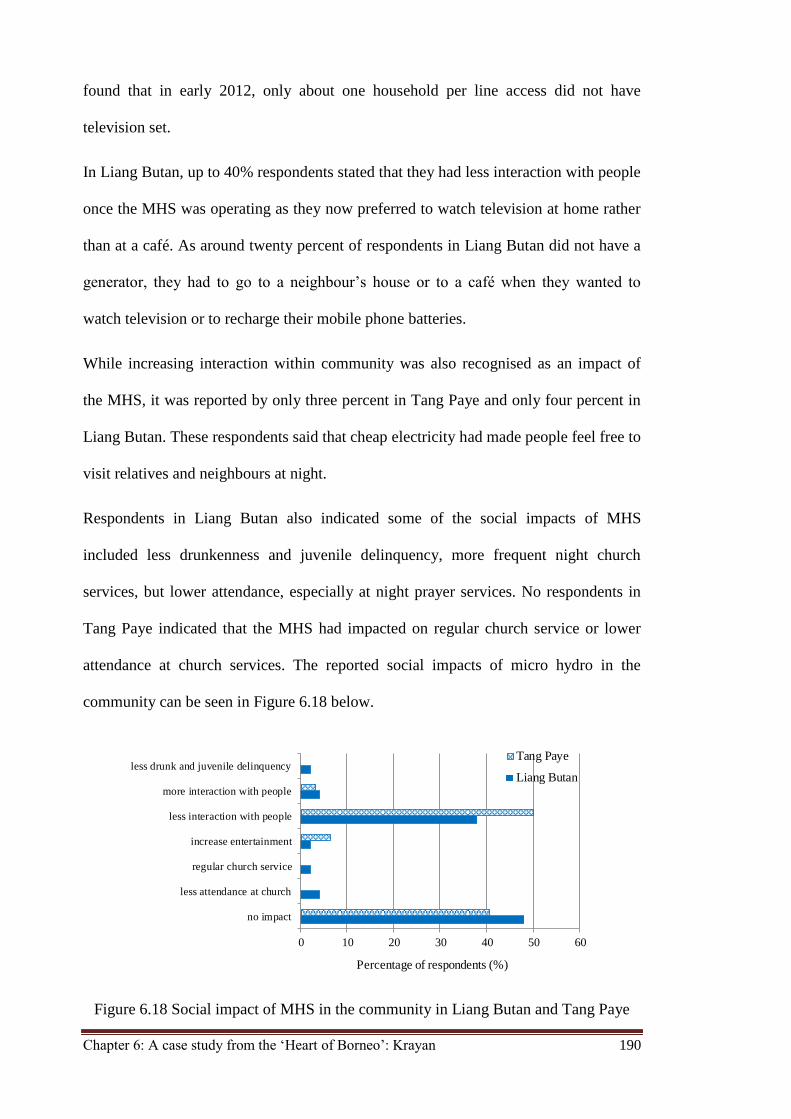
Chapter 6: A case study from the ‘Heart of Borneo’: Krayan 190
found that in early 2012, only about one household per line access did not have
television set.
In Liang Butan, up to 40% respondents stated that they had less interaction with people
once the MHS was operating as they now preferred to watch television at home rather
than at a café. As around twenty percent of respondents in Liang Butan did not have a
generator, they had to go to a neighbour’s house or to a café when they wanted to
watch television or to recharge their mobile phone batteries.
While increasing interaction within community was also recognised as an impact of
the MHS, it was reported by only three percent in Tang Paye and only four percent in
Liang Butan. These respondents said that cheap electricity had made people feel free to
visit relatives and neighbours at night.
Respondents in Liang Butan also indicated some of the social impacts of MHS
included less drunkenness and juvenile delinquency, more frequent night church
services, but lower attendance, especially at night prayer services. No respondents in
Tang Paye indicated that the MHS had impacted on regular church service or lower
attendance at church services. The reported social impacts of micro hydro in the
community can be seen in Figure 6.18 below.
Figure 6.18 Social impact of MHS in the community in Liang Butan and Tang Paye
0 10 20 30 40 50 60
no impact
less attendance at church
regular church service
increase entertainment
less interaction with people
more interaction with people
less drunk and juvenile delinquency
Percentage of respondents (%)
Tang Paye
Liang Butan
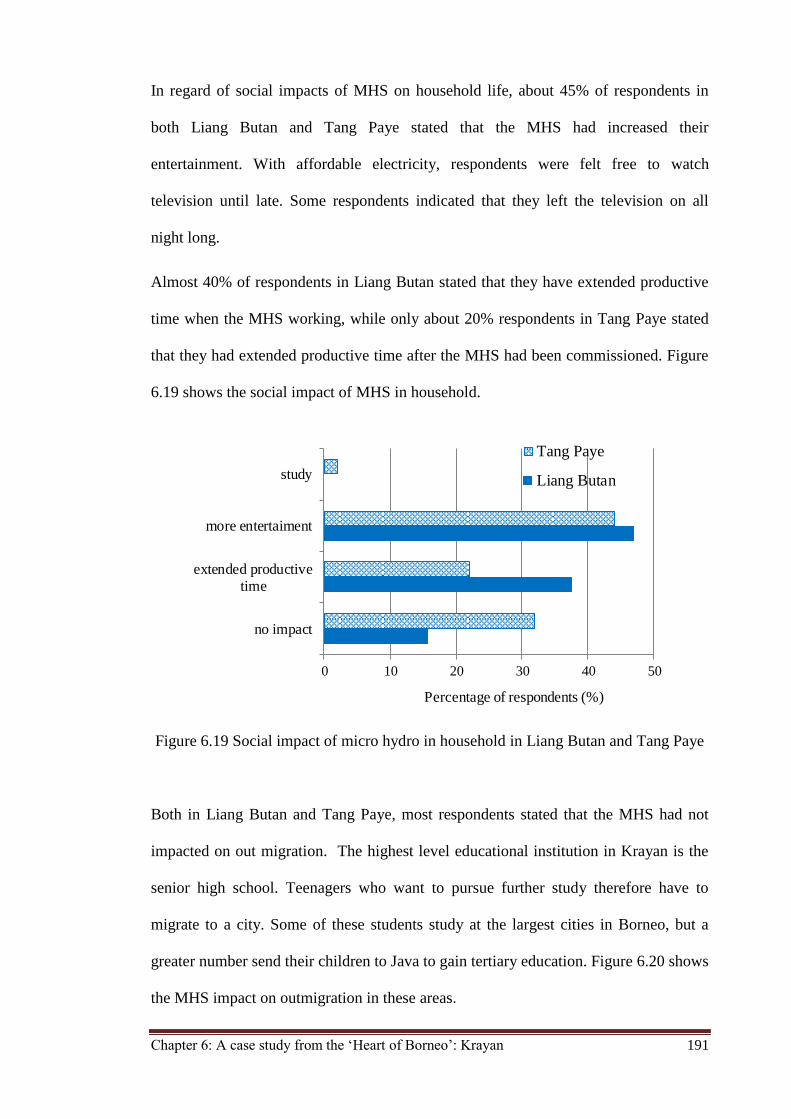
Chapter 6: A case study from the ‘Heart of Borneo’: Krayan 191
In regard of social impacts of MHS on household life, about 45% of respondents in
both Liang Butan and Tang Paye stated that the MHS had increased their
entertainment. With affordable electricity, respondents were felt free to watch
television until late. Some respondents indicated that they left the television on all
night long.
Almost 40% of respondents in Liang Butan stated that they have extended productive
time when the MHS working, while only about 20% respondents in Tang Paye stated
that they had extended productive time after the MHS had been commissioned. Figure
6.19 shows the social impact of MHS in household.
Figure 6.19 Social impact of micro hydro in household in Liang Butan and Tang Paye
Both in Liang Butan and Tang Paye, most respondents stated that the MHS had not
impacted on out migration. The highest level educational institution in Krayan is the
senior high school. Teenagers who want to pursue further study therefore have to
migrate to a city. Some of these students study at the largest cities in Borneo, but a
greater number send their children to Java to gain tertiary education. Figure 6.20 shows
the MHS impact on outmigration in these areas.
0 10 20 30 40 50
no impact
extended productivetime
more entertaiment
study
Percentage of respondents (%)
Tang Paye
Liang Butan
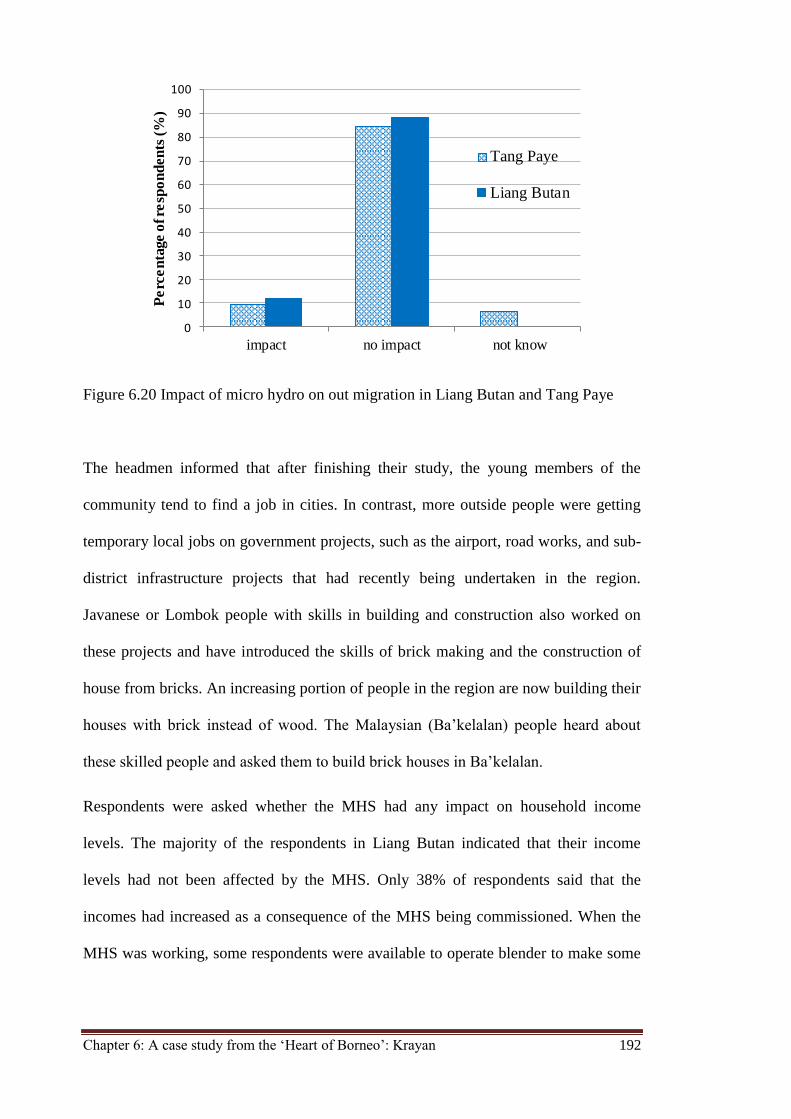
Chapter 6: A case study from the ‘Heart of Borneo’: Krayan 192
Figure 6.20 Impact of micro hydro on out migration in Liang Butan and Tang Paye
The headmen informed that after finishing their study, the young members of the
community tend to find a job in cities. In contrast, more outside people were getting
temporary local jobs on government projects, such as the airport, road works, and sub-
district infrastructure projects that had recently being undertaken in the region.
Javanese or Lombok people with skills in building and construction also worked on
these projects and have introduced the skills of brick making and the construction of
house from bricks. An increasing portion of people in the region are now building their
houses with brick instead of wood. The Malaysian (Ba’kelalan) people heard about
these skilled people and asked them to build brick houses in Ba’kelalan.
Respondents were asked whether the MHS had any impact on household income
levels. The majority of the respondents in Liang Butan indicated that their income
levels had not been affected by the MHS. Only 38% of respondents said that the
incomes had increased as a consequence of the MHS being commissioned. When the
MHS was working, some respondents were available to operate blender to make some
0
10
20
30
40
50
60
70
80
90
100
impact no impact not know
Pe
rce
nta
ge o
f re
spo
nd
en
ts (
%)
Tang Paye
Liang Butan
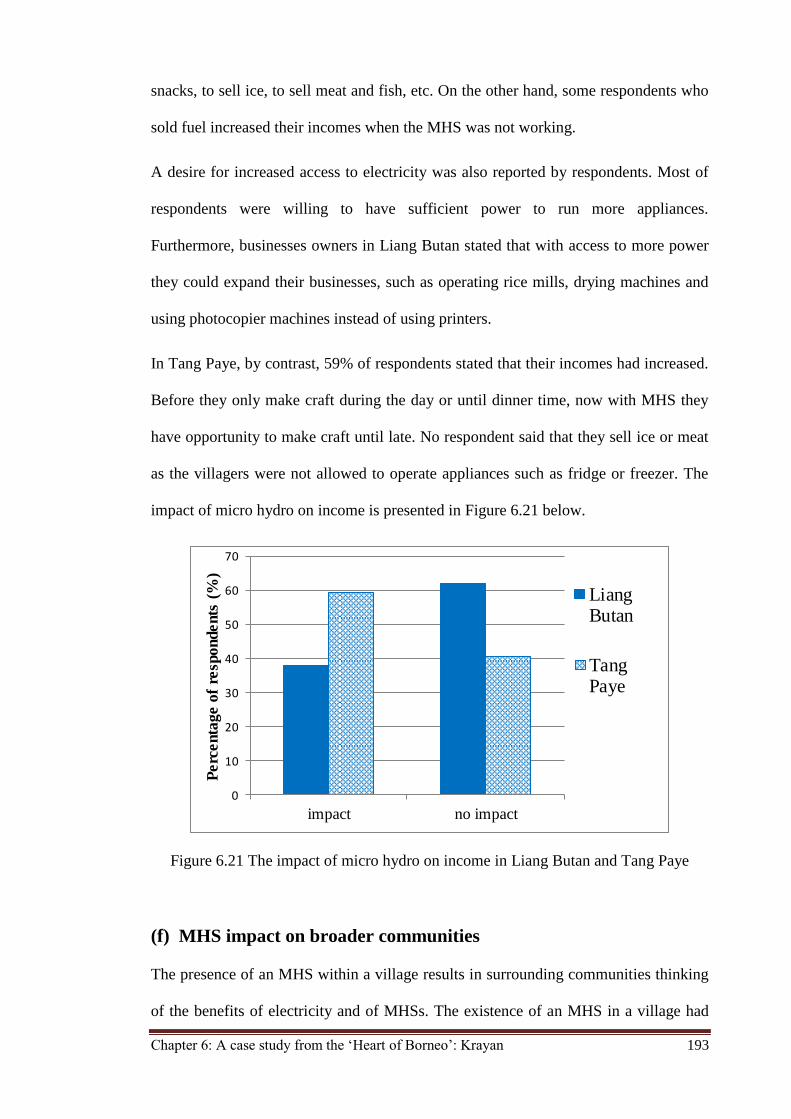
Chapter 6: A case study from the ‘Heart of Borneo’: Krayan 193
snacks, to sell ice, to sell meat and fish, etc. On the other hand, some respondents who
sold fuel increased their incomes when the MHS was not working.
A desire for increased access to electricity was also reported by respondents. Most of
respondents were willing to have sufficient power to run more appliances.
Furthermore, businesses owners in Liang Butan stated that with access to more power
they could expand their businesses, such as operating rice mills, drying machines and
using photocopier machines instead of using printers.
In Tang Paye, by contrast, 59% of respondents stated that their incomes had increased.
Before they only make craft during the day or until dinner time, now with MHS they
have opportunity to make craft until late. No respondent said that they sell ice or meat
as the villagers were not allowed to operate appliances such as fridge or freezer. The
impact of micro hydro on income is presented in Figure 6.21 below.
Figure 6.21 The impact of micro hydro on income in Liang Butan and Tang Paye
(f) MHS impact on broader communities
The presence of an MHS within a village results in surrounding communities thinking
of the benefits of electricity and of MHSs. The existence of an MHS in a village had
0
10
20
30
40
50
60
70
impact no impact
Perc
enta
ge o
f re
spondents
(%
)
LiangButan
TangPaye
Chapter 6: A case study from the ‘Heart of Borneo’: Krayan 194
not attracted people to move to that village, but did lead to them thinking about having
an MHS for their own village. This was demonstrated by the fact that every village in
the Krayan sub-district that has hydro potential has put forward a proposal for a MHS
project through the PNPM. However , one respondent regretted that a village that has
about 20 kW potential could not propose a MHS project through PNPM as the cost of
a 20 kW MHS will be more than IDR 350K , the maximum budget of PNPM project.
In another case, a village with about only 4 kW MHS potential proposed a 7.5 kW
capacity in order to take the maximum budget. The background of this decision was
that people thought that it would be better to have larger MHS to get more electricity.
Unfortunately, the 7.5 kW did not work well due to lack of water resources.
In villages without any appropriate hydro potential to electrify the whole villages, there
was a person or a group who persisted in attempting to harness the hydro potential
privately. For those schemes they could not apply for any funding support and needed
to invest their own money. The community did not see any harm as long as they did
not use all of the available water. As an example of this, a villager in Buduk Tumuh
spent around IDR 30 million (AUD 3,529) to build a 2 kW MHS. In Liang Tuer, a
group of 21 people spent around IDR 60 million (AUD 7,059) setting up a 3 kW MHS.
However, as these two systems were categorised as pico hydro systems, neither system
is included in the list of MHS in Krayan sub-district (Table 4.12).
Villages without any hydro potential have tried to utilise other renewable energy
sources for rural electrification. Solar panels have been looked as an alternative and
according to the Government respondent, implementing a solar panel program is easier
than an MHS project as it does not require as much consideration as an MHS. Based
on the available annual budget, the national government delegates funds to the
provinces, which then grant a number of SHS programs. The provincial government
Chapter 6: A case study from the ‘Heart of Borneo’: Krayan 195
then distributes the SHSs to needed regencies based on the electrification rate per
regency in the province. In the Regency Government’s fairness point of view, it is
better to spread out the units to as many villages as possible rather than concentrating
the grant to only a few villages. The first three units in the first year were given to
headman, secretary and treasurer in every village and several units in the next year
were given to government staffs. The grants in the coming year will be distributed to
villagers. Some constraints have been identified by respondents.
A Government respondent reported that an interesting finding was that a village was
refused an SHS grant on the grounds that not enough to be provided to all villagers at a
time. The reason, however, was that the villagers had agreed that the first units should
be given to the village committee members and government staff, but found it hard to
reach agreement on who (villagers) should receive the SHS units in the future. For the
villagers it was hard to decide who would get a SHS in the first round and who would
get one later.
The other problem was lack of sense of ownership. A case of selling the SHS unit by
the household recipient was reported. The householder treated the SHS as a
consumable item, which the government will replace. Lack of maintenance, especially
for the batteries, was also identified. And when the batteries needed to be replaced, the
villagers could not afford to replace them and as a consequence the SHS sat unused.
In general, household respondents expressed their willingness to have increased access
to electricity and pointed out that there is a river that should be enough to electrify the
entire Bawan Valley and perhaps even to export excess power to Ba’kelalan. The
enthusiasm to export excess electricity derives from the fact that it would strengthen
their bargaining power with the people in Ba’kelalan with whom they are reliant for
trade. Due to their isolation, the people in Krayan can only sell their rice to Ba’kelalan
Chapter 6: A case study from the ‘Heart of Borneo’: Krayan 196
and they have to buy most of their commodities from Ba’kelalan. As the result, the
price of goods is determined by traders in Ba’kelalan and consumers in Krayan are
forced to accept the terms of trade. An actual example of this occurred at the time of
the preliminary fieldtrip. The MHS in Buduk Nur was not working, while across the
border, the Romayo I MHS was working. Over the course of this research project, the
situation was reversed. The Romayo I MHS was not working, but the MHS in Buduk
Nur had been fixed and was working. This impacted on the trade of fuel. As the fuel
demand increased in Krayan, the Ba’kelalan traders increased the price almost 250%.
The existence of the MHS also led to benchmarking. Understanding the MHS
maintenance issues, especially those related to the bearings and belts, those involved in
the PNPM project applied in 2011 for a compact type of turbine that had been
successfully used in the MHSs in Ba’kelalan. A resource assessment was undertaken
by the local community members and a turbine order was placed through the O&M
personnel who look after one of the MHSs in Ba’kelalan. The system design was made
by the local community. Unfortunately, all three of those MHS were not working
properly due to a design fault (this is discussed further in section 7.6.1).
Another finding from the survey revealed another aspect to the successful of MHS.
Based on experience, even though the same procedure was applied, the outcomes
varied from one area to another. According to Government respondent, the rule of
thumb has become that the success of an MHS project depends on the community’s
ethnicity. The government respondent argument was that each ethnic group has its own
value, culture and and way of working together and this can impact on the success of
running an MHS project.
Chapter 6: A case study from the ‘Heart of Borneo’: Krayan 197
6.4 Summary
The implementation of both MHSs in the case study used different approaches. The
government adopted a top-down approach for the Romayo I MHS, while community-
based project in Tang Paye adopted a bottom-up approach. As the result, the planning,
installation, and operation and maintenance, as well as stakeholders and their roles, in
the two case studies differed.
The design of an MHS is very important. The design should be based on long-term
river flow rate data, but in both cases such data were not available. Instead, the
capacities of the MHSs were estimated by using spot readings, which meant that the
estimates of the MHS output over a full year were highly unreliable.
Both MHSs were designed on the basis of the estimated available hydro potential and
on the basis that the power would be distributed equally to the end users. This proved
to be an effective approach where the number of households served was small (Tang
Paye), as it reduced their energy costs and at the same time helped the community to
earn extra income. The cost of electricity from the micro hydro system proved to be
cheaper than the electricity produced from diesel/petrol generators and the light
cheaper than lighting provided by using kerosene lamps. Tang Paye villagers pay only
IDR 30,000 (AUD 3.75) per month to have access to electricity for half a day,
compared to Liang Butan villagers who pay IDR 1.4 million (AUD 160 ) per month to
enjoy 6 hours electricity per day. Although the power supply depends on the water
availability and reduced water levels cause disruptions to supply, the villagers have
found that electricity from the MHS is preferable.
The most critical issue for the Romayo I MHS project was load management. This is
not a technical problem, as two strategies (current limit device and clustering) to limit
electricity access per household have been applied. This unsolved load management
Chapter 6: A case study from the ‘Heart of Borneo’: Krayan 198
problem indicated that there was another factor involved - a social factor that led to
non-conforming behaviour such as bypassing the limit devices. A load management
problem was not found to exist in Tang Paye. Recognising that the supply of power
was limited, current limit devices were fitted to all households with the support of
strong leadership and the regulation was pretty much a success in terms of keeping the
supply and demand in balance.
The decision to run the MHS during the night time only and let the river flow untapped
during the day indicated that the communities in both case studies did not have the
knowledge and were not sufficiently informed about how an MHS works and how
matching load with the supply is important in order to keep the system work
efficiently.
The operation and maintenance of an MHS is an important factor to be considered in
designing an MHS, and operator safety also needs to be taken into account. The survey
showed that providing O&M training to increase capacity building in the community
helps in reducing the cost and maintenance time. The high rate of turnover of
maintenance staff personnel who are poorly paid and see better opportunities to earn
money elsewhere may lead to poor maintenance.
The availability of relatively low cost electricity from the MHS has led to some social
interaction changes at both the community and household levels. Not all impacts were
regarded by the villagers as being positive as some respondents claimed that the
installation of the MHS had resulted in some social drawbacks.
The projects have had impacts in terms of creating opportunities to earn additional
income. Clear reliable light at night has enabled people in Tang Paye to do handicraft
work, while in Liang Butan people benefit from using appliances, such as blenders and
freezers powered by electricity supplied from the micro hydro system.

Chapter 6: A case study from the ‘Heart of Borneo’: Krayan 199
Local culture, including cultural values and social structure, varies from one
community to another and is linked with ethnicity. These factors have an impacton the
way communities form a local organisation with the primary responsibility of running
the O&M and handle any problems that may occur. Therefore the MHS management
may differ from one site to another to suit the local/community.

Chapter 6: A case study from the ‘Heart of Borneo’: Krayan 200

201
PART III:
DISCUSSION AND CONCLUSION
Chapter 7: Discussion
Chapter 8: Summary and conclusion

202
Chapter 7: Discussion 203
Chapter 7
Discussion
Overview
This chapter contains an in-depth discussion on the findings from the case studies of
the border villages in Ba’kelalan and Krayan. That discussion leads to a synthesis of
the findings in a form that allows comparison of the case studies to address the first
research question of this thesis. This is followed by identifying the key factors that
need to be considered when implementing a village-scale MHS, which attends to the
second research question. Finally ‘a whole picture’ of MHS implementation is
constructed, thereby addressing the research aim of this thesis.
7.1 Introduction
The questions that led to this study are:
1 What are critical reasons behind the reported lack of success of some rural
electrification projects based on the use of MHSs?
2 What are the key issues that need to be considered and addressed in order to
ensure that rural electrification projects involving the use of MHS are successful?
These questions were distilled into a single research aim:
To obtain a ‘whole picture’ understanding of MHS projects undertaken as rural
electrification projects so as to obtain a better understanding of the factors that
affect the level of success of these MHS projects.
To address these research questions, a conceptual model of an MHS project was
developed that included all of the stages and all of the different aspects or issues
Chapter 7: Discussion 204
associated with an MHS project (see Chapter 2, Section 2.3) in order to provide a
structure for the research. The same structure is now used to discuss the key research
findings. The results are then synthesised in order to address the research questions of
this thesis, i.e. which MHS projects have been the most successful, the reasons for
their success, and the issues that need to be taken into consideration when planning
future MHS projects.
The presentation of this Chapter follows the conceptual model. It begins with a
discussion of the results as they relate to the planning stage in the second section. The
discussion on issues at the implementation stage is presented in section three, followed
by discussion about operation in section four and on evaluation at section five. Section
six presents the cross-case analysis and reconceptualisation of the conceptual model.
Lastly, a ’whole picture’ of MHS implementation is presented in section seven.
7.2 Policy and design
One of the findings from the literature review was that project planning and design are
commonly regarded as being of critical importance to the success of renewable energy
rural electrification programs (Khwaja, 2009; Urmee, 2009). In the case of MHS
projects, this translates into a need for accurate and reliable assessments of the
hydrological resources, a good understanding of loads and patterns of electricity use so
that supply and demand can be balanced, a process for determining who needs to be
involved and their roles, and the need to be well informed about all relevant
government policies.
7.2.1 Hydro resource assessment
When designing an MHS, it is crucial that the capacity be designed on the basis of
accurate measurements of the available resource. This requires reliable and accurate
Chapter 7: Discussion 205
hydrological data information (river flow rates and variation). A lack of accurate flow
rate data will result in poor decision making and can result in an MHS project
incurring financial losses (Odiyo et al., 2012). The results of the case study surveys,
however, found that in each case the MHS size or capacity was determined on the
basis of spot readings only, and long-term resource data was not available in either the
Malaysian or the Indonesian case studies. Spot readings were taken using a simple
method to measure flow rates, either timing how long it took to fill a bucket or timing
the distance travelled by a floating object. As a consequence of the combination of the
use of spot readings and a relatively inaccurate method to calculate river flow rates as
the basis for determining the size of the MHS in the design stage, the MHSs were
unable to supply constant power, especially during the dry season.
Minimum flow rates over a year and a reliable flow measurement method as advocated
by the European Small Hydropower Association (ESHA)(2004) were not used. Nor
were seasonal variations over many years as suggested by Kaldellis et al. (2005) or
even over a single year as suggested by the European Small Hydropower Association
(2004). The reason for this was simply that such reliable long-term data did not exist.
This finding is in fact, not surprising given that such data is not easy to obtain
(Mohibullah et al., 2004), and this is particularly true in remote areas in developing
countries. The survey results indicated that neither government agencies nor the
private companies involved in planning the MHS in Ba’kelalan and Krayan had access
to any long-term flow rate data in either Ba’kelalan or Krayan as these rivers are
ungauged. While other methods, such as using regional flow duration curves based on
data from the nearest gauged river in the region as recommended by two studies (Viola
et al., 2010; Castellarin et al., 2004), could perhaps have been used, it is likely that
Chapter 7: Discussion 206
these projects were deemed to be too small to warrant the additional effort and
resources required to do so.
The fact that reliable long-term data for rural areas in developing countries is often
unavailable to MHS project developers was demonstrated in this study. Over the
period of the study, the only long-term rainfall data that could be obtained was for a 6-
year period for Ba’kelalan (refer to Figure 5.10 and 5.11). Furthermore, the required
supporting data, such as slope and catchment size, evaporation, temperature and soil
texture and structure, needed to estimate the runoff based on the rainfall data (NRCS,
2004) was not available.
The ranges in mean monthly rainfall recorded in Ba’kelalan are very large. Sizing an
MHS on the basis of the lowest rainfall/run-off would result in the MHS being quite
small. What is clear from this data is that it cannot be used to predict river flow rates in
any particular month and, secondly, that there is significant variability between years
and between months in different years.
The most important thing that this data tells is that rainfall in the area is quite variable
(refer to Figure 5.11). Rainfall may be becoming even less predictable, which will
make the planning of micro hydro systems even more difficult. According to the
anecdotal information provided by respondents, the weather patterns and rainfall
seasons have been becoming less predictable. To some extent this is borne out by the
recorded rainfall data, although it is also not clear how predictable rainfall was prior to
2004.
A second observation drawn from the case studies is that in none of the cases was
climate change and possible long-term changes in river flows considered in the
planning and design stages.
The three crucial components required for a successful hydro resource assessment are:
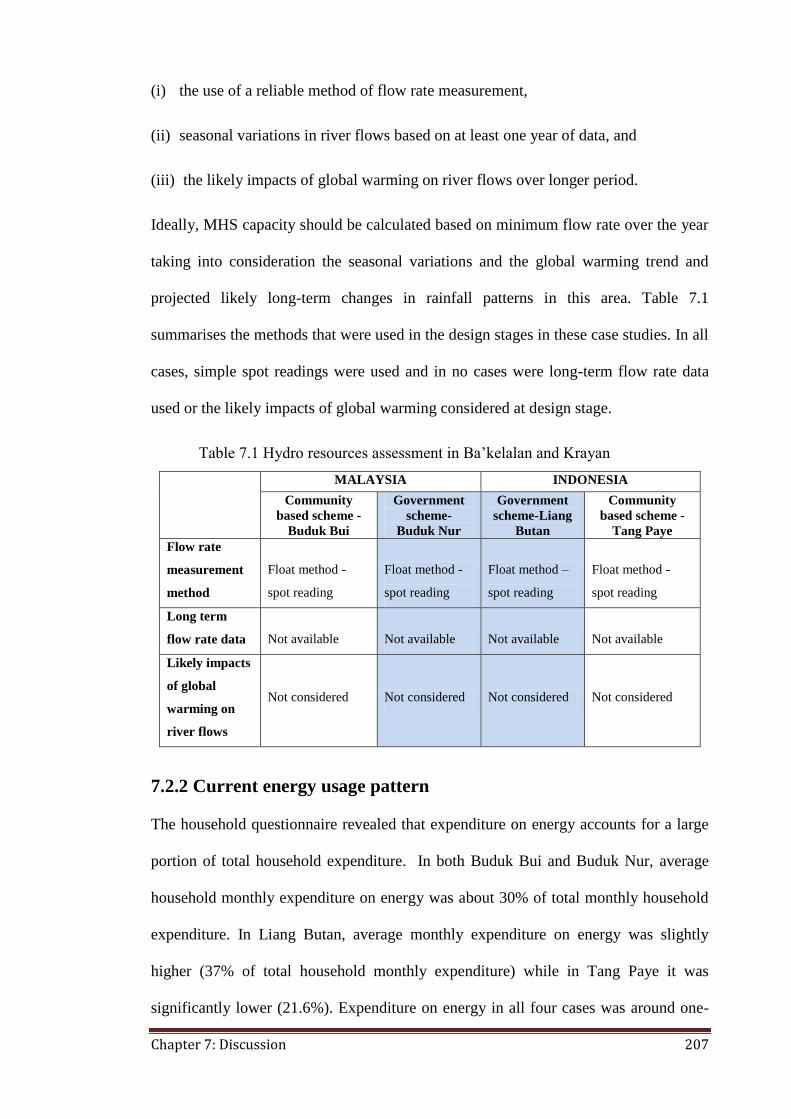
Chapter 7: Discussion 207
(i) the use of a reliable method of flow rate measurement,
(ii) seasonal variations in river flows based on at least one year of data, and
(iii) the likely impacts of global warming on river flows over longer period.
Ideally, MHS capacity should be calculated based on minimum flow rate over the year
taking into consideration the seasonal variations and the global warming trend and
projected likely long-term changes in rainfall patterns in this area. Table 7.1
summarises the methods that were used in the design stages in these case studies. In all
cases, simple spot readings were used and in no cases were long-term flow rate data
used or the likely impacts of global warming considered at design stage.
Table 7.1 Hydro resources assessment in Ba’kelalan and Krayan
MALAYSIA INDONESIA
Community
based scheme -
Buduk Bui
Government
scheme-
Buduk Nur
Government
scheme-Liang
Butan
Community
based scheme -
Tang Paye Flow rate
measurement
method
Float method -
spot reading
Float method -
spot reading
Float method –
spot reading
Float method -
spot reading
Long term
flow rate data Not available Not available Not available Not available
Likely impacts
of global
warming on
river flows
Not considered Not considered Not considered Not considered
7.2.2 Current energy usage pattern
The household questionnaire revealed that expenditure on energy accounts for a large
portion of total household expenditure. In both Buduk Bui and Buduk Nur, average
household monthly expenditure on energy was about 30% of total monthly household
expenditure. In Liang Butan, average monthly expenditure on energy was slightly
higher (37% of total household monthly expenditure) while in Tang Paye it was
significantly lower (21.6%). Expenditure on energy in all four cases was around one-
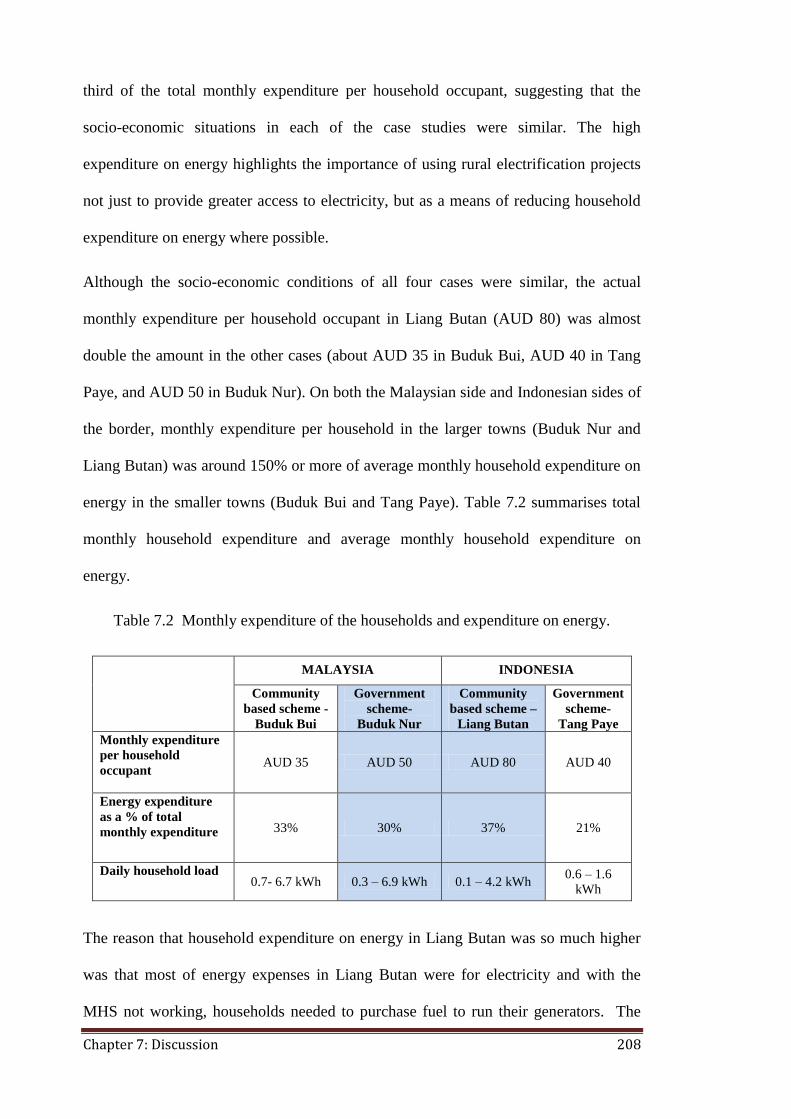
Chapter 7: Discussion 208
third of the total monthly expenditure per household occupant, suggesting that the
socio-economic situations in each of the case studies were similar. The high
expenditure on energy highlights the importance of using rural electrification projects
not just to provide greater access to electricity, but as a means of reducing household
expenditure on energy where possible.
Although the socio-economic conditions of all four cases were similar, the actual
monthly expenditure per household occupant in Liang Butan (AUD 80) was almost
double the amount in the other cases (about AUD 35 in Buduk Bui, AUD 40 in Tang
Paye, and AUD 50 in Buduk Nur). On both the Malaysian side and Indonesian sides of
the border, monthly expenditure per household in the larger towns (Buduk Nur and
Liang Butan) was around 150% or more of average monthly household expenditure on
energy in the smaller towns (Buduk Bui and Tang Paye). Table 7.2 summarises total
monthly household expenditure and average monthly household expenditure on
energy.
Table 7.2 Monthly expenditure of the households and expenditure on energy.
MALAYSIA INDONESIA
Community
based scheme -
Buduk Bui
Government
scheme-
Buduk Nur
Community
based scheme –
Liang Butan
Government
scheme-
Tang Paye
Monthly expenditure
per household
occupant AUD 35 AUD 50 AUD 80 AUD 40
Energy expenditure
as a % of total
monthly expenditure 33% 30% 37% 21%
Daily household load 0.7- 6.7 kWh 0.3 – 6.9 kWh 0.1 – 4.2 kWh
0.6 – 1.6
kWh
The reason that household expenditure on energy in Liang Butan was so much higher
was that most of energy expenses in Liang Butan were for electricity and with the
MHS not working, households needed to purchase fuel to run their generators. The
Chapter 7: Discussion 209
cost of firewood also was a factor in explaining the high household energy expenditure
in Liang Butan. Many of the inhabitants in Liang Butan have migrated there from other
villages or other districts and do not own farmland in Liang Butan. As a result, they
need to buy wood for cooking, while the inhabitants in the other three case study
villages were originally from the villages and so are able to obtain firewood at no cost.
The appliances found to be commonly used in a household in all case study villages
were lights, a television, a washing machine, a refrigerator, a freezer, a computer, a
rice cooker and an iron. In Buduk Bui and Buduk Nur, daily household loads ranged
from 0.7 to 6.7 kWh and from 0.3 to 6.9 kWh, respectively, while in Liang Butan daily
household load ranged from 0.1 to 4.2 kWh and from 0.6 to 1.6 kWh in Tang Paye.
The reason for the higher electricity consumption in the two villages on the Malaysian
side of the border was that those two MHSs operate for 24 hours per day, while on the
Indonesian side the MHSs are operated for only 14 hours per day (during the evening
and night). The regulatory mechanism used to limit household daily loads in Tang
Paye was quite successful and, in addition to the limited hours of operation of the
MHS, is a reason that maximum daily household consumption is less than 2 kWh.
7.2.3 Electricity demand
The assumption used in designing all of the MHSs was that a typical household load is
220 watts. This assumes that a typical load comprised of five 20 W (energy saving)
lights and a 120 W television set. Note that in some households the load may increase
to e.g 370 W if a 150 W freezer is operated during the day time. The actual power
supplied per household in three of the village case studies was lower than this “typical”
assumed load, while in Buduk Bui the actual load was higher than the assumed typical
load (Table 7.3).
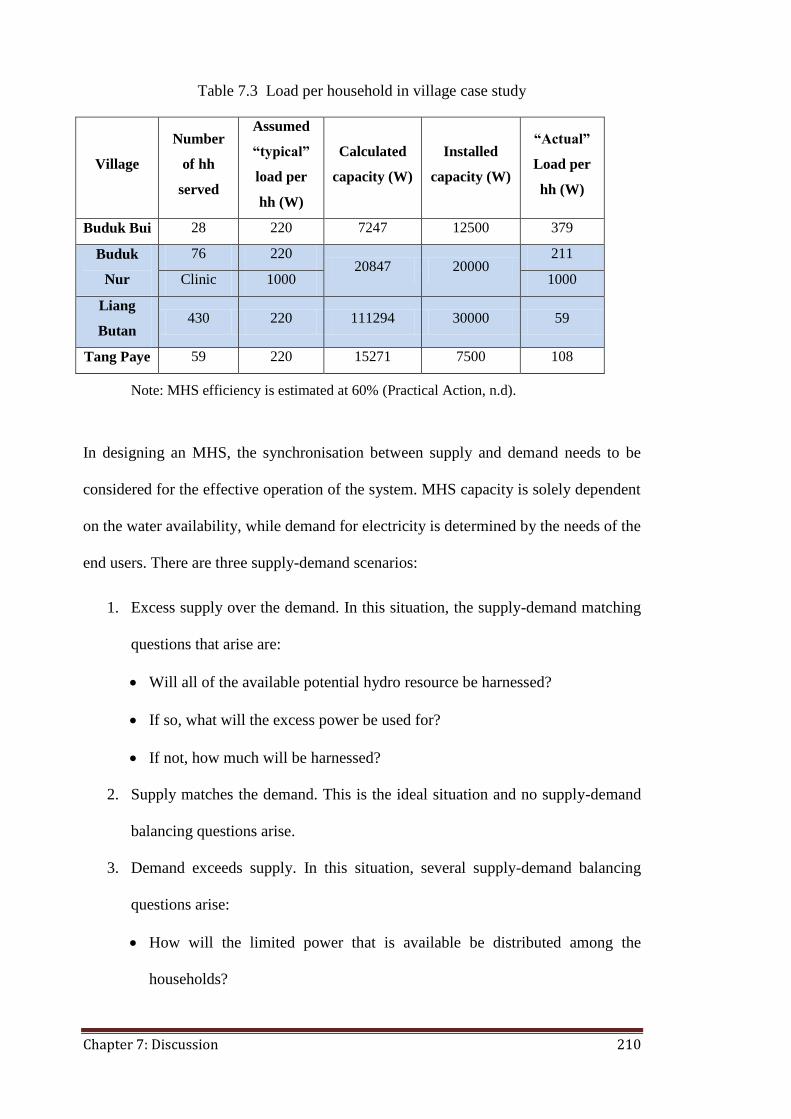
Chapter 7: Discussion 210
Table 7.3 Load per household in village case study
Village
Number
of hh
served
Assumed
“typical”
load per
hh (W)
Calculated
capacity (W)
Installed
capacity (W)
“Actual”
Load per
hh (W)
Buduk Bui 28 220 7247 12500 379
Buduk
Nur
76 220 20847 20000
211
Clinic 1000 1000
Liang
Butan 430 220 111294 30000 59
Tang Paye 59 220 15271 7500 108
Note: MHS efficiency is estimated at 60% (Practical Action, n.d).
In designing an MHS, the synchronisation between supply and demand needs to be
considered for the effective operation of the system. MHS capacity is solely dependent
on the water availability, while demand for electricity is determined by the needs of the
end users. There are three supply-demand scenarios:
1. Excess supply over the demand. In this situation, the supply-demand matching
questions that arise are:
· Will all of the available potential hydro resource be harnessed?
· If so, what will the excess power be used for?
· If not, how much will be harnessed?
2. Supply matches the demand. This is the ideal situation and no supply-demand
balancing questions arise.
3. Demand exceeds supply. In this situation, several supply-demand balancing
questions arise:
· How will the limited power that is available be distributed among the
households?
Chapter 7: Discussion 211
· Will the load be distributed equally (all households have the same load) or
will household demand be determined on the ability to pay or some other
factors?
· If the power is rationed, what method or mechanism will be used to ensure
that each household uses only the amount of power allocated?
The Buduk Bui MHS is the only one of the four MHSs that falls into the excess supply
category. In that case, the full potential resource (see Table 5.3) has been harnessed but
without clear planning as to how or for what purposes the excess power would be used.
This is in contrast to the step by step development suggested by Otaki for a project in
Vietnam in order to minimise MHS idle capacity (Otaki, 2003). In all of the other three
cases (Buduk Nur, Liang Butan and Tang Paye) demand exceeds supply. In Buduk Nur
and Liang Butan, the power was planned to be distributed equally, while the
distribution arrangement in Tang Paye relied on the committee setting different
maximum demand points for each household.
It was found from the field survey that the sizing of the MHSs in the Buduk Nur and
Liang Butan case studies was not determined on the basis of technical considerations
only (i.e. based on the available hydrological resources), but also on the basis of social
factors (i.e. based on the community’s request). In the Buduk Nur case study, the MHS
capacity was initially designed as a 7.5 kW system, but in order to fulfil the
community’s request for greater access to electricity for the lokasi, the system was
upgraded to 20 kW. Field observations confirmed that the actual performance as
measured during the study, however, dropped to around just 3 kW during the dry
months (Table 5.2) and even in the wet season was able to supply around only 14 kW
(Figure 5.16). Sizing the MHS at 7.5 kW was done to supply reliable power to the
clinic all year round, and was a reasonable design decision. Increasing the design size
Chapter 7: Discussion 212
to 20 kW, however, meant that the system capacity exceeded the available
hydrological resources and that although it had the capacity to achieve that output
during the wet season with a lot of rain, it could not do so in most of the dry season
months.
In the case of Liang Butan, the electricity distribution arrangement also had to be
adjusted as a result of design changes. The initial design aim was to electrify the Long
Bawan lokasi, with around 333 households. As a consequence of including the supply
to other villages in the implementation stage, the total number of households served by
the MHS was increased to 430. This meant that the amount of electricity supplied to
each household had to be adjusted downward and this led to dissatisfaction within the
community. In the cases of Buduk Nur and Liang Butan, the distribution arrangements
were made more complex by the existence of larger end users. In those cases, the
adjustments to system sizing and the consequential adjustments that had to be made to
the distribution arrangements created disappointment and dissatisfaction within both
communities. This finding is in line with that of a study undertaken by Khwaja, which
found that community involvement in MHS technical decision making had a negative
impact on project outcomes as rural communities are relatively lacking in technical
knowledge (Khwaja, 2004; Khwaja, 2005). Oversizing an MHS using a hybrid stand-
alone village power supply system could be one way of managing this, but it would be
difficult to design such a system in which the non-MHS component was able to supply
all of the power requirements in the dry season.
This is particularly so in those situations in which the demand for electricity exceeds
the capacity. In those situations, it is critical that well thought out arrangements for
distributing access to the available electricity are put into place. The Tang Paye case
study indicates that it is possible to do so successfully. Knowing that the available
Chapter 7: Discussion 213
power was far lower than that required to meet the total ‘typical’ demand, a regulation
regarding appliances that were allowed to be operated, including a fine for breaches,
was set up by the MHC and was strictly adhered to and applied. In the case of Buduk
Bui the supply exceeds demand and the use of more electricity than a ‘typical load’ did
not cause problems for the operation of the MHS. Overuse is nonetheless a concern for
the MHC and the lack of planning or control on loads has the potential to create
problems in the future.
7.2.4 Stakeholders
The survey found that the number of stakeholders and their roles in the MHS projects
varied from one case to another and that it was dependent primarily on the nature of
the source of funding for the scheme. In general, the stakeholders included the project
initiator, the government, the funding body, contractors, manufacturers/suppliers, the
community, NGO and the local electricity authorities. It was found that in the case of
government-funded schemes (Buduk Nur and Liang Butan) the stakeholders with the
primary roles were the government and the contractor. In these cases, although the
community was involved, community involvement was limited to consultation and the
community was not involved in the actual decision making process. In both cases the
communities were also involved in the civil works stage. There were, however,
differences between these two government-funded projects in terms of community
involvement. In the case of Buduk Nur, all community members were invited to be
involved in the civil works as volunteers, while in Liang Butan the project was handled
by a contractor and only a small number of community members were involved in the
construction as paid workers.
In the case of the community-based schemes (Buduk Bui and Tang Paye), the
community was not only involved in project funding, but was also involved in the
Chapter 7: Discussion 214
planning stage (e.g. having input into the decision making including which river to
dam and the location of the power house), the implementation stage up until
commissioning, and in operation and maintenance. In these two study cases, however,
the degree of community involvement differed. The community involvement in the
Tang Paye project was more intense than the community involvement in Buduk Bui. In
Tang Paye, the community was even involved in the project proposal stage, including
the preparation of the budget.
Overall, the number, type and roles of stakeholders in the MHS projects varied
according to the nature of the funding scheme. One implication of this is that
differences in project financing and funding lead to dissimilarities in the planning,
implementation and operation and maintenance processes.
In all four case studies, however, the funding covered the activities/equipment up until
the implementation stage. Once commissioned, ownership of the MHS project was
handled over to the community and the operation and maintenance of the MHS in all
case studies became the responsibility of the community itself. Table 7.4 shows the
stakeholder and community involvement in each case study.
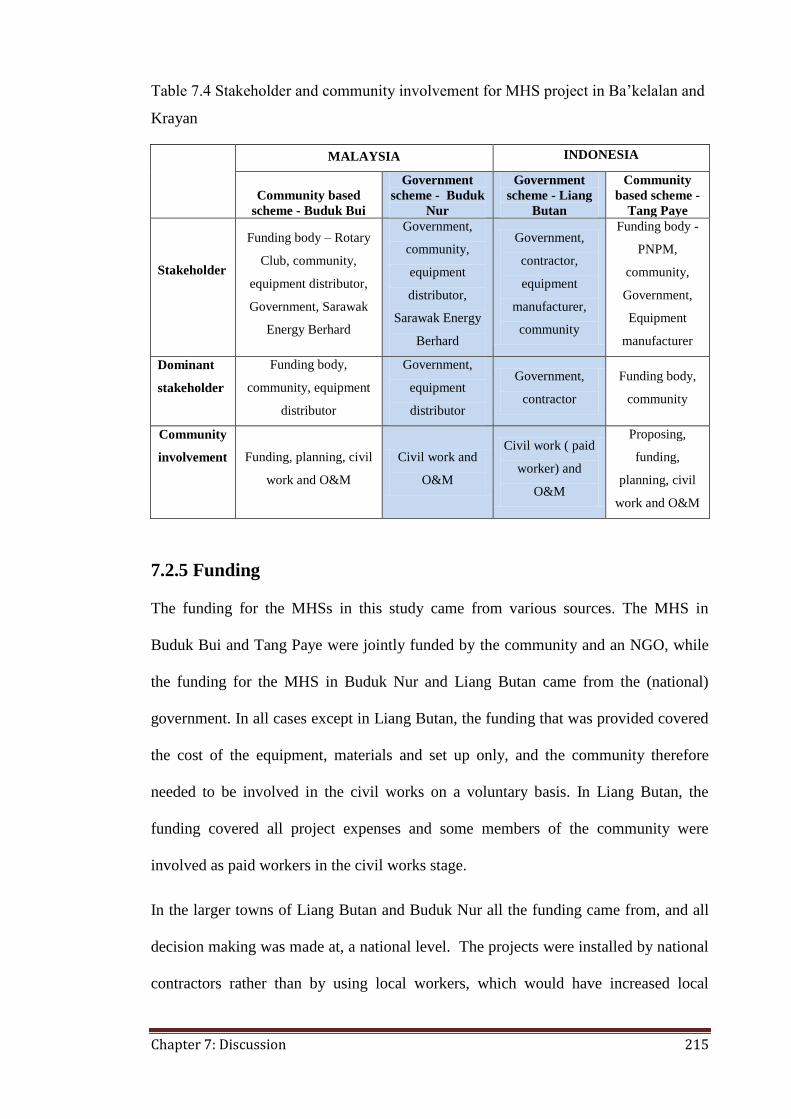
Chapter 7: Discussion 215
Table 7.4 Stakeholder and community involvement for MHS project in Ba’kelalan and
Krayan
MALAYSIA INDONESIA
Community based
scheme - Buduk Bui
Government
scheme - Buduk
Nur
Government
scheme - Liang
Butan
Community
based scheme -
Tang Paye
Stakeholder
Funding body – Rotary
Club, community,
equipment distributor,
Government, Sarawak
Energy Berhard
Government,
community,
equipment
distributor,
Sarawak Energy
Berhard
Government,
contractor,
equipment
manufacturer,
community
Funding body -
PNPM,
community,
Government,
Equipment
manufacturer
Dominant
stakeholder
Funding body,
community, equipment
distributor
Government,
equipment
distributor
Government,
contractor
Funding body,
community
Community
involvement Funding, planning, civil
work and O&M
Civil work and
O&M
Civil work ( paid
worker) and
O&M
Proposing,
funding,
planning, civil
work and O&M
7.2.5 Funding
The funding for the MHSs in this study came from various sources. The MHS in
Buduk Bui and Tang Paye were jointly funded by the community and an NGO, while
the funding for the MHS in Buduk Nur and Liang Butan came from the (national)
government. In all cases except in Liang Butan, the funding that was provided covered
the cost of the equipment, materials and set up only, and the community therefore
needed to be involved in the civil works on a voluntary basis. In Liang Butan, the
funding covered all project expenses and some members of the community were
involved as paid workers in the civil works stage.
In the larger towns of Liang Butan and Buduk Nur all the funding came from, and all
decision making was made at, a national level. The projects were installed by national
contractors rather than by using local workers, which would have increased local
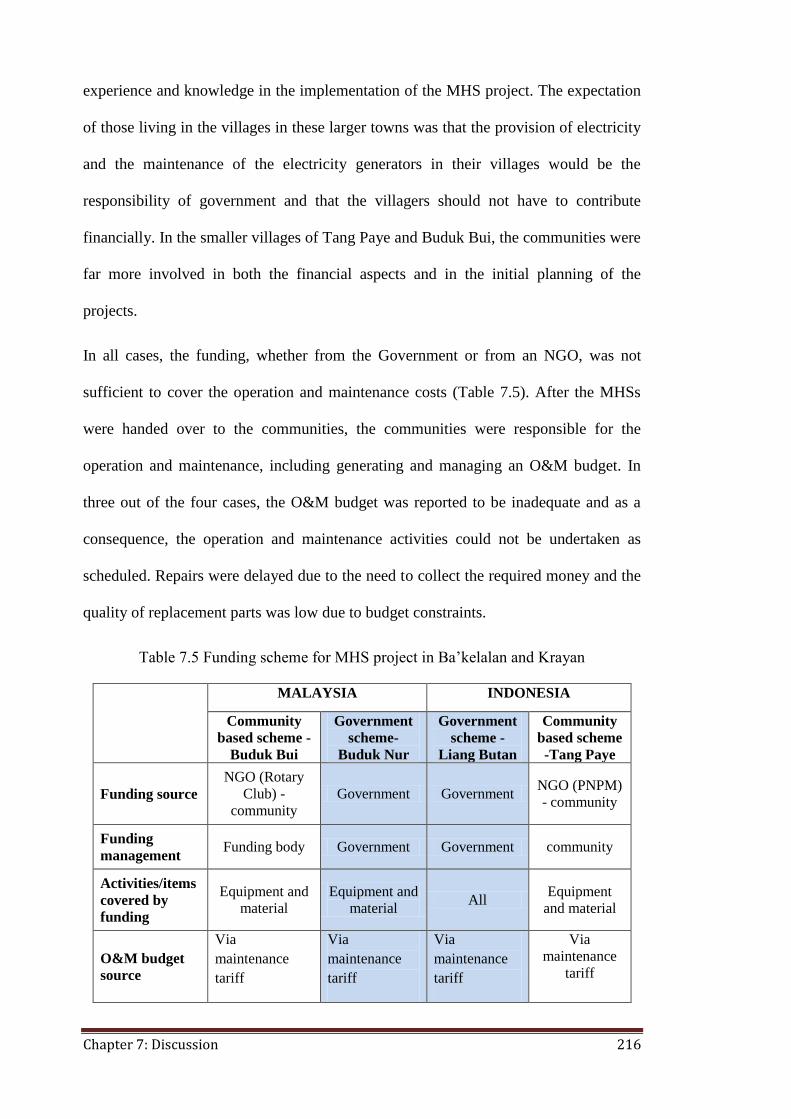
Chapter 7: Discussion 216
experience and knowledge in the implementation of the MHS project. The expectation
of those living in the villages in these larger towns was that the provision of electricity
and the maintenance of the electricity generators in their villages would be the
responsibility of government and that the villagers should not have to contribute
financially. In the smaller villages of Tang Paye and Buduk Bui, the communities were
far more involved in both the financial aspects and in the initial planning of the
projects.
In all cases, the funding, whether from the Government or from an NGO, was not
sufficient to cover the operation and maintenance costs (Table 7.5). After the MHSs
were handed over to the communities, the communities were responsible for the
operation and maintenance, including generating and managing an O&M budget. In
three out of the four cases, the O&M budget was reported to be inadequate and as a
consequence, the operation and maintenance activities could not be undertaken as
scheduled. Repairs were delayed due to the need to collect the required money and the
quality of replacement parts was low due to budget constraints.
Table 7.5 Funding scheme for MHS project in Ba’kelalan and Krayan
MALAYSIA INDONESIA
Community
based scheme -
Buduk Bui
Government
scheme-
Buduk Nur
Government
scheme -
Liang Butan
Community
based scheme
-Tang Paye
Funding source
NGO (Rotary
Club) -
community
Government Government NGO (PNPM)
- community
Funding
management Funding body Government Government community
Activities/items
covered by
funding
Equipment and
material
Equipment and
material All
Equipment
and material
O&M budget
source
Via
maintenance
tariff
Via
maintenance
tariff
Via
maintenance
tariff
Via
maintenance
tariff
Chapter 7: Discussion 217
7.2.6 Government policy
· Malaysia
According to the Malaysian government respondent, the preference of the federal
government of Malaysia (Ministry of Rural Development) is to set up hybrid solar-
diesel power generation projects rather than MHS projects. The reasons for this are
that the use of hybrid power projects is perceived to better enable the installed capacity
of a project to be set to meet the demand (i.e. an end user approach) and to have the
potential for upgrading to meet future growth in demand. Furthermore, to better assure
a reliable service, the federal government policy is to convert responsibility for the
maintenance to the state electricity board and to charge end users as per national
electricity charges.
In the case of Ba’kelalan, the remoteness and the lack of good information channels
has meant that government policy is not implemented. It was found that the villagers in
Buduk Bui and Buduk Nur were not informed of the opportunity to propose rural
electrification projects using hybrid solar-diesel power systems or that end users could
be charged as per the national bill. One of the MHC members in Buduk Nur reported
that he would have preferred such a model in the village having recognised the
difficulty of maintaining a stable supply of electricity over the year and the complexity
of managing the MHS.
The implementation of renewable energy projects in Malaysia seems to be still far
behind the national government’s target. In order to achieve the share of renewable
energy in the Eighth Malaysia Plan and the Ninth Malaysia Plan, the Small Renewable
Energy Power (SREP) Program was introduced. However, a lack of capacity building,
lengthy approval processes, a lack of monitoring, the exclusion of key stakeholders
and a lack of pre-feasibility studies (all factors that have been evidenced in these case
Chapter 7: Discussion 218
studies) are all factors that have contributed to the SREP Program not achieving its
targets (Sovacool and Drupady, 2011). The national target of 500 MW by 2005 for
small-scale renewable electricity was consequently reduced to a 350 MW target by
2010 and still was not achieved, with only 12 MW having been installed by 2005 and
only 61.7 MW by 2010 (Sovacool and Drupady, 2011).
One of the findings from the survey was that the existence of a local government (sub-
district) office in the area has a positive impact on the government role in MHS
implementation. The lack of a local government representative in the case of the
Ba’kelalan projects meant that any governmental matters were required to be
processed in Lawas city. Remoteness and lack of modes of communication (e.g.
mobile phone) also become constraints in terms of a community-government
relationship. The impact on the MHS project in Buduk Nur was that any problem
associated with the Clinic MHS could not be reported promptly.
· Indonesia
One of the important findings from the survey was that the RET program in Indonesia
suffers from weak coordination and linkages, both hierarchically and horizontally. An
example of this was the inability to harness the potential of one river, with an
estimated 15 kW MHS capacity, to supply the village of Lembudud because the
project budget was beyond the PNPM limit, and because negotiations for the project to
be jointly funded by the PNPM and the local government were unsuccessful.
According to the government respondent, however, there have been projects in which
funding has been shared between the national government (the Ministry of
Disadvantaged Areas) and local government. In these cases, the procedure has been for
the Ministry of Disadvantaged Areas to review the total funding available and, if the
project budget is found to be beyond the available funding, a proposal to share funding
Chapter 7: Discussion 219
is sent to the provincial or regency level governments. Unfortunately, however, the
lack of established processes, including laws or ministerial regulations, means that
where this occurs it is undertaken only on a case by case basis rather than as a general
rule or general procedure.
A concern that was raised by Indonesian government respondents, both at the national
and provincial levels, was the difficulty in establishing good inter-governmental level
coordination within or between departments. Regional autonomy was promoted by the
central government of Indonesia in 1999 which gave regions (provinces, regency, and
municipalities) full autonomy to “govern and administer the interest of the local
people’. Chapter II of Law 22/1999 states that regencies no longer have an hierarchical
relationship with the provincial government, but are “authorized to govern and
administer the interest of local people according to their own initiatives based on
people’s aspirations” (Seymour and Turner, 2002). This cut-off hierarchical
relationship within the department, both at the national and provincial levels, is
perceived to make it difficult for the upper government levels to reach their targets or
to execute planning because the policy at the lower government level is sometimes
dissimilar. The power of vertical control has been dismantled, while horizontal
coordination is not yet in place. The main barriers identified by the Sustainable Energy
Regulation Network (SERN) in implementing various energy programs were the
absence of coordinating mechanisms among key government actors in decision
making, an overlapping/unclear division of responsibilities among the institutions and
the decentralisation of some administrative roles (SERN, 2012). The regional
autonomy policy that aims to create decentralisation appears to be as yet far from
being effectively demonstrated.
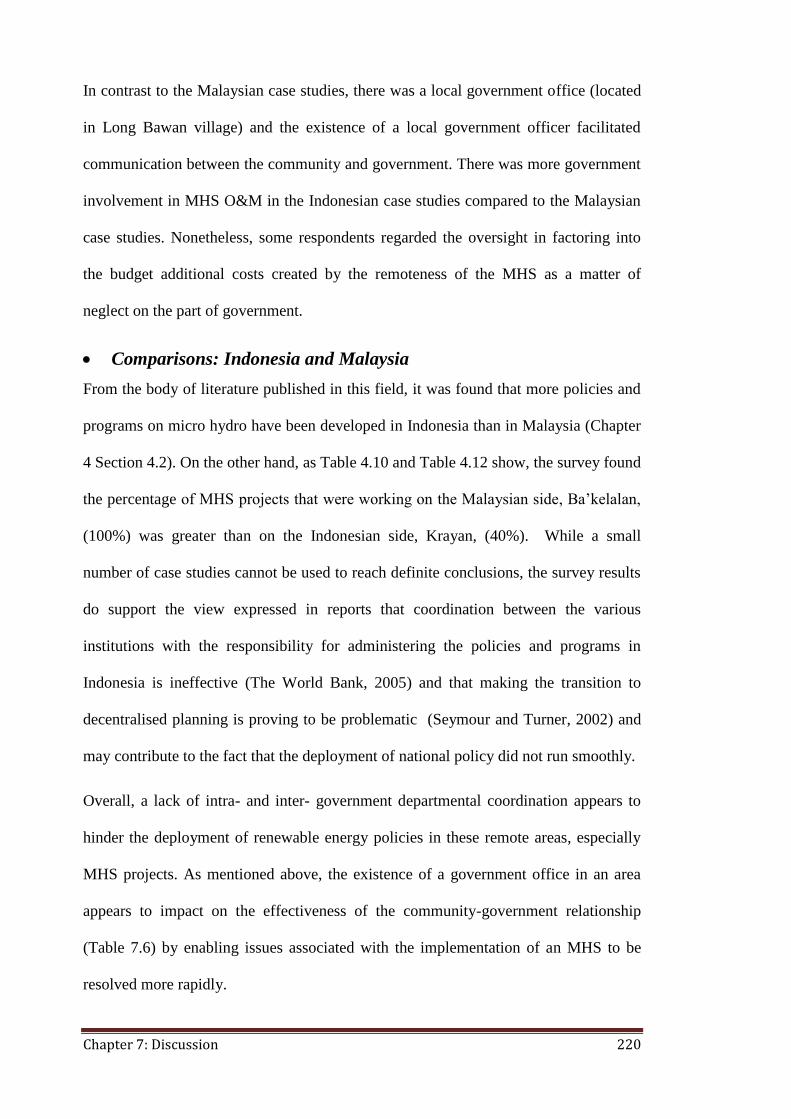
Chapter 7: Discussion 220
In contrast to the Malaysian case studies, there was a local government office (located
in Long Bawan village) and the existence of a local government officer facilitated
communication between the community and government. There was more government
involvement in MHS O&M in the Indonesian case studies compared to the Malaysian
case studies. Nonetheless, some respondents regarded the oversight in factoring into
the budget additional costs created by the remoteness of the MHS as a matter of
neglect on the part of government.
· Comparisons: Indonesia and Malaysia
From the body of literature published in this field, it was found that more policies and
programs on micro hydro have been developed in Indonesia than in Malaysia (Chapter
4 Section 4.2). On the other hand, as Table 4.10 and Table 4.12 show, the survey found
the percentage of MHS projects that were working on the Malaysian side, Ba’kelalan,
(100%) was greater than on the Indonesian side, Krayan, (40%). While a small
number of case studies cannot be used to reach definite conclusions, the survey results
do support the view expressed in reports that coordination between the various
institutions with the responsibility for administering the policies and programs in
Indonesia is ineffective (The World Bank, 2005) and that making the transition to
decentralised planning is proving to be problematic (Seymour and Turner, 2002) and
may contribute to the fact that the deployment of national policy did not run smoothly.
Overall, a lack of intra- and inter- government departmental coordination appears to
hinder the deployment of renewable energy policies in these remote areas, especially
MHS projects. As mentioned above, the existence of a government office in an area
appears to impact on the effectiveness of the community-government relationship
(Table 7.6) by enabling issues associated with the implementation of an MHS to be
resolved more rapidly.
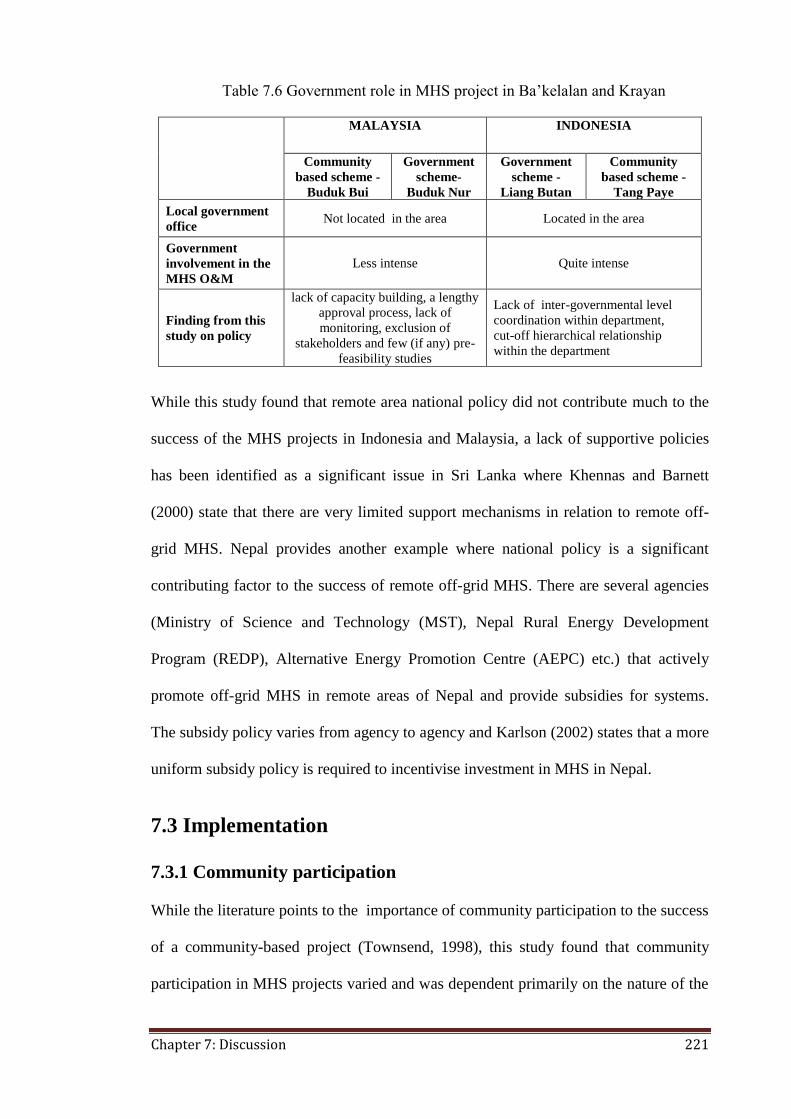
Chapter 7: Discussion 221
Table 7.6 Government role in MHS project in Ba’kelalan and Krayan
MALAYSIA INDONESIA
Community
based scheme -
Buduk Bui
Government
scheme-
Buduk Nur
Government
scheme -
Liang Butan
Community
based scheme -
Tang Paye
Local government
office Not located in the area Located in the area
Government
involvement in the
MHS O&M
Less intense Quite intense
Finding from this
study on policy
lack of capacity building, a lengthy
approval process, lack of
monitoring, exclusion of
stakeholders and few (if any) pre-
feasibility studies
Lack of inter-governmental level
coordination within department,
cut-off hierarchical relationship
within the department
While this study found that remote area national policy did not contribute much to the
success of the MHS projects in Indonesia and Malaysia, a lack of supportive policies
has been identified as a significant issue in Sri Lanka where Khennas and Barnett
(2000) state that there are very limited support mechanisms in relation to remote off-
grid MHS. Nepal provides another example where national policy is a significant
contributing factor to the success of remote off-grid MHS. There are several agencies
(Ministry of Science and Technology (MST), Nepal Rural Energy Development
Program (REDP), Alternative Energy Promotion Centre (AEPC) etc.) that actively
promote off-grid MHS in remote areas of Nepal and provide subsidies for systems.
The subsidy policy varies from agency to agency and Karlson (2002) states that a more
uniform subsidy policy is required to incentivise investment in MHS in Nepal.
7.3 Implementation
7.3.1 Community participation
While the literature points to the importance of community participation to the success
of a community-based project (Townsend, 1998), this study found that community
participation in MHS projects varied and was dependent primarily on the nature of the
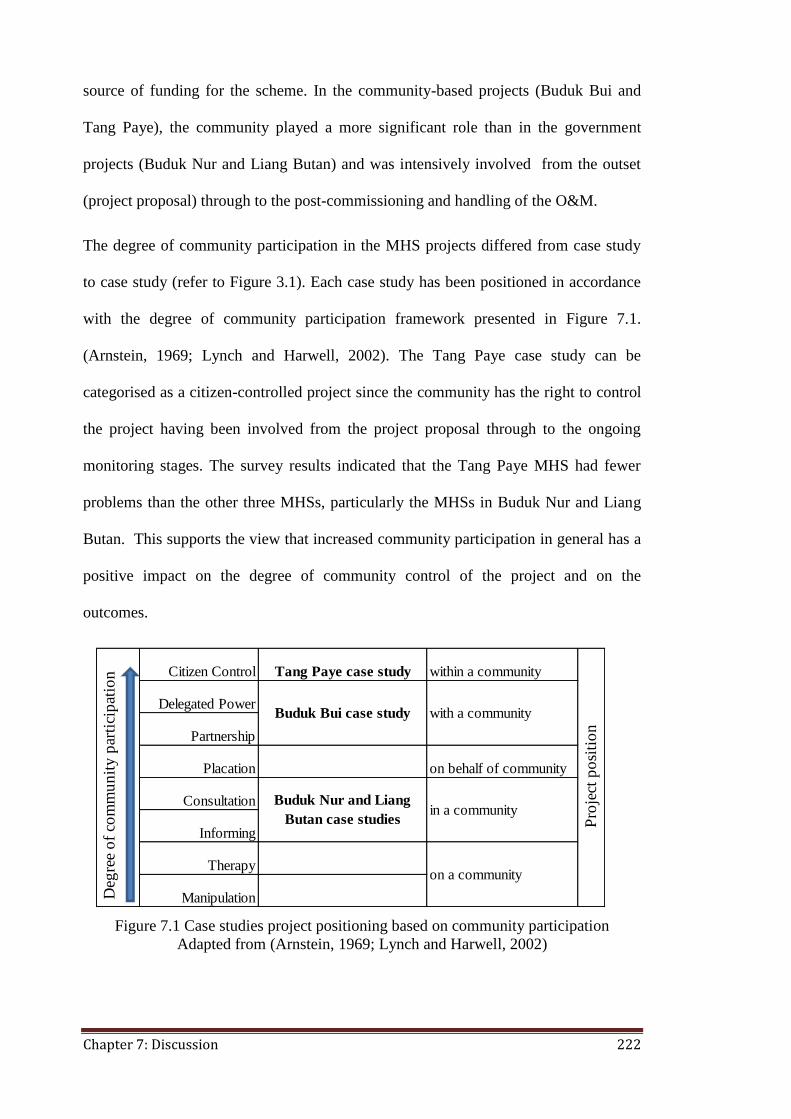
Chapter 7: Discussion 222
source of funding for the scheme. In the community-based projects (Buduk Bui and
Tang Paye), the community played a more significant role than in the government
projects (Buduk Nur and Liang Butan) and was intensively involved from the outset
(project proposal) through to the post-commissioning and handling of the O&M.
The degree of community participation in the MHS projects differed from case study
to case study (refer to Figure 3.1). Each case study has been positioned in accordance
with the degree of community participation framework presented in Figure 7.1.
(Arnstein, 1969; Lynch and Harwell, 2002). The Tang Paye case study can be
categorised as a citizen-controlled project since the community has the right to control
the project having been involved from the project proposal through to the ongoing
monitoring stages. The survey results indicated that the Tang Paye MHS had fewer
problems than the other three MHSs, particularly the MHSs in Buduk Nur and Liang
Butan. This supports the view that increased community participation in general has a
positive impact on the degree of community control of the project and on the
outcomes.
Figure 7.1 Case studies project positioning based on community participation
Adapted from (Arnstein, 1969; Lynch and Harwell, 2002)
Citizen Control Tang Paye case study within a community
Delegated Power
Partnership
Placation on behalf of community
Consultation
Informing
Therapy
Manipulation
Pro
ject
po
siti
on
on a community
in a community
with a community
Deg
ree
of
com
mu
nit
y p
arti
cip
atio
n
Buduk Bui case study
Buduk Nur and Liang
Butan case studies
Chapter 7: Discussion 223
On the whole, the project initiator defines the project and determines the degree of
community participation in the project. Table 7.7 summarises the intensity of
community involvement in the MHS project and the project position as defined in the
framework of Figure 7.1. The more intense the community’s involvement, the more
power that community has to control the project and the greater the chances are of the
project being successful. Pandey (2009) suggests that at least 20% community
participation is required to invoke a real sense of ownership. Project initiators therefore
need to determine the expected community involvement in all activities of the project
at an early stage.
Table 7.7 Community participation intensity and MHS project position for
Ba’kelalan and Krayan
MALAYSIA INDONESIA
Community
based scheme -
Buduk Bui
Government
scheme -
Buduk Nur
Government
scheme - Liang
Butan
Community
based scheme
-Tang Paye
Community
participation
Funding,
planning, civil
works and
O&M
Civil works and
O&M
Civil works (
paid workers)
and O&M
Proposing,
funding,
planning, civil
works and
O&M
High intensity Medium
intensity Low intensity
Very high
intensity
Project
position
Within a
community In a community In a community
Within a
community
7.3.2 Ownership
In the Buduk Nur case study, the MHS falls into the private-group category as the
power house was built on private land but the MHS is used to serve all community
members/public (refer to Figure 3.2). The owner of the land requested privileged
access to unlimited electricity and as no written Memorandum of Understanding
(MOU) was put into effect to establish rights and responsibilities, both the government
as the project initiator and the MHC as project administrative unit were forced to agree
to this demand. As the landlord’s house connection was located between the power
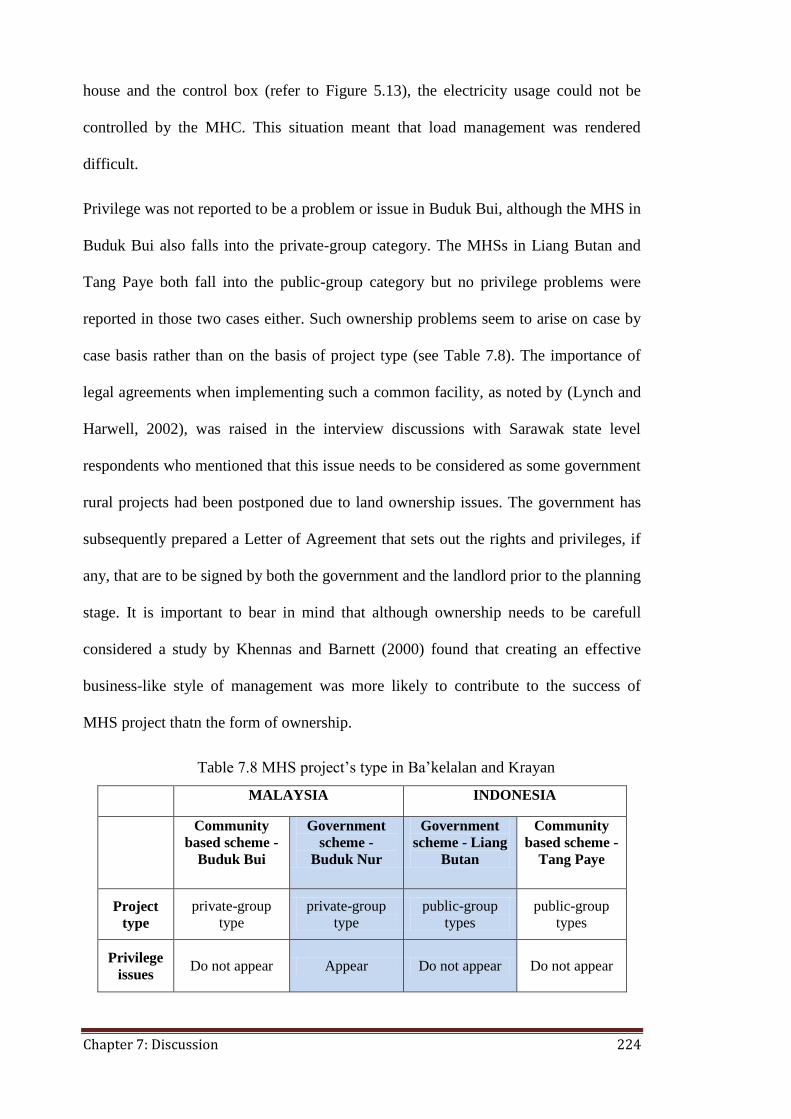
Chapter 7: Discussion 224
house and the control box (refer to Figure 5.13), the electricity usage could not be
controlled by the MHC. This situation meant that load management was rendered
difficult.
Privilege was not reported to be a problem or issue in Buduk Bui, although the MHS in
Buduk Bui also falls into the private-group category. The MHSs in Liang Butan and
Tang Paye both fall into the public-group category but no privilege problems were
reported in those two cases either. Such ownership problems seem to arise on case by
case basis rather than on the basis of project type (see Table 7.8). The importance of
legal agreements when implementing such a common facility, as noted by (Lynch and
Harwell, 2002), was raised in the interview discussions with Sarawak state level
respondents who mentioned that this issue needs to be considered as some government
rural projects had been postponed due to land ownership issues. The government has
subsequently prepared a Letter of Agreement that sets out the rights and privileges, if
any, that are to be signed by both the government and the landlord prior to the planning
stage. It is important to bear in mind that although ownership needs to be carefull
considered a study by Khennas and Barnett (2000) found that creating an effective
business-like style of management was more likely to contribute to the success of
MHS project thatn the form of ownership.
Table 7.8 MHS project’s type in Ba’kelalan and Krayan
MALAYSIA INDONESIA
Community
based scheme -
Buduk Bui
Government
scheme -
Buduk Nur
Government
scheme - Liang
Butan
Community
based scheme -
Tang Paye
Project
type
private-group
type
private-group
type
public-group
types
public-group
types
Privilege
issues Do not appear Appear Do not appear Do not appear
Chapter 7: Discussion 225
7.4 Operation
7.4.1 Social enterprise
Two out of the four case studies, Buduk Nur and Liang Butan, were found to encounter
difficulties in terms of load management as households failed to comply with the rules
limiting the use of electricity for lighting and a television only. The load management
issues in Buduk Nur and Liang Butan (described in detail in Section 5..3.3 and Section
6.3.3) are a “Tragedy of Commons” (Hardin, 1968) type of problem in their nature.
They appear to have arisen as a consequence of the projects having been more focused
on the technical issues and overlooking the social issues (Shashidharan, 1998;
McConney, 1998). There was evidence that project planners had ignored social-
climatic-geomorphologic issues (Shashidharan, 1998) and equity and social justice
issues (Chakraborty, 1998). What is apparent is that the mechanisms for social
dilemmas, the co-evolution of norms, leadership and trust, were absent in both Buduk
Nur and Liang Butan. This was confirmed by interview responses with members of the
MHC in Buduk Nur who complained about the headman election procedure. Instead of
having a capable headman elected by the community, it was asserted that the headman
in Ba’kelalan was appointed by the government and was replaced when he passed
away. In comparison, the leaders in Buduk Bui and Tang Paye are strong and
electricity usage issues are able to be handled in a much better way in these
communities.
Lack of managerial skills, especially in bookkeeping, was also found to be a problem
in both Buduk Nur and Liang Butan. As a consequence, householders were often
reluctant to pay their bills due to a lack of transparency and an absence of reporting on
the total amount of money raised and how it is used.
Chapter 7: Discussion 226
Overall, since the MHS projects are eventually handed over to the relevant community,
it is appropriate to consider the MHS as a social enterprise. To achieve the maximum
benefit for the community, it is important to establish an institutional framework to
deal with the management of the MHS. Indeed, there is a need to integrate these formal
institutional frameworks with the informal (indigenous) institutional frameworks.
Many problems that arose in regard to load management in the case studies reflected a
lack of such institutional frameworks as well as a lack of leadership and managerial
skills.
7.4.2 Capacity building
In none of the four MHS case studies was preventive maintenance included in the
O&M process. This has meant that a “fix only when fail” approach has been adopted,
in which “fix” often entails the method of “trial and error”. This highlights that the
O&M training provided by the supplier to increase capacity building was insufficient.
Although some of the MHS projects involved both off-site and on-site training, it
appears that the training material/scope and time allocated were not appropriate. The
responsibility of operation and maintenance lies with the community, but most rural
communities, including these four case studies villages, have a lack of sufficient
expertise in terms of both project management and technical skills. The lack of any
maintenance handbook may also have contributed to poor maintenance in the cases of
both Buduk Nur and Liang Butan. The lack of a maintenance budget may also have
contributed as it forces technicians to use cheaper components of lower quality and
results in high rates of turnover of maintenance staff. This was found to be the case in
Liang Butan, where maintenance staff members are poorly paid and pursue
opportunities to earn money elsewhere, such as an agricultural labourer. A high rate of
Chapter 7: Discussion 227
turn-over of MHS operators (caused by low salaries) was also reported in Nepal (Gill
et al., 1999).
In all cases studies, a tariff is used to cover the maintenance costs. The tariff is fixed in
the Malaysian case studies, but is variable in the Indonesian case studies (dependent on
the current limit or the number of appliances). Unfortunately, repairs are sometimes
postponed due to the lack of an adequate maintenance budget.
MHS down time was found to vary from one case study to another. The longest down
time, found in Buduk Nur, was about 2 years and was due to a lack of available
expertise to fix faulty wiring. In Liang Butan, the system stopped working in August
2010 and was not fixed until December of that year and unfortunately operated for
only a month before failing again. The community and the sub-district officer therefore
decided to apply for funding to install new equipment (turbine and generator) rather
than fixing it. After the follow-up survey in 2012, correspondence with the sub-district
officer, continued and, as of June 2013, the new system has still not been installed.
In summary, although training, either off-site or on-site, was provided to the
community, preventive maintenance was not included in the O&M processes being
applied and maintenance has come to be reactive and to mean fixing problems only
once they occur. Furthermore, what O&M is undertaken is based on a trial and error
approach in all case studies.
Poor maintenance may be caused by inappropriate training, absence of a guide or high
turn-over of technical staff and the lack of an adequate O&M budget. O&M budgets
are created from monthly electricity bills, which are fixed in the Malaysian case
studies but variable in the Indonesian case studies. The lack of an O&M budget results
in faulty components being replaced by cheaper and lower quality components or

Chapter 7: Discussion 228
postponement of repairs. Table 7.9 summarises the approaches to operation and
maintenance in the four case studies.
Table 7.9 Operation and maintenance for MHS in Ba’kelalan and Krayan
MALAYSIA INDONESIA
Community
based scheme
- Buduk Bui
Government
scheme -
Buduk Nur
Government
scheme -
Liang Butan
Community
based scheme
-Tang Paye
O&M Run by the
community
Run by the
community
Run by the
community
Run by the
community
Training On-site Off-site and
On-site
Off-site and
On-site
Off-site and
On-site
Electricity
tariff Fixed Fixed Variable Variable
O&M
budget Sufficient Insufficient Insufficient Sufficient
While capacity building has been reported to be a critical factor of project success by a
number of studies and reports (IEA, 2000; Tsephel, n.d; Engkoeswara, 1998), this
study found that lack of technical skills and knowledge, as well as a lack of managerial
skills (both financial and leadership skills) resulted in poor project performance.
The results of this study highlight that the transfer of knowledge, including technical
know-how, skills and attitudes, should be accompanied by tutoring on critical thinking
and communicative action. Appropriate training in terms of material and time need to
be provided to ensure that a community is capable of undertaking the O&M smoothly
and those repairs are not based on a trial and error approach. A lack of capacity
building has been reported to be an obstruction to project success, although the extent
to which this is a problem may be mitigated by designing the MHS project prudently.
Chapter 7: Discussion 229
7.5 Evaluation
7.5.1 Available power and load factor
The design of the MHS in all case studies was not based on a robust assessment of
current or projected electricity demand or on fluctuations in demand. In Buduk Nur,
power shortages often occur during the peak periods in the evening, but the excess
power during the day is dumped. This situation results in low load factors. This study
found that the load factor was 0.4 in Buduk Nur and 0.5 in Buduk Bui, well below the
power factor of 0.8 expected by the designers. It must be noted, however, that there is
a degree of uncertainty associated with the reported load factor in Buduk Nur as a
number of householders did not give permission to be audited and provided verbal
information on appliances and patterns of appliance usage.
Increasing load factor means that less hydro power is wasted and this can be achieved
either by using excess power during the daytime or storing it during the daytime and
using it to meet the peak demand during the evening. According to some survey
respondents in Buduk Nur, however, such approaches would be difficult to implement.
The results from a focus group held in Buduk Nur (Table 5.3) showed that all group
members do not consider there to be any excess power as the supply did not meet their
peak demand. Interview respondents from both Buduk Bui and focus group member in
Buduk Nur were also pessimistic about the ability to use any excess power during the
daytime for public facilities. The option of storing the excess power and using it in the
peak period was considered to involve a very large investment that would be
unaffordable to the community. The load factor in Liang Butan and Tang Paye could
not be calculated as in both case studies the MHS was shut down during the day. In
regard to power availability, in Liang Butan power shortages often occurred, indicating
that demand exceeds supply. In contrast, power shortages were not mentioned by
Chapter 7: Discussion 230
survey respondents in Tang Paye. In summary, when designing an MHS, the expected
load factor needs to be reasonable and has to be estimated thoughtfully in the design
phase, and there needs to be clear strategies for achieving it.
In term of the role of the MHCs in the public use of energy, the MHCs on both sides of
the border were involved in trying to manage electricity loads by applying limits to
total consumption or limits on the number and types of appliances that could be used.
The findings of this research suggest that the MHCs are generally more proactive in
terms of load management in Indonesia than they are in Malaysia. In the larger towns
on both sides of the border, the villagers were less compliant with the MHC
regulations and misused the systems by using more appliances than were approved or
allowed, bypassing current limiters and reconnecting cut wires, etc. The need for load
management and the function of current limiters were not well communicated by the
MHCs to the villagers.
The ineffectiveness of the MHC roles in the two larger towns (Liang Butan and Buduk
Nur) in promoting load management was related to the absence of written regulations
made by the MHC, as they do not have enough power to enforce the regulations.
Factors such as kinship, social status or age difference meant that the MHC deferred to
the householder and often were reluctant to impose any strict penalties or fines.
All things considered, load factor in the case studies was overlooked by the designers.
Even though the designers set load factor targets at 0.8, strategies that could realise
these targets were not formulated and put in action. The research findings suggest that
the villagers do not understand that matching demand with supply is important in terms
of keeping the system working efficiently. Therefore, demand management training
needs to be provided by the MHCs to the householders, with written regulations in
place, in order to achieve a targeted load factor.
Chapter 7: Discussion 231
7.5.2 End users’ satisfaction
According to the respondents, two of the four MHS case studies did not meet end user
demand. In Buduk Nur, 55 % of respondents reported that they were dissatisfied with
the current MHS due to its limited capacity and the poor quality of power supply.
Dissatisfaction caused by limited access and poor quality were also reported by 60% of
respondents in Liang Butan. Despite facing similar problems of limited power, 90% of
respondents in Buduk Bui and 90% of respondents in Tang Paye stated that they were
satisfied with the MHS supply. The level of satisfaction is clearly highly dependent on
the users’ expectations and that is the reason that community consultation prior to
project implementation is so important.
The dissatisfaction expressed by respondents in both Buduk Nur and Liang Butan
appears to stem from the fact that households in these communities already own and
use a range of appliances or can afford to buy new appliances, but that these cannot all
be operated using the limited amount of electricity supplied by the MHS. The MHSs in
Buduk Nur and Liang Butan were not able to meet the “hidden demand” and the
growing demand of communities. The approach applied to these projects of harnessing
all the water resources available and then sharing the electricity generated equally
among end users proved to be fruitless.
Dissatisfaction was also found to exist over the inability to achieve stable voltages
from the MHS in the Buduk Nur case study. The MHS had potentially a very
important impact on the productive use of energy by meeting the Clinic’s needs for
refrigeration for vaccines, etc. Unfortunately, that outcome was compromised by the
design of the distribution system which gives priority to the electricity needs of
households rather than the need of the Clinic.
Chapter 7: Discussion 232
In contrast, the majority of households in Buduk Bui and in Tang Paye did not own
any electric appliances before the MHS was installed. One of the main benefits of the
MHS for the members of these communities was the ability to operate a television. The
growth in demand in the Buduk Bui and Tang Paye cases was under control at the time
the MHSs were set up; real demand was low and regulations were imposed by the
MHC to limit the access to power so that the growth in demand was controllable.
The inability to meet end user demand in some of the cases may have been caused by
the limitations of an instantaneous MHS that uses a non-robust, top down approach
that could not be upgraded to increase the capacity. In comparison, a diesel power or
solar power project can be designed according to the existing end users’ demand and
has the capacity to be upgraded to meet future growing demand.
In summary it is important to understand the current energy use situation in the
community and future demand to develop and impose a proper strategy for managing
the load in order to meet customer satisfaction.
7.5.3 Capacity to pay
The communities were involved in setting the electricity tariff in both Ba’kelalan and
Krayan and took into consideration the fact that these are subsistence communities in
which the members of the community depend to a high degree on producing rice from
their fields and vegetables from their backyards, hunting to obtain meat or fish, and
collecting wood from the forest, and thus do not have cash available. Therefore the
monthly household electricity bill was set at RM5 (AUD 1.7) in Buduk Bui, RM 10
(AUD 3.1) in Buduk Nur, IDR 15000 (AUD 1.8) in Liang Butan for 1 Amp limit and
IDR 30000 (AUD 3.5) to operate three lights and a television in Tang Paye. In all
cases, the cost is lower than the expenses of buying petrol to run a generator as the
villagers did before the MHS was commissioned. In all cases, respondents expressed a
Chapter 7: Discussion 233
willingness to pay an additional cost to obtain more electricity. In Buduk Bui and
Buduk Nur, around one-third of respondents were willing to pay an additional AUD
26-50 and around one-third were willing to pay an extra AUD 1-25, while in Liang
Butan and Tang Paye the majority of respondents (around 80%) stated that they were
willing to pay an additional AUD 1-25. The approach that respondents in Malaysia
used to calculate the additional cost that they were willing to pay was to compare the
cost with what they would pay for electricity if connected to a public grid in a town or
city, while respondents in Indonesia compared the costs to what they would pay if
buying petrol to run a generator.
Some of the wealthier respondents stated that they would actually be willing to pay
even more (> AUD 100) in order to obtain more power. Respondents in Buduk Nur
and Liang Butan who were currently running a business expected to have reliable
power supply to support the business. The size of their electricity bill was not
mentioned as a big problem for them, indicating that they had previously spent much
more buying fuel to run their generators. The implication of this is that it is crucial to
determine how the power produced by MHS will be distributed to the end users as the
demand per household and the ability to pay may vary.
A major finding was that the electricity bill was found to be affordable to the villagers
and in fact significantly lower than the capacity to pay (up to AUD 25). It would
therefore be possible to increase the monthly tariff in order to increase the operation
and maintenance budget. Furthermore, the wealthiest respondents were business
owners who reported that they were willing to pay more in order to obtain more
reliable power. This finding is compatible with the research of Kirubi et al. (2009)
who investigated the benefit of MHS to rural entrepreneurship (carpentry and tailoring)
Chapter 7: Discussion 234
and found that accessing electricity from MHS resulted in increased productivity and
volume of sales for business owners.
7.5.4 MHS Impacts
Within community
One of the impacts of the MHSs is that they have created opportunities to increase
income; clear, reliable light at night has enabled householders in Buduk Bui and Tang
Paye to produce handicrafts during the evenings, while in Buduk Nur and Liang Butan
the supply of electricity has enabled a greater use of appliances, such as blenders and
freezers. In the cases of Buduk Nur and Liang Butan, women in particular have
benefited from the MHSs by increased income generation opportunities, such as
handicraft production, sewing, making snacks, and reduced housework (use of washing
machines). Assuming that the findings of other studies on community impact of MHSs
(González et al., 2009; Balakrishnan, 2006; Maier, 2007) are applicable then the
women in these communities are likely to have more leisure time and opportunity to
interact with other community/household members or to engage in income generating
activities. Other positive impacts of MHSs found in these four case studies were
increased access to television and radio, and increased communication and
information, which included information used for educational and health purposes.
There have been reported improvements in health in some MHS projects due to lower
indoor smoke from kerosene lamps (Gurung et al., 2011c; Manuswamy et al., 2011).
This may have also been a positive impact of the MHSs in these case studies, but this
was not reported by the survey participants.
The cost of electricity to householders for the electricity that they use from the MHS is
lower than the cost of electricity that they would otherwise have had to produce using a
diesel/petrol generator. Even though the power supply depends on the water
Chapter 7: Discussion 235
availability and reduced water levels cause disruptions to supply, the members of these
communities report that electricity from MHS is preferable to them. A major reduction
in expenditure on energy means that the community has greater disposable income.
One respondent in Buduk Nur stated that “now I have a budget for myself (clothes,
make up)”.
In terms of further impacts of the MHSs, both increased and reduced social cohesion
within the communities were reported. Previous studies have reported that increased
social interaction as a result of street and house lighting provides a greater sense of
security to the community (Annemarije L et al., 2010). In the case studies presented
here there was an increase in social cohesion due to increased safety from house
lighting, and respondents reported an increased feeling of comfort rather than a greater
sense of security, in visiting other households that could operate more appliances with
the cheaper electricity from the MHS The fact that the respondents referred to
‘comfort’ rather than ‘security’ may be due to the small size of these case study lokasi
and the inherent greater security in these communities. It has to be noted that reduced
interactions between members of a community were also reported as a result of an
increased tendency to stay at home watching television.
According to the majority of respondents in all case studies, the MHSs have had no
impact in stemming outmigration. The main reason for leaving these remote
communities and migrating to a city was to pursue further study and after completing
their studies, the young adults prefer to remain in cities to find a job.
While Gurung et al. (2011) found MHSs to have a positive impact on education; only
13 % of respondents in Tang Paye reported this to be the case. The effect of lighting on
studying was not reported to be significant in Buduk Bui as most of the students attend
a boarding school on weekdays and are at home only during weekends and when they
Chapter 7: Discussion 236
are at home, children tend to watch TV rather than study. Even though in Buduk Nur
students do not stay at a boarding school, respondents did not report an increase in
hours studied as a result of the MHS. Similarly, no impact on education was reported
in Liang Butan, which may have been attributable in part to the poor quality of power
supply, especially peak demand periods. It appears that the impact that an MHS has on
the education of the children in the household, through provision of night-time
lighting, will depend on a number of factors including the time that the children are at
home, availability of the lighting and distractions in the household such as television.
Cross-border area
One of the opportunities created by the development of an MHS in a border region is
that it creates increased opportunities for learning and benchmarking. On the
Indonesian side of the border it was found that the type of turbine used in the MHSs in
Krayan required greater maintenance, including greasing the turbine and replacing the
belt more often, than the turbine used in the MHSs in Ba’kelalan. The funding made
available from PNPM for 3 lokasi in 2011 (refer to Table 4.12) was therefore used to
set up new MHSs in each proposed lokasi using the more compact turbine design that
was used in the MHSs in Ba’kelalan (Unfortunately, these systems are beyond the
scope of this study).
The MHSs also had an impact on trade relationships between these communities. The
price of traded goods is set by those in the villages on the Malaysian side of the border
and there has traditionally been a significant trade imbalance between the
communities. This was highlighted when the Liang Butan MHS stopped working. The
demand for fuel in the Indonesian village increased and the price charged for fuel (by
the Malaysians) was 2.5 times higher than the regular price paid by the Malaysians. A
strong motivation for increased utilization of MHS on the part of the Indonesian
Chapter 7: Discussion 237
communities reported in this study was a desire to sell the excess electricity generated
to Malaysia in order to strengthen their bargaining power with the Malaysian
communities.
General rural development was also a strong motivation for increased MHS projects.
The communities on both sides of the border had approached their local governments
over the years with requests to provide facilities, such as good roads,
telecommunications, electricity, and public health facilities. The governments on both
sides of the border wanted to initiate development and infrastructure projects in these
areas, but the high transportation costs meant that total project budgets were high. The
limited annual budgets provided by governments, combined with a lack of skilled local
labour, served to decelerate the implementation of such infrastructure projects. MHS
represented one of the more viable types of infrastructure projects.
In the follow-up field trip (February - March 2012), it was found that a 75 km road
between Ba’kelalan and Long Luping had been completed in 2011, connected to the
sealed road between Long Luping and Lawas. This represented a major benefit to the
people living in the 20 remote villages in the southern part of Lawas in terms of
increasing their ability to access the nearest city; Lawas. Travel time from Ba’kelalan
to Lawas city was reduced from six to about four hours, which reduced transportation
costs and therefore the cost of consumer goods. Communication services had also
improved over the period in Ba’kelalan. The mobile phone tower is now powered by
excess power produced by the Apple Lodge MHS during the daytime. The electricity
supply system nonetheless is in need of upgrading as the existing Clinic MHS is not
able to meet the demand in Buduk Nur.
On the Indonesia side, key respondents revealed that the completion of road works
connecting Ba’kelalan to Lawas was a trigger for the Indonesian local government to
Chapter 7: Discussion 238
improve infrastructure in Krayan. Upgrading the air strip to accommodate larger
aircraft was started in 2008 but had not been completed by 2012 (the follow-up
fieldtrip). Various attempts to connect Krayan to the nearest city, Malinau have been
made since Krayan became a part of East Kalimantan. The district government
approached the national government with a request for a road, which connected to
Malinau, to be constructed through the Kayan Mentarang National Park.
Unfortunately, until 2011 this project had not been approved. Instead, short-term road
work projects to connect villages in both in the Krayan and Krayan Selatan sub-
districts have been set up.
In regard to electricity supply projects, Romayo I was handled over to the state-owned
electricity company (PLN) after negotiations for funding to replace the turbine and
generator proved unsuccessful. PLN staff reported that a 50 kW diesel generator is
currently (2013) being used as a substitute for the Romayo I MHS but that a PLN team
is preparing to install new equipment to re-commission the MHS in the near future.
7.6 Synthesis
In order to tease out some of the more salient points in the above discussion, Table
7.10 is used to present a summary of the survey findings. These findings are used to
compare the MHS case studies in order to identify which of the four MHSs appear to
be the most successful.
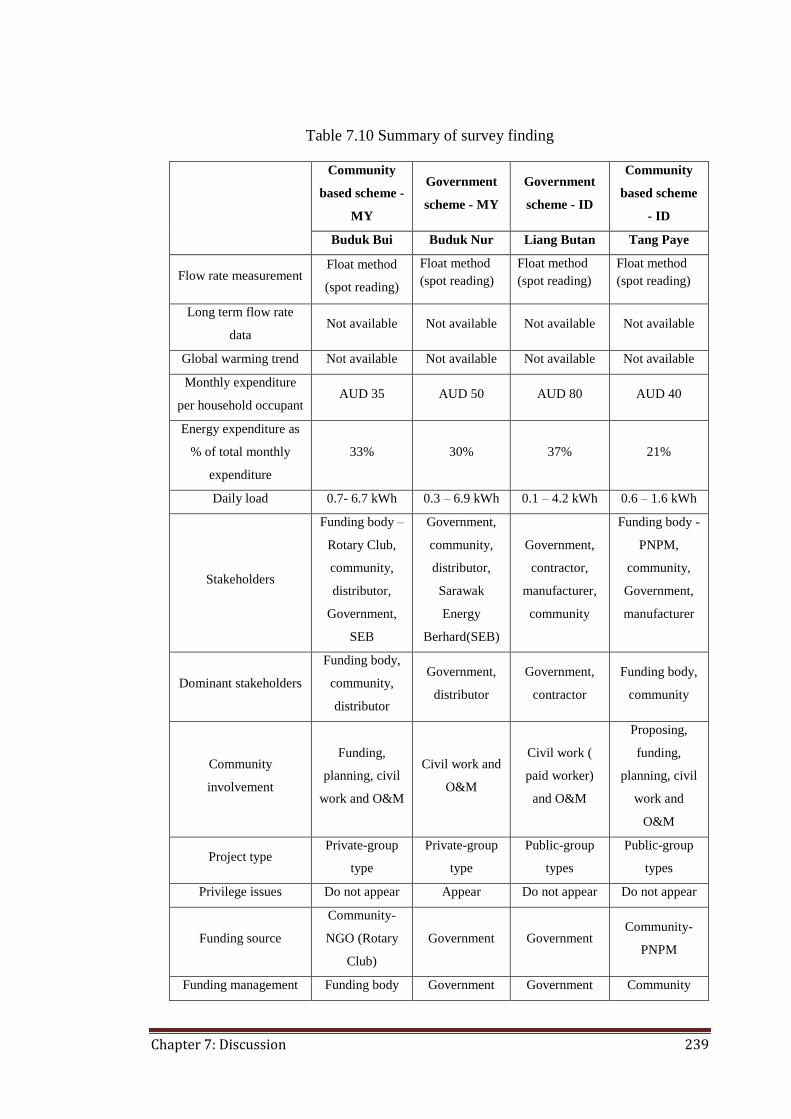
Chapter 7: Discussion 239
Table 7.10 Summary of survey finding
Community
based scheme -
MY
Government
scheme - MY
Government
scheme - ID
Community
based scheme
- ID
Buduk Bui Buduk Nur Liang Butan Tang Paye
Flow rate measurement Float method
(spot reading)
Float method
(spot reading) Float method
(spot reading) Float method
(spot reading)
Long term flow rate
data Not available Not available Not available Not available
Global warming trend Not available Not available Not available Not available
Monthly expenditure
per household occupant AUD 35 AUD 50 AUD 80 AUD 40
Energy expenditure as
% of total monthly
expenditure
33% 30% 37% 21%
Daily load 0.7- 6.7 kWh 0.3 – 6.9 kWh 0.1 – 4.2 kWh 0.6 – 1.6 kWh
Stakeholders
Funding body –
Rotary Club,
community,
distributor,
Government,
SEB
Government,
community,
distributor,
Sarawak
Energy
Berhard(SEB)
Government,
contractor,
manufacturer,
community
Funding body -
PNPM,
community,
Government,
manufacturer
Dominant stakeholders
Funding body,
community,
distributor
Government,
distributor
Government,
contractor
Funding body,
community
Community
involvement
Funding,
planning, civil
work and O&M
Civil work and
O&M
Civil work (
paid worker)
and O&M
Proposing,
funding,
planning, civil
work and
O&M
Project type Private-group
type
Private-group
type
Public-group
types
Public-group
types
Privilege issues Do not appear Appear Do not appear Do not appear
Funding source
Community-
NGO (Rotary
Club)
Government Government Community-
PNPM
Funding management Funding body Government Government Community
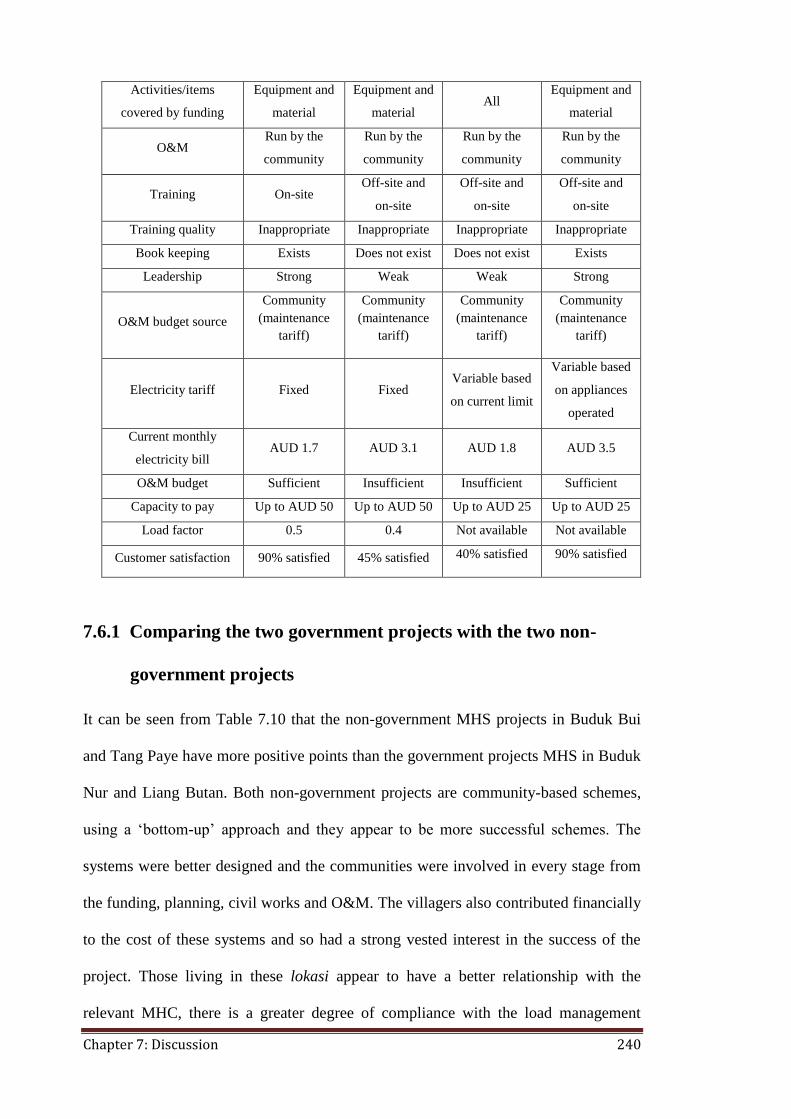
Chapter 7: Discussion 240
Activities/items
covered by funding
Equipment and
material
Equipment and
material All
Equipment and
material
O&M Run by the
community
Run by the
community
Run by the
community
Run by the
community
Training On-site Off-site and
on-site
Off-site and
on-site
Off-site and
on-site
Training quality Inappropriate Inappropriate Inappropriate Inappropriate
Book keeping Exists Does not exist Does not exist Exists
Leadership Strong Weak Weak Strong
O&M budget source
Community
(maintenance
tariff)
Community
(maintenance
tariff)
Community
(maintenance
tariff)
Community
(maintenance
tariff)
Electricity tariff Fixed Fixed Variable based
on current limit
Variable based
on appliances
operated
Current monthly
electricity bill AUD 1.7 AUD 3.1 AUD 1.8 AUD 3.5
O&M budget Sufficient Insufficient Insufficient Sufficient
Capacity to pay Up to AUD 50 Up to AUD 50 Up to AUD 25 Up to AUD 25
Load factor 0.5 0.4 Not available Not available
Customer satisfaction 90% satisfied 45% satisfied 40% satisfied 90% satisfied
7.6.1 Comparing the two government projects with the two non-
government projects
It can be seen from Table 7.10 that the non-government MHS projects in Buduk Bui
and Tang Paye have more positive points than the government projects MHS in Buduk
Nur and Liang Butan. Both non-government projects are community-based schemes,
using a ‘bottom-up’ approach and they appear to be more successful schemes. The
systems were better designed and the communities were involved in every stage from
the funding, planning, civil works and O&M. The villagers also contributed financially
to the cost of these systems and so had a strong vested interest in the success of the
project. Those living in these lokasi appear to have a better relationship with the
relevant MHC, there is a greater degree of compliance with the load management
Chapter 7: Discussion 241
program set by the MHC, and the expectations of the householders in terms of access
to electricity are more modest. It would be useful to look more closely at government
schemes in smaller lokasi such as Long Langai and Long Rusu in Ba’kelalan as well as
look at more non-government schemes such as Pa Padi, Wa Yagung and Pa Raye in
Krayan to confirm this result.
The ‘bottom-up’ approach used in the PNPM programme was found to be working
well in the Tang Paye case study and, through the interview with the government
respondent, it was found that other MHSs installed through the PNPM programme in
2008 were also working well (Table 4.12). However, three MHS projects funded by
the PNPM in 2010 were not as successful as the PNPM projects undertaken in 2008.
This leads to the proposition that having the right policy and funding support in place
is no guarantee of success. Implementing an MHS is a complex process that is not only
determined or shaped by policy or government support, but involves many other
factors. In the Pa Padi MHS (Table 4.12), for example, the MHS was not working well
due to insufficient water. The villagers decided to invest in a larger system as they
thought that a larger system would be able to produce more power and, as a
consequence, the electricity supplied per household would be increased without
compromising the resource availability. Again, a non-technical issue led to the
amendment in the determination of the capacity of the system and the result was an
ineffective system. Further study is required to better understand this matter and how it
can be best resolved.
7.6.2. Comparing the Malaysian government project with the
Indonesian government project
Both government funded MHSs in Buduk Nur and Liang Butan used a ‘top down’
approach in their implementation with all decisions made by the project initiator at a
Chapter 7: Discussion 242
national government level. In each case neither the community nor government at
provincial, state/district and sub-district levels were involved in the decision making
processes.
Both government MHS case studies fall under the category of ‘demand exceeds
supply’ schemes and faced load management problems that lead to subsequent issues,
such as overloading, brownout/blackout and unstable voltage. Applying a current limit
device was ineffective as householders bypassed the device to tap more power to fulfil
their ‘hidden demand’.
The different type of O&M and tariff management in the government schemes either
side of the border did not appear to have an influence on the projects and both yielded
similarly unsuccessful results. It would be worthwhile to investigate more closely
other government schemes such as those at Long Langai and Long Rusu in Ba’kelalan
to confirm this result.
7.6.3. Comparing the two projects in Malaysia with the two projects
in Indonesia
On both the Malaysian and Indonesian side, the MHS in the smaller lokasi of Buduk
Bui and Tang Paye appear to be more successful than those in the larger lokasi of
Buduk Nur and the large village of Liang Butan. The circumstances in the smaller
lokasi (Buduk Bui and Tang Paye) were similar and more supportive of the MHC, e.g.
people did not have wide range of appliances before the MHS was installed, the degree
of compliance with the MHC rule on load management was higher, and the community
was satisfied with the limited power. Considering that need and level of satisfaction
may shift over time, the degree of satisfaction may change and move onto another
stage as suggested in Abraham Maslow’s ‘hierarchy of needs’ (Jerome, 2013; Nemati,
Chapter 7: Discussion 243
2013). It would therefore be interesting to investigate the situation at some future date
(e.g. in two years) to see whether the need and level of satisfaction have changed and
what effect this has had on the degree of compliance with the MHC and the attitudes to
the limited availability of power.
7.7 Revised conceptual diagram for the MHS implementation
The ultimate finding from this cross-case analysis is that key or critical factors
involved in the implementation of a successful MHS project are not fixed. The factors
that contribute to the success of one MHS project may not be equally critical or play
the same role in achieving the outcome for other cases. This finding confirms the
premise stated in Chapter One that the implementation of MHS projects is more
complex than the programmes that are based on other renewable energy technologies,
such as solar home systems. Load management, for example, was effective in Tang
Paye by applying current limits, but was not effective in Liang Butan. Encouraging
villagers to use electricity only for lights and television without applying a current
limit device was effective in Buduk Bui, but not in Buduk Nur. Load management may
not be a technical issue only (how much power is to be distributed and how to
distribute it) as other factors appeared to determine whether a load management
strategy worked well or not.
Customer satisfaction is another example. Three out of four case studies supply less
electricity than could meet “typical” average household loads. Even though each
household in Tang Paye has a 1 Amp limit, those living in the village were satisfied
with enjoying cheap electricity supplied from the MHS. On the other hand, households
in Buduk Nur and Liang Butan were not happy because electricity access from the
MHS was limited and that dissatisfaction resulted in subsequent destructive actions,
such as by-passing current limit devices, not complying with the rules used to limit
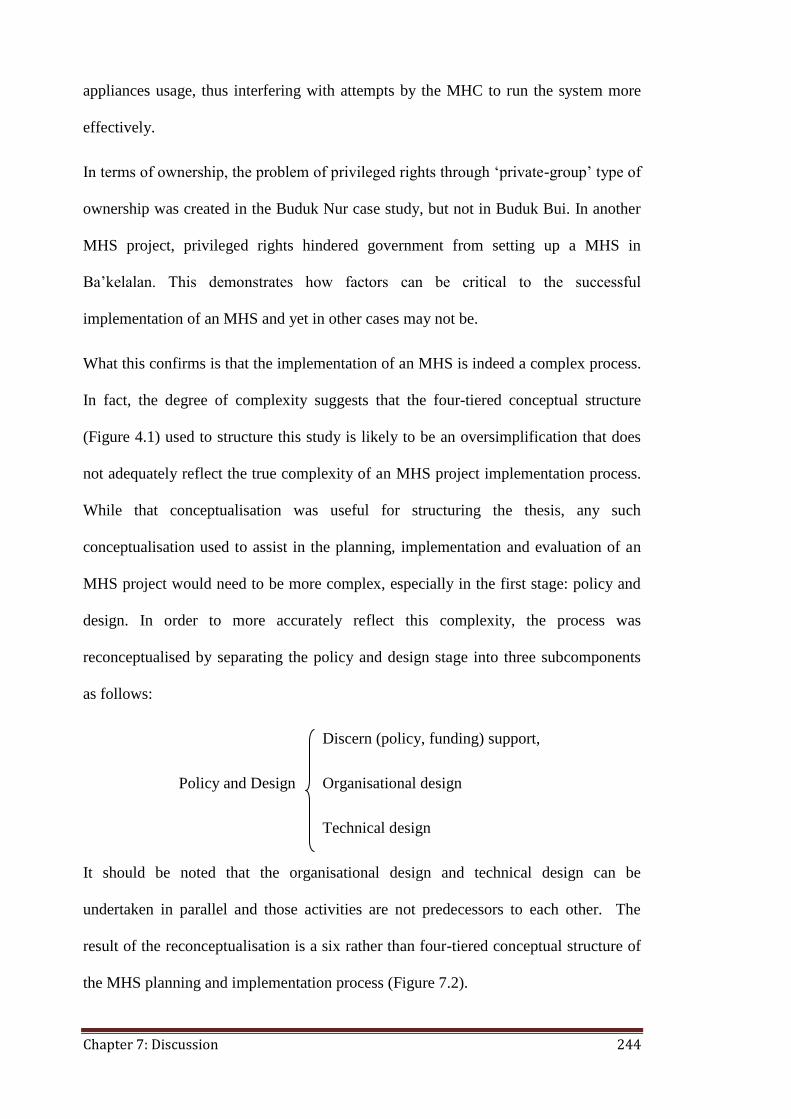
Chapter 7: Discussion 244
appliances usage, thus interfering with attempts by the MHC to run the system more
effectively.
In terms of ownership, the problem of privileged rights through ‘private-group’ type of
ownership was created in the Buduk Nur case study, but not in Buduk Bui. In another
MHS project, privileged rights hindered government from setting up a MHS in
Ba’kelalan. This demonstrates how factors can be critical to the successful
implementation of an MHS and yet in other cases may not be.
What this confirms is that the implementation of an MHS is indeed a complex process.
In fact, the degree of complexity suggests that the four-tiered conceptual structure
(Figure 4.1) used to structure this study is likely to be an oversimplification that does
not adequately reflect the true complexity of an MHS project implementation process.
While that conceptualisation was useful for structuring the thesis, any such
conceptualisation used to assist in the planning, implementation and evaluation of an
MHS project would need to be more complex, especially in the first stage: policy and
design. In order to more accurately reflect this complexity, the process was
reconceptualised by separating the policy and design stage into three subcomponents
as follows:
Discern (policy, funding) support,
Policy and Design Organisational design
Technical design
It should be noted that the organisational design and technical design can be
undertaken in parallel and those activities are not predecessors to each other. The
result of the reconceptualisation is a six rather than four-tiered conceptual structure of
the MHS planning and implementation process (Figure 7.2).
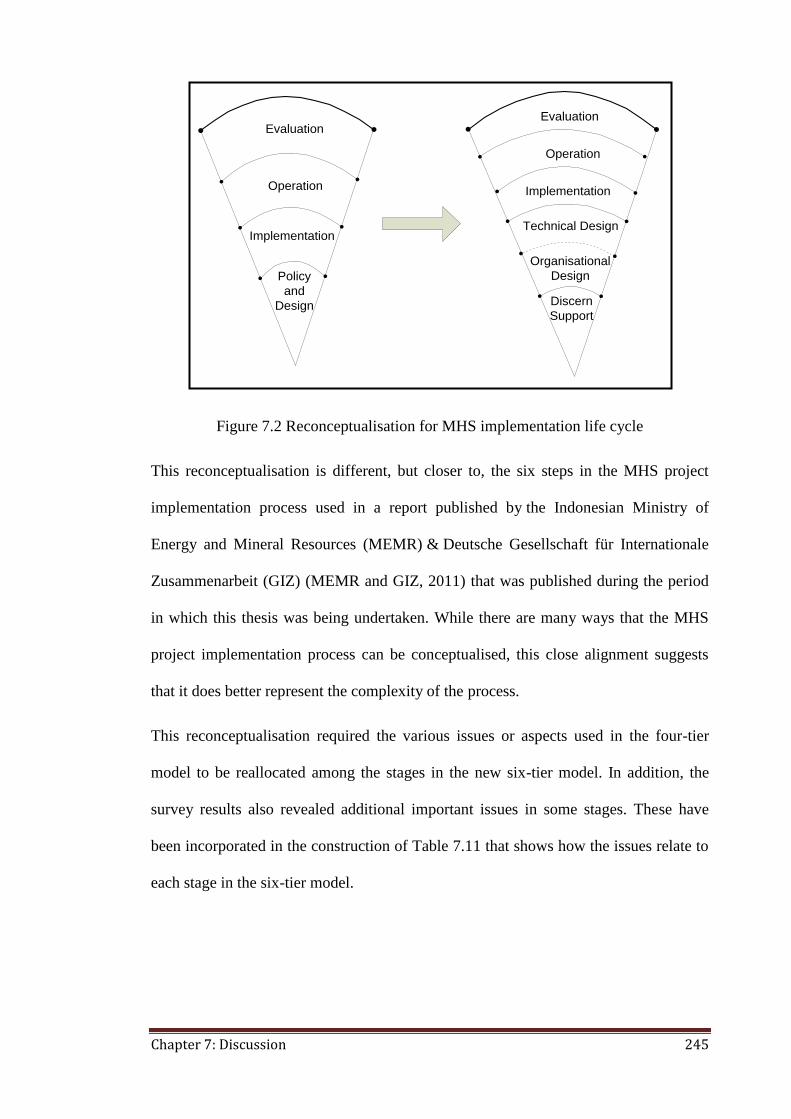
Chapter 7: Discussion 245
Figure 7.2 Reconceptualisation for MHS implementation life cycle
This reconceptualisation is different, but closer to, the six steps in the MHS project
implementation process used in a report published by the Indonesian Ministry of
Energy and Mineral Resources (MEMR) & Deutsche Gesellschaft für Internationale
Zusammenarbeit (GIZ) (MEMR and GIZ, 2011) that was published during the period
in which this thesis was being undertaken. While there are many ways that the MHS
project implementation process can be conceptualised, this close alignment suggests
that it does better represent the complexity of the process.
This reconceptualisation required the various issues or aspects used in the four-tier
model to be reallocated among the stages in the new six-tier model. In addition, the
survey results also revealed additional important issues in some stages. These have
been incorporated in the construction of Table 7.11 that shows how the issues relate to
each stage in the six-tier model.
Discern
Support
Implementation
Operation
Evaluation
Technical Design
Organisational
DesignPolicy
and
Design
Implementation
Operation
Evaluation
Policy
and
Design
Implementation
Operation
Evaluation
· Hydro resource assessment
· Current energy usage and pattern
· Current demand
· Capacity to pay
· Stakeholder
· Funding
· Government policy
· Community participation
· Ownership
· Social enterprise
· Capacity building
· Available power and demand
growth
· Customer satisfaction
· Impact
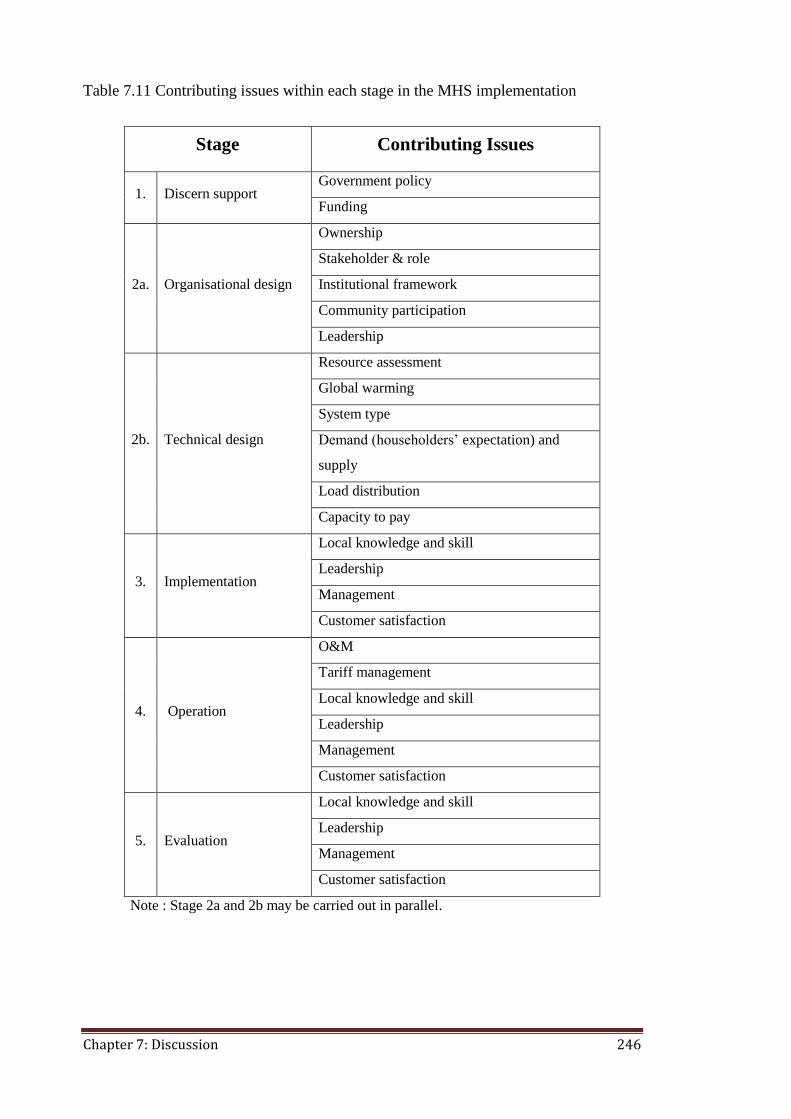
Chapter 7: Discussion 246
Table 7.11 Contributing issues within each stage in the MHS implementation
Stage Contributing Issues
1. Discern support Government policy
Funding
2a. Organisational design
Ownership
Stakeholder & role
Institutional framework
Community participation
Leadership
2b. Technical design
Resource assessment
Global warming
System type
Demand (householders’ expectation) and
supply
Load distribution
Capacity to pay
3. Implementation
Local knowledge and skill
Leadership
Management
Customer satisfaction
4. Operation
O&M
Tariff management
Local knowledge and skill
Leadership
Management
Customer satisfaction
5. Evaluation
Local knowledge and skill
Leadership
Management
Customer satisfaction
Note : Stage 2a and 2b may be carried out in parallel.
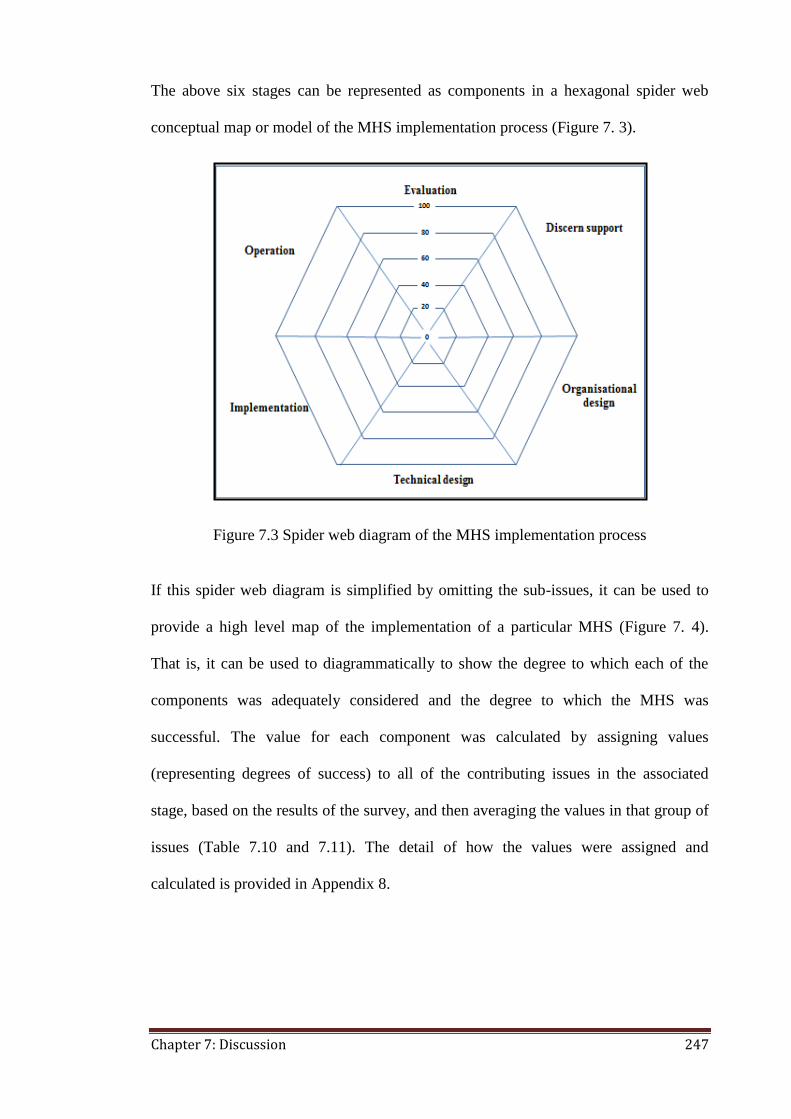
Chapter 7: Discussion 247
The above six stages can be represented as components in a hexagonal spider web
conceptual map or model of the MHS implementation process (Figure 7. 3).
Figure 7.3 Spider web diagram of the MHS implementation process
If this spider web diagram is simplified by omitting the sub-issues, it can be used to
provide a high level map of the implementation of a particular MHS (Figure 7. 4).
That is, it can be used to diagrammatically to show the degree to which each of the
components was adequately considered and the degree to which the MHS was
successful. The value for each component was calculated by assigning values
(representing degrees of success) to all of the contributing issues in the associated
stage, based on the results of the survey, and then averaging the values in that group of
issues (Table 7.10 and 7.11). The detail of how the values were assigned and
calculated is provided in Appendix 8.
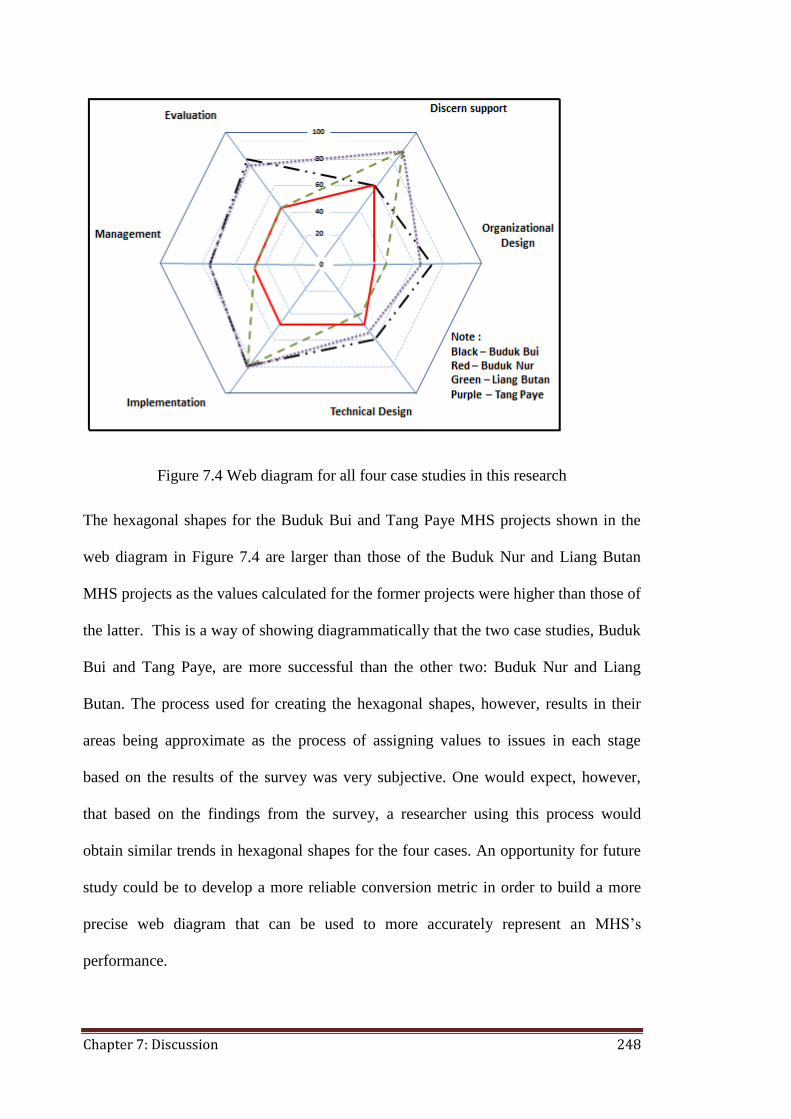
Chapter 7: Discussion 248
Figure 7.4 Web diagram for all four case studies in this research
The hexagonal shapes for the Buduk Bui and Tang Paye MHS projects shown in the
web diagram in Figure 7.4 are larger than those of the Buduk Nur and Liang Butan
MHS projects as the values calculated for the former projects were higher than those of
the latter. This is a way of showing diagrammatically that the two case studies, Buduk
Bui and Tang Paye, are more successful than the other two: Buduk Nur and Liang
Butan. The process used for creating the hexagonal shapes, however, results in their
areas being approximate as the process of assigning values to issues in each stage
based on the results of the survey was very subjective. One would expect, however,
that based on the findings from the survey, a researcher using this process would
obtain similar trends in hexagonal shapes for the four cases. An opportunity for future
study could be to develop a more reliable conversion metric in order to build a more
precise web diagram that can be used to more accurately represent an MHS’s
performance.
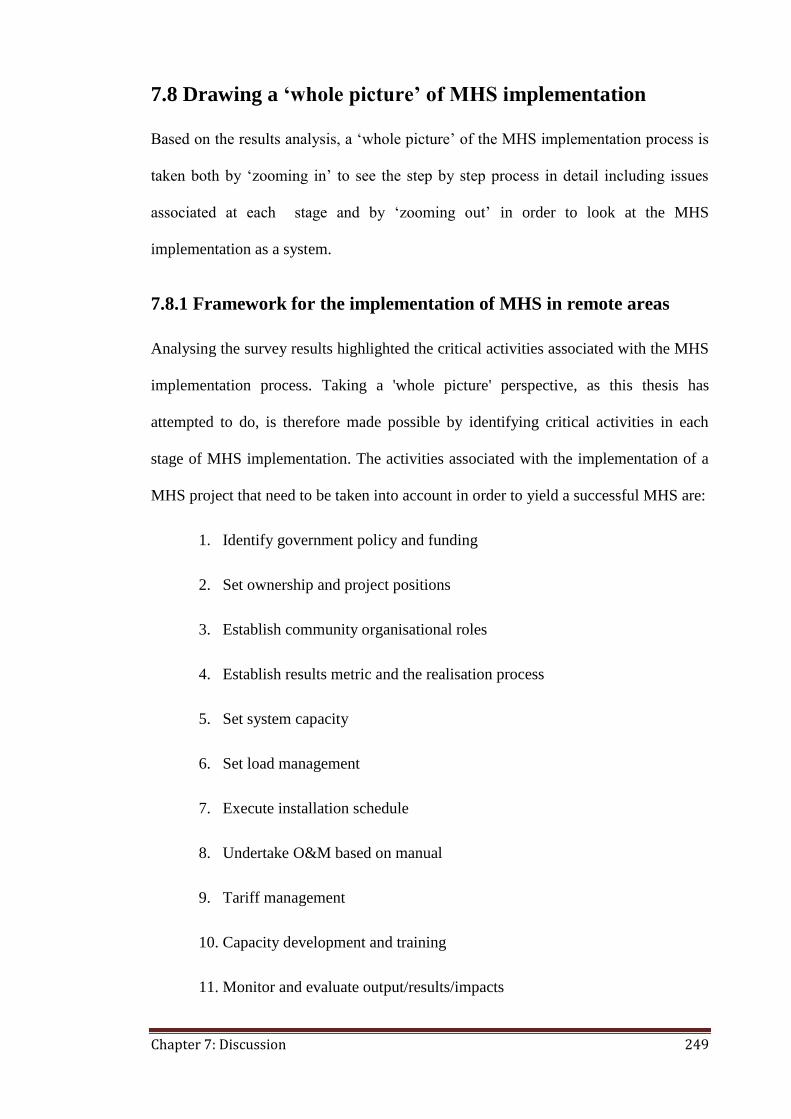
Chapter 7: Discussion 249
7.8 Drawing a ‘whole picture’ of MHS implementation
Based on the results analysis, a ‘whole picture’ of the MHS implementation process is
taken both by ‘zooming in’ to see the step by step process in detail including issues
associated at each stage and by ‘zooming out’ in order to look at the MHS
implementation as a system.
7.8.1 Framework for the implementation of MHS in remote areas
Analysing the survey results highlighted the critical activities associated with the MHS
implementation process. Taking a 'whole picture' perspective, as this thesis has
attempted to do, is therefore made possible by identifying critical activities in each
stage of MHS implementation. The activities associated with the implementation of a
MHS project that need to be taken into account in order to yield a successful MHS are:
1. Identify government policy and funding
2. Set ownership and project positions
3. Establish community organisational roles
4. Establish results metric and the realisation process
5. Set system capacity
6. Set load management
7. Execute installation schedule
8. Undertake O&M based on manual
9. Tariff management
10. Capacity development and training
11. Monitor and evaluate output/results/impacts
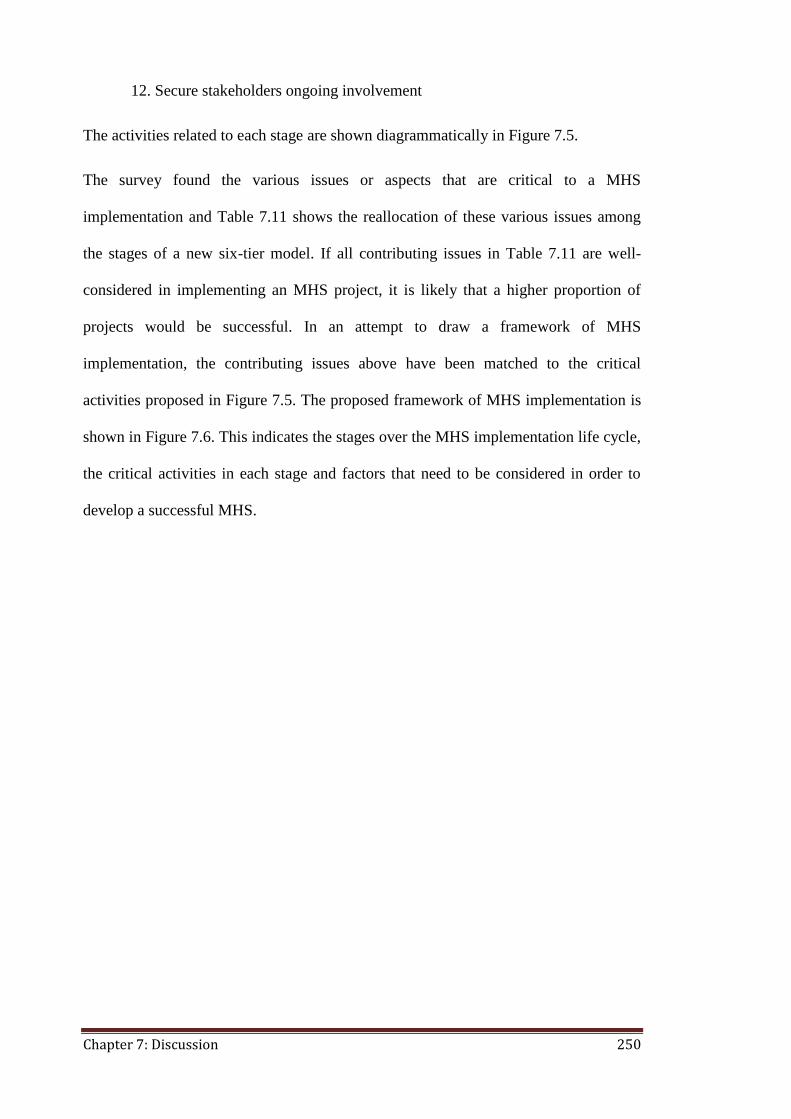
Chapter 7: Discussion 250
12. Secure stakeholders ongoing involvement
The activities related to each stage are shown diagrammatically in Figure 7.5.
The survey found the various issues or aspects that are critical to a MHS
implementation and Table 7.11 shows the reallocation of these various issues among
the stages of a new six-tier model. If all contributing issues in Table 7.11 are well-
considered in implementing an MHS project, it is likely that a higher proportion of
projects would be successful. In an attempt to draw a framework of MHS
implementation, the contributing issues above have been matched to the critical
activities proposed in Figure 7.5. The proposed framework of MHS implementation is
shown in Figure 7.6. This indicates the stages over the MHS implementation life cycle,
the critical activities in each stage and factors that need to be considered in order to
develop a successful MHS.
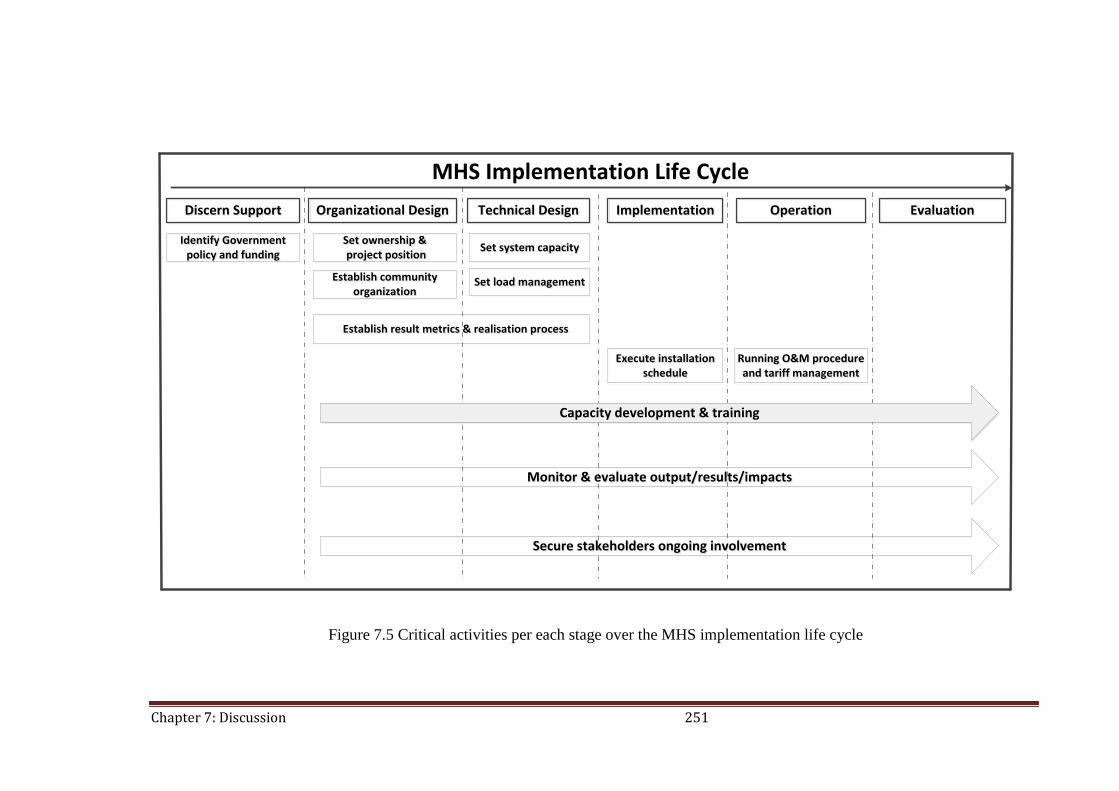
Chapter 7: Discussion 251
Figure 7.5 Critical activities per each stage over the MHS implementation life cycle
Technical Design Technical Design ImplementationImplementation OperationOperation EvaluationEvaluation
Set system capacity Set system capacity
Establish community organization
Establish community organization
Establish result metrics & realisation process Establish result metrics & realisation process
MHS Implementation Life Cycle
Set ownership & project position
Set ownership & project position
Discern SupportDiscern Support Organizational Design Organizational Design
Identify Government policy and funding
Identify Government policy and funding
Capacity development & training
Monitor & evaluate output/results/impactsMonitor & evaluate output/results/impacts
Secure stakeholders ongoing involvementSecure stakeholders ongoing involvement
Set load managementSet load management
Execute installation schedule
Execute installation schedule
Running O&M procedure and tariff management
Running O&M procedure and tariff management
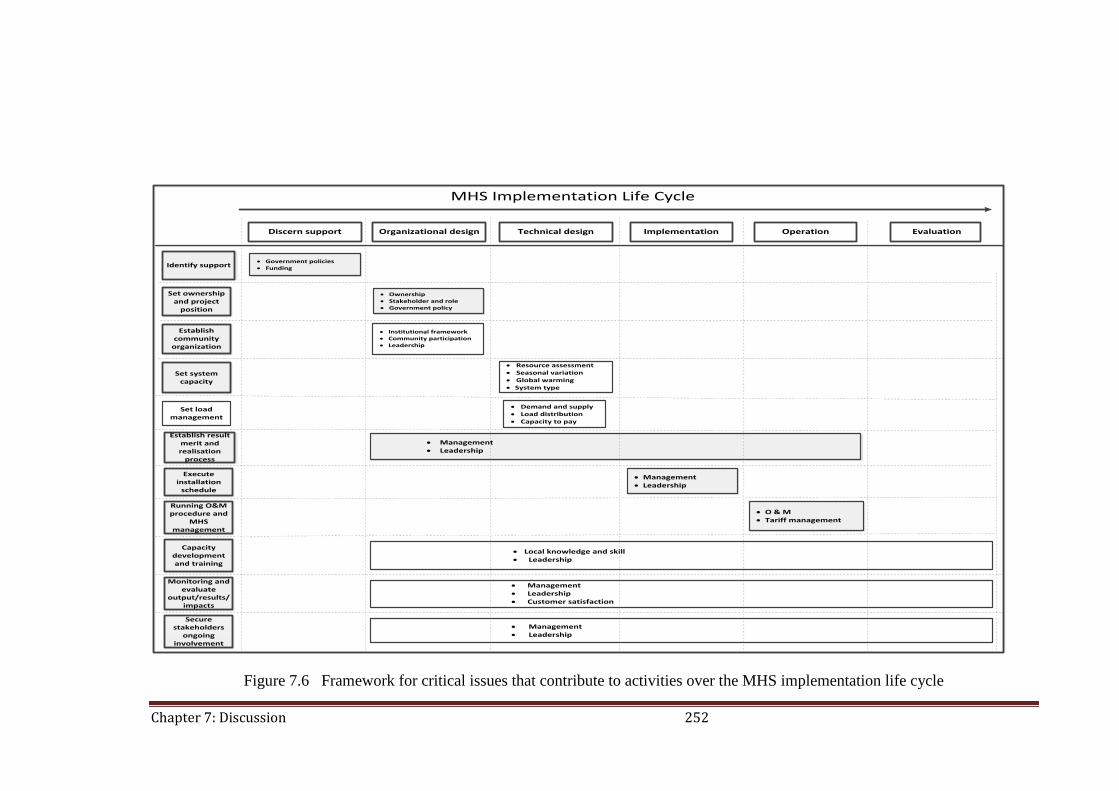
Chapter 7: Discussion 252
Figure 7.6 Framework for critical issues that contribute to activities over the MHS implementation life cycle
Set load management
· Demand and supply· Load distribution· Capacity to pay
Technical design
· Institutional framework· Community participation· Leadership
Implementation Operation
· Local knowledge and skill· Leadership
· Management · Leadership · Customer satisfaction
Evaluation
· Management· Leadership
Establish community
organization
Set system capacity
Establish result merit and realisation
process
· Management· Leadership
· Government policies· Funding
Execute installation
schedule
Monitoring and evaluate
output/results/impacts
Secure stakeholders
ongoing involvement
Running O&M procedure and
MHS management
Capacity development and training
· O & M · Tariff management
· Management· Leadership
Organizational designDiscern support
Identify support
Set ownership and project
position
· Resource assessment· Seasonal variation· Global warming· System type
· Ownership· Stakeholder and role· Government policy
MHS Implementation Life Cycle
Chapter 7: Discussion 253
Based on findings from the four MHS case studies, the explanations of critical issues
in Figure 7.6 that could lead to a project being successful are presented below
according to MHS project life cycle.
(a) Discern support
· Deployment of government policies, especially those policies relating to
renewable energy, need to be augmented in order to educate and help the
community propose renewable energy projects that can both achieve
government policy objects and meet the community have needs and match the
community’s circumstances.
· Any funding contribution from the community towards the construction of the
MHS project may raise the community’s sense of ownership of – and/or
belonging to the project as well as their awareness of the factors that will
contribute to the success of the project.
(b) Organisational design
· The project needs to be clearly positioned in terms of the organisational
aspects, including definition of the ownership, who the stakeholders are and
their roles at each stage of the project, and the intensity of community
participation.
· A non-profit community organisation, a social enterprise form, that will take
over the MHS management and will have responsibility for its ongoing
performance should be formed. The role of a leader, in ensuring that all
community members are willing to contribute and to agree on how they will
work either individually or together in order to run the MHS smoothly, is vital.
Chapter 7: Discussion 254
· An institutional framework should be established (an integration of formal
institutional frameworks with the informal (indigenous) institutional
frameworks) on how the government, community and all stakeholders interact
and work together.
(c) Technical design
· Resource assessment method: the equipment used, the time (in the year) that
the flow rate measurements are taken and the duration over which
measurements are taken need to be carefully considered in order to ensure that
the data obtained is accurate and reliable.
· Long term flow rate data and the impact of climate change on river flow rates
at the MHS site need to be considered in order to determine reliable system
capacity.
· Determining the MHS capacity should be based on resource availability in
combination with a demand assessment.
· Understanding current energy use patterns will assist in designing the load
distribution and in setting regulation on load management.
· In those situations where the amount of electricity that could be generated and
supplied exceeds current demand, opportunities for utilisation of the excess
power to benefit the community need to be deliberated.
· In those situations where the amount of electricity supplied is less than the
demand, mechanisms for regulating the total load and how the load will be
distributed, including fines/penalties for over use, need to be considered and
put into effect.

Chapter 7: Discussion 255
· Planning of load distribution needs to be undertaken in consultation with the
community at a very early stage in order to help community understanding of
the situation and the need to limit the loads.
· Involvement of particular stakeholders in every stage needs to be enhanced.
· Designers should be prepared to perceive constraints as challenges and to be
creative so as to design a multipurpose project if applicable.
· Future demand needs to be considered when designing the MHS capacity.
· MHS projects should be designed thoughtfully in order to recognise the need
for and to incorporate capacity building where needed.
(d) Implementation
· Community involvement to the MHS project should be maximised in order to
strengthen the sense of ownership and belonging, and to avoid project
rejection.
· The establishment of agreements on legal recognition is important to avoid
subsequent ownership or privilege disputes.
· The quantum and the means of funding the operation and maintenance (O&M)
budget needs to be considered carefully to ensure that the O&M can be
undertaken smoothly.
(e) Operation
· Strong local community leadership is needed to strengthen the communication,
cooperation and commitment among community members.
· Developing technical knowledge, skill and attitudes, as well as managerial
skills, including book keeping, needs to be enhanced to support the
Chapter 7: Discussion 256
community’s ability to run the MHS effectively, especially for those projects
that are handed over to the community post-commissioning.
· A transparent and clear tariff collection procedure needs to be put into effect to
prevent access from being determined on the basis of social status, kinship or
any other basis that would give rise to disputes.
· Providing demand management training at the beginning of the project may
help the members of a community to be more ready to operate the system
effectively.
(f) Evaluation
· Load factors need to be taken into account from the beginning, to be set
reasonably and the options for how to achieve them need to be considered.
· The level of satisfaction among community members very much depends on
the users’ perception/expectation of electrification through an MHS.
Community consultation before the project implementation is therefore clearly
important.
· Electricity tariffs need to be determined respectfully (fair and equitable) in
accordance to fit community’s capacity to pay, while being adequate to cover
the O&M cost appropriately. The lack of an adequate O&M budget may have
negative impacts, such as delays in the replacement of components replacement
and repairs.
· MHSs have positive impacts in terms of reducing expenditure on energy as fuel
(petrol, diesel) prices are very high in these remote areas. Community
education on the optimal uses of those savings could be beneficial.
Chapter 7: Discussion 257
· Electricity demand of local businesses is characterised by lighting for
handcrafts production, retail shops, cafés, as well as cooling and the
preservation of food (drinks and meat). In order to promote economic
development, other productive services that use larger amounts of power and
that could not be supplied prior to the construction of the MHS capacity should
be factored into the MHS planning.
· As well as providing numerous benefits for a community, it needs to be
anticipated that the construction of an MHS may also have negative impacts,
such as increasing the amount of time spent watch TV and reducing the amount
of time spent in social engagement or in undertaking productive activities.
7.8.2 Systemic model for MHS implementation
It was found that there are multiple disciplines and issues involved in the
implementation of an MHS project. This makes MHS implementation is highly
complex. Figures 7.5 and 7.6 depict the MHS implementation process in detail,
step by step including issues that need to be considered. On the other hand, it is
also important to picture the MHS implementation process as a system to help
build an understanding of what the MHS implementation process actually is, and
the Venn diagram of Figure 7.7 was used to try and achieve this.
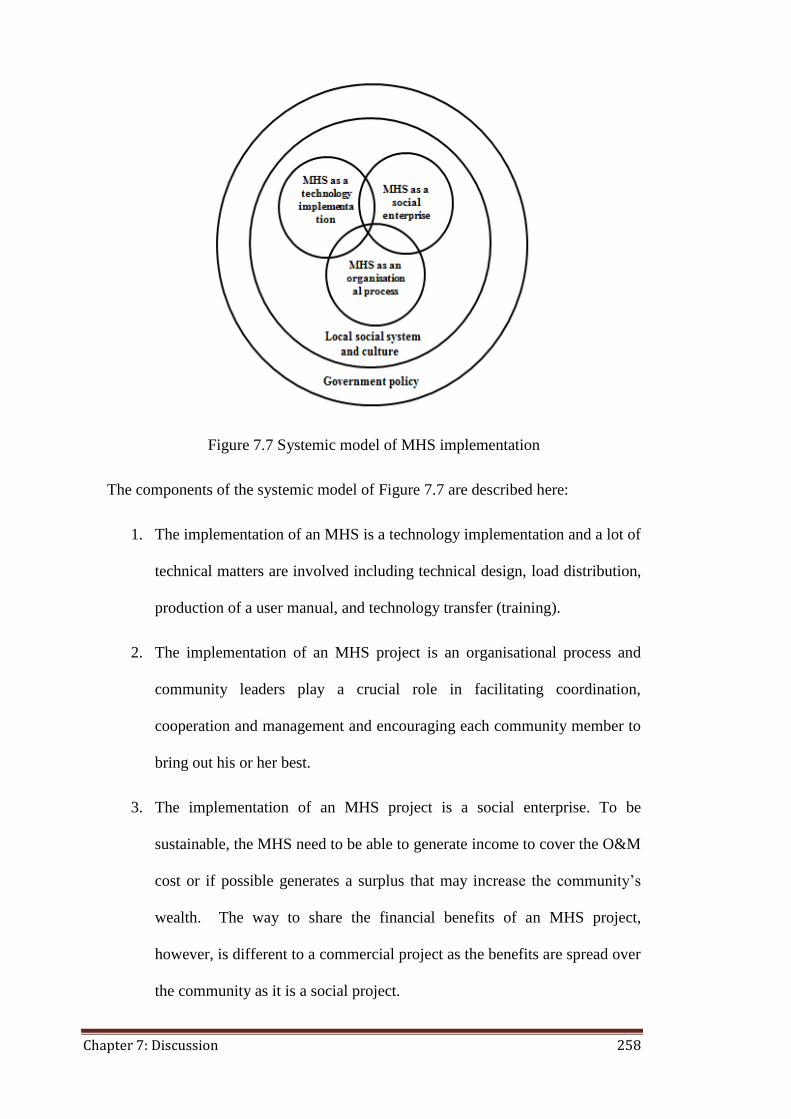
Chapter 7: Discussion 258
Figure 7.7 Systemic model of MHS implementation
The components of the systemic model of Figure 7.7 are described here:
1. The implementation of an MHS is a technology implementation and a lot of
technical matters are involved including technical design, load distribution,
production of a user manual, and technology transfer (training).
2. The implementation of an MHS project is an organisational process and
community leaders play a crucial role in facilitating coordination,
cooperation and management and encouraging each community member to
bring out his or her best.
3. The implementation of an MHS project is a social enterprise. To be
sustainable, the MHS need to be able to generate income to cover the O&M
cost or if possible generates a surplus that may increase the community’s
wealth. The way to share the financial benefits of an MHS project,
however, is different to a commercial project as the benefits are spread over
the community as it is a social project.
Chapter 7: Discussion 259
4. The way that social enterprise is formed and the management of the MHS
very much depends on the local social system and culture.
5. The local social system and culture have considerable influence in the way
the community builds and runs the three concepts above. Community
behaviour, characteristics, and motivations have an influence on the
organisational culture and management. The overarching government
policies help to provide a supportive environment.

Chapter 7: Discussion 260
Chapter 8: Summary and conclusion 261
Chapter 8
Summary and Conclusion
Overview
The purpose of this final chapter is to return to the original research questions and to
summarise the extent to which this study has been able to provide answers to those
questions, to extract from this the recommendations that can be made regarding the
implementation of rural electrification programs in developing countries based on
renewable energy and on MHSs in particular, and make suggestions as to what further
research in this field is required or would be useful.
8.1 Answering the research questions
The first research question that led to this research was that of ‘What are the critical
reasons behind the reported lack of success of some rural electrification projects based
on the use of MHSs?’ While similar questions have been behind much of the research
involving the evaluation of renewable energy projects in developing countries
undertaken to date, the argument put forward at the start of this thesis was that
attempting to answer these kind of questions is difficult as the issues associated with
renewable energy projects or programs in these situations tend to be quite large in
number and complex in their nature. A corollary of this argument is that most of those
previous studies have not been able to completely answer this question as the answers
that they have provided have not been based on a comprehensive understanding of
these programs or how they are planned, designed and implemented. This study has
focused on MHS projects and has attempted to address some of the important issues
Chapter 8: Summary and conclusion 262
that have not been addressed in previous studies, such as the importance of MHS
sizing, the benefits that they provide to the communities that they are used to supply,
and the problems associated with the programs from the perspectives of all
stakeholders.
The second research question that has underpinned this study was that of ‘What are the
key issues that need to be considered and addressed in order to ensure that rural
electrification projects involving the use of MHS are successful?’ In order to answer
this question, a second argument was developed, which was that the issues that need to
be considered and factored into decision making in the design, planning and
implementation of an MHS project, in order for it to be successful, vary according to
the approach or the aim of the program, and that a pre-condition of program success is
that, whether the approach is political or institutional, a well-coordinated institutional
and policy framework needs to exist at both national and local level.
In order to test the above arguments and to address the research questions, this study of
MHS rural electrification programs has used a range of strategies or approaches. These
have included a comprehensive literature review, a questionnaire, energy audits, focus
group surveys, field observations and interviews with different stakeholders in two
lokasi in Ba’kelalan and one lokasi and one larger village in Krayan. The aim was to
obtain a more complete understanding of these programs, of the impacts and benefits
and of the issues associated with their planning and implementation from the
perspective of all of the stakeholders involved in the projects. The question that now
needs to be asked is to what extent these aims were achieved and to what extent the
research questions have been answered and the explanations or hypotheses that were
put forward supported.
Chapter 8: Summary and conclusion 263
8.1.1 Reasons for the limited success of some MHS programs
in the “Heart of Borneo”
One of the main reasons for the limited success of many of the MHS projects
undertaken in the remote highland areas of Malaysia and Indonesia was found to be a
lack of technical and operational awareness. This finding confirmed what has been a
commonly reported conclusion in the literature. Many studies in this field have
reported that program implementers fail to recognise the need for the system to be
sized and designed using accurate measurements of the hydrological resources
available to the community.
Another common reason for the limited success of many of the MHS projects was
found to be a lack of readiness of the local community to take on the responsibility for
running the operation and maintenance of an MHS. The lack of readiness was found
not only to be a lack of technical knowledge, but also a lack of training and
understanding of MHS management. The remedy to this problem was to involve
members of the local community at an early stage so as to facilitate an understanding
of the principles of an MHS how the system operates, what needs to be undertaken to
ensure that the systems continues to run smoothly, the types of problems or faults that
may arise and how they can be solved. That is, the better the community’s
understanding is of the whole system and their role, the more prepared and able the
community will be to take on the ongoing operation and maintenance of the system.
It was found that the funding for these village-scale MHSs usually covered the
equipment and construction, but did not include a budget for the ongoing O&M budget
and cost had to be raised by the community. Ensuring that the community sets up a
Chapter 8: Summary and conclusion 264
system for raising enough funds to cover the operational, maintenance and eventual
equipment replacement costs is crucial. Therefore, it is important to treat the MHS as a
social enterprise that should generate adequate income to cover the O&M cost, or to
generate surplus income, if possible, that can be used to increase community’s wealth.
It needs to be recognised, however, that the management of a village scale MHS
project is different to that of a commercial-scale hydro project as, in the case of a
village MHS project, the benefits are distributed and shared over the community and it
is very much a social rather than a purely commercial project.
The members of the communities supplied by MHS were found to benefit in several
ways as a result of the implementation of the MHS project. Using the electricity
supplied from the MHS to increase the number and range of productive activities
undertaken so as to enable members of the community to earn additional income,
however, tended not to be one of these benefits reported although the potential to do so
appeared to exist. Finding ways to encourage communities to derive greater economic
benefits from an MHS therefore appeared to be an area in which more could be done.
The primary or overarching finding was that for an MHS project to be successful, the
community that is to be supplied with the MHS electricity needs to be involved and
engaged from the very start and to continue to be involved in all stages from the
planning to the design, implementation, operation and maintenance and evaluation
stages.
Chapter 8: Summary and conclusion 265
8.1.2 Key issues in implementing a successful MHS in remote
rural areas.
The key issues that need to be addressed in order to develop a successful MHS project
have been identified and discussed in this study. The issues have been grouped
according to the stages of the project to get an overview of MHS implementation over
the lifetime of the project (Table 7.11). The main conclusions that can be drawn from
discussion of these issues are presented below.
It was found that the stakeholders involved in an MHS project generally vary, but can
include the project initiator, the government, a funding body, equipment manufacturers
and suppliers, the members of the community that the MHS will be used to supply
electricity to, and government agencies such as departments of works and electricity
authorities. The numbers and types of stakeholders involved vary and depend largely
on the mechanism used to fund the construction of the scheme. This variability in
terms of the stakeholder mix means that there is not one single approach used for
planning, implementation, operation and management. The process used for each MHS
project is unique to that project and this unique process has a very significant impact
on the project outcomes and performance.
One of the large factors impacting on the planning and implementation of MHS
projects is clearly remoteness. The remoteness of an area in which MHS projects are
undertaken influences the effectiveness of communication between the government
and community. In areas that are very remote, the government-community
communication link can be weak. Long distance, poor accessibility and limited modes
of transportation available to reach an area hinder the government’s ability, whether at
Chapter 8: Summary and conclusion 266
a national, provincial, regency or sub-district level, to be actively involved and
informed. It is difficult for government representatives to visit the sites and the villages
to observe the actual conditions or to oversee the development of the MHS. High
transportation costs and difficult transportation logistics often mean that the project
budgets provided by government prove to be inadequate. Remoteness also impacts on
the degree to which government policies are delivered and implemented in an area.
Remoteness can mean poor intra- and inter-departmental coordination that hinders the
implementation of a government’s renewable energy policies in remote areas and this
is particularly so in the case of MHS projects as these tend to be undertaken in remote
areas. Government policy objectives in implementing an MHS project may not be
clearly stated or understood, which renders the task of assessing the successfulness of
the project, in terms of delivering government policy, difficult.
These problems were highlighted in this study by the fact that although Indonesia has
more progressive policy and programs related to MHSs than Malaysia, the degree of
success of MHSs in the research area was not determined by the existence of national
or state government policy. One of the possible conclusions that can be drawn from
this is that the existence of policies (government support) does not always assure that
the implementation of an MHS in a remote area will work well, and that remoteness
may be one of the contributing factors in this study. The distance between national
centres of policy and decision making and remote areas such as these, as well as the
many governmental layers between national level and local level in remote areas, may
dilute and disperse national policies along the way, so that the national policies are
effectively not implemented at the local level in these remote areas.
Chapter 8: Summary and conclusion 267
Community readiness to handle an MHS project is an important issue in implementing
MHS in remote rural areas. Local knowledge and skill, leadership and management are
some of factors that significantly contribute to the success of an MHS project.
8.2 Lessons learned
The implementation of MHS projects differs from one site to another and needs to be
tailored and adjusted to suit the local/community. MHS implementation is unique in
many ways. Firstly, there are many factors that contribute to the success of the MHS,
yet the degree to which each factor contributes to success and the intensity of the
interaction between factors differ from one project to another. Secondly, every single
site is unique and for that reason the design and construction differ from one site to
another. A method or type that works well in one site may not yield the same result in
another site. For example, the case studies presented showed that the degree of
effectiveness of implementing current limit devices as a means of improving system
reliability varied from one case study to another. Thirdly, the community’s
characteristics, behaviours, motivations and expectations, as well as the local social
system and culture, also differ from one community to another. Therefore, the way in
which the community organisation is formed and the management style that suits the
community are also specific to the community.
The existence of guidelines, roadmaps or frameworks for MHS implementation is
helpful by way of providing a process for developing a very carefully planned and
detailed project management plan. The execution will differ, however, as it is
influenced by the way (creativity) the designer /manager approaches the problem and
the differences of one person/group to another.
Chapter 8: Summary and conclusion 268
The existing guidelines for off-grid micro hydropower schemes for rural electrification
prepared by the Indonesian government and GIZ (MEMR and GIZ, 2011) are very
sophisticated and require significant resources to justify their use for MHS project
development and may be more appropriate for larger hydro schemes but would be
difficult to justify for MHS projects.
This study has provided a streamlined guide to develop and implement MHS in remote
rural areas in developing countries.
8.3 Limitations of the study
Despite detailed planning for the data collection, unpredictable situations were
encountered during the fieldtrip that hindered the smooth collection of data and it was
not possible to overcome all of the constraints that had the potential to become sources
of errors. All conclusions drawn above are thus made with due reference to the
following limitations:
· The flow rate in this study was not measured during the dry season, which
would have been preferable, since the priority was to conduct the fieldtrip at a
convenient time for survey participants and unfortunately it was impossible to
synchronize both interests.
· The attempt to collect long-term river flow rate data, including hydrological
data, was not successful. A number of attempts were made by the author during
the study to contact institutions in order to obtain long-term hydrological data.
It was found, however, that due to a lack of weather stations and equipment in
these areas the data very likely does not exist. The same issue confronts
designers of MHS in remote areas and restricts the design flow rate to that of
Chapter 8: Summary and conclusion 269
spot readings taken in the dry season, an inadequate approach as documented in
this thesis.
· A lack of personal contacts within government, especially in Malaysia, proved
to be a considerable obstacle. A letter by the author requesting an interview
with a national or state government representative was sent via email to the
government department. The response received was that “finding the right
person or obtaining the information would be difficult”.
· At the time that the preliminary fieldtrip was undertaken, the MHS in Liang
Butan was operating and it was therefore selected as one of the case studies for
Krayan. Unfortunately, during the subsequent fieldwork the MHS in Liang
Butan was out of operation. A follow-up fieldtrip was conducted to see whether
this MHS had been fixed and to update the data if applicable, but it was found
that the MHS was still not working. As there was no other government MHS
project in Krayan, the MHS in Liang Butan was retained as case study while
noting the problems associated with doing so.
· The results for Ba’kelalan and Krayan are based on four MHS projects. The
number was limited to these four due to the time and budget constraints of a
Ph.D study. Different results may have been obtained if all of the MHS projects
in both Ba’kelalan and Krayan were included as case studies.
· This study placed most focus and detailed discussion on factors related to the
planning and design stage of an MHS project. In practice there are likely to be
other important factors that need to be considered including cultural/social
aspects such as the values, norms power dynamics of the society.
Chapter 8: Summary and conclusion 270
8.4 Recommendations for future research
Based on the findings of this research some suggestions for useful future research in
this area are:
· Research to determine improved methods for obtaining reliable estimates of
seasonal flow rates in remote areas.
· The design of effective stakeholder training programs and a method of
evaluating the extent to which the training program affects the success of an
MHS project.
· The application of the critical activities and issues identified in this study to a
new MHS project and the development of a method for measuring the
effectiveness of using this approach.
· A broader investigation involving a larger number of MHS projects in order to
obtain a more complete picture of the influence of all factors involved in MHS
project design, planning and implementation in remote areas in developing
countries.
· A further investigation on impact of remoteness of villages to national policy
to determine whether national policy plays more of a role in less remote areas
of Indonesia and Malaysia.
· A study that focuses on assessing the impact of national policy to the
implementation of successful MHS in remote rural areas versus less remote
areas using multiple case studies in several developing countries.
Chapter 8: Summary and conclusion 271
· An assessment on the contribution of cultural/social factors to successful MHS
implementation in remote rural areas.
· Compilation of findings into a dedicated set of guidelines for MHS projects in
remote areas.

Chapter 8: Summary and conclusion 272
References 273
References
Abdullah, K., 2005. Renewable Energy Conversion and Utilization in ASEAN Countries Energy,
Vol. 30, 2-4, pp. 119-128. Abe, H., Katayama, A., Sah, B. P., Toriu, T., Samy, S., Pheach, P., Adams, M. A. & Grierson,
P. F., 2007. Potential for Rural Electrification Based on Biomass Gasification in Cambodia. Biomass and Bioenergy, Vol. 31, 9, pp. 656-664.
Academy of Science Malaysia. 2013. Sustainable Energy Options for Electric Power Generation in Peninsular Malaysia to 2030. Available: http://www.akademisains.gov.my/download/monograph/Sustainable%20Energy%20Options.pdf [Accessed 7 December 2013].
ADB. 1998. Project Performance Audit Report on the Mini-hydropower Project in Nepal. Available: http://www.adb.org/sites/default/files/pe-503.pdf [Accessed 5 May 2011].
ADC. 2001. Bhutan Subprogram Energy 2005–2007 Support of Rural Energy, Hydropower Generation and Capacity Building. Available: http://www.raonline.ch/pages/bt/pdf/OEZA_BhutanEnergy07.pdf [Accessed 17 September 2011].
Ahmad, S., Kadir, M. Z. A. A. & Shafie, S., 2011. Current Perspective of The Renewable Energy Development in Malaysia. Renewable and Sustainable Energy Reviews, Vol. 15, 2, pp. 897-904.
Akgün, O. & Luukkanen, J., 2012. Extension of Rice Husk Gasification Technology for Electricity Generation in Cambodia Energy Procedia, Vol. 14, pp. 1244-1249.
Annemarije L, Dijk, K. V. & Clancy, J., 2010. Impacts of Electricity Access to Rural Enterprises in Bolivia, Tanzania and Vietnam. Energy for Sustainable Development, Vol. 14, pp. 14-21.
Anon. n.d. Borneo's New World: Newly Discovered Species in the Heart of Borneo. Available: http://www.wwf.or.id/en/news_facts/reports/?19201/New-WWF-report-Borneos-New-World-Newly-Discovered-Species-in-the-Heart-of-Borneo [Accessed 16 June 2010].
Anyi, M., Kirke, B. & Ali, S., 2010. Remote Community Electrification in Sarawak, Malaysia. Renewable Energy, Vol. 35, 7, pp. 1609-1613.
ARE. 2011. Best Practice of the Alliance for Rural Electrification: What Renewable Energy Can Achieve in Developing Countries. Available: http://www.ruralelec.org/fileadmin/DATA/Documents/06_Publications/Misc/ARE_Best_Practice_2011.pdf [Accessed 27 October 2013].
ARE. 2012. The Potential of Small And Medium Wind Energy in Developing Countries: A Guide for Energy Sector Decision-makers. Available: http://www.ruralelec.org/fileadmin/DATA/Pictures/07_Publications/ARE_Small_Wind_Position_Paper.pdf [Accessed 27 October 2013].
Arnstein, S. R., 1969. A Ladder of Citizen Participation. Journal of the American Planning Association, Vol. 35, 4, pp. 216-224.
AUSAID. 2000. Power for the People: Renewable Energy in Developing Countries. Available: http://www.ausaid.gov.au/Publications/Documents/renewable_energy.pdf [Accessed 8 October 2013].
AUSAID. n.d. Strategy for Support to Indonesia’s National Program for Community Empowerment (PNPM). Available: http://www.ausaid.gov.au/Publications/Pages/8242_4717_3585_4837_8406.aspx [Accessed 8 October 2013].
References 274
Australian Government, 2013. National Statement on Ethical Conduct in Human Research 2007 (updated May 2013).Canberra, Australian Government.
Azahari, H. L., 2012. New and Renewable Energy Policies. Conference and Exhibition EBTKE 2012.Jakarta.
Bajracharya, T. R., 2012. Addressing Climate Change and Ensuring Energy Security in Nepal through Enhancing Renewable Energy Technology. 6th International Conferences and Planning Workshop of the University Network for Climate and Ecosystems Change and Adaptation Research (UN_CECAR) on Renewable Energy. Chulalongkom University, Thailand.
Balakrishnan, L., 2006. Women and Micro-hydro Systems. Himalayan Small Hydropower Summit.Dehradun.
Basak, S., Baug, A., Mitra, P. & Chatterjee, S., 2013. Role of Government in Promoting Renewable Resources in India. International Journal of Emerging Technology and Advanced Engineering, Vol. 3, 3, pp. 504-513.
Baxter, P. & Jack, S., 2008. Qualitative Case Study Methodology: Study Design and Implementation for Novice Researchers The Qualitative Report, Vol. 13, 4, pp. 544-559.
Bernama. 2009. RM9 Million for Transporting Essential Goods to Rural Areas. Bernama [Online]. Available: http://kpdnkk.bernama.com/news.php?id=424221& [Accessed 17 June 2010].
Bischoff, I., 2007. Institutional Choice Versus Communication in Social Dilemmas—An Experimental Approach. Journal of Economic Behavior & Organization Vol. 62, 1, pp. 20-36.
Boedoyo, M. S. & Sugiyono, A., 2010. Decentralized Power Generation in Indonesia: Current Issue and Prospects. Tech Monitor, Vol. May-June, pp. 31-36.
Borhanazad, H., Mekhilef, S., Saidur, R. & Boroumandjazi, G., 2013. Potential Application of Renewable Energy for Rural Electrification in Malaysia. Renewable Energy, Vol. 59, pp. 210-219.
Borneopost. 2010. Long Road Project Luping-Ba 'Kelalan Christmas Day Gift Population. The Borneopost Online [Online]. Available: http://www.theborneopost.com/2010/12/15/projek-jalan-long-luping-ba%e2%80%99-kelalan-hadiah-hari-krismas-penduduk/#ixzz2AydqnMvd [Accessed 18 December 2010].
Bryan, J. E., Shearman, P. L., Asner, G. P., Knapp, D. E., Aoro, G. & Lokes, B., 2013. Extreme Differences in Forest Degradation in Borneo: Comparing Practices in Sarawak, Sabah, and Brunei. Plos One, Vol. 8, 7.
Butler, R. A. n.d. Borneo. Available: http://www.mongabay.com/borneo.html [Accessed 3 March 2011].
Carlson, K. M., Curran, L. M., Ratnasari, D., Pittman, A. M., Soares-Filho, B. S., Asner, G. P., Trigg, S. N., Gaveau, D. A., Lawrence, D. & Rodrigues, H. O., 2012. Committed Carbon Emissions, Deforestation, and Community Land Conversion from Oil Palm Plantation Expansion in West Kalimantan, Indonesia. The National Academy of Science of the United States of America.
Castellarin, A., Galeati, G., Brandimarte, L., Montanari, A. & Brath, A., 2004. Regional Flow-duration Curves: Reliability For Ungauged Basins. Advances in Water Resources Vol. 27, pp. 953-965.
Chakraborty, M., 1998. Conflict and Participation in Community Based Fresh Water Resource Management: The Case of Chandrabhaga Stream in Garhwal Himalaya, Uttarpradesh.Washington DC, The World Bank/WBI’s CBNRM Initiative.
References 275
Chaureya, A. & Kandpal, T. C., 2010. A Techno-economic Comparison of Rural Electrification Based on Solar Home Systems and PV Microgrids. Energy Policy, Vol. 38, 6, pp. 3118-3129.
Chew, D., Ardhana, I. K. & Langub, J., 2004. Borders of Kinship and Ethnicity: Cross-border Relations Between the Kelalan Valley, Sarawak and the Bawan Valley, East Kalimantan. Borneo Research Bulletin, Vol. 35, pp. 144-179.
Combs, S. n.d. Feedlot Biomass. Available: http://www.window.state.tx.us/specialrpt/energy/renewable/feedlot.php [Accessed 5 July 2012].
Curran, L. M., Trigg, S. N., McDonald, A. K., Astiani, D., Hardiono, Y. M., Siregar, P., Caniago, I. & Kasischke, E., 2004. Lowland Forest Loss in Protected Areas of Indonesian Borneo. Science, Vol. 303, 5660, pp. 1000-1003.
Dapice, D. & Cunningham, E. A. 2011. Squaring the Circle: Politics and Energy Supply in Indonesia. Available: http://www.ash.harvard.edu/extension/ash/docs/squaring.pdf [Accessed 5 May 2012].
Dayo, F. B. 2008. Clean Energy Investment in Nigeria: The Domestic Context. Available: http://www.iisd.org/pdf/2008/cei_nigeria.pdf [Accessed 15 March 2012].
Delimar, M., Szabo, A. & Lugaric, L., 2007. First Integrated Electric Power System in Croatia. The International Conference on "Computer as a Tool".Warsaw.
Delivand, M. K., Barz, M., Gheewala, S. H. & Sajjakulnukit, B., 2011. Economic Feasibility Assessment of Rice Straw Utilization for Electricity Generating Through Combustion in Thailand. Applied Energy, Vol. 88, 11, pp. 3651-3658.
Dijk, E. V., Wilke, H. & Wit, A., 2003. Preferences for Leadership in Social Dilemmas: Public Good Dilemmas Versus Common Resource Dilemmas. Journal of Experimental Social Psychology, Vol. 39, 2, pp. 170-176.
Drinkwaard, W., Kirkels, A. & Romjin, H., 2010. A learning-based Approach to Understanding Succes in Rural Electrification: Insights from Micro Hydro Project in Bolivia. Energy for Sustainable Develpoment, Vol. 14, pp. 232-237.
Dudhani, S., Sinhab, A. K. & Inamdara, S. S., 2006. Assessment of Small Hydropower Potential Using Remote Sensing Data for Sustainable Development in India. Energy Policy, Vol. 34, 17, pp. 3195-3205.
Dulal, H. B., Shah, K. U., Sapkota, C., Uma, G. & Kandel, B. R., 2013. Renewable Energy Diffusion in Asia: Can It Happen Without Government Support? Energy Policy, Vol. 59, pp. 301-311.
Eghenter, C., 2007. Of Negotiable Boundaries and Fixed Lines in Borneo: Practices and Views of the Border in the Apo Kayan Region of East Kalimantan Moussons, Vol. 11, pp. 133 - 150.
Eghenter, C. & Langub, J., 2008. Past Meets Future: A Transborder Forum for A Sustainable Future For The Highlands of Borneo. Borneo Research Bulletin, Vol. 39, pp. 286-294.
Engkoeswara, 1998. Community Based IPM: A Farmer-driven Movement, A Field Case Study From Bali, Indonesia.Washington DC, The World Bank/WBI’s CBNRM Initiative.
Era-energy. n.d. Water Energy: Hydroelectric Power. Available: http://www.era-energy.com/water_power [Accessed 8 December 2013].
Eriksson, G. & Kjellström, B., 2010. Assessment of Combined Heat and Power (CHP) Integrated with Wood-based Ethanol Production. Applied Energy, Vol. 87, pp. 3632-3641.
ESHA. 2004. Guide on How to Develop a Small Hydropower Plant Available: http://www.esha.be/fileadmin/esha_files/documents/publications/GUIDES/GUIDE_SHP/GUIDE_SHP_EN.pdf [Accessed 11 February 2009].
Esplin, M. n.d. Here Beats the Heart of Borneo. Available: http://bruneitimesextra.com/heart-of-borneo/ [Accessed 6 November 2012].
References 276
Flyvbjerg, B. 2011. Case Study. In: Denzin, N. K. & lincoln, Y. S. (ed.) The Sage Handbook of Qualitative Research. Thousand Oaks, California: SAGE Publication. Inc.
Gable, G. G., 1994. Integrating Case Study and Survey Research Methods : An Example in Information Systems. European Journal of Information Systems, Vol. 3, 2, pp. 112-126.
Gill, A., Mosley, P. & Fulford, D. J., 1999. Community Micro-Hydro in LDCs: Adoption, Management and Poverty Impact Project 7110 Socio-economic Effects of MicroHydro in Nepal, Sri Lanka, Ethiopia and Uganda. The University of Reading.Available: http://r4d.dfid.gov.uk/PDF/Outputs/Energy/DFIDR7110.pdf
Gleason, W., 1981. Statistics: A First Course, Belmont, California, Wadsworth Publishing Company.
González, A. H., Aristizábal, A. B. & Díaz, R. M., 2009. Micro Hydro Power Plants in Andean Bolivian Communities: Impacts on Development and Environment. International Conference on Renewable Energies and Power Quality.Valencia, Italy.
Greacen, C. E., 2004. The Marginalization of “Small is Beautiful”: Micro-hydroelectricity, Common Property, and the Politics of Rural Electricity Provision in Thailand. Ph.D. Thesis, University of California, Berkeley
Green Empowerment & Richards, J. G. 2004. A Case Study of Comunity Based Micro Hydropower Long Lawen, Sarawak, Malaysia. Available: http://greenempowerment.org/wp-content/uploads/2013/08/LongLawenCaseStudy.pdf [Accessed 6 November 2012].
Green, S. B., Salkind, N. J. & Akey, T. M., 2000. Using SPSS for Windows: Analyzing and Understanding Data, Upper Saddle River, Prentice Hall
Gurung, A., Bryceson, I., Joo, J. H. & Oh, S.-E., 2011a. Socio-economic Impacts of Micro-hydropower Plant on Rural Livelihoods. Scientific Research and Essays, Vol. 6, 19, pp. 3964-3972.
Gurung, A., Gurung, O. P. & Oh, S. E., 2011b. The Potential of a Renewable Energy Technology for Rural electrification in Nepal: A Case Study from Tingting. Renewable Energy, Vol. 36, pp. 3203-3210.
Gurung, A., Ian, B. & Sang-Eun, O., 2011c. Micro-hydropower: A Promising Decentralized Renewable Technology and Its Impact on Rural Livelihoods. Scientific Research and Essays Vol. 6, 6, pp. 1240-1248.
Hardin, G., 1968. The Tragedy of the Commons. Science, Vol. 162, 3859, pp. 1243-1248. Harries, D. 2011. Hydroelectricity in Australia: Past, Present and Future. EcoGeneration
[Online]. Available: http://ecogeneration.com.au/news/hydroelectricity_in_australia_past_present_and_future/055974/ [Accessed 23 May 2012].
Hasan, M. H., Mahlia, T. M. I. & Nur, H., 2012. A Review on Energy Scenario and Sustainable Energy in Indonesia. Renewable and Sustainable Energy Reviews, Vol. 16, pp. 2316-2328.
Hashim, H. & Ho, W. S., 2011. Renewable Energy Policies and Initiatives for a Sustainable Energy Future in Malaysia. Renewable and Sustainable Energy Reviews, Vol. 15, pp. 4780-4787.
Herrmann, B., Thöni, C. & Gächter, S., 2008. Antisocial Punishment Across Societies. Science Vol. 319, pp. 1362-1367.
Hiloidhari, M. & Baruah, D. C., 2011. Rice Straw Residue Biomass Potential for Decentralized Electricity Generation: A GIS Based Study in Lakhimpur District of Assam, India. Energy for Sustainable Development, Vol. 15, 3, pp. 214-222.
Holland, R., Perera, L., Teodoro, S. & Wilkinson, R. 2005. Decentralised Rural Electrification: The Critical Success Factors Available:
References 277
http://practicalaction.org/docs/energy/Rural%20Electrification.PDF [Accessed 9 November 2013].
Horn, M. & Espinoza, R., 1995. Decentralised Rural Electrification in Peru. Sustainable Development of Rural Aareas.Marrakech, Marroco.
Hosseini, S. M. H., Forouzbakhsh, F. & Rahimpoor, M., 2005. Determination of The Optimal Installation Capacity of Small Hydro-power Plants Through The Use of Technical, Economic and Reliability Indices. Energy Policy Vol. 33, pp. 1948-1956.
IEA-PVPS. 2003. 16 Case Studies on the Deployment of Photovoltaic Technologies in Developing Countries. Available: http://www.rpc.com.au/pdf/rep9_07.pdf [Accessed 20 February 2011].
IEA. 2000. Hydropower and the Environment : Present Context and Guidelines for Future Action. 2. Available: http://www.ieahydro.org/reports/HyA3S5V2.pdf [Accessed 20 February 2011].
IEA. n.d. What Is Hydropower's History. Available: http://www.ieahydro.org/What_is_hydropower's_history.html [Accessed 3 September 2011].
Iimi, A. 2007. Estimating Global Climate Change Impacts on Hydropower Projects: Applications in India, Sri Lanka and Vietnam. Available: http://elibrary.worldbank.org/doi/pdf/10.1596/1813-9450-4344 [Accessed 7 June 2011].
IPCC. 2001. Climate Change 2001: The Scientific Basis. Available: http://www.grida.no/publications/other/ipcc_tar/?src=/climate/ipcc_tar/wg1/index.htm [Accessed 11 June 2011].
Irvine-Halliday, D. & Crain, S., 2000. Demand Side Management for Rural Nepal. Boiling Point Vol. 45, pp. 14-16.
Jacquet, J., Hauert, C., Traulsen, A. & Milinski, M., 2011. Shame and Honor Drive Cooperation. Biology Letter Vol. 7, pp. 899-901.
Jerome, N., 2013. Application of the Maslow’s Hierarchy of Need Theory; Impacts and Implications on Organizational Culture, Human Resource and Employee’s Performance. International Journal of Business and Management Invention, Vol. 2 3, pp. 39-45.
JICA. 2008. Master Plan Study for Rural Electrification by Renewable Energy in the Republic of Peru Available: http://dger.minem.gob.pe/archivos/PlanMaestro_ER_PeruSummary.pdf [Accessed 3 June 2011].
Jiménez, H., 1998. Management of the Bitaco River Watershed With Interinstitutional and Community Participation.Washington DC, The World Bank/WBI’s CBNRM Initiative.
Kaldellis, J. K., Vlachou, D. S. & Korbakis, G., 2005. Techno-economic Evaluation of Small Hydro Power Plants in Greece: A Complete Sensitivity Analysis. Energy Policy 33, Vol. 33, pp. 1969-1985.
Kapur, T., Kandpal, T. C. & Garg, H. P., 1996. Electricity Generation From Rice Husk In Indian Rice Mills: Potential And Financial Viability. Biomass and Bioenergy, Vol. 10, 5/6, pp. 393-403.
Karki, S. K., Mann, M. D. & Salehfar, H., 2005. Energy and Environment in the ASEAN: Challenges and Opportunities. Energy Policy, Vol. 33, 4, pp. 499-509.
Khennas, S. & Barnett, A., 2000. Best Practices for Sustaibanle Development of Micro Hydro Power in Developing Countries. Final Synthesis Report, Contract R7215. London, UK, Department for International Development, ITDG.Available: http://www.microhydropower.net/download/bestpractsynthe.pdf
Khwaja, A. I., 2004. Is Increasing Community Participation Always Good Things? Journal of the European Economic Association Vol. 2, 2-3, pp. 427- 436.
References 278
Khwaja, A. I. 2005. Measuring Empowerment at the Community Level: An Economist’s Perspective. In: Narayan, D. (ed.) Measuring Empowerment: Cross-Disciplinary Perspectives. Washington, DC: World Bank.
Khwaja, A. I., 2009. Can Good Projects Succeed in Bad Communities? Journal of Public Economics, Vol. 93, pp. 899-916.
Kirubi, C., Jacobson, A., Kammen, D. M. & Mills, A., 2009. Community-Based Electric Micro-Grids Can Contribute to Rural Development: Evidence from Kenya. World Development Vol. 37, pp. 1208-1221.
Klunne, W. J., 2010. Sustainable Implementation of Microhydro to Eradicate Poverty in Africa. XXI World Energy Congress.Montreal.
Klunne, W. J. & Michael, E. G., 2009. Increasing Sustainability of Rural Community Electricity Schemes – Case Study of Small Hydropower in Tanzania. SET2009 - 8th International Conference on Sustainable Energy Technologies.Aachen, Germany.
Kollock, P., 1998. Social Dilemmas: The Anatomy of Cooperation. Annual Review of Sociology, Vol. 24, pp. 183-214.
Kugler, T. & Bornstein, G., 2013. Social Dilemmas Between Individuals and Groups. Organizational Behavior and Human Decision Processes, Vol. 120, 2, pp. 191-205.
Kumar, A., Schei, T., Devernay, J.-M., Freitas, M., Hall, D., Killingtveit, Å. & Liu, Z., 2011. Hydropower. In: Edenhofer, O., Pichs-Madruga, R., Sokona, Y., Seyboth, K., Matschoss, P., S. Kadner, T. Z., Eickemeier, P., Hansen, G., Schlömer, S. & Stechow, C. V. (ed.)(eds.) IPCC Special Report on Renewable Energy Sources and Climate Change Mitigation.Cambridge, United Kingdom and New York, USA, Cambridge University Press.
Langley, R., 1970. Practical Statistics for Non-mathematical People, Newton Abbot, Devon, W J Holman Limited Dawlish.
Langub, J. & Chew, D., 2009. The Social Impact of Mobile Phone Usage on the Lun Dayeh Community in Kecamatan Krayan Induk, Kalimantan Timur. Second E-Bario Knowledge Fair.Bario.
Lapin, L. L., 1980. Statistics Meaning and Methods, New York, Harcourt Brace Jovanovich Inc. Lasimbang, A. 2009. "A Simple Technology for Complicated Woe" Community Based Micro
Hydro for Rural Electrification in Sabah and Sarawak. Available: http://indigenouspeoplesissues.com/index.php?option=com_content&view=article&id=1497:a-simple-technology-for-complicated-woe-micro-hydro-in-sabah-and-sarawak&catid=32&Itemid=65 [Accessed 7 June 2011].
Legros, G., Havet, I., Bruce, N. & Bonjour, S. 2009. The Energy Access Situation in Developing Countries: A Review Focusing on the Least Developed Countries and Sub-Saharan Africa. [Accessed 3 May 2013].
Lejeune, A. & Hui, S. 2012. Hydro Power: A Multi Benefit Solution for Renewable Energy. Comprehensive Renewable Energy, Volume 6.
Leong, J. 2009. Ba’kelalan People Live in ‘Hidden Paradise’. Available: http://borneopedia.com/2009/08/03/ba%E2%80%99kelalan-people-live-in-%E2%80%98hidden-paradise%E2%80%99/ [Accessed 8 June 2012].
Liang, L. H. 2010. Tenaga Nasional to Restore 26 Mini Hydro Plants by Mid-2011. Recharge [Online]. Available: http://www.rechargenews.com/news/wave_tidal_hydro/article1285949.ece [Accessed 7 December 2012].
Lidula, N. W. A., Mithulananthan, N., Ongsakul, W., Widjaya, C. & Henson, R., 2007. ASEAN Towards Clean and Sustainable Energy: Potential, Utilization and Barriers. Renewable Energy, Vol. 32, pp. 1441-1452.
References 279
Lim, J. S., Manan, Z. A., Alwi, S. R. W. & Hashim, H., 2012. A Review on Utilisation of Biomass from Rice Industry as a Source of Renewable Energy. Renewable and Sustainable Energy Reviews, Vol. 16, 5, pp. 3084-3094.
Liu, H., Polenske, K. R., Xi, Y. & Guo, J. e., 2010. Comprehensive Evaluation of Effects of Straw-based Electricity Generation: A Chinese Case. Energy Policy, Vol. 38, 10, pp. 6153-6160.
Lokhorst, A. M., Dijk, E. v. & Staats, H., 2009. Public Commitment Making as a Structural Solution in Social Dilemmas. Journal of Environmental Psychology, Vol. 29, 4, pp. 400-406.
Lynch, O. J. & Harwell, E. (ed.)(eds.) 2002. Whose Natural Resources? Whose Common Good? Towards a New Paradigm of Environmental Justice and the National Interest in Indonesia, Washington DC, Center for International Environment Law (CIEL).
Maier, C., 2007. The Sustainability of Community-Managed Micro Hydels in Chitral, Pakistan Institut für Geographische Wissenschaften Freie Universität Berlin.
Manuswamy, S., Nakamura, K. & Katta, A., 2011. Comparing the Cost of Electricity Sourced from a Fuel Cell-based Renewable Energy System and the National Grid to Electrify a Rural Health Centre in India: A Case Study. Renewable Energy, Vol. 36, pp. 2978 - 2983.
Maslog, C. 2012a. Asia-Pacific Analysis: Go Green Not Nuclear. Available: http://www.scidev.net/global/energy/analysis-blog/asia-pacific-analysis-go-green-not-nuclear-1.html [Accessed 3 June 2013].
Maslog, C. 2012b. Asia–Pacific Analysis: The Slow Road to Green Energy. Available: http://m.scidev.net/es/climate-change-and-energy/renewable-energy/opinions/an-lisis-asia-pac-fico-lento-camino-a-energ-a-verde.html [Accessed 3 June 2013].
McConney, P., Creating Conditions for Community-based Small Scale Fisheries Management in the Carribean. International Workshop on Community-based Natural Resources Management, 1998 Washington DC. The World Bank/WBI’s CBNRM Initiative.
MEMR & GIZ. 2011. Best Practice Guideline: Off-grid Micro Hydro Power Schemes for Rural Electrification. Available: http://energy-indonesia.com/006Hydro/bpg.pdf [Accessed 5 May 2012].
Mi, L. Y. 2011. Being Socially Prepared is the Key Success Factor in Community Based Development- Interview with Tri Mumpuni. 2011. Available: http://goodeconomy.hani.co.kr/archives/5291 [Accessed 5 May 2012].
Microsolar. 2006. Microsolar-the World's Highest Efficiency Solar Water Heater Installed in Hotel in Ba'Kelalan Highlands Sarawak, Malaysia. Available: http://www.microsolarsystem.com/bakelalan.htm [Accessed 8 August 2011].
Min, T. C., Jobli, M. I., Ahmed, A. S., Malong, R., Zaini, M., Abdullah, M. O., Jaffar, M. N. & Ali, M. A., 2011. Renewable Energy Potential From Micro Hydro For Techno-economic Uplift - A Brief Review. International Journal of Research and Reviews in Apllied Science Vol. 7, 4, pp. 368-372.
Ministry of Rural Development, 2008. Rural Electrification Project : Selection Criteria for Rural Electrification Using Alternative Energy.Kuala Lumpur, Ministry of Rural Development, Malaysia.
Mohibullah, M., Radzi, A. M. & Hakim, M. I. A., Basic Design Aspects of Micro Hydro Power Plant and its Potential Development in Malaysia. Power and Energy Conference, 2004 Kuala Lumpur.
Mujis, D., 2004. Doing Quantitative Research in Education with SPSS, London, SAGE Publications.Inc.
Mulder, L. B., Dijk, E. v., Cremer, D. D. & Wilke, H. A. M., 2006. Undermining Trust and Cooperation: The Paradox of Sanctioning Systems in Social Dilemmas. Journal of Experimental Social Psychology, Vol. 42, 2, pp. 147-162.
References 280
Muller, P., 2006. Reputation, Trust and The Dynamics of Leadership in Communities of Practice. Journal of Manage Governance, Vol. 10, pp. 381-400.
NASA. n.d. Surface Meteorology and Solar Energy. Available: https://eosweb.larc.nasa.gov [Accessed 4 May 2010].
Nemati, B., 2013. Improving Maslow’s Hierarchy of Needs: New Approach to Needs Hierarchy. Applied Mathematics in Engineering, Management and Technology Vol. 1, 1, pp. 1-16.
New, D., 2004. Intro to Hydro Power Part 1: Systems Overview. Home Power. October-November2004 ed.
Nicholas, J. M., 2004. Project Management for Business and Engineering: Principles and Practice, Burlington, Massachusetts, Elsevier Inc.
Nielsen, E. & Munguia, O., 1998. Community Participation in Wildlands Management : A Case of Indigenous Efforts to plan and Manage Sustainable Ecotourism in The Rio Platano Biosphere Reserve, Honduras.Washington DC, The World Bank/WBI’s CBNRM Initiative.
NRCS, 2004. Chapter 10 : Estimation of Direct Runoff from Storm Rainfall.Washington DC, United States Department of Agriculture.
Obeng, G. Y., Akuffo, F. O., Braimah, I., Evers, H.-D. & Mensah, E., 2008. Impact of Solar Photovoltaic Lighting on Indoor Air Smoke in Off-grid Rural Ghana. Energy for Sustainable Development, Vol. 12, 1, pp. 55-61.
Odiyo, J. O., Phangisa, J. I. & Makungo, R., 2012. Rainfall–runoff Modelling For Estimating Latonyanda River flow Contributions to Luvuvhu River Downstream of Albasini Dam. Physics and Chemistry of the Earth Vol. 50-52, pp. 5-13.
Ohunakin, O. S., Ojolo, S. J. & Ajayi, O. O., 2011. Small Hydropower (SHP) Development in Nigeria: An Assessment. Renewable and Sustainable Energy Reviews ) Vol. 15, pp. 2006-2013.
Okushima, M. 1999. Wet Rice Cultivation and the Kayanic Peoples of East Kalimantan: Some Possible Factors Explaining Their Preference For Dry Rice Cultivation The Free Library [Online]. Available: http://www.thefreelibrary.com/Wet%20rice%20cultivation%20and%20the%20Kayanic%20peoples%20of%20East%20Kalimantan:%20some...-a093792579 [Accessed 10 June 2010].
Old Pelton. n.d. Lester Allen Pelton (1829-1908), the Inventor, and His Pelton Water Wheel. Available: http://www.oldpelton.net/history/ [Accessed 8 December 2013].
Ong, H. C., Mahlia, T. M. I. & Masjuki, H. H., 2011. A Review on Energy Scenario and Sustainable Energy in Malaysia. Renewable and Sustainable Energy Reviews, Vol. 15, pp. 639-647.
Otaki, K., 2003. Vietnam Village Hydro - A Strategic Rural Development Model. Renewable Energy for Development, Vol. 16 1.
Palit, D. & Chaurey, A., 2011. Off-grid Rural Electrification Experiences from South Asia: Status and Best Practices. Energy for Sustainable Development, Vol. 15, 3, pp. 266-276.
Pandey, R., 2009. Rural Entrepreneurship Through Electricity. Hydro Nepal, Vol. 4, pp. 36-39. Pereira, R. 2008. Micro-Hydro Electric Matching Grant Project for Kampong Buduk Bui,
Ba'kelalan (MG 63234) Commenced During PP Sami Midani's Presidential Year 2006/2007 Available: http://www.rotaryclubrafflescity.org/RCRCV2/bulletins/2008-12-02.pdf [Accessed 4 December 2009].
Pokhrel, S., Singal, S. K. & Singh, S. N., 2013. Comprehensive Study of Community Managed Mini Grid. International Journal of Emerging Technology and Advanced Engineering, Vol. 3, 3, pp. 514-520.
References 281
Practical Action. n.d. Micro Hydro Power. Available: http://practicalaction.org/docs/technical_information_service/micro_hydro_power.pdf [Accessed 16 March 2012].
Probst, T. M., Carnevale, P. J. & Triandis, H. C., 1999. Cultural Values in Intergroup and Single-Group Social Dilemmas. Organizational Behavior and Human Decision Processes, Vol. 77, 3, pp. 171-191.
Pusdatin ESDM. 2012. Handbook of Energy and Economic Statistics of Indonesia. Available: http://prokum.esdm.go.id/Publikasi/Handbook%20of%20Energy%20&%20Economic%20Statistics%20of%20Indonesia%20/Handbook%20of%20Energy%20&%20Economic%20Statistics%20ind%202012.pdf [Accessed 24 October 2013].
Raharjo, K. 2011. 20 Years of MHP in Indonesia and Its Future Outlook in the Perspective of Turbine Manufacturer. Available: http://indonesien.ahk.de/fileadmin/ahk_indonesien/PAST_EVENTS/RENERGY2011/WEDNESDAY/HYDRO/2_-_Heksa_20th-GTZ-MHPP.pdf [Accessed 20 September 2013].
Raosoft. 2007. Sample Sizing 2007 [Online]. Raosoft. Available: www.raosoft.com/samplesize.html [Accessed 24 July 2009.
Repko, A. F. 2011. Defining Interdisciplinary Studies. Interdisciplinary Research: Process and Theory. Thousand Oaks, California: SAGE Publications, Inc.
Research Methods Knowledge Base. n.d. Types of Questions. 2010. Available: http://www.socialresearchmethods.net/kb/questype.php [Accessed 6 February 2010].
Ruiz, E. & Rosellón, J., 2012. Transmission Investment in the Peruvian Electricity Market: Theory and Applications. Energy Policy, Vol. 47, pp. 238-245.
Sánchez, T., Williams, A. & Smith, N., The Critical Factors for Success of Stand Alone Energy Schemes. The International Conference on Renewable Energy for Developing Countries, 2006 Columbia USA. University of the District of Columbia.
Sander and Partner, 2002. World Wind Atlas. Sander and Partner Gmbh. Sarawak Energy. n.d. Survey of Micro-hydro Potential in Sarawak. Available:
http://www.sarawakenergy.com.my/index.php/r-d/micro-hydro [Accessed 8 June 2012].
Saxena, P. & Kumar, A., 2010. Hydropower Development in India. IGHEM-2010.IIT Roorkee, India.
Schonhardt, S. 2011. Tri Mumpuni Iskandar Builds Small Hydro Plants to bring Electricity to Indonesian Villages. 2011. Available: http://www.myhero.com/go/hero.asp?hero=indonesia_hydroplants_CSM [Accessed 2 April 2012].
Serfianus, 2011. Report on Micro Hydro Projects in Krayan Sub-district, Krayan Sub-district. SERN. 2012. Indonesia (2012). Available: http://www.reegle.info/policy-and-regulatory-
overviews/ID [Accessed 7 September 2013]. Seymour, R. & Turner, S., 2002. Otonomi Daerah : Indonesia's Decentralization Experiment.
New Zealand Journal of Asian Studies, Vol. 4, 2, pp. 33-51. Shashidharan, 1998. Scaling up Through Micro-planning : a GO-NGO
Collaboration.Washington DC, The World Bank/WBI’s CBNRM Initiative. Shen, H. S., Ni, D. B. & Sundstùl, F., 1998. Studies on Untreated and Urea-treated Rice Straw
from Three Cultivation Seasons : Physical and Chemical Measurements in Straw and Straw Fractions Animal feed Science and Technology, Vol. 73, pp. 243-261.
Singh, K. M., 2010. Community Aspects of Micro Hydro Discussion on Community Involvement in Design, Construction and Operation of Micro Hydro Systems in Nepal. Regional Workshop on Micro Hydro Projects.Kathmandu, Nepal, Rural Energy Development Programme.
References 282
Smith, N. 1995. Low Cost Electricity Installation. Available: http://www.dfid.gov.uk/r4d/PDF/Outputs/R5685.pdf [Accessed 24 July 2011].
Snaz-Menendez, L., Bordons, M. & Zulueta, M. A. 2001. Interdisciplinarity as a Multidimensional Concept: Its Measure in Three Different Research Areas Available: http://digital.csic.es/bitstream/10261/1470/1/dt-0104.pdf [Accessed 27 April 2012].
Sookkumnerd, C., Ito, N. & Kito, K., 2005. Financial Viabilities of Husk-fueled Steam Engines as an Energy-saving Technology in Thai Rice Mills. Applied Energy, Vol. 82, pp. 64-80.
Sovacool, B. K. & Bulan, L. C., 2012. Energy Security and Hydropower Development in Malaysia: the Drivers and Challanges Facing the Sarawak Corridor of Renewable Energy (SCORE). Renewable Energy, Vol. 40, 1, pp. 113-129.
Sovacool, B. K., Dhakal, S., Gippner, O. & Bambawale, M. J., 2011. Halting Hydro: A review of the Socio-technical Barriers to Hydroelectric Power Plants in Nepal. Energy, Vol. 36, pp. 3468-3476.
Sovacool, B. K. & Drupady, I. M., 2011. Examining the Small Renewable Energy Power (SREP) Program in Malaysia. Energy Policy, Vol. 39, pp. 7244-7256.
Srinivararao, P., Reddy, P. R. & Reddy, K. V. K., 2012. Advance Power Plant Technologies and Steam Cycle for Super Critical Application. International Journal of Scientific and Research Publications, Vol. 2, 9.
Sulistyowati, A., 2012. Connecting Conservation and Electrification in Indonesia. Solutions For a Sustainable and Desirable Future, Vol. 3, 5, pp. 24-28.
Suruhanjaya Tenaga. 2013. National Energy Balance 2011. Available: http://www.st.gov.my/index.php/component/k2/item/553-national-energy-balance-2011.html [Accessed 4 December 2013].
Thao, P. T. M., Kurisu, K. H. & Hanaki, K., 2011. Greenhouse Gas Emission Mitigation Potential of Rice Husks for An Giang Province, Vietnam. Biomass and Bioenergy, Vol. 35, 8, pp. 3656-3666.
The Economist. 2011. Peru's Energy Ambitions: Hydro-powered Dreams. Available: http://www.economist.com/node/18114659 [Accessed 8 December 2013].
The GEF-SGP. n.d. Community Based Microhydro for Rural Electrification in Ulu Papar, Sabah. Available: https://sgp.undp.org/index.php?option=com_sgpprojects&view=projectdetail&id=19223&Itemid=205 [Accessed 9 June 2013].
The Guardian. 2013. Enabling Access to Electricity in Rural Peru. Available: http://www.theguardian.com/sustainable-business/enabling-access-electricity-peru [Accessed 18 January 2014].
The Star. 2010. TNB to Complete Rehabilitation of Mini-hydro Plants by Mid-2011. Thestar [Online]. Available: http://www.thestar.com.my/story.aspx?sec=business&file=%2f2010%2f6%2f4%2fbusiness%2f6399695 [Accessed 6 April 2012].
The World Bank. 2005. Electricity for All : Options for Increasing Access in Indonesia. Available: http://siteresources.worldbank.org/INTINDONESIA/Resources/Publication/280016-1106130305439/Electricity-for-All-Options-for-Increasing-Access-in-Indonesia.pdf [Accessed 22 November 2012].
The World Bank. n.d. Community Driven Development in Indonesia. Available: http://web.worldbank.org/WBSITE/EXTERNAL/COUNTRIES/EASTASIAPACIFICEXT/0,,contentMDK:23186164~pagePK:146736~piPK:146830~theSitePK:226301,00.html [Accessed 22 November 2012].
Townsend, W. R., 1998. Participatory Investigation As a Means to Promote Community Based Management: Examples from the Bolivian Lowlands.Washington DC, The World Bank/WBI’s CBNRM Initiative.
References 283
Tran, Q. C. 2013. ASEAN Guideline on Off-grid Rural Electrification Approaches. Available: http://aseanenergy.org/media/documents/2013/04/11/a/s/asean_guideline_on_off-grid_rural_electrification_final_1.pdf [Accessed 16 January 2014].
Tsephel, S. n.d. Hydro Power for Decentralised Energy Supply Challenges and Opportunities in the Western Himalaya – a NGO’s Grassroots' perspective. Available: http://www.borda-sea.org/fileadmin/borda-net/Knowledge/Workshops/3_BNS_Workshop/05_tsephel.pdf [Accessed 18 October 2012].
UNCTAD. 2010. Renewable Energy Technologies for Rural Development. Available: http://unctad.org/en/docs/dtlstict20094_en.pdf [Accessed 10 March 2012].
UNDP-GEF. 2006. Indonesia: Integrated Microhydro Development and Application Program (IMIDAP). Available: http://www.thegef.org/gef/sites/thegef.org/files/repository/Indonesia_IMIDAP.pdf [Accessed 10 August 2011].
UNDP. 2009. Project Facts Rural Development with Renewable Energy-IMIDAP. Available: http://www.undp.or.id/factsheets/2009/ENV/Microhydro.pdf.
UNDP Indonesia. 2009. Community in Tasikmalaya Exploring Business Opportunities from The River.
UNIDO. 2010. UNIDO Projects for the Promotion of Small Hydro Power for Productive Use. Available: http://www.unido.org/fileadmin/user_media/About_UNIDO/Evaluation/Project_reports/e-book_small-hydro.PDF [Accessed 4 September 2012].
United Nations Development Programme. 2006. Indonesia: Integrated Microhydro Development and Application Program (IMIDAP). Available: http://www.thegef.org/gef/sites/thegef.org/files/repository/Indonesia_IMIDAP.pdf.
Universiti Teknologi MARA. n.d. Introduction to Local Government in Malaysia. Available: http://lib.kedah.uitm.edu.my/psblibrary/notes/am110/layout/subject%20material/handouts/dpa/PAD%20320/h1.pdf [Accessed 4 December 2013].
Urmee, T., 2009. Solar PV Electrification Programs in Developing Countries: Towards an Holistic Approach. Doctor of Philosophy, Murdoch University
Urmee, T. & Harries, D., 2011. Determinants of The Success and Sustainability of Bangladesh's SHS Program. Renewable Energy, Vol. 36, pp. 2822-2830.
USAID, 2011. Hybrid Mini-grids for Rural Electrification. Brussels, Alliance for Rural Electrification.Available: http://www.ruralelec.org/fileadmin/DATA/Documents/06_Publications/Position_papers/ARE_Mini-grids_-_Full_version.pdf
Viola, F., Noto, L. V., Cannarozzo, M. & Loggia, G. L., 2010. Regional Flow Duration Curves for Ungauged Sites in Sicily. International Workshop Advances in Statistical Hydrology.Taormina, Italy.
Wang, Q., Thompson, E., Parsons, R., Rogers, G. & Dunn, D., 2011. Economic Feasibility of Converting Cow Manure to Electricity: A Case Study of the CVPS Cow Power Program in Vermont. Journal of Dairy Science, Vol. 94, 10, pp. 4937-4949.
WEC. 2004. Electricity for All: Renewable Energy Project Handbook. Available: http://www.worldenergy.org/documents/handbook04.pdf [Accessed 11 October 2011].
Wiantoro, S., Lit, E., Sidq, M. F., Salmizar, N., Sait, I. & M.T.Abdullah, 2009. Notes on Field Survey and New Distributional Record of Small Mammals in Mount Murud, Sarawak, Malaysia. Journal of Tropical Biology and Conservation, Vol. 5, pp. 71-79.
Winarno, D., 2011. The Clean Energy Policy in Indonesia: Action Plan of Utilization of Biomass for Power Plant. The Germany-Indonesian Renewable Energy Days.Jakarta.
References 284
Wynn, G. 2013. The Babalitan Micro Hydro System is Now Online [Online]. TONIBUNG-Friends of Village Development. Available: http://tonibungrenewables.blogspot.com.au/ [Accessed 17 October 2013].
Yeo, S. 2013. 80% of Malaysian Borneo’s Rainforests Destroyed by Logging Available: http://www.rtcc.org/2013/07/18/80-of-malaysian-borneos-rainforests-destroyed-by-logging/#sthash.AwrmzgDs.dpuf [Accessed 4 January 2014].
Yermoli, C. & Krishnan, K. n.d. Grid-connnected Renewable Energy: Hydroelectric Power. Available: http://www.energytoolbox.org/gcre/mod_4/gcre_hydropower.pdf [Accessed 4 December 2013].
Yin, R. K., 2009. Case Study Research: Design and Methods, Thousand Oaks, California, SAGE Publications, Inc.
Zahnd, A., Kimber, H. M. & Komp, R., Renewable Energy Village Power Systems for Remote and Impoverished Himalayan Villages in Nepal. The International Conference on Renewable Energy for Developing Countries, 2006 Columbia. University of the District of Columbia.
Zettler, I., Hilbig, B. E. & Heydasch, T., 2013. Two Sides of One Coin: Honesty–Humility and Situational Factors Mutually Shape Social Dilemma Decision Making. Journal of Research in Personality, Vol. 47, 4, pp. 286-295.
Page 285
APPENDICES
Appendix 1: Information letter
Appendix 2: Household questionnaire
Appendix 3: Manufacturer/distributor
questionnaire
Appendix 4: Focus questions for O&M
personnel
Appendix 5: Focus questions for community
leaders
Appendix 6: Focus questions for the headmen
Appendix 7: Focus questions for government
officials
Appendix 8: Synchronisation process for web
diagram

Page 286
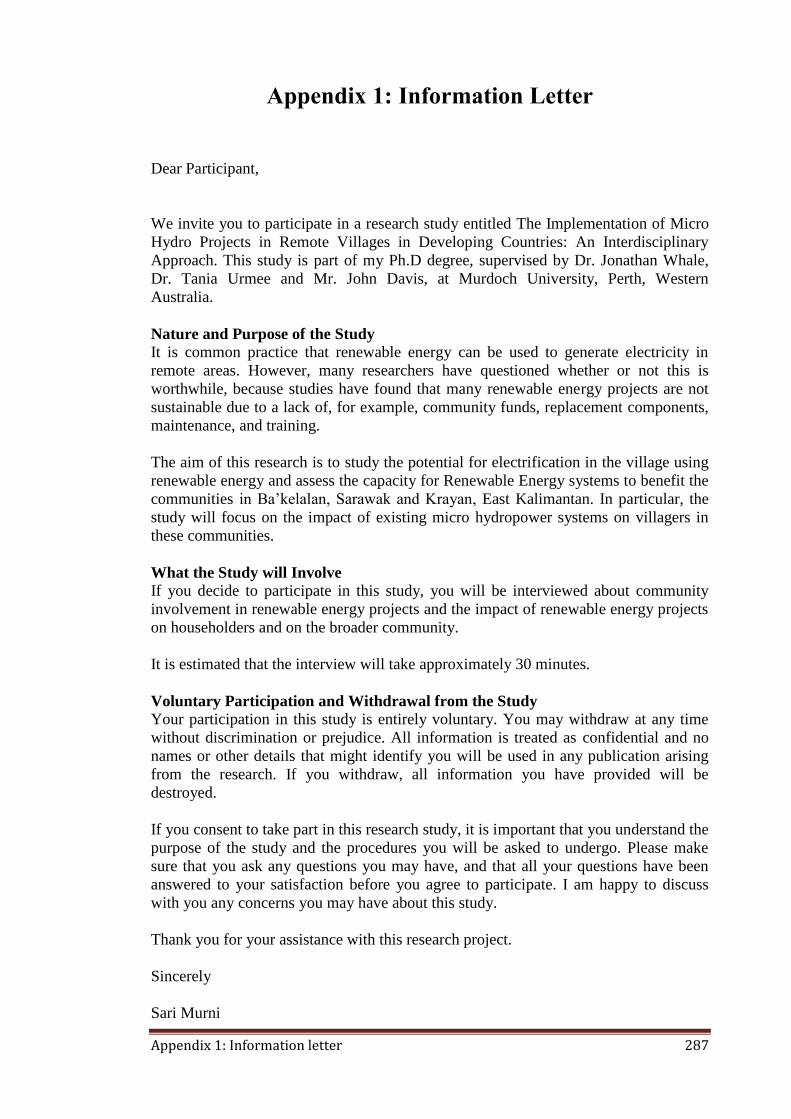
Appendix 1: Information letter 287
Appendix 1: Information Letter
Dear Participant,
We invite you to participate in a research study entitled The Implementation of Micro
Hydro Projects in Remote Villages in Developing Countries: An Interdisciplinary
Approach. This study is part of my Ph.D degree, supervised by Dr. Jonathan Whale,
Dr. Tania Urmee and Mr. John Davis, at Murdoch University, Perth, Western
Australia.
Nature and Purpose of the Study It is common practice that renewable energy can be used to generate electricity in
remote areas. However, many researchers have questioned whether or not this is
worthwhile, because studies have found that many renewable energy projects are not
sustainable due to a lack of, for example, community funds, replacement components,
maintenance, and training.
The aim of this research is to study the potential for electrification in the village using
renewable energy and assess the capacity for Renewable Energy systems to benefit the
communities in Ba’kelalan, Sarawak and Krayan, East Kalimantan. In particular, the
study will focus on the impact of existing micro hydropower systems on villagers in
these communities.
What the Study will Involve If you decide to participate in this study, you will be interviewed about community
involvement in renewable energy projects and the impact of renewable energy projects
on householders and on the broader community.
It is estimated that the interview will take approximately 30 minutes.
Voluntary Participation and Withdrawal from the Study Your participation in this study is entirely voluntary. You may withdraw at any time
without discrimination or prejudice. All information is treated as confidential and no
names or other details that might identify you will be used in any publication arising
from the research. If you withdraw, all information you have provided will be
destroyed.
If you consent to take part in this research study, it is important that you understand the
purpose of the study and the procedures you will be asked to undergo. Please make
sure that you ask any questions you may have, and that all your questions have been
answered to your satisfaction before you agree to participate. I am happy to discuss
with you any concerns you may have about this study.
Thank you for your assistance with this research project.
Sincerely
Sari Murni

Appendix 1: Information letter 288
Declaration by Interview Participant
I have read the Information Letter and any questions I have about the interview have
been answered to my satisfaction. I agree to take part in this study and give my consent
for the results to be used in the study. I am aware that this interview is anonymous and
no personal details are being collected or used. I know that I may change my mind,
withdraw my consent and stop participating at any time. I understand that all
information provided is treated as confidential and will not be released unless required
to do so by law. I agree that the findings of this study may be published and that no
information which can specifically identify me will be published.
Participant/Authorised Representative Signature : Date:
Investigator’s Name and Signature :
This study has been approved by the Murdoch University Human Research
Ethics Committee (Approval 2009/130). If you have any reservation or
complaint about the ethical conduct of this research, and wish to talk with an
independent person, you may contact Murdoch University’s Research Ethics
Office (Tel. +61 8 9360 6677) or e-mail [email protected]). Any issues
you raise will be treated in confidence and investigated fully, and you will be
informed of the outcome.
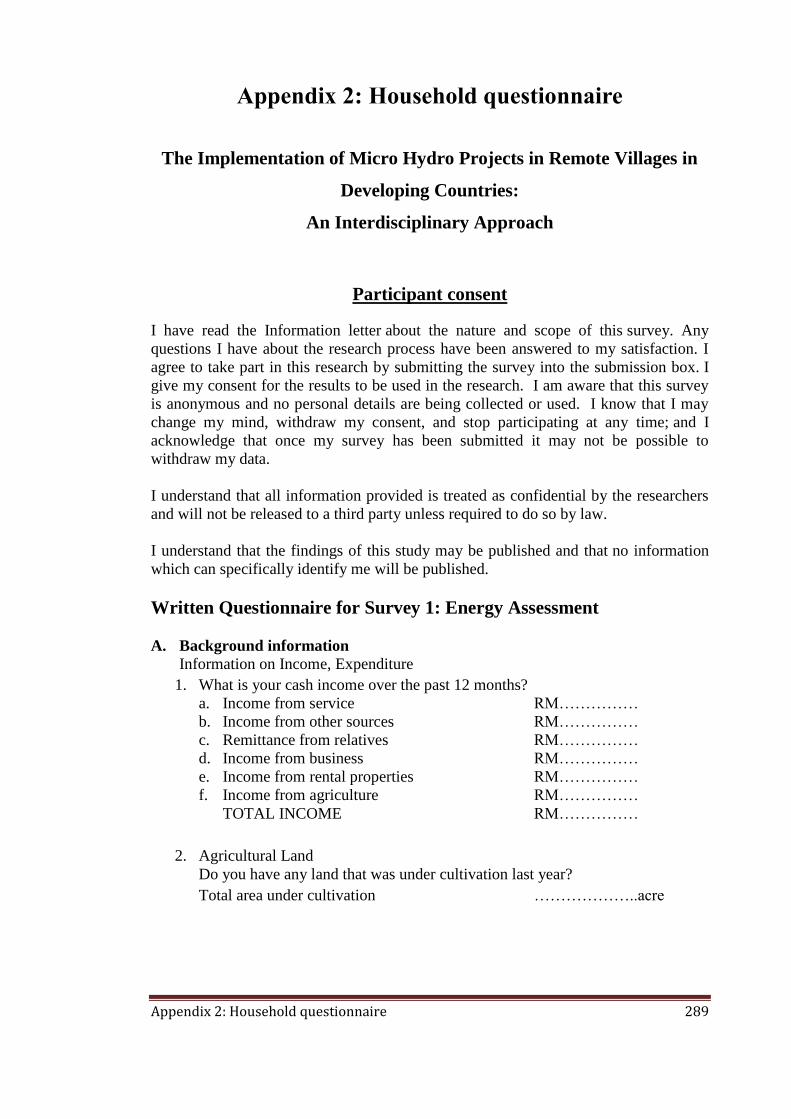
Appendix 2: Household questionnaire 289
Appendix 2: Household questionnaire
The Implementation of Micro Hydro Projects in Remote Villages in
Developing Countries:
An Interdisciplinary Approach
Participant consent
I have read the Information letter about the nature and scope of this survey. Any
questions I have about the research process have been answered to my satisfaction. I
agree to take part in this research by submitting the survey into the submission box. I
give my consent for the results to be used in the research. I am aware that this survey
is anonymous and no personal details are being collected or used. I know that I may
change my mind, withdraw my consent, and stop participating at any time; and I
acknowledge that once my survey has been submitted it may not be possible to
withdraw my data.
I understand that all information provided is treated as confidential by the researchers
and will not be released to a third party unless required to do so by law.
I understand that the findings of this study may be published and that no information
which can specifically identify me will be published.
Written Questionnaire for Survey 1: Energy Assessment
A. Background information
Information on Income, Expenditure
1. What is your cash income over the past 12 months?
a. Income from service RM……………
b. Income from other sources RM……………
c. Remittance from relatives RM……………
d. Income from business RM……………
e. Income from rental properties RM……………
f. Income from agriculture RM……………
TOTAL INCOME RM……………
2. Agricultural Land
Do you have any land that was under cultivation last year?
Total area under cultivation ………………..acre
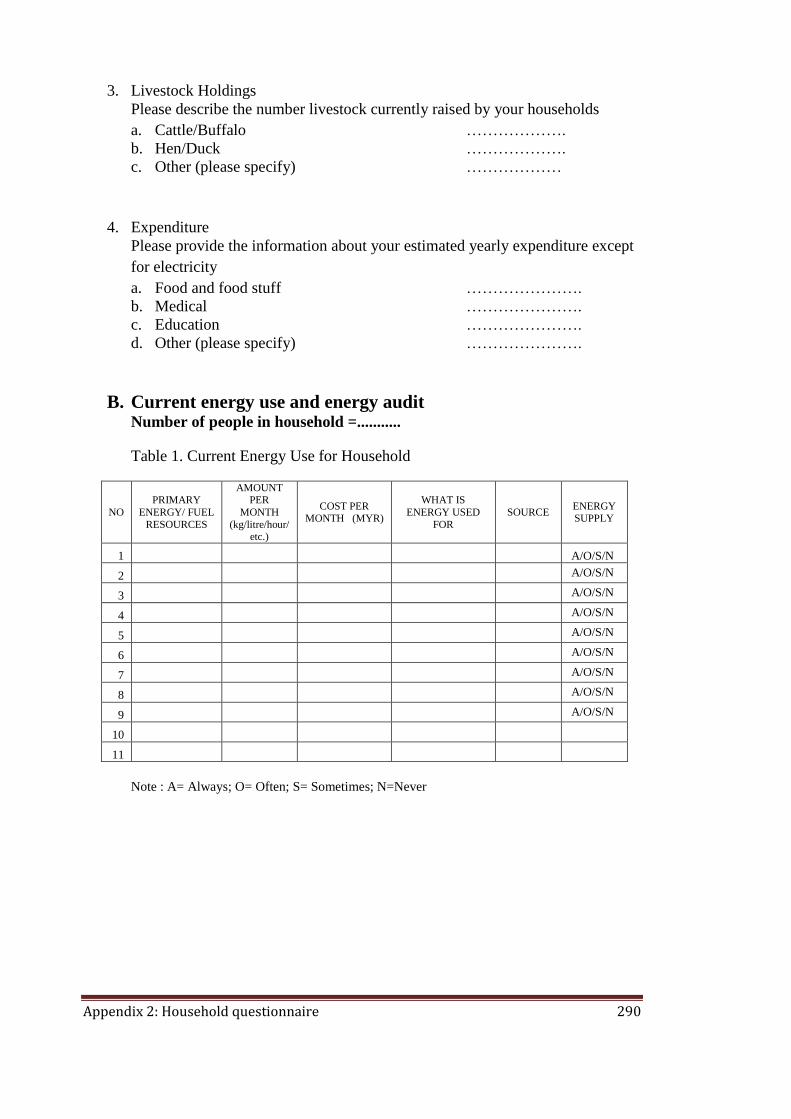
Appendix 2: Household questionnaire 290
3. Livestock Holdings
Please describe the number livestock currently raised by your households
a. Cattle/Buffalo ……………….
b. Hen/Duck ……………….
c. Other (please specify) ………………
4. Expenditure
Please provide the information about your estimated yearly expenditure except
for electricity
a. Food and food stuff ………………….
b. Medical ………………….
c. Education ………………….
d. Other (please specify) ………………….
B. Current energy use and energy audit Number of people in household =...........
Table 1. Current Energy Use for Household
NO
PRIMARY
ENERGY/ FUEL
RESOURCES
AMOUNT PER
MONTH
(kg/litre/hour/etc.)
COST PER MONTH (MYR)
WHAT IS
ENERGY USED
FOR
SOURCE ENERGY SUPPLY
1 A/O/S/N
2 A/O/S/N
3 A/O/S/N
4 A/O/S/N
5 A/O/S/N
6 A/O/S/N
7 A/O/S/N
8 A/O/S/N
9 A/O/S/N
10
11
Note : A= Always; O= Often; S= Sometimes; N=Never

Appendix 2: Household questionnaire 291
Table 2. Electricity Technology
Primary
energy
Electricity
technology
Life time
(year)
Purchase
cost (MYR) Type
Power
rating
Running
cost/ month
(MYR)
Electricity
supply
A/O/S/N
A/O/S/N
Note : A= Always; O= Often; S= Sometimes; N=Never
Table 3. Electrical Energy Audit
Appliances Number Power
rating
Time of use per day
Energy
Technology
Variation
Hours am/pm wet
season dry season
Bulb
TV
Radio
Freezer
Fridge
Washing machine
Fan
DVD player
Rice cooker
Computer
Laptop
Iron
Toaster
Oven
C. Energy vulnerability
1. How do you regard the cost of your energy sources in general?
a. Very expensive
b. Expensive
c. Cheap
d. Very cheap

Appendix 2: Household questionnaire 292
2. How satisfied are you with the current energy sources available to you?
a. Strongly dissatisfied
b. Dissatisfied
c. Satisfied
d. Strongly satisfied
Please explain your answer:
…………………………………………………………………………………
…………………………………………………………………………………
…………………………………………………………………………………
…………………………………………………………………………………
3. In your opinion, what is the greatest limitation imposed by your current energy
sources? Please describe in detail
…………………………………………………………………………………
…………………………………………………………………………………
…………………………………………………………………………………
…………………………………………………………………………………
…………………………………………………………………………………
…………………………………………………………………
4. What do you think should be done to overcome the limitations?
…………………………………………………………………………………
…………………………………………………………………………………
…………………………………………………………………………………
…………………………………………………………………………………
…………………………………………………………………………………
…………………………………………………………………
5. Can you suggest different sources of energy that could be used in your village?
…………………………………………………………………………………
…………………………………………………………………………………
…………………………………………………………………………………
…………………
6. How might one or more of the options you mention be put in place?
……………………………………………………………………………………
……………………………………………………………………………………
……………………………………………………………………………………
…………
D. Current renewable energy project
7. Were you involved in the Micro Hydro Scheme (MHS)? Yes/No
If yes, please specify your role:
...............................................................................................................................
...............................................................................................................................
...............................................................................................................................
..........................................

Appendix 2: Household questionnaire 293
8. How has the MHS impacted on the range of appliances that you use?
...............................................................................................................................
...............................................................................................................................
...............................................................................................................................
..........................................
9. How has the MHS impacted on your cost of energy?
...............................................................................................................................
...............................................................................................................................
...............................................................................................................................
..........................................
10. Has the MHS had an impact on reliability of electricity? (e.g. getting
electricity whenever you need it)
Yes/No
11. If there is a problem with the MHS electricity who do you contact with?
...............................................................................................................................
...............................................................................................................................
...............................................................................................................................
..........................................
12. Have you experienced facing a problem with MHS electricity? Yes/No
How frequent? …….…times
13. How long it took time to fix the problem? ................................................
14. How satisfied are you with the current MHS electricity
a. Strongly dissatisfied
b. Dissatisfied
c. Satisfied
d. Strongly satisfied
E. Further renewable energy projects
15. If more renewable energy projects will be set up in your village, would you
prefer it to be a :
a. Community based project
b. Government Service Delivery Project
c. Private Business project
d. Other, please specify
Please explain your answer:
……………………………………………………………………………………
……………………………………………………………………………………

Appendix 2: Household questionnaire 294
……………………………………………………………………………………
………………………………………………………
16. What do you think to make a Renewable Energy projects happen?
...............................................................................................................................
...............................................................................................................................
...............................................................................................................................
..........................................
F. Expectations
17. If you were able to have electricity from more renewable energy project, what
kind of appliances or machines do you think you would want to operate using
this electricity?
a………………………………………..
b………………………………………..
c………………………………………..
d……………………………………….
e……………………………………….
f………………………………………..
g………………………………………
h……………………………………….
18. Given your current cost of electricity, how much more would you be willing to
pay to get more electricity to run the above appliances?
a. Less than 25 ringgit per month
b. 26 – 50 ringgit per month
c. 51 – 75 ringgit per month
d. 76 – 100 ringgit per month
e. More than 100 ringgit per month
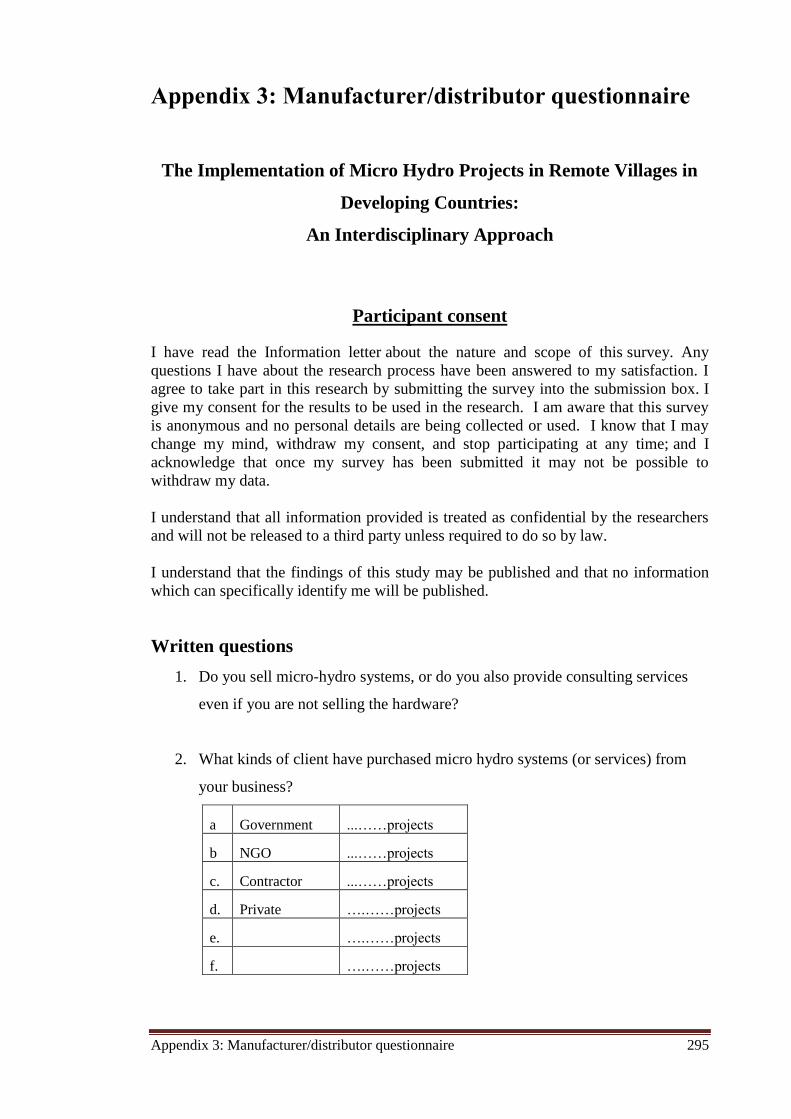
Appendix 3: Manufacturer/distributor questionnaire 295
Appendix 3: Manufacturer/distributor questionnaire
The Implementation of Micro Hydro Projects in Remote Villages in
Developing Countries:
An Interdisciplinary Approach
Participant consent
I have read the Information letter about the nature and scope of this survey. Any
questions I have about the research process have been answered to my satisfaction. I
agree to take part in this research by submitting the survey into the submission box. I
give my consent for the results to be used in the research. I am aware that this survey
is anonymous and no personal details are being collected or used. I know that I may
change my mind, withdraw my consent, and stop participating at any time; and I
acknowledge that once my survey has been submitted it may not be possible to
withdraw my data.
I understand that all information provided is treated as confidential by the researchers
and will not be released to a third party unless required to do so by law.
I understand that the findings of this study may be published and that no information
which can specifically identify me will be published.
Written questions
1. Do you sell micro-hydro systems, or do you also provide consulting services
even if you are not selling the hardware?
2. What kinds of client have purchased micro hydro systems (or services) from
your business?
a Government ...……projects
b NGO ...……projects
c. Contractor ...……projects
d. Private ….……projects
e. ….……projects
f. ….……projects

Appendix 3: Manufacturer/distributor questionnaire 296
3. For your clients, in which of the following stages of micro hydro projects have
you been involved in?
Stage Involve
a. System design
b. Installation
c. maintain
d. operating
e. monitoring
f. training
g.
h.
4. I am trying to understand the regulatory environment in which you operate. Are
you able to tell me which Government agencies are required to give approval
prior to commencing a micro hydro project in any given District in Malaysia?
For example, what if anything is required from:
a. State Government (Kuching)
b. Division Officer (Limbang)
c. District Officer (Lawas)
d. Land Survey Department
e. Department of Irrigation and Drainage
Any others?
f. ……………………………….
g. ………………………………
h. ………………………………
5. When designing a micro hydro project, what proportion of river flow do you
usually aim to harness?
…………………………………………………………………………………
………
…………………………………………………………………………………
…………………………………………………………………………………
………………

Appendix 3: Manufacturer/distributor questionnaire 297
6. How do you usually obtain the river flow data you use for planning a micro
hydro project?
a. Take their own Spot reading
b. Take their own Annual river flow data
c. Annual river flow data from…………………
d. ……………………………..
e. ……………………………..
7. What method do you usually use to measure river flow?
a. Bucket method
b. Flowing method
c. Weir board
d. Flow meter
e. ………………
f. ………………
8. I would like to ask about the forms of community involvement in micro hydro
project you have worked on. Is the local community ever involved in each of
these stages, and if so, how?
Stage Type of Community
Involvement Are they paid?
a. design Yes / No
b. installation Yes / No
c. maintenance Yes / No
d. operating Yes / No
e. monitoring Yes / No
f. training Yes / No
g. Yes / No
h. Yes / No
9. Which of these types of micro hydro projects do you usually install?
a. Run-of-river scheme
b. Scheme with a dam
c. Scheme integrated on other purpose
d. …………………………………………..
e. …………………………………………..
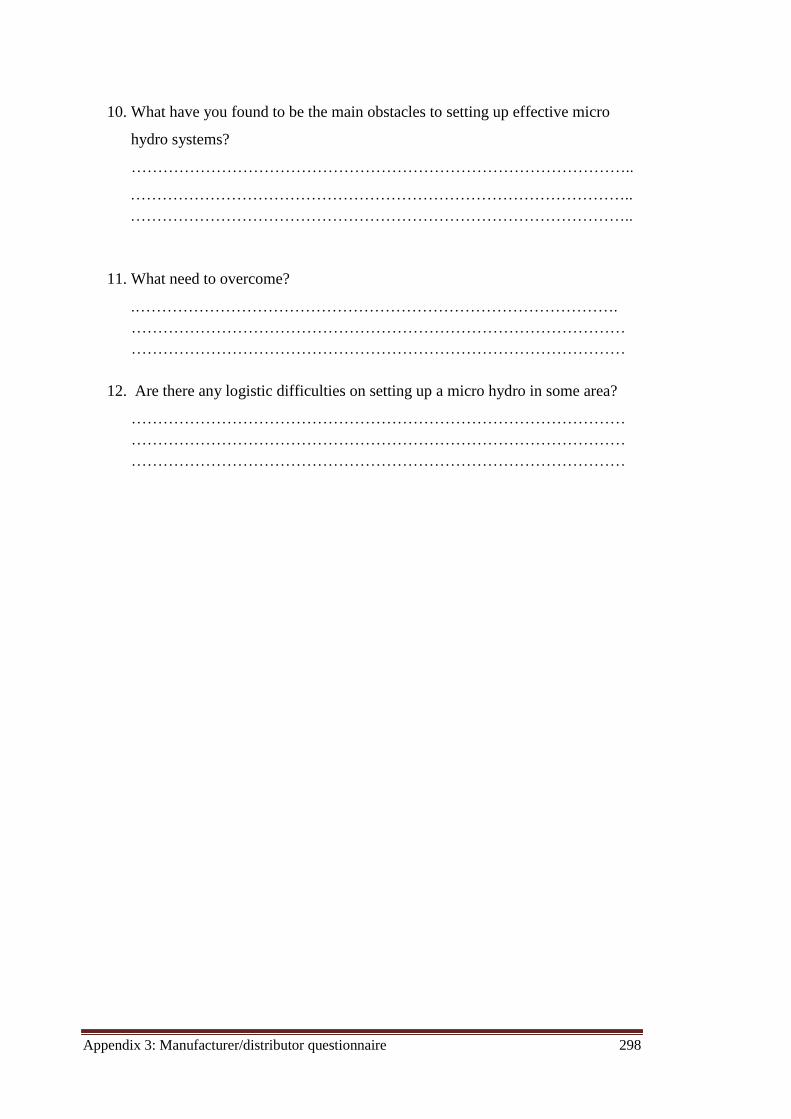
Appendix 3: Manufacturer/distributor questionnaire 298
10. What have you found to be the main obstacles to setting up effective micro
hydro systems?
…………………………………………………………………………………..
…………………………………………………………………………………..
…………………………………………………………………………………..
11. What need to overcome?
.……………………………………………………………………………….
…………………………………………………………………………………
…………………………………………………………………………………
12. Are there any logistic difficulties on setting up a micro hydro in some area?
…………………………………………………………………………………
…………………………………………………………………………………
…………………………………………………………………………………
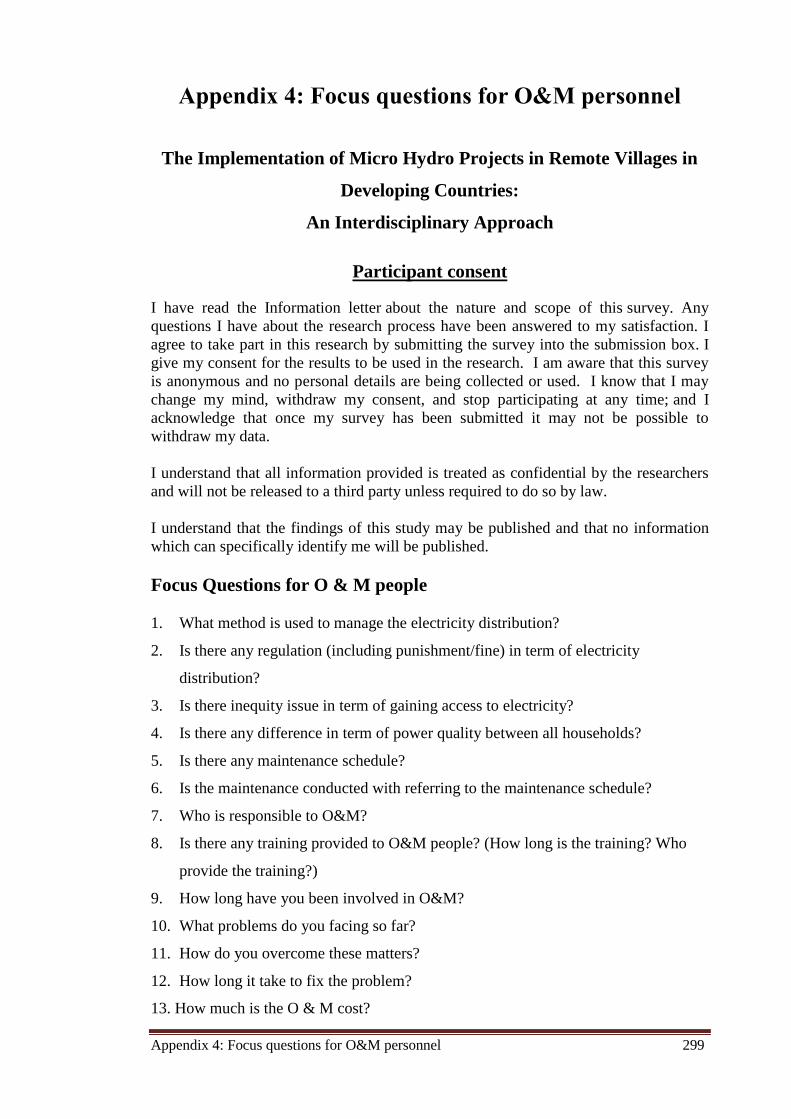
Appendix 4: Focus questions for O&M personnel 299
Appendix 4: Focus questions for O&M personnel
The Implementation of Micro Hydro Projects in Remote Villages in
Developing Countries:
An Interdisciplinary Approach
Participant consent
I have read the Information letter about the nature and scope of this survey. Any
questions I have about the research process have been answered to my satisfaction. I
agree to take part in this research by submitting the survey into the submission box. I
give my consent for the results to be used in the research. I am aware that this survey
is anonymous and no personal details are being collected or used. I know that I may
change my mind, withdraw my consent, and stop participating at any time; and I
acknowledge that once my survey has been submitted it may not be possible to
withdraw my data.
I understand that all information provided is treated as confidential by the researchers
and will not be released to a third party unless required to do so by law.
I understand that the findings of this study may be published and that no information
which can specifically identify me will be published.
Focus Questions for O & M people
1. What method is used to manage the electricity distribution?
2. Is there any regulation (including punishment/fine) in term of electricity
distribution?
3. Is there inequity issue in term of gaining access to electricity?
4. Is there any difference in term of power quality between all households?
5. Is there any maintenance schedule?
6. Is the maintenance conducted with referring to the maintenance schedule?
7. Who is responsible to O&M?
8. Is there any training provided to O&M people? (How long is the training? Who
provide the training?)
9. How long have you been involved in O&M?
10. What problems do you facing so far?
11. How do you overcome these matters?
12. How long it take to fix the problem?
13. How much is the O & M cost?

Appendix 4: Focus questions for O&M personnel 300

Appendix 5: Focus questions for community leader ( Penghulu/Kepala Adat) 301
Appendix 5: Focus questions for community leaders
The Implementation of Micro Hydro Projects in Remote Villages in
Developing Countries:
An Interdisciplinary Approach
Participant consent
I have read the Information letter about the nature and scope of this survey. Any
questions I have about the research process have been answered to my satisfaction. I
agree to take part in this research by submitting the survey into the submission box. I
give my consent for the results to be used in the research. I am aware that this survey
is anonymous and no personal details are being collected or used. I know that I may
change my mind, withdraw my consent, and stop participating at any time; and I
acknowledge that once my survey has been submitted it may not be possible to
withdraw my data.
I understand that all information provided is treated as confidential by the researchers
and will not be released to a third party unless required to do so by law.
I understand that the findings of this study may be published and that no information
which can specifically identify me will be published.
Focus Questions for Community Leader (Penghulu/Kepala Adat)
1. Who initiated this project? (Community, government, private company, other)
2. What were the reasons for initiating the project (i.e. what were the aims and
objectives)?
3. What is the community's involvement in the micro hydro project?
4. In general, at what stage does the community get involved in the project?
5. Is the community willing to involved/contribute in future micro hydro project?
6. If so what kind of contribution they are willing to give? Financial? Other?
7. What is the nature of the community involvement? (Advice, paid workers,
volunteer workers)?
8. Does the community contribute toward the funding of the MH project? If so, what
has been the community's financial contribution?
9. Is the MH project used to supply electricity to more than one community/village?
10. If so, what agreements are made between the communities/villages involved?

Appendix 5: Focus questions for community leader ( Penghulu/Kepala Adat) 302
11. Are the members of community satisfied with the current level of service?
(Amount of electricity supplied; when it is supplied; reliability; quality)
12. If the members of community are dissatisfied, what actions have they undertaken
to rectify the problem?
13. Who do dissatisfied members of the community address their concerns to?
14. Has the MH had any positive social impacts on the community?
15. Has the MH project had any negative social impacts on the community?
16. What the other impacts to the household? (e.g. business opportunity)
17. Has the MH project resulted in an increase in household income?
18. In your opinion, has the MH project may resulted in any difference of the
migration of people?
19. What have been the other impacts on households?
20. In your opinion, over all, how satisfied is the community members with the MH
system? ( e.g. management, quality)
Appendix 6: Focus question for the headmen 303
Appendix 6: Focus questions for the headmen
The Implementation of Micro Hydro Projects in Remote Villages in
Developing Countries:
An Interdisciplinary Approach
Participant consent
I have read the Information letter about the nature and scope of this survey. Any
questions I have about the research process have been answered to my satisfaction. I
agree to take part in this research by submitting the survey into the submission box. I
give my consent for the results to be used in the research. I am aware that this survey
is anonymous and no personal details are being collected or used. I know that I may
change my mind, withdraw my consent, and stop participating at any time; and I
acknowledge that once my survey has been submitted it may not be possible to
withdraw my data.
I understand that all information provided is treated as confidential by the researchers
and will not be released to a third party unless required to do so by law.
I understand that the findings of this study may be published and that no information
which can specifically identify me will be published.
Focus Questions for the headmen
1. How long have you lived in this village/community?
2. When did you first become Headman?
3. Have there ever been community discussions about electrification?
4. What sort of proposals have been discussed? (Probe- when, who, how, why etc.)
5. What has actually been done to introduce electricity in this village to date?
(include private and community/public, probe)
6. Is electricity used in any way that could be described as having collective benefit
for all community members or public use at the moment?
7. How is the cost of this electricity generation paid for?
8. Who is responsible for managing its use and ongoing maintenance or funding?
Appendix 6: Focus question for the headmen 304
9. Are there any plans to use electricity to power other community
services/activities?
10. What renewable energy sources are used to produce electricity in this village?
11. How effective, reliable and cheap do you consider these technologies you see
operating here?
12. What do you think are the relative merits of the different renewable energy
technologies which could be used to produce electricity in this village?
13. Do you think this community would be willing to collaborate with other
communities in the village to enable electrification if it were to be available?
14. Do you think this community would be willing to collaborate with other villages
to enable electrification if it were to be available?
15. Do you think it would be feasible for communities in this area to collaborate in an
electrification program with nearby villages across the border in the neighbouring
country?
16. If so what would be the benefits of such collaboration?
17. If any of these collaborative project ideas were ever be set up, who would be in the
best position to take responsibility or take care and operate them?
18. What do you understand by the term “sustainable development”?
19. What concerns do you have (if any) about Development activities you see
happening in your community these days?
20. As Headman, how important do you personally regard the question of energy
supply to your village?
21. What are the (other) priority issues? (plenty of probing including place of energy
if necessary)

Appendix 7: Focus question for Government official 305
Appendix 7: Focus questions for Government officials
The Implementation of Micro Hydro Projects in Remote Villages in
Developing Countries:
An Interdisciplinary Approach
Participant consent
I have read the Information letter about the nature and scope of this survey. Any
questions I have about the research process have been answered to my satisfaction. I
agree to take part in this research by submitting the survey into the submission box. I
give my consent for the results to be used in the research. I am aware that this survey
is anonymous and no personal details are being collected or used. I know that I may
change my mind, withdraw my consent, and stop participating at any time; and I
acknowledge that once my survey has been submitted it may not be possible to
withdraw my data.
I understand that all information provided is treated as confidential by the researchers
and will not be released to a third party unless required to do so by law.
I understand that the findings of this study may be published and that no information
which can specifically identify me will be published.
Focus Questions for Government Officials (National, State, District)
General question
1. Is any Government project on rural electrification using renewable energy?
2. Which government departments/agencies are involved in the project?
3. What are the roles of the various government departments?
4. Is any explicit government policy in place to increase access to electricity for
those living in remote areas?
5. What are Government's objectives in funding MHS in remote areas?
6. Is there a forward plan for these communities to increase reliance on renewable
energy?
7. What is the time frame (years) for increasing reliance on renewable energy?
8. Are there phases to the renewable energy plan? If so, what are the phases?
9. What was the basis for setting electricity tariffs?
Appendix 7: Focus question for Government official 306
10. Are there any standards that these systems and the equipment need to comply
with?
Ba’kelalan /Krayan focus
11. Who was the initiator of this project? (community, government, other)
12. What were the project’s aims?
13. Has this MH project had any 'measurable' benefits for communities?
14. What have been the positive impacts or benefits of the project for the community?
15. Has the MH project had any negative impacts on the community?
16. Has this MH project had any 'measurable' benefits for individual households?
17. What have been the positive impacts or benefits of the project for individual
household?
18. Has the MH project had any negative impacts on individual household?
19. Who are the stakeholders that are involved in this project?
20. What are their roles in the project?
21. Has planning involved meetings between the various stakeholder groups?
22. Is any monitoring undertaken of stakeholders (in terms of their satisfaction, etc.)?
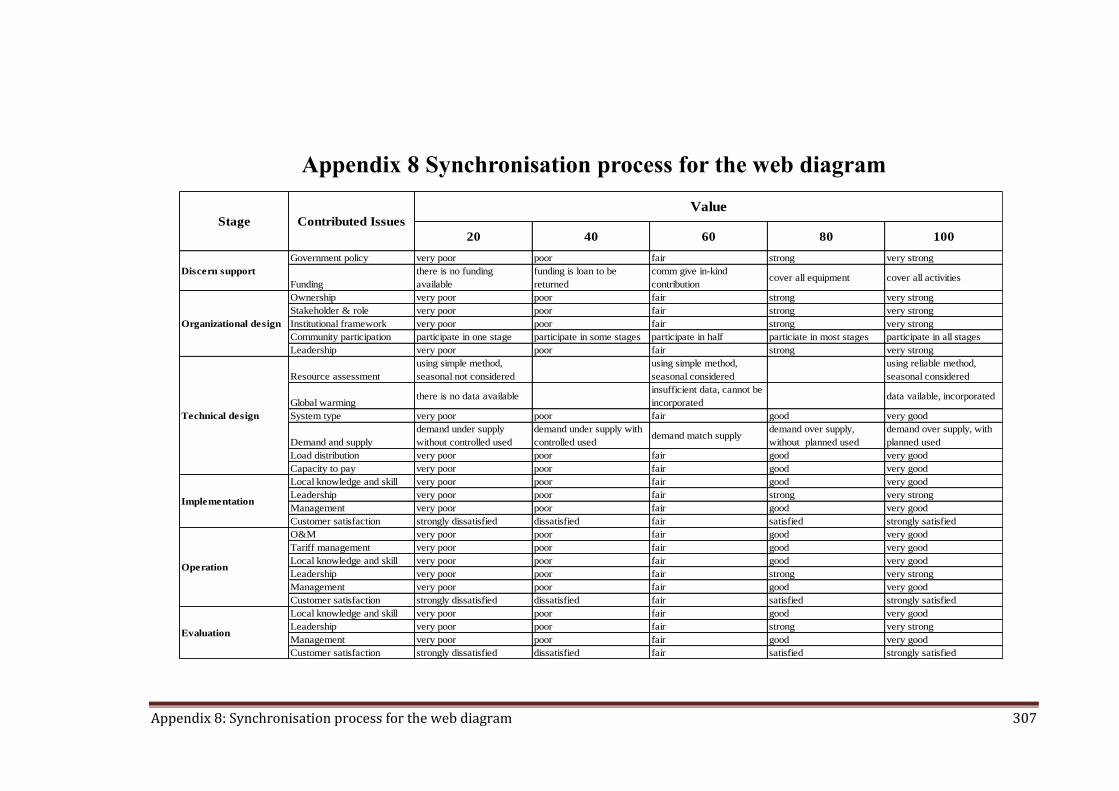
Appendix 8: Synchronisation process for the web diagram 307
Appendix 8 Synchronisation process for the web diagram
20 40 60 80 100
Government policy very poor poor fair strong very strong
Funding
there is no funding
available
funding is loan to be
returned
comm give in-kind
contributioncover all equipment cover all activities
Ownership very poor poor fair strong very strong
Stakeholder & role very poor poor fair strong very strong
Institutional framework very poor poor fair strong very strong
Community participation participate in one stage participate in some stages participate in half particiate in most stages participate in all stages
Leadership very poor poor fair strong very strong
Resource assessment
using simple method,
seasonal not considered
using simple method,
seasonal considered
using reliable method,
seasonal considered
Global warmingthere is no data available
insufficient data, cannot be
incorporateddata vailable, incorporated
System type very poor poor fair good very good
Demand and supply
demand under supply
without controlled used
demand under supply with
controlled useddemand match supply
demand over supply,
without planned used
demand over supply, with
planned used
Load distribution very poor poor fair good very good
Capacity to pay very poor poor fair good very good
Local knowledge and skill very poor poor fair good very good
Leadership very poor poor fair strong very strong
Management very poor poor fair good very good
Customer satisfaction strongly dissatisfied dissatisfied fair satisfied strongly satisfied
O&M very poor poor fair good very good
Tariff management very poor poor fair good very good
Local knowledge and skill very poor poor fair good very good
Leadership very poor poor fair strong very strong
Management very poor poor fair good very good
Customer satisfaction strongly dissatisfied dissatisfied fair satisfied strongly satisfied
Local knowledge and skill very poor poor fair good very good
Leadership very poor poor fair strong very strong
Management very poor poor fair good very good
Customer satisfaction strongly dissatisfied dissatisfied fair satisfied strongly satisfied
Technical design
Implementation
Operation
Evaluation
ValueContributed IssuesStage
Discern support
Organizational design