Embed Size (px)
Citation preview
1
MSc Thesis by Floor Mossink
27 April 2020
Water Systems and Global Change Group
The implementation of Blue-Green
Infrastructure in a Sustainable
Urban Stormwater Management
COMPARING LARGE AND MID-SIZED CITIES IN DENMARK AND THE
NETHERLANDS
2
The implementation of Blue-Green
Infrastructure in Sustainable Urban
Stormwater Management COMPARING LARGE AND MID-SIZED CITIES IN DENMARK AND THE NETHERLANDS
Floor Mossink
950706584100 27 March 2020
Master Thesis Water Systems and Global Change Group in partial fulfillment of the degree of Master
of Science in Climate Studies master program at Wageningen University, the Netherlands
Supervisors:
Dr. ir. LWA (Bert )van Hove – Water Systems and Global Change / Meteorology and Air Quality
MSc. Monserrat Budding-Polo Ballinas – Wageningen Environmental Research
Dr. Isabel Seifert-Dähnn – Norwegian Institute for Water Research
This Master Thesis report is written in cooperation with Wageningen University, Wageningen Environmental Research and the Norwegian Institute for Water Research.
Frontpage image: Enghavenparken, Copenhagen (Tredje Natur, 2019)

3
Acknowledgements This Master Thesis has been a wonderful journey. It brought me new insights into the seemingly endless innovative possibilities of climate adaptation and how I truly want to contribute to urban areas in my future career. Although this section is the last part of my Master Thesis that I will write, I am sure that my BGI journey has just begun. First of all, I would like to thank my dear supervisors Bert, Monserrat and Isabel who supervised me in my thesis research and helped me throughout the whole process. Thank you that I could always visit you or skype/call when I needed you. Your feedback has been most valuable to me and I learned a lot from you. I also would like to thank Åse Johannessen for advice and guidance on structuring my interviews. Secondly, I am grateful to have had the privilege to visit all four wonderful cities and meet all the inspiring informants in Amsterdam, Amersfoort, Copenhagen and Odense. Thank you for sharing your ideas and struggles openly. My research would have been empty without your contribution. I would like to thank my fellow thesis room students who I now call dear friends (see picture). You have made writing a thesis incredibly enjoyable. Your support has been very valuable to me. Special thanks to Froukje and for your endless support and believe in me. Finally, I am forever grateful for the support and love of my family and friends. Enjoy reading!
4
Abstract Extreme precipitation events as a result of climate change in combination with increased impervious surfaces as a result of urbanization, enhance the risks of flooding in urban areas. However, in many cities the current urban stormwater management approach is mainly based on a pipe-bound system and is not sustainable in the long term. Therefore, there have been calls for more sustainable urban stormwater management (SUSWM). Blue-Green Infrastructure (BGI) is an important tool for SUSWM as these measures manage stormwater by supporting a more natural water cycle in cities and provide ecosystem services. Despite the multiple benefits of BGI, implementation remains slow. The objective of this study is to identify and evaluate how BGI is implemented in large and mid-sized cities in The Netherlands and Denmark in SUSWM. This study compares Amsterdam, Copenhagen, Amersfoort and Odense. Explanatory research on the integration of BGI in the municipal organisation, the perceived drivers, barriers, opportunities and strategies in the implementation of BGI practices is provided. This study collected primary data through twelve semi-structured interviews in these cities from an institutional perspective and the qualitative research data was analysed using ATLAS ti. Results indicate that the four cities include BGI in their standard urban planning and large-sized cities have an additional program for BGI implementation. Commonalities between the four cities are identified on the perceived drivers and opportunities to implement BGI in SUSWM. All four cities indicate that climate change is the main driver to implement BGI and all identify additional drivers as co-benefits of BGI. The cities perceived community cooperation and political support as opportunities that stimulate BGI implementation. Furthermore, this study shows that there are differences in perceived barriers in the implementation of BGI in large-sized and mid-sized cities. Large-sized cities perceive more opportunities and fewer barriers, however, are perceiving difficulties in the new maintenance process of BGI. Mid-sized cities perceived financial resources and laws and regulations as barriers. Current successes in the cities that enhance BGI development include a long term city plan, invest in a network strategy, cooperate with the community and present BGI examples in the city. It is concluded that a regime shift from a traditional pipe-bound system toward a SUSWM regime by means of BGI is possible by mainstreaming BGI and make it the new standard in stormwater management that influences all retrofitting, reconstruction and new urban development. Keywords: Amersfoort, Amsterdam, Blue-Green Infrastructure, Climate Adaptation, Copenhagen, Multi-Level Perspective, Odense, Stormwater management, Transition Framework
5
Table of contents Abstract ....................................................................................................................................... 4
Table of contents ......................................................................................................................... 5
List of figures ................................................................................................................................ 7
List of tables ................................................................................................................................. 8
Abbreviations ............................................................................................................................... 9
Chapter 1: Introduction .............................................................................................................. 10
Background ............................................................................................................................ 10
Problem statement ................................................................................................................ 11
Research Objectives .............................................................................................................. 12
Research Questions ............................................................................................................... 12
Significance of the Study ....................................................................................................... 12
Scope and Limitations ........................................................................................................... 12
Further outline of thesis ........................................................................................................ 13
Chapter 2: Theoretical background ............................................................................................. 14
Blue-Green Infrastructure ..................................................................................................... 14
Multi-Level Perspective ......................................................................................................... 15
Transition Framework ........................................................................................................... 16
Climate adaptation, adaptive capacity and urban resilience ................................................ 17
Chapter 3: Research Design and Methods ................................................................................... 18
Methodology approach ......................................................................................................... 18
Study Areas ............................................................................................................................ 19
3.2.1. The Netherlands: Amsterdam and Amersfoort ............................................................. 19
3.2.2. Denmark: Copenhagen and Odense .............................................................................. 20
Defining BGI implementation indicators ............................................................................... 21
Data collection and data analysis .......................................................................................... 22
3.4.1. Primary Data, Secondary Data and Sampling ................................................................ 22
3.4.2. Validity and Reliability ................................................................................................... 23
3.4.3. Data Analysis Methods .................................................................................................. 23
Collaboration with institutions .............................................................................................. 23
Chapter 4: Results ...................................................................................................................... 24
Organization and management of BGI .................................................................................. 24
4.1.1. Amsterdam .................................................................................................................... 24
4.1.2. Amersfoort .................................................................................................................... 28
4.1.3. Copenhagen ................................................................................................................... 31
4.1.4. Odense ........................................................................................................................... 35
6
Drivers for BGI implementation ............................................................................................ 37
Barriers and opportunities .................................................................................................... 40
4.3.1. Information availability ................................................................................................. 42
4.3.2. Technical skills ............................................................................................................... 43
4.3.3. Legal support ................................................................................................................. 45
4.3.4. Financial support ........................................................................................................... 48
4.3.5. Organisational collaboration ......................................................................................... 49
4.3.6. Community involvement ............................................................................................... 51
Comparison of cities .............................................................................................................. 54
4.4.1. Comparison Netherlands: Amsterdam, Amersfoort ..................................................... 54
4.4.2. Comparison Denmark: Copenhagen, Odense ............................................................... 54
4.4.3. Comparison large sized cities: Amsterdam, Copenhagen ............................................. 56
4.4.4. Comparison mid-sized cities: Amersfoort, Odense ....................................................... 56
Strategies to overcome main barriers ................................................................................... 57
Chapter 5: Discussion .................................................................................................................. 60
Organization and management of BGI .................................................................................. 60
Drivers for BGI implementation ............................................................................................ 60
Barriers and opportunities .................................................................................................... 61
Strategies to overcome identified barriers ........................................................................... 62
Implementing Blue-Green-Infrastructure in large and mid-sized cities ................................ 63
Relevance and limitation of this study .................................................................................. 63
Chapter 6: Conclusions and recommendations .............................................................................. 65
Conclusions ............................................................................................................................ 65
Recommendations and future research ................................................................................ 66
References ................................................................................................................................. 67
List of Key Informants ................................................................................................................. 71
Annex 1: Variables, indicators and coding ................................................................................... 72
Annex 2.1: Interview Guide (English) ........................................................................................... 78
Annex 2.2: Interview Guide (Dutch) ............................................................................................ 81
Annex 3: Translation Municipal Departments Amersfoort ........................................................... 84
Annex 4: Barriers and opportunities............................................................................................ 85
Annex 5: Code definitions ........................................................................................................... 86
7
List of figures FIGURE 1: THE MULTI-LEVEL PERSPECTIVE ON THE URBAN WATER SYSTEM WITH THE LANDSCAPE, REGIME,
NICHE AND NICHE-REGIME (WIHLBORG ET AL., 2019). ............................................................................... 15 FIGURE 2 THE URBAN WATER MANAGEMENT TRANSITIONS FRAMEWORK AS PRESENTED BY (WONG &
BROWN, 2009).............................................................................................................................................. 16 FIGURE 3: THE ADAPTIVE CAPACITY FRAMEWORK (DIXON ET AL., 2014) ............................................................ 17 FIGURE 4: COMPARISON BETWEEN LARGE AND MID-SIZED CITIES AS RESEARCH STRATEGY (AUTHOR, 2020) .. 18 FIGURE 5: LOCATIONS OF CASE STUDIES: AMSTERDAM, COPENHAGEN, AMERSFOORT AND ODENSE (T.L.B.R.)
(ADAPTED FROM ESRI, GARMIN, GEBCO, NOAA NGDC AND OTHER CONTRIBUTORS) ............................... 19 FIGURE 6: THE DATA ANALYSIS METHOD AS PRESENTED IN FIVE DISTINGUISHED STEPS (BASED ON (BRAUN &
CLARKE, 2006)). ............................................................................................................................................ 23 FIGURE 7: ORGANISATIONAL STRUCTURE OF AMSTERDAM MUNICIPALITY, WITH GREEN INDICATING THE
DEPARTMENTS THAT ARE INVOLVED IN BGI IMPLEMENTATION BASED ON THE INTERVIEWEES
PERCEPTION, ADAPTED FROM (GEMEENTE AMSTERDAM, 2015) . ............................................................. 25 FIGURE 8: A) RAINWATER BOTTLENECKS B) THE BELLAMYBUURT AREA C) A SIMULATION OF FLOODED AREAS IN
THE BELLAMYBUURT AT 60 MM/HOUR (AMSTERDAM RAINPROOF, 2019; KLUCK ET AL., 2015) ............... 26 FIGURE 9: NETWORK APPROACH OF AMSTERDAM RAINPROOF (AMSTERDAM RAINPROOF, N.D.) .................... 27 FIGURE 10: BGI MEASURES IN THE BELLAMYBUURT: WADI, BELLAMYSQUARE AND FACADE GARDENS (AUTHOR,
2020) ............................................................................................................................................................ 28 FIGURE 11: ORGANISATIONAL STRUCTURE OF AMERSFOORT MUNICIPALITY, WITH GREEN INDICATING THE
DEPARTMENTS THAT ARE INVOLVED IN BGI IMPLEMENTATION BASED ON THE INTERVIEWEES
PERCEPTION, ADAPTED FROM (GEMEENTE AMERSFOORT, 2017). ............................................................. 29 FIGURE 12: THE THEORY OF THE NEGOTIATION PROCESS IN DEVELOPING PROJECTS FOR PUBLIC SPACE (IN
DUTCH), ADAPTED FROM (INFORMANT 5, AMERSFOORT, 2019) ................................................................ 30 FIGURE 13: ORGANISATIONAL STRUCTURE OF THE CITY OF COPENHAGEN MUNICIPALITY, WITH GREEN
INDICATING THE DEPARTMENTS THAT ARE INVOLVED IN BGI IMPLEMENTATION, BASED ON THE
INTERVIEWEES PERCEPTION, BASED ON INFORMATION FROM (THE CITY OF COPENHAGEN, 2018) . ....... 32 FIGURE 14: THE SEVEN CATCHMENTS AREAS (LEFT). THE NØRREBRO DISTRICT (333 HA) WITH AN INDICATION
OF MULTIPLE SOLUTIONS DESIGNED FOR THE CATCHMENT AREA. THE CLOUDBURST BOULEVARDS ARE
CONTROLLED WATER TRANSPORT DURING EXTREME RAIN EVENTS; RETENTION ROADS DELAY RUNOFF;
RETENTION SPACES COLLECT EXCESS SURFACE RUNOFF; GREEN ROADS INFILTRATE AND RETAIN
RAINWATER; CLOUDBURST TUNNELS TRANSFER WATER TO A NEARBY HARBOUR (RIGHT) (ZIERSEN ET AL.,
2017). ........................................................................................................................................................... 33 FIGURE 15: MULTIPLE RESERVOIRS INCREASE THE STORAGE CAPACITY OF ENGHAVEPARKEN IN CASE OF A
CLOUDBURST. IN CASE OF AN EVERYDAY RAIN EVENT THE UNDERGROUND RESERVOIR OF THE ROSE
GARDEN IS USED. IN CASE OF A 10-YEAR RAIN EVENT, AN ADDITIONAL SPORTS FIELD, LAKE AND ROSE
GARDEN ARE FLOODED IN THAT ORDER. FINALLY, IN CASE OF A 100-YEAR RAIN EVENT, THE WHOLE PARK
IS OVERFLOWN (TREDJE NATUR, 2019; INFORMANT 9, COPENHAGEN, 2020). .......................................... 34 FIGURE 16: ORGANISATIONAL STRUCTURE OF THE CITY OF ODENSE MUNICIPALITY, WITH GREEN INDICATING
THE DEPARTMENTS THAT ARE INVOLVED IN BGI IMPLEMENTATION, BASED ON THE INTERVIEWEES
PERCEPTION, ADAPTED FROM (BYRÅD, 2015). ............................................................................................ 35 FIGURE 17: IN THE BELLINGE FÆLLED DISTRICT AREA, RAINWATER IS HANDLED WITHIN THE DISTRICT (ODENSE
KOMMUNE, 2013) ........................................................................................................................................ 36 FIGURE 18: SPIDERWEB DIAGRAM: THE AVERAGE LIKERT-SCALE RATING ON THE TWELVE INDICATORS AS
SCORED BY THE INTERVIEWEES OF A) AMSTERDAM, B) AMERSFOORT, C) COPENHAGEN AND D) ODENSE
(AUTHOR, 2020) ........................................................................................................................................... 41 FIGURE 19: SKIBHUS: THE DECOUPLING OF RAINWATER BY CITIZENS, THE ARROW INDICATING WHERE
RAINWATER IS DECOUPLED AND LED TO THE RETENTION ON THE PUBLIC ROAD (LEFT) AND THE
EXPERIMENTATION WITH STREET PROFILES (RIGHT) (AUTHOR, 2020). ...................................................... 47 FIGURE 20: RENEWAL OF A SQUARE IN DE HAM, AMERSFOORT. LTR: INSECT HOTEL, WADI AND EDIBLE HERBS
AND FRUIT TREES (AUTHOR, 2020). ............................................................................................................. 53
8
FIGURE 21: SPIDERWEB DIAGRAM: THE COMPARISON OF THE FOUR CITIES BASED ON HOMOGENOUS
COMPARISON BETWEEN COUNTRIES AND HETEROGENOUS COMPARISON BETWEEN CITY SIZES. LARGE-
VS MID-SIZED CITIES: A) AMSTERDAM-AMERSFOORT, B) COPENHAGEN-ODENSE. LARGE-SIZED CITIES: C)
AMSTERDAM-COPENHAGEN. MID-SIZED CITIES: D) AMERSFOORT-ODENSE. (AUTHOR, 2020) .................. 55 FIGURE 22: AMSTERDAM: THE DEFINED MAIN BGI BARRIERS AND PROPOSED STRATEGIES TO OVERCOME
THEM (AUTHOR, 2020). ................................................................................................................................ 57 FIGURE 23: AMERSFOORT: THE DEFINED MAIN BGI BARRIERS AND PROPOSED STRATEGIES TO OVERCOME
THEM. UNDERLINED BARRIERS ARE LINKED TO THE TWELVE INDICATORS (AUTHOR, 2020). .................... 57 FIGURE 24: COPENHAGEN: THE DEFINED MAIN BGI BARRIERS AND PROPOSED STRATEGIES TO OVERCOME
THEM. UNDERLINED BARRIERS ARE LINKED TO THE TWELVE INDICATORS (AUTHOR, 2020). .................... 58 FIGURE 25: ODENSE: THE DEFINED MAIN BGI BARRIERS AND PROPOSED STRATEGIES TO OVERCOME THEM.
UNDERLINED BARRIERS ARE LINKED TO THE TWELVE INDICATORS (AUTHOR, 2020). ................................ 59
List of tables TABLE 1: DEFINITIONS OF TOOLS IN SUSTAINABLE URBAN STORMWATER MANAGEMENT ............................... 14 TABLE 2: CASE CITY PROFILES AND CHARACTERISTICS (CLIMATE DATA, N.D.) ..................................................... 18 TABLE 3: OPERATIONALIZATION OF STUDY: VARIABLES AND INDICATORS AS LINKED TO THE SUB-RESEARCH
QUESTIONS (AUTHOR, 2020)........................................................................................................................ 22 TABLE 4: DRIVERS FOR THE IMPLEMENTATION OF BGI IN THE CITIES, BASED ON THE INTERVIEWEES
PERCEPTION (AUTHOR, 2020) ...................................................................................................................... 37 TABLE 5: INTERVIEWEES AND THEIR PROFESSIONAL BACKGROUND: “GREEN” OFFICIALS HAVE A BACKGROUND
ON ECOLOGY, “BLUE” OFFICIALS ARE MAINLY WORKING WITH WATER AND “PLANNING” ARE OFFICIALS
WORKING WITH URBAN PLANNING AND/OR ARCHITECTURE ..................................................................... 40 TABLE 6: KNOWLEDGE STATUS: THE NUMBERS PRESENT THE FREQUENCY OF THE CODES, OR ARGUMENTS,
MENTIONED BY THE INTERVIEWEES. A HIGHER NUMBER INDICATES THAT THE CODE IS MENTIONED
MORE OFTEN. A ‘-‘ SIGN INDICATES THAT THE CODE IS NOT MENTIONED FOR THE RESPECTIVE CITY. FOR A
DEFINITION OF THE CODES SEE ANNEX 5. (NOTE: THE CODE ‘KNOWLEDGE IS CONCENTRATED’ IS BOTH
PERCEIVED AS BARRIER AND AS OPPORTUNITY). ........................................................................................ 42 TABLE 7: EDUCATIONAL TRAINING: THE NUMBERS PRESENT THE FREQUENCY OF THE CODES, OR ARGUMENTS,
MENTIONED BY THE INTERVIEWEES. A HIGHER NUMBER INDICATES THAT THE CODE IS MENTIONED
MORE OFTEN. A ‘-‘ SIGN INDICATES THAT THE CODE IS NOT MENTIONED FOR THE RESPECTIVE CITY. FOR A
DEFINITION OF THE CODES SEE ANNEX 5 ..................................................................................................... 42 TABLE 8: PLANNING GUIDELINES: THE NUMBERS PRESENT THE FREQUENCY OF THE CODES, OR ARGUMENTS,
MENTIONED BY THE INTERVIEWEES. A HIGHER NUMBER INDICATES THAT THE CODE IS MENTIONED
MORE OFTEN. A ‘-‘ SIGN INDICATES THAT THE CODE IS NOT MENTIONED FOR THE RESPECTIVE CITY. FOR A
DEFINITION OF THE CODES SEE ANNEX 5 ..................................................................................................... 44 TABLE 9: COORDINATION OF MAINTENANCE: THE NUMBERS PRESENT THE FREQUENCY OF THE CODES, OR
ARGUMENTS, MENTIONED BY THE INTERVIEWEES. A HIGHER NUMBER INDICATES THAT THE CODE IS
MENTIONED MORE OFTEN. A ‘-‘ SIGN INDICATES THAT THE CODE IS NOT MENTIONED FOR THE
RESPECTIVE CITY. FOR A DEFINITION OF THE CODES SEE ANNEX 5 ............................................................. 44 TABLE 10: LAWS AND REGULATIONS: THE NUMBERS PRESENT THE FREQUENCY OF THE CODES, OR
ARGUMENTS, MENTIONED BY THE INTERVIEWEES. A HIGHER NUMBER INDICATES THAT THE CODE IS
MENTIONED MORE OFTEN. A ‘-‘ SIGN INDICATES THAT THE CODE IS NOT MENTIONED FOR THE
RESPECTIVE CITY. FOR A DEFINITION OF THE CODES SEE ANNEX 5 ............................................................. 45 TABLE 11: POLITICAL SUPPORT: THE NUMBERS PRESENT THE FREQUENCY OF THE CODES, OR ARGUMENTS,
MENTIONED BY THE INTERVIEWEES. A HIGHER NUMBER INDICATES THAT THE CODE IS MENTIONED
MORE OFTEN. A ‘-‘ SIGN INDICATES THAT THE CODE IS NOT MENTIONED FOR THE RESPECTIVE CITY. FOR A
DEFINITION OF THE CODES SEE ANNEX 5 ..................................................................................................... 46 TABLE 12: FINANCIAL RESOURCES: THE NUMBERS PRESENT THE FREQUENCY OF THE CODES, OR ARGUMENTS,
MENTIONED BY THE INTERVIEWEES. A HIGHER NUMBER INDICATES THAT THE CODE IS MENTIONED
9
MORE OFTEN. A ‘-‘ SIGN INDICATES THAT THE CODE IS NOT MENTIONED FOR THE RESPECTIVE CITY. FOR A
DEFINITION OF THE CODES SEE ANNEX 5 ..................................................................................................... 48 TABLE 13: BUDGET AVAILABILITY: THE NUMBERS PRESENT THE FREQUENCY OF THE CODES, OR ARGUMENTS,
MENTIONED BY THE INTERVIEWEES. A HIGHER NUMBER INDICATES THAT THE CODE IS MENTIONED
MORE OFTEN. A ‘-‘ SIGN INDICATES THAT THE CODE IS NOT MENTIONED FOR THE RESPECTIVE CITY. FOR A
DEFINITION OF THE CODES SEE ANNEX 5 ..................................................................................................... 48 TABLE 14: INSTITUTIONAL RESPONSIBILITY: THE NUMBERS PRESENT THE FREQUENCY OF THE CODES, OR
ARGUMENTS, MENTIONED BY THE INTERVIEWEES. A HIGHER NUMBER INDICATES THAT THE CODE IS
MENTIONED MORE OFTEN. A ‘-‘ SIGN INDICATES THAT THE CODE IS NOT MENTIONED FOR THE
RESPECTIVE CITY. FOR A DEFINITION OF THE CODES SEE ANNEX 5 (NOTE: ‘RESPONSIBILITY IS SPREAD’ IS
BOTH PERCEIVED AS A BARRIER AND OPPORTUNITY) ................................................................................. 50 TABLE 15: INSTITUTIONAL COOPERATION: THE NUMBERS PRESENT THE FREQUENCY OF THE CODES, OR
ARGUMENTS, MENTIONED BY THE INTERVIEWEES. A HIGHER NUMBER INDICATES THAT THE CODE IS
MENTIONED MORE OFTEN. A ‘-‘ SIGN INDICATES THAT THE CODE IS NOT MENTIONED FOR THE
RESPECTIVE CITY. FOR A DEFINITION OF THE CODES SEE ANNEX 5 ............................................................. 50 TABLE 16: COMMUNITY COOPERATION: THE NUMBERS PRESENT THE FREQUENCY OF THE CODES, OR
ARGUMENTS, MENTIONED BY THE INTERVIEWEES. A HIGHER NUMBER INDICATES THAT THE CODE IS
MENTIONED MORE OFTEN. A ‘-‘ SIGN INDICATES THAT THE CODE IS NOT MENTIONED FOR THE
RESPECTIVE CITY. FOR A DEFINITION OF THE CODES SEE ANNEX 5 ............................................................. 51 TABLE 17: COMMUNITY EDUCATION: THE NUMBERS PRESENT THE FREQUENCY OF THE CODES, OR
ARGUMENTS, MENTIONED BY THE INTERVIEWEES. A HIGHER NUMBER INDICATES THAT THE CODE IS
MENTIONED MORE OFTEN. A ‘-‘ SIGN INDICATES THAT THE CODE IS NOT MENTIONED FOR THE
RESPECTIVE CITY. FOR A DEFINITION OF THE CODES SEE ANNEX 5 ............................................................. 51 TABLE 18: DESCRIPTION OF THE VARIABLES, INDICATORS AND CODING LINKED TO THE INTERVIEW QUESTIONS
AND LITERATURE .......................................................................................................................................... 73 TABLE 19: JUSTIFICATION OF THE ENGLISH TRANSLATION OF THE AMERSFOORT MUNICIPAL DEPARTMENTS IN
DUTCH .......................................................................................................................................................... 84 TABLE 20: DETAILS OF THE SPIDERWEB DIAGRAMS, A QUANTITATIVE RATING OF THE INDICATORS ................. 85 TABLE 21: DETAILS OF CODE DEFINITIONS TO BARRIERS AND OPPORTUNITIES .................................................. 86
Abbreviations ABC Active, Beautiful and Clean Waters AME Amersfoort AMS Amsterdam BMP Best Management Practices BGI Blue-Green Infrastructure COP Copenhagen GI Green Infrastructure LID Low Impact Development LIUD Low Impact Urban Development NBS Nature Based Solutions NWW New Water Ways ODE Odense SCMs Stormwater control measures SUDS Sustainable Urban Drainage System SUSWM Sustainable Urban Stormwater Management SWM Storm Water Management WSUD Water Sensitive Urban Design WSC Water Smart City measures
10
Chapter 1: Introduction Background
Today’s urban communities face multiple challenges as a result of climate change and urban population growth (Dhakal & Chevalier, 2017; Wong & Brown, 2009). More than half of the global population lives in urban areas and this amount is expected to increase to over 6 billion people in 2050. This urbanization is accompanied by land-cover change and adds to the greying of the natural landscape which alters the natural hydrological cycle (Grimm et al., 2008; Hoang & Fenner, 2016; van Hattum, 2016). Due to an increase in impervious surfaces, the hydrologic functions of infiltration, evapotranspiration, interception and retention of rainwater are reduced in the urban landscape. As a result, urban areas have become more susceptible to flooding due to excessive rainfall. This vulnerability is enhanced by climate change since rainfall intensity and frequency are projected to increase further in the next decades. This may lead to increased property damage and a threat to public safety (Braskerud et al., 2019; Cettner et al., 2013; Dhakal & Chevalier, 2016, 2017; Ngamalieu-Nengoue et al., 2019; van Hattum, 2016). Thus, stormwater management is increasingly becoming a challenge for municipalities (Wihlborg et al., 2019; Wong & Brown, 2009). Traditionally, the drainage of rainwater consists of grey infrastructure with a pipe-bound system approach; a network of pipes which removes stormwater directly from urban areas to a downstream drainage system. However, this traditional system lacks sufficient capacity to handle rainwater in case of extreme precipitation events (Dhakal & Chevalier, 2017; The City of Copenhagen, 2012). This system is often based on a combined sewer system where rainwater and wastewater are flowing in the same pipes. In case of extreme precipitation events, the stormwater volume exceeds the capacity of this system, causing combined sewer overflow and pollution in surface waters which are a major problem in cities (Lucas & Sample, 2015). Additionally, this system causes hydrologic disruption, for example, diminished rainwater infiltration which inhibits groundwater recharge. The traditional urban water management practices are unsustainable and in case of future climate changes, a more flexible approach is needed to cope with extreme weather events (Braskerud et al., 2019; Dhakal & Chevalier, 2017). As opposed to the traditional pipe-bound system, Blue-Green Infrastructure (BGI) (as an important tool for SUSWM) aims to support a more natural water cycle in cities by the use of ecosystem-based measures to manage stormwater. Examples of BGI are green roofs, rain gardens and retention basins (Dhakal & Chevalier, 2017; Liao et al., 2017; Thorne et al., 2018). Apart from treating stormwater on-site, these measures have additional benefits such as recharged groundwater levels, restoration of biodiversity, providing recreation and improve public health (van Hattum, 2016; Wong & Brown, 2009). In addition, these BGI measures are considered to be cost-effective compared to increasing the capacity of the pipe-bound system due to the enhancement of natural processes instead of exclusively using manufactured materials (Dhakal & Chevalier, 2017). Additionally, flood management on urban surfaces is less expensive than the expansion of the traditional pipe system below ground (Ziersen et al., 2017). Likely, BGI is not implemented as a stand-alone approach, but supplementary to existing pipe-systems (Li et al., 2017). Although BGI measures have started to be applied, focus on the traditional pipe-bound systems remains ubiquitous globally and the implementation of sustainable water sensitive practices such as BGI remains slow (Brown & Farrelly, 2009; Cettner et al., 2013; Dhakal & Chevalier, 2017; Roy et al., 2008; Wong & Brown, 2009). Urban flooding remains a severe threat (Dhakal & Chevalier, 2016). Thus, there is a need to shift from the traditional urban stormwater management toward sustainable urban stormwater management (Dhakal & Chevalier, 2016).
11
Problem statement The problem can be examined on different scales: global, European and local. On a global scale, different studies identify possible causes for the inaction of implementing stormwater measures and define multiple barriers, mainly resulting from research in the US, Australia and the UK (Brown & Farrelly, 2009; Roy et al., 2008). Notably, the main barriers to change the traditional urban water management toward SUSWM emerges from governance barriers rather than technical barriers (Brown & Farrelly, 2009; Dhakal & Chevalier, 2017; S. J. van de Meene et al., 2011). These governance barriers are described with different terms as socio-institutional-, organizational-, or administrative barriers (Dhakal & Chevalier, 2016). Examples of these governmental barriers are fragmented roles and responsibilities, poor communication, no long-term strategy and lack of political and public will (Brown & Farrelly, 2009). However, although these barriers are identified, evaluation of the governmental barriers of urban stormwater management is limited (Dhakal & Chevalier, 2016). Thus, from a global perspective, there is a need to evaluate governmental barriers and address applicable strategies to overcome them. On a European scale, the uptake of BGI measures in Western Europe is gradual, however, limited, hesitant and stalled (Cettner et al., 2013). This despite the present risk of flooding in cities across all of Europe due to climate change and ageing grey infrastructure (Backhaus & Fryd, 2013). The study of Cettner et al. (2013) on Swedish municipalities, indicating to be representative of other Western European countries, recognized that this limited uptake of sustainable stormwater initiatives is mainly due to legal requirements. There a lack of legislation on the use of sustainable measures over the traditional pipe-bound system approach. Additionally, there is a perceived dichotomy on stormwater management between the urban planning department and water department. The dichotomy is amplified by the assumption that the development and usage of alternatives to piped-systems have no legal support. Thus, fractions between these different departments inhibit implementation, while the involvement of water managers as key players in urban planning has the potential to enhance implementation (Cettner et al., 2013). Thus, on a European scale, the implementation of stormwater measures is constrained by organizational and legislative barriers. On a local city scale, the uptake of BGI measures can be different as water management practises are unique for every city. The development of urban processes on stormwater infrastructure vary between different cities due to their difference in history, available resources and local climate conditions. Although previous research on urban stormwater management has mainly focused on large cities, the patterns may be different for smaller cities. At the same time, it is important to take into account that the combined urban population of small and mid-sized cities still is a significant amount. There is a need to obtain information on stormwater management in large cities as well as in mid-sized cities as it would create a more complete understanding of the complexities in urban stormwater management in cities of different sizes (Hale, 2016). A comparison can be made between cities of different sizes in Europe. Northern European countries as the Netherlands and Denmark have been developing stormwater management in pilot projects and are driven to adapt their cities to future climate change (Backhaus & Fryd, 2013). In Danish as well as in Dutch urban areas, the extreme weather events are expected to increase over the next century. Amsterdam and Copenhagen are already improving their stormwater management via long term strategies. Copenhagen has developed a Cloudburst Management Plan and Amsterdam has developed a Rainproof cross-cutting strategy (Kluck et al., 2015; Ziersen et al., 2017). However, studies on the comparison between large and mid-sized cities are underrepresented. There is a need for new insights in comparison on BGI implementation between large cities such as Amsterdam and Copenhagen and mid-sized cities such as Amersfoort and Odense. There is a lack of information on the sustainable urban stormwater management with a city size approach, which this thesis study will address.
12
Research Objectives This study is an explanatory research on the transition from the traditional urban stormwater management towards a sustainable, more nature-based urban stormwater management. This study aims to identify and evaluate the barriers and opportunities in the implementation of BGI practices from a governmental perspective. Two large cities (Amsterdam, Copenhagen) and two mid-sized cities (Amersfoort, Odense) in respectively the Netherlands and Denmark were compared. The collaboration between different departments within municipalities was analysed, and the perceived drivers, barriers and opportunities on the implementation of BGI were assessed. As such, strategies needed to overcome these barriers could be identified.
Research Questions Main Question
How is Blue-Green Infrastructure implemented in large and mid-sized cities of The Netherlands and Denmark for Sustainable Urban Stormwater Management? Sub-Questions
• SRQ1: How is the implementation of BGI currently organised in the stormwater management in large cities like Amsterdam and Copenhagen and mid-sized like Amersfoort and Odense?
• SRQ2: What are the drivers for implementing BGI in large cities like Amsterdam and Copenhagen and mid-sized cities like Amersfoort and Odense?
• SRQ3: What are the perceived barriers and opportunities in the implementation of BGI from an institutional perspective in Amsterdam, Amersfoort, Copenhagen and Odense?
• SRQ4: What are possible strategies to overcome the identified barriers in the implementation of BGI in Amsterdam, Amersfoort, Copenhagen and Odense?
Significance of the Study To manage urban stormwater, a transition from the traditional pipe-bound system approach toward SUSWM utilizing BGI is essential. Although the role of the government in the implementation of BGI is indispensable due to their responsibilities in urban planning, a comprehensive evaluation of the governance on their barriers, organisation and legislation is still lacking (Cettner et al., 2013; Dhakal & Chevalier, 2016). Especially practitioners involved in urban planning have a key role in the link between urban planning and other actors involved (Wihlborg et al., 2019). This study contributes toward solving this knowledge gap by explaining the governmental organisation of municipalities as well as the perceived governmental barriers and opportunities in the implementation of BGI. Additionally, a new perspective analysis and comparison between large and mid-sized cities in this study will create a more complete understanding of stormwater management at different scales and would increase the transferability of the research outcome. Furthermore, this research will contribute to the New Water Ways (NWW) project, funded by the Norwegian Research Council. This project looks at different solutions and gathers information from other cities and countries. Amsterdam and Copenhagen are used as example cases for the NWW project (Braskerud et al., 2019). An additional comparison with mid-sized cities could improve the quality of the results and the transferability towards other Northern European cities.
Scope and Limitations This study is limited to four case studies as the geographical scope is limited to Northern European cities and specifically two large cities (Amsterdam and Copenhagen) and two mid-sized cities (Amersfoort and Odense). The size is based on the number of inhabitants per city on a European scale. A city in the category large-sized has more than 500.000 inhabitants while a city in the category mid-sized has less than 500.000 and more than 100.000 inhabitants (Giffinger et al., 2007). Furthermore,
13
despite multiple challenges due to climate change, the focus of this study is on stormwater management. Finally, this research interviewed experts from each municipality and is hence limited to the local scale. Other limitations within the interview method were the difference in language when conducting the interview. However, this limitation was solved by the use of the English language, mainly in Denmark, and nowadays many reports are available in English.
Further outline of thesis The following chapter provides a theoretical background on BGI and water governance by presenting the Multi-Level Perspective and the Transition Framework. The third chapter concerns the Research Design and Methods to present the approaches used for data collection as well as a description of the case study areas. The fourth chapter presents the results of the sub-research questions on the four case studies. This includes how BGI is organised within the municipal structure, the management of BGI in the four cities, the drivers for implementing BGI, the perceived barriers and opportunities on BGI, a comparison between mid-sized and large-sized cities and finally the strategies presented to overcome certain barriers. The fifth and final chapter discusses the results of the research questions and a conclusion on the main question is derived.
14
Chapter 2: Theoretical background This chapter addresses relevant concepts from the literature that create a foundation for the empirical study in this thesis. First, different definitions in urban stormwater management are presented and Blue-Green Infrastructure (BGI) is defined. Water governance is explained via the Multi-Level Perspective and the Urban Water Management Transition framework is presented.
Blue-Green Infrastructure Over time, the terminology around urban stormwater management practices has developed in different parts of the world as driven by local contexts (Table 1) (Fletcher et al., 2015; Liao et al., 2017). Table 1: Definitions of tools in Sustainable Urban Stormwater Management
Term Abbreviation Country primarily used
Reference
Active, Beautiful and Clean Waters ABC Singapore (Liao et al., 2017) Adaptive measures - - (The City of Copenhagen,
2012) Best Management Practices BMP Primarily US
and Canada (Fletcher et al., 2015)
Blue-Green Infrastructure BGI - (Liao et al., 2017) Cloudburst management measures - Denmark (The City of Copenhagen,
2014) Green Infrastructure GI Initially US (Liao et al., 2017) Low Impact Development LID US (Fletcher et al., 2015) Low Impact Urban Development LIUD New Zealand (Fletcher et al., 2015) Nature Based Solutions NBS - (Maes & Jacobs, 2017) Non-piped drainage systems - Sweden (Cettner et al., 2013) Stormwater control measures SCMs US (Fletcher et al., 2015) Stormwater management solutions - - (Hoang & Fenner, 2016) Sponge city - China (Liao et al., 2017)
Sustainable Urban Drainage System SUDS UK (Fletcher et al., 2015)
Water Sensitive Urban Design WSUD Australia (Fletcher et al., 2015) Water Smart City measures WSC - (van Hattum, 2016)
Blue-Green Infrastructure (BGI) is a relatively new term, however, the concept and practice are not new. Hence, resulting in different terms that define similar concepts in different parts of the world (Fletcher et al., 2015; Liao et al., 2017). To make an overview, these different terms are listed in Table 1. The concepts slightly vary in focus from a more green (nature) to a blue (water) focus and have a stronger connection to one scientific discipline than another (Wihlborg et al., 2019). Green Infrastructure, for example, is more focused on green, while Water Smart City initiatives are focused slightly more on blue. Important to note is that in this study all these landscape system concepts in the context of urban stormwater management practices are considered BGI. Although, BGI is linked to climate adaptation measures, in this study it has a main focus on stormwater and torrential rain events and not heat stress or drought. Thus, in this study, BGI is used as a working definition which refers to the listed terms of the same concept. Blue-Green Infrastructure (BGI) is defined here as an umbrella term for sustainable multifunctional measures which often combines natural and artificial materials and is purposefully designed and managed to provide stormwater-related ecosystem services (Liao et al., 2017; Wihlborg et al., 2019). The essence of BGI is to create solutions that are based on natural ecosystems and processes (Liao et
15
al., 2017). In general, five types can be distinguished: raingardens, bioswales, constructed wetlands, retention and detention basins and green roofs. SUSWM includes measures as permeable paving, rainwater cisterns and underground storage tanks, which are according to Liao et al. (2017) not considered as BGI as these are not ecosystem-based. However, as BGI is used as a working term in this study to cover stormwater solutions, it will also cover permeable paving and rainwater cisterns.
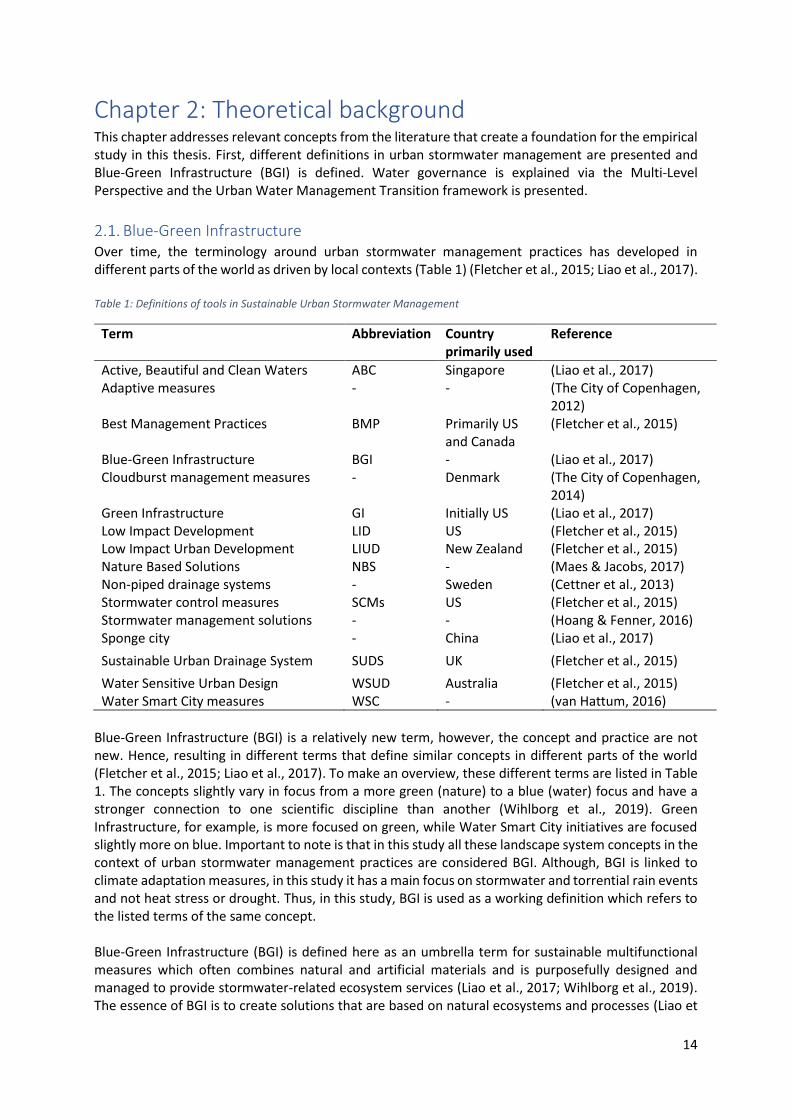
Multi-Level Perspective To explain what barriers and drivers exist in the transition to SUSMW, the transition theory is used. In order to describe the transition of the traditional pipe-bound system approach toward a SUSWM approach by means of BGI. This transition of large socio-technical systems can be explained via the Multi-Level Perspective as introduced by Geels (2002) and further elaborated by Mguni et al. (2015) and Wihlborg et al. (2019). The Multi-Level Perspective creates a better understanding of how the implementation of stormwater solutions is arranged within the governmental framework of a city, and how the urban water management regime of a city is arranged. The Multi-Level Perspective consists of three levels as presented in Figure 1. The first level is the ‘landscape’ or macro-level and refers to pressures on the system. Climate change and urbanization are examples of pressures on the urban water management system. The second level is the ‘regime’ or the meso-level, which are the persons or institutions, such as municipalities and water authorities, that are responsible for the system and dominates the way societal needs are met. The traditional system with a pipe-bound approach and central management is an example of a current regime. The third level is the ‘niche’ level or micro-level which are innovations that are developed outside the regime and are specific such as BGI pilot projects. Additionally, there is the ‘niche-regime’, a regime that is not dominating, however, has the power to compete with the current regime (Geels, 2002; Mguni et al., 2015; Wihlborg et al., 2019).
Figure 1: The Multi-Level Perspective on the urban water system with the landscape, regime, niche and niche-regime (Wihlborg et al., 2019).
Central in the Multi-Level Perspective is that drivers that stimulate transition emerges from niches by presenting alternative solutions to the regime or drivers appear from the landscape level, such as climate change or increased urbanisation. Whereas barriers can hinder a transition to SUSWM. The origins of barriers can be technological, legal, organisational, financial, social, educational or political (Wihlborg et al., 2019). The focus of this study will be on the second- or ‘regime’ level and the
16
municipalities and their perceived drivers, barriers and opportunities. The reason for this is that urban water management has a focus on a city-scale due to its corresponding spatial area of the urban water infrastructure and their responsibility in urban planning (S. J. van de Meene et al., 2011). Moreover, municipalities are legally responsible for stormwater management, which is a responsibility frequently delegated to the public water utilities (Wihlborg et al., 2019). In general, the municipalities have the responsibility to implement urban planning, however, to what degree the different departments work together differs between municipality (Cettner et al., 2013). Although the Multi-Level Perspective indicates an organized structure in the urban water management, in practice the water regime remains fragmented. The organisational collaboration and coordination within the urban water management remain poor which constrains the implementation of SUSWM practices as BGI (Brown & Farrelly, 2009). There is a limited understanding of the used governance approaches that are needed to support SUSWM as it needs an adaptive, participatory and integrated approach (Brown & Farrelly, 2009; S. J. van de Meene et al., 2011). Therefore, it is important to investigate how the water regime is arranged in different city municipalities of different scales in order to investigate how BGI can be efficiently implemented.
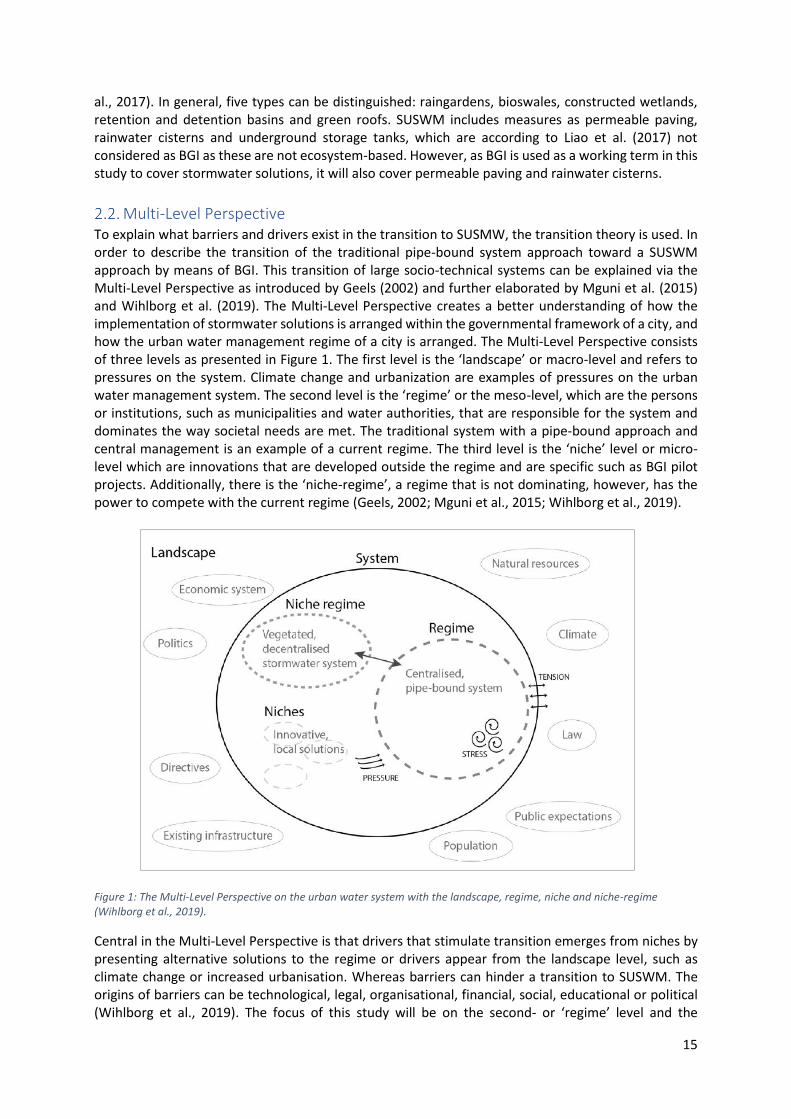
Transition Framework In addition to the Multi-Level Perspective, the Urban Water Management Transition Framework, as presented in Figure 2, displays how the urban water regime can develop toward a Water Sensitive City. Meaning that a city can develop to a sustainable urban water city which would ‘ensure environmental repair and protection, supply security, public health and economic sustainability, through water sensitive urban design; enlightened social and institutional capital, and diverse and sustainable technology choices’ (Wong & Brown, 2009, p. 674). This framework indicates where current cities are in their transition and what transition states are needed to develop further (Wong & Brown, 2009). There are six transition states which are displayed in overlapping rings in Figure 2. Cities in the first (water supply city) and second state (sewered city) are often cities in developing countries, while the majority of cities in developed countries are in state 3 (drained city), 4 (waterway city) or 5 (water cycle city) (van Hattum, 2016).
Figure 2 The Urban Water Management Transitions Framework as presented by (Wong & Brown, 2009)
17
The transition framework illustrates that overall a major change is needed of traditional approaches in order to envision a Water Sensitive City. Wong & Brown (2009) confirm that the implementation of infrastructure that is flexible is needed to realise this transition. Fortunately, urban areas already provide opportunities for new technologies to develop and are so-called hot spots for innovation to promote transition (Grimm et al., 2008). Thus, changes in traditional approaches of water governance by use of innovations can enhance the transition process.
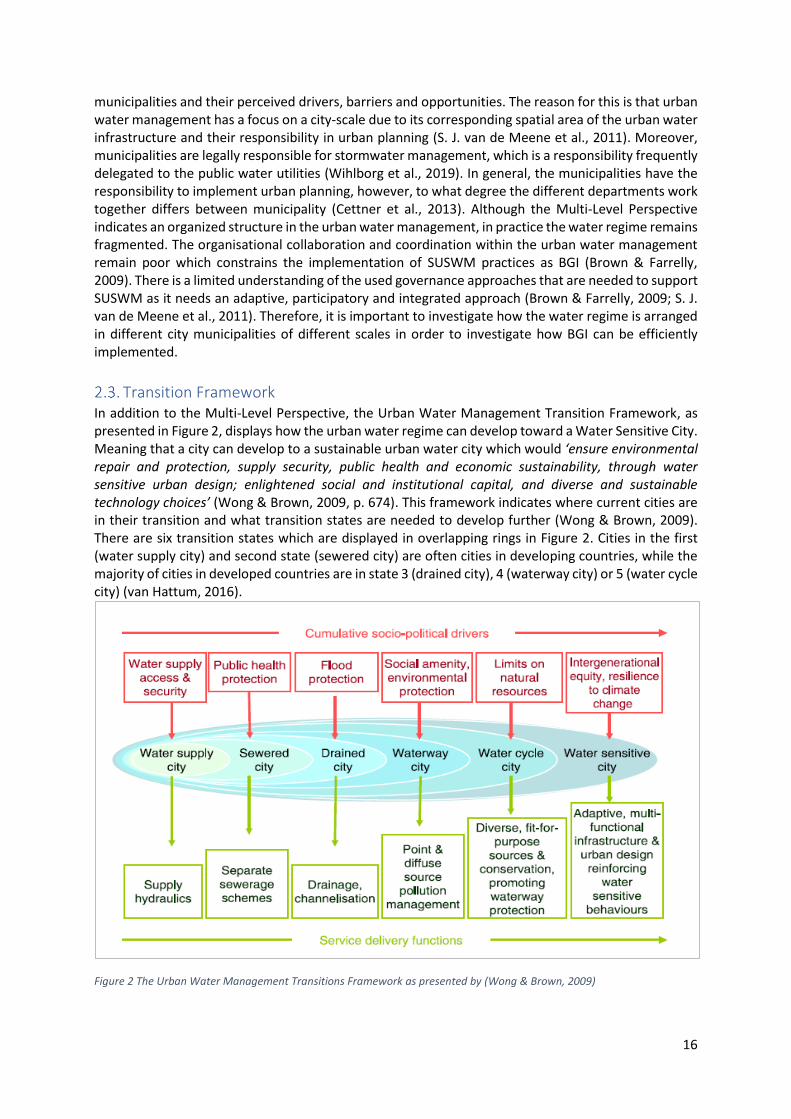
Climate adaptation, adaptive capacity and urban resilience The potential impacts of climate change on cities is determined by the adaptive capacity of cities to deal with climate change impacts. Adaptive capacity is described as the ability to adapt and connects vulnerability and resilience (Dixon et al., 2014). The vulnerability of a city is dependent on the exposure and sensitivity of cities to climate change (Georgi et al., 2012). Resilience, on the other hand, refers to: ‘the ability of a system (the city) to adapt and adjust to changing internal or external processes’ (Voskamp & Van de Ven, 2015, p. 159). Thus, increasing adaptive capacity towards climate change, acknowledged as a positive aspect of a city is determined by the reduction of vulnerability and the increase in resilience. This principle is explained by the adaptive capacity framework in Figure 3 (Dixon et al., 2014).
Implementing measures that improve adaptive capacity can be developed by examining cities' vulnerability and resilience (Dixon et al., 2014). BGIs provide adaptation measures that can reduce vulnerability as it reduces the sensitivity to climate change such as flooding (Georgi et al., 2012). The functionality of BGI differs among the measures and include regulating rainwater runoff via infiltration, water retention and adsorption, water storage and rainfall interception. Simultaneously, BGI contributes to urban resilience against climatic hazards such as extreme precipitation events. Climatic adaptation is reached by processes that contribute to the capture, storage and drainage of water in the hydraulic system (Dai et al., 2018; Voskamp & Van de Ven, 2015). Thus, BGI could enhance the adaptive capacity of the water system in cities.
Figure 3: The Adaptive Capacity Framework (Dixon et al., 2014)
18
Chapter 3: Research Design and Methods This chapter presents the methods that were used in order to gather and analyse data. This study is an explanatory research that assesses the implementation of BGI in four cities Amsterdam, Amersfoort, Copenhagen and Odense based on primary data collection and qualitative data analysis.
Methodology approach This study looked at four case studies: two large cities Amsterdam and Copenhagen and two mid-sized cities Amersfoort and Odense. These cities were chosen for three reasons. Firstly, these cities were chosen as the two capital cities are considered to be frontrunners in sustainable urban stormwater management (van Hattum, 2016) and all of the cities have experienced incidents of heavy rainfall in recent years. Each municipality has developed its governmental arrangement to address climate adaptation and could, therefore, serve as an example to other cities (Dai et al., 2018), also in light of the NWW project. Secondly, as mentioned in 1.6, the case studies are also chosen based on their size in the amount of inhabitants per city on a European scale (Table 2). Table 2: Case city profiles and characteristics (Climate Data, n.d.)
The Netherlands Denmark Characteristics Amsterdam Amersfoort Copenhagen Odense
Area (km2) 219,3 63,86 88,25 304,3 Population 821.752 152.481 602.481 200.703 Annual average rainfall (mm)
805 794 1164 613
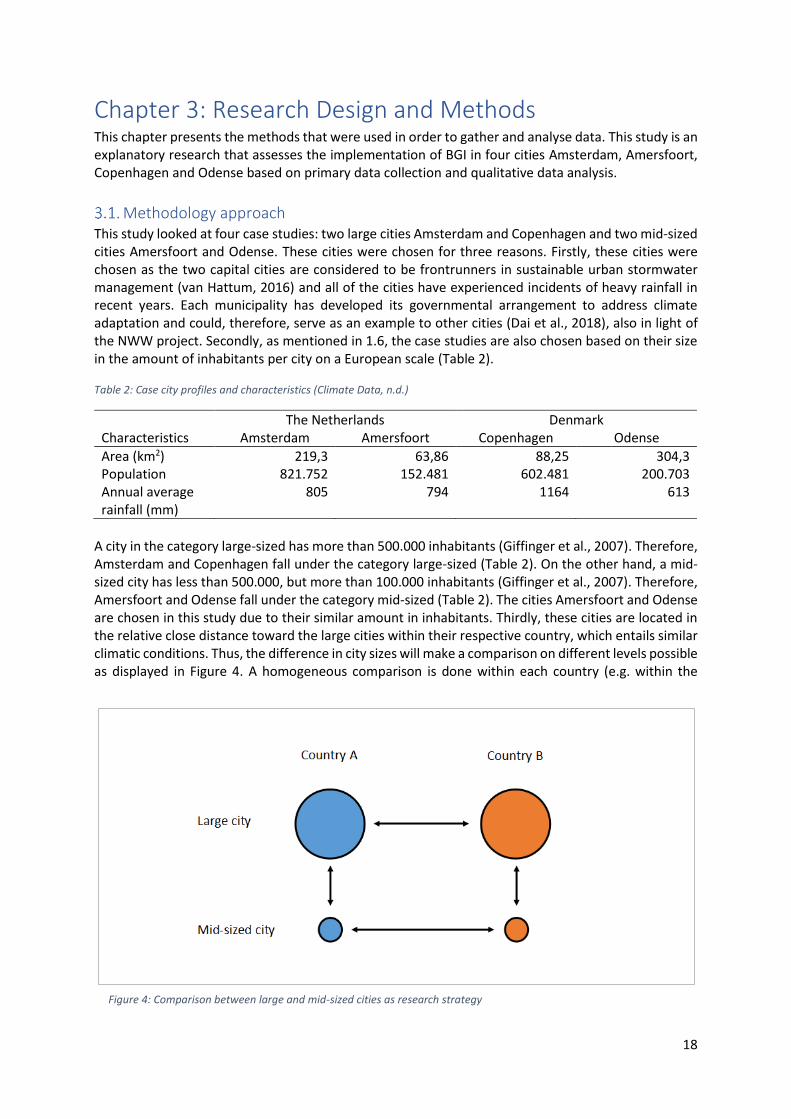
A city in the category large-sized has more than 500.000 inhabitants (Giffinger et al., 2007). Therefore, Amsterdam and Copenhagen fall under the category large-sized (Table 2). On the other hand, a mid-sized city has less than 500.000, but more than 100.000 inhabitants (Giffinger et al., 2007). Therefore, Amersfoort and Odense fall under the category mid-sized (Table 2). The cities Amersfoort and Odense are chosen in this study due to their similar amount in inhabitants. Thirdly, these cities are located in the relative close distance toward the large cities within their respective country, which entails similar climatic conditions. Thus, the difference in city sizes will make a comparison on different levels possible as displayed in Figure 4. A homogeneous comparison is done within each country (e.g. within the
Figure 4: Comparison between large and mid-sized cities as research strategy
19
Netherlands and within Denmark) based on the same city size categories. A heterogeneous comparison is done at a country level comparing large versus mid-size cities. Challenges of the data collection of the case studies are limitations of the collection of qualitative data. The qualitative data is based on the level of experience on BGI implementation of the interviewees. Additionally, the collection of qualitative data by means of semi-structured interviews limits the statistical analysis which may negatively influence the validity of this study (Thiel, 2014).
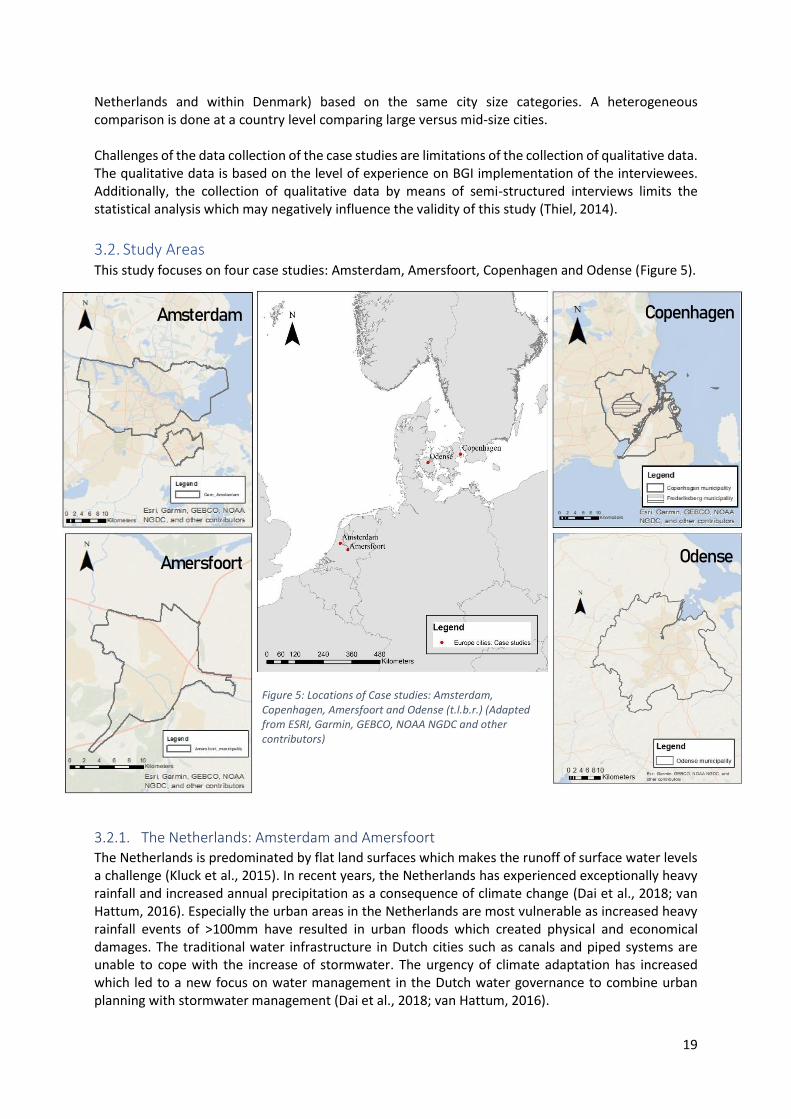
Study Areas This study focuses on four case studies: Amsterdam, Amersfoort, Copenhagen and Odense (Figure 5).
3.2.1. The Netherlands: Amsterdam and Amersfoort The Netherlands is predominated by flat land surfaces which makes the runoff of surface water levels a challenge (Kluck et al., 2015). In recent years, the Netherlands has experienced exceptionally heavy rainfall and increased annual precipitation as a consequence of climate change (Dai et al., 2018; van Hattum, 2016). Especially the urban areas in the Netherlands are most vulnerable as increased heavy rainfall events of >100mm have resulted in urban floods which created physical and economical damages. The traditional water infrastructure in Dutch cities such as canals and piped systems are unable to cope with the increase of stormwater. The urgency of climate adaptation has increased which led to a new focus on water management in the Dutch water governance to combine urban planning with stormwater management (Dai et al., 2018; van Hattum, 2016).
Figure 5: Locations of Case studies: Amsterdam, Copenhagen, Amersfoort and Odense (t.l.b.r.) (Adapted from ESRI, Garmin, GEBCO, NOAA NGDC and other contributors)
Amsterdam
Amersfoort
Copenhagen
Odense
20
The Netherlands is a unitary federal state, where responsibilities for urban planning and stormwater management are spread through various levels of government. These responsibilities and accompanied policies are based on the Water Act and the Spatial Planning Act. The National Adaptation Strategy and the Delta Programme, based on the Water Act have been adopted in close cooperation with decentralized government agencies. Thereby indicating that the responsibility for spatial planning and urban water management is that of municipalities. Furthermore, the mentioned acts allow municipalities and regional water authorities to adopt a wide range of policy instruments that allow dealing with the effects of climate change, such as local regulations or subsidies. However, the effects of flooding due to rainwater is a shared responsibility of the local government and the residents. For example, taking measures to decouple rainwater from private property needs to be done in cooperation with residents (Dai et al., 2018).
Amsterdam – study area description
Amsterdam is the capital city of the Netherlands with 821.752 inhabitants and is, therefore, a large-sized city. The city centre contains many canals and the Amstel River runs adjacent to the city. Amsterdam has an international position in integrated water management and ranked first for water in the European Green City Index. However, Amsterdam has experienced extreme precipitation events, such as on 28 July 2014, when between 50 and 90 mm rain fell within two hours, which led to flooded streets and houses (Amsterdam Rainproof, n.d.-b; Kluck et al., 2015). Taking future scenarios into account, Amsterdam aims to cope with rainfall of 60 mm per hour by 2020 without having damage to buildings and vital infrastructure and to be fully rainproof by 2050 (Dai et al., 2018). Amersfoort – study area description
Amersfoort is surrounded by three landscapes: the Utrechtse heuvelrug, Gelderse Vallei and the Eempolder. The water flows from the hill of the Utrechtse Heuvelrug and from the Veluwe area toward the city of Amersfoort. Here, the water is collected in the river the Eem from where it ends in the Randmeer lake. The Valleikanaal is a canal, built in 1930, to convey the water around the city to cope with high water levels. However, nowadays, the canal is increasingly surrounded by human settlements due to increased urbanisation. Amersfoort is vulnerable to flooding in case of a dyke break at Wageningen, situated upstream, or in times of intense storms when the water reservoir at the Randmeer would overflow. These situations could lead to a flood with water levels of 2 m, thereby flooding half of the city. Therefore, Amersfoort is addressing climate adaptation and developing green and blue values in the city. In 2006 and 2007 was proclaimed the greenest city in the Netherlands as well as for Europe (Gemeente Amersfoort, 2018b). The aim of Amersfoort is to be CO2 neutral in 2030 and commit to the climate goals of the COP21 in Paris and become a climate resilient city in 2050 (Gemeente Amersfoort, 2018b, 2019b).
3.2.2. Denmark: Copenhagen and Odense Denmark is vulnerable to climate change and related extreme weather events. In addition to an increased frequency of storms, there is an expected increase of 30% in annual precipitation by 2100. Especially urbanized areas are vulnerable as the precipitation events cause pressure on the current drainage capacity. The urgency to address adaptation to climate change has increased in Denmark (Ziersen et al., 2017). In Denmark, the national bodies responsible for water management are the Ministry of the Environment and the Nature Agency. The Nature Agency is responsible for the implementation of policies and strategies on climate change adaptation and urban water management based on EU plans. The Nature Agency develops national policies and regulations, while municipalities are responsible for the local implementation, of which some elements are delegated to water utilities. The municipalities carry out water management above ground on the surface, while water utilities are responsible for below groundwater management such as the sewer system. In Denmark, the water
21
utilities are owned by municipalities, however, are functioning as an independent organization. This includes independent financing which allows water utilities flexibility to invest within a certain price cap that is nationally determined within the Ministry of Finance (Feilberg & Mark, 2016).
Copenhagen – study area description
Copenhagen, the capital city of Denmark, has 602.481 inhabitants and is located on the Zealand and Amager Islands. It is separated from Sweden by the strait of Øresund which connects the North Sea with the Baltic Sea. Climate change has multiple consequences for Copenhagen which brings challenges that require climate adaptation. Therefore, the City of Copenhagen developed a Climate Adaptation Plan after the climate summit COP15 in Copenhagen (The City of Copenhagen, 2011). While the city is working to become a carbon-neutral city, it also focuses on extreme rain events as a result of the 2010 and 2011 flooding. Copenhagen experienced torrential rain of which the 2nd of July 2011 was the heaviest on record as more than 50 mm fell in 30 minutes, resulting in major flooding. This event caused damage in the city which has been valued 1 billion Euros (Ziersen et al., 2017). Heavy rainfall events and floods are expected to occur more often in the future (The City of Copenhagen, 2011).
Odense – study area description
Odense is Denmark’s third-largest city and has 200.703 inhabitants. The city is characterized by build-up areas and industry. Odense has a historical and cultural centre due to the history of the fairy tale writer Hans Christian Andersen. The northern part of the city Odense is attached to the Odense fjord and the Odense river running through the city centre. The combination of the geographical place of Odense with the high density of impervious surfaces makes Odense prone to floods at times of torrential rain. Multiple flooding events from 2006 to 2012 resulted in the awareness of the flood risks (Kaspersen & Halsnæs, 2017).
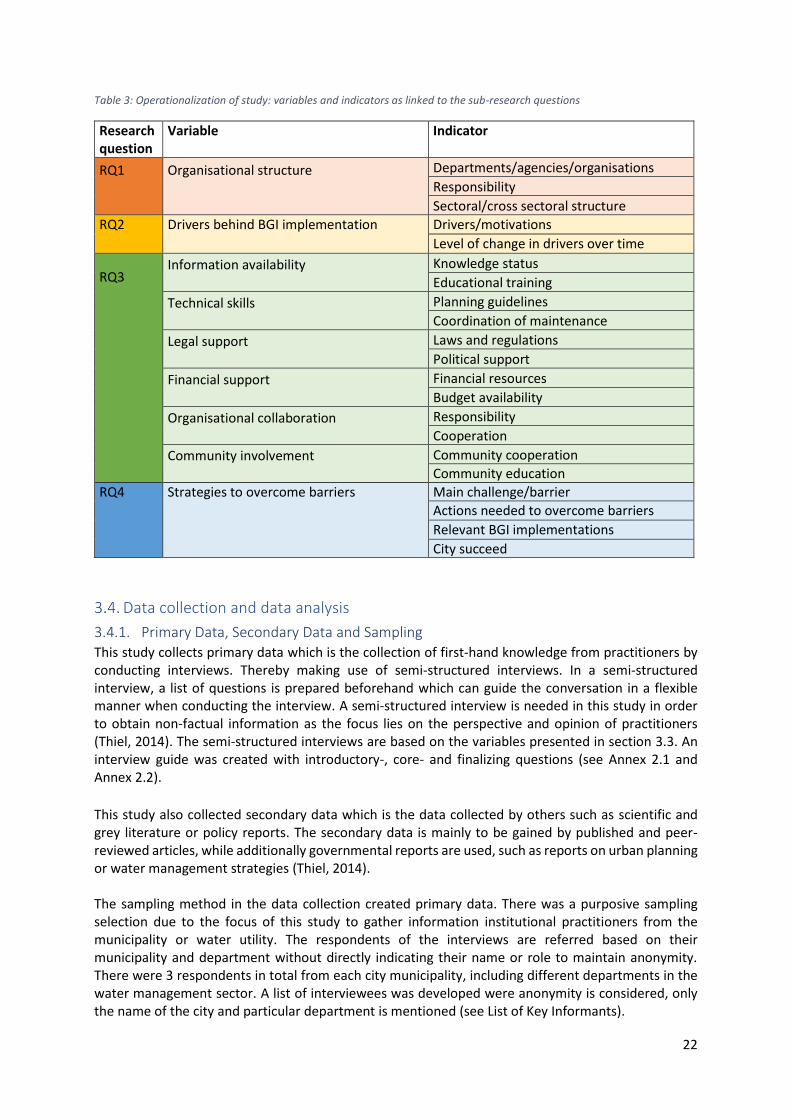
Defining BGI implementation indicators In order to link the Urban Water Management Transition Framework as presented in section 2.2 and 2.3 to the barriers and opportunities in the implementation of BGI practices as described in RQ3, a clear categorisation is needed with measurable indicators (Table 3). It already became clear that on a global and European level, governmental barriers and organisational- and legislative barriers hinder the implementation of BGI. However, in this study, a broader perspective that is more inclusive is required to gain a complete overview of the governmental perspective on the barriers and opportunities and make a comparison between the four cities possible. Table 3 describes the operationalization of the study as linked to the four research questions, their variables and indicators. For an elaborated description of the variables and indicators and how these are linked to the interview questions, see Annex 1. The indicators are linked to specific interview questions. In addition to qualitative questions, a rating scale was presented on the questions concerning the barriers and opportunities. The interviewees indicated their rating based on the Likert scale from 1 (very poor) to 5 (excellent). The Likert scale is meant as an addition to the qualitative data received from these particular questions. The Likert scale is applied, however, mainly qualitative data is gathered with an additional why-question. Based on the score and motivation, an indicator was considered a barrier or opportunity. A barrier is a factor that inhibits BGI implementation and is scored lower than 3, thus poor or very poor. An opportunity is a factor that is currently stimulating BGI implementation and is perceived as a factor that is already going well. These indicators are scored 4 or higher (fair, good or excellent). Based on the average outcome of the three interviewees per city each indicator has a rating to develop Spiderweb diagrams that provide an overview of the implementation process of BGI.
22
Table 3: Operationalization of study: variables and indicators as linked to the sub-research questions
Data collection and data analysis
3.4.1. Primary Data, Secondary Data and Sampling This study collects primary data which is the collection of first-hand knowledge from practitioners by conducting interviews. Thereby making use of semi-structured interviews. In a semi-structured interview, a list of questions is prepared beforehand which can guide the conversation in a flexible manner when conducting the interview. A semi-structured interview is needed in this study in order to obtain non-factual information as the focus lies on the perspective and opinion of practitioners (Thiel, 2014). The semi-structured interviews are based on the variables presented in section 3.3. An interview guide was created with introductory-, core- and finalizing questions (see Annex 2.1 and Annex 2.2).
This study also collected secondary data which is the data collected by others such as scientific and grey literature or policy reports. The secondary data is mainly to be gained by published and peer-reviewed articles, while additionally governmental reports are used, such as reports on urban planning or water management strategies (Thiel, 2014). The sampling method in the data collection created primary data. There was a purposive sampling selection due to the focus of this study to gather information institutional practitioners from the municipality or water utility. The respondents of the interviews are referred based on their municipality and department without directly indicating their name or role to maintain anonymity. There were 3 respondents in total from each city municipality, including different departments in the water management sector. A list of interviewees was developed were anonymity is considered, only the name of the city and particular department is mentioned (see List of Key Informants).
Research question
Variable Indicator
RQ1
Organisational structure
Departments/agencies/organisations
Responsibility
Sectoral/cross sectoral structure
RQ2 Drivers behind BGI implementation
Drivers/motivations
Level of change in drivers over time
RQ3
Information availability
Knowledge status
Educational training
Technical skills
Planning guidelines
Coordination of maintenance
Legal support
Laws and regulations
Political support
Financial support
Financial resources
Budget availability
Organisational collaboration
Responsibility
Cooperation
Community involvement
Community cooperation
Community education
RQ4
Strategies to overcome barriers Main challenge/barrier
Actions needed to overcome barriers
Relevant BGI implementations
City succeed
23
3.4.2. Validity and Reliability The generalization of the findings is limited to the four cases within Northern Europe. However, different city sizes were compared (large vs. mid-sized) as well as different countries (The Netherlands vs. Denmark). In addition, the primary data were triangulated with the obtained secondary data as proposed by Thiel (2014). As such, the results may give a fairly reliable picture of common practice in cities in North-Western Europe regarding BGI.
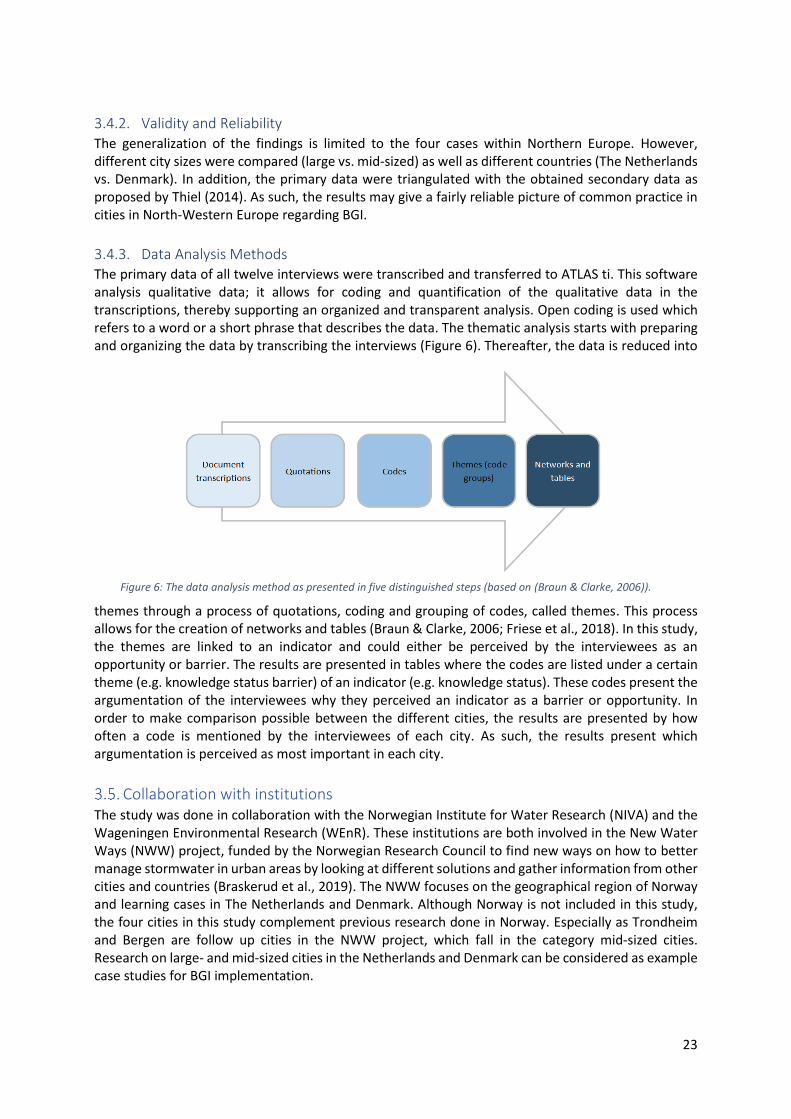
3.4.3. Data Analysis Methods The primary data of all twelve interviews were transcribed and transferred to ATLAS ti. This software analysis qualitative data; it allows for coding and quantification of the qualitative data in the transcriptions, thereby supporting an organized and transparent analysis. Open coding is used which refers to a word or a short phrase that describes the data. The thematic analysis starts with preparing and organizing the data by transcribing the interviews (Figure 6). Thereafter, the data is reduced into
themes through a process of quotations, coding and grouping of codes, called themes. This process allows for the creation of networks and tables (Braun & Clarke, 2006; Friese et al., 2018). In this study, the themes are linked to an indicator and could either be perceived by the interviewees as an opportunity or barrier. The results are presented in tables where the codes are listed under a certain theme (e.g. knowledge status barrier) of an indicator (e.g. knowledge status). These codes present the argumentation of the interviewees why they perceived an indicator as a barrier or opportunity. In order to make comparison possible between the different cities, the results are presented by how often a code is mentioned by the interviewees of each city. As such, the results present which argumentation is perceived as most important in each city.
Collaboration with institutions The study was done in collaboration with the Norwegian Institute for Water Research (NIVA) and the Wageningen Environmental Research (WEnR). These institutions are both involved in the New Water Ways (NWW) project, funded by the Norwegian Research Council to find new ways on how to better manage stormwater in urban areas by looking at different solutions and gather information from other cities and countries (Braskerud et al., 2019). The NWW focuses on the geographical region of Norway and learning cases in The Netherlands and Denmark. Although Norway is not included in this study, the four cities in this study complement previous research done in Norway. Especially as Trondheim and Bergen are follow up cities in the NWW project, which fall in the category mid-sized cities. Research on large- and mid-sized cities in the Netherlands and Denmark can be considered as example case studies for BGI implementation.
Figure 6: The data analysis method as presented in five distinguished steps (based on (Braun & Clarke, 2006)).
24
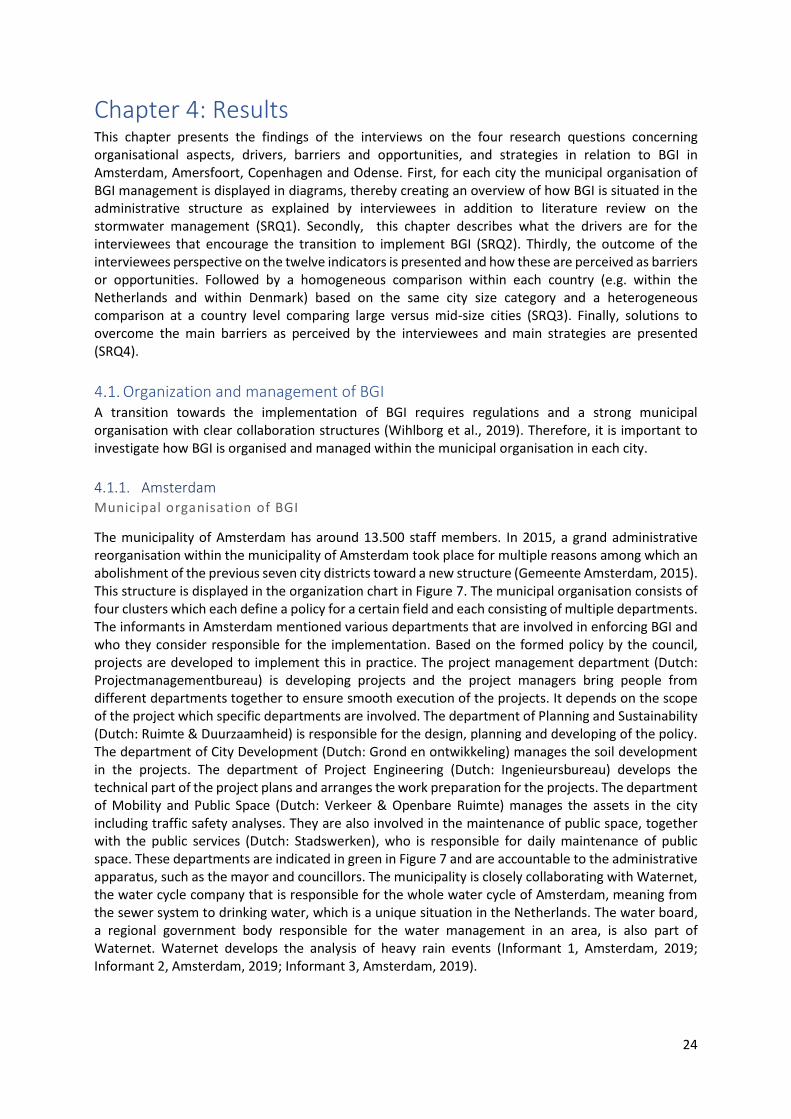
Chapter 4: Results This chapter presents the findings of the interviews on the four research questions concerning organisational aspects, drivers, barriers and opportunities, and strategies in relation to BGI in Amsterdam, Amersfoort, Copenhagen and Odense. First, for each city the municipal organisation of BGI management is displayed in diagrams, thereby creating an overview of how BGI is situated in the administrative structure as explained by interviewees in addition to literature review on the stormwater management (SRQ1). Secondly, this chapter describes what the drivers are for the interviewees that encourage the transition to implement BGI (SRQ2). Thirdly, the outcome of the interviewees perspective on the twelve indicators is presented and how these are perceived as barriers or opportunities. Followed by a homogeneous comparison within each country (e.g. within the Netherlands and within Denmark) based on the same city size category and a heterogeneous comparison at a country level comparing large versus mid-size cities (SRQ3). Finally, solutions to overcome the main barriers as perceived by the interviewees and main strategies are presented (SRQ4).
Organization and management of BGI A transition towards the implementation of BGI requires regulations and a strong municipal organisation with clear collaboration structures (Wihlborg et al., 2019). Therefore, it is important to investigate how BGI is organised and managed within the municipal organisation in each city.
4.1.1. Amsterdam Municipal organisation of BGI
The municipality of Amsterdam has around 13.500 staff members. In 2015, a grand administrative reorganisation within the municipality of Amsterdam took place for multiple reasons among which an abolishment of the previous seven city districts toward a new structure (Gemeente Amsterdam, 2015). This structure is displayed in the organization chart in Figure 7. The municipal organisation consists of four clusters which each define a policy for a certain field and each consisting of multiple departments. The informants in Amsterdam mentioned various departments that are involved in enforcing BGI and who they consider responsible for the implementation. Based on the formed policy by the council, projects are developed to implement this in practice. The project management department (Dutch: Projectmanagementbureau) is developing projects and the project managers bring people from different departments together to ensure smooth execution of the projects. It depends on the scope of the project which specific departments are involved. The department of Planning and Sustainability (Dutch: Ruimte & Duurzaamheid) is responsible for the design, planning and developing of the policy. The department of City Development (Dutch: Grond en ontwikkeling) manages the soil development in the projects. The department of Project Engineering (Dutch: Ingenieursbureau) develops the technical part of the project plans and arranges the work preparation for the projects. The department of Mobility and Public Space (Dutch: Verkeer & Openbare Ruimte) manages the assets in the city including traffic safety analyses. They are also involved in the maintenance of public space, together with the public services (Dutch: Stadswerken), who is responsible for daily maintenance of public space. These departments are indicated in green in Figure 7 and are accountable to the administrative apparatus, such as the mayor and councillors. The municipality is closely collaborating with Waternet, the water cycle company that is responsible for the whole water cycle of Amsterdam, meaning from the sewer system to drinking water, which is a unique situation in the Netherlands. The water board, a regional government body responsible for the water management in an area, is also part of Waternet. Waternet develops the analysis of heavy rain events (Informant 1, Amsterdam, 2019; Informant 2, Amsterdam, 2019; Informant 3, Amsterdam, 2019).
25
Figure 7: Organisational structure of Amsterdam municipality, with green indicating the departments that are involved in BGI implementation based on the interviewees perception, adapted from (Gemeente Amsterdam, 2015) .
26
BGI management
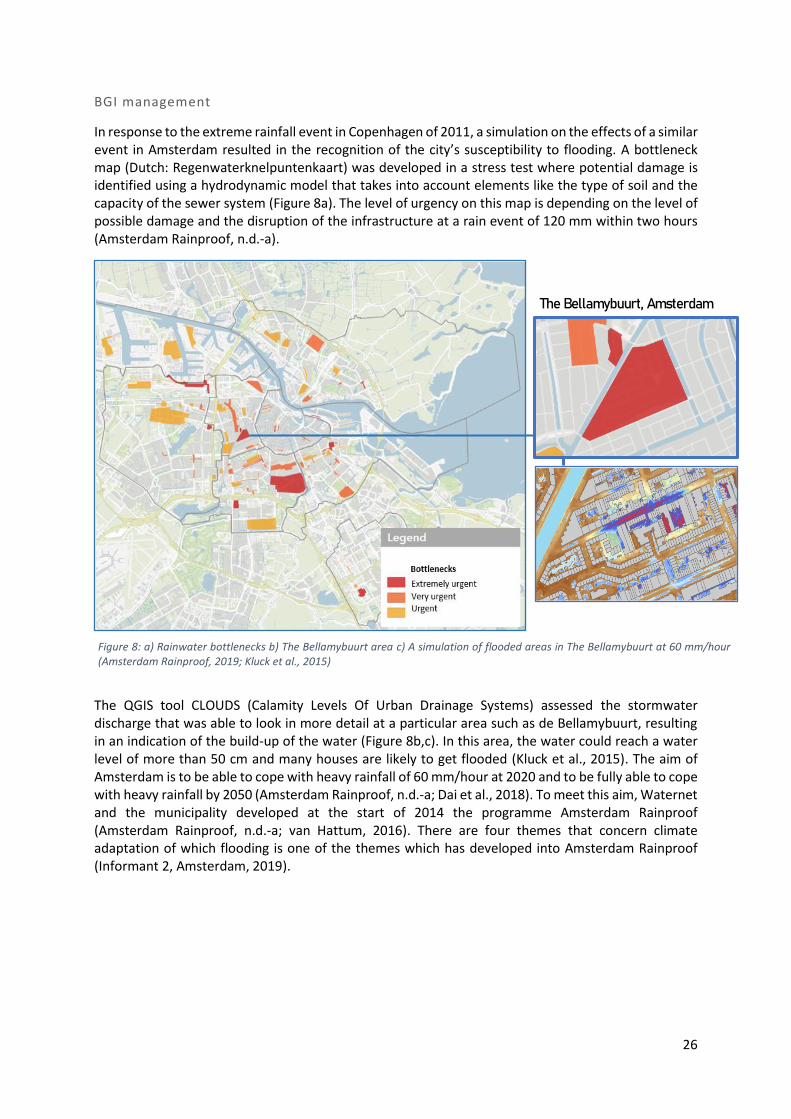
In response to the extreme rainfall event in Copenhagen of 2011, a simulation on the effects of a similar event in Amsterdam resulted in the recognition of the city’s susceptibility to flooding. A bottleneck map (Dutch: Regenwaterknelpuntenkaart) was developed in a stress test where potential damage is identified using a hydrodynamic model that takes into account elements like the type of soil and the capacity of the sewer system (Figure 8a). The level of urgency on this map is depending on the level of possible damage and the disruption of the infrastructure at a rain event of 120 mm within two hours (Amsterdam Rainproof, n.d.-a).
The QGIS tool CLOUDS (Calamity Levels Of Urban Drainage Systems) assessed the stormwater discharge that was able to look in more detail at a particular area such as de Bellamybuurt, resulting in an indication of the build-up of the water (Figure 8b,c). In this area, the water could reach a water level of more than 50 cm and many houses are likely to get flooded (Kluck et al., 2015). The aim of Amsterdam is to be able to cope with heavy rainfall of 60 mm/hour at 2020 and to be fully able to cope with heavy rainfall by 2050 (Amsterdam Rainproof, n.d.-a; Dai et al., 2018). To meet this aim, Waternet and the municipality developed at the start of 2014 the programme Amsterdam Rainproof (Amsterdam Rainproof, n.d.-a; van Hattum, 2016). There are four themes that concern climate adaptation of which flooding is one of the themes which has developed into Amsterdam Rainproof (Informant 2, Amsterdam, 2019).
The Bellamybuurt, Amsterdam
Figure 8: a) Rainwater bottlenecks b) The Bellamybuurt area c) A simulation of flooded areas in The Bellamybuurt at 60 mm/hour (Amsterdam Rainproof, 2019; Kluck et al., 2015)
27
Amsterdam Rainproof is a policy programme which is initially formed as a semi-independent programme outside of existing organisations to create a broad network coalition. However, remains in close cooperation with Waternet and Amsterdam municipality (Amsterdam Rainproof, n.d.-a). The programme aims to cope with heavy rainfalls where a rainfall event of 60mm is considered as the level at which no damage may occur in order for an area to be ‘Rainproof’. Unique in the Amsterdam Rainproof programme is the network strategy by actively connecting stakeholders and provide a platform to share knowledge and information (Figure 9). In this network, Waternet and the Amsterdam municipality are concerned with the development of public space. While insurance companies, gardeners and estate owners can stimulate Rainproof measures on private space. Which is necessary as a considerable part of cities is private space and requires the action of homeowners. Thus, the government has to cooperate with companies, property owners and residents to capture, store and drain water on private space. Therefore, Amsterdam Rainproof operates as a brand to communicate a positive message to the community via social media, website and newsletters, thereby creating a forum for questions and remarks which stimulates interaction (Amsterdam Rainproof, n.d.-a). Overall, this network approach brings stakeholders together and stimulates them to take action. Amsterdam Rainproof has a supporting role in this approach. Thereby creating a movement where all stakeholders feel responsible to take measures (Amsterdam Rainproof, n.d.-a; van Hattum, 2016). After the study of bottleneck maps, solution maps (Dutch: Oplossingskaarten) was created to handle extreme rain events the most effective way. Such solution maps broaden the scope of the solution approach since rainwater is not restricted to project boundaries (Amsterdam Rainproof, n.d.-a). The Bellamybuurt (Figure 8 b) is an example of a neighbourhood that has received attention through the rainwater analysis and in combination with close stakeholder collaboration, Rainproof measures were implemented (Box 4.1). Since 2017, Amsterdam Rainproof has integrated closer to the Amsterdam municipality and Waternet. The aim is to standardize Rainproof measures in the municipal policy and working method. Rainproof is now one of the objectives in spatial planning. Rainproof’s team, with members of Waternet and the municipality, encourage to maintain BGI implementation on the agenda.
Figure 9: Network approach of Amsterdam Rainproof (Amsterdam Rainproof, n.d.)
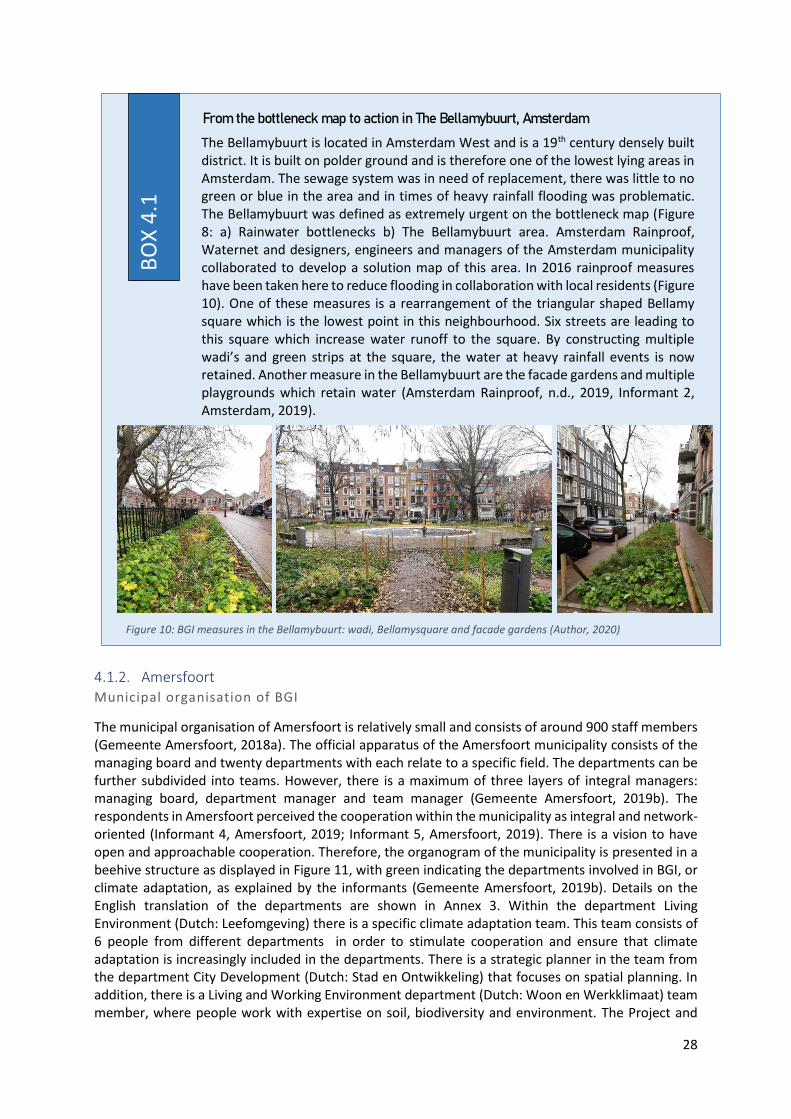
28
4.1.2. Amersfoort Municipal organisation of BGI
The municipal organisation of Amersfoort is relatively small and consists of around 900 staff members (Gemeente Amersfoort, 2018a). The official apparatus of the Amersfoort municipality consists of the managing board and twenty departments with each relate to a specific field. The departments can be further subdivided into teams. However, there is a maximum of three layers of integral managers: managing board, department manager and team manager (Gemeente Amersfoort, 2019b). The respondents in Amersfoort perceived the cooperation within the municipality as integral and network-oriented (Informant 4, Amersfoort, 2019; Informant 5, Amersfoort, 2019). There is a vision to have open and approachable cooperation. Therefore, the organogram of the municipality is presented in a beehive structure as displayed in Figure 11, with green indicating the departments involved in BGI, or climate adaptation, as explained by the informants (Gemeente Amersfoort, 2019b). Details on the English translation of the departments are shown in Annex 3. Within the department Living Environment (Dutch: Leefomgeving) there is a specific climate adaptation team. This team consists of 6 people from different departments in order to stimulate cooperation and ensure that climate adaptation is increasingly included in the departments. There is a strategic planner in the team from the department City Development (Dutch: Stad en Ontwikkeling) that focuses on spatial planning. In addition, there is a Living and Working Environment department (Dutch: Woon en Werkklimaat) team member, where people work with expertise on soil, biodiversity and environment. The Project and
BO
X 4
.1
The Bellamybuurt is located in Amsterdam West and is a 19th century densely built district. It is built on polder ground and is therefore one of the lowest lying areas in Amsterdam. The sewage system was in need of replacement, there was little to no green or blue in the area and in times of heavy rainfall flooding was problematic. The Bellamybuurt was defined as extremely urgent on the bottleneck map (Figure 8: a) Rainwater bottlenecks b) The Bellamybuurt area. Amsterdam Rainproof, Waternet and designers, engineers and managers of the Amsterdam municipality collaborated to develop a solution map of this area. In 2016 rainproof measures have been taken here to reduce flooding in collaboration with local residents (Figure 10). One of these measures is a rearrangement of the triangular shaped Bellamy square which is the lowest point in this neighbourhood. Six streets are leading to this square which increase water runoff to the square. By constructing multiple wadi’s and green strips at the square, the water at heavy rainfall events is now retained. Another measure in the Bellamybuurt are the facade gardens and multiple playgrounds which retain water (Amsterdam Rainproof, n.d., 2019, Informant 2, Amsterdam, 2019).
From the bottleneck map to action in The Bellamybuurt, Amsterdam
Figure 10: BGI measures in the Bellamybuurt: wadi, Bellamysquare and facade gardens (Author, 2020)
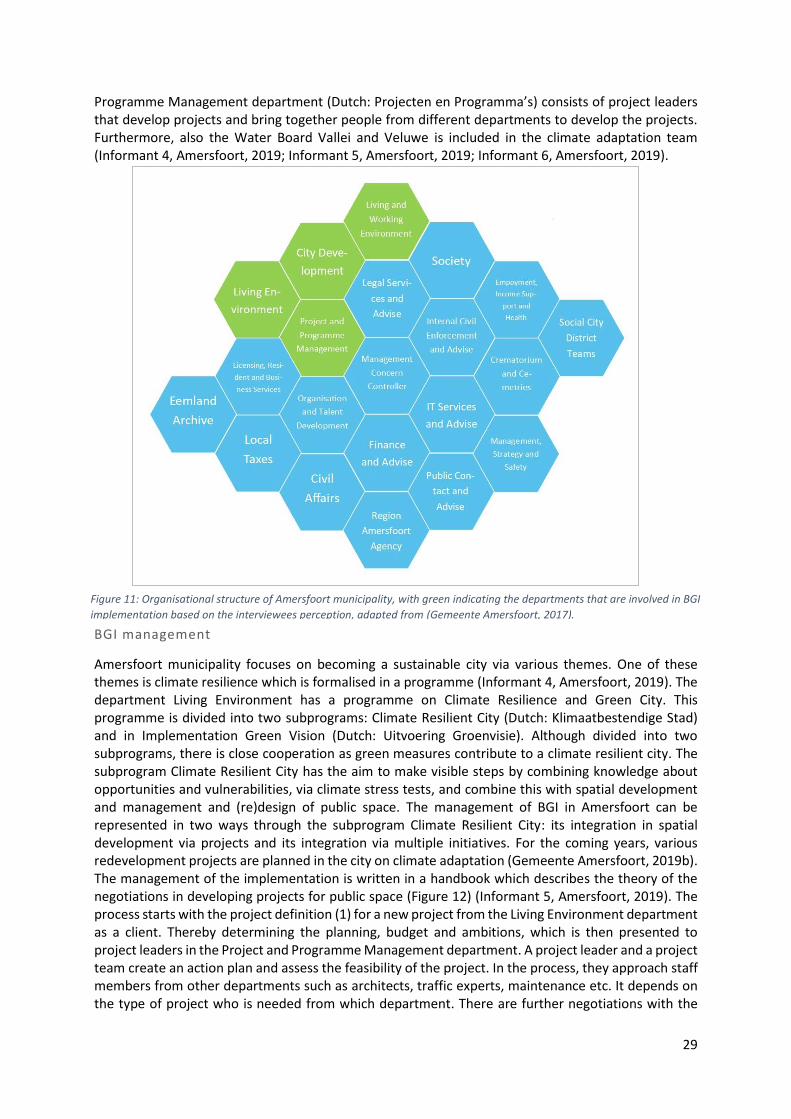
29
Programme Management department (Dutch: Projecten en Programma’s) consists of project leaders that develop projects and bring together people from different departments to develop the projects. Furthermore, also the Water Board Vallei and Veluwe is included in the climate adaptation team (Informant 4, Amersfoort, 2019; Informant 5, Amersfoort, 2019; Informant 6, Amersfoort, 2019).
BGI management
Amersfoort municipality focuses on becoming a sustainable city via various themes. One of these themes is climate resilience which is formalised in a programme (Informant 4, Amersfoort, 2019). The department Living Environment has a programme on Climate Resilience and Green City. This programme is divided into two subprograms: Climate Resilient City (Dutch: Klimaatbestendige Stad) and in Implementation Green Vision (Dutch: Uitvoering Groenvisie). Although divided into two subprograms, there is close cooperation as green measures contribute to a climate resilient city. The subprogram Climate Resilient City has the aim to make visible steps by combining knowledge about opportunities and vulnerabilities, via climate stress tests, and combine this with spatial development and management and (re)design of public space. The management of BGI in Amersfoort can be represented in two ways through the subprogram Climate Resilient City: its integration in spatial development via projects and its integration via multiple initiatives. For the coming years, various redevelopment projects are planned in the city on climate adaptation (Gemeente Amersfoort, 2019b). The management of the implementation is written in a handbook which describes the theory of the negotiations in developing projects for public space (Figure 12) (Informant 5, Amersfoort, 2019). The process starts with the project definition (1) for a new project from the Living Environment department as a client. Thereby determining the planning, budget and ambitions, which is then presented to project leaders in the Project and Programme Management department. A project leader and a project team create an action plan and assess the feasibility of the project. In the process, they approach staff members from other departments such as architects, traffic experts, maintenance etc. It depends on the type of project who is needed from which department. There are further negotiations with the
Figure 11: Organisational structure of Amersfoort municipality, with green indicating the departments that are involved in BGI
implementation based on the interviewees perception, adapted from (Gemeente Amersfoort, 2017).
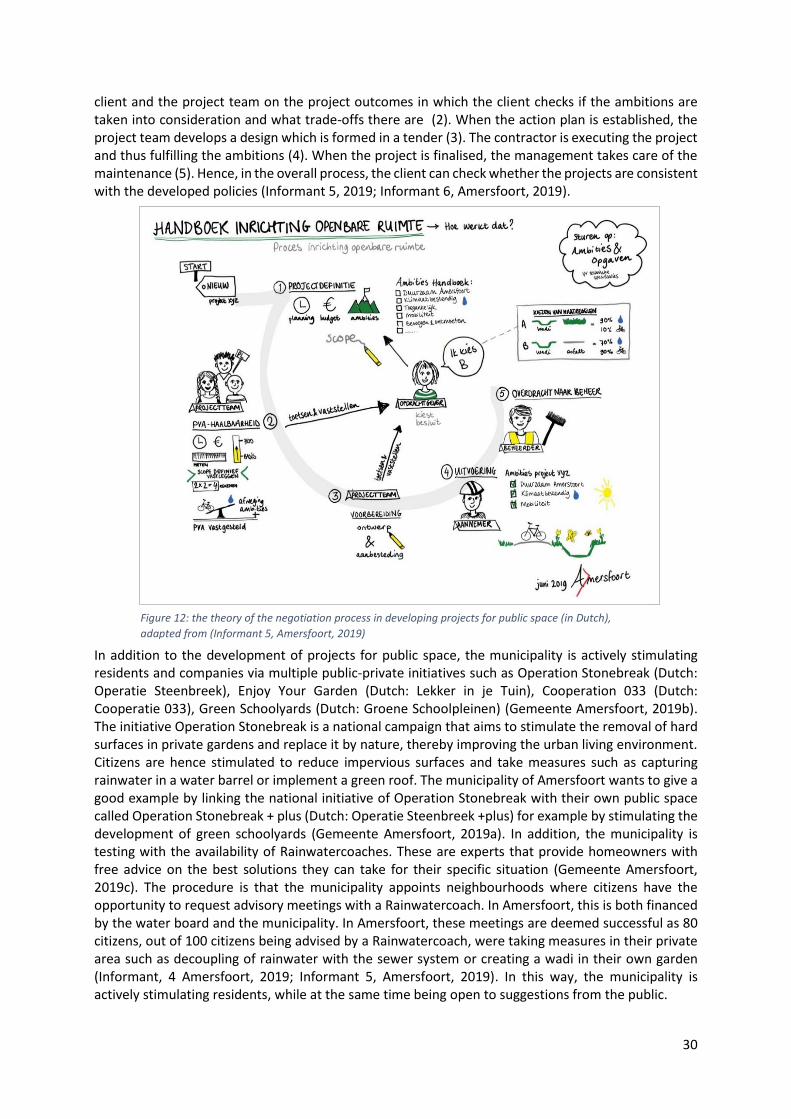
30
client and the project team on the project outcomes in which the client checks if the ambitions are taken into consideration and what trade-offs there are (2). When the action plan is established, the project team develops a design which is formed in a tender (3). The contractor is executing the project and thus fulfilling the ambitions (4). When the project is finalised, the management takes care of the maintenance (5). Hence, in the overall process, the client can check whether the projects are consistent with the developed policies (Informant 5, 2019; Informant 6, Amersfoort, 2019).
In addition to the development of projects for public space, the municipality is actively stimulating residents and companies via multiple public-private initiatives such as Operation Stonebreak (Dutch: Operatie Steenbreek), Enjoy Your Garden (Dutch: Lekker in je Tuin), Cooperation 033 (Dutch: Cooperatie 033), Green Schoolyards (Dutch: Groene Schoolpleinen) (Gemeente Amersfoort, 2019b). The initiative Operation Stonebreak is a national campaign that aims to stimulate the removal of hard surfaces in private gardens and replace it by nature, thereby improving the urban living environment. Citizens are hence stimulated to reduce impervious surfaces and take measures such as capturing rainwater in a water barrel or implement a green roof. The municipality of Amersfoort wants to give a good example by linking the national initiative of Operation Stonebreak with their own public space called Operation Stonebreak + plus (Dutch: Operatie Steenbreek +plus) for example by stimulating the development of green schoolyards (Gemeente Amersfoort, 2019a). In addition, the municipality is testing with the availability of Rainwatercoaches. These are experts that provide homeowners with free advice on the best solutions they can take for their specific situation (Gemeente Amersfoort, 2019c). The procedure is that the municipality appoints neighbourhoods where citizens have the opportunity to request advisory meetings with a Rainwatercoach. In Amersfoort, this is both financed by the water board and the municipality. In Amersfoort, these meetings are deemed successful as 80 citizens, out of 100 citizens being advised by a Rainwatercoach, were taking measures in their private area such as decoupling of rainwater with the sewer system or creating a wadi in their own garden (Informant, 4 Amersfoort, 2019; Informant 5, Amersfoort, 2019). In this way, the municipality is actively stimulating residents, while at the same time being open to suggestions from the public.
Figure 12: the theory of the negotiation process in developing projects for public space (in Dutch),
adapted from (Informant 5, Amersfoort, 2019)
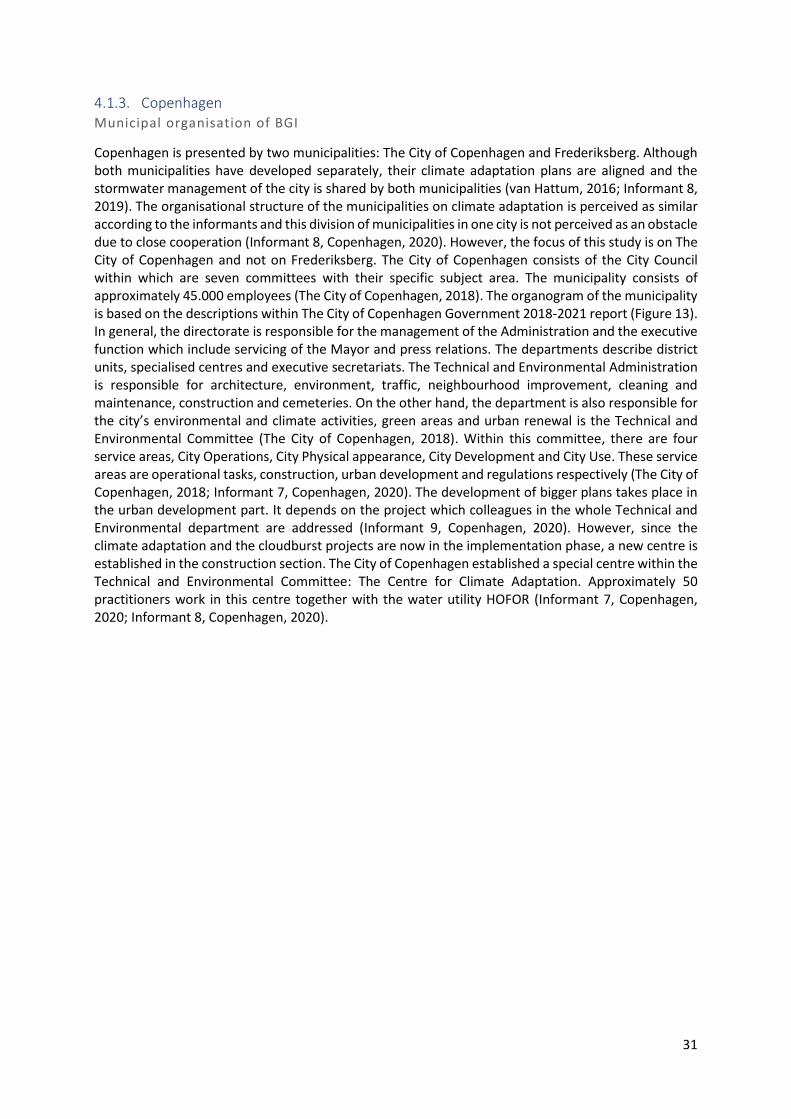
31
4.1.3. Copenhagen Municipal organisation of BGI
Copenhagen is presented by two municipalities: The City of Copenhagen and Frederiksberg. Although both municipalities have developed separately, their climate adaptation plans are aligned and the stormwater management of the city is shared by both municipalities (van Hattum, 2016; Informant 8, 2019). The organisational structure of the municipalities on climate adaptation is perceived as similar according to the informants and this division of municipalities in one city is not perceived as an obstacle due to close cooperation (Informant 8, Copenhagen, 2020). However, the focus of this study is on The City of Copenhagen and not on Frederiksberg. The City of Copenhagen consists of the City Council within which are seven committees with their specific subject area. The municipality consists of approximately 45.000 employees (The City of Copenhagen, 2018). The organogram of the municipality is based on the descriptions within The City of Copenhagen Government 2018-2021 report (Figure 13). In general, the directorate is responsible for the management of the Administration and the executive function which include servicing of the Mayor and press relations. The departments describe district units, specialised centres and executive secretariats. The Technical and Environmental Administration is responsible for architecture, environment, traffic, neighbourhood improvement, cleaning and maintenance, construction and cemeteries. On the other hand, the department is also responsible for the city’s environmental and climate activities, green areas and urban renewal is the Technical and Environmental Committee (The City of Copenhagen, 2018). Within this committee, there are four service areas, City Operations, City Physical appearance, City Development and City Use. These service areas are operational tasks, construction, urban development and regulations respectively (The City of Copenhagen, 2018; Informant 7, Copenhagen, 2020). The development of bigger plans takes place in the urban development part. It depends on the project which colleagues in the whole Technical and Environmental department are addressed (Informant 9, Copenhagen, 2020). However, since the climate adaptation and the cloudburst projects are now in the implementation phase, a new centre is established in the construction section. The City of Copenhagen established a special centre within the Technical and Environmental Committee: The Centre for Climate Adaptation. Approximately 50 practitioners work in this centre together with the water utility HOFOR (Informant 7, Copenhagen, 2020; Informant 8, Copenhagen, 2020).
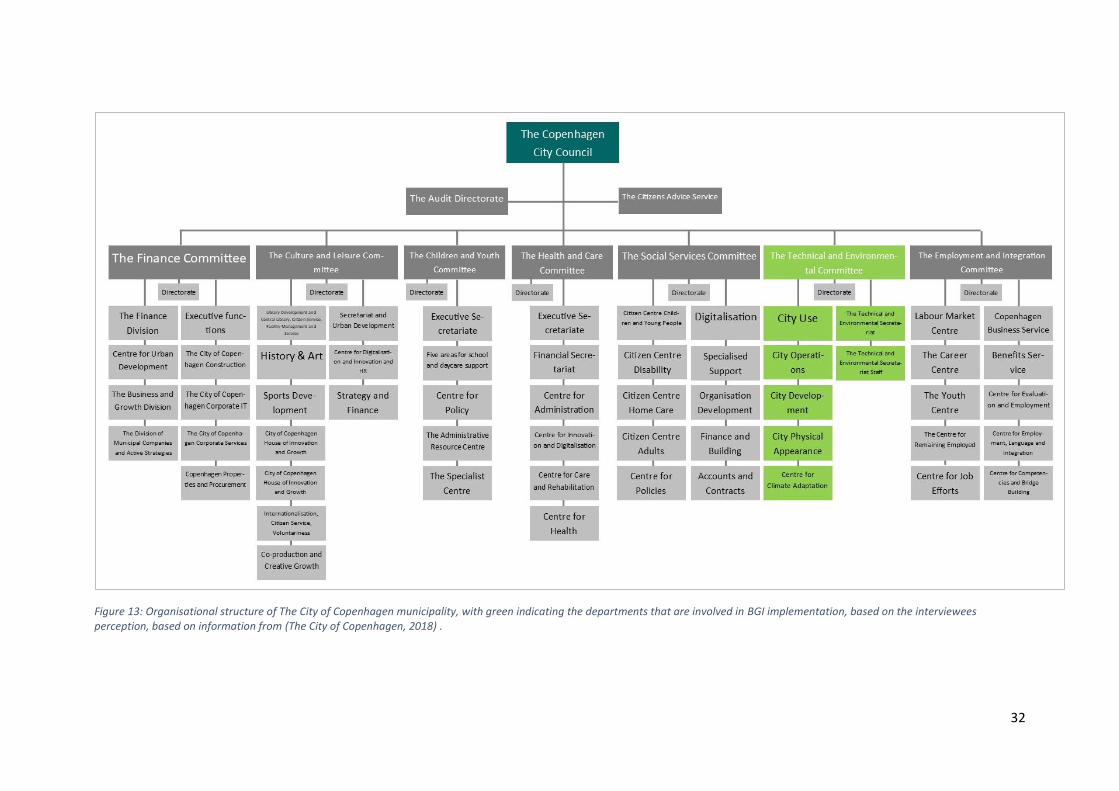
32
Figure 13: Organisational structure of The City of Copenhagen municipality, with green indicating the departments that are involved in BGI implementation, based on the interviewees perception, based on information from (The City of Copenhagen, 2018) .
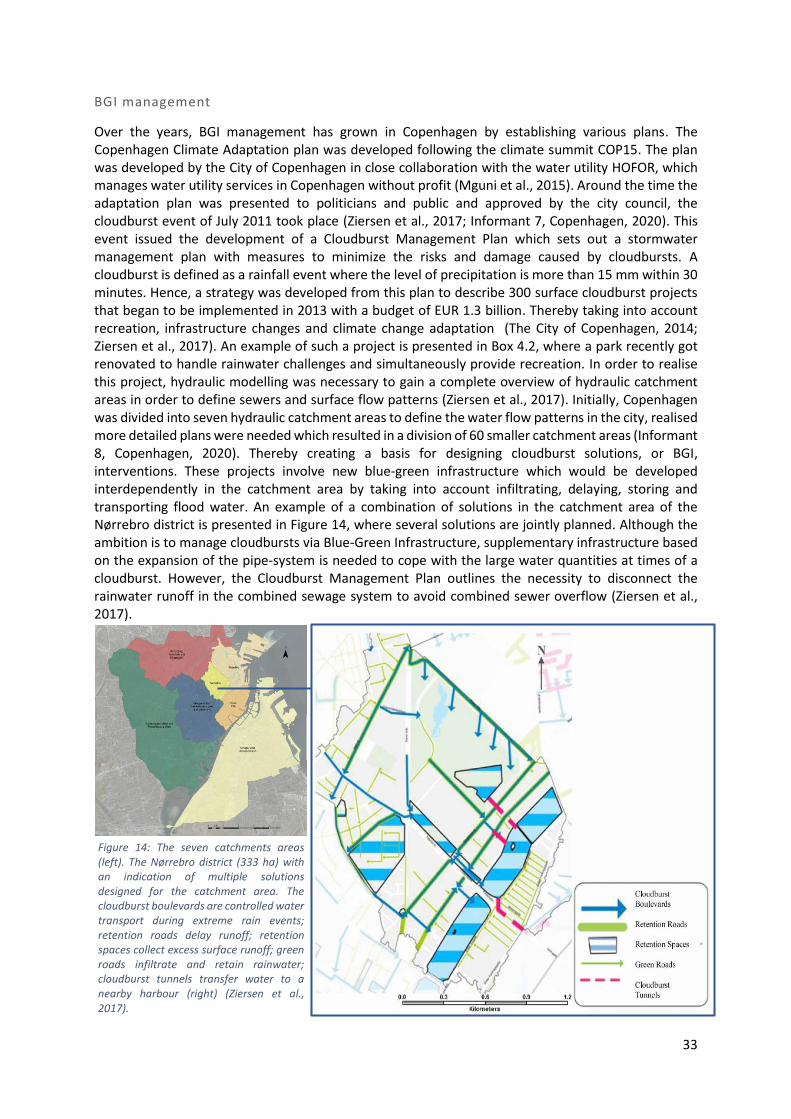
33
BGI management
Over the years, BGI management has grown in Copenhagen by establishing various plans. The Copenhagen Climate Adaptation plan was developed following the climate summit COP15. The plan was developed by the City of Copenhagen in close collaboration with the water utility HOFOR, which manages water utility services in Copenhagen without profit (Mguni et al., 2015). Around the time the adaptation plan was presented to politicians and public and approved by the city council, the cloudburst event of July 2011 took place (Ziersen et al., 2017; Informant 7, Copenhagen, 2020). This event issued the development of a Cloudburst Management Plan which sets out a stormwater management plan with measures to minimize the risks and damage caused by cloudbursts. A cloudburst is defined as a rainfall event where the level of precipitation is more than 15 mm within 30 minutes. Hence, a strategy was developed from this plan to describe 300 surface cloudburst projects that began to be implemented in 2013 with a budget of EUR 1.3 billion. Thereby taking into account recreation, infrastructure changes and climate change adaptation (The City of Copenhagen, 2014; Ziersen et al., 2017). An example of such a project is presented in Box 4.2, where a park recently got renovated to handle rainwater challenges and simultaneously provide recreation. In order to realise this project, hydraulic modelling was necessary to gain a complete overview of hydraulic catchment areas in order to define sewers and surface flow patterns (Ziersen et al., 2017). Initially, Copenhagen was divided into seven hydraulic catchment areas to define the water flow patterns in the city, realised more detailed plans were needed which resulted in a division of 60 smaller catchment areas (Informant 8, Copenhagen, 2020). Thereby creating a basis for designing cloudburst solutions, or BGI, interventions. These projects involve new blue-green infrastructure which would be developed interdependently in the catchment area by taking into account infiltrating, delaying, storing and transporting flood water. An example of a combination of solutions in the catchment area of the Nørrebro district is presented in Figure 14, where several solutions are jointly planned. Although the ambition is to manage cloudbursts via Blue-Green Infrastructure, supplementary infrastructure based on the expansion of the pipe-system is needed to cope with the large water quantities at times of a cloudburst. However, the Cloudburst Management Plan outlines the necessity to disconnect the rainwater runoff in the combined sewage system to avoid combined sewer overflow (Ziersen et al., 2017).
Figure 14: The seven catchments areas (left). The Nørrebro district (333 ha) with an indication of multiple solutions designed for the catchment area. The cloudburst boulevards are controlled water transport during extreme rain events; retention roads delay runoff; retention spaces collect excess surface runoff; green roads infiltrate and retain rainwater; cloudburst tunnels transfer water to a nearby harbour (right) (Ziersen et al., 2017).
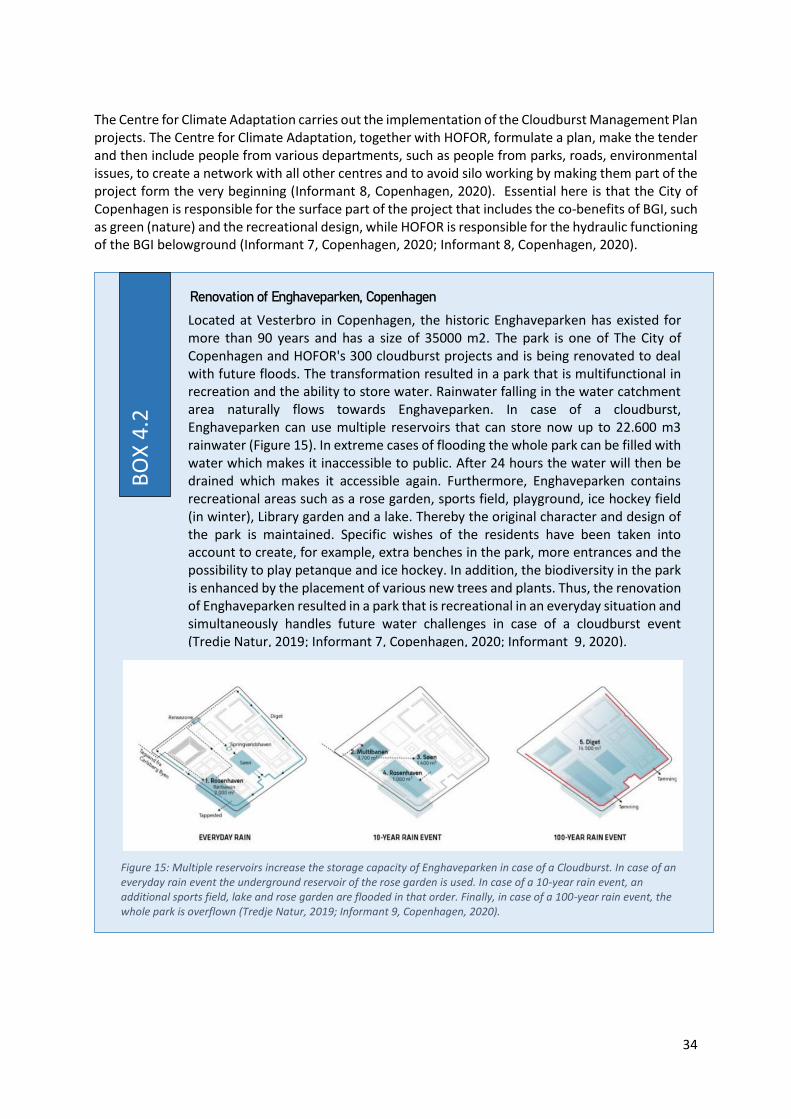
34
The Centre for Climate Adaptation carries out the implementation of the Cloudburst Management Plan projects. The Centre for Climate Adaptation, together with HOFOR, formulate a plan, make the tender and then include people from various departments, such as people from parks, roads, environmental issues, to create a network with all other centres and to avoid silo working by making them part of the project form the very beginning (Informant 8, Copenhagen, 2020). Essential here is that the City of Copenhagen is responsible for the surface part of the project that includes the co-benefits of BGI, such as green (nature) and the recreational design, while HOFOR is responsible for the hydraulic functioning of the BGI belowground (Informant 7, Copenhagen, 2020; Informant 8, Copenhagen, 2020).
BO
X 4
.2
Located at Vesterbro in Copenhagen, the historic Enghaveparken has existed for more than 90 years and has a size of 35000 m2. The park is one of The City of Copenhagen and HOFOR's 300 cloudburst projects and is being renovated to deal with future floods. The transformation resulted in a park that is multifunctional in recreation and the ability to store water. Rainwater falling in the water catchment area naturally flows towards Enghaveparken. In case of a cloudburst, Enghaveparken can use multiple reservoirs that can store now up to 22.600 m3 rainwater (Figure 15). In extreme cases of flooding the whole park can be filled with water which makes it inaccessible to public. After 24 hours the water will then be drained which makes it accessible again. Furthermore, Enghaveparken contains recreational areas such as a rose garden, sports field, playground, ice hockey field (in winter), Library garden and a lake. Thereby the original character and design of the park is maintained. Specific wishes of the residents have been taken into account to create, for example, extra benches in the park, more entrances and the possibility to play petanque and ice hockey. In addition, the biodiversity in the park is enhanced by the placement of various new trees and plants. Thus, the renovation of Enghaveparken resulted in a park that is recreational in an everyday situation and simultaneously handles future water challenges in case of a cloudburst event (Tredje Natur, 2019; Informant 7, Copenhagen, 2020; Informant 9, 2020).
Renovation of Enghaveparken, Copenhagen
Figure 15: Multiple reservoirs increase the storage capacity of Enghaveparken in case of a Cloudburst. In case of an everyday rain event the underground reservoir of the rose garden is used. In case of a 10-year rain event, an additional sports field, lake and rose garden are flooded in that order. Finally, in case of a 100-year rain event, the whole park is overflown (Tredje Natur, 2019; Informant 9, Copenhagen, 2020).
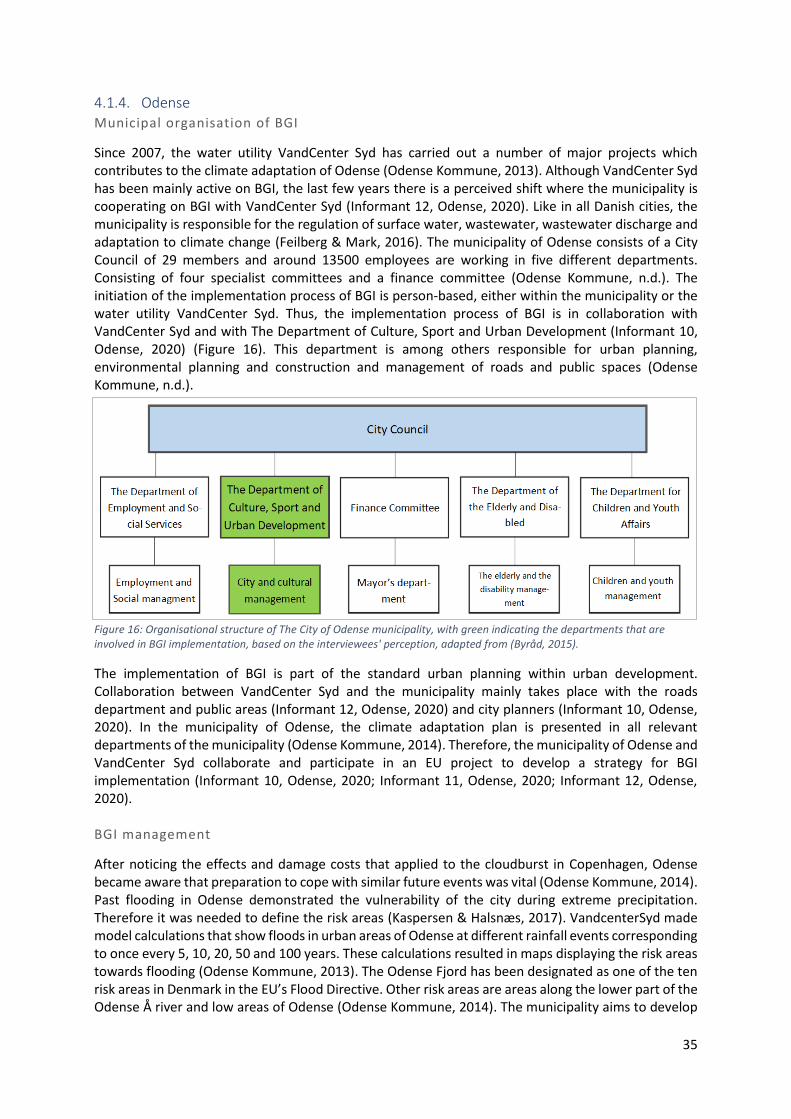
35
4.1.4. Odense Municipal organisation of BGI
Since 2007, the water utility VandCenter Syd has carried out a number of major projects which contributes to the climate adaptation of Odense (Odense Kommune, 2013). Although VandCenter Syd has been mainly active on BGI, the last few years there is a perceived shift where the municipality is cooperating on BGI with VandCenter Syd (Informant 12, Odense, 2020). Like in all Danish cities, the municipality is responsible for the regulation of surface water, wastewater, wastewater discharge and adaptation to climate change (Feilberg & Mark, 2016). The municipality of Odense consists of a City Council of 29 members and around 13500 employees are working in five different departments. Consisting of four specialist committees and a finance committee (Odense Kommune, n.d.). The initiation of the implementation process of BGI is person-based, either within the municipality or the water utility VandCenter Syd. Thus, the implementation process of BGI is in collaboration with VandCenter Syd and with The Department of Culture, Sport and Urban Development (Informant 10, Odense, 2020) (Figure 16). This department is among others responsible for urban planning, environmental planning and construction and management of roads and public spaces (Odense Kommune, n.d.).
Figure 16: Organisational structure of The City of Odense municipality, with green indicating the departments that are involved in BGI implementation, based on the interviewees' perception, adapted from (Byråd, 2015).
The implementation of BGI is part of the standard urban planning within urban development. Collaboration between VandCenter Syd and the municipality mainly takes place with the roads department and public areas (Informant 12, Odense, 2020) and city planners (Informant 10, Odense, 2020). In the municipality of Odense, the climate adaptation plan is presented in all relevant departments of the municipality (Odense Kommune, 2014). Therefore, the municipality of Odense and VandCenter Syd collaborate and participate in an EU project to develop a strategy for BGI implementation (Informant 10, Odense, 2020; Informant 11, Odense, 2020; Informant 12, Odense, 2020). BGI management
After noticing the effects and damage costs that applied to the cloudburst in Copenhagen, Odense became aware that preparation to cope with similar future events was vital (Odense Kommune, 2014). Past flooding in Odense demonstrated the vulnerability of the city during extreme precipitation. Therefore it was needed to define the risk areas (Kaspersen & Halsnæs, 2017). VandcenterSyd made model calculations that show floods in urban areas of Odense at different rainfall events corresponding to once every 5, 10, 20, 50 and 100 years. These calculations resulted in maps displaying the risk areas towards flooding (Odense Kommune, 2013). The Odense Fjord has been designated as one of the ten risk areas in Denmark in the EU’s Flood Directive. Other risk areas are areas along the lower part of the Odense Å river and low areas of Odense (Odense Kommune, 2014). The municipality aims to develop
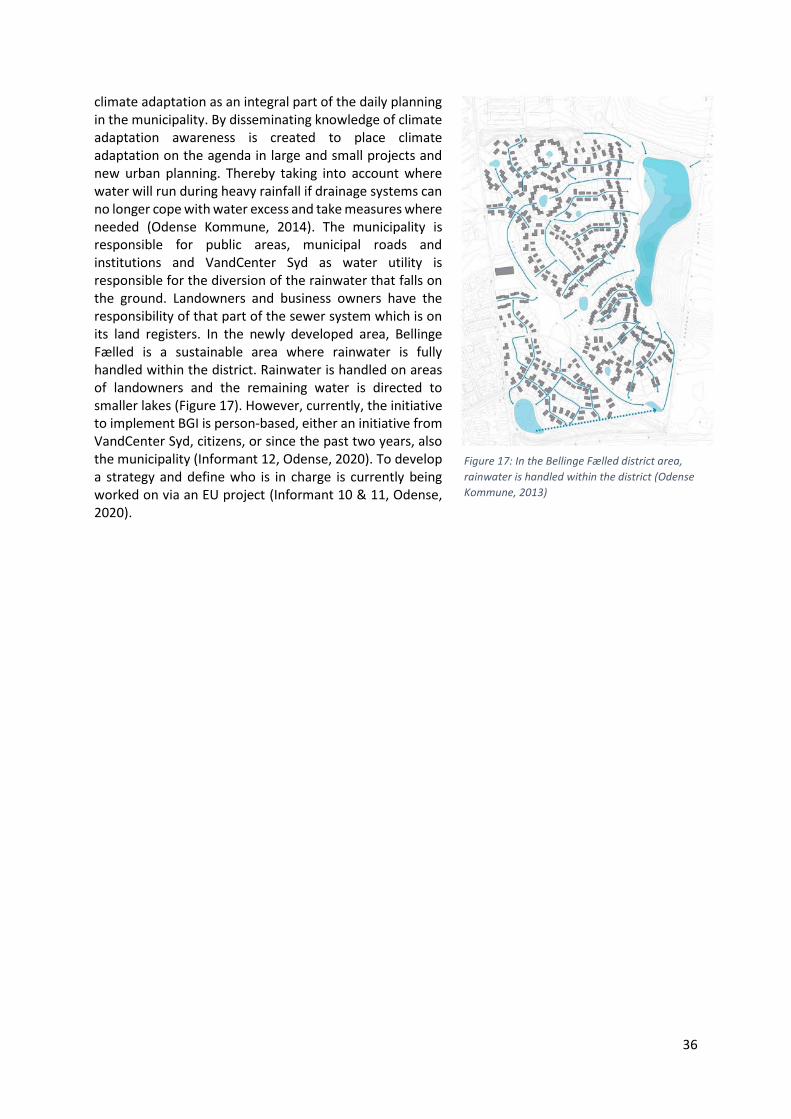
36
climate adaptation as an integral part of the daily planning in the municipality. By disseminating knowledge of climate adaptation awareness is created to place climate adaptation on the agenda in large and small projects and new urban planning. Thereby taking into account where water will run during heavy rainfall if drainage systems can no longer cope with water excess and take measures where needed (Odense Kommune, 2014). The municipality is responsible for public areas, municipal roads and institutions and VandCenter Syd as water utility is responsible for the diversion of the rainwater that falls on the ground. Landowners and business owners have the responsibility of that part of the sewer system which is on its land registers. In the newly developed area, Bellinge Fælled is a sustainable area where rainwater is fully handled within the district. Rainwater is handled on areas of landowners and the remaining water is directed to smaller lakes (Figure 17). However, currently, the initiative to implement BGI is person-based, either an initiative from VandCenter Syd, citizens, or since the past two years, also the municipality (Informant 12, Odense, 2020). To develop a strategy and define who is in charge is currently being worked on via an EU project (Informant 10 & 11, Odense, 2020).
Figure 17: In the Bellinge Fælled district area,
rainwater is handled within the district (Odense
Kommune, 2013)
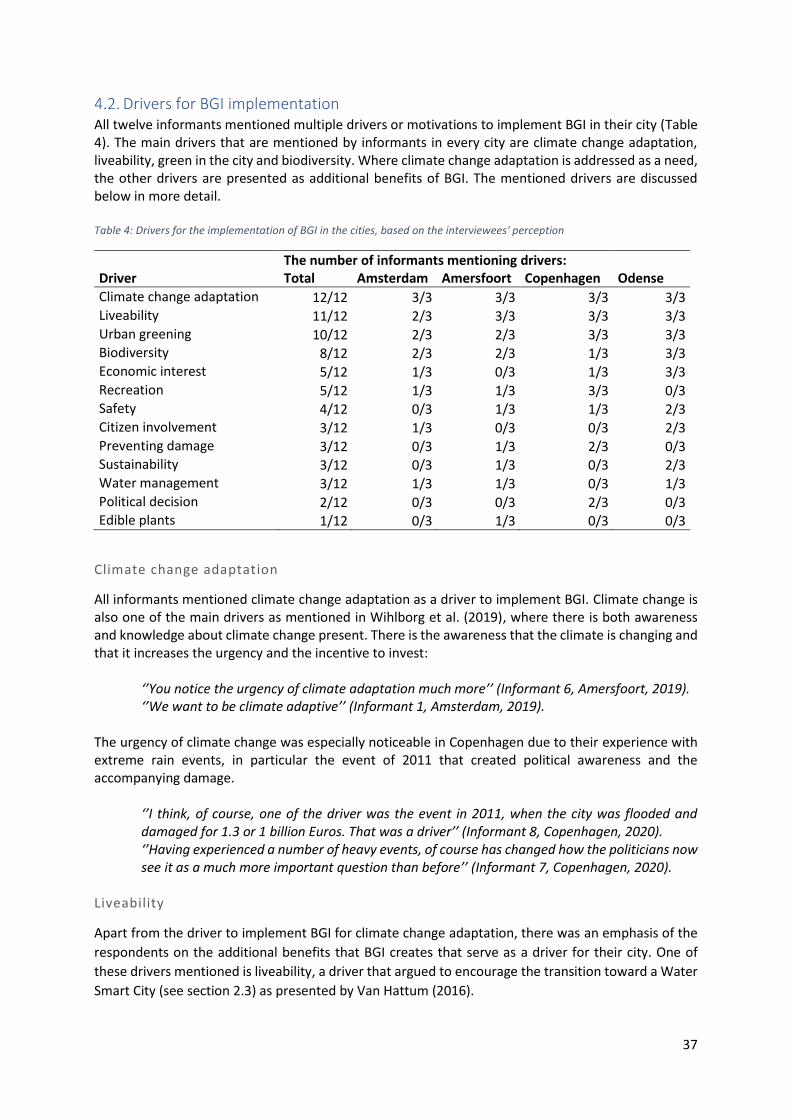
37
Drivers for BGI implementation All twelve informants mentioned multiple drivers or motivations to implement BGI in their city (Table 4). The main drivers that are mentioned by informants in every city are climate change adaptation, liveability, green in the city and biodiversity. Where climate change adaptation is addressed as a need, the other drivers are presented as additional benefits of BGI. The mentioned drivers are discussed below in more detail. Table 4: Drivers for the implementation of BGI in the cities, based on the interviewees' perception
The number of informants mentioning drivers: Driver Total Amsterdam Amersfoort Copenhagen Odense
Climate change adaptation 12/12 3/3 3/3 3/3 3/3 Liveability 11/12 2/3 3/3 3/3 3/3 Urban greening 10/12 2/3 2/3 3/3 3/3 Biodiversity 8/12 2/3 2/3 1/3 3/3 Economic interest 5/12 1/3 0/3 1/3 3/3 Recreation 5/12 1/3 1/3 3/3 0/3 Safety 4/12 0/3 1/3 1/3 2/3 Citizen involvement 3/12 1/3 0/3 0/3 2/3 Preventing damage 3/12 0/3 1/3 2/3 0/3 Sustainability 3/12 0/3 1/3 0/3 2/3 Water management 3/12 1/3 1/3 0/3 1/3 Political decision 2/12 0/3 0/3 2/3 0/3 Edible plants 1/12 0/3 1/3 0/3 0/3
Climate change adaptation
All informants mentioned climate change adaptation as a driver to implement BGI. Climate change is also one of the main drivers as mentioned in Wihlborg et al. (2019), where there is both awareness and knowledge about climate change present. There is the awareness that the climate is changing and that it increases the urgency and the incentive to invest:
‘’You notice the urgency of climate adaptation much more’’ (Informant 6, Amersfoort, 2019). ‘’We want to be climate adaptive’’ (Informant 1, Amsterdam, 2019).
The urgency of climate change was especially noticeable in Copenhagen due to their experience with extreme rain events, in particular the event of 2011 that created political awareness and the accompanying damage.
‘’I think, of course, one of the driver was the event in 2011, when the city was flooded and damaged for 1.3 or 1 billion Euros. That was a driver’’ (Informant 8, Copenhagen, 2020). ‘’Having experienced a number of heavy events, of course has changed how the politicians now see it as a much more important question than before’’ (Informant 7, Copenhagen, 2020).
Liveability
Apart from the driver to implement BGI for climate change adaptation, there was an emphasis of the
respondents on the additional benefits that BGI creates that serve as a driver for their city. One of
these drivers mentioned is liveability, a driver that argued to encourage the transition toward a Water
Smart City (see section 2.3) as presented by Van Hattum (2016).
38
‘’Actually it is a more liveable city. I think that is one of the drivers. People they want these
changes. People really liked to have the blue-green areas’’ (Informant 10, Odense, 2020).
BGI is often described as a possibility to create a better urban area in which people can enjoy the
solution in other additional ways apart from a stormwater solution. For example that BGI can have an
everyday function as a park.
Urban greening
Urban greening, or often mentioned by the term ‘green’, is repeatedly mentioned by the respondents as a driver to implement BGI. Thereby referring to nature in the city and the accompanying ecosystem services behind that. According to Liao et al., (2017), urban greening is a motivation for cities to implement BGI. Greening has additional benefits of recreation, leisure, religion and adds on mental well-being which are relevant aspects that add to the quality of urban life (Liao et al., 2017). The informants often mention liveability and green in the city interlinked:
‘’I think the quality of living in the city depends so much on how much green there is in the city’’ (Informant 2, Amsterdam, 2019). ‘’We love green, thus increasing the added value of green in the city is very important’’ (Informant 4, Amersfoort, 2019).
Green can be mentioned as a part of the BGI solution or as nature-inclusive construction, however, on the other hand, there is the insight that city greening on itself can contribute to climate adaptation. As one respondent mentioned:
‘’We make the city greener for climate adaptation, for biodiversity and for better recreation services, for more edible plants in the city, more trees, thus more shade. More green has the effect of being able to cope with extreme rain events’’ (Informant 5, Amersfoort, 2019).
Biodiversity
Biodiversity is mentioned as a driver for BGI implementation and some respondents mention that it is
becoming more important and that it is taken into account.
‘’Biodiversity is of course essential, that you make that kind of investments’’ (Informant 4,
Amersfoort, 2019).
Wihlborg et al. (2019) mention biodiversity among ecosystem services as a driving force to implement
BGI. There is active attention for including biodiversity in projects. For example, in Amsterdam, a point
system for nature inclusive construction applies to tenders which ensure biodiversity inclusion
(Informant 3, Amsterdam, 2019).
‘’That developers must be able to demonstrate that the buildings they are going to construct
are nature-inclusive. So that, for example, there are nesting places for certain animals or that
façade green is applied’’ (Informant 2, Amsterdam, 2019).
Other drivers
Other drivers that were occasionally mentioned are economical interest, recreation, safety, citizen
involvement, preventing damage, sustainability, water management, political decision and edible
plants. Although drivers as safety and preventing damage is linked to extreme rain events and
recreation and edible plants add to the liveability of the city, these drivers were mentioned separately.
The economic interest in BGI is mentioned by respondents from different perspectives. For example,

39
it is noticed from experience that BGI has the possibility to increase the value of property (Informant
10 & 11, 2020) and it is mentioned that the costs for BGI are lower than expanding the sewer system
(Informant 8, Copenhagen, 2020). This finding of the economic driver is also mentioned by Wihlborg
et al. (2019) arguing that an expansion of the existing sewage pipe is more expansive. Furthermore,
citizen involvement refers to including citizen in the process of BGI implementation or make them
responsible for taking measures themselves (Informant 1, Amsterdam, 2019; Informant 10 & 11, 2020).
Sustainability also refers to the most energy effective measure in order to develop greener solutions.
Water management is mentioned separately as BGI would be the natural way of handling the water
(Informant 12, Odense, 2020). Mainly in Copenhagen, the political decision is mentioned as a driver to
implement BGI as the politicians asked to develop an implementation plan after the Cloudburst
management plan.
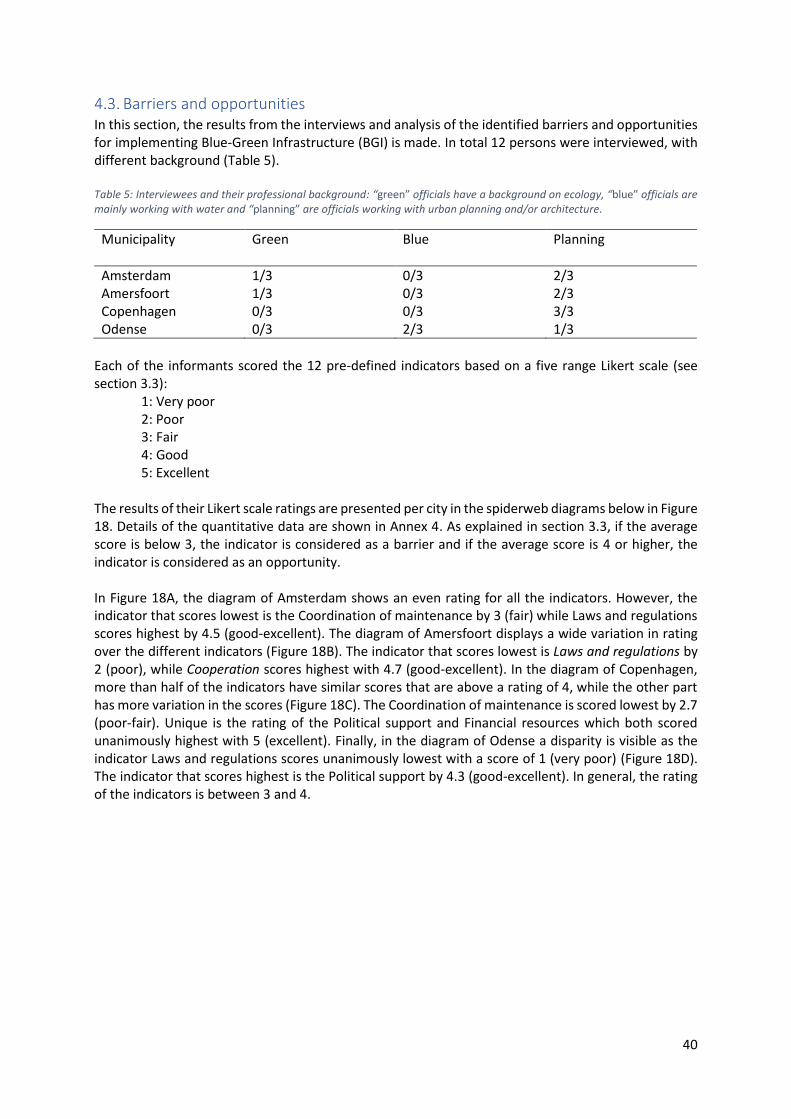
40
Barriers and opportunities In this section, the results from the interviews and analysis of the identified barriers and opportunities for implementing Blue-Green Infrastructure (BGI) is made. In total 12 persons were interviewed, with different background (Table 5). Table 5: Interviewees and their professional background: “green” officials have a background on ecology, “blue” officials are mainly working with water and “planning” are officials working with urban planning and/or architecture.
Municipality Green Blue Planning
Amsterdam 1/3 0/3 2/3 Amersfoort 1/3 0/3 2/3 Copenhagen 0/3 0/3 3/3 Odense 0/3 2/3 1/3
Each of the informants scored the 12 pre-defined indicators based on a five range Likert scale (see section 3.3):
1: Very poor 2: Poor 3: Fair 4: Good 5: Excellent
The results of their Likert scale ratings are presented per city in the spiderweb diagrams below in Figure 18. Details of the quantitative data are shown in Annex 4. As explained in section 3.3, if the average score is below 3, the indicator is considered as a barrier and if the average score is 4 or higher, the indicator is considered as an opportunity. In Figure 18A, the diagram of Amsterdam shows an even rating for all the indicators. However, the indicator that scores lowest is the Coordination of maintenance by 3 (fair) while Laws and regulations scores highest by 4.5 (good-excellent). The diagram of Amersfoort displays a wide variation in rating over the different indicators (Figure 18B). The indicator that scores lowest is Laws and regulations by 2 (poor), while Cooperation scores highest with 4.7 (good-excellent). In the diagram of Copenhagen, more than half of the indicators have similar scores that are above a rating of 4, while the other part has more variation in the scores (Figure 18C). The Coordination of maintenance is scored lowest by 2.7 (poor-fair). Unique is the rating of the Political support and Financial resources which both scored unanimously highest with 5 (excellent). Finally, in the diagram of Odense a disparity is visible as the indicator Laws and regulations scores unanimously lowest with a score of 1 (very poor) (Figure 18D). The indicator that scores highest is the Political support by 4.3 (good-excellent). In general, the rating of the indicators is between 3 and 4.
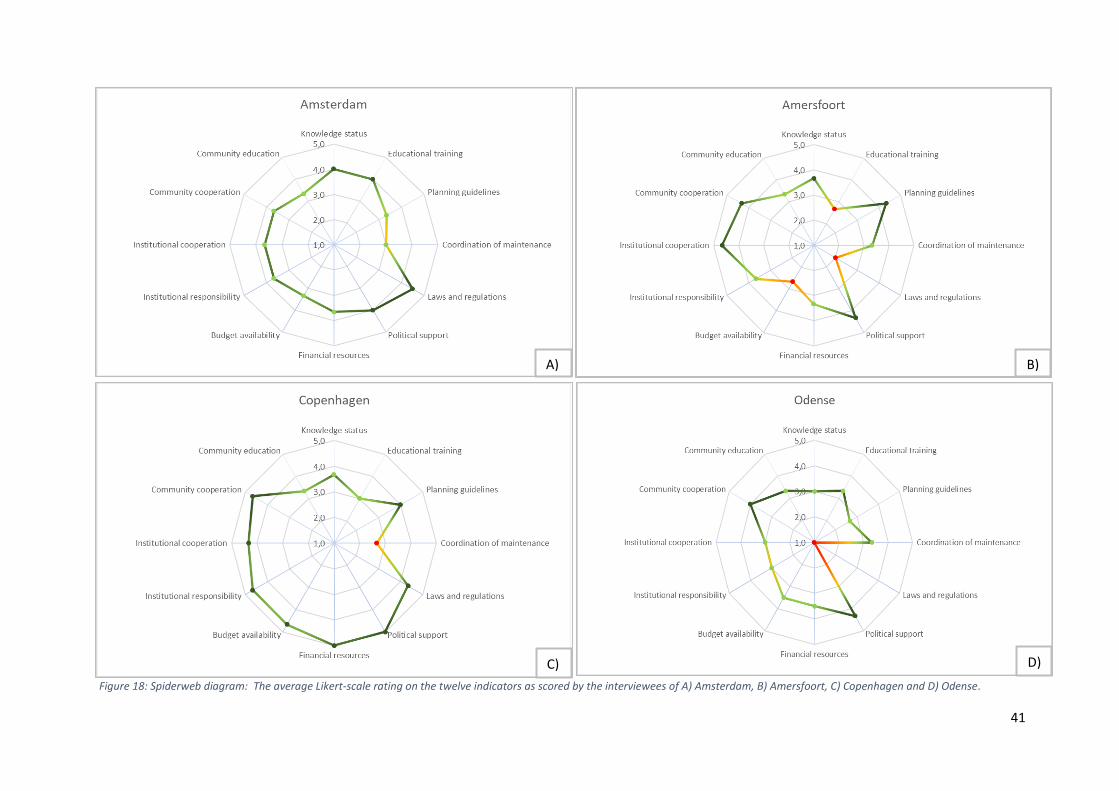
41
Figure 18: Spiderweb diagram: The average Likert-scale rating on the twelve indicators as scored by the interviewees of A) Amsterdam, B) Amersfoort, C) Copenhagen and D) Odense.
A) B)
C) D)
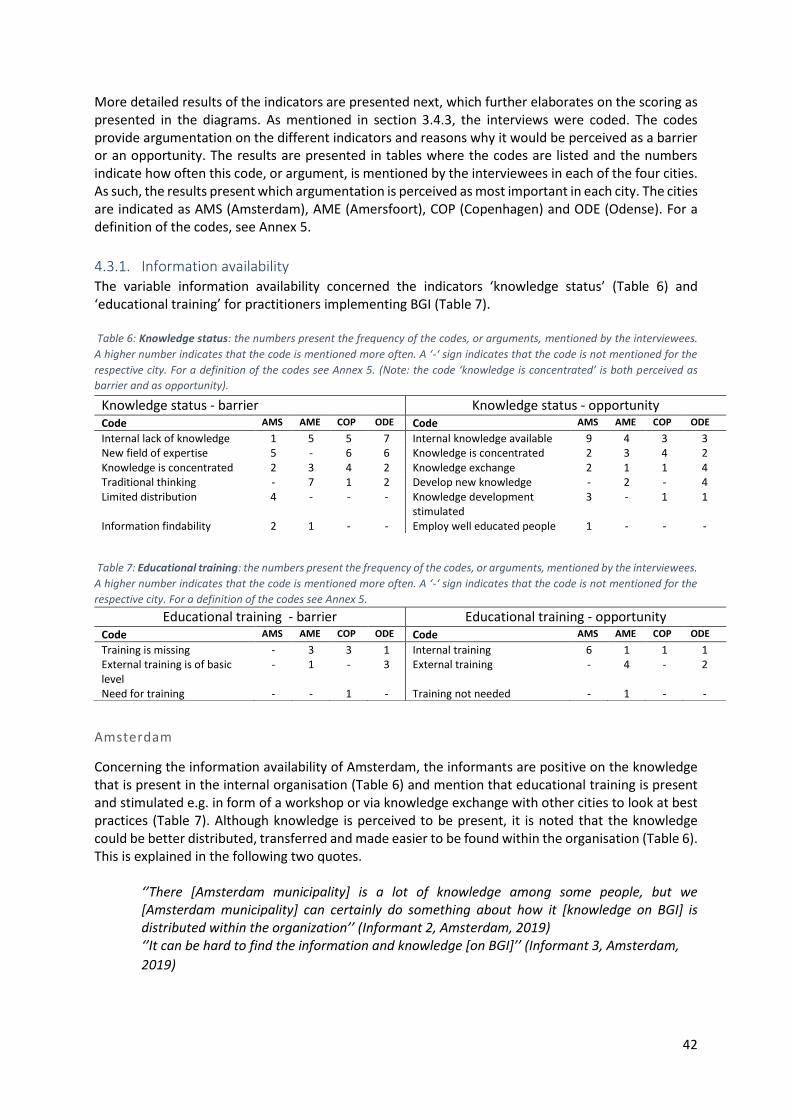
42
More detailed results of the indicators are presented next, which further elaborates on the scoring as presented in the diagrams. As mentioned in section 3.4.3, the interviews were coded. The codes provide argumentation on the different indicators and reasons why it would be perceived as a barrier or an opportunity. The results are presented in tables where the codes are listed and the numbers indicate how often this code, or argument, is mentioned by the interviewees in each of the four cities. As such, the results present which argumentation is perceived as most important in each city. The cities are indicated as AMS (Amsterdam), AME (Amersfoort), COP (Copenhagen) and ODE (Odense). For a definition of the codes, see Annex 5.
4.3.1. Information availability The variable information availability concerned the indicators ‘knowledge status’ (Table 6) and ‘educational training’ for practitioners implementing BGI (Table 7). Table 6: Knowledge status: the numbers present the frequency of the codes, or arguments, mentioned by the interviewees.
A higher number indicates that the code is mentioned more often. A ‘-‘ sign indicates that the code is not mentioned for the
respective city. For a definition of the codes see Annex 5. (Note: the code ‘knowledge is concentrated’ is both perceived as
barrier and as opportunity).
Table 7: Educational training: the numbers present the frequency of the codes, or arguments, mentioned by the interviewees.
A higher number indicates that the code is mentioned more often. A ‘-‘ sign indicates that the code is not mentioned for the
respective city. For a definition of the codes see Annex 5.
Amsterdam
Concerning the information availability of Amsterdam, the informants are positive on the knowledge that is present in the internal organisation (Table 6) and mention that educational training is present and stimulated e.g. in form of a workshop or via knowledge exchange with other cities to look at best practices (Table 7). Although knowledge is perceived to be present, it is noted that the knowledge could be better distributed, transferred and made easier to be found within the organisation (Table 6). This is explained in the following two quotes.
‘’There [Amsterdam municipality] is a lot of knowledge among some people, but we [Amsterdam municipality] can certainly do something about how it [knowledge on BGI] is distributed within the organization’’ (Informant 2, Amsterdam, 2019) ‘’It can be hard to find the information and knowledge [on BGI]’’ (Informant 3, Amsterdam,
2019)
Knowledge status - barrier Knowledge status - opportunity Code AMS AME COP ODE Code AMS AME COP ODE Internal lack of knowledge 1 5 5 7 Internal knowledge available 9 4 3 3 New field of expertise 5 - 6 6 Knowledge is concentrated 2 3 4 2 Knowledge is concentrated 2 3 4 2 Knowledge exchange 2 1 1 4 Traditional thinking - 7 1 2 Develop new knowledge - 2 - 4 Limited distribution 4 - - - Knowledge development
stimulated 3 - 1 1
Information findability 2 1 - - Employ well educated people 1 - - -
Educational training - barrier Educational training - opportunity Code AMS AME COP ODE Code AMS AME COP ODE Training is missing - 3 3 1 Internal training 6 1 1 1 External training is of basic level
- 1 - 3 External training - 4 - 2
Need for training - - 1 - Training not needed - 1 - -
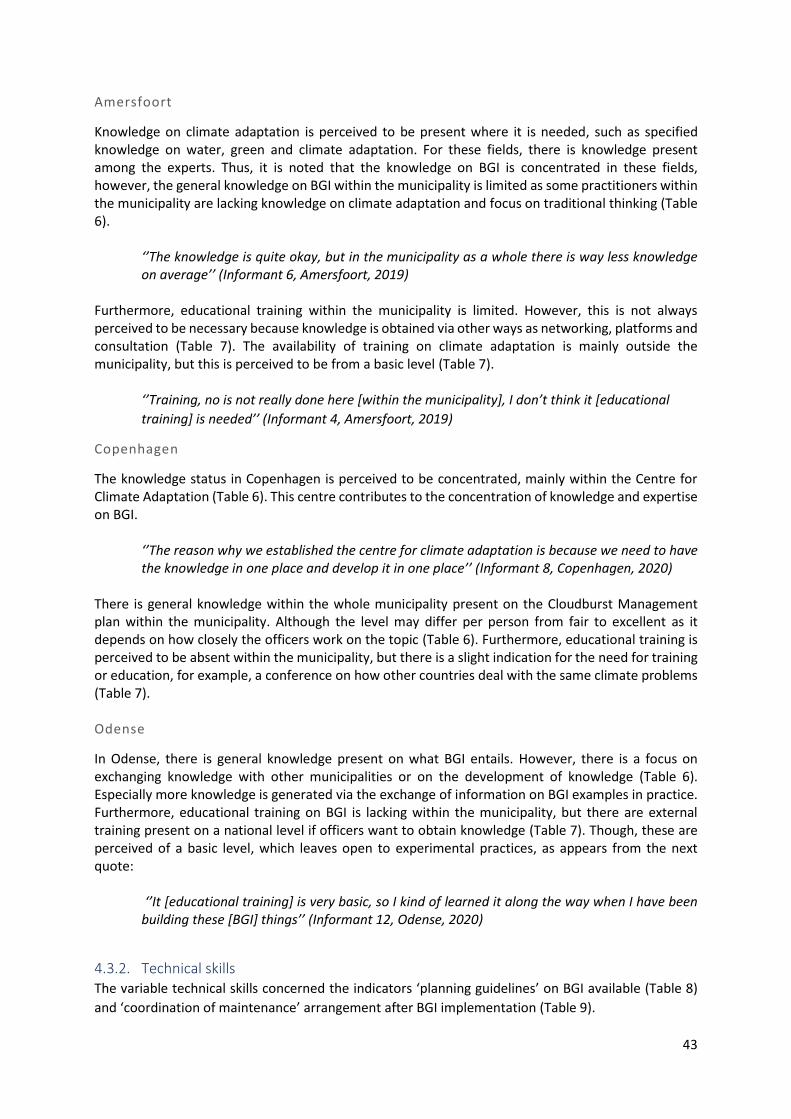
43
Amersfoort
Knowledge on climate adaptation is perceived to be present where it is needed, such as specified knowledge on water, green and climate adaptation. For these fields, there is knowledge present among the experts. Thus, it is noted that the knowledge on BGI is concentrated in these fields, however, the general knowledge on BGI within the municipality is limited as some practitioners within the municipality are lacking knowledge on climate adaptation and focus on traditional thinking (Table 6).
‘’The knowledge is quite okay, but in the municipality as a whole there is way less knowledge on average’’ (Informant 6, Amersfoort, 2019)
Furthermore, educational training within the municipality is limited. However, this is not always perceived to be necessary because knowledge is obtained via other ways as networking, platforms and consultation (Table 7). The availability of training on climate adaptation is mainly outside the municipality, but this is perceived to be from a basic level (Table 7).
‘’Training, no is not really done here [within the municipality], I don’t think it [educational
training] is needed’’ (Informant 4, Amersfoort, 2019)
Copenhagen
The knowledge status in Copenhagen is perceived to be concentrated, mainly within the Centre for Climate Adaptation (Table 6). This centre contributes to the concentration of knowledge and expertise on BGI.
‘’The reason why we established the centre for climate adaptation is because we need to have the knowledge in one place and develop it in one place’’ (Informant 8, Copenhagen, 2020)
There is general knowledge within the whole municipality present on the Cloudburst Management plan within the municipality. Although the level may differ per person from fair to excellent as it depends on how closely the officers work on the topic (Table 6). Furthermore, educational training is perceived to be absent within the municipality, but there is a slight indication for the need for training or education, for example, a conference on how other countries deal with the same climate problems (Table 7). Odense
In Odense, there is general knowledge present on what BGI entails. However, there is a focus on exchanging knowledge with other municipalities or on the development of knowledge (Table 6). Especially more knowledge is generated via the exchange of information on BGI examples in practice. Furthermore, educational training on BGI is lacking within the municipality, but there are external training present on a national level if officers want to obtain knowledge (Table 7). Though, these are perceived of a basic level, which leaves open to experimental practices, as appears from the next quote:
‘’It [educational training] is very basic, so I kind of learned it along the way when I have been building these [BGI] things’’ (Informant 12, Odense, 2020)
4.3.2. Technical skills The variable technical skills concerned the indicators ‘planning guidelines’ on BGI available (Table 8)
and ‘coordination of maintenance’ arrangement after BGI implementation (Table 9).
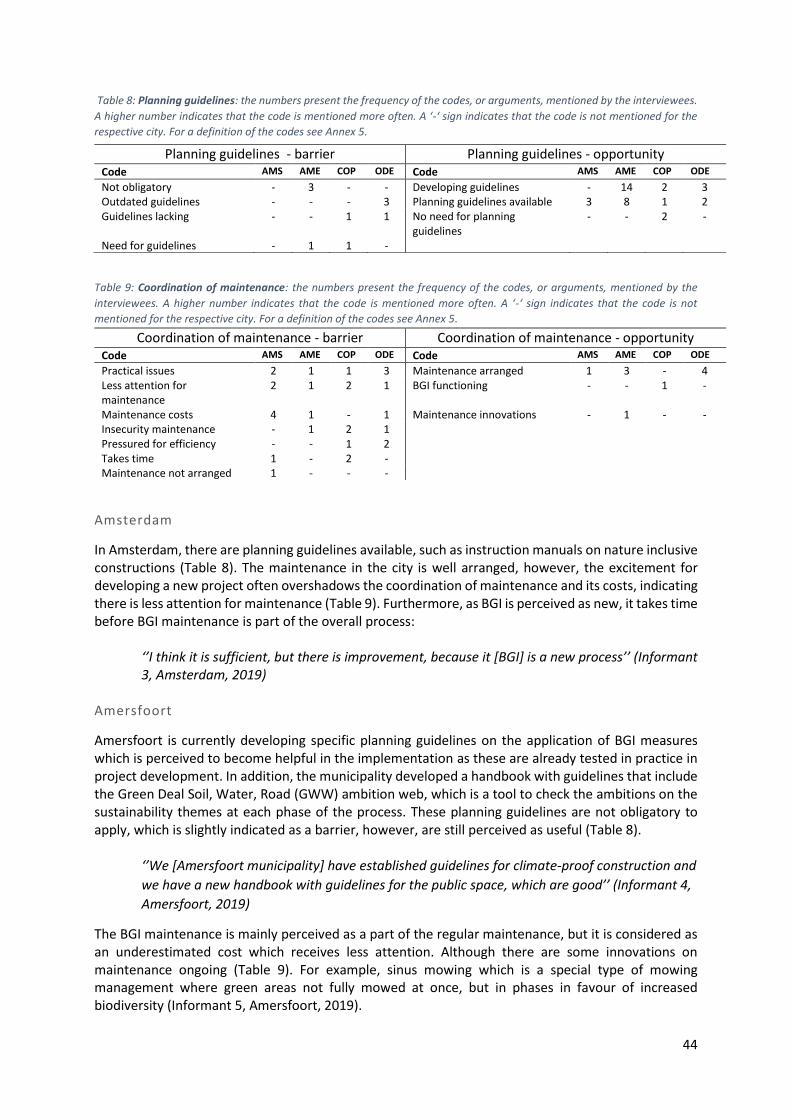
44
Table 8: Planning guidelines: the numbers present the frequency of the codes, or arguments, mentioned by the interviewees.
A higher number indicates that the code is mentioned more often. A ‘-‘ sign indicates that the code is not mentioned for the
respective city. For a definition of the codes see Annex 5.
Table 9: Coordination of maintenance: the numbers present the frequency of the codes, or arguments, mentioned by the
interviewees. A higher number indicates that the code is mentioned more often. A ‘-‘ sign indicates that the code is not
mentioned for the respective city. For a definition of the codes see Annex 5.
Amsterdam
In Amsterdam, there are planning guidelines available, such as instruction manuals on nature inclusive constructions (Table 8). The maintenance in the city is well arranged, however, the excitement for developing a new project often overshadows the coordination of maintenance and its costs, indicating there is less attention for maintenance (Table 9). Furthermore, as BGI is perceived as new, it takes time before BGI maintenance is part of the overall process:
‘’I think it is sufficient, but there is improvement, because it [BGI] is a new process’’ (Informant 3, Amsterdam, 2019)
Amersfoort
Amersfoort is currently developing specific planning guidelines on the application of BGI measures which is perceived to become helpful in the implementation as these are already tested in practice in project development. In addition, the municipality developed a handbook with guidelines that include the Green Deal Soil, Water, Road (GWW) ambition web, which is a tool to check the ambitions on the sustainability themes at each phase of the process. These planning guidelines are not obligatory to apply, which is slightly indicated as a barrier, however, are still perceived as useful (Table 8).
‘’We [Amersfoort municipality] have established guidelines for climate-proof construction and
we have a new handbook with guidelines for the public space, which are good’’ (Informant 4,
Amersfoort, 2019)
The BGI maintenance is mainly perceived as a part of the regular maintenance, but it is considered as an underestimated cost which receives less attention. Although there are some innovations on maintenance ongoing (Table 9). For example, sinus mowing which is a special type of mowing management where green areas not fully mowed at once, but in phases in favour of increased biodiversity (Informant 5, Amersfoort, 2019).
Planning guidelines - barrier Planning guidelines - opportunity Code AMS AME COP ODE Code AMS AME COP ODE Not obligatory - 3 - - Developing guidelines - 14 2 3 Outdated guidelines - - - 3 Planning guidelines available 3 8 1 2 Guidelines lacking - - 1 1 No need for planning
guidelines - - 2 -
Need for guidelines - 1 1 -
Coordination of maintenance - barrier Coordination of maintenance - opportunity Code AMS AME COP ODE Code AMS AME COP ODE Practical issues 2 1 1 3 Maintenance arranged 1 3 - 4 Less attention for maintenance
2 1 2 1 BGI functioning - - 1 -
Maintenance costs 4 1 - 1 Maintenance innovations - 1 - - Insecurity maintenance - 1 2 1 Pressured for efficiency - - 1 2 Takes time 1 - 2 - Maintenance not arranged 1 - - -
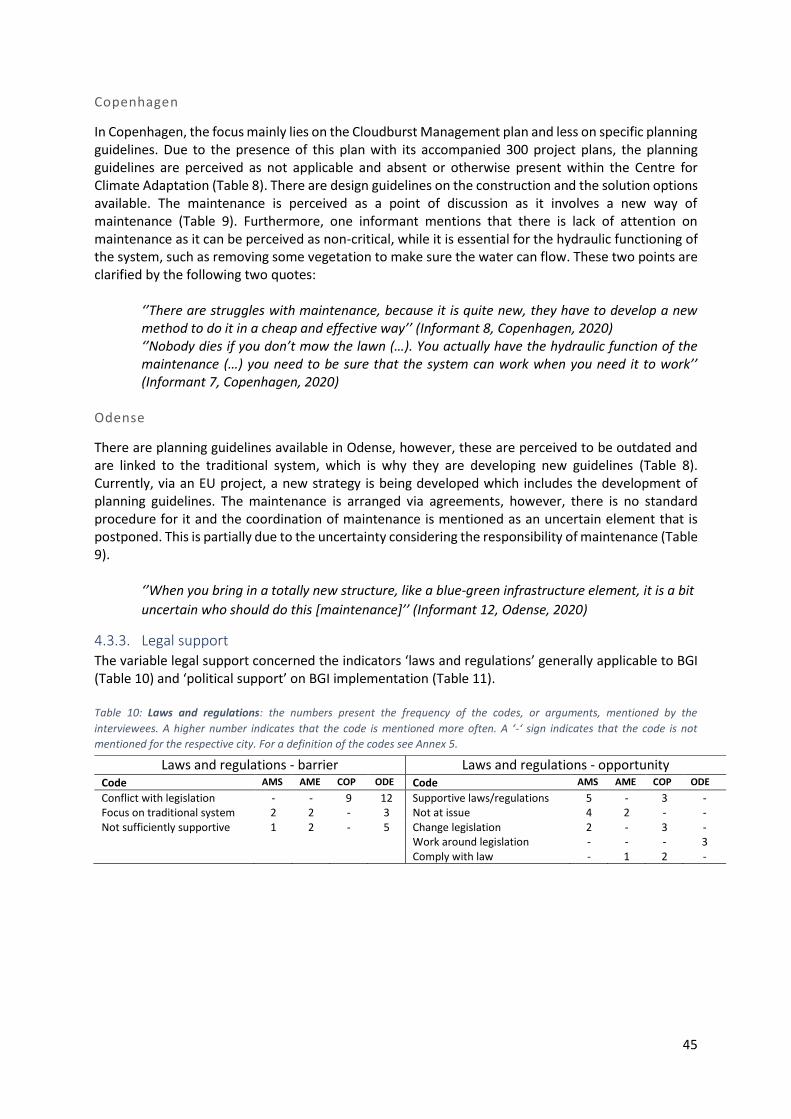
45
Copenhagen
In Copenhagen, the focus mainly lies on the Cloudburst Management plan and less on specific planning guidelines. Due to the presence of this plan with its accompanied 300 project plans, the planning guidelines are perceived as not applicable and absent or otherwise present within the Centre for Climate Adaptation (Table 8). There are design guidelines on the construction and the solution options available. The maintenance is perceived as a point of discussion as it involves a new way of maintenance (Table 9). Furthermore, one informant mentions that there is lack of attention on maintenance as it can be perceived as non-critical, while it is essential for the hydraulic functioning of the system, such as removing some vegetation to make sure the water can flow. These two points are clarified by the following two quotes:
‘’There are struggles with maintenance, because it is quite new, they have to develop a new method to do it in a cheap and effective way’’ (Informant 8, Copenhagen, 2020) ‘’Nobody dies if you don’t mow the lawn (…). You actually have the hydraulic function of the maintenance (…) you need to be sure that the system can work when you need it to work’’ (Informant 7, Copenhagen, 2020)
Odense
There are planning guidelines available in Odense, however, these are perceived to be outdated and are linked to the traditional system, which is why they are developing new guidelines (Table 8). Currently, via an EU project, a new strategy is being developed which includes the development of planning guidelines. The maintenance is arranged via agreements, however, there is no standard procedure for it and the coordination of maintenance is mentioned as an uncertain element that is postponed. This is partially due to the uncertainty considering the responsibility of maintenance (Table 9).
‘’When you bring in a totally new structure, like a blue-green infrastructure element, it is a bit
uncertain who should do this [maintenance]’’ (Informant 12, Odense, 2020)
4.3.3. Legal support The variable legal support concerned the indicators ‘laws and regulations’ generally applicable to BGI (Table 10) and ‘political support’ on BGI implementation (Table 11). Table 10: Laws and regulations: the numbers present the frequency of the codes, or arguments, mentioned by the
interviewees. A higher number indicates that the code is mentioned more often. A ‘-‘ sign indicates that the code is not
mentioned for the respective city. For a definition of the codes see Annex 5.
Laws and regulations - barrier Laws and regulations - opportunity Code AMS AME COP ODE Code AMS AME COP ODE Conflict with legislation - - 9 12 Supportive laws/regulations 5 - 3 -
Focus on traditional system 2 2 - 3 Not at issue 4 2 - -
Not sufficiently supportive 1 2 - 5 Change legislation 2 - 3 -
Work around legislation - - - 3
Comply with law - 1 2 -
46
Table 11: Political support: the numbers present the frequency of the codes, or arguments, mentioned by the interviewees. A
higher number indicates that the code is mentioned more often. A ‘-‘ sign indicates that the code is not mentioned for the
respective city. For a definition of the codes see Annex 5.
Amsterdam
In Amsterdam, laws and regulations are mentioned not to be at issue and there are supportive laws and regulations present. There was some neutrality on laws and regulations as these were perceived as laws and regulations need to be taken into account. These were mentioned as being present, and that it is more about the results and the aims instead of the form of the rules (Table 10).
‘’We [Amsterdam municipality] should not focus on regulations but on project results, but provide clear aims instead’’ (Informant 1, Amsterdam, 2019)
There are instruction manuals on nature inclusive construction and a new system where tenders need to comply with a certain amount of points linked to specific measures. Other regulations concern the Green Vision (Dutch: Groenvisie) and environmental plan (Dutch: Omgevingsplan) which concern policy guidelines. However, the laws and regulation focus on the traditional system and are not always sufficiently supportive (Table 10). It is indicated that some regulations are independent of the council that is present and will continue despite this indifference. Furthermore, political support is positive in Amsterdam. There is attention for BGI in political agendas and has political priority (Table 11). Amersfoort
Concerning laws and regulations, the informants in Amersfoort considered it not an issue or mainly as an aspect with which they have to comply to. It is mentioned that further progress on national laws would be helpful (Table 10). The political support is perceived as good or excellent, due to political priority and a coalition in the council that has a focus on green policy (Table 11):
‘’I think there is support, certainly because we do have a green coalition and they are really based on climate adaptation and green’’ (Informant 6, Amersfoort, 2019)
Copenhagen
In Copenhagen, there was lobbying for change in legislation that would clarify the distinction in financial responsibilities of the water utility and the municipality in the projects on the hydraulic part and the green part of the projects. Although there is enough funding for the projects available from the water utility, there is some conflict with the law on the availability of municipal funding (Table 10). Political support is seen as vastly present (Table 11).
‘’Well of course having experienced a number of heavy events, of course has changed the politicians, now they see it as a much more important question than before’’ (Informant 7, Copenhagen, 2020)
There is some critique if this support will remain steady in the future, however, the reason to not only add benefits on the projects for BGI, but for the benefits to the citizens as this is a strong motivation for politicians to implement it. For Copenhagen one of the main drivers to implement BGI is the political decision to do it (Table 11).
Political support - barrier Political support - opportunity Code AMS AME COP ODE Code AMS AME COP ODE Susceptible to change 2 - 1 - Positive support 2 4 8 2
Political dependence - - 3 - Political priority 2 1 11 1
Inaction - - - 1 Green coalition 2 1 - -
Less involved 1 - - - Attention in political agendas 2 - - -
Exceeds council 1 - - -
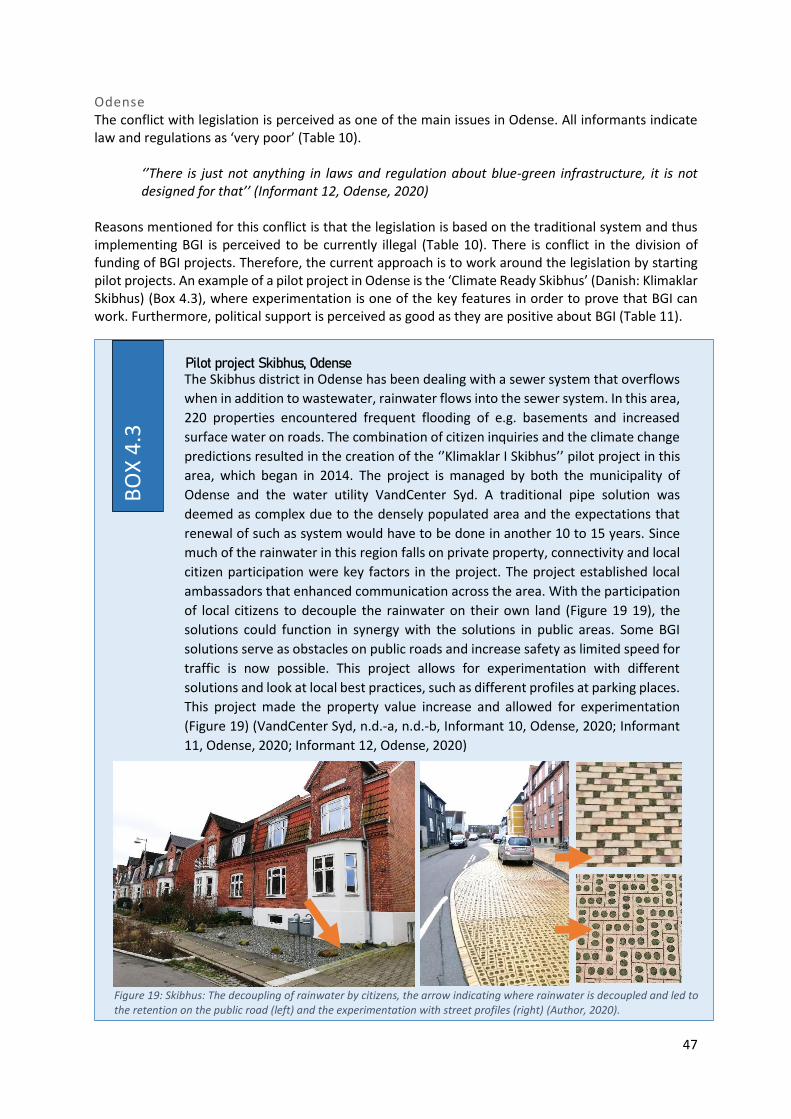
47
Odense The conflict with legislation is perceived as one of the main issues in Odense. All informants indicate law and regulations as ‘very poor’ (Table 10).
‘’There is just not anything in laws and regulation about blue-green infrastructure, it is not designed for that’’ (Informant 12, Odense, 2020)
Reasons mentioned for this conflict is that the legislation is based on the traditional system and thus implementing BGI is perceived to be currently illegal (Table 10). There is conflict in the division of funding of BGI projects. Therefore, the current approach is to work around the legislation by starting pilot projects. An example of a pilot project in Odense is the ‘Climate Ready Skibhus’ (Danish: Klimaklar Skibhus) (Box 4.3), where experimentation is one of the key features in order to prove that BGI can work. Furthermore, political support is perceived as good as they are positive about BGI (Table 11).
BO
X 4
.3
The Skibhus district in Odense has been dealing with a sewer system that overflows
when in addition to wastewater, rainwater flows into the sewer system. In this area,
220 properties encountered frequent flooding of e.g. basements and increased
surface water on roads. The combination of citizen inquiries and the climate change
predictions resulted in the creation of the ‘’Klimaklar I Skibhus’’ pilot project in this
area, which began in 2014. The project is managed by both the municipality of
Odense and the water utility VandCenter Syd. A traditional pipe solution was
deemed as complex due to the densely populated area and the expectations that
renewal of such as system would have to be done in another 10 to 15 years. Since
much of the rainwater in this region falls on private property, connectivity and local
citizen participation were key factors in the project. The project established local
ambassadors that enhanced communication across the area. With the participation
of local citizens to decouple the rainwater on their own land (Figure 19 19), the
solutions could function in synergy with the solutions in public areas. Some BGI
solutions serve as obstacles on public roads and increase safety as limited speed for
traffic is now possible. This project allows for experimentation with different
solutions and look at local best practices, such as different profiles at parking places.
This project made the property value increase and allowed for experimentation
(Figure 19) (VandCenter Syd, n.d.-a, n.d.-b, Informant 10, Odense, 2020; Informant
11, Odense, 2020; Informant 12, Odense, 2020)
Pilot project Skibhus, Odense
Figure 19: Skibhus: The decoupling of rainwater by citizens, the arrow indicating where rainwater is decoupled and led to the retention on the public road (left) and the experimentation with street profiles (right) (Author, 2020).
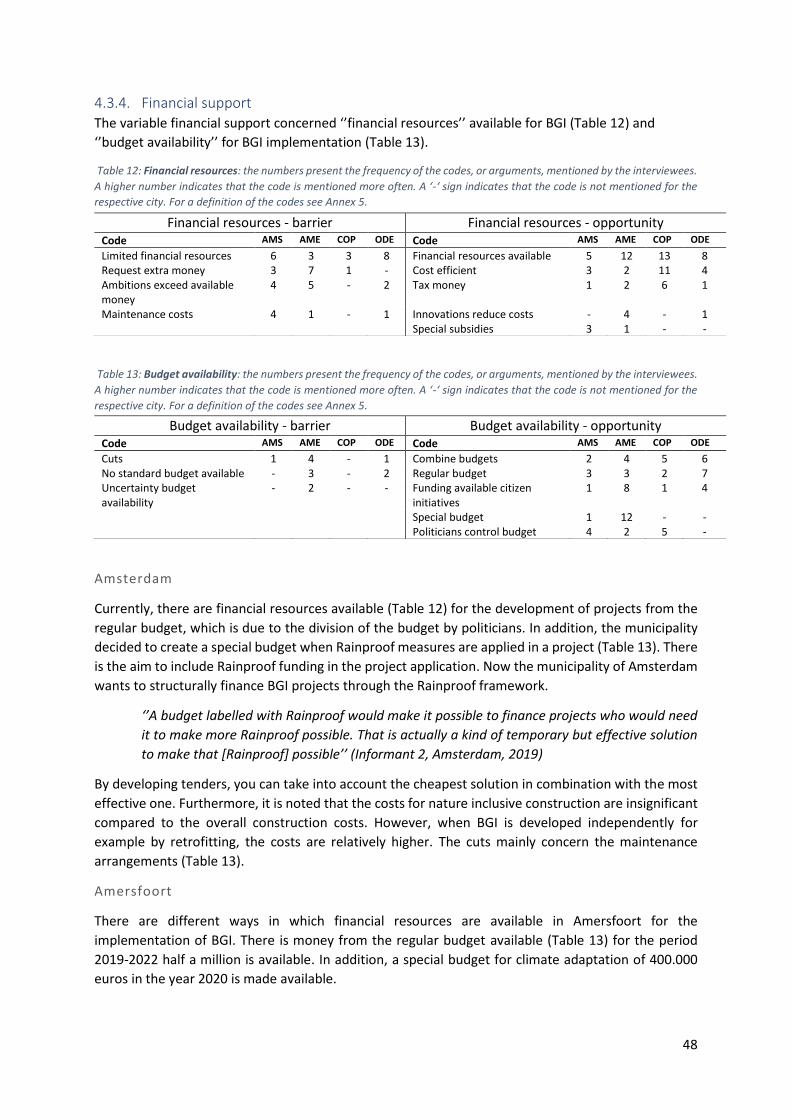
48
4.3.4. Financial support The variable financial support concerned ‘’financial resources’’ available for BGI (Table 12) and
‘’budget availability’’ for BGI implementation (Table 13).
Table 12: Financial resources: the numbers present the frequency of the codes, or arguments, mentioned by the interviewees.
A higher number indicates that the code is mentioned more often. A ‘-‘ sign indicates that the code is not mentioned for the
respective city. For a definition of the codes see Annex 5.
Table 13: Budget availability: the numbers present the frequency of the codes, or arguments, mentioned by the interviewees.
A higher number indicates that the code is mentioned more often. A ‘-‘ sign indicates that the code is not mentioned for the
respective city. For a definition of the codes see Annex 5.
Amsterdam
Currently, there are financial resources available (Table 12) for the development of projects from the
regular budget, which is due to the division of the budget by politicians. In addition, the municipality
decided to create a special budget when Rainproof measures are applied in a project (Table 13). There
is the aim to include Rainproof funding in the project application. Now the municipality of Amsterdam
wants to structurally finance BGI projects through the Rainproof framework.
‘’A budget labelled with Rainproof would make it possible to finance projects who would need
it to make more Rainproof possible. That is actually a kind of temporary but effective solution
to make that [Rainproof] possible’’ (Informant 2, Amsterdam, 2019)
By developing tenders, you can take into account the cheapest solution in combination with the most
effective one. Furthermore, it is noted that the costs for nature inclusive construction are insignificant
compared to the overall construction costs. However, when BGI is developed independently for
example by retrofitting, the costs are relatively higher. The cuts mainly concern the maintenance
arrangements (Table 13).
Amersfoort
There are different ways in which financial resources are available in Amersfoort for the
implementation of BGI. There is money from the regular budget available (Table 13) for the period
2019-2022 half a million is available. In addition, a special budget for climate adaptation of 400.000
euros in the year 2020 is made available.
Financial resources - barrier Financial resources - opportunity Code AMS AME COP ODE Code AMS AME COP ODE Limited financial resources 6 3 3 8 Financial resources available 5 12 13 8
Request extra money 3 7 1 - Cost efficient 3 2 11 4
Ambitions exceed available money
4 5 - 2 Tax money 1 2 6 1
Maintenance costs 4 1 - 1 Innovations reduce costs - 4 - 1
Special subsidies 3 1 - -
Budget availability - barrier Budget availability - opportunity Code AMS AME COP ODE Code AMS AME COP ODE Cuts 1 4 - 1 Combine budgets 2 4 5 6
No standard budget available - 3 - 2 Regular budget 3 3 2 7
Uncertainty budget availability
- 2 - - Funding available citizen initiatives
1 8 1 4
Special budget 1 12 - -
Politicians control budget 4 2 5 -
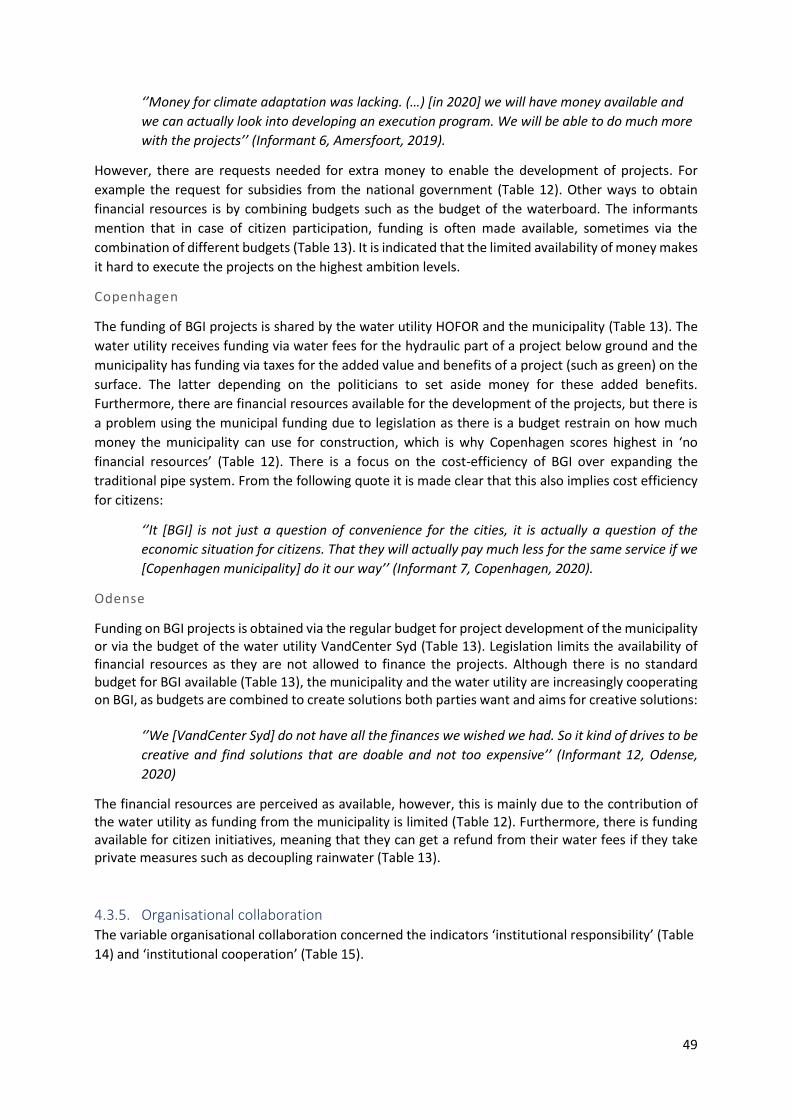
49
‘’Money for climate adaptation was lacking. (…) [in 2020] we will have money available and
we can actually look into developing an execution program. We will be able to do much more
with the projects’’ (Informant 6, Amersfoort, 2019).
However, there are requests needed for extra money to enable the development of projects. For
example the request for subsidies from the national government (Table 12). Other ways to obtain
financial resources is by combining budgets such as the budget of the waterboard. The informants
mention that in case of citizen participation, funding is often made available, sometimes via the
combination of different budgets (Table 13). It is indicated that the limited availability of money makes
it hard to execute the projects on the highest ambition levels.
Copenhagen
The funding of BGI projects is shared by the water utility HOFOR and the municipality (Table 13). The
water utility receives funding via water fees for the hydraulic part of a project below ground and the
municipality has funding via taxes for the added value and benefits of a project (such as green) on the
surface. The latter depending on the politicians to set aside money for these added benefits.
Furthermore, there are financial resources available for the development of the projects, but there is
a problem using the municipal funding due to legislation as there is a budget restrain on how much
money the municipality can use for construction, which is why Copenhagen scores highest in ‘no
financial resources’ (Table 12). There is a focus on the cost-efficiency of BGI over expanding the
traditional pipe system. From the following quote it is made clear that this also implies cost efficiency
for citizens:
‘’It [BGI] is not just a question of convenience for the cities, it is actually a question of the
economic situation for citizens. That they will actually pay much less for the same service if we
[Copenhagen municipality] do it our way’’ (Informant 7, Copenhagen, 2020).
Odense
Funding on BGI projects is obtained via the regular budget for project development of the municipality or via the budget of the water utility VandCenter Syd (Table 13). Legislation limits the availability of financial resources as they are not allowed to finance the projects. Although there is no standard budget for BGI available (Table 13), the municipality and the water utility are increasingly cooperating on BGI, as budgets are combined to create solutions both parties want and aims for creative solutions:
‘’We [VandCenter Syd] do not have all the finances we wished we had. So it kind of drives to be
creative and find solutions that are doable and not too expensive’’ (Informant 12, Odense,
2020)
The financial resources are perceived as available, however, this is mainly due to the contribution of the water utility as funding from the municipality is limited (Table 12). Furthermore, there is funding available for citizen initiatives, meaning that they can get a refund from their water fees if they take private measures such as decoupling rainwater (Table 13).
4.3.5. Organisational collaboration The variable organisational collaboration concerned the indicators ‘institutional responsibility’ (Table
14) and ‘institutional cooperation’ (Table 15).
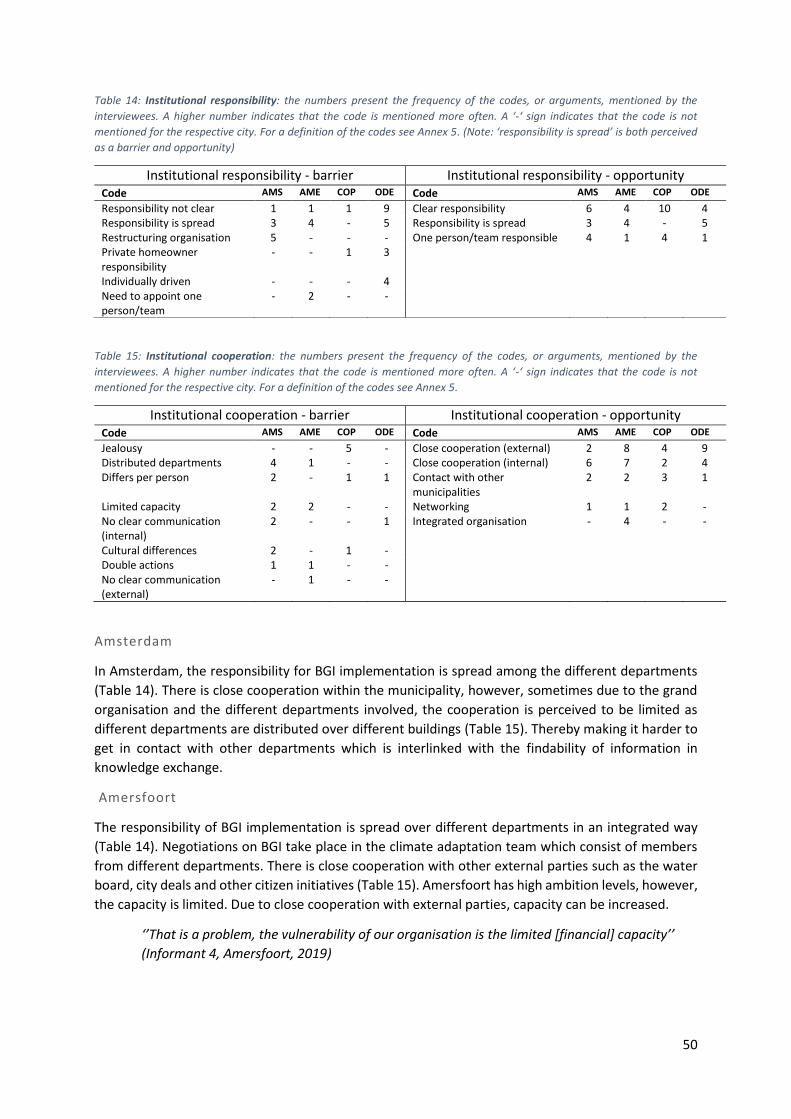
50
Table 14: Institutional responsibility: the numbers present the frequency of the codes, or arguments, mentioned by the
interviewees. A higher number indicates that the code is mentioned more often. A ‘-‘ sign indicates that the code is not
mentioned for the respective city. For a definition of the codes see Annex 5. (Note: ‘responsibility is spread’ is both perceived
as a barrier and opportunity)
Table 15: Institutional cooperation: the numbers present the frequency of the codes, or arguments, mentioned by the
interviewees. A higher number indicates that the code is mentioned more often. A ‘-‘ sign indicates that the code is not
mentioned for the respective city. For a definition of the codes see Annex 5.
Amsterdam
In Amsterdam, the responsibility for BGI implementation is spread among the different departments
(Table 14). There is close cooperation within the municipality, however, sometimes due to the grand
organisation and the different departments involved, the cooperation is perceived to be limited as
different departments are distributed over different buildings (Table 15). Thereby making it harder to
get in contact with other departments which is interlinked with the findability of information in
knowledge exchange.
Amersfoort
The responsibility of BGI implementation is spread over different departments in an integrated way
(Table 14). Negotiations on BGI take place in the climate adaptation team which consist of members
from different departments. There is close cooperation with other external parties such as the water
board, city deals and other citizen initiatives (Table 15). Amersfoort has high ambition levels, however,
the capacity is limited. Due to close cooperation with external parties, capacity can be increased.
‘’That is a problem, the vulnerability of our organisation is the limited [financial] capacity’’
(Informant 4, Amersfoort, 2019)
Institutional responsibility - barrier Institutional responsibility - opportunity Code AMS AME COP ODE Code AMS AME COP ODE Responsibility not clear 1 1 1 9 Clear responsibility 6 4 10 4
Responsibility is spread 3 4 - 5 Responsibility is spread 3 4 - 5
Restructuring organisation 5 - - - One person/team responsible 4 1 4 1
Private homeowner responsibility
- - 1 3
Individually driven - - - 4
Need to appoint one person/team
- 2 - -
Institutional cooperation - barrier Institutional cooperation - opportunity Code AMS AME COP ODE Code AMS AME COP ODE Jealousy - - 5 - Close cooperation (external) 2 8 4 9
Distributed departments 4 1 - - Close cooperation (internal) 6 7 2 4
Differs per person 2 - 1 1 Contact with other municipalities
2 2 3 1
Limited capacity 2 2 - - Networking 1 1 2 -
No clear communication (internal)
2 - - 1 Integrated organisation - 4 - -
Cultural differences 2 - 1 -
Double actions 1 1 - -
No clear communication (external)
- 1 - -
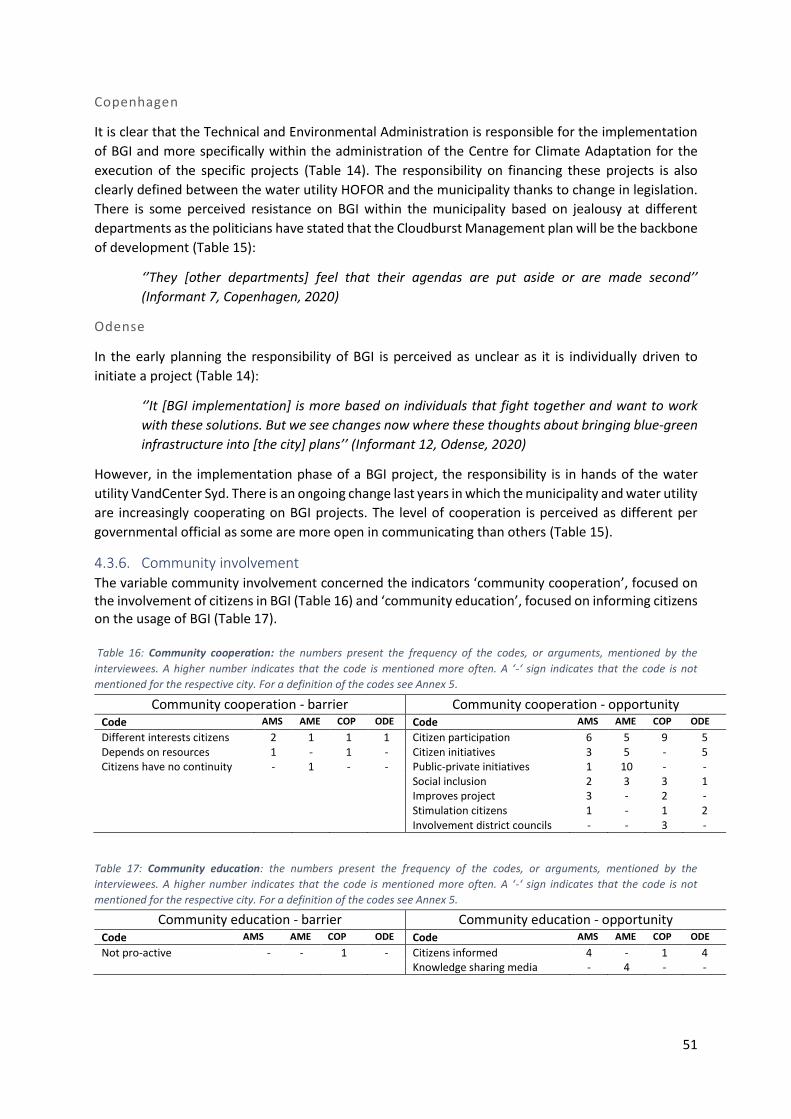
51
Copenhagen
It is clear that the Technical and Environmental Administration is responsible for the implementation
of BGI and more specifically within the administration of the Centre for Climate Adaptation for the
execution of the specific projects (Table 14). The responsibility on financing these projects is also
clearly defined between the water utility HOFOR and the municipality thanks to change in legislation.
There is some perceived resistance on BGI within the municipality based on jealousy at different
departments as the politicians have stated that the Cloudburst Management plan will be the backbone
of development (Table 15):
‘’They [other departments] feel that their agendas are put aside or are made second’’
(Informant 7, Copenhagen, 2020)
Odense
In the early planning the responsibility of BGI is perceived as unclear as it is individually driven to
initiate a project (Table 14):
‘’It [BGI implementation] is more based on individuals that fight together and want to work
with these solutions. But we see changes now where these thoughts about bringing blue-green
infrastructure into [the city] plans’’ (Informant 12, Odense, 2020)
However, in the implementation phase of a BGI project, the responsibility is in hands of the water
utility VandCenter Syd. There is an ongoing change last years in which the municipality and water utility
are increasingly cooperating on BGI projects. The level of cooperation is perceived as different per
governmental official as some are more open in communicating than others (Table 15).
4.3.6. Community involvement The variable community involvement concerned the indicators ‘community cooperation’, focused on the involvement of citizens in BGI (Table 16) and ‘community education’, focused on informing citizens on the usage of BGI (Table 17). Table 16: Community cooperation: the numbers present the frequency of the codes, or arguments, mentioned by the
interviewees. A higher number indicates that the code is mentioned more often. A ‘-‘ sign indicates that the code is not
mentioned for the respective city. For a definition of the codes see Annex 5.
Table 17: Community education: the numbers present the frequency of the codes, or arguments, mentioned by the
interviewees. A higher number indicates that the code is mentioned more often. A ‘-‘ sign indicates that the code is not
mentioned for the respective city. For a definition of the codes see Annex 5.
Community cooperation - barrier Community cooperation - opportunity Code AMS AME COP ODE Code AMS AME COP ODE Different interests citizens 2 1 1 1 Citizen participation 6 5 9 5
Depends on resources 1 - 1 - Citizen initiatives 3 5 - 5
Citizens have no continuity - 1 - - Public-private initiatives 1 10 - -
Social inclusion 2 3 3 1
Improves project 3 - 2 -
Stimulation citizens 1 - 1 2
Involvement district councils - - 3 -
Community education - barrier Community education - opportunity Code AMS AME COP ODE Code AMS AME COP ODE Not pro-active - - 1 - Citizens informed 4 - 1 4
Knowledge sharing media - 4 - -
52
Amsterdam
Amsterdam is active in the involvement of citizens in the projects, especially via Amsterdam Rainproof
which almost serves as a brand (Table 16). Via different information and consultation meetings, local
citizens can receive information on the projects and provide input (Table 17). The informants deemed
it important to include citizens in the process and explicitly say that the overall results of the project
are thereby improved (Table 16). It is noted that the involvement of citizens can be difficult due to
their different interests which makes it sometimes hard to meet all different wishes (Table 16).
Furthermore, citizens are actively stimulated to participate via knowledge sharing media such as
Amsterdamrainproof.nl (Table 17):
‘’Everyone is invited to place their projects on the map when you have done a Rainproof project,
this could be in your own garden or balcony (…), which serves as inspiration for new projects’’
(Informant 2, 2020)
Amersfoort
In Amersfoort, citizen participation is perceived as key (Table 16). Public-private initiatives such as
Operation Stonebreak (Dutch: Operatie Steenbreek) and Enjoy your Garden (Dutch: Lekker in je Tuin)
actively stimulate citizens to participate and create awareness among them. Citizens can receive advise
via rainwater coaches from the municipality. Although it is mentioned that citizens do not always
provide continuity as they move to another house, some projects are on self-initiative by homeowners
(Table 16). A clear example of a project that was initiated by citizens and was developed in
collaboration with the municipality is a renewed square in the De Ham neighbourhood (Box 4.4).
Copenhagen
Citizen participation is key in all projects and happens via consultation meetings where local
engagement is encouraged, which in general have a high level of involvement (Table 16). It is unique
in Copenhagen that there are special district councils that are appointed by local citizens (Table 16).
The district council communicates with the citizen in the local area and simultaneously with the
municipality, thereby serving as intermediate between the two parties and assuring that certain wishes
are met. Furthermore, citizens also help in maintaining the project after implementation:
‘’In citizen involvement, they really like the project, they also have a feeling it is their project
and they help us maintain the area’’ (Informant 8, Copenhagen, 2020)
Odense
The cooperation with the community is perceived as good as they understand the necessity of the
projects (Table 16). Due to the pilot project of Climate Ready Skibhus (Danish: Klimatklar Skibhus),
some citizens got excited about the project and were interested in having BGI in their street as well.
This participation makes it easier to implement BGI as it enhances collaboration for the
implementation :
‘’The citizens out there are thrilled (…) Because it [the BGI measures] are blue green [water
and nature]’’ (Informant 11, Odense, 2020)
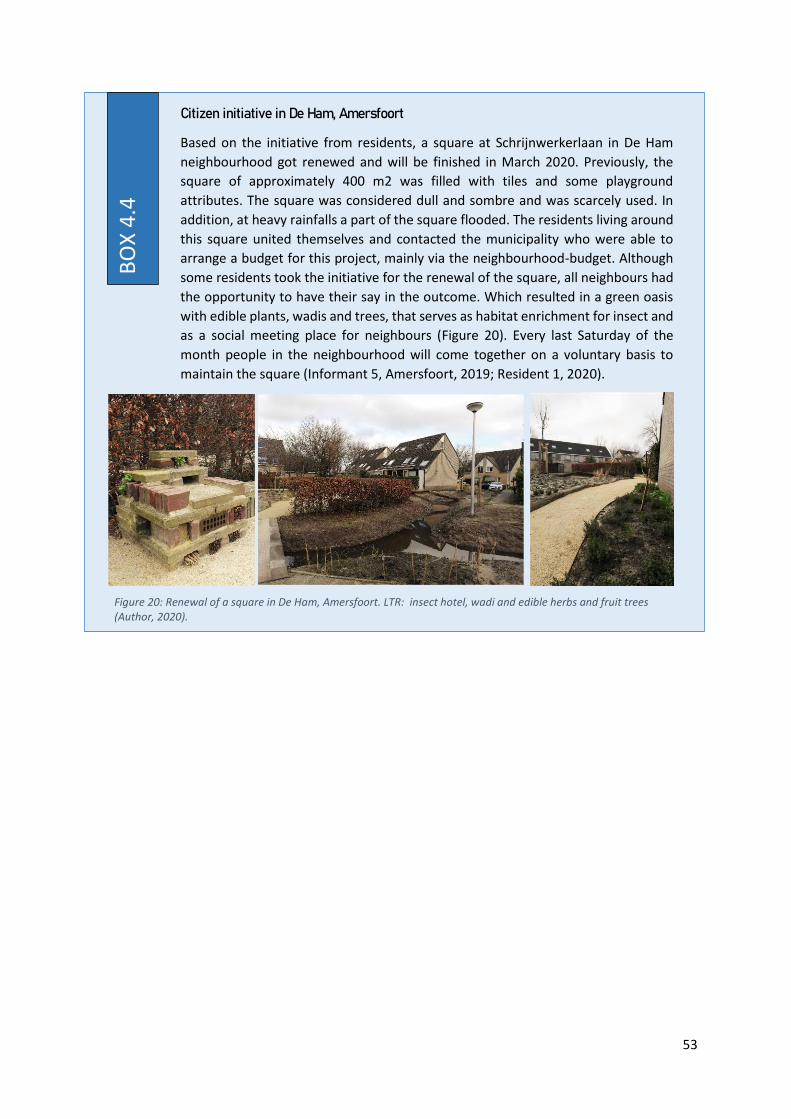
53
BO
X 4
.4
Based on the initiative from residents, a square at Schrijnwerkerlaan in De Ham
neighbourhood got renewed and will be finished in March 2020. Previously, the
square of approximately 400 m2 was filled with tiles and some playground
attributes. The square was considered dull and sombre and was scarcely used. In
addition, at heavy rainfalls a part of the square flooded. The residents living around
this square united themselves and contacted the municipality who were able to
arrange a budget for this project, mainly via the neighbourhood-budget. Although
some residents took the initiative for the renewal of the square, all neighbours had
the opportunity to have their say in the outcome. Which resulted in a green oasis
with edible plants, wadis and trees, that serves as habitat enrichment for insect and
as a social meeting place for neighbours (Figure 20). Every last Saturday of the
month people in the neighbourhood will come together on a voluntary basis to
maintain the square (Informant 5, Amersfoort, 2019; Resident 1, 2020).
Citizen initiative in De Ham, Amersfoort
Figure 20: Renewal of a square in De Ham, Amersfoort. LTR: insect hotel, wadi and edible herbs and fruit trees (Author, 2020).
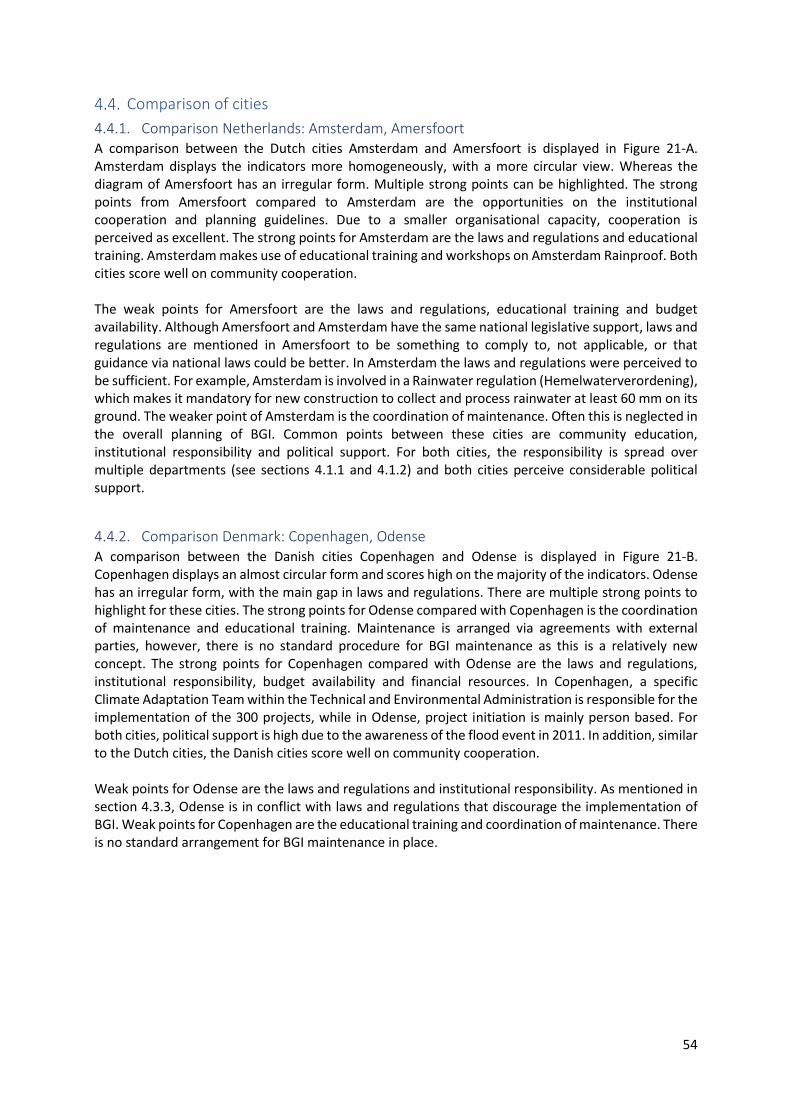
54
Comparison of cities
4.4.1. Comparison Netherlands: Amsterdam, Amersfoort A comparison between the Dutch cities Amsterdam and Amersfoort is displayed in Figure 21-A. Amsterdam displays the indicators more homogeneously, with a more circular view. Whereas the diagram of Amersfoort has an irregular form. Multiple strong points can be highlighted. The strong points from Amersfoort compared to Amsterdam are the opportunities on the institutional cooperation and planning guidelines. Due to a smaller organisational capacity, cooperation is perceived as excellent. The strong points for Amsterdam are the laws and regulations and educational training. Amsterdam makes use of educational training and workshops on Amsterdam Rainproof. Both cities score well on community cooperation. The weak points for Amersfoort are the laws and regulations, educational training and budget availability. Although Amersfoort and Amsterdam have the same national legislative support, laws and regulations are mentioned in Amersfoort to be something to comply to, not applicable, or that guidance via national laws could be better. In Amsterdam the laws and regulations were perceived to be sufficient. For example, Amsterdam is involved in a Rainwater regulation (Hemelwaterverordening), which makes it mandatory for new construction to collect and process rainwater at least 60 mm on its ground. The weaker point of Amsterdam is the coordination of maintenance. Often this is neglected in the overall planning of BGI. Common points between these cities are community education, institutional responsibility and political support. For both cities, the responsibility is spread over multiple departments (see sections 4.1.1 and 4.1.2) and both cities perceive considerable political support.
4.4.2. Comparison Denmark: Copenhagen, Odense A comparison between the Danish cities Copenhagen and Odense is displayed in Figure 21-B. Copenhagen displays an almost circular form and scores high on the majority of the indicators. Odense has an irregular form, with the main gap in laws and regulations. There are multiple strong points to highlight for these cities. The strong points for Odense compared with Copenhagen is the coordination of maintenance and educational training. Maintenance is arranged via agreements with external parties, however, there is no standard procedure for BGI maintenance as this is a relatively new concept. The strong points for Copenhagen compared with Odense are the laws and regulations, institutional responsibility, budget availability and financial resources. In Copenhagen, a specific Climate Adaptation Team within the Technical and Environmental Administration is responsible for the implementation of the 300 projects, while in Odense, project initiation is mainly person based. For both cities, political support is high due to the awareness of the flood event in 2011. In addition, similar to the Dutch cities, the Danish cities score well on community cooperation. Weak points for Odense are the laws and regulations and institutional responsibility. As mentioned in section 4.3.3, Odense is in conflict with laws and regulations that discourage the implementation of BGI. Weak points for Copenhagen are the educational training and coordination of maintenance. There is no standard arrangement for BGI maintenance in place.
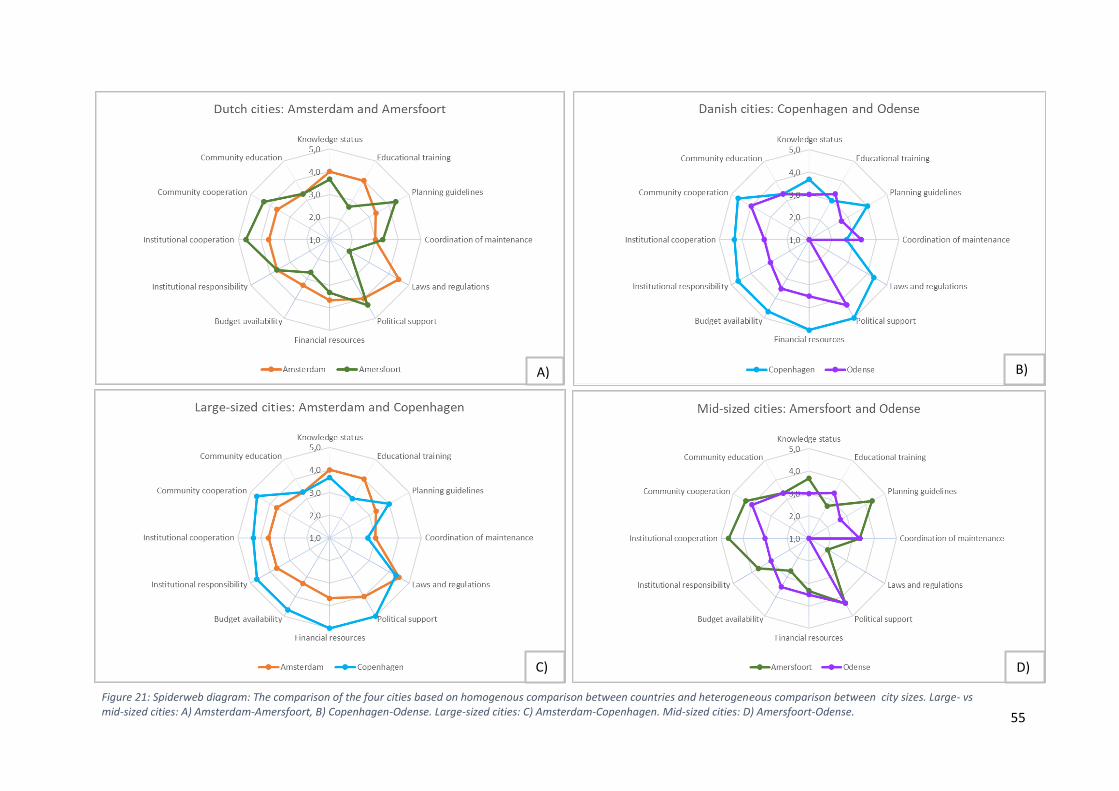
55
Figure 21: Spiderweb diagram: The comparison of the four cities based on homogenous comparison between countries and heterogeneous comparison between city sizes. Large- vs mid-sized cities: A) Amsterdam-Amersfoort, B) Copenhagen-Odense. Large-sized cities: C) Amsterdam-Copenhagen. Mid-sized cities: D) Amersfoort-Odense.
B) A)
C) D)
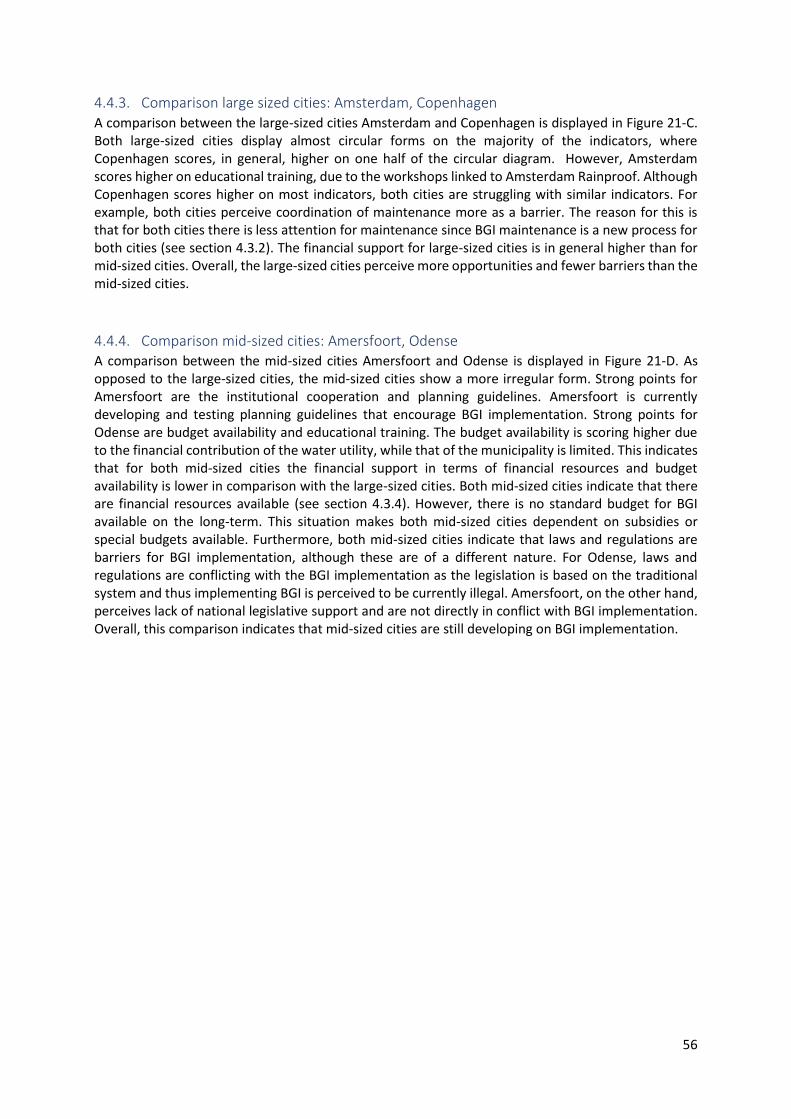
56
4.4.3. Comparison large sized cities: Amsterdam, Copenhagen A comparison between the large-sized cities Amsterdam and Copenhagen is displayed in Figure 21-C. Both large-sized cities display almost circular forms on the majority of the indicators, where Copenhagen scores, in general, higher on one half of the circular diagram. However, Amsterdam scores higher on educational training, due to the workshops linked to Amsterdam Rainproof. Although Copenhagen scores higher on most indicators, both cities are struggling with similar indicators. For example, both cities perceive coordination of maintenance more as a barrier. The reason for this is that for both cities there is less attention for maintenance since BGI maintenance is a new process for both cities (see section 4.3.2). The financial support for large-sized cities is in general higher than for mid-sized cities. Overall, the large-sized cities perceive more opportunities and fewer barriers than the mid-sized cities.
4.4.4. Comparison mid-sized cities: Amersfoort, Odense A comparison between the mid-sized cities Amersfoort and Odense is displayed in Figure 21-D. As opposed to the large-sized cities, the mid-sized cities show a more irregular form. Strong points for Amersfoort are the institutional cooperation and planning guidelines. Amersfoort is currently developing and testing planning guidelines that encourage BGI implementation. Strong points for Odense are budget availability and educational training. The budget availability is scoring higher due to the financial contribution of the water utility, while that of the municipality is limited. This indicates that for both mid-sized cities the financial support in terms of financial resources and budget availability is lower in comparison with the large-sized cities. Both mid-sized cities indicate that there are financial resources available (see section 4.3.4). However, there is no standard budget for BGI available on the long-term. This situation makes both mid-sized cities dependent on subsidies or special budgets available. Furthermore, both mid-sized cities indicate that laws and regulations are barriers for BGI implementation, although these are of a different nature. For Odense, laws and regulations are conflicting with the BGI implementation as the legislation is based on the traditional system and thus implementing BGI is perceived to be currently illegal. Amersfoort, on the other hand, perceives lack of national legislative support and are not directly in conflict with BGI implementation. Overall, this comparison indicates that mid-sized cities are still developing on BGI implementation.
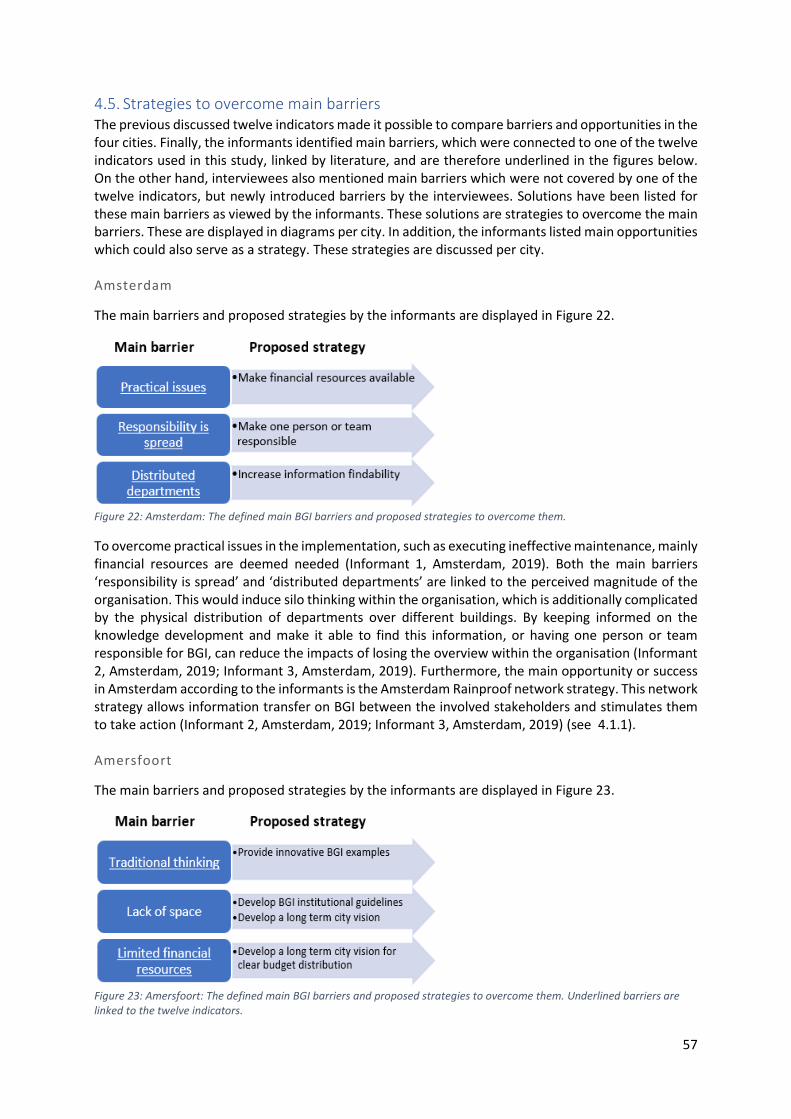
57
Strategies to overcome main barriers The previous discussed twelve indicators made it possible to compare barriers and opportunities in the four cities. Finally, the informants identified main barriers, which were connected to one of the twelve indicators used in this study, linked by literature, and are therefore underlined in the figures below. On the other hand, interviewees also mentioned main barriers which were not covered by one of the twelve indicators, but newly introduced barriers by the interviewees. Solutions have been listed for these main barriers as viewed by the informants. These solutions are strategies to overcome the main barriers. These are displayed in diagrams per city. In addition, the informants listed main opportunities which could also serve as a strategy. These strategies are discussed per city. Amsterdam
The main barriers and proposed strategies by the informants are displayed in Figure 22.
Figure 22: Amsterdam: The defined main BGI barriers and proposed strategies to overcome them.
To overcome practical issues in the implementation, such as executing ineffective maintenance, mainly financial resources are deemed needed (Informant 1, Amsterdam, 2019). Both the main barriers ‘responsibility is spread’ and ‘distributed departments’ are linked to the perceived magnitude of the organisation. This would induce silo thinking within the organisation, which is additionally complicated by the physical distribution of departments over different buildings. By keeping informed on the knowledge development and make it able to find this information, or having one person or team responsible for BGI, can reduce the impacts of losing the overview within the organisation (Informant 2, Amsterdam, 2019; Informant 3, Amsterdam, 2019). Furthermore, the main opportunity or success in Amsterdam according to the informants is the Amsterdam Rainproof network strategy. This network strategy allows information transfer on BGI between the involved stakeholders and stimulates them to take action (Informant 2, Amsterdam, 2019; Informant 3, Amsterdam, 2019) (see 4.1.1). Amersfoort
The main barriers and proposed strategies by the informants are displayed in Figure 23.
Figure 23: Amersfoort: The defined main BGI barriers and proposed strategies to overcome them. Underlined barriers are linked to the twelve indicators.
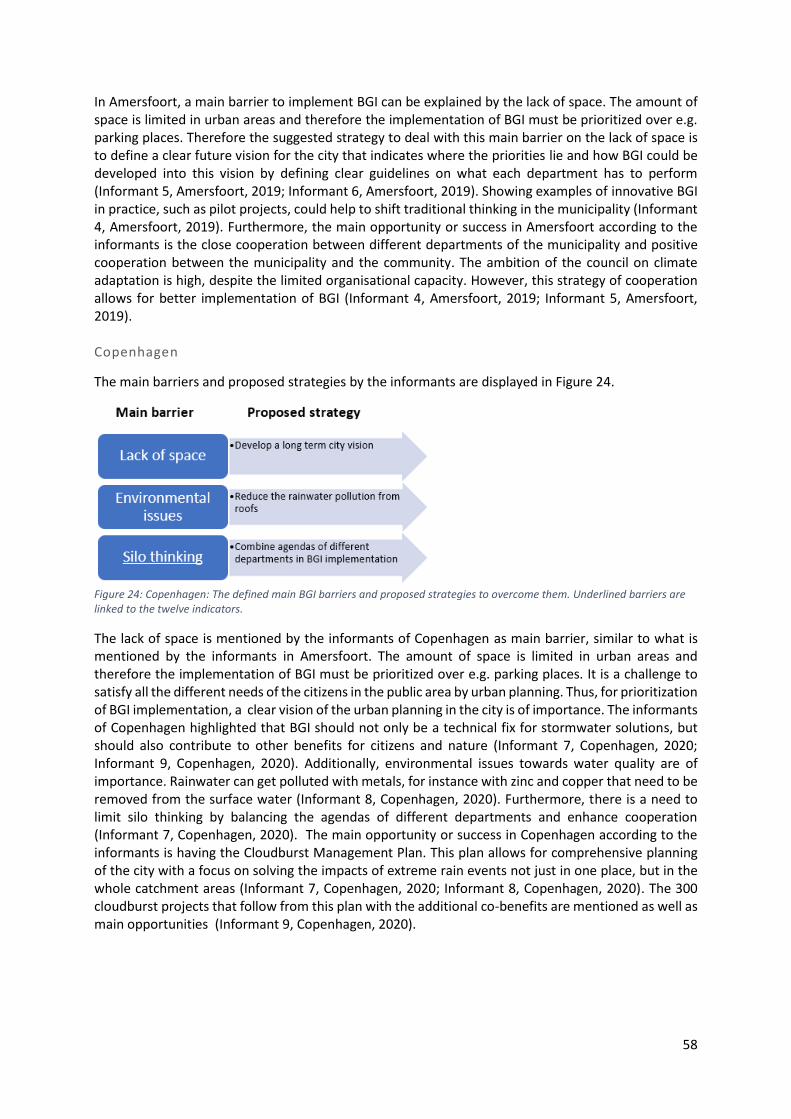
58
In Amersfoort, a main barrier to implement BGI can be explained by the lack of space. The amount of space is limited in urban areas and therefore the implementation of BGI must be prioritized over e.g. parking places. Therefore the suggested strategy to deal with this main barrier on the lack of space is to define a clear future vision for the city that indicates where the priorities lie and how BGI could be developed into this vision by defining clear guidelines on what each department has to perform (Informant 5, Amersfoort, 2019; Informant 6, Amersfoort, 2019). Showing examples of innovative BGI in practice, such as pilot projects, could help to shift traditional thinking in the municipality (Informant 4, Amersfoort, 2019). Furthermore, the main opportunity or success in Amersfoort according to the informants is the close cooperation between different departments of the municipality and positive cooperation between the municipality and the community. The ambition of the council on climate adaptation is high, despite the limited organisational capacity. However, this strategy of cooperation allows for better implementation of BGI (Informant 4, Amersfoort, 2019; Informant 5, Amersfoort, 2019). Copenhagen
The main barriers and proposed strategies by the informants are displayed in Figure 24.
Figure 24: Copenhagen: The defined main BGI barriers and proposed strategies to overcome them. Underlined barriers are linked to the twelve indicators.
The lack of space is mentioned by the informants of Copenhagen as main barrier, similar to what is mentioned by the informants in Amersfoort. The amount of space is limited in urban areas and therefore the implementation of BGI must be prioritized over e.g. parking places. It is a challenge to satisfy all the different needs of the citizens in the public area by urban planning. Thus, for prioritization of BGI implementation, a clear vision of the urban planning in the city is of importance. The informants of Copenhagen highlighted that BGI should not only be a technical fix for stormwater solutions, but should also contribute to other benefits for citizens and nature (Informant 7, Copenhagen, 2020; Informant 9, Copenhagen, 2020). Additionally, environmental issues towards water quality are of importance. Rainwater can get polluted with metals, for instance with zinc and copper that need to be removed from the surface water (Informant 8, Copenhagen, 2020). Furthermore, there is a need to limit silo thinking by balancing the agendas of different departments and enhance cooperation (Informant 7, Copenhagen, 2020). The main opportunity or success in Copenhagen according to the informants is having the Cloudburst Management Plan. This plan allows for comprehensive planning of the city with a focus on solving the impacts of extreme rain events not just in one place, but in the whole catchment areas (Informant 7, Copenhagen, 2020; Informant 8, Copenhagen, 2020). The 300 cloudburst projects that follow from this plan with the additional co-benefits are mentioned as well as main opportunities (Informant 9, Copenhagen, 2020).
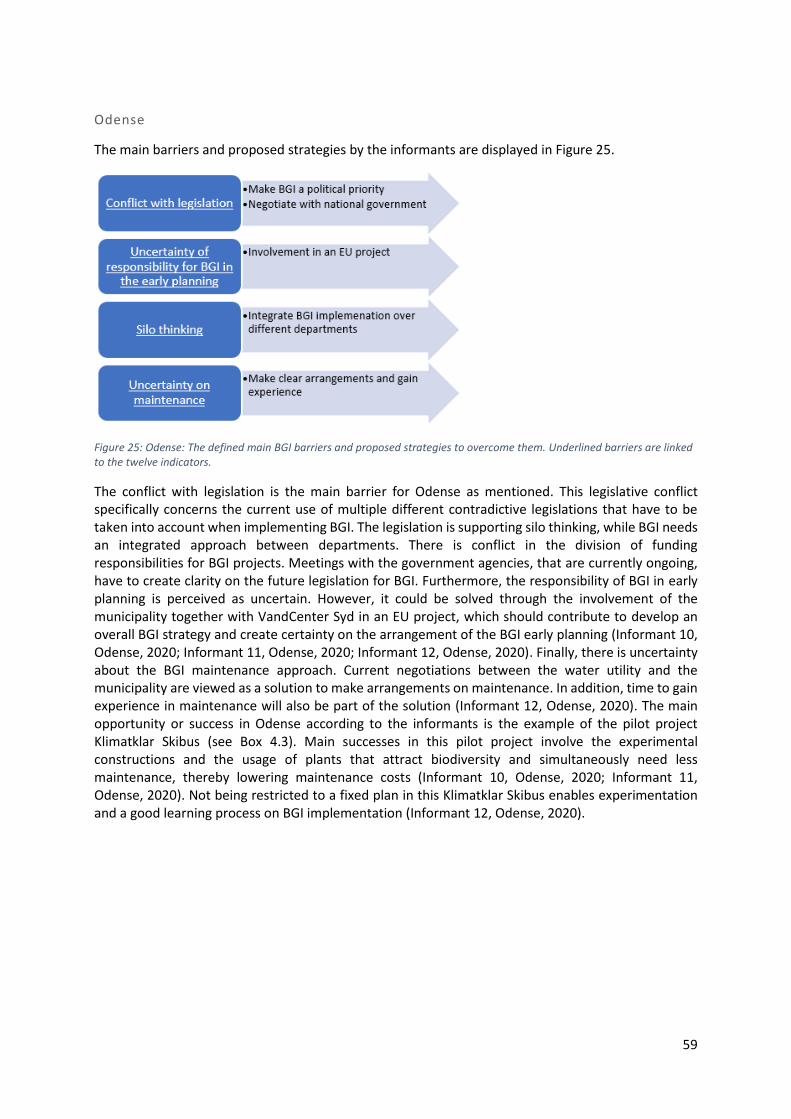
59
Odense
The main barriers and proposed strategies by the informants are displayed in Figure 25.
Figure 25: Odense: The defined main BGI barriers and proposed strategies to overcome them. Underlined barriers are linked to the twelve indicators.
The conflict with legislation is the main barrier for Odense as mentioned. This legislative conflict specifically concerns the current use of multiple different contradictive legislations that have to be taken into account when implementing BGI. The legislation is supporting silo thinking, while BGI needs an integrated approach between departments. There is conflict in the division of funding responsibilities for BGI projects. Meetings with the government agencies, that are currently ongoing, have to create clarity on the future legislation for BGI. Furthermore, the responsibility of BGI in early planning is perceived as uncertain. However, it could be solved through the involvement of the municipality together with VandCenter Syd in an EU project, which should contribute to develop an overall BGI strategy and create certainty on the arrangement of the BGI early planning (Informant 10, Odense, 2020; Informant 11, Odense, 2020; Informant 12, Odense, 2020). Finally, there is uncertainty about the BGI maintenance approach. Current negotiations between the water utility and the municipality are viewed as a solution to make arrangements on maintenance. In addition, time to gain experience in maintenance will also be part of the solution (Informant 12, Odense, 2020). The main opportunity or success in Odense according to the informants is the example of the pilot project Klimatklar Skibus (see Box 4.3). Main successes in this pilot project involve the experimental constructions and the usage of plants that attract biodiversity and simultaneously need less maintenance, thereby lowering maintenance costs (Informant 10, Odense, 2020; Informant 11, Odense, 2020). Not being restricted to a fixed plan in this Klimatklar Skibus enables experimentation and a good learning process on BGI implementation (Informant 12, Odense, 2020).
60
Chapter 5: Discussion This chapter discusses the main results and the relevance and limitations of this study.
Organization and management of BGI The implementation process of Blue-Green Infrastructure (BGI) involves cooperation between multiple departments in the municipality that are related to the urban planning of public space. Multiple studies indicate that the traditional urban water regime is characterized by a centralized and non-integrated organisation, whereas BGI management in Sustainable Urban Stormwater Management (SUSWM) requires an integrated organisation over different sectors (Dai et al., 2018; Dhakal & Chevalier, 2016; S. J. V. D. Meene & Brown, 2009; Wihlborg et al., 2019). Each of the four cities studied here has a different organisation and management approach towards BGI. In the Netherlands, BGI is interlinked over different departments. In Amsterdam, BGI organized among different departments within the municipality, whereas in Amersfoort, the organisational structure has an integrated departmental approach. In Denmark, BGI is organised within one administrative unit. In Copenhagen, the Technical and Environmental Administration is responsible, consisting of multiple departments. One of these departments is the Centre for Climate Adaptation which includes practitioners with different backgrounds that stimulates integration of different sectors. In Odense, BGI is organised in the Department of Urban Development. In addition, the organisational capacity of the mid-sized cities in comparison with the large-sized cities is lower. These findings show that in all cities, BGI is organised in an integrated manner. However, to what extend this is integrated differs per city. Although there are differences in the organisation of BGI evident between the cities, cooperation with the water utility is of importance to all four municipalities. The municipalities cooperate with water utilities on the implementation of BGI. All cities receive financial support from water utilities for BGI implementation, though the level of cooperation differs per city. In the large-sized cities, the water utility is actively involved in the implementation process. In Odense the water utility has until recently been the main initiator of BGI projects and in Amersfoort the water utility is involved in the negotiations on climate adaptation with the municipality. BGI implementation is therefore a joint effort in the city planning. With respect to BGI management, all cities aim to have BGI integrated as a standard stormwater management approach (i.e. embedded in existing procedures) in their urban planning. The inclusion of BGI in the whole planning process is essential for the utilization of BGI (Wihlborg et al., 2019). Moreover, according to Van Hattum (2016), cities should shift their perspective and use adaptation measures, such as BGI, as an opportunity to create a sustainable, liveable and resilient city. Additional programs to the standard urban planning have been developed in the large-sized cities: “Amsterdam Rainproof” in Amsterdam and “The Cloudburst Management Plan” in Copenhagen. These programs create awareness and stimulate the implementation of BGI by prioritizing it and integrating BGI into existing projects (e.g. through nature inclusive construction) or as newly developed projects. The aim of Amsterdam Rainproof is to get this program integrated within the standard urban planning process, thereby combining spatial planning with water management, which is essential for climate change adaptation (Hurlimann & Wilson, 2018). The development of these programs show that large-sized cities are making progress towards the normalization of BGI implementation in urban planning.
Drivers for BGI implementation The results of this study have shown that the main driver to implement BGI is climate change, as BGI is a tool to cope with stormwater and future extreme precipitation events. This creates more urban resilience in cities. Additionally, many co-benefits have been identified in this study as drivers for BGI implementation. While climate change is addressed as a need, the many co-benefits are important drivers to implement BGI over the expansion of the traditional pipe-system. The purpose of these
61
measures is to develop BGI solutions that cope with stormwater in times of extreme precipitation events and simultaneously have other functions (e.g. recreation) in times of dry periods. This multifunctionality of BGI is confirmed by Liao et al. (2017), who studied different BGI measures. Co-benefits that were mainly mentioned by all informants were an increase in liveability, urban green (nature) and biodiversity. Thus, the results of this study suggest that awareness of the co-benefits of BGI stimulate its implementation.
Barriers and opportunities This study identified twelve indicators which could either be perceived by the informants as a barrier, which currently inhibits BGI implementation, or an opportunity, which stimulates BGI implementation. Firstly, a homogenous comparison on the country level between The Netherlands (Amsterdam and Amersfoort) and Denmark (Copenhagen and Odense) was performed. The informants of all four cities perceived community cooperation and political support as strong opportunities. Mguni et al. (2015), who studied Dar es Salaam and Copenhagen as case studies, explain that cooperation with the community on the implementation of adaptive measures such as BGI, play a significant part in the planning process. This cooperation could either be effective in a bottom-up approach as was used in Dar es Salaam, or via a top-down approach as was used in Copenhagen. Both approaches are deemed to be promising (Mguni et al., 2015). Politicians can obstruct and block implementation of BGI or support an increase in the implementation of BGI (Wihlborg et al., 2019). Political support is therefore important to influencing urban stormwater management as politicians need to balance different interest concerning the development of urban areas. Secondly, a heterogeneous comparison between the countries based on city sizes with large-sized cities (Amsterdam and Copenhagen) and mid-sized cities (Amersfoort and Odense) was performed, which showed differences in maintenance, laws and regulations and financial support. Overall the large-sized cities have more opportunities and fewer barriers than the mid-sized cities according to the informants. When comparing the large-sized cities it is noticeable that Copenhagen scored higher on most of the twelve indicators compared to Amsterdam. A reason for this could be related to the flood event in Copenhagen of 2011. According to a study by Johnson et al. (2005) on historical flooding, the potential for flood disasters to act as a catalyst for quick policy reaction is well recognized. A severe flood event with damaging impacts places a fitting response on the political agenda, so that political inaction is deemed unacceptable (Johnson et al., 2005). The flood of 2011 in Copenhagen caused severe damage and raised awareness among politicians and citizens about such a disaster. Due to climate change, the frequency and intensity of such events are expected to increase in the future. This awareness led to direct action and the development of the Cloudburst Management Plan in Copenhagen to anticipate future events (The City of Copenhagen, 2012). Amsterdam scores relatively high on the indicators as well, as the 2011 case in Copenhagen also increased awareness in Amsterdam with accompanied actions. Thus, we here observe that in large-sized cities, political awareness has played an important role in BGI implementation. Furthermore, both large-sized cities perceive coordination of BGI maintenance as a barrier because it is perceived as a new process. Maintenance difficulties are also acknowledged in other studies. Li et al. (2017) explain that requirements for maintenance differ per measure, function and local conditions. These would range from simpler tasks like weeding or removing debris, to more complex tasks as maintaining large-scale measures. Ensuring proper maintenance with continuity for a longer term is therefore a challenge (Li et al., 2017). In contrast to large-sized cities, in mid-sized cities, the informants perceive laws and regulations as a barrier. Mainly the informants in Odense indicated there was a conflict with national legislation, which inhibits the implementation of BGI. Although in Amersfoort laws and regulations were also perceived as a barrier, this does not refer to conflict with national law, but limited national legislative support.
62
Interestingly, both large-sized cities did not perceive conflict with the legislation despite having to conform to the same national legislation as the respective mid-sized cities. In Denmark, Copenhagen did not perceive laws and regulations as a barrier, though being exposed to the same national legislation as Odense. A reason for this, as mentioned by Wejs et al. (2014), could be that the Danish national incentives on climate change adaptation are weak and actions are dependent on local factors and institutional capacity rather than central government requirements. There is a Danish national adaptation policy available that does not impose strong binding demands on municipalities, which allows for free interpretation and choice (Wejs et al., 2014). This could explain the perceived differences in the Danish cities, as in Odense the initiative to create BGI depends on individual actions (i.e. person base), while in Copenhagen the event of 2011 in combination with a higher capacity was able to already implement BGI measures. Another reason, mentioned by Feilberg and Mark (2016), could be that the barriers around legislation are mainly related to the financing of BGI. The problem lies in the uncertainty of the distinction between what aspects of BGI are funded by the water fee via water utilities and what aspects are funded by municipal taxes (Feilberg & Mark, 2016). This problem has also been mentioned by the informants in Odense. However, for Copenhagen, there has been a legislative change in the past which allowed the water utility HOFOR to invest in BGI measures. In order to develop clear national legislation on BGI, Copenhagen and Odense, as well as other Danish municipalities, are in dialogue with the national government regarding legislative change. Copenhagen aims to influence legislative change by sharing their BGI implementation experience to date to be an example of how local governments can incentivise the uptake of BGI (Brears, 2018). Thus, action is being taken to overcome the barrier of conflicting and unclear laws and regulations. In the Netherlands, the informants in Amersfoort indicated laws and regulations as a barrier due to limited national legislative support. In Amsterdam laws and regulations were perceived to be sufficient, among others due to the Rainwater Regulation (Dutch: Hemelwaterverordening). In the Netherlands in general, there is more flexibility for municipalities and water utilities to adopt a wide range of policy instruments to deal with climate change adaptation (Dai et al., 2018). However, national legislation is changing as the national government of the Netherlands has developed the Environment Act (Dutch: Omgevingswet), to simplify and merge regulations on urban planning, environmental management and water management (Dai et al., 2018; Rijksoverheid, 2013). This act could reduce the perceived lack of support on laws and regulations on BGI implementation by mid-sized cities in the Netherlands. Furthermore, mid-sized cities perceive less financial support than large-sized cities. The financial support for the large-sized cities is not only higher in absolute terms as the cities are larger, but it is also perceived to be more supportive. Both mid-sized cities indicate they have sufficient financial resources available, however, there is a high dependence on subsidies or special budgets as there is no standard budget for BGI available on the long-term. A reason for this, compared to the large-sized cities, could be that the large-sized cities receive budget via their additional programs of Amsterdam Rainproof or the Cloudburst Management Plan.
Strategies to overcome identified barriers The informants were also asked to identify strategies to overcome the mentioned barriers. To overcome the barriers of maintenance, informants proposed to make clear arrangements and gain experience over time. A strategy to overcome limited financial support is the development of a long term vision, referring to the question of how to satisfy all different needs of the municipality and from the citizens in the public area. A politically approved long-term vision (such as the Cloudburst Management Plan) makes it easier to argue for the required budget. Negotiations with the national government are required to amend regulatory policies as one of the main barrier of conflict with the local laws.
63
Other proposed strategies to overcome the barriers are learning from the successes of each city. In Amsterdam, the Amsterdam Rainproof network strategy is proposed as a main success. In Amersfoort, cooperation with the community and institutions are perceived as a main success. For Copenhagen, the development of a long term city plan for SUSWM, the Cloudburst Management Plan, allows for the development and implementation of 300 BGI projects. In Odense, the main success is in the development of the pilot project Klimatklar Skibhus which allows for BGI experimentation. The proposed strategies can overcome the main barriers identified and function as an example to other municipalities so the implementation of BGI can be enhanced. Experimentation and learning from implemented BGI projects was therefore perceived to be useful. This experimentation can be found in other cities. The study of Li et al (2017) on sponge city programs (i.e. sustainable urban development on flood control and water quality), used 30 pilot cities in China for the implementation of BGI measures. They conclude that although the pilot cities still perceived challenges, they perceive important opportunities by exploring the development of a safe, green and holistic urban living (Li et al., 2017).
Implementing Blue-Green-Infrastructure in large and mid-sized cities The general opinion is that a regime shift from a traditional pipe-bound system toward a BGI-based SUSWM is possible by mainstreaming it in the reconstruction of urban areas or the development of new urban areas. The study of Wihlborg et al. (2019), that identified barriers and drivers in the implementation of BGI in Sweden, found similar results that BGI has to be adopted in the standard stormwater management and urban development. Thus, BGI should become the new standard in stormwater management, either by integrating it in the traditional urban planning or by additional programs as has been done in Amsterdam and Copenhagen. These programs open up to the benefits of a network strategy (Amsterdam Rainproof) or the benefit of a clear strategy to develop a city-wide stormwater plan (Cloudburst Management Plan) and stimulate the implementation of BGI. Large-sized cities in the Netherlands and Denmark perceive more opportunities and fewer barriers in implementing BGI than mid-sized cities. In this study, mid-sized and large-sized cities perceive different barriers. The origin in difficulties in mid-sized cities lies in the fewer resources available, limited organisational capacity and lack of legislative support. The latter discourages the uptake of BGI implementation, however, legal support is essential for local government institutions to make BGI part of their stormwater management and include them in their standard urban planning. Simultaneously, the strengths of mid-sized cities are the cooperation with the community, which could be useful to compensate for the limited organisational capacity. The research findings from Wihlborg et al. (2019) mention that organisational capacity can be increased by strengthening capacity building among citizens via the facilitation of dialogues with homeowners on the potentials and benefits of BGI. Increased understanding of the problem could enhance BGI implementations on private land (Wihlborg et al., 2019). As example, Amersfoort is already facilitating these dialogues with citizens by use of Rainwater coaches (i.e. experts), which is perceived to be successful. Enhancing community cooperation could increase bottom-up initiatives and result in common approaches to achieve an integrated approach for SUSWM.
Relevance and limitation of this study This study proposed a way to assess BGI implementation by comparing twelve indicators in four case studies and analyse a homogenous comparison between countries and a heterogeneous comparison between large-sized and mid-sized cities. This study provides essential insights for SUSWM decisions. By understanding the barriers and how to overcome them in different cities, as well as learning from the opportunities in the different cities, the transition toward SUSWM can be improved using BGI. This study proposed visualization of information of the perceived barriers and opportunities of these cities through spiderweb diagrams, allowing easier comparison between the cities. In addition, results show which of the barriers and opportunities reported from other city-studies in literature apply to the
64
selected case-study cities, but also revealed new barriers and opportunities. This study is of interest for the BGI policy direction for the Netherlands and Denmark as well as for other cities that have the ambition to adopt BGI measures in SUSWM. Therefore, the methodology in this study can be used or further developed to make comparisons on BGI implementation with other cities.
In this study, some limitations apply. Firstly, the selected twelve indicators of possible barriers and opportunities were selected from literature review and scored by the interviewees, however, it was not asked from the interviewees to weight the importance of the different indicators. This weighting would have provided insights on the importance of the different barriers and opportunities perceived and learn more about which of these would have been most pressing. Inclusion of weight values of the indicators could have improved the outcome of the study by creating a focus on the most important values to enhance implementation of BGI in SUSWM. Secondly, this study is limited to only three respondents in each city, while an increase in the number of interviewees per city would have increased the validity of this study. This limitation has consequences for the results as scoring of the codes was based on how often the code was mentioned by the interviewees, which allowed for a bias towards the most talkative person. However, this approach made it possible to present which argumentation was perceived as most important in each city. Furthermore, the limitation has consequences for the indicator values in the spider-web diagram, which is based on the average rating in the Likert-scale of three informants per city. Additionally, in some cases, indicators were perceived by interviewees to be irrelevant and therefore perceived no score applicable for that interviewee for that specific indicator. Thus, the scoring on the Likert scale for the development of the spiderweb diagrams is limited in accuracy. However, the main benefit of the spider-web diagram is that it allowed a relatively easy comparison between the cities by providing a clear overview of the interviewees per city. Therefore, it is suggested to further investigate the possibilities for spiderweb diagrams in comparative studies on BGI implementation through survey research with a larger group of informants. Finally, there is a limitation in language barriers as the results might have been influenced by the Danish and English language barrier. Policy documents, mainly for Odense, were found in Danish, which was perceived as a barrier. In addition, both the Danish interviewees as the Dutch interviewer were not expressing themselves in their native language which might influence the outcome of the study.
65
Chapter 6: Conclusions and recommendations Conclusions
This study analysed the perceptions of practitioners involved in the implementation of Blue-Green Infrastructure (BGI) in Amsterdam, Amersfoort, Copenhagen and Odense on their perceived drivers, barriers, opportunities and strategies. This study shows that there are commonalities on the perceived drivers and opportunities between the cities and to implement BGI in Sustainable Urban Stormwater Management. All informants indicated that climate change is the main driver to implement BGI and all identified multiple drivers as co-benefits of BGI. This would allow cities to cope with stormwater in times of extreme precipitation events and simultaneously have other functions in times of dry periods. In addition, in all four cities, the informants perceived community cooperation and political support as an opportunity that stimulates BGI implementation. Furthermore, this study shows that there are differences in perceived barriers in the implementation of BGI in large-sized cities (Amsterdam and Copenhagen) and mid-sized cities (Amersfoort and Odense). Large-sized cities perceive more opportunities and fewer barriers, however, are perceiving difficulties in the new maintenance process of BGI. Mid-sized cities perceived financial resources and laws and regulations as barriers. The origin of these barriers lies in the limited resources available, limited organisational capacity and lack of legislative support. Proposed strategies for mid-sized cities are to extend their capacity by close cooperation with their community and water utilities. The aim for the municipalities in the four cities is to make BGI the new standard for stormwater management in the urban planning in an integrated organisation and ensure that it is always taken into account in new urban development which is in the large-sized cities enhanced by additional programs to the urban planning. The general opinion is that a regime shift from a traditional pipe-bound system toward a BGI-based SUSWM is possible by mainstreaming it in the reconstruction of urban areas or in the development of new urban areas. Additionally, the experimentation and learning from implemented BGI projects in the four cities are perceived to be useful. This led to successes in the four cities, which could inform other cities in developing strategies to implement BGI:
• Develop a long term city plan: by investigating where the priorities of the municipality lie, the more understandable it is to make investments in public space (e.g. the trade-off on parking places or street gardens)
• Invest in a network strategy: rainwater falls on public and private space, therefore, it is important to activate involved parties and create one clear goal of SUSWM for all stakeholders.
• Cooperate with the community: community participation is essential in further adoption of BGI and can even lead to community maintenance which can result in lowered maintenance costs.
• Present examples of pilot projects: by providing examples of implemented BGI, politicians and practitioners within the municipality can learn and become stimulated to overcome traditional thinking.
In conclusion, cities have the ability to shift from the traditional pip-bound system to a more SUSWM approach and use BGI as a tool to enhance this shift. However, barriers need to be overcome and opportunities should be utilized. Learning from other cities in their challenges and successes could enhance the implementation of BGI. Using BGI not only as a tool to combat the risks of climate change, but also as a tool that leads to new opportunities to create sustainable, liveable and resilient cities.

66
Recommendations and future research This study has presented that each city is different in their BGI implementation. Therefore, a few
recommendations are presented for municipalities to enhance implementation of BGI.
• For municipalities that have the ambition to implement BGI, but have limited organisational and financial capacities, it is recommended to have more attention on citizen cooperation by strengthening capacity building among citizens. The municipalities can take a facilitating position and facilitate dialogues with homeowners on BGI benefits as this could enhance the uptake of BGI measures on private areas.
• To municipalities, it is recommended to use an institutional network strategy to combine all involved parties in BGI implementation and thereby create a platform by which knowledge and information can be shared. This could enhance the uptake of BGI measures in urban areas and create awareness on SUSWM.
• It is recommended to explore the possibilities of efficient maintenance. Ensuring proper maintenance with continuity for a longer term is a challenge for a new process as BGI. However, maintenance is an important element in BGI functioning. Even stimulation of maintenance can be reached via citizen participation and even thereby reducing maintenance costs.
• Future research on transitional governance is needed. By implementing BGI as the new standard, a specific approach to incorporate this in the current system is needed. Thereby making it clear which departments are responsible and how cooperation should proceed in an integrated way.
• Future research on perceived lack of support in laws and regulations on BGI in mid-sized cities in comparison with large-sized cities is recommended to overcome this barrier.
• Future research on small-sized cities with inhabitants below 100.000 is recommended to develop a complete overview of the barriers and opportunities in cities of different sizes in the implementation of BGI.
67
References Amsterdam Rainproof. (n.d.-a). Amsterdam Rainproof magazine. Amsterdam Rainproof. Retrieved 8
January 2020, from https://www.rainproof.nl/sites/default/files/rainproof-magazine-lr2-
spreads.pdf
Amsterdam Rainproof. (n.d.-b). Wolkbreuk 28 juli. Retrieved 18 April 2020, from
https://www.rainproof.nl/wolkbreuk-28-juli
Backhaus, A., & Fryd, O. (2013). The aesthetic performance of urban landscape-based stormwater
management systems: A review of twenty projects in Northern Europe. Journal of Landscape
Architecture, 8(2), 52–63. https://doi.org/10.1080/18626033.2013.864130
Braskerud, B. C., Azhar, S., Barkved, L. J., de Bruin, K., Christiansen, A. F., Fleig, A., Isager, E. B.,
Iversen, H., Kristensen, K., Li, H., Seifert-Dähnn, I., Skaugen, T., Sjødahl, E. U., & Volden, E. P.
(2019). Hver dråpe teller—Blågrønn infrastruktur i byer. Eksempler på tiltak basert på
studietur til Amsterdam og Rotterdam. Norsk Insitutt for Vannforskning.
https://niva.brage.unit.no/niva-xmlui/handle/11250/2601016
Braun, V., & Clarke, V. (2006). Using thematic analysis in psychology. Qualitative Research in
Psychology, 3(2), 77–101. https://doi.org/10.1191/1478088706qp063oa
Brears, R. C. (2018). Copenhagen Becoming a Blue-Green City. In R. C. Brears (Ed.), Blue and Green
Cities: The Role of Blue-Green Infrastructure in Managing Urban Water Resources (pp. 99–
126). Palgrave Macmillan UK. https://doi.org/10.1057/978-1-137-59258-3_4
Brown, R. R., & Farrelly, M. A. (2009). Delivering sustainable urban water management: A review of
the hurdles we face. Water Science and Technology, 59(5), 839–846.
https://doi.org/10.2166/wst.2009.028
Byråd, O. (2015). Politisk hovedorganisationsplan. 1.
Cettner, A., Ashley, R., Viklander, M., & Nilsson, K. (2013). Stormwater management and urban
planning: Lessons from 40 years of innovation. Journal of Environmental Planning and
Management, 56(6), 786–801. https://doi.org/10.1080/09640568.2012.706216
Climate Data. (n.d.). Klimaat data voor steden wereldwijd—Climate-Data.org. Retrieved 19 March
2020, from https://nl.climate-data.org/
Dai, L., Wörner, R., & van Rijswick, H. F. M. W. (2018). Rainproof cities in the Netherlands:
Approaches in Dutch water governance to climate-adaptive urban planning. International
Journal of Water Resources Development, 34(4), 652–674.
https://doi.org/10.1080/07900627.2017.1372273
Dhakal, K. P., & Chevalier, L. R. (2016). Urban Stormwater Governance: The Need for a Paradigm
Shift. Environmental Management, 57(5), 1112–1124. https://doi.org/10.1007/s00267-016-
0667-5
Dhakal, K. P., & Chevalier, L. R. (2017). Managing urban stormwater for urban sustainability: Barriers
and policy solutions for green infrastructure application. Journal of Environmental
Management, 203, 171–181. https://doi.org/10.1016/j.jenvman.2017.07.065
Dixon, J. L., Stringer, L. C., & Challinor, A. J. (2014). Farming System Evolution and Adaptive Capacity:
Insights for Adaptation Support. Resources, 3(1), 182–214.
https://doi.org/10.3390/resources3010182
Feilberg, M., & Mark, O. (2016). Integrated Urban Water Management: Improve Efficient Water
Management and Climate Change Resilience in Cities. In T. Younos & T. E. Parece (Eds.),
68
Sustainable Water Management in Urban Environments (pp. 1–32). Springer International
Publishing. https://doi.org/10.1007/978-3-319-29337-0_1
Fletcher, T. D., Shuster, W., Hunt, W. F., Ashley, R., Butler, D., Arthur, S., Trowsdale, S., Barraud, S.,
Semadeni-Davies, A., Bertrand-Krajewski, J.-L., Mikkelsen, P. S., Rivard, G., Uhl, M., Dagenais,
D., & Viklander, M. (2015). SUDS, LID, BMPs, WSUD and more – The evolution and
application of terminology surrounding urban drainage. Urban Water Journal, 12(7), 525–
542. https://doi.org/10.1080/1573062X.2014.916314
Friese, S., Soratto, J., & Pires, D. (2018). Carrying out a computer-aided thematic content analysis
with ATLAS.ti. https://www.mmg.mpg.de/62130/wp-18-02
Geels, F. W. (2002). Technological transitions as evolutionary reconfiguration processes: A multi-level
perspective and a case-study. Research Policy, 31(8), 1257–1274.
https://doi.org/10.1016/S0048-7333(02)00062-8
Gemeente Amersfoort. (2018a, July 4). Werken bij Amersfoort [Webpagina].
http://www.amersfoort.nl/bestuur-en-organisatie/vacatures-3.htm
Gemeente Amersfoort. (2018b, October 22). Duurzame maatregelen nodig door klimaatverandering
[Webpagina]. http://www.amersfoort.nl/bericht/duurzame-maatregelen-nodig-door-
klimaatverandering.htm
Gemeente Amersfoort. (2019a). Deelprogramma Uitvoering Groenvisie 2019-2022 def.pdf.
Gemeente Amersfoort. (2019b). Raadsinformatiebrief Klimaatbestendige Stad.pdf.
Gemeente Amersfoort. (2019c, April 11). Advies over regenwater opvangen in eigen tuin
[Webpagina]. http://www.amersfoort.nl/nieuws/advies-over-regenwater-opvangen-in-
eigen-tuin.htm
Gemeente Amsterdam. (2015). Presentatie gemeente Amsterdam.pdf.
Georgi, B., Swart, R., Marinova, N., Hove, B. van, Jacobs, C., Klostermann, J., Kazmierczak, A.,
Peltonen, L., Kopperoinen, L., Oinonen, K., Havrek, M., Cruz, M. J., Gregor, M., Fons-Esteve,
J., Keskitalo, C., Juhola, S., Krellenberg, K., & Bree, L. van. (2012). Urban adaptation to climate
change in Europe: Challenges and opportunities for cities together with supportive national
and European policies [Monograph]. European Environment Agency.
http://www.eea.europa.eu/publications/urban-adaptation-to-climate-change
Giffinger, R., Fertner, C., Kramar, H., & Meijers, E. (2007). City-ranking of European Medium-Sized
Cities. 12.
Grimm, N. B., Faeth, S. H., Golubiewski, N. E., Redman, C. L., Wu, J., Bai, X., & Briggs, J. M. (2008).
Global Change and the Ecology of Cities. Science, 319(5864), 756–760.
https://doi.org/10.1126/science.1150195
Hale, R. L. (2016). Spatial and Temporal Variation in Local Stormwater Infrastructure Use and
Stormwater Management Paradigms over the 20th Century. Water, 8(7), 310.
https://doi.org/10.3390/w8070310
Hoang, L., & Fenner, R. A. (2016). System interactions of stormwater management using sustainable
urban drainage systems and green infrastructure. Urban Water Journal, 13(7), 739–758.
https://doi.org/10.1080/1573062X.2015.1036083
Hurlimann, A., & Wilson, E. (2018). Sustainable Urban Water Management under a Changing Climate:
The Role of Spatial Planning. Water, 10(5), 546. https://doi.org/10.3390/w10050546
Johnson, C. L., Tunstall, S. M., & Penning-Rowsell, E. C. (2005). Floods as Catalysts for Policy Change:
Historical Lessons from England and Wales. International Journal of Water Resources
Development, 21(4), 561–575. https://doi.org/10.1080/07900620500258133
69
Kaspersen, P. S., & Halsnæs, K. (2017). Integrated climate change risk assessment: A practical
application for urban flooding during extreme precipitation. Climate Services, 6, 55–64.
https://doi.org/10.1016/j.cliser.2017.06.012
Kluck, J., Boogaard, F., Goedbloed, D., & Claassen, M. (2015). Storm water flooding Amsterdam, from
a quick scan analyses to an action plan. Amsterdam International Water Week.
https://research.hanze.nl/nl/publications/storm-water-flooding-amsterdam-from-a-quick-
scan-analyses-to-an-a
Li, H., Ding, L., Ren, M., Li, C., & Wang, H. (2017). Sponge City Construction in China: A Survey of the
Challenges and Opportunities. Water, 9(9), 594. https://doi.org/10.3390/w9090594
Liao, K.-H., Deng, S., & Tan, P. Y. (2017). Blue-Green Infrastructure: New Frontier for Sustainable
Urban Stormwater Management. In P. Y. Tan & C. Y. Jim (Eds.), Greening Cities: Forms and
Functions (pp. 203–226). Springer Singapore. https://doi.org/10.1007/978-981-10-4113-6_10
Lucas, W. C., & Sample, D. J. (2015). Reducing combined sewer overflows by using outlet controls for
Green Stormwater Infrastructure: Case study in Richmond, Virginia. Journal of Hydrology,
520, 473–488. https://doi.org/10.1016/j.jhydrol.2014.10.029
Maes, J., & Jacobs, S. (2017). Nature-Based Solutions for Europe’s Sustainable Development.
Conservation Letters, 10(1), 121–124. https://doi.org/10.1111/conl.12216
Meene, S. J. V. D., & Brown, R. R. (2009). Delving into the “Institutional Black Box”: Revealing the
Attributes of Sustainable Urban Water Management Regimes1. JAWRA Journal of the
American Water Resources Association, 45(6), 1448–1464. https://doi.org/10.1111/j.1752-
1688.2009.00377.x
Mguni, P., Herslund, L., & Jensen, M. B. (2015). Green infrastructure for flood-risk management in
Dar es Salaam and Copenhagen: Exploring the potential for transitions towards sustainable
urban water management. Water Policy; Oxford, 17(1), 126–142.
http://dx.doi.org.ezproxy.library.wur.nl/10.2166/wp.2014.047
Ngamalieu-Nengoue, U. A., Martínez-Solano, F. J., Iglesias-Rey, P. L., & Mora-Meliá, D. (2019). Multi-
Objective Optimization for Urban Drainage or Sewer Networks Rehabilitation through Pipes
Substitution and Storage Tanks Installation. Water, 11(5), 935.
https://doi.org/10.3390/w11050935
Odense Kommune. (n.d.). City, Government and Administration. Retrieved 18 March 2020, from
https://english.odense.dk/about-odense/city-government-and-administration
Odense Kommune. (2013). Tillg nr1 KlimatilpasningKommuneplan 20132025.pdf.
Odense Kommune. (2014). Baggrundsrapport.pdf.
Rijksoverheid. (2013, May 31). Omgevingswet—Rijksoverheid.nl [Onderwerp]. Ministerie van
Algemene Zaken. https://www.rijksoverheid.nl/onderwerpen/omgevingswet
Roy, A. H., Wenger, S. J., Fletcher, T. D., Walsh, C. J., Ladson, A. R., Shuster, W. D., Thurston, H. W., &
Brown, R. R. (2008). Impediments and Solutions to Sustainable, Watershed-Scale Urban
Stormwater Management: Lessons from Australia and the United States. Environmental
Management, 42(2), 344–359. https://doi.org/10.1007/s00267-008-9119-1
Ruiz, A. G., Dobbie, M., & Brown, R. (2017). Insights and future directions of transdisciplinary practice
in the urban water sector. Journal of Environmental Studies and Sciences, 7(2), 251–263.
https://doi.org/10.1007/s13412-015-0351-8
The City of Copenhagen. (2011). Copenhagen Climate Adaptation Plan—2011.pdf.
https://international.kk.dk/sites/international.kk.dk/files/uploaded-
files/Copenhagen%20Climate%20Adaptation%20Plan%20-%202011.pdf
70
The City of Copenhagen. (2012, October). Cloudburst Management plan 2010.pdf.
https://international.kk.dk/sites/international.kk.dk/files/uploaded-
files/Cloudburst%20Management%20plan%202010.pdf
The City of Copenhagen. (2014, November). Cloudburst Management Pays Off. https://climate-
adapt.eea.europa.eu/metadata/publications/economics-of-cloudburst-and-stormwater-
management-in-copenhagen/11258638
The City of Copenhagen. (2018, May). The_city_of_copenhagen_government_2018_-_2021.pdf.
https://international.kk.dk/sites/international.kk.dk/files/uploaded-
files/the_city_of_copenhagen_government_2018_-_2021.pdf
Thiel, S. van. (2014). Research in public administration and public management: An introduction.
Routledge/Taylor & Francis Group.
Thorne, C. R., Lawson, E. C., Ozawa, C., Hamlin, S. L., & Smith, L. A. (2018). Overcoming uncertainty
and barriers to adoption of Blue-Green Infrastructure for urban flood risk management.
Journal of Flood Risk Management, 11(S2), S960–S972. https://doi.org/10.1111/jfr3.12218
Tredje Natur. (2019). ENGHAVEPARKEN - CLIMATE PARK. TREDJE NATUR.
https://www.tredjenatur.dk/en/portfolio/enghaveparken-climate-park/
van de Meene, S. J., Brown, R. R., & Farrelly, M. A. (2011). Towards understanding governance for
sustainable urban water management. Global Environmental Change, 21(3), 1117–1127.
https://doi.org/10.1016/j.gloenvcha.2011.04.003
van Hattum, T. (2016). Climate adaptation is a huge opportunity to improve the quality of life in cities.
60.
Voskamp, I. M., & Van de Ven, F. H. M. (2015). Planning support system for climate adaptation:
Composing effective sets of blue-green measures to reduce urban vulnerability to extreme
weather events. Building and Environment, 83, 159–167.
https://doi.org/10.1016/j.buildenv.2014.07.018
Wejs, A., Harvold, K., Larsen, S. V., & Saglie, I.-L. (2014). Legitimacy building in weak institutional
settings: Climate change adaptation at local level in Denmark and Norway. Environmental
Politics, 23(3), 490–508. https://doi.org/10.1080/09644016.2013.854967
Wihlborg, M., Sörensen, J., & Alkan Olsson, J. (2019). Assessment of barriers and drivers for
implementation of blue-green solutions in Swedish municipalities. Journal of Environmental
Management, 233, 706–718. https://doi.org/10.1016/j.jenvman.2018.12.018
Wong, T. H. F., & Brown, R. R. (2009). The water sensitive city: Principles for practice. Water Science
and Technology, 60(3), 673–682. https://doi.org/10.2166/wst.2009.436
Ziersen, J., Clauson-Kaas, J., & Rasmussen, J. (2017). The role of Greater Copenhagen Utility in
implementing the city’s Cloudburst Management Plan. Water Practice and Technology, 12(2),
338–343. https://doi.org/10.2166/wpt.2017.039
71
List of Key Informants Interview 1 (2019), Amsterdam, Engineering office Interview 2 (2019), Amsterdam, Planning and Sustainability Interview 3 (2019), Amsterdam, Planning and Sustainability Interview 4 (2019), Amersfoort, Living Environment Interview 5 (2019), Amersfoort, Living Environment Interview 6 (2019), Amersfoort, City Development Interview 7 (2020), Copenhagen, City Development Interview 8 (2020), Copenhagen, The Center for Climate Adaptation Interview 9 (2020), Copenhagen, City Physical Appearance Interview 10 (2020), Odense, Nature and Climate office Interview 11 (2020), Odense, VandCenter Syd Interview 12 (2020), Odense, VandCenter Syd Resident interview 1 (2020), Amersfoort
72
Annex 1: Variables, indicators and coding In order to gain a broader view on the barriers and perceived opportunities multiple variables have
been selected (SRQ3), six variables have been distinguished:
• Information availability
• Technical skills
• Legal support
• Financial support
• Organisational collaboration
• Community involvement
These variables are based on the study of Li et al (2017) where a survey of progress on pilot sponge cities was discussed. These challenges consisted of a broad array of challenges. These challenges were divided in four categories: technical/physical, legal/regulatory, financial and community/institutional (Li et al., 2017). These challenges were combined with a study from Wihlborg et al. (2019) which describes a study to the barriers and drivers that encourage or hinder implementation of BGI. Barriers can have different origins: technological, legal, organisational, financial, social educational or political (Wihlborg et al., 2019). Therefore these categories and origins of barriers, which simultaneously can have encouraging origins, were then combined in six variables for SRQ3. Each variable of SRQ3 contains two indicators to make an even distribution per variable. This resulted in 12 indicators:
• Knowledge status
• Educational training
• Planning guidelines
• Coordination of maintenance
• Laws and regulations
• Political support
• Financial resources
• Budget availability
• Responsibility
• Cooperation
• Community cooperation
• Community education These indicators are linked to the interview questions. The answers of the informants is coded and linked to the indicators. The information of the variables, indicators, interview questions, literature and coding is summarized in Table 18.
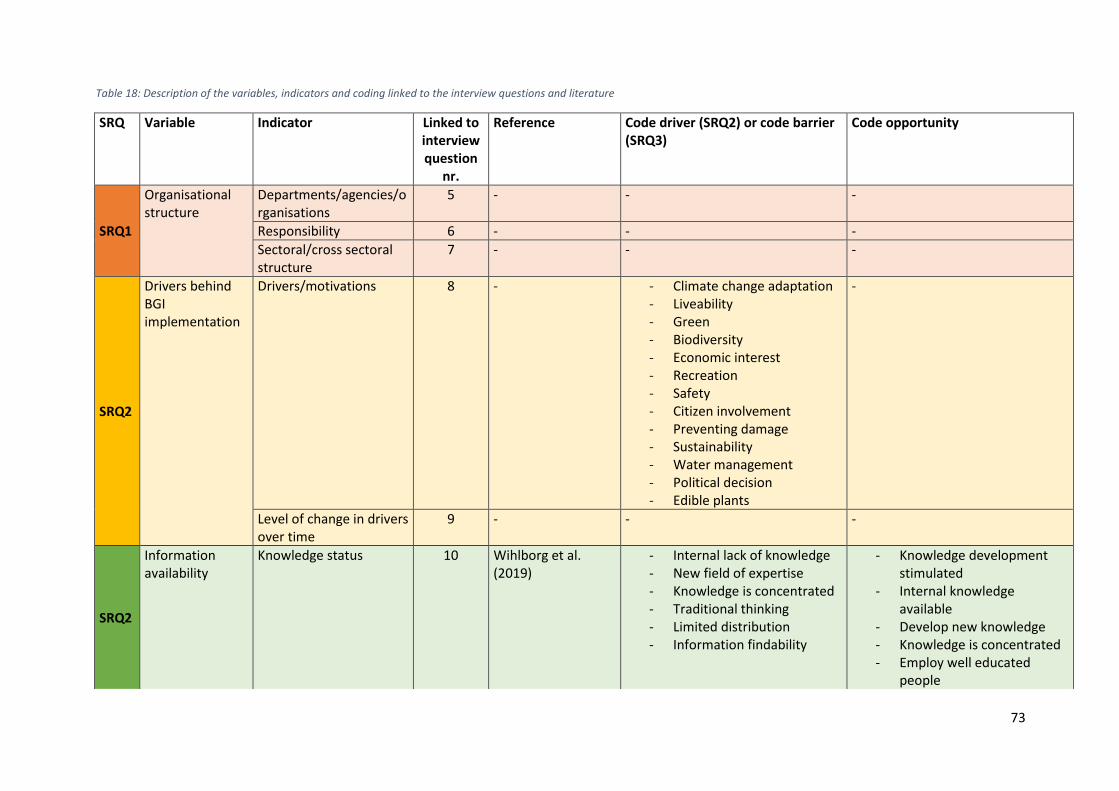
73
SRQ Variable Indicator Linked to interview question
nr.
Reference Code driver (SRQ2) or code barrier (SRQ3)
Code opportunity
SRQ1
Organisational structure
Departments/agencies/organisations
5 - - -
Responsibility 6 - - -
Sectoral/cross sectoral structure
7 - - -
SRQ2
Drivers behind BGI implementation
Drivers/motivations 8 - - Climate change adaptation - Liveability - Green - Biodiversity - Economic interest - Recreation - Safety - Citizen involvement - Preventing damage - Sustainability - Water management - Political decision - Edible plants
-
Level of change in drivers over time
9 - - -
SRQ2
Information availability
Knowledge status 10 Wihlborg et al. (2019)
- Internal lack of knowledge - New field of expertise - Knowledge is concentrated - Traditional thinking - Limited distribution - Information findability
- Knowledge development stimulated
- Internal knowledge available
- Develop new knowledge - Knowledge is concentrated - Employ well educated
people
Table 18: Description of the variables, indicators and coding linked to the interview questions and literature
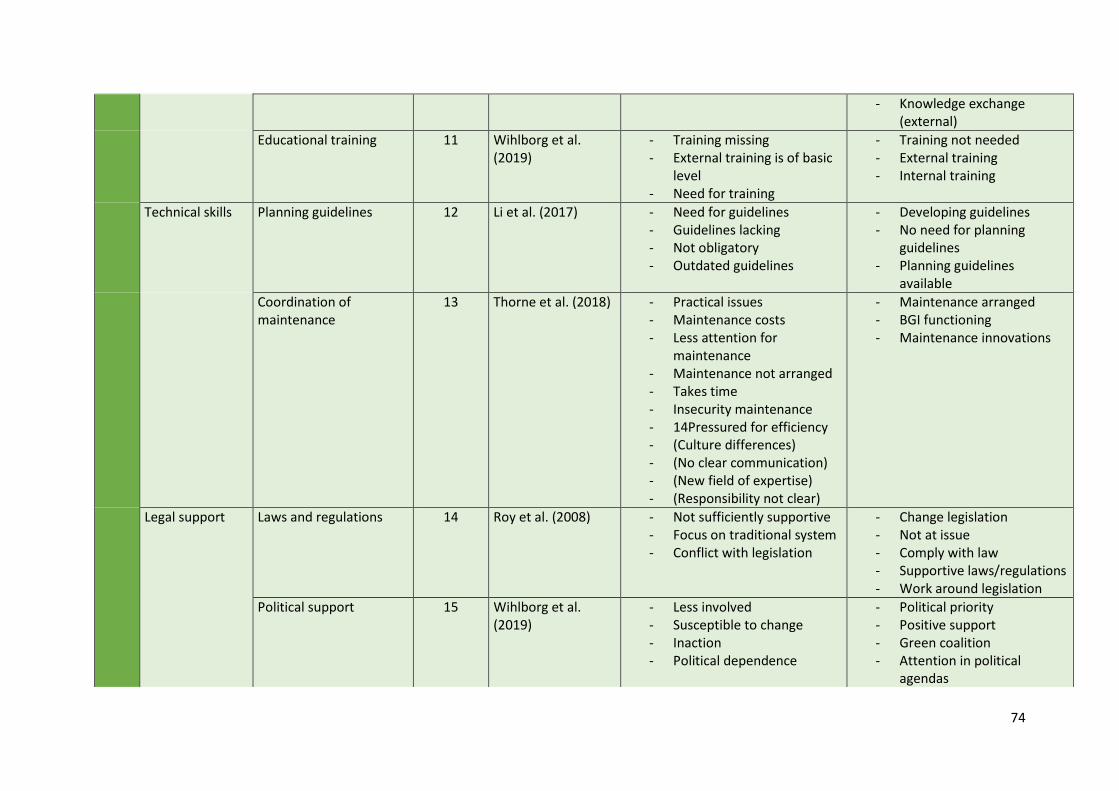
74
- Knowledge exchange (external)
Educational training 11 Wihlborg et al.
(2019) - Training missing - External training is of basic
level - Need for training
- Training not needed - External training - Internal training
Technical skills Planning guidelines 12 Li et al. (2017) - Need for guidelines - Guidelines lacking - Not obligatory - Outdated guidelines
- Developing guidelines - No need for planning
guidelines - Planning guidelines
available
Coordination of maintenance
13 Thorne et al. (2018) - Practical issues - Maintenance costs - Less attention for
maintenance - Maintenance not arranged - Takes time - Insecurity maintenance - 14Pressured for efficiency - (Culture differences) - (No clear communication) - (New field of expertise) - (Responsibility not clear)
- Maintenance arranged - BGI functioning - Maintenance innovations
Legal support Laws and regulations 14 Roy et al. (2008) - Not sufficiently supportive - Focus on traditional system - Conflict with legislation
- Change legislation - Not at issue - Comply with law - Supportive laws/regulations - Work around legislation
Political support 15 Wihlborg et al. (2019)
- Less involved - Susceptible to change - Inaction - Political dependence
- Political priority - Positive support - Green coalition - Attention in political
agendas
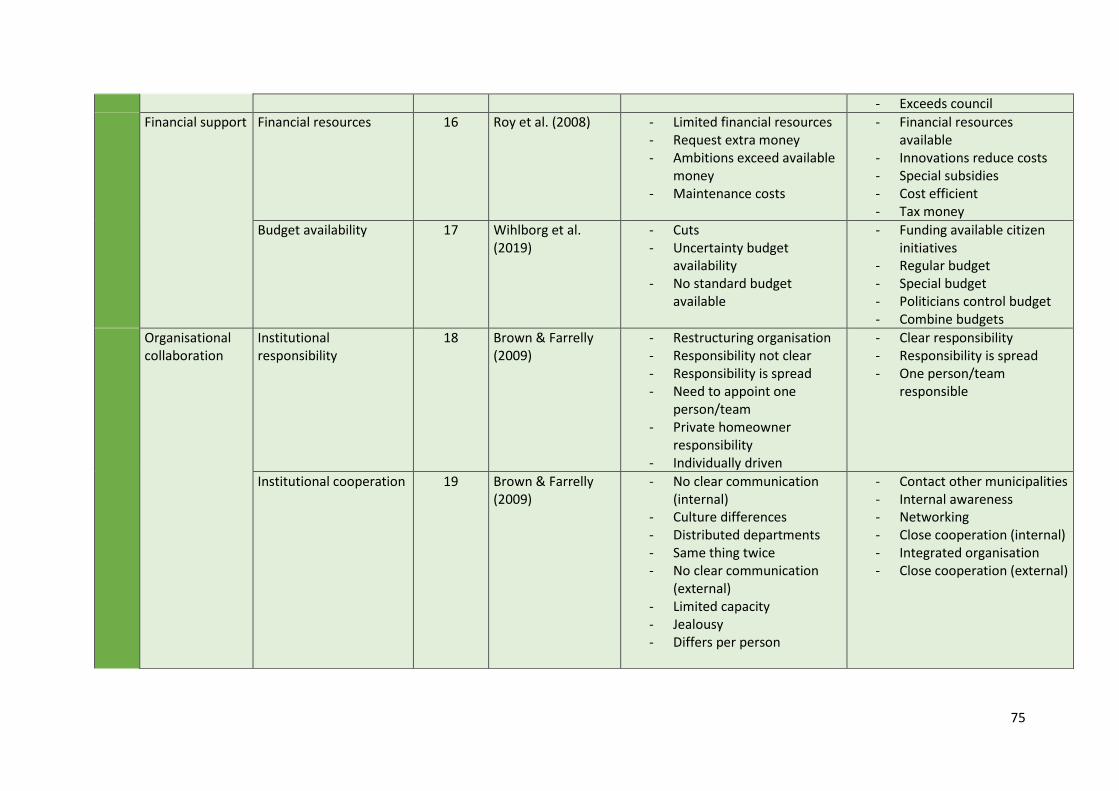
75
- Exceeds council
Financial support Financial resources 16 Roy et al. (2008) - Limited financial resources - Request extra money - Ambitions exceed available
money - Maintenance costs
- Financial resources available
- Innovations reduce costs - Special subsidies - Cost efficient - Tax money
Budget availability 17 Wihlborg et al. (2019)
- Cuts - Uncertainty budget
availability - No standard budget
available
- Funding available citizen initiatives
- Regular budget - Special budget - Politicians control budget - Combine budgets
Organisational collaboration
Institutional responsibility
18 Brown & Farrelly (2009)
- Restructuring organisation - Responsibility not clear - Responsibility is spread - Need to appoint one
person/team - Private homeowner
responsibility - Individually driven
- Clear responsibility - Responsibility is spread - One person/team
responsible
Institutional cooperation 19 Brown & Farrelly (2009)
- No clear communication (internal)
- Culture differences - Distributed departments - Same thing twice - No clear communication
(external) - Limited capacity - Jealousy - Differs per person
- Contact other municipalities - Internal awareness - Networking - Close cooperation (internal) - Integrated organisation - Close cooperation (external)
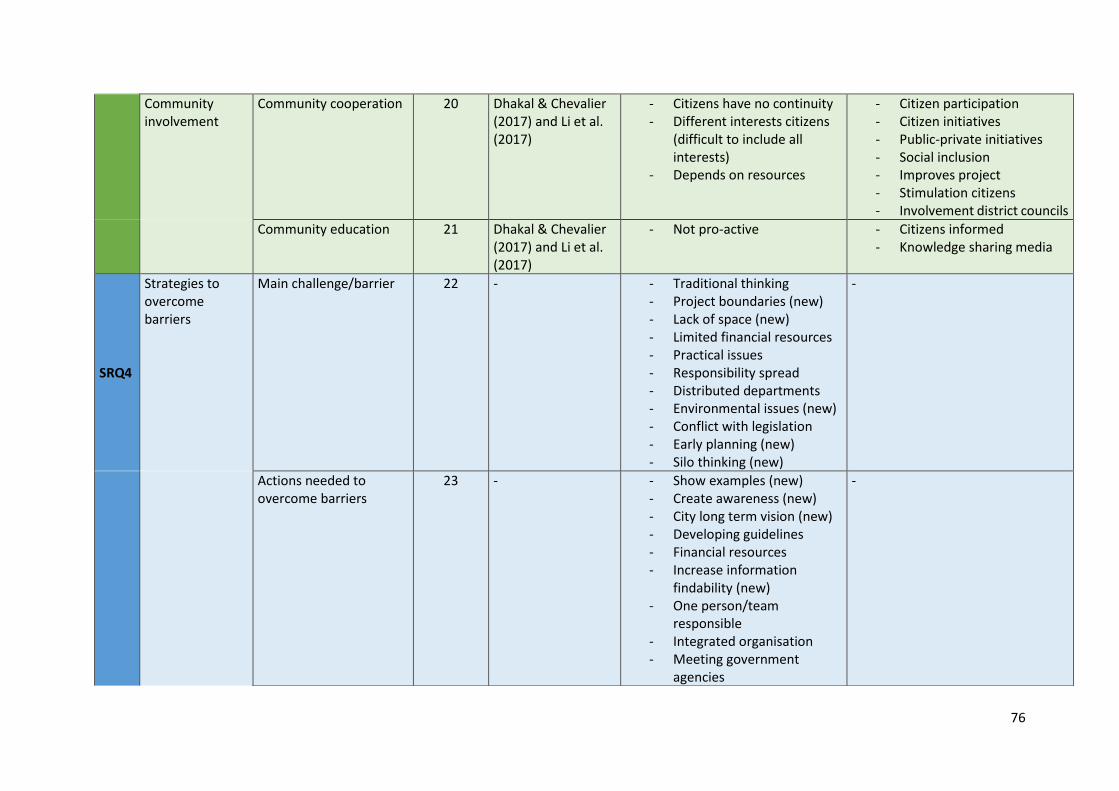
76
Community involvement
Community cooperation 20 Dhakal & Chevalier (2017) and Li et al. (2017)
- Citizens have no continuity - Different interests citizens
(difficult to include all interests)
- Depends on resources
- Citizen participation - Citizen initiatives - Public-private initiatives - Social inclusion - Improves project - Stimulation citizens - Involvement district councils
Community education 21 Dhakal & Chevalier
(2017) and Li et al. (2017)
- Not pro-active - Citizens informed - Knowledge sharing media
SRQ4
Strategies to overcome barriers
Main challenge/barrier 22 - - Traditional thinking - Project boundaries (new) - Lack of space (new) - Limited financial resources - Practical issues - Responsibility spread - Distributed departments - Environmental issues (new) - Conflict with legislation - Early planning (new) - Silo thinking (new)
-
Actions needed to overcome barriers
23 - - Show examples (new) - Create awareness (new) - City long term vision (new) - Developing guidelines - Financial resources - Increase information
findability (new) - One person/team
responsible - Integrated organisation - Meeting government
agencies
-
77
Relevant BGI implementations
24 - - -
City success 25 - - -

78
Annex 2.1: Interview Guide (English) I will shortly introduce myself and my research topic and thereafter we will start the interview. My name is Floor Mossink and I am a master student in Climate Studies at the Wageningen University, the Netherlands. As part of my master thesis study, I am conducting interviews at municipalities of different Northern European cities: Amsterdam, Copenhagen, Amersfoort and Odense. Thus, this interview forms part of my master thesis as I am interested in identifying barriers and drivers in the implementation of BGI practices from your perspective in your city. Let me shortly discuss some formal points concerning the interview:
• Do you give permission to record this interview?
• Your participation in the interview is voluntary. You can withdraw your consent at any time.
• Everything that is discussed in the interview will remain confidential and will be used for
academic purposes only. I will process your personal data confidentially and after the end of
the project the data will be anonymized.
• If a certain question is unclear, please let me know. You are not obliged to answer.
• Do you give your consent to participate in this interview?
1. Which organisation do you work for? 2. In which department do you work? (blue/green/planning)
Objective 1.2: Level of experience in stormwater management ‘Blue-Green Infrastructure: BGI is defined here as an umbrella term for sustainable multifunctional measures which often combines natural and artificial materials and is purposefully designed and managed to provide stormwater-related ecosystem services (Liao et al., 2017; Wihlborg et al., 2019). Examples of BGI are green roofs, raingardens and retention basins.‘
3. For how many years have you been working on BGI projects? 4. Can you please describe how your work is related to stormwater management and BGI?
Part 2: The organisation of BGI management in municipalities (RQ1)
Objective 2.1: Organisational structure ‘The term implementation refers here to the whole process of planning, building and maintenance of BGI.’ For Q6: ‘Sectoral meaning within your own sector and cross-sectoral meaning that includes other disciplines’ (Ruiz et al., 2017))
5. With which departments/agencies/organisations are you mainly collaborating to implement BGI?
6. Which departments/agencies/organisations are responsible to implement BGI? 7. How would you describe the organisational structure (sectoral/cross-sectoral) of BGI
implementation?
Part 3: Drivers in the implementation of BGI (RQ2)
Objective 3.1: Drivers behind BGI implementation ‘The term drivers refers here to motivations or encouraging factors towards the implementation of Blue-Green Infrastructure’ (Wihlborg et al., 2019).
Part 1: Introductory questions
Objective 1.1: Identification

79
Furthermore, you can consider the implementation of BGI on different scales: at a street level, neighbourhood level and on a citywide scale. These questions have a focus on a citywide scale.
8. What do you consider as driver(s)/motivation(s) to implement BGI in your city? 9. Have the driver(s)/motivation(s) to implement BGI on a citywide scale changed over time? If
yes, how?
Part 4: Enable or constrain the implementation of BGI (RQ2) In this part, six themes will be presented: informational, technical, legal, financial, organisational and community. You are asked to give a score to each question and shortly explain why.
Objective 4.1: Information availability within the municipality
10. How do you perceive the knowledge status on the implementation of BGI?
1: Very poor 2: Poor 3: Fair 4: Good 5: Excellent
Can you shortly explain why?
11. To what extend is educational training on the implementation of BGI provided for the practitioners working on BGI?
1: Very poor 2: Poor 3: Fair 4: Good 5: Excellent
Can you shortly explain why?
12. To which extent are there planning guidelines on BGI available in your city?
1: Very poor 2: Poor 3: Fair 4: Good 5: Excellent
Can you shortly explain why?
13. To which extent do you perceive the coordination of BGI maintenance?
1: Very poor 2: Poor 3: Fair 4: Good 5: Excellent
Can you shortly explain why?
14. To which extent do laws and regulations support the implementation of BGI?
1: Very poor 2: Poor 3: Fair 4: Good 5: Excellent
Can you shortly explain why?
15. To which extent does the implementation of BGI receive political support?
1: Very poor 2: Poor 3: Fair 4: Good 5: Excellent
Can you shortly explain why?
16. To which extent do you receive financial resources in your city to implement BGI?
1: Very poor 2: Poor 3: Fair 4: Good 5: Excellent
Can you shortly explain why?
17. How do you perceive the budget availability for implementing BGI to fulfil the targets you have for BGI in your city?
1: Very poor 2: Poor 3: Fair 4: Good 5: Excellent
Can you shortly explain why?
18. To which extent is the responsibility to implement BGI divided between departments?
Objective 4.2: Technical skills available
Objective 4.3: Legal support
Objective 4.4: Financial support
Objective 4.5: Organisational collaboration
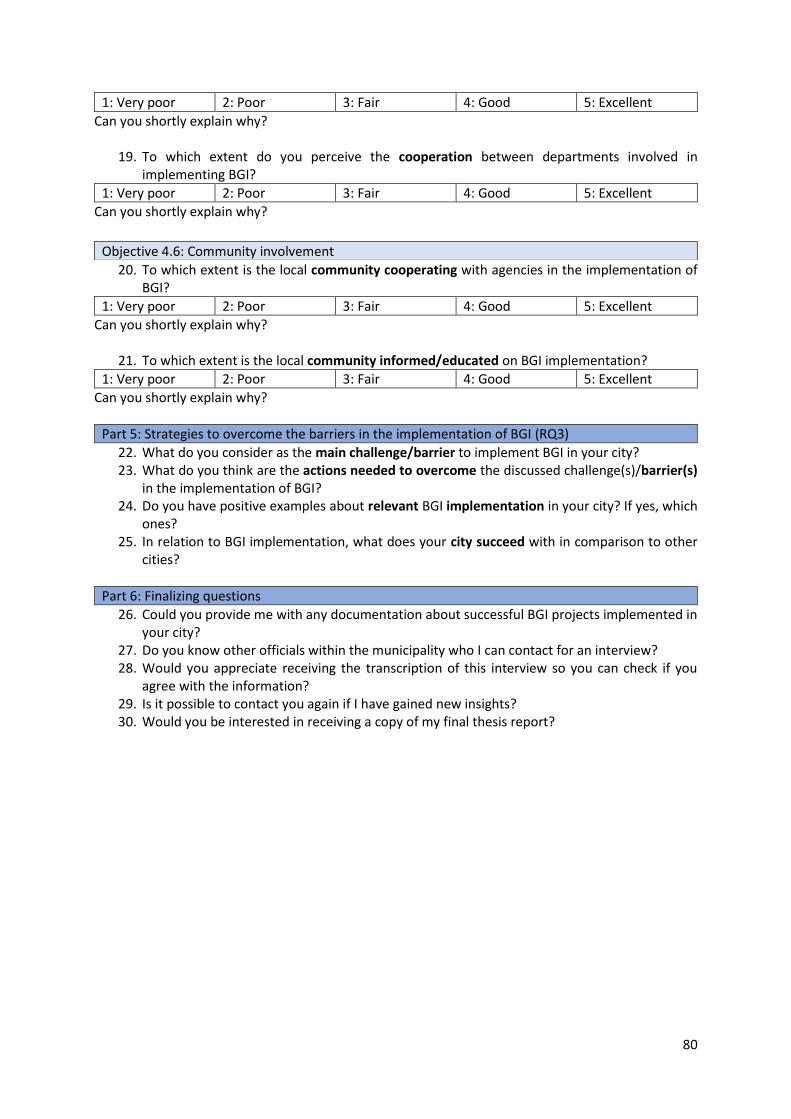
80
1: Very poor 2: Poor 3: Fair 4: Good 5: Excellent
Can you shortly explain why?
19. To which extent do you perceive the cooperation between departments involved in implementing BGI?
1: Very poor 2: Poor 3: Fair 4: Good 5: Excellent
Can you shortly explain why?
20. To which extent is the local community cooperating with agencies in the implementation of BGI?
1: Very poor 2: Poor 3: Fair 4: Good 5: Excellent
Can you shortly explain why?
21. To which extent is the local community informed/educated on BGI implementation?
1: Very poor 2: Poor 3: Fair 4: Good 5: Excellent
Can you shortly explain why?
Part 5: Strategies to overcome the barriers in the implementation of BGI (RQ3)
22. What do you consider as the main challenge/barrier to implement BGI in your city? 23. What do you think are the actions needed to overcome the discussed challenge(s)/barrier(s)
in the implementation of BGI? 24. Do you have positive examples about relevant BGI implementation in your city? If yes, which
ones? 25. In relation to BGI implementation, what does your city succeed with in comparison to other
cities?
Part 6: Finalizing questions
26. Could you provide me with any documentation about successful BGI projects implemented in your city?
27. Do you know other officials within the municipality who I can contact for an interview? 28. Would you appreciate receiving the transcription of this interview so you can check if you
agree with the information? 29. Is it possible to contact you again if I have gained new insights? 30. Would you be interested in receiving a copy of my final thesis report?
Objective 4.6: Community involvement
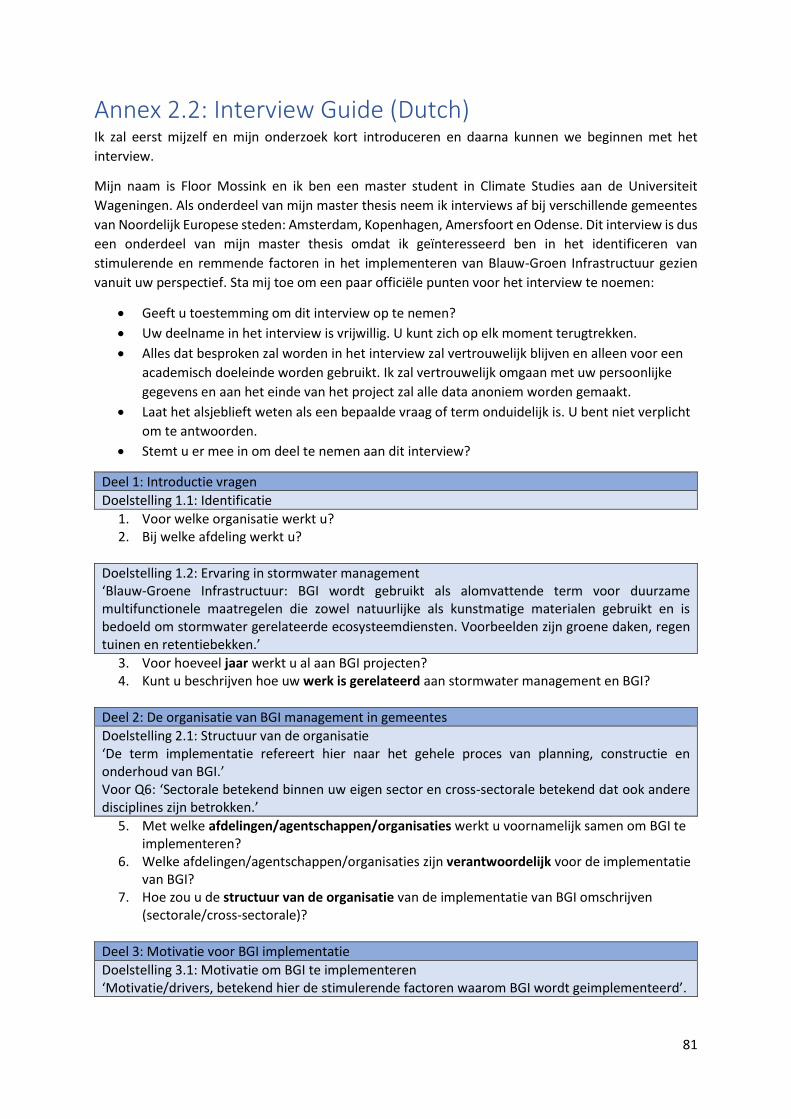
81
Annex 2.2: Interview Guide (Dutch) Ik zal eerst mijzelf en mijn onderzoek kort introduceren en daarna kunnen we beginnen met het
interview.
Mijn naam is Floor Mossink en ik ben een master student in Climate Studies aan de Universiteit
Wageningen. Als onderdeel van mijn master thesis neem ik interviews af bij verschillende gemeentes
van Noordelijk Europese steden: Amsterdam, Kopenhagen, Amersfoort en Odense. Dit interview is dus
een onderdeel van mijn master thesis omdat ik geïnteresseerd ben in het identificeren van
stimulerende en remmende factoren in het implementeren van Blauw-Groen Infrastructuur gezien
vanuit uw perspectief. Sta mij toe om een paar officiële punten voor het interview te noemen:
• Geeft u toestemming om dit interview op te nemen?
• Uw deelname in het interview is vrijwillig. U kunt zich op elk moment terugtrekken.
• Alles dat besproken zal worden in het interview zal vertrouwelijk blijven en alleen voor een
academisch doeleinde worden gebruikt. Ik zal vertrouwelijk omgaan met uw persoonlijke
gegevens en aan het einde van het project zal alle data anoniem worden gemaakt.
• Laat het alsjeblieft weten als een bepaalde vraag of term onduidelijk is. U bent niet verplicht
om te antwoorden.
• Stemt u er mee in om deel te nemen aan dit interview?
Deel 1: Introductie vragen
Doelstelling 1.1: Identificatie
1. Voor welke organisatie werkt u? 2. Bij welke afdeling werkt u?
Doelstelling 1.2: Ervaring in stormwater management ‘Blauw-Groene Infrastructuur: BGI wordt gebruikt als alomvattende term voor duurzame multifunctionele maatregelen die zowel natuurlijke als kunstmatige materialen gebruikt en is bedoeld om stormwater gerelateerde ecosysteemdiensten. Voorbeelden zijn groene daken, regen tuinen en retentiebekken.’
3. Voor hoeveel jaar werkt u al aan BGI projecten? 4. Kunt u beschrijven hoe uw werk is gerelateerd aan stormwater management en BGI?
Deel 2: De organisatie van BGI management in gemeentes
Doelstelling 2.1: Structuur van de organisatie ‘De term implementatie refereert hier naar het gehele proces van planning, constructie en onderhoud van BGI.’ Voor Q6: ‘Sectorale betekend binnen uw eigen sector en cross-sectorale betekend dat ook andere disciplines zijn betrokken.’
5. Met welke afdelingen/agentschappen/organisaties werkt u voornamelijk samen om BGI te implementeren?
6. Welke afdelingen/agentschappen/organisaties zijn verantwoordelijk voor de implementatie van BGI?
7. Hoe zou u de structuur van de organisatie van de implementatie van BGI omschrijven (sectorale/cross-sectorale)?
Deel 3: Motivatie voor BGI implementatie
Doelstelling 3.1: Motivatie om BGI te implementeren ‘Motivatie/drivers, betekend hier de stimulerende factoren waarom BGI wordt geimplementeerd’.
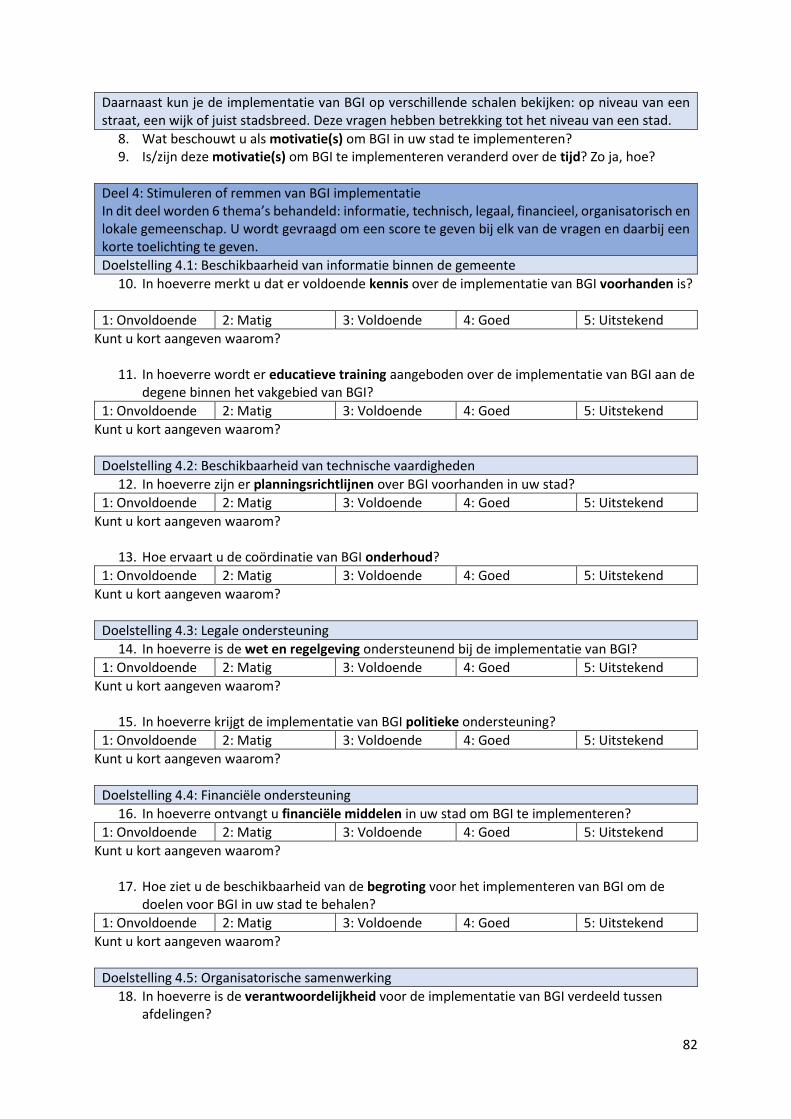
82
Daarnaast kun je de implementatie van BGI op verschillende schalen bekijken: op niveau van een straat, een wijk of juist stadsbreed. Deze vragen hebben betrekking tot het niveau van een stad.
8. Wat beschouwt u als motivatie(s) om BGI in uw stad te implementeren? 9. Is/zijn deze motivatie(s) om BGI te implementeren veranderd over de tijd? Zo ja, hoe?
Deel 4: Stimuleren of remmen van BGI implementatie In dit deel worden 6 thema’s behandeld: informatie, technisch, legaal, financieel, organisatorisch en lokale gemeenschap. U wordt gevraagd om een score te geven bij elk van de vragen en daarbij een korte toelichting te geven.
Doelstelling 4.1: Beschikbaarheid van informatie binnen de gemeente
10. In hoeverre merkt u dat er voldoende kennis over de implementatie van BGI voorhanden is?
1: Onvoldoende 2: Matig 3: Voldoende 4: Goed 5: Uitstekend
Kunt u kort aangeven waarom?
11. In hoeverre wordt er educatieve training aangeboden over de implementatie van BGI aan de degene binnen het vakgebied van BGI?
1: Onvoldoende 2: Matig 3: Voldoende 4: Goed 5: Uitstekend
Kunt u kort aangeven waarom?
Doelstelling 4.2: Beschikbaarheid van technische vaardigheden
12. In hoeverre zijn er planningsrichtlijnen over BGI voorhanden in uw stad?
1: Onvoldoende 2: Matig 3: Voldoende 4: Goed 5: Uitstekend
Kunt u kort aangeven waarom?
13. Hoe ervaart u de coördinatie van BGI onderhoud?
1: Onvoldoende 2: Matig 3: Voldoende 4: Goed 5: Uitstekend
Kunt u kort aangeven waarom?
Doelstelling 4.3: Legale ondersteuning
14. In hoeverre is de wet en regelgeving ondersteunend bij de implementatie van BGI?
1: Onvoldoende 2: Matig 3: Voldoende 4: Goed 5: Uitstekend
Kunt u kort aangeven waarom?
15. In hoeverre krijgt de implementatie van BGI politieke ondersteuning?
1: Onvoldoende 2: Matig 3: Voldoende 4: Goed 5: Uitstekend
Kunt u kort aangeven waarom?
Doelstelling 4.4: Financiële ondersteuning
16. In hoeverre ontvangt u financiële middelen in uw stad om BGI te implementeren?
1: Onvoldoende 2: Matig 3: Voldoende 4: Goed 5: Uitstekend
Kunt u kort aangeven waarom?
17. Hoe ziet u de beschikbaarheid van de begroting voor het implementeren van BGI om de doelen voor BGI in uw stad te behalen?
1: Onvoldoende 2: Matig 3: Voldoende 4: Goed 5: Uitstekend
Kunt u kort aangeven waarom?
Doelstelling 4.5: Organisatorische samenwerking
18. In hoeverre is de verantwoordelijkheid voor de implementatie van BGI verdeeld tussen afdelingen?
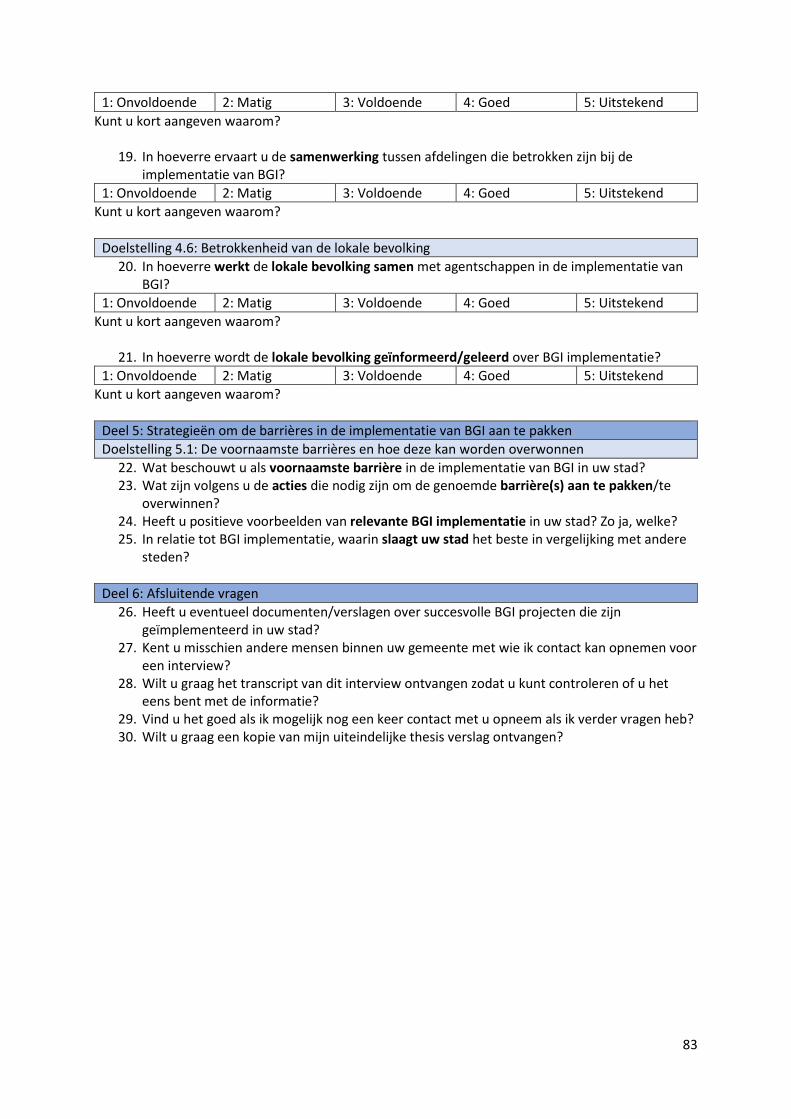
83
1: Onvoldoende 2: Matig 3: Voldoende 4: Goed 5: Uitstekend
Kunt u kort aangeven waarom?
19. In hoeverre ervaart u de samenwerking tussen afdelingen die betrokken zijn bij de implementatie van BGI?
1: Onvoldoende 2: Matig 3: Voldoende 4: Goed 5: Uitstekend
Kunt u kort aangeven waarom?
Doelstelling 4.6: Betrokkenheid van de lokale bevolking
20. In hoeverre werkt de lokale bevolking samen met agentschappen in de implementatie van BGI?
1: Onvoldoende 2: Matig 3: Voldoende 4: Goed 5: Uitstekend
Kunt u kort aangeven waarom?
21. In hoeverre wordt de lokale bevolking geïnformeerd/geleerd over BGI implementatie?
1: Onvoldoende 2: Matig 3: Voldoende 4: Goed 5: Uitstekend
Kunt u kort aangeven waarom?
Deel 5: Strategieën om de barrières in de implementatie van BGI aan te pakken
Doelstelling 5.1: De voornaamste barrières en hoe deze kan worden overwonnen
22. Wat beschouwt u als voornaamste barrière in de implementatie van BGI in uw stad? 23. Wat zijn volgens u de acties die nodig zijn om de genoemde barrière(s) aan te pakken/te
overwinnen? 24. Heeft u positieve voorbeelden van relevante BGI implementatie in uw stad? Zo ja, welke? 25. In relatie tot BGI implementatie, waarin slaagt uw stad het beste in vergelijking met andere
steden?
Deel 6: Afsluitende vragen
26. Heeft u eventueel documenten/verslagen over succesvolle BGI projecten die zijn geïmplementeerd in uw stad?
27. Kent u misschien andere mensen binnen uw gemeente met wie ik contact kan opnemen voor een interview?
28. Wilt u graag het transcript van dit interview ontvangen zodat u kunt controleren of u het eens bent met de informatie?
29. Vind u het goed als ik mogelijk nog een keer contact met u opneem als ik verder vragen heb? 30. Wilt u graag een kopie van mijn uiteindelijke thesis verslag ontvangen?
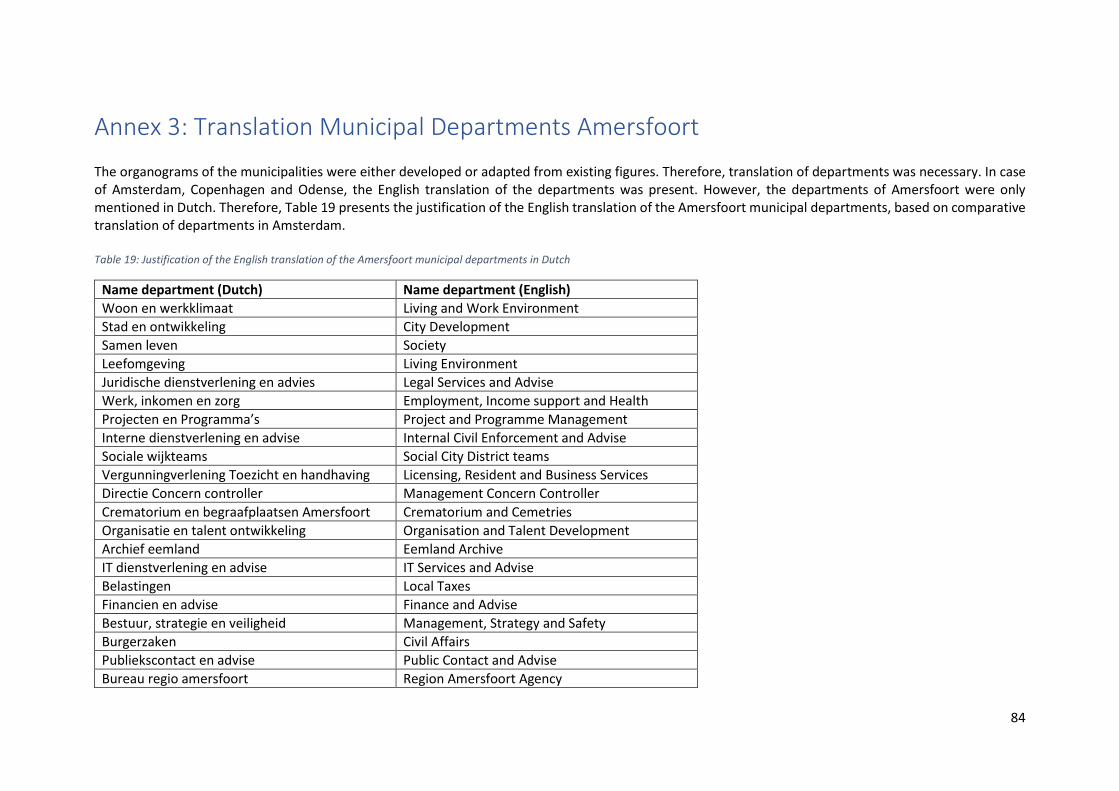
84
Annex 3: Translation Municipal Departments Amersfoort The organograms of the municipalities were either developed or adapted from existing figures. Therefore, translation of departments was necessary. In case of Amsterdam, Copenhagen and Odense, the English translation of the departments was present. However, the departments of Amersfoort were only mentioned in Dutch. Therefore, Table 19 presents the justification of the English translation of the Amersfoort municipal departments, based on comparative translation of departments in Amsterdam. Table 19: Justification of the English translation of the Amersfoort municipal departments in Dutch
Name department (Dutch) Name department (English)
Woon en werkklimaat Living and Work Environment
Stad en ontwikkeling City Development
Samen leven Society
Leefomgeving Living Environment
Juridische dienstverlening en advies Legal Services and Advise
Werk, inkomen en zorg Employment, Income support and Health
Projecten en Programma’s Project and Programme Management
Interne dienstverlening en advise Internal Civil Enforcement and Advise
Sociale wijkteams Social City District teams
Vergunningverlening Toezicht en handhaving Licensing, Resident and Business Services
Directie Concern controller Management Concern Controller
Crematorium en begraafplaatsen Amersfoort Crematorium and Cemetries
Organisatie en talent ontwikkeling Organisation and Talent Development
Archief eemland Eemland Archive
IT dienstverlening en advise IT Services and Advise
Belastingen Local Taxes
Financien en advise Finance and Advise
Bestuur, strategie en veiligheid Management, Strategy and Safety
Burgerzaken Civil Affairs
Publiekscontact en advise Public Contact and Advise
Bureau regio amersfoort Region Amersfoort Agency
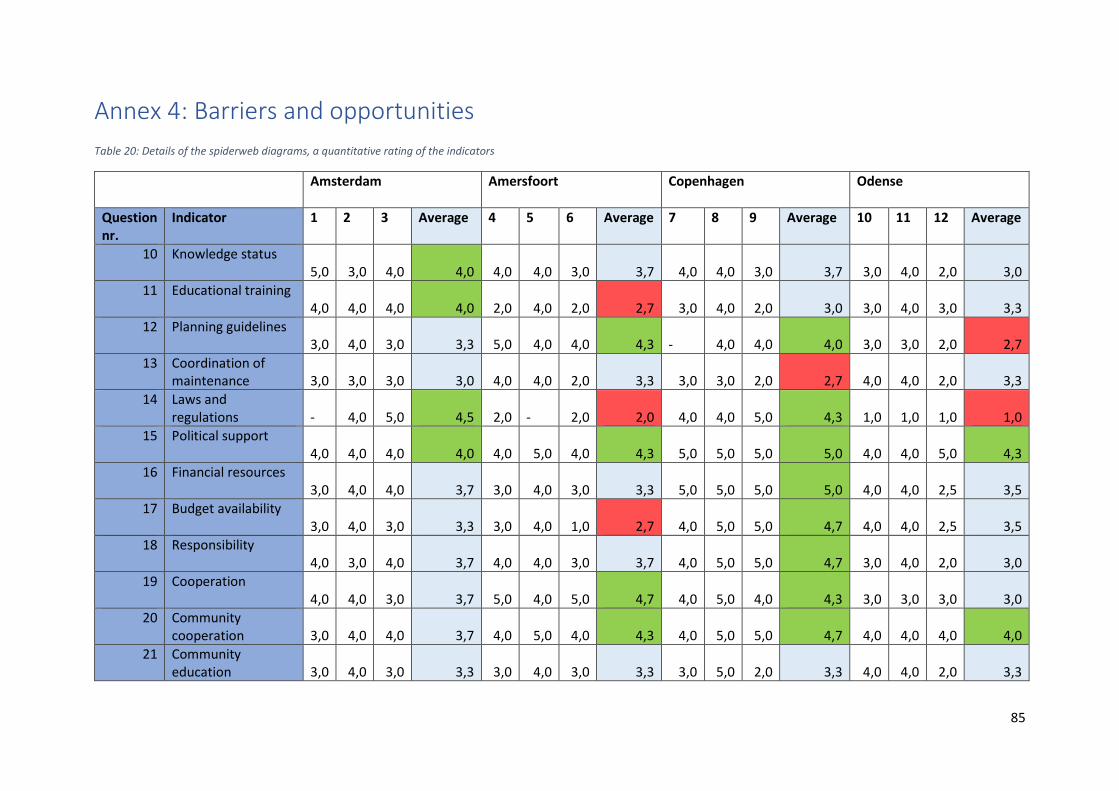
85
Annex 4: Barriers and opportunities Table 20: Details of the spiderweb diagrams, a quantitative rating of the indicators
Amsterdam Amersfoort Copenhagen Odense
Question nr.
Indicator 1 2 3 Average 4 5 6 Average 7 8 9 Average 10 11 12 Average
10 Knowledge status 5,0 3,0 4,0 4,0 4,0 4,0 3,0 3,7 4,0 4,0 3,0 3,7 3,0 4,0 2,0 3,0
11 Educational training 4,0 4,0 4,0 4,0 2,0 4,0 2,0 2,7 3,0 4,0 2,0 3,0 3,0 4,0 3,0 3,3
12 Planning guidelines 3,0 4,0 3,0 3,3 5,0 4,0 4,0 4,3 - 4,0 4,0 4,0 3,0 3,0 2,0 2,7
13 Coordination of maintenance 3,0 3,0 3,0 3,0 4,0 4,0 2,0 3,3 3,0 3,0 2,0 2,7 4,0 4,0 2,0 3,3
14 Laws and regulations - 4,0 5,0 4,5 2,0 - 2,0 2,0 4,0 4,0 5,0 4,3 1,0 1,0 1,0 1,0
15 Political support 4,0 4,0 4,0 4,0 4,0 5,0 4,0 4,3 5,0 5,0 5,0 5,0 4,0 4,0 5,0 4,3
16 Financial resources 3,0 4,0 4,0 3,7 3,0 4,0 3,0 3,3 5,0 5,0 5,0 5,0 4,0 4,0 2,5 3,5
17 Budget availability 3,0 4,0 3,0 3,3 3,0 4,0 1,0 2,7 4,0 5,0 5,0 4,7 4,0 4,0 2,5 3,5
18 Responsibility 4,0 3,0 4,0 3,7 4,0 4,0 3,0 3,7 4,0 5,0 5,0 4,7 3,0 4,0 2,0 3,0
19 Cooperation 4,0 4,0 3,0 3,7 5,0 4,0 5,0 4,7 4,0 5,0 4,0 4,3 3,0 3,0 3,0 3,0
20 Community cooperation 3,0 4,0 4,0 3,7 4,0 5,0 4,0 4,3 4,0 5,0 5,0 4,7 4,0 4,0 4,0 4,0
21 Community education 3,0 4,0 3,0 3,3 3,0 4,0 3,0 3,3 3,0 5,0 2,0 3,3 4,0 4,0 2,0 3,3
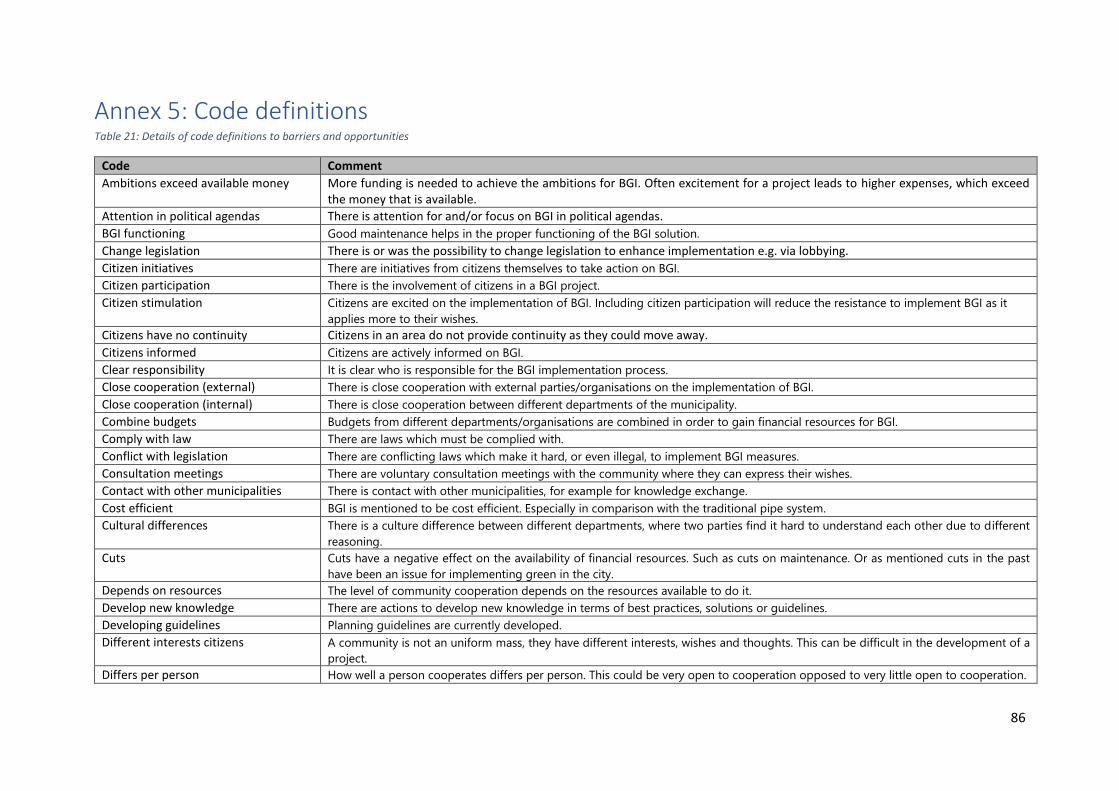
86
Annex 5: Code definitions Table 21: Details of code definitions to barriers and opportunities
Code Comment
Ambitions exceed available money More funding is needed to achieve the ambitions for BGI. Often excitement for a project leads to higher expenses, which exceed the money that is available.
Attention in political agendas There is attention for and/or focus on BGI in political agendas.
BGI functioning Good maintenance helps in the proper functioning of the BGI solution.
Change legislation There is or was the possibility to change legislation to enhance implementation e.g. via lobbying.
Citizen initiatives There are initiatives from citizens themselves to take action on BGI.
Citizen participation There is the involvement of citizens in a BGI project.
Citizen stimulation Citizens are excited on the implementation of BGI. Including citizen participation will reduce the resistance to implement BGI as it
applies more to their wishes.
Citizens have no continuity Citizens in an area do not provide continuity as they could move away.
Citizens informed Citizens are actively informed on BGI.
Clear responsibility It is clear who is responsible for the BGI implementation process.
Close cooperation (external) There is close cooperation with external parties/organisations on the implementation of BGI.
Close cooperation (internal) There is close cooperation between different departments of the municipality.
Combine budgets Budgets from different departments/organisations are combined in order to gain financial resources for BGI.
Comply with law There are laws which must be complied with.
Conflict with legislation There are conflicting laws which make it hard, or even illegal, to implement BGI measures.
Consultation meetings There are voluntary consultation meetings with the community where they can express their wishes.
Contact with other municipalities There is contact with other municipalities, for example for knowledge exchange.
Cost efficient BGI is mentioned to be cost efficient. Especially in comparison with the traditional pipe system.
Cultural differences There is a culture difference between different departments, where two parties find it hard to understand each other due to different
reasoning. Cuts Cuts have a negative effect on the availability of financial resources. Such as cuts on maintenance. Or as mentioned cuts in the past
have been an issue for implementing green in the city. Depends on resources The level of community cooperation depends on the resources available to do it.
Develop new knowledge There are actions to develop new knowledge in terms of best practices, solutions or guidelines.
Developing guidelines Planning guidelines are currently developed.
Different interests citizens A community is not an uniform mass, they have different interests, wishes and thoughts. This can be difficult in the development of a
project. Differs per person How well a person cooperates differs per person. This could be very open to cooperation opposed to very little open to cooperation.
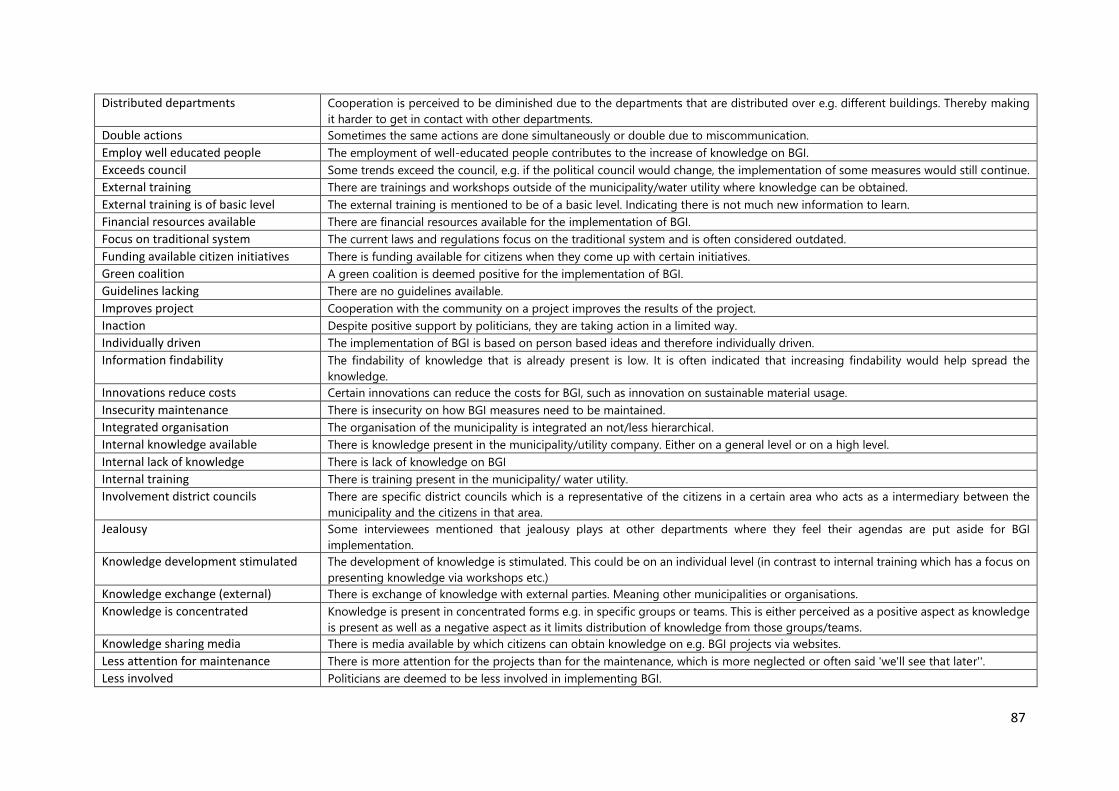
87
Distributed departments Cooperation is perceived to be diminished due to the departments that are distributed over e.g. different buildings. Thereby making
it harder to get in contact with other departments. Double actions Sometimes the same actions are done simultaneously or double due to miscommunication.
Employ well educated people The employment of well-educated people contributes to the increase of knowledge on BGI.
Exceeds council Some trends exceed the council, e.g. if the political council would change, the implementation of some measures would still continue.
External training There are trainings and workshops outside of the municipality/water utility where knowledge can be obtained.
External training is of basic level The external training is mentioned to be of a basic level. Indicating there is not much new information to learn.
Financial resources available There are financial resources available for the implementation of BGI.
Focus on traditional system The current laws and regulations focus on the traditional system and is often considered outdated.
Funding available citizen initiatives There is funding available for citizens when they come up with certain initiatives.
Green coalition A green coalition is deemed positive for the implementation of BGI.
Guidelines lacking There are no guidelines available.
Improves project Cooperation with the community on a project improves the results of the project.
Inaction Despite positive support by politicians, they are taking action in a limited way.
Individually driven The implementation of BGI is based on person based ideas and therefore individually driven.
Information findability The findability of knowledge that is already present is low. It is often indicated that increasing findability would help spread the
knowledge. Innovations reduce costs Certain innovations can reduce the costs for BGI, such as innovation on sustainable material usage.
Insecurity maintenance There is insecurity on how BGI measures need to be maintained.
Integrated organisation The organisation of the municipality is integrated an not/less hierarchical.
Internal knowledge available There is knowledge present in the municipality/utility company. Either on a general level or on a high level.
Internal lack of knowledge There is lack of knowledge on BGI
Internal training There is training present in the municipality/ water utility.
Involvement district councils There are specific district councils which is a representative of the citizens in a certain area who acts as a intermediary between the
municipality and the citizens in that area. Jealousy Some interviewees mentioned that jealousy plays at other departments where they feel their agendas are put aside for BGI
implementation. Knowledge development stimulated The development of knowledge is stimulated. This could be on an individual level (in contrast to internal training which has a focus on
presenting knowledge via workshops etc.) Knowledge exchange (external) There is exchange of knowledge with external parties. Meaning other municipalities or organisations.
Knowledge is concentrated Knowledge is present in concentrated forms e.g. in specific groups or teams. This is either perceived as a positive aspect as knowledge
is present as well as a negative aspect as it limits distribution of knowledge from those groups/teams. Knowledge sharing media There is media available by which citizens can obtain knowledge on e.g. BGI projects via websites.
Less attention for maintenance There is more attention for the projects than for the maintenance, which is more neglected or often said 'we'll see that later''.
Less involved Politicians are deemed to be less involved in implementing BGI.
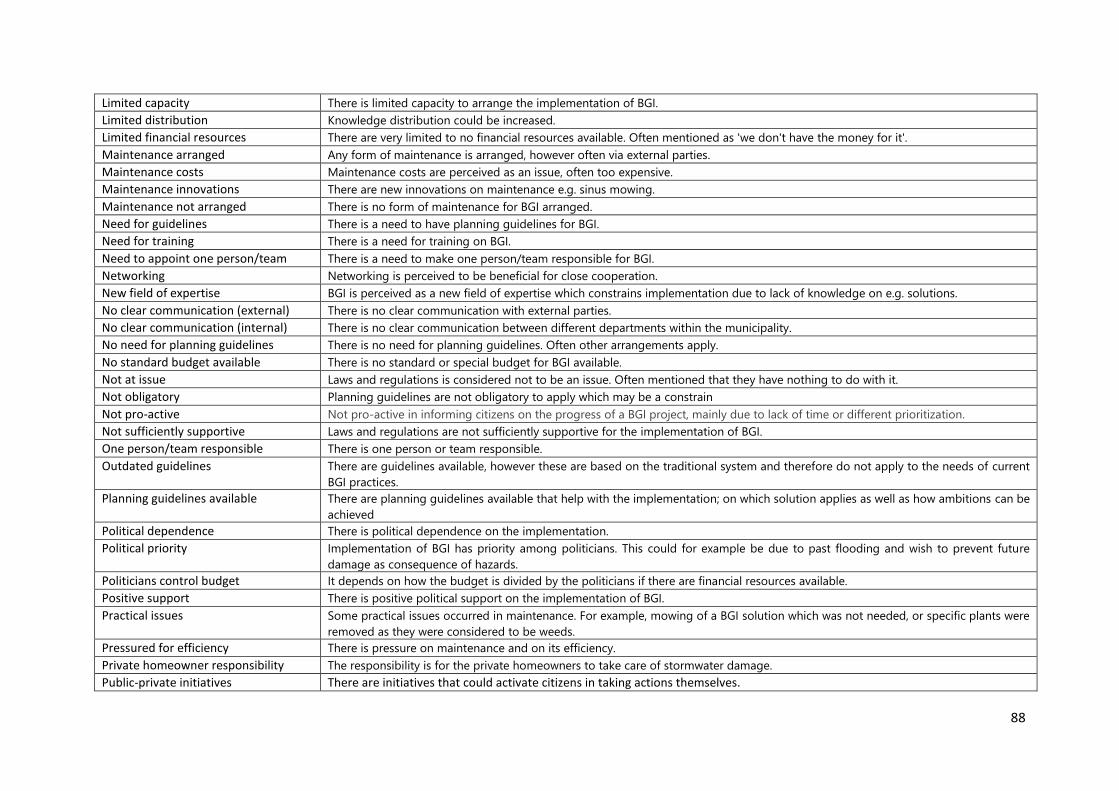
88
Limited capacity There is limited capacity to arrange the implementation of BGI.
Limited distribution Knowledge distribution could be increased.
Limited financial resources There are very limited to no financial resources available. Often mentioned as 'we don't have the money for it'.
Maintenance arranged Any form of maintenance is arranged, however often via external parties.
Maintenance costs Maintenance costs are perceived as an issue, often too expensive.
Maintenance innovations There are new innovations on maintenance e.g. sinus mowing.
Maintenance not arranged There is no form of maintenance for BGI arranged.
Need for guidelines There is a need to have planning guidelines for BGI.
Need for training There is a need for training on BGI.
Need to appoint one person/team There is a need to make one person/team responsible for BGI.
Networking Networking is perceived to be beneficial for close cooperation.
New field of expertise BGI is perceived as a new field of expertise which constrains implementation due to lack of knowledge on e.g. solutions.
No clear communication (external) There is no clear communication with external parties.
No clear communication (internal) There is no clear communication between different departments within the municipality.
No need for planning guidelines There is no need for planning guidelines. Often other arrangements apply.
No standard budget available There is no standard or special budget for BGI available.
Not at issue Laws and regulations is considered not to be an issue. Often mentioned that they have nothing to do with it.
Not obligatory Planning guidelines are not obligatory to apply which may be a constrain
Not pro-active Not pro-active in informing citizens on the progress of a BGI project, mainly due to lack of time or different prioritization.
Not sufficiently supportive Laws and regulations are not sufficiently supportive for the implementation of BGI.
One person/team responsible There is one person or team responsible.
Outdated guidelines There are guidelines available, however these are based on the traditional system and therefore do not apply to the needs of current
BGI practices. Planning guidelines available There are planning guidelines available that help with the implementation; on which solution applies as well as how ambitions can be
achieved Political dependence There is political dependence on the implementation.
Political priority Implementation of BGI has priority among politicians. This could for example be due to past flooding and wish to prevent future
damage as consequence of hazards. Politicians control budget It depends on how the budget is divided by the politicians if there are financial resources available.
Positive support There is positive political support on the implementation of BGI.
Practical issues Some practical issues occurred in maintenance. For example, mowing of a BGI solution which was not needed, or specific plants were
removed as they were considered to be weeds. Pressured for efficiency There is pressure on maintenance and on its efficiency.
Private homeowner responsibility The responsibility is for the private homeowners to take care of stormwater damage.
Public-private initiatives There are initiatives that could activate citizens in taking actions themselves.
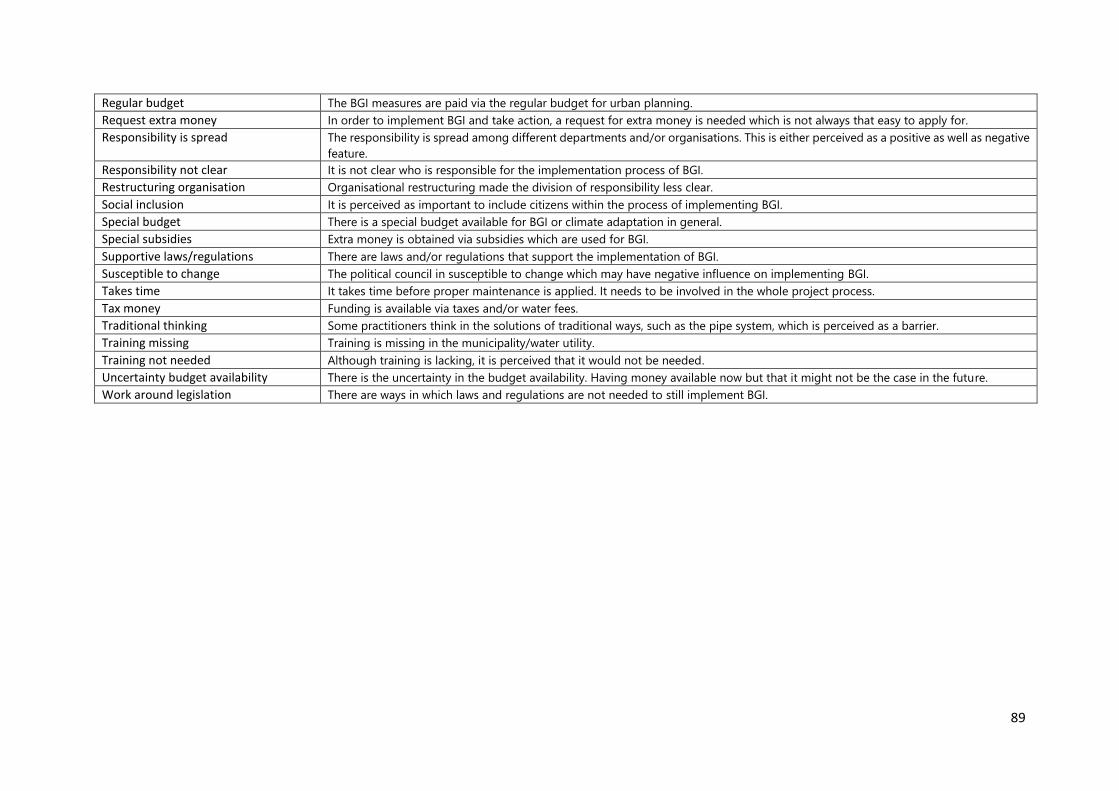
89
Regular budget The BGI measures are paid via the regular budget for urban planning.
Request extra money In order to implement BGI and take action, a request for extra money is needed which is not always that easy to apply for.
Responsibility is spread The responsibility is spread among different departments and/or organisations. This is either perceived as a positive as well as negative
feature. Responsibility not clear It is not clear who is responsible for the implementation process of BGI.
Restructuring organisation Organisational restructuring made the division of responsibility less clear.
Social inclusion It is perceived as important to include citizens within the process of implementing BGI.
Special budget There is a special budget available for BGI or climate adaptation in general.
Special subsidies Extra money is obtained via subsidies which are used for BGI.
Supportive laws/regulations There are laws and/or regulations that support the implementation of BGI.
Susceptible to change The political council in susceptible to change which may have negative influence on implementing BGI.
Takes time It takes time before proper maintenance is applied. It needs to be involved in the whole project process.
Tax money Funding is available via taxes and/or water fees.
Traditional thinking Some practitioners think in the solutions of traditional ways, such as the pipe system, which is perceived as a barrier.
Training missing Training is missing in the municipality/water utility.
Training not needed Although training is lacking, it is perceived that it would not be needed.
Uncertainty budget availability There is the uncertainty in the budget availability. Having money available now but that it might not be the case in the future.
Work around legislation There are ways in which laws and regulations are not needed to still implement BGI.