Embed Size (px)
Citation preview
THE IMPACTS OF THE EU SUBSIDIES ON THE PRODUCTION OF ORGANIC FARMSMarie PechrováCzech University of Life Sciences Prague, Faculty of Ecoomics and Management
February 4th, 2014

1. Content
Introduction Materials and Methods Results and Discussion Conclusion References
2
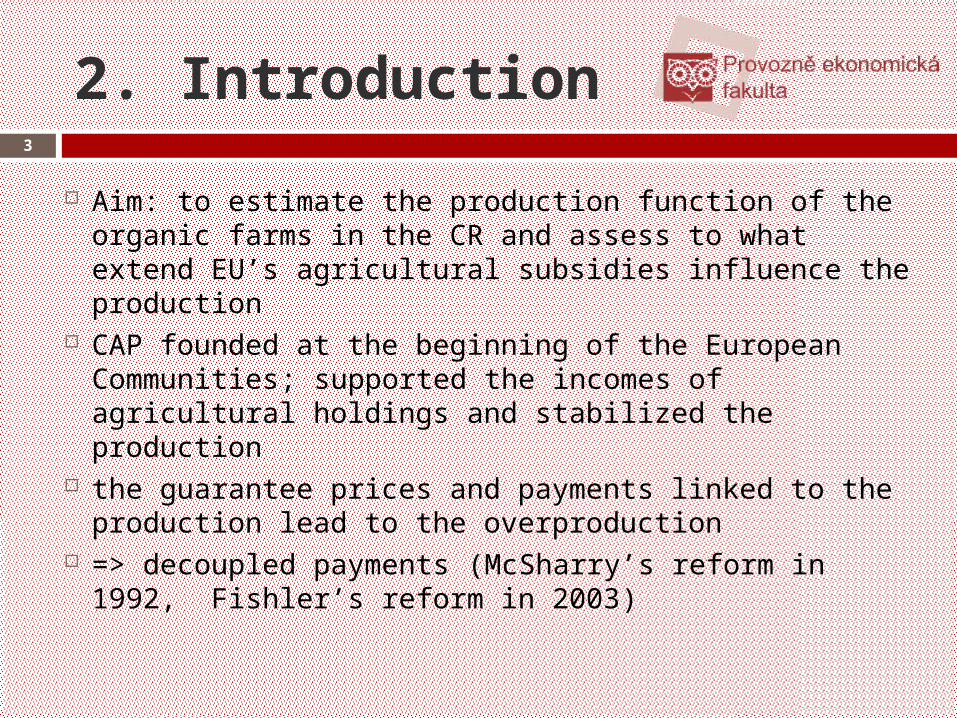
2. Introduction
Aim: to estimate the production function of the organic farms in the CR and assess to what extend EU’s agricultural subsidies influence the production
CAP founded at the beginning of the European Communities; supported the incomes of agricultural holdings and stabilized the production
the guarantee prices and payments linked to the production lead to the overproduction
=> decoupled payments (McSharry’s reform in 1992, Fishler’s reform in 2003)
3
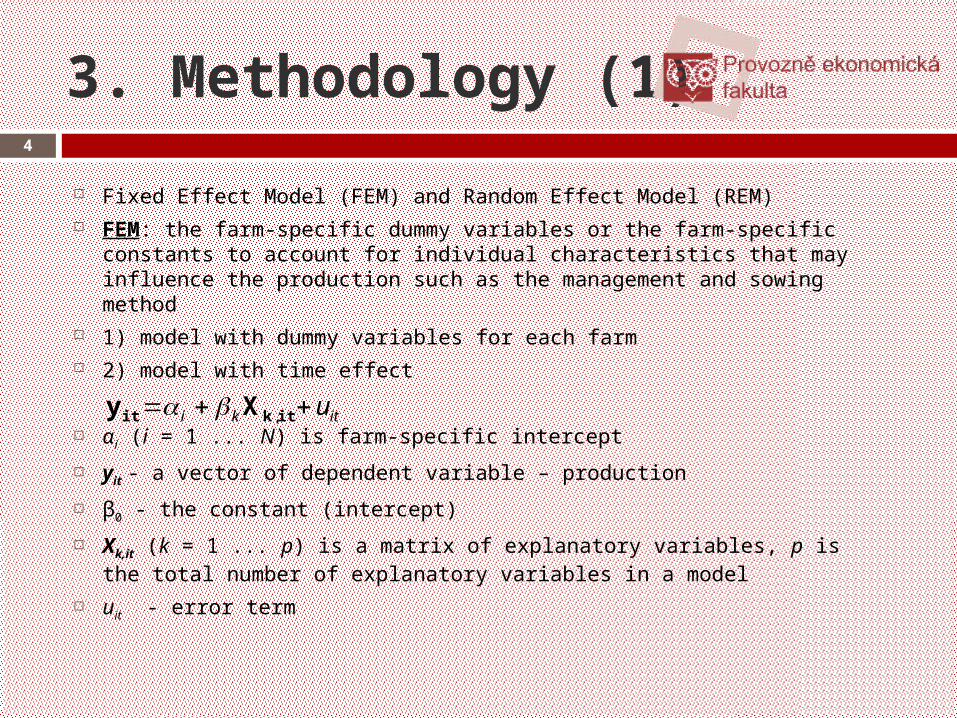
3. Methodology (1)
Fixed Effect Model (FEM) and Random Effect Model (REM) FEM: the farm-specific dummy variables or the farm-specific
constants to account for individual characteristics that may influence the production such as the management and sowing method
1) model with dummy variables for each farm 2) model with time effect
αi (i = 1 ... N) is farm-specific intercept
yit - a vector of dependent variable – production
β0 - the constant (intercept)
Xk,it (k = 1 ... p) is a matrix of explanatory variables, p is the total number of explanatory variables in a model
uit - error term
4
itki u itkit Xy ,
3. Methodology (2)
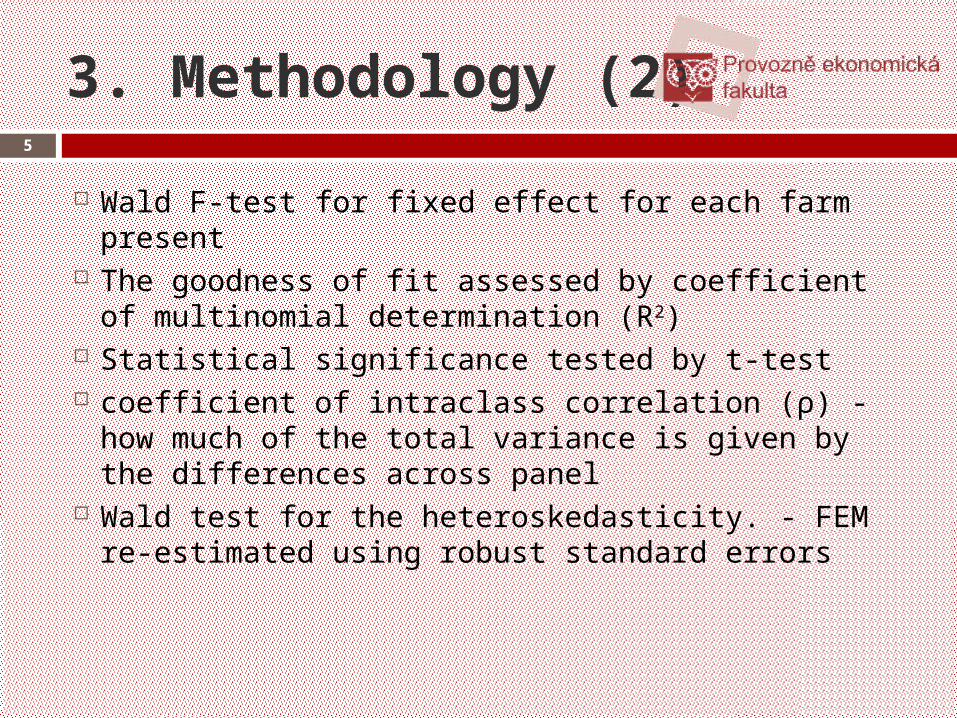
Wald F-test for fixed effect for each farm present
The goodness of fit assessed by coefficient of multinomial determination (R2)
Statistical significance tested by t-test coefficient of intraclass correlation (ρ) - how
much of the total variance is given by the differences across panel
Wald test for the heteroskedasticity. - FEM re-estimated using robust standard errors
5
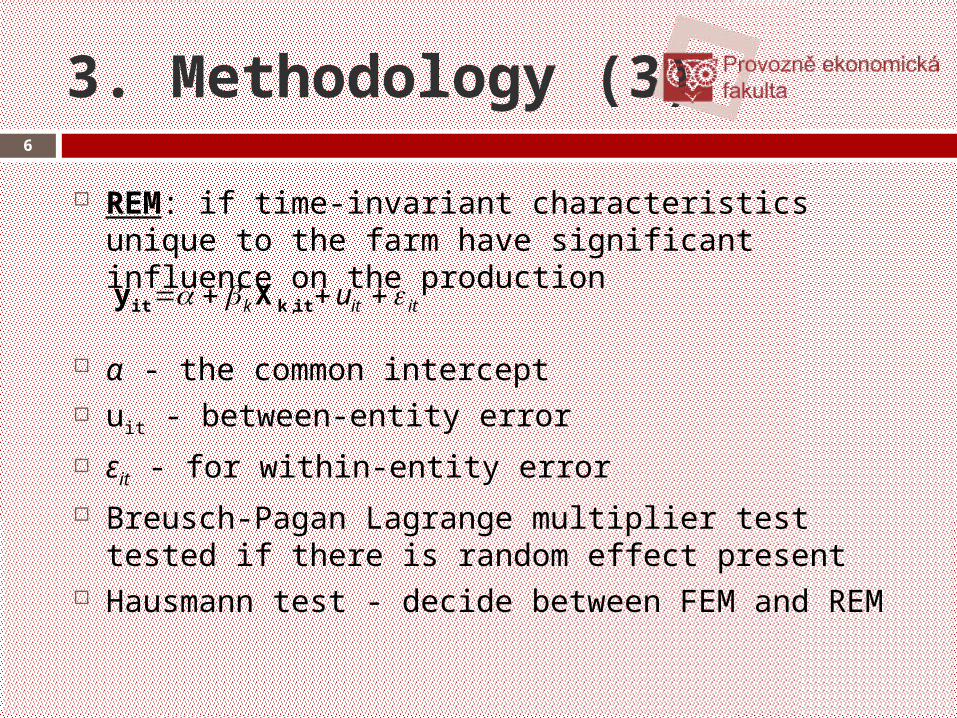
3. Methodology (3)
REM: if time-invariant characteristics unique to the farm have significant influence on the production
α - the common intercept uit - between-entity error
εit - for within-entity error Breusch-Pagan Lagrange multiplier test tested if
there is random effect present Hausmann test - decide between FEM and REM
6
ititk u itkit Xy ,
3. Methodology (4)
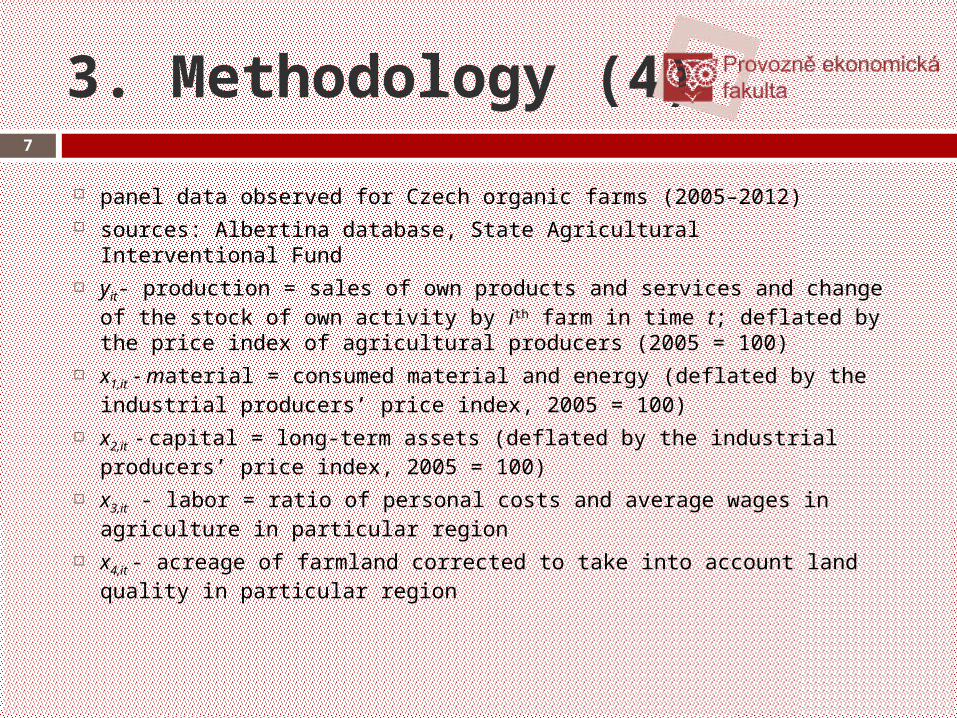
panel data observed for Czech organic farms (2005–2012) sources: Albertina database, State Agricultural Interventional Fund yit- production = sales of own products and services and change of
the stock of own activity by ith farm in time t; deflated by the price index of agricultural producers (2005 = 100)
x1,it - material = consumed material and energy (deflated by the industrial producers’ price index, 2005 = 100)
x2,it - capital = long-term assets (deflated by the industrial producers’ price index, 2005 = 100)
x3,it - labor = ratio of personal costs and average wages in agriculture in particular region
x4,it - acreage of farmland corrected to take into account land quality in particular region
7
3. Methodology (5)
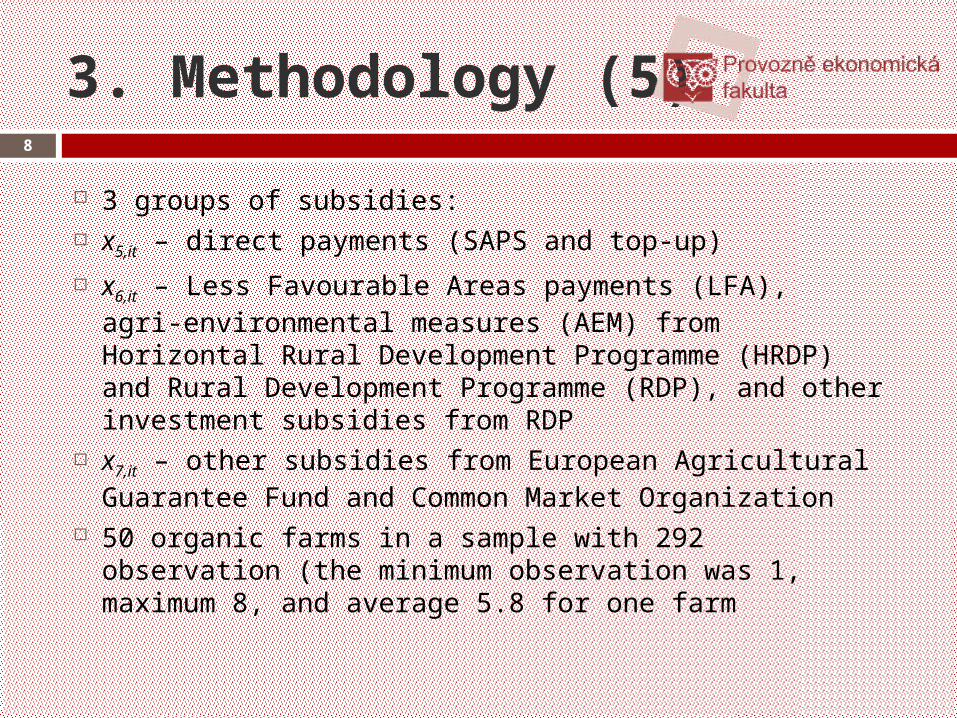
3 groups of subsidies: x5,it – direct payments (SAPS and top-up)
x6,it – Less Favourable Areas payments (LFA), agri-environmental measures (AEM) from Horizontal Rural Development Programme (HRDP) and Rural Development Programme (RDP), and other investment subsidies from RDP
x7,it – other subsidies from European Agricultural Guarantee Fund and Common Market Organization
50 organic farms in a sample with 292 observation (the minimum observation was 1, maximum 8, and average 5.8 for one farm
8
4. Results (1)9
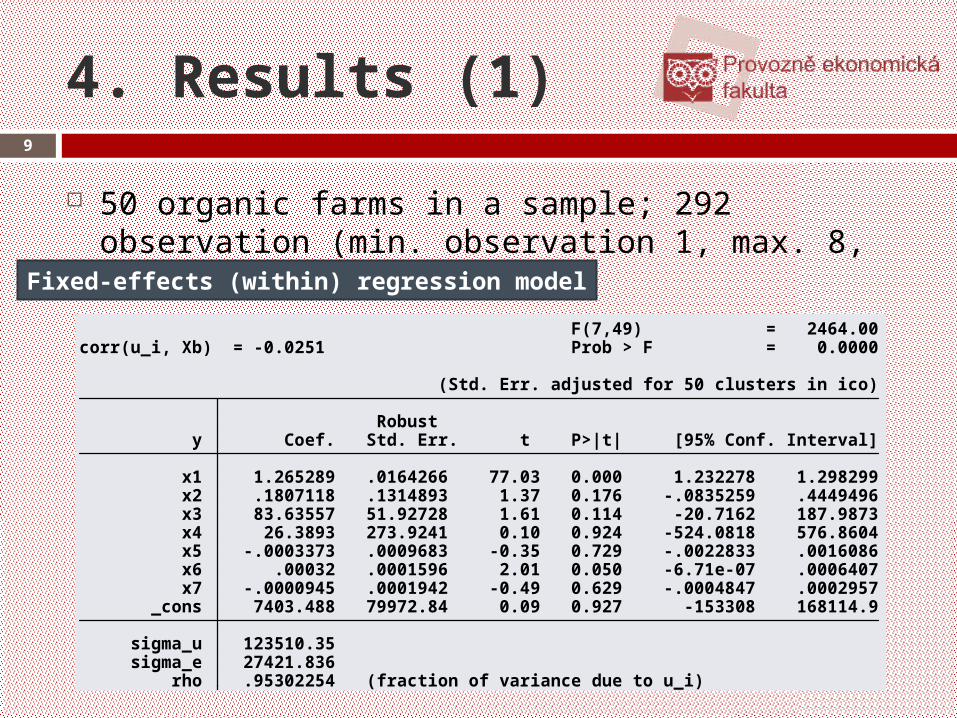
50 organic farms in a sample; 292 observation (min. observation 1, max. 8, average 5.8 for one farm)Fixed-effects (within) regression model
rho .95302254 (fraction of variance due to u_i) sigma_e 27421.836 sigma_u 123510.35 _cons 7403.488 79972.84 0.09 0.927 -153308 168114.9 x7 -.0000945 .0001942 -0.49 0.629 -.0004847 .0002957 x6 .00032 .0001596 2.01 0.050 -6.71e-07 .0006407 x5 -.0003373 .0009683 -0.35 0.729 -.0022833 .0016086 x4 26.3893 273.9241 0.10 0.924 -524.0818 576.8604 x3 83.63557 51.92728 1.61 0.114 -20.7162 187.9873 x2 .1807118 .1314893 1.37 0.176 -.0835259 .4449496 x1 1.265289 .0164266 77.03 0.000 1.232278 1.298299 y Coef. Std. Err. t P>|t| [95% Conf. Interval] Robust (Std. Err. adjusted for 50 clusters in ico)
corr(u_i, Xb) = -0.0251 Prob > F = 0.0000 F(7,49) = 2464.00
overall = 0.3198 max = 8 between = 0.2678 avg = 5.8R-sq: within = 0.6074 Obs per group: min = 1
Group variable: ico Number of groups = 50Fixed-effects (within) regression Number of obs = 292
. xtreg y x1 x2 x3 x4 x5 x6 x7, fe robust
4. Results (2)10
FEM: calculated using within estimator presence of heteroskedasticity => the robust
standard errors R2 = 96.81 % => the conformity with data is
high 95.30 % (rho = 0.9530) of the variance is due
to differences across panel material, and RDP subsidies statistically
significant fixed effect exists
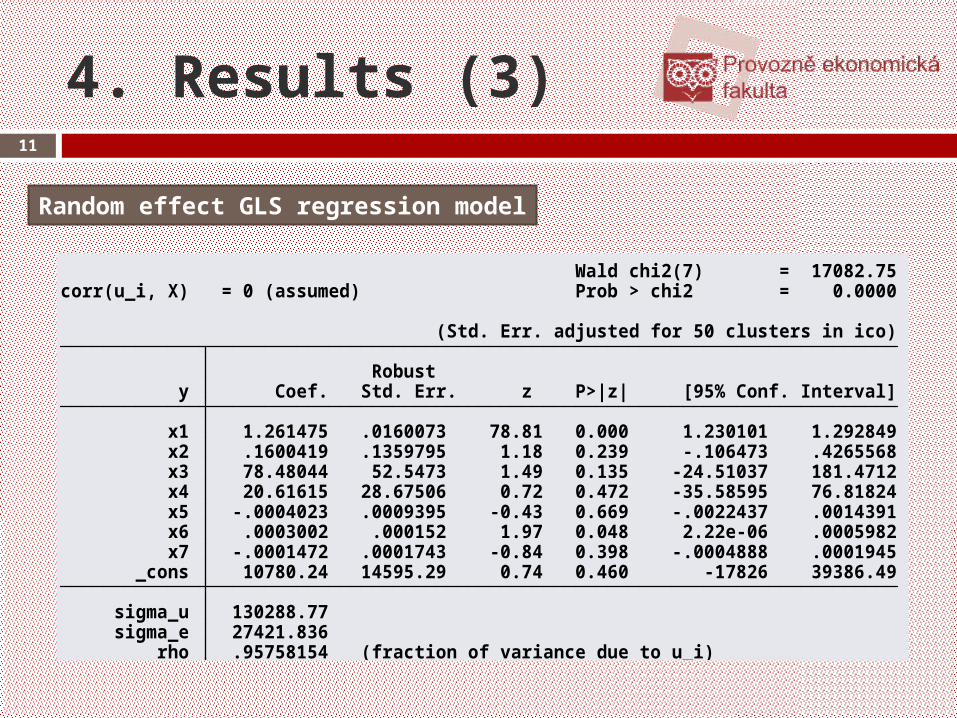
4. Results (3)11
Random effect GLS regression model
rho .95758154 (fraction of variance due to u_i) sigma_e 27421.836 sigma_u 130288.77 _cons 10780.24 14595.29 0.74 0.460 -17826 39386.49 x7 -.0001472 .0001743 -0.84 0.398 -.0004888 .0001945 x6 .0003002 .000152 1.97 0.048 2.22e-06 .0005982 x5 -.0004023 .0009395 -0.43 0.669 -.0022437 .0014391 x4 20.61615 28.67506 0.72 0.472 -35.58595 76.81824 x3 78.48044 52.5473 1.49 0.135 -24.51037 181.4712 x2 .1600419 .1359795 1.18 0.239 -.106473 .4265568 x1 1.261475 .0160073 78.81 0.000 1.230101 1.292849 y Coef. Std. Err. z P>|z| [95% Conf. Interval] Robust (Std. Err. adjusted for 50 clusters in ico)
corr(u_i, X) = 0 (assumed) Prob > chi2 = 0.0000 Wald chi2(7) = 17082.75
overall = 0.3215 max = 8 between = 0.2693 avg = 5.8R-sq: within = 0.6073 Obs per group: min = 1
Group variable: ico Number of groups = 50Random-effects GLS regression Number of obs = 292
. xtreg y x1 x2 x3 x4 x5 x6 x7, re robust
4. Results (4)12
REM: estimated already with robust standard errors using General Least Squares (GLS) regression
model is statistically significant parameters for material and RDP subsidies are
statistically significant 95.76 % (rho = 0.9576) of the variance is due to
the differences across panel Breusch and Pagan Lagrangian multiplier test for
random effects => also a random effect present
4. Discussion
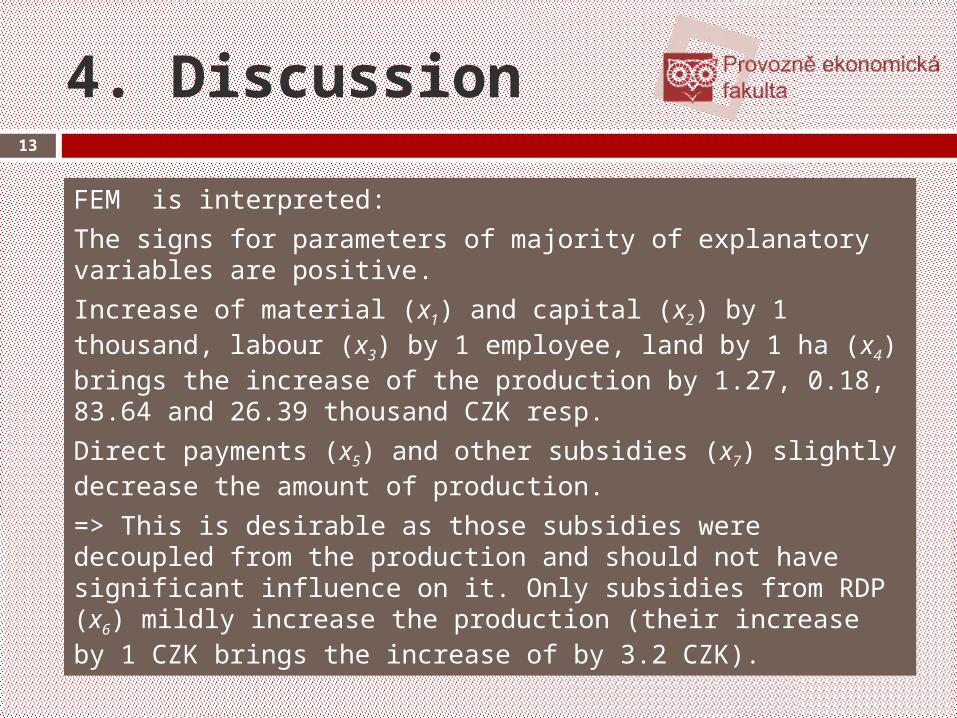
FEM is interpreted:
The signs for parameters of majority of explanatory variables are positive.
Increase of material (x1) and capital (x2) by 1 thousand, labour (x3) by 1 employee, land by 1 ha (x4) brings the increase of the production by 1.27, 0.18, 83.64 and 26.39 thousand CZK resp.
Direct payments (x5) and other subsidies (x7) slightly decrease the amount of production.
=> This is desirable as those subsidies were decoupled from the production and should not have significant influence on it. Only subsidies from RDP (x6) mildly increase the production (their increase by 1 CZK brings the increase of by 3.2 CZK).
13
6. Conclusion
The aim was to assess the impact of EU agricultural subsidies on production of organic farms.
McSharry’s reform in 1992 and Fishler’s reform of CAP in 2003 decoupled the direct payments from production.
SAPS and other subsidies mildly decrease the production.
=> The decoupling of the direct payments had desirable effect.
On the other hand, agri-environmental payments from RDP and HRDP, LFA payments, and other subsidies from RDP tend to increase the production.
=> It might be due to the fact that RDP includes also investment subsidies for farms’ modernization which can lead to higher output.
14
7. References
BEARD, N., SWINBANK, A., Decoupled payments to facilitate CAP reform. Food Policy, 2001, vol. 26, no. 2001, pp. 121–145, ISSN 0306-9192.
BREEN, J.P., C. HENNESSY, T. C., THORNE, F. S., The effect of decoupling on the decision to produce: An Irish case study. Food Policy, 2005, vol. 30, no. 2005, pp. 129–144, ISSN 0306-9192.
CISILINO, F. et al., The effects of decoupling on the COP sector in Italy: an ex-post performance analysis. PAGRI, 2012, vol. 2, no. 2012, pp. 47–63.
KATRANIDIS S. D., KOTAKOU, C. A., Are CAP Decoupling Policies Really Production Neutral? 12th Congress of the European Association of Agricultural Economists – EAAE 2008, 2008, vol. 12, no. 2008, pp. 1–8.
OFFERMANN F., NIEBERG, H., ZANDER K., Dependency of organic farms on direct payments in selected EU member states: Today and tomorrow. Food Policy, vol. 34, no. 2009, pp. 273–279, ISSN 0306-9192.
VIAGGIA, D., RAGGIB, M., GOMEZ Y PALOMA, S., Farm-household investment behaviour and the CAP decoupling: Methodological issues in assessing policy impacts. Journal of Policy Modeling, 2011, vol. 33, no. 2011, pp. 127–145. ISSN 0161-8938.
15
Thank you for your attention.
Czech University of Life Sciences Prague, Faculty of Economics and [email protected]