Embed Size (px)
Citation preview

The Impacts of School Management Reforms in Madagascar: Do the Impacts Vary by Teacher Type?
Paul Glewwe and Eugenie Maïga
Department of Applied Economics University of Minnesota
St. Paul, MN 55108 U.S.A.
June, 2011
Abstract
This paper exploits a recently implemented randomised control trial in Madagascar that focused on management reforms. It investigates whether the impact of the reforms varies by the type of teacher. This is an important issue because Madagascar, like many other developing countries, has recently hired a large number of contract or temporary teachers, who have less training but may be motivated to work harder in order to have their contracts renewed. The management reforms did not have any impact on student test scores. This lack of an impact holds for all types of teachers. It may be that two years is not enough time for the program to have had a measurable impact, but it is also possible that the program is ineffective, at least in the context of Madagascar’s educational system. The authors are indebted to Esther Duflo for her contribution to setting up the experimental design for this impact evaluation. They also thank the staff at Madagascar’s Ministry of Education, led by Tahinarinoro Razafindramary and Paul Randrianirina, and the staff of Aide et Action, for help in designing the workflow tools, implementing the experiment, and collecting the data. The authors also appreciate Pierre-Emmanuel Couralet and Erika Strand for on-the-ground supervision during the experiment and Mathieu Laroche and Muriel Nicot-Guillorel for technical support to the Malagasy counterparts. The authors also thank Sajitha Bashir, Benu Bidani, Robert Blake, Deon Filmer, Elizabeth King, Arianna Legovini, Robert Prouty, Lina Rajonhson, Patrick Ramanantoanina, and Venkatesh Sundararaman who provided input, advice, and comment to guide the design of the experiment, among them. Finally, the authors acknowledge the support of the World Bank and the governments of France, Ireland, Madagascar, and Norway, as well as that of the donor partners of the Education for All Fast Track Initiative through the Education Program Development Fund.

1
I. Introduction
Most economists agree that an educated population is necessary for sustained economic
growth. While economists and other researchers have had some success in understanding what
policies encourage parents to send their children to school, they have had less success in
understanding what policies and programs increase learning among students who are in school
(Glewwe and Kremer, 2006). In recent years, many economists have used randomised control
trials to try to estimate the impact of specific policies or programs on student learning. This
paper adds to that literature by examining the impact of a school management program in
Madagascar, and how those impacts vary by the type of teacher.
There is ample evidence that students’ academic performance is very low in many
developing countries (Glewwe and Kremer, 2006; Hanushek and Woessmann, 2008). While
earlier research focused on school and teacher characteristics, such as availability of textbooks
and teachers’ levels of education, more recent research examines school organization and
management. This paper exploits a recently implemented randomised control trial in
Madagascar that focused on management reforms. While others have recently estimated the
impact of these reforms (Lassibille et. al, 2010), this paper goes further by investigating whether
the impact of the reforms varies by the type of teacher. This is an important issue because
Madagascar, like many other developing countries, has recently hired a large number of contract
or temporary teachers, who have less training but may be motivated to work harder in order to
have their contracts renewed. More specifically, this paper examines whether there is
heterogeneity in treatment effects by estimating separate effects for different types of teachers:
regular (civil service) teachers, contract teachers, and student teachers.

2
Summarizing the results, of the three variants of the management reforms – district level,
sub-district level and school level -- none had any impact on student test scores. Note, however,
that many of the estimates are not very precise. Turning to the relative performance of the three
interventions, no significant differences were found between the district level and sub-district
level interventions. The school level intervention seems to have had larger impacts on test scores
in the first year of the program, relative to the district level intervention. Similar results hold for
the school level intervention relative to the sub-district level intervention.
The remainder of this paper is organised as follows. The next section briefly reviews the
literature on the impact of school management reforms in developing countries. Section III
describes Madagascar’s education system, and the recently enacted school management reforms.
The following section presents the data and the methodology used. The estimation results are
shown in Section V, and a final section concludes and provides suggestions for future research.
II. Literature Review
In recent years, policymakers in poor countries, with the help of their development
partners (international and bilateral development agencies), have improved educational
opportunities for millions of children in those countries. Primary school enrolment rates have
increased dramatically in most developing countries since the Education for All initiative was
launched in 1990. For example, in Sub-Saharan Africa the average primary net enrolment rate
increased from 54% to 70% between 1999 and 2006, and in South and West Asia it rose from
75% to 86% (UNESCO, 2009). Yet the quality of education remains a serious concern. Some of
the reasons put forward to explain the meagre outcomes are poor school management, poor
infrastructure, low teacher quality and lack of teachers (the recent increases in enrolment have
raised pupil-teacher ratios in many countries).

3
To reduce the recent shortage of teachers, many developing countries have hired contract
teachers. Another recent policy concerns school management; local accountability has been
proposed to improve education quality (World Bank, 2004). This paper focuses on both of these
issues for one country: Madagascar.
In recent years, many developing countries, including Madagascar, have increased
enrolment rates and in some cases student performance by hiring contract teachers, who typically
have less education and training than regular, civil service teachers (Duflo et al., 2007). These
teachers are paid much lower salaries than civil service teachers, for example 40% of regular
teachers’ salaries in Togo (De Laat and Vegas, 2005), and have little or no “security” that assures
them a permanent job. Another common characteristic of contract teachers is that they are often
hired from the local community.
There is much debate about the quality of contract teachers; opponents argue that they are
unqualified, but advocates claim that they exert greater effort because of their tenuous job status
(their contracts are usually for only one year, and they have no employment protections). A
relatively new literature on contract teachers has investigated the impact of hiring such teachers
on schooling outcomes. De Laat and Vegas (2005) found that, controlling for teacher education
and experience, students of regular teachers in Togo scored higher on tests than students of
contract teachers. Relative to civil service teachers of any experience level, experienced contract
teachers’ students’ normalised test scores are lower by 0.423, and for inexperienced contract
teachers they are lower by 0.087. When teacher education and experience are not controlled for,
there is no significant difference in performance between the two types of teachers. Since
contract teachers in Togo are more educated than regular teachers, and given the strong positive
correlation between student performance and teacher’s education level, this suggests that more

4
educated contract teachers exert lower effort, but due to their higher teaching skills their students
do as well as the students of regular teachers. Duflo et. al. (2007) found that hiring of contract
teachers combined with class size reductions significantly increased students’ test scores in
Kenya. In India, contract teachers are hired from the local community and are paid only a small
fraction of regular teacher salaries; Muralidharan and Sundararaman (2010) find that contract
teachers are at least as effective as regular civil service teachers in raising student learning.
Finally, Bettinger and Long (2006) examined the impact of the type of instructor on U.S.
students’ interest in college classes. They found that adjunct professors and graduate assistants
negatively affect students’ interest in the humanities but positively affect them in some technical
and professional fields. Although their paper focuses on college students, as opposed to primary
school students, their finding of the importance of the type of instructor highlights teacher type
as a key variable in predicting students’ performance.
With regard to school management, centralised school systems are often thought to be of
high cost and low quality. To remedy that, decentralised (locally controlled) systems have been
implemented in many countries, such as El Salvador and Venezuela. Jimenez and Sawada
(1999) analyzed the effectiveness of El Salvador’s community-managed (EDUCO) schools. The
community participates in hiring and firing teachers, purchasing supplies, and maintenance in
EDUCO schools. Community and parental involvement appeared to reduce student absenteeism
and increase their language test scores. Allcott and Ortega (2009) analyzed the performance of
decentralised (Fe y Alegría) schools in Venezuela. They found that students in Fe y Alegría
schools, which are private Catholic schools, perform better on tests than public school students,
and they argue that the better performance of Fe y Alegría schools is due to their decentralised
nature.

5
In September 2005, with the assistance of the World Bank, Madagascar introduced the
AGEMAD (Amélioration de la Gestion de l’Education àMadagascar) program, which was
designed to improve primary school management.1 To facilitate evaluation of the program’s
impacts on education outcomes, it was implemented as a randomised control trial. Thus far two
evaluations have been conducted of the AGEMAD program. First, a World Bank report (2008)
on all aspects of the program found no significant impact on teacher absenteeism. It also found
that, for schools in groups that received the district and sub-district level interventions, no
significant impacts were found in either the proportion of teachers that use all of the “essential
tools”2 or the proportion of schools that are considered well managed. However, comparisons of
the school level intervention to the control group revealed significant differences in the
proportion of teachers that use all of the “essential tools” (63% versus 42%) and the proportion
of schools that are considered “well managed” (37 % versus 15%).3 Similar results were found
for student dropout and repetition rates. Statistically significant differences were also found
between the school level intervention and the district and sub-district level interventions for
Mathematics, Malagasy, and overall test scores.
In a second study, Lassibille et al. (2010) examined the impact of the program (described
in more detail in Section III) on primary education management and outcomes. They found little
evidence that district and sub-district level interventions improved school management. In
contrast, they found that combining district and sub-district interventions with school level
interventions raised outcomes; teachers’ behaviour improved (in terms of teachers’ lesson
planning and frequency of student evaluation), and students’ mathematics and Malagasy test
scores increased by 0.1 standard deviations.

6
Neither of these studies examined whether the AGEMAD program’s impacts on students’
test scores varied by the type of teacher. Yet the management reforms recently enacted in
Madagascar could have different effects for different types of teachers. For example, the reforms
could increase the incentives and/or motivation of regular teachers, who currently face few
incentives. On the other hand, the incentives already in place for contract teachers may motivate
them to take advantage of the opportunities provided by the management reforms since doing so
may increase their performance and thus their job security.
III. Education in Madagascar, and the AGEMAD Program
This paper evaluates the impact of the AGEMAD program on student learning in
Madagascar, and whether that impact varies by the type of teacher. The AGEMAD program is a
management system designed to improve the management and performance of primary
education in Madagascar. The long-term plan is to implement this program nationwide. Before
doing so, AGEMAD was implemented in a representative sample of school districts (called
CISCOs, of which there are 111 in Madagascar). To obtain unbiased estimates of the impacts of
AGEMAD on various educational outcomes, a randomised control trial was implemented.
A. Madagascar’s Education System. This subsection describes Madagascar’s system
of education. That system consists of 5 grades in primary school, 4 grades in lower secondary
school, 3 grades in upper secondary school, and several types of post-secondary education.
Because AGEMAD is implemented only in primary schools, the focus is on those schools.
In 2005, the gross primary enrolment rate in Madagascar was 123.4%. The primary gross
enrolment rate is defined as the total number of pupils enrolled in primary school, regardless of
age, divided by the population in the theoretical age group for primary education. In recent years,

7
Madagascar has attempted to increase primary enrolment rapidly by hiring large numbers of new
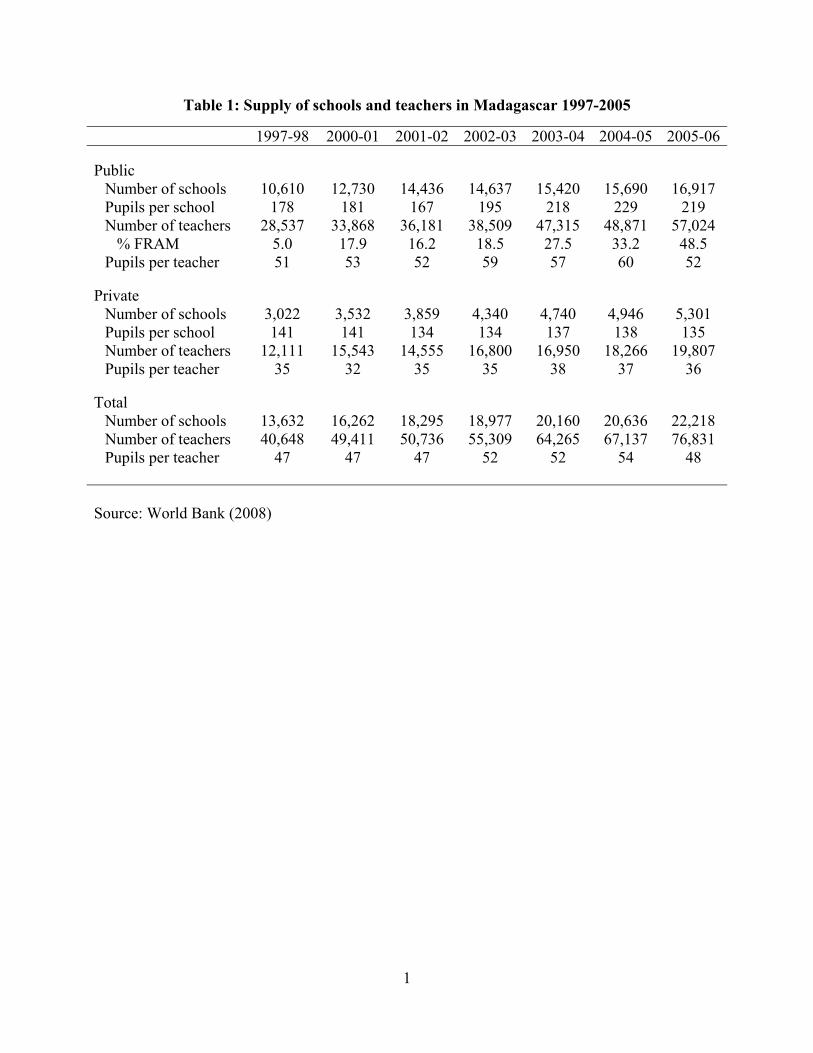
teachers. Almost all of the newly hired teachers were contract teachers. Table 1 shows trends in
the numbers of primary schools and teachers in Madagascar from 1997-98 to 2005-06. FRAM is
the acronym for Fikambanan’ny Ray Amandrenin’ny Mpianatra, which are parent-teacher
associations that hire contract teachers, called FRAM teachers. The percentage of teachers who
are FRAM contract teachers rose from 5% in 1997-98 to 48.5% in 2005-06.
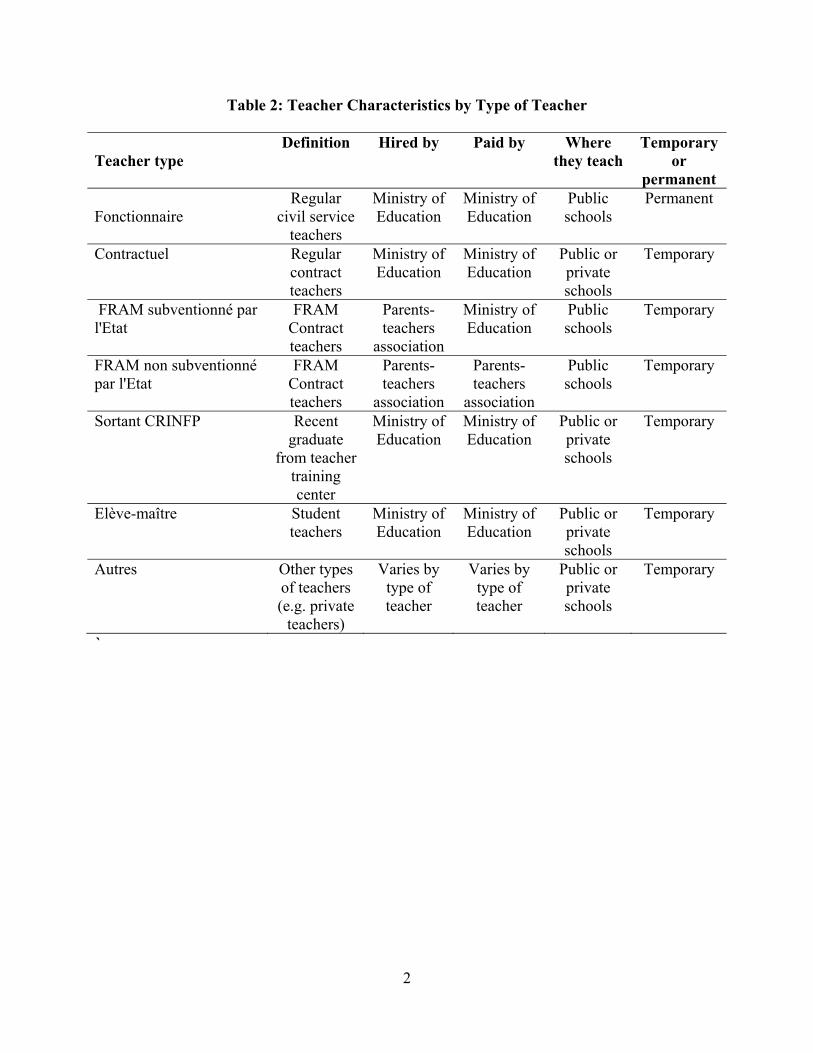
The rest of this subsection describes the different types of teachers, and explains why
almost all recently hired teachers were contract teachers. There are seven types of primary school
teachers in Madagascar: regular civil servants (fonctionnaire), regular contract teachers
(contractuel), contract teachers hired and paid by the community (FRAM non subventionné par
l’Etat), contract teachers hired by the community but paid by the government (FRAM
subventionné par l’Etat), teachers that have just graduated from teacher training (sortant
CRINFP), student teachers (Elève-maître), and other (autres, which includes teachers paid by
NGOs and teachers in private schools). Their characteristics are summarised in Table 2.
Regular civil servant teachers (“fonctionnaires”) and are paid on a 12-month basis by the
Ministry of Education. Their employment is stable and they have many years of experience; in
the AGEMAD data (described below) fonctionnaires have, on average, more than 20 years of
experience. They constitute 52.6% of the teachers in the sample.
Contract teachers are about 44.7% of all primary school teachers in Madagascar in the
data. There are two groups of contract teachers: “regular” contract teachers (“contractuels”) and
FRAM contract teachers (which are further divided into those paid and those not paid by the
Ministry or Education). Regular contract teachers (contractuels) are directly hired by the
Ministry of Education; they are about 8% of the teachers in the AGEMAD data. In contrast,
8
FRAM contract teachers were initially hired and paid by local parent-teacher associations, but
since 2003 most have been paid by the Ministry of Education (though they are still hired by the
FRAMs). They represent about one third of the teachers in the data. For the school year 2006-
07, their monthly salary was about 60,000-70,000 Ariary Mg ($31-36), versus an average of
189,000 Ariary Mg for regular civil service teachers. Before 2006, FRAM teachers were paid
only for 9 months per year, while regular teachers were paid for all 12 months. Yet starting in
the school year 2006-2007 FRAM teachers have also been paid for 12 months. Although they are
paid less, they are often more qualified than regular teachers; for example, about 21% have a
high school diploma, versus 8% for regular teachers. Indeed, they are even slightly more
educated than the sub-district heads (18% of whom have a high school diploma) who are
supposed to train and guide them (World Bank, 2008).
The “sortant CRINFP” teachers are recent graduates from the pedagogical training
institute (Centre Régional de l’Institut National de Formation Pédagogique). They are only
0.8% of the teachers in the data. Student teachers (Elève-maître) are teachers who are still in
training; they constitute only 1.8% of teachers in the data. The ‘Autres” category is made of
teachers paid by NGOs and other types of teachers; they are only 0.3 % of teachers in the data.
B. Description of the AGEMAD Program. The AGEMAD program was first
implemented in Madagascar’s primary schools in September of 2005. It is designed to streamline
the administration of the system (direct objectives) and improve student learning (indirect
objectives). More specifically, the AGEMAD program has three (direct) objectives: (1) Explain
to district heads, sub-district heads, school principals, and teachers their responsibilities, and
provide them with materials and procedures to accomplish their tasks; (2) Promote supervision
and follow-up at key positions in the administrative hierarchy; and (3) Facilitate school-

9
community interactions and promote accountability for results through the use of school report
cards.
The AGEMAD program consists of three distinct interventions. Each intervention
provides “tools”, that is methods and materials, that were designed to help various employees of
the Ministry of Education (district heads, sub-district heads, school principals, and teachers) do
their work and, ultimately, improve educational outcomes. The first intervention consisted of
providing CISCO (district) heads with tools to accomplish their tasks, and training on the use of
these tools. Other CISCO level administrative staff (financial officers, pedagogical officers, and
programming officers) also received training on the AGEMAD program. Tools for CISCO
heads included: a teacher transfer master sheet, a pedagogical supplies form, and a class
observation grid. This intervention will be referred to as the CISCO level intervention.
The second intervention was implemented at the sub-district (ZAP) level. (A typical
CISCO has about 10 to 15 ZAPs.) It consisted of providing operational tools to ZAP (sub-
district) heads that were designed to help them monitor and support their schools. In contrast to
the CISCO level intervention, only the ZAP heads received the AGEMAD tools and training; no
other ZAP level staff participated. Tools provided at the ZAP level included: pedagogical
supervision and support forms, and report cards on the performance of, and the resources for,
each school in the ZAP. This intervention will be referred to as the ZAP level intervention.
Note that this second intervention was implemented only in ZAPs that belonged to CISCOs in
which the CISCO intervention was implemented. Thus any ZAP that has the ZAP level
intervention also has the CISCO level intervention.
The third AGEMAD intervention was at the school level. It consisted of providing
educational and administrative tools to teachers (e.g. lesson planning forms, records of student

10
attendance and learning, and reports to parents and school directors) and to school principals
(directors), who were provided with tools to better manage their schools (e.g. attendance
registers to monitor teachers’ absence, summaries of student test scores, and community meeting
forms). In addition, school meetings were held to discuss school report cards, in order to
encourage parental and community involvement in monitoring school quality. This intervention
will be called the school level intervention. Note that it was implemented only for schools that
belonged to ZAPs that were selected to implement the ZAP level intervention (and thus only for
schools in CISCOs that implemented the CISCO-level intervention). Thus any school that
implemented the school level intervention is always in a ZAP that implemented the ZAP level
intervention and in a CISCO that implemented the CISCO level intervention.
C. Design of the Experiment. The three interventions described above were randomly
assigned to different schools as follows. First, 30 CISCOs (school districts) were randomly
assigned so that 15 received the CISCO-level intervention while the other 15 did not receive it.
Note that these 30 CISCOs were not randomly selected from Madagascar’s 111 CISCOs; rather
they were selected based on their similarity and ease of access. Second, within each of the 15
treated CISCOs all ZAPs were randomly assigned to receive (or not receive) the ZAP-level
intervention. More specifically, from the 259 ZAPs in the 15 treated CISCOs, 89 were randomly
selected to receive the ZAP-level intervention, and the remaining 170 did not receive it (of these
170, data were collected from only 84). Within the 89 ZAPs that received both the CISCO- and
ZAP-level interventions there are 739 schools. From these schools, 303 were randomly selected
to receive a school-level intervention, while the other 436 did not receive it (of these, data were
collected from only 303). This randomization scheme is shown in Figure 1.
Overall, this randomization scheme created one control group and three treatment groups:

11
Control group - 1,721 schools (of which data were collected from 303) in the 15 non-
treated CISCOs.
Treatment 1 - 1,314 schools (of which data were collected from 303) in the 15 treated
CISCOs that received only the CISCO-level intervention. Henceforth, these schools will
be referred to as treatment 1 schools, or CISCO-AGEMAD schools.
Treatment 2 - 436 schools (of which data were collected from 303) in the 15 treated
CISCOs and the 89 treated ZAPs that received both the CISCO- and ZAP-level
interventions, but not the school-level intervention because they were not selected for that
intervention. Henceforth, these schools are referred to as the treatment 2 schools, or the
ZAP-AGEMAD schools.
Treatment 3 - 303 schools in the 15 treated CISCOs and the 89 treated ZAPs that
received all three levels of treatment (CISCO, ZAP and school) because they were
selected to receive the school-level interventions. Henceforth, these schools will be
referred to as the treatment 3 schools, or the FULL-AGEMAD schools.
Comparing these four types of schools allows one to answer several different questions
about the AGEMAD program. Comparison of Treatment 1 schools with the control group
schools estimates the effect of a “cascade” or “training-of-trainers” model for implementing the
program. Comparing Treatment 2 schools to the control group schools gives the effect of a more
intensive “cascade” model (both district and sub-district interventions). Comparing Treatment 3
schools to the control group schools allows one to identify the maximum possible impact of the
full AGEMAD program, with CISCO, ZAP, and school-level interventions.
In addition, one can estimate the relative effectiveness of different interventions. First,
comparing Treatment 3 schools to Treatment 2 schools reveals whether adding the school level
12
intervention to schools that already have the district (CISCO) and sub-district (ZAP)
interventions leads to further improvements in student outcomes. Second, comparison of
Treatment 2 schools to Treatment 1 schools shows whether the more intensive “cascade” or
“training-of-trainers” intervention, the one implemented at the CISCO and the ZAP levels, has a
significantly stronger impact than implementing only the CISCO level intervention.
To ensure that the two groups of 15 CISCOs are comparable, the assignment of the 30
CISCOs to the treatment and control groups was done after stratifying by region, repetition rate,
whether or not the Approche par les Compétences (APC, a pedagogic innovation project) was
implemented, and the presence of Non-Governmental Organizations (NGOs). There are 573
ZAPs and 6,488 schools in these 30 CISCOs. Some ZAPs and schools that are located in remote
areas were excluded (107 ZAPs and 2,714 schools) from the experiment because of difficulty of
access. As a result, the 30 CISCOs have 466 participating ZAPs and 3,774 participating schools,
of which 2,053 schools are in the 15 treated CISCOs and 1,721 are in the 15 control CISCOs.
ZAPs and schools in the treated CISCOs were randomly assigned to treatments 2 and 3
after stratifying by school size and repetition rate. This ensures the similarity of treated groups at
the beginning of the experiment and reduces the variance of the estimated impact of the program.
The final sample for data analysis was obtained by randomly selecting 303 schools from each of
the four intervention groups, which yields a total of 1,212 schools. Program implementation and
data collection were conducted from September 2005 to June 2007.
IV. Data and Methodology
This section describes the data used in the analysis, and the empirical methods to estimate
the impacts of the AGEMAD program.

13
A. Data. The main dependent variables in this study are test scores in three subjects,
French, Malagasy, and Mathematics, that were given to third grade students in 2005-2006 and
fourth grade students in 2006-2007. Including all three subjects, there were 97 questions for the
first year test and 98 for the second year test. The pupils tested during the first year were given
the fourth grade test during the second year regardless of repetition status. Some pupils were not
present in class on the day of the second year’s test (due to absence on that day, switching
schools, or dropping out). Among the absentees, five pupils per school were chosen at random
and tracked down for testing. However, the second year’s test was not given to 3,431 pupils who
could not be found. The same tests were administered to teachers in 2005-06 and 2006-07 (see
table 2.3 of World Bank, 2008) to verify whether those who are supposed to grade the students’
tests know enough to do so (a check of teacher quality/knowledge). The final sample sizes were
24,579 third graders in 2005-06 and 22,038 fourth graders (or third graders who had repeated) in
2006-07.
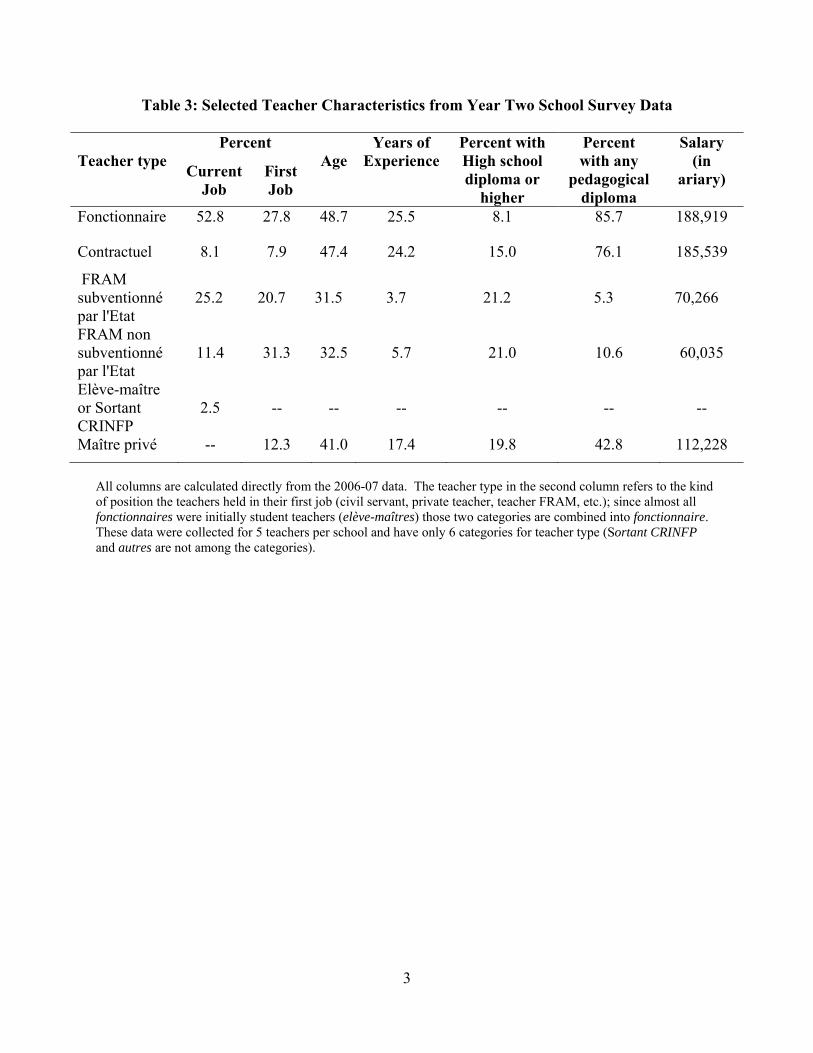
Table 3 provides some basic information on the different types of teachers, using the
2006-07 data. Regular civil servant teachers (“fonctionnaires”) comprise 27.8% of teachers.
They are relatively old (average age of 48.7) and have about 25 years of experience. Their age
and experience reflect the fact that almost all teachers hired in the past decade have been FRAM
teachers, as explained above. While few (8.1%) have a high school diploma, the vast majority
(85.7%) have pedagogical training. Finally, their salaries are relatively high. Contractuel
teachers are relative rare (7.9% of all teachers) but are very similar to regular civil service
teachers. In contrast, the two types of FRAM teachers, which constitute 52% of all teachers, are
much younger (in their early 30s) and so have much less experience (4-6 years), more likely to
have a high school diploma (21%), but much less likely to have formal pedagogical training.

14
Higher education levels in the general population, relative to 20 years ago, may explain why
FRAM teachers are more likely to have a high school diploma. Finally, their salaries are less
than half of those of regular civil service and contract teachers.
For purposes of analysis, these seven types of teachers can be combined into four basic
groups. First, the sortant CRINF’ and Elève-maître categories can be combined to form a new
category, ‘sortant_élève-maître’; the first category represents new graduates from the teacher’s
training centres and the second represents teachers still in training, so their level of experience is
similar. Second, the two FRAM categories can be combined into a single category because they
differ only by who pays their salaries. Finally, the autres (others) category was dropped from the
sample because it combines many different, often not clearly defined, types of teachers that
constitute only 0.3% of the total sample.
B. Methodology. This subsection explains the procedure used to estimate the impact of
the three AGEMAD interventions on students’ test scores in Madagascar. Given the randomised
assignment of CISCOs, ZAPs and schools to treatment and control groups, many econometric
problems that arise in non-experimental data are avoided. Yet there are some issues that require
discussion, and knowledge of the estimation procedure is necessary to interpret the results.
The AGEMAD data have scores for grade 3 students on tests taken in February, 2006,
which is in the middle of the 2005-06 school year. These tests were taken five months after the
program was launched in September of 2005, so analysis of the February 2006 data estimates the
impact of the three interventions after they had been in place for five months. The data also have
scores for grade 4 students on tests given in June of 2007, near the end of the 2006-07 school
year, at which time the program had been operating for two school years. For simplicity, the
2005-06 and 2006-07 school years are called “year 1” and “year 2” of the program, respectively.
15
Recall that the three “treatments” were the CISCO level, the CISCO and ZAP level, and
the CISCO, ZAP and school level interventions. Given random assignment to the treatment and
control groups, the following regression in either year 1 (t=1) or year 2 (t=2) provides the
simplest method to estimate the impacts of the three separate programs (denoted by P1, P2 and
P3) on the test scores of student i at time t (denoted by Tit):
Tit = κt + αtP1i + βtP2i + γtP3i + uit, t= 1, 2 (1)
where P1i is a dummy variable indicating whether student i is in a school that received the
CISCO level treatment (Treatment 1), and P2i and P3i are similarly defined for schools that
received the ZAP (Treatment 2) and school (Treatment 3) level interventions, respectively.
In this simple regression, κt is the average test scores of students in the control schools at
time t (imposing the usual normalisation that E[uit] = 0), and αt, βt and γt are the average impacts
of the three programs on students’ test scores. If t = 1, this regression estimates these three
impacts after only five months (from September 2005 to February 2006), while if t = 2 it
estimates these impacts after two full school years (September 2005 to June 2007).
It is likely that most of the impact of the program by time period 2 (i.e., by June 2007)
would have taken place in the 16 months between time periods 1 and 2 (between February 2006
and June 2007), rather than during the first 5 months of the intervention (from September 2005
to February 2006). For example, there may have been little impact in the first few months
because it probably took some time for education officials to implement and adjust to the
interventions. In this case, it is useful to estimate the impact of the program on “learning gains”
between time periods 1 and 2, because such estimates of program effects may be more precise

16
than those of either year 1 or year 2. There are two ways to estimate learning gains over time.
First, one could estimate the impact of the programs on the “change” in test scores over time:
Ti2 - Ti1 = (κ2 – κ1) + (α2 – α1) P1i + (β2 – β1) P2i + (γ2 – γ1) P3i + (ui2 - ui1) (2)
In this expression, the constant term (κ2 – κ1) is the average change in test scores for students in
the schools that did not participate in any intervention. For each intervention program variable
(P1i, P2i and P3i), the associated coefficient (e.g. (α2 – α1) for the variable P1i) shows how that
intervention added to (or perhaps subtracted from) the average change in test scores experienced
by the control school students. Note that if any intervention’s impact at time period 1, that is
after the program has been in place for five months, is close to zero, then equation (2) provides
an alternative estimate of α2, β2 and γ2 (since α1, β1 and γ1 are close to zero).
The second way to estimate learning gains moves Ti1 in (2) to the right of that equation:
Ti2 = (κ2 – κ1) + (α2 – α1) P1i + (β2 – β1) P2i + (γ2 – γ1) P3i + τ1Ti1 + (ui2 - ui1) (3)
This is more flexible than equation (2) because the τ coefficient may be different from one. Yet
this estimate of τ1 is almost certainly biased since Ti1 is correlated with ui1*, but this does not
cause bias in estimates of (α2 – α1), (β2 – β1) or (γ2 – γ1) because all three P variables are, by
random assignment, uncorrelated with all other variables (Ti1, ui2 and ui1).4
Another possible way to increase statistical efficiency in the estimates of equations (1),
(2) and (3) is to add other explanatory variables to the above regressions. Denoting those
variables by the vector x, we have the following modifications of those regressions:
Tit = κt + αtP1i + βtP2i + γtP3i + δt′xit + uit′, t= 1, 2 (1′)
Ti2 - Ti1 = (κ2 – κ1) + (α2 – α1) P1i + (β2 – β1) P2i + (γ2 – γ1) P3i + (δ2′xi2 – δ1′xi1) + (ui2′ - ui1′) (2′)
17
Ti2 = (κ2 – κ1) + (α2 – α1) P1i + (β2 – β1) P2i + (γ2 – γ1) P3i + (δ2′xi2 – δ1′xi1) + τ1Ti1 + (ui2′ - ui1′) (3′)
The “prime” on the error terms in these regressions indicates that they differ from the error terms
in equations (1), (2) and (3). For example, in equation (1′) they are related as follows: uit = δt′xit
+ uit′. The x variables used in the next section are: a dummy variable for male students; child
age; mothers’ and fathers’ education; and wealth. Whether adding these variables increases
efficiency is an empirical issue that can be settled only by estimating these regressions.
Finally, given that the goal of this paper is to investigate whether the impacts vary by the
type of teacher, all three equations require variables that interact the three program variables with
dummy variables for different types of teachers. As explained above, there are four main types:
regular (civil service) teachers; FRAM contract teachers; other contract teachers, and student
teachers. Using regular teachers as the omitted category, this implies the following regressions
to estimate differential impacts by type of teacher:
Tit = κt + αtP1i + βtP2i + γtP3i + δt′xit + π1tFTi + π2tCTi + π3tSTi
+ θF1tFTi×P1i + θC1tCTi×P1i + θS1tSTi×P1i + θF2tFTi×P2i + θC2tCTi×P2i + θS2tSTi×P2i
+ θF3tFTi×P3i + θC3tCTi×P3i + θS3tSTi×P3i + uit′′, t = 1, 2 (1′′)
Ti2 - Ti1 = (κ2 – κ1) + (α2 – α1) P1i + (β2 – β1) P2i + (γ2 – γ1) P3i + (δ2′xi2 – δ1′xi1)
+ (π12 - π11) FTi + (π22 – π21) CTi + (π32 – π31) STi
+ (θF12 - θF11) FTi×P1i + (θC12 – θC11) CTi×P1i + (θS12 – θS11) STi×P1i
+ (θF22 - θF21) FTi×P2i + (θC22 – θC21) CTi×P2i + (θS22 – θS21) STi×P2i
+ (θF32 - θF31) FTi×P3i + (θC32 – θC31) CTi×P3i + (θS32 – θS31) STi×P3i + (ui2′′ - ui1′′) (2′′)

18
Ti2 = (κ2 – κ1) + (α2 – α1) P1i + (β2 – β1) P2i + (γ2 – γ1) P3i + (δ2′xi2 – δ1′xi1) + τ1Ti1
+ (π12 - π11) FTi + (π22 – π21) CTi + (π32 – π31) STi
+ (θF12 - θF11) FTi×P1i + (θC12 – θC11) CTi×P1i + (θS12 – θS11) STi×P1i
+ (θF22 - θF21) FTi×P2i + (θC22 – θC21) CTi×P2i + (θS22 – θS21) STi×P2i
+ (θF32 - θF31) FTi×P3i + (θC32 – θC31) CTi×P3i + (θS32 – θS31) STi×P3i + (ui2′′ - ui1′′) (3′′)
where the θ parameters measure the additional impacts for FRAM (FT), contract (CT) and
student teachers (ST) for all three interventions relative to the program impacts on regular (civil
service) teachers.
Note that these equations assume that teacher types do not change over time (FTi, CTi
and STi do not have time subscripts). This is generally true, but there are some exceptions. More
specifically, in both grade 3 year 1 (2005-06) and grade 4 in year 2 (2006-07) over 90% of
schools had the same type of teacher for all students in those grades (mainly because most
schools had only one teacher per grade). For these schools, 95% had the same type of teacher in
grade 3 in year 1 and grade 4 in year 2. For the other schools (less than 10%), which had
multiple types of teachers in grade 3 in year 1 and grade 4 in year 2, we cannot determine
whether a given child had the same type of teacher in both years because we do not have data
that match individual students to specific teachers in year 1.
A final important point regarding estimation of all of the equations presented in this
section is that random assignment of schools to the three interventions assures that the error
terms (uit, uit′ and uit′′) are uncorrelated with the program variables (P1i, P2i and P3i). Thus OLS
yields consistent estimates of the α, β and γ parameters in equations (1), (2) and (3), though not
of τ in equation (3). Random assignment also assures that OLS estimates of equations (1′), (2′)
and (3′) consistently estimate α, β and γ; even though the x variables could be correlated with the

19
error terms, random assignment assures that the program variables are not correlated with the x
variables, so OLS consistently estimates α, β and γ (though not necessarily the δ parameters).
Random assignment also assures that OLS estimates of α, β and γ, and the θ parameters
(coefficients on the interaction terms), in equations (1′′), (2′′) and (3′′) are consistent even though
estimates of the δ terms may be inconsistent. To see why, consider (without loss of generality) a
simpler version of equation (1′′), with only one intervention and only one type of teacher (say,
FRAM teachers) other than general civil service teachers:
Tit = κt + αtP1i + δt′xit + π1tFTi + θF1tFTi×P1i + uit′′′, t = 1, 2 (1′′′)
Random assignment of schools to the program assures that Cov (P1i, uit′′′) = 0. However, uit′′′
could be correlated both with FTi and some of the x variables. This can be expressed as:
uit′′′ = β0 + β1FTi + βx′xit + εit
where εit is uncorrelated with all variables in equation (1′′′). Inserting this expression for uit′′′
into equation (1′′′) yields:
Tit = κt + αtP1i + δt′xit + π1tFTi + θF1tFTi×P1i + β0 + β1FTi + βx′xit + εit
= (κt+ β0) + αtP1i + (δt + βx)′xit + (π1t + β1)FTi + θF1tFTi×P1i + εit t = 1,2 (1′′′′)
Since εit is, by definition, uncorrelated with all variables in equation (1′′′), OLS estimation will
consistently estimate all of the parameters in this expression. That is, consistent estimates can be
obtained for αt and θF1t, but not for κt, δt or π1t.

20
V. Results
The section presents estimates of the impact of the three AGEMAD interventions on the
test scores in Madagascar of students who were in grade 3 in 2005-06 (year 1) and in grade 4 (or
in grade 3 if the student repeated) in 2006-07 (year 2), using the regression methods discussed in
Section IV. To ease interpretation, all test score variables are transformed to have a mean of 0
and a standard deviation of 1. Finally, to reduce clutter the test score variable in all tables is an
average of the three tests (Malagasy, French and Mathematics).5
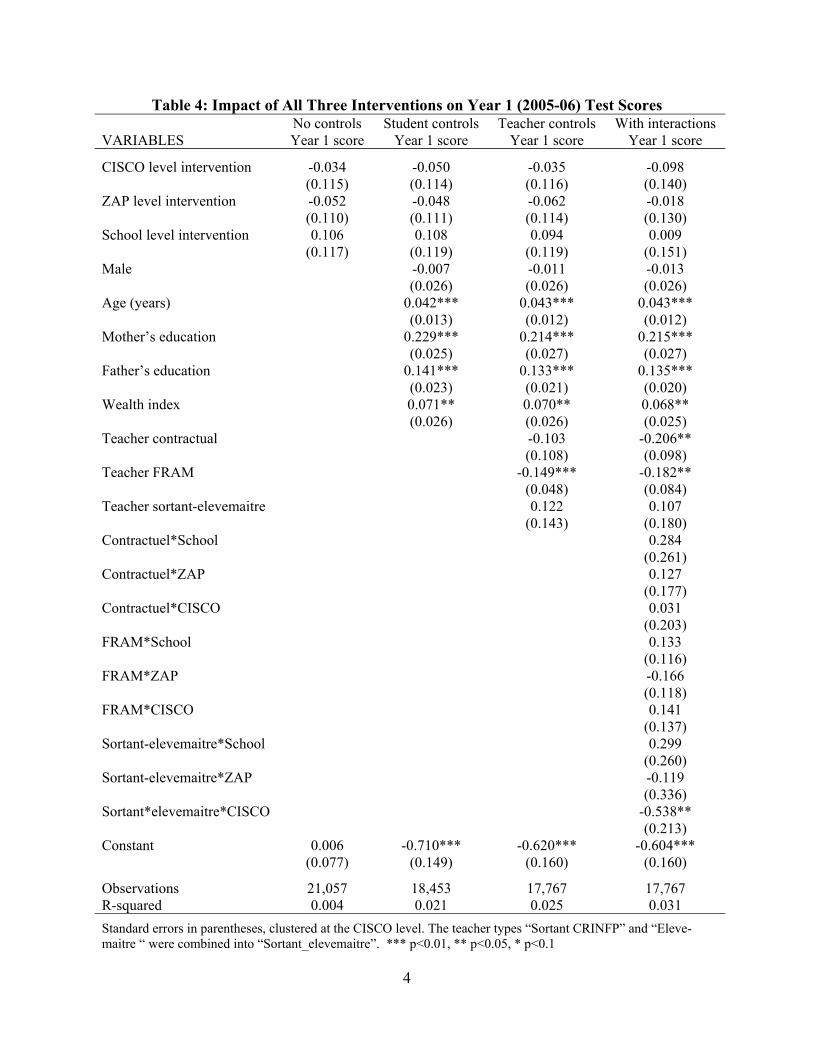
A. Estimates of General Program Impacts. The first set of estimates, presented in
Table 4, shows estimates of equations (1), (1′) and (1′′) for the test scores in year 1, when the
students were in grade 3 and had been exposed to the program for five months. Column 1
presents estimates of equation (1), the estimated impacts for all three interventions after 5
months, without covariates. The estimated impacts are quite small, ranging from -0.05 to 0.11
standard deviations (of the distribution of averaged test scores), and all are statistically
insignificant. Note that the size of the standard errors, between 0.11 and 0.12, are somewhat
large, and so can detect only program impacts that are 0.2 standard deviations or larger.6
Adding student and teacher covariates may increase the precision of the estimated
impacts for year 1. This is examined in columns 2 (student covariates only) and 3 (student and
teacher covariates) of Table 4.7 Adding these covariates did not increase precision; instead, the
standard errors of the estimated impacts of the three interventions increased slightly in five out of
six cases. Note that the (possibly biased) estimates of the student characteristics are plausible;
students who are older, have more educated parents, or are from wealthier households all have
higher test scores.
21
The estimates in the last column of Table 4 examine whether the program impacts vary
by the type of teacher, the central issue addressed by this paper. The three interventions still have
small (between -0.10 and 0.01) and statistically insignificant impacts. These estimates apply to
regular (civil service) teachers, the omitted teacher group. Thus they indicate that, after the first
five months, none of the three interventions had any discernable impact on the test scores of
students of regular teachers.
The remaining rows of Table 4 measure the impacts of the three interventions among
students who had the other types of teachers.8 With one exception, the estimated impacts for
other teachers are statistically insignificant; although the impacts (relative to those for regular
teachers) of some of the interventions appear to be large (the estimated parameters that are not
significant range from -0.17 to 0.30), they are all imprecisely estimated, with standard errors
ranging from 0.12 to 0.34. (The most precise estimates are for FRAM teachers, who are much
more common than contract teachers or student teachers, but the range of these estimates is also
smaller, from -0.17 to 0.14.) The one exception is student teachers (which include very new
teachers); the CISCO level treatment appears to have had a strong negative impact on students
who were taught by student teachers, reducing their test scores by 0.54 standard deviations of the
distribution of test scores, which is significant at the 5% level.
To summarise the results in Table 4, after the first five months there appears to have been
little impact of any of the three interventions on students’ test scores. The only exception is that
the CISCO level intervention appears to have had a negative impact on students taught by
student teachers. Yet this result should be interpreted with caution, since 12 parameters are
being estimated, and even if the true values of all were zero each has a one in twenty chance of
being significant at the 5% level. Also, recall that the year 1 test scores measure the programs’

22
impacts after only five months, which may not be enough time for any of the programs to have
had a large impact.
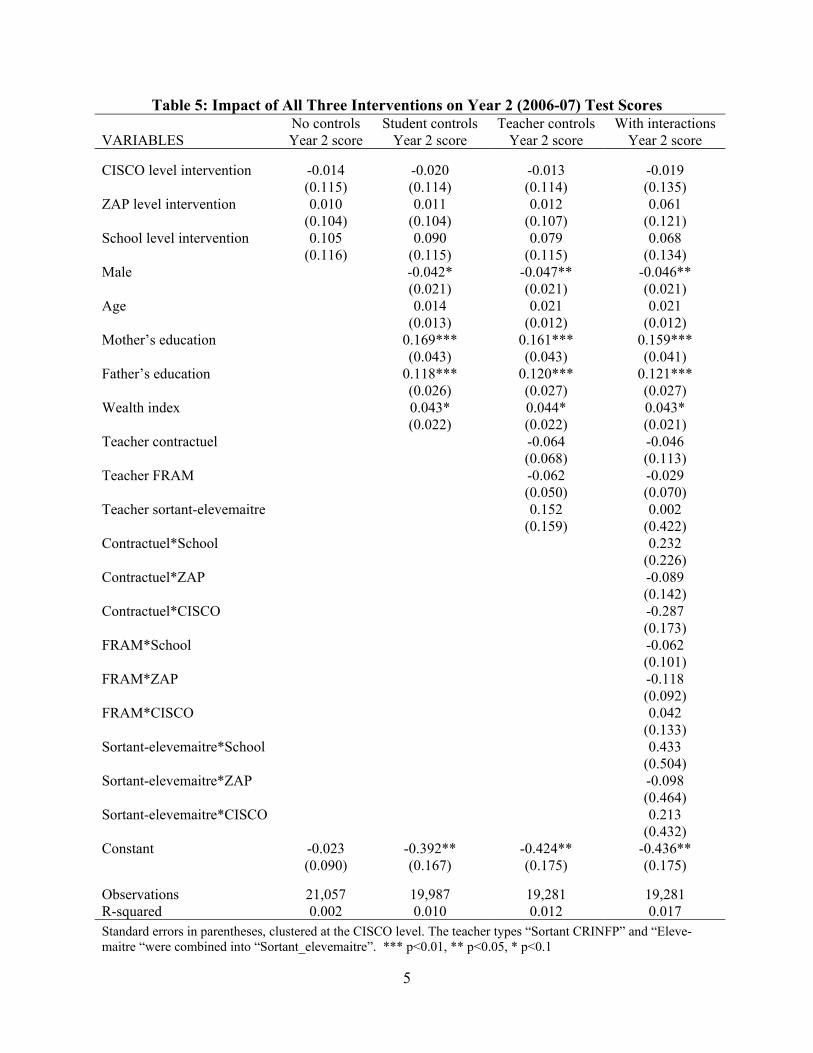
Next, turn to estimates of the impacts of all three interventions after almost two years.
Table 5 presents estimates of equations (1), (1′) and (1′′) for the test scores in year 2, when the
students were in grade 4 and had been exposed to the programs for nearly two school years.
Column 1 presents estimates of equation (1). The estimated impacts are quite small, ranging
from -0.01 to 0.11 standard deviations (of the distribution of averaged test scores), and are all
statistically insignificant. As in Table 4, the standard errors are somewhat large, between 0.10
and 0.12, and thus can detect only program impacts that are 0.2 standard deviations or larger.
Adding student and teacher covariates does not increase the precision of the estimated
impacts in year 2 (see columns 2 and 3 of Table 5). It slightly reduces the point estimates of the
impacts of the three interventions (they now range from -0.02 to 0.09), and they are still far from
statistically significant. Again, the (possibly biased) estimates of student characteristics are
plausible; students with more educated or wealthier parents have higher test scores.
The last column in Table 5 presents estimates that examine whether program impacts
vary by the type of teacher. The estimated parameters for all three programs are very small,
ranging from -0.02 to 0.07, and all are statistically insignificant. Recall that these estimates
apply to regular (civil service) teachers. Thus they indicate that, after 2 years, the impact of all
three interventions was very small for students whose main teacher was a regular teacher. The
last nine rows of Table 5 assess whether the program impacts were different for the three other
types of teachers. As in Table 4, these impacts are imprecisely estimated, with the standard
errors ranging from 0.09 to 0.50. The estimates range from -0.29 to 0.43, yet none of them is
statistically significant. Note also that, in contrast with the significantly negative result after five
23
months, students taught by student teachers who received the CISCO level intervention did not
have significantly lower test scores (indeed, the point estimate is positive, but not significant).
Overall, the results in Table 5 indicate that two years after the three interventions were
implemented, none had any impact on student test scores (combined for all three subjects), and
this result does not vary over different types of teachers. These results are similar to those of
Lassibille et. al. (2010).
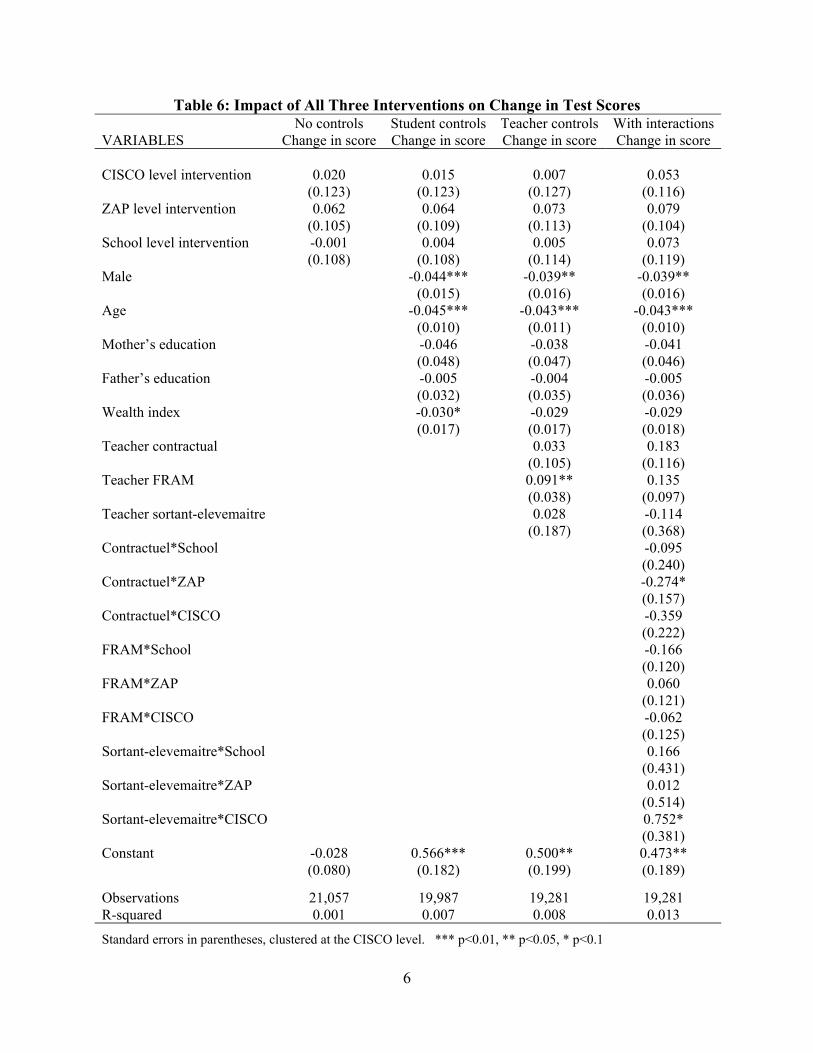
Estimation of equations (2) and (3), and their variants, may provide more precise
estimates of program effects than estimation of equation (1) and its variants. Table 6 presents
estimates of equations (2), (2′) and (2′′). The first column includes no covariates. Comparing
the standard errors in that column with the standard errors in the first column of Table 5, there is
no general tendency toward more precise estimates, and so the estimated impacts of gains in
students test scores from year 1 to year 2 are all insignificant. Adding student and teacher
characteristics did not improve statistical precision. Finally, the estimates in the last column are,
on average, no more precise than those in the last column of Table 5. While two of the nine
coefficients are statistically significant at the 10% level, this is not much more than one would
expect from random variation. Also, it is hard to imagine why the ZAP-level program had a
negative effect for contract teachers, relative to regular teachers, while the same was not true of
the “full” intervention, which included all the (presumably negative) interventions implemented
at the ZAP level. Similarly, the large positive (though very imprecisely estimated) impact of the
CISCO level treatment for student teachers primarily reflects the unusually negative impact for
that combination in year 1, which (as discussed above) is difficult to interpret and may be due to
random chance.
24
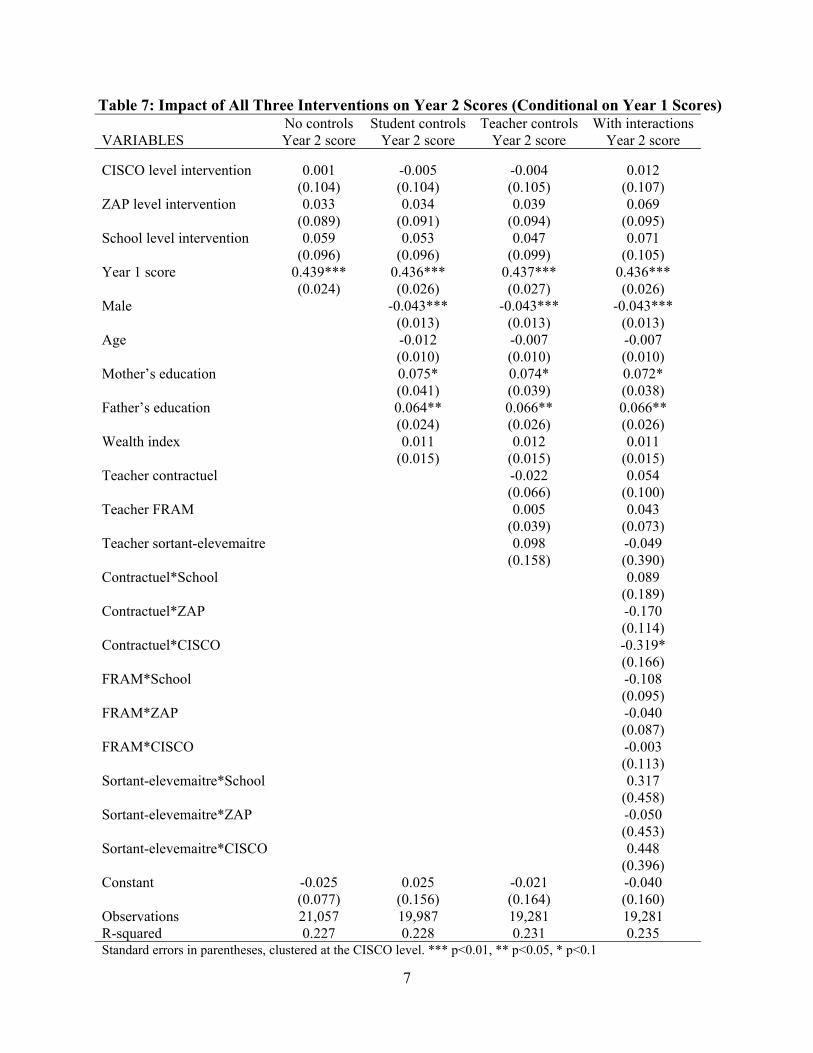
Finally, estimates of equations (3), (3′) and (3′′) are shown in Table 7. In this case, there
is some tendency for more efficient estimation relative to the Table 5 results. For example, in
column 1 of Table 5 the standard errors of the estimates of the impact of the interventions on the
Year 2 test scores ranged from 0.10 to 0.12, while in column 1 of Table 7 the standard errors of
the estimates of the program impacts on the Year 2 test scores, conditional on year 1 test scores,
range from 0.09 to 0.10. Yet even with these smaller standard errors the estimated impacts of the
three interventions on test scores in year 2, conditional on scores in year 1, are all small (ranging
from 0.00 to 0.06) and statistically insignificant. Adding other covariates (columns 2 and 3) does
not improve the precision. Regarding the possibility of differential impacts for different types of
teachers, only one of the nine interaction terms is statistically significant, and only at the 10%
level, which is what one could expect even if the true (interaction) effects were all equal to zero.
Overall, the modest gain in precision does not change the general result that none of the
interventions has an impact after two years, and that there appear to be no differences across
different types of teachers (relative to civil service teachers).
B. Comparing the Relative Effectiveness of Different Interventions. Although none
of the interventions appears to have a sizeable impact on test scores, relative to no intervention at
all, it is possible that one intervention may outperform another. That is, the impact of one
intervention may be slightly negative (e.g. αt < 0 in Equation (1)) while that of another is slightly
positive (e.g. γt > 0 in Equation (1)), and although neither is significantly different from zero the
difference of the two impacts could be statistically significant (e.g. γt – αt could be significantly
greater than 0). This subsection examines this possibility.
First, consider the relative impacts of the CISCO and ZAP level interventions. Recall
that, in the 15 CISCOs randomly assigned to get the CISCO treatment, some of the ZAPs (sub-

25
districts) were randomly selected to get the ZAP level treatment as well, while the others had
only the CISCO level treatment. Thus regressions can be estimated only for these 15 CISCOs
(that is, dropping the 15 “control” CISCOs), which is somewhat more flexible but, in theory,
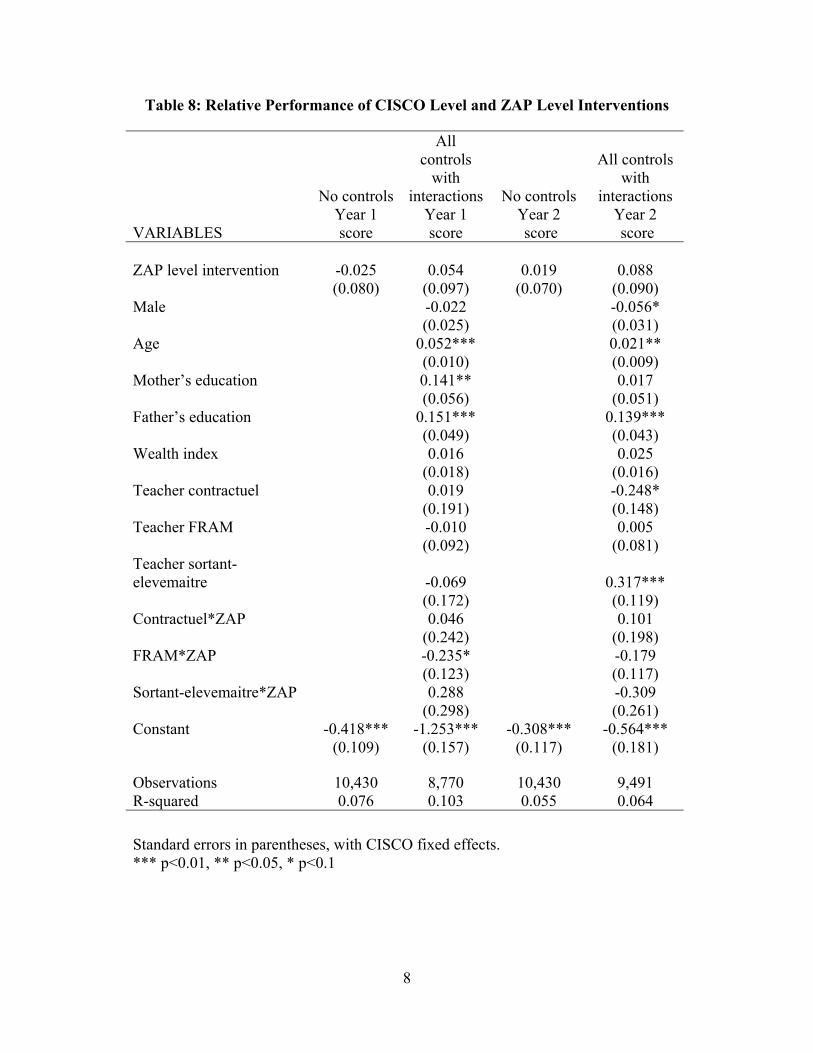
may suffer some loss of precision. The results are shown in Table 8. Note that, unlike the
results in the previous subsection, in these regressions only half of the sample is used (i.e. only
two of the three types of treatment schools, and none of the control schools; cf. Figure 1).
The first and third columns of Table 8 show no significant difference in the impact of the
ZAP level intervention, relative to the CISCO level intervention, for both Year 1 and Year 2
scores. Indeed, the two point estimates are very small (-0.03 and 0.02, respectively). Columns
(2) and (4) examine whether these relative differences vary by the type of teacher. Although
there is more variation in the point estimates (which are all relative to regular teachers), indeed
they vary from -0.31 to 0.29, only one of the six (that for FRAM teachers in Year 1) is
statistically significant, and only at the 10% level. The three interaction terms in column 2 are
not jointly significant (F=1.72 and p=0.16). Overall, there is little evidence of a significant
difference between the impacts of the ZAP level and the CISCO level interventions.
Table 9 presents evidence on whether there is a difference between the impacts of the
CISCO and ZAP level interventions in changes in test scores between Year 1 and Year 2.
Columns (1) and (2) show results where the change in test scores is the dependent variable, while
columns (3) and (4) present findings when the Year 2 test score is the dependent variable and the
Year 1 test score is an explanatory variable. The simplest specifications, with no covariates or
interaction terms, show no evidence of a differential impact for the CISCO and ZAP level
interventions. Yet when interactions are added there is weak evidence (significant at 10% level)
that the impact of the ZAP level intervention is smaller than that of the CISCO level intervention

26
for student teachers, and these effects are large (-0.63 in column 2 and -0.44 for column 4).
While this is consistent with the result in the fourth column of Table 6, where the interaction
between the CISCO level intervention and student teachers was large and significant at the 10%
level, the effects in both Tables 6 and 9 are very imprecisely estimated. Moreover, the three
interaction terms in columns 2 and 4 are not jointly significant (F = 1.16 and p = 0.33).
Turn next to the relative impacts of the CISCO and school level interventions (Treatment
1 vs. Treatment 3). Recall that the school level intervention combined the CISCO, ZAP and
school level interventions. Intuitively, if the ZAP and school level interventions are valuable one
would expect a larger impact on student test scores from the school level intervention than from
the CISCO level intervention. The results are shown in Tables 10 and 11.
The first column of Table 10 shows that, after 5 months, the school level intervention has
a larger impact than the CISCO level intervention on Year 1 test scores. More specifically, the
Year 1 test score is 0.13 standard deviations higher in schools exposed to the school level
intervention, and this impact is significant at the 5% level. However, this differential effect falls
and becomes statistically insignificant after the program has been in place for two years; the
point estimate drops somewhat, to 0.11 standard deviations, and is no longer significant even at
the 10% level. When covariates and interactions are added (columns 2 and 4) the evidence is
somewhat contradictory; in Year 1 students taught by student teachers in schools with the school
level intervention seem to do much better than those taught by student teachers in schools with
the CISCO level intervention, a large effect (0.63) that is significant at the 5% level, but in Year
2 this effect drops to 0.15 and is insignificant, and instead there is a large (0.52) and statistically
significant impact for contract teachers. The three interaction terms in column 2 are not jointly
significant (F=1.93 and p=0.13) but those in column 4 are jointly significant (F=3.47and p=0.02).

27
Table 11 presents evidence on whether there is a difference between the impacts of the
CISCO and school level interventions in changes in test scores from Year 1 to Year 2. The
simplest specifications, in columns 1 and 3, which have no covariates or interaction terms, show
no evidence that the school level intervention has a larger impact than the CISCO level
intervention on changes in test scores. Indeed, the two point estimates are quite small (-0.02 and
0.05, respectively). The second and fourth columns examine whether these relative differences
vary substantially by the type of teacher. As in Table 9, there is more variation in the point
estimates (which are all relative to regular teachers) – they vary from -0.47 to 0.40 – but these
impacts relative to regular teachers are quite imprecisely estimated, with standard errors ranging
from 0.13 to 0.25. Two of six estimated parameters (those for student teachers in the change
specification and for contract teachers in the “conditional on Year 1 scores” specification) are
statistically significant, but only at the 10% level. The three interaction terms in column 2 are not
jointly significant (F=1.76 and p=0.16) while those in column 4 are weakly jointly significant
(F=2.44 and p=0.07). These weakly significant effects, while large (-0.47 and 0.40,
respectively), are difficult to interpret: why would adding the ZAP and school level interventions
to the CISCO level intervention favour contract teachers in one specification but not the other?
The same point applies to student teachers, column 2 has a large (-0.47) and significantly
negative impact, while column 4 has a much smaller (-0.12) impact that is not at all significant.
Overall, the evidence from Tables 10 and 11 does not show a significant difference between the
impacts of the CISCO level intervention and the school level intervention.
Finally, consider the relative impacts of the ZAP level and the school level interventions
(Treatments 2 and 3). Both provided “tools” at the CISCO and ZAP levels, but only the latter
provided assistance at the school level. These results are shown in Tables 12 and 13.

28
The first column of Table 12 shows that, after 5 months of the program, the school level
intervention has a larger impact than the ZAP level intervention on Year 1 test scores; the Year 1
test score is 0.16 standard deviations higher in schools exposed to the school level intervention,
and this difference is significant at the 5% level. Yet this differential effect becomes smaller
(0.10) and statistically insignificant after the interventions have been in place for two years. It is
possible that the ZAP level intervention had some initial start-up problems that had a small
negative effect on test scores, which were later resolved, but we do not have any evidence to
support this conjecture.
When covariates and interactions are added (columns 2 and 4) there are no statistically
significant interaction effects in Year 1 (column 2). Yet there is one significant interaction in
Year 2; students in schools with contract teachers and the school level intervention had much
higher test scores (0.45 standard deviations) than students in schools with contract teachers and
the ZAP level intervention. This impact is difficult to interpret. The three interaction terms in
column 2 are not jointly significant (F=0.71 and p=0.55) while those of column 4 are marginally
jointly significant (F=2.77 and p=0.05).
Table 13 examines whether there is a difference between the impacts of the ZAP and
school level interventions in changes in test scores between Years 1 and 2. The specifications in
columns 1 and 3, which have no covariates or interaction terms, show no evidence that the
school level intervention has a larger impact than the ZAP level intervention on changes in test
scores; indeed, the two point estimates are fairly small (-0.06 and 0.03, respectively). The
second and fourth columns examine whether there are differences by the type of teacher. Only
one of the six estimated parameters (that for contract teachers in column 4) is statistically
significant, and only at the 10% level. This is consistent with the result in column 4 of Table 12,
29
and the same caveats apply. The three interaction terms in column 2 are not jointly significant
(F=0.90 and p=0.45) and the same holds for the three interaction terms in column 4 (F=1.90 and
p=0.14).
VI. Conclusion
This paper has examined the impact of the AGEMAD program on student learning in
Madagascar, focusing on whether the impacts vary by type of teacher. Overall, after two years
the program appears to have had little or no impact in terms of either general or teacher specific
results. Test scores on three subjects, Mathematics, Malagasy, and French, were averaged into a
single score. The results show no direct impact of any of the three interventions on students’
average test scores for either year of the program, nor on the change in test scores between Years
1 and 2. There seemed to be a negative impact of the CISCO (district) level intervention on
students who were taught by student teachers in Year 1, and a negative impact of the ZAP (sub-
district) level intervention on those taught by (regular) contract teachers. A large positive but
weakly significant impact of the CISCO level intervention on the change in test scores of those
taught by student teachers was found, but the estimates are not very precise. Turning to the
relative performance of the three interventions, no significant difference between the district
level and sub-district level intervention was found. The school level intervention seemed to have
had larger impacts on Year 1 test scores, but not Year 2 test scores, relative to the CISCO level
intervention. Similar results are found for the school level intervention relative to the ZAP level
intervention.
There are several possible explanations of the lack of any program impacts. First, maybe
two years is not enough time for the type of interventions implemented by this program to have
30
effects on student performance (which is an indirect effect of the program) compared to school
management (which is a direct effect). Second, the fact that there are no true baseline data to
compare to the post implementation data to may explain the insignificant results on changes in
test scores. Third, the sample size may be too small to obtain precise estimates, as the large
standard errors on the program coefficient suggest. Finally, it may simply be that the AGEMAD
reforms are inherently ineffective, at least in the context of Madagascar’s educational system,
and thus that other policies will be needed to improve students’ academic performance.
1 More details on the AGEMAD program are given below in Section III. 2 Tools that are necessary for a teacher to properly manage his/her classroom and teach more effectively. 3 Well managed schools are defined as schools where “the school director and all the teachers perform all their essential tasks” (Lassibile et. al. 2010). See Table A.1 in Appendix for a list of the essential tasks. 4 See Angrist and Pischke (2009, pp.22-24) on this point. They also point out that adding controls could increase precision, as explained in the next paragraph, but that this is not necessarily the case. 5 Separate results for each subject (available from the authors on request) are similar to the overall numbers. For example, when the regressions in Table 4 are estimated for each subject, all the intervention effects are insignificant. 6 The standard errors in Table 4 allow for heteroskedasticity of unknown form, including allowing for arbitrary correlation in the error terms of the estimated equations for any schools in the same CISCO. Clustering at the ZAP or the school level reduces the standard errors somewhat, but not enough to lead to statistically significant results. 7 Adding covariates and interaction terms reduces the sample size by about 10-15%. This raises the possibility that any changes in results due to the introduction of covariates and interaction terms is due to a change in the sample, not the change in the specification. To check this, we re-estimated all regressions including only observations that had all the covariates and interaction terms; the results (available from the authors) were essentially unchanged. 8 A related issue is whether student characteristics varied by type of teacher. In fact, there is very little variation of this type. For example, the distribution of high (low) income students by type of teacher was: 55.7% (51.8%) had regular civil service teachers; 7.3% (8.3%) had regular contract teachers; 33.7% (37.6%) had FRAM contract teachers; and 3.2% (2.3%) had student teachers.

References
Allcott, H., and D. Ortega (2009). “The Performance of Decentralized School Systems: Evidence from Fe y Alegría in Venezuela”. in F. Barrera-Osorio, H. A. Patrinos, and Q. Wodon, eds., Emerging Evidence on Private Participation in Education: Vouchers and Faith-Based Providers. The World Bank. Washington, D.C.
Angrist, Joshua, and Jörn-Steffen Pischke. 2009. Mostly Harmless Econometrics. Princeton,
NJ: Princeton University Press. Bettinger, E. and B. Long (2006). “Does Cheaper Mean Better? The Impact of Adjunct
Instructors on Student Outcomes.” Mimeo, Harvard University. De Laat, J., and Vegas, E. (2005). “Do Differences in Teacher Contracts Affect Student
Performance? Evidence from Togo.” Mimeo, Brown University. Duflo, E., P. Dupas and M. Kremer (2007). “Peer Effects, Pupil-Teacher Ratios, and Teacher
Incentives: Evidence from a Randomized Evaluation in Kenya.” Mimeo, MIT. Glewwe, P., and M. Kremer (2006). “Schools, Teachers, and Education Outomes in Developing
Countries”, Handbook of Economics of Education, vol 2. Amsterdam: North Holland. Hanushek, Eric, and Ludger Woessmann. 2008. “The Role of Cognitive Skills in Economic
Development.” Journal of Economic Literature 46(3): 607-668. Jimenez, E., and Y. Sawada (1999). “Do Community-Managed Schools Work? An Evaluation of
El Salvador’s EDUCO Program” World Bank Economic Review, 13(3): 415-441. Lassibille, G., J-P. Tan, C. Jesse, and T. Nguyen (2010). “Managing for results in primary
education in Madagascar: Evaluating the impact of selected workflow interventions”, World Bank Economic Review 24(2):303-329.
Muralidharan, K., and V. Sundararaman. 2010. “Contract Teachers: Evidence from India.”
Department of Economics. University of California at San Diego. Nguyen, T., and G. Lassibille (2008). “Improving Management in Education: Evidence from a
Randomized Experiment in Madagascar”, Mimeo World Bank. UNESCO (2008). “Overcoming inequality: why governance matters” Education for All Global
Monitoring Report. Paris. World Bank (2004), World Development Report 2004: Making Services Work for the Poor, New
York: Oxford University Press. World Bank (2008). De Nouveaux Modes de Gestion pour Accroitre les Performances de
l’Enseignement Primaire Malgache : Evaluation d’Impact de l’Initiative d’Amélioration de la Gestion de l’Education à Madagascar (AGEMAD), Final Report.
1
Table 1: Supply of schools and teachers in Madagascar 1997-2005
1997-98 2000-01 2001-02 2002-03 2003-04 2004-05 2005-06
Public Number of schools 10,610 12,730 14,436 14,637 15,420 15,690 16,917 Pupils per school 178 181 167 195 218 229 219 Number of teachers 28,537 33,868 36,181 38,509 47,315 48,871 57,024 % FRAM 5.0 17.9 16.2 18.5 27.5 33.2 48.5 Pupils per teacher 51 53 52 59 57 60 52
Private Number of schools 3,022 3,532 3,859 4,340 4,740 4,946 5,301 Pupils per school 141 141 134 134 137 138 135 Number of teachers 12,111 15,543 14,555 16,800 16,950 18,266 19,807 Pupils per teacher 35 32 35 35 38 37 36
Total Number of schools 13,632 16,262 18,295 18,977 20,160 20,636 22,218 Number of teachers 40,648 49,411 50,736 55,309 64,265 67,137 76,831 Pupils per teacher 47 47 47 52 52 54 48 Source: World Bank (2008)
2
Table 2: Teacher Characteristics by Type of Teacher
Teacher type
Definition Hired by Paid by Where they teach
Temporary or
permanent Fonctionnaire
Regular civil service
teachers
Ministry of Education
Ministry of Education
Public schools
Permanent
Contractuel Regular contract teachers
Ministry of Education
Ministry of Education
Public or private schools
Temporary
FRAM subventionné par l'Etat
FRAM Contract teachers
Parents-teachers
association
Ministry of Education
Public schools
Temporary
FRAM non subventionné par l'Etat
FRAM Contract teachers
Parents-teachers
association
Parents-teachers
association
Public schools
Temporary
Sortant CRINFP Recent graduate
from teacher training center
Ministry of Education
Ministry of Education
Public or private schools
Temporary
Elève-maître Student teachers
Ministry of Education
Ministry of Education
Public or private schools
Temporary
Autres Other types of teachers (e.g. private
teachers)
Varies by type of teacher
Varies by type of teacher
Public or private schools
Temporary
`
3
Table 3: Selected Teacher Characteristics from Year Two School Survey Data
Teacher type
Percent Age
Years of Experience
Percent with High school diploma or
higher
Percent with any
pedagogical diploma
Salary (in
ariary) Current Job
First Job
Fonctionnaire 52.8 27.8 48.7 25.5 8.1 85.7 188,919
Contractuel 8.1 7.9 47.4 24.2 15.0 76.1 185,539
FRAM subventionné par l'Etat
25.2
20.7
31.5
3.7
21.2
5.3
70,266
FRAM non subventionné par l'Etat
11.4
31.3
32.5
5.7
21.0
10.6
60,035
Elève-maître or Sortant CRINFP
2.5
--
--
--
--
--
--
Maître privé -- 12.3 41.0 17.4 19.8 42.8 112,228
All columns are calculated directly from the 2006-07 data. The teacher type in the second column refers to the kind of position the teachers held in their first job (civil servant, private teacher, teacher FRAM, etc.); since almost all fonctionnaires were initially student teachers (elève-maîtres) those two categories are combined into fonctionnaire. These data were collected for 5 teachers per school and have only 6 categories for teacher type (Sortant CRINFP and autres are not among the categories).
4
Table 4: Impact of All Three Interventions on Year 1 (2005-06) Test Scores No controls Student controls Teacher controls With interactionsVARIABLES Year 1 score Year 1 score Year 1 score Year 1 score
CISCO level intervention -0.034 -0.050 -0.035 -0.098(0.115) (0.114) (0.116) (0.140)
ZAP level intervention -0.052 -0.048 -0.062 -0.018(0.110) (0.111) (0.114) (0.130)
School level intervention 0.106 0.108 0.094 0.009(0.117) (0.119) (0.119) (0.151)
Male -0.007 -0.011 -0.013(0.026) (0.026) (0.026)
Age (years) 0.042*** 0.043*** 0.043***(0.013) (0.012) (0.012)
Mother’s education 0.229*** 0.214*** 0.215***(0.025) (0.027) (0.027)
Father’s education 0.141*** 0.133*** 0.135***(0.023) (0.021) (0.020)
Wealth index 0.071** 0.070** 0.068**(0.026) (0.026) (0.025)
Teacher contractual -0.103 -0.206**(0.108) (0.098)
Teacher FRAM -0.149*** -0.182**(0.048) (0.084)
Teacher sortant-elevemaitre 0.122 0.107(0.143) (0.180)
Contractuel*School 0.284(0.261)
Contractuel*ZAP 0.127(0.177)
Contractuel*CISCO 0.031(0.203)
FRAM*School 0.133(0.116)
FRAM*ZAP -0.166(0.118)
FRAM*CISCO 0.141(0.137)
Sortant-elevemaitre*School 0.299(0.260)
Sortant-elevemaitre*ZAP -0.119(0.336)
Sortant*elevemaitre*CISCO -0.538**(0.213)
Constant 0.006 -0.710*** -0.620*** -0.604***(0.077) (0.149) (0.160) (0.160)
Observations 21,057 18,453 17,767 17,767R-squared 0.004 0.021 0.025 0.031
Standard errors in parentheses, clustered at the CISCO level. The teacher types “Sortant CRINFP” and “Eleve-maitre “ were combined into “Sortant_elevemaitre”. *** p<0.01, ** p<0.05, * p<0.1
5
Table 5: Impact of All Three Interventions on Year 2 (2006-07) Test Scores No controls Student controls Teacher controls With interactionsVARIABLES Year 2 score Year 2 score Year 2 score Year 2 score
CISCO level intervention -0.014 -0.020 -0.013 -0.019(0.115) (0.114) (0.114) (0.135)
ZAP level intervention 0.010 0.011 0.012 0.061(0.104) (0.104) (0.107) (0.121)
School level intervention 0.105 0.090 0.079 0.068(0.116) (0.115) (0.115) (0.134)
Male -0.042* -0.047** -0.046**(0.021) (0.021) (0.021)
Age 0.014 0.021 0.021(0.013) (0.012) (0.012)
Mother’s education 0.169*** 0.161*** 0.159***(0.043) (0.043) (0.041)
Father’s education 0.118*** 0.120*** 0.121***(0.026) (0.027) (0.027)
Wealth index 0.043* 0.044* 0.043*(0.022) (0.022) (0.021)
Teacher contractuel -0.064 -0.046(0.068) (0.113)
Teacher FRAM -0.062 -0.029(0.050) (0.070)
Teacher sortant-elevemaitre 0.152 0.002(0.159) (0.422)
Contractuel*School 0.232(0.226)
Contractuel*ZAP -0.089(0.142)
Contractuel*CISCO -0.287(0.173)
FRAM*School -0.062(0.101)
FRAM*ZAP -0.118(0.092)
FRAM*CISCO 0.042(0.133)
Sortant-elevemaitre*School 0.433(0.504)
Sortant-elevemaitre*ZAP -0.098(0.464)
Sortant-elevemaitre*CISCO 0.213(0.432)
Constant -0.023 -0.392** -0.424** -0.436**(0.090) (0.167) (0.175) (0.175)
Observations 21,057 19,987 19,281 19,281R-squared 0.002 0.010 0.012 0.017Standard errors in parentheses, clustered at the CISCO level. The teacher types “Sortant CRINFP” and “Eleve-maitre “were combined into “Sortant_elevemaitre”. *** p<0.01, ** p<0.05, * p<0.1
6
Table 6: Impact of All Three Interventions on Change in Test Scores No controls Student controls Teacher controls With interactionsVARIABLES Change in score Change in score Change in score Change in score CISCO level intervention 0.020 0.015 0.007 0.053
(0.123) (0.123) (0.127) (0.116)ZAP level intervention 0.062 0.064 0.073 0.079
(0.105) (0.109) (0.113) (0.104)School level intervention -0.001 0.004 0.005 0.073
(0.108) (0.108) (0.114) (0.119)Male -0.044*** -0.039** -0.039**
(0.015) (0.016) (0.016)Age -0.045*** -0.043*** -0.043***
(0.010) (0.011) (0.010)Mother’s education -0.046 -0.038 -0.041
(0.048) (0.047) (0.046)Father’s education -0.005 -0.004 -0.005
(0.032) (0.035) (0.036)Wealth index -0.030* -0.029 -0.029
(0.017) (0.017) (0.018)Teacher contractual 0.033 0.183
(0.105) (0.116)Teacher FRAM 0.091** 0.135
(0.038) (0.097)Teacher sortant-elevemaitre 0.028 -0.114
(0.187) (0.368)Contractuel*School -0.095
(0.240)Contractuel*ZAP -0.274*
(0.157)Contractuel*CISCO -0.359
(0.222)FRAM*School -0.166
(0.120)FRAM*ZAP 0.060
(0.121)FRAM*CISCO -0.062
(0.125)Sortant-elevemaitre*School 0.166
(0.431)Sortant-elevemaitre*ZAP 0.012
(0.514)Sortant-elevemaitre*CISCO 0.752*
(0.381)Constant -0.028 0.566*** 0.500** 0.473**
(0.080) (0.182) (0.199) (0.189)
Observations 21,057 19,987 19,281 19,281R-squared 0.001 0.007 0.008 0.013
Standard errors in parentheses, clustered at the CISCO level. *** p<0.01, ** p<0.05, * p<0.1
7
Table 7: Impact of All Three Interventions on Year 2 Scores (Conditional on Year 1 Scores) No controls Student controls Teacher controls With interactionsVARIABLES Year 2 score Year 2 score Year 2 score Year 2 score
CISCO level intervention 0.001 -0.005 -0.004 0.012(0.104) (0.104) (0.105) (0.107)
ZAP level intervention 0.033 0.034 0.039 0.069(0.089) (0.091) (0.094) (0.095)
School level intervention 0.059 0.053 0.047 0.071(0.096) (0.096) (0.099) (0.105)
Year 1 score 0.439*** 0.436*** 0.437*** 0.436***(0.024) (0.026) (0.027) (0.026)
Male -0.043*** -0.043*** -0.043***(0.013) (0.013) (0.013)
Age -0.012 -0.007 -0.007(0.010) (0.010) (0.010)
Mother’s education 0.075* 0.074* 0.072*(0.041) (0.039) (0.038)
Father’s education 0.064** 0.066** 0.066**(0.024) (0.026) (0.026)
Wealth index 0.011 0.012 0.011(0.015) (0.015) (0.015)
Teacher contractuel -0.022 0.054(0.066) (0.100)
Teacher FRAM 0.005 0.043(0.039) (0.073)
Teacher sortant-elevemaitre 0.098 -0.049(0.158) (0.390)
Contractuel*School 0.089(0.189)
Contractuel*ZAP -0.170(0.114)
Contractuel*CISCO -0.319*(0.166)
FRAM*School -0.108(0.095)
FRAM*ZAP -0.040(0.087)
FRAM*CISCO -0.003(0.113)
Sortant-elevemaitre*School 0.317(0.458)
Sortant-elevemaitre*ZAP -0.050(0.453)
Sortant-elevemaitre*CISCO 0.448(0.396)
Constant -0.025 0.025 -0.021 -0.040(0.077) (0.156) (0.164) (0.160)
Observations 21,057 19,987 19,281 19,281R-squared 0.227 0.228 0.231 0.235Standard errors in parentheses, clustered at the CISCO level. *** p<0.01, ** p<0.05, * p<0.1
8
Table 8: Relative Performance of CISCO Level and ZAP Level Interventions
No controls
All controls
with interactions No controls
All controls with
interactions
VARIABLES Year 1 score
Year 1 score
Year 2 score
Year 2 score
ZAP level intervention -0.025 0.054 0.019 0.088
(0.080) (0.097) (0.070) (0.090) Male -0.022 -0.056*
(0.025) (0.031) Age 0.052*** 0.021**
(0.010) (0.009) Mother’s education 0.141** 0.017
(0.056) (0.051) Father’s education 0.151*** 0.139***
(0.049) (0.043) Wealth index 0.016 0.025
(0.018) (0.016) Teacher contractuel 0.019 -0.248*
(0.191) (0.148) Teacher FRAM -0.010 0.005
(0.092) (0.081) Teacher sortant-elevemaitre -0.069 0.317***
(0.172) (0.119) Contractuel*ZAP 0.046 0.101
(0.242) (0.198) FRAM*ZAP -0.235* -0.179
(0.123) (0.117) Sortant-elevemaitre*ZAP 0.288 -0.309
(0.298) (0.261) Constant -0.418*** -1.253*** -0.308*** -0.564***
(0.109) (0.157) (0.117) (0.181)
Observations 10,430 8,770 10,430 9,491 R-squared 0.076 0.103 0.055 0.064
Standard errors in parentheses, with CISCO fixed effects. *** p<0.01, ** p<0.05, * p<0.1
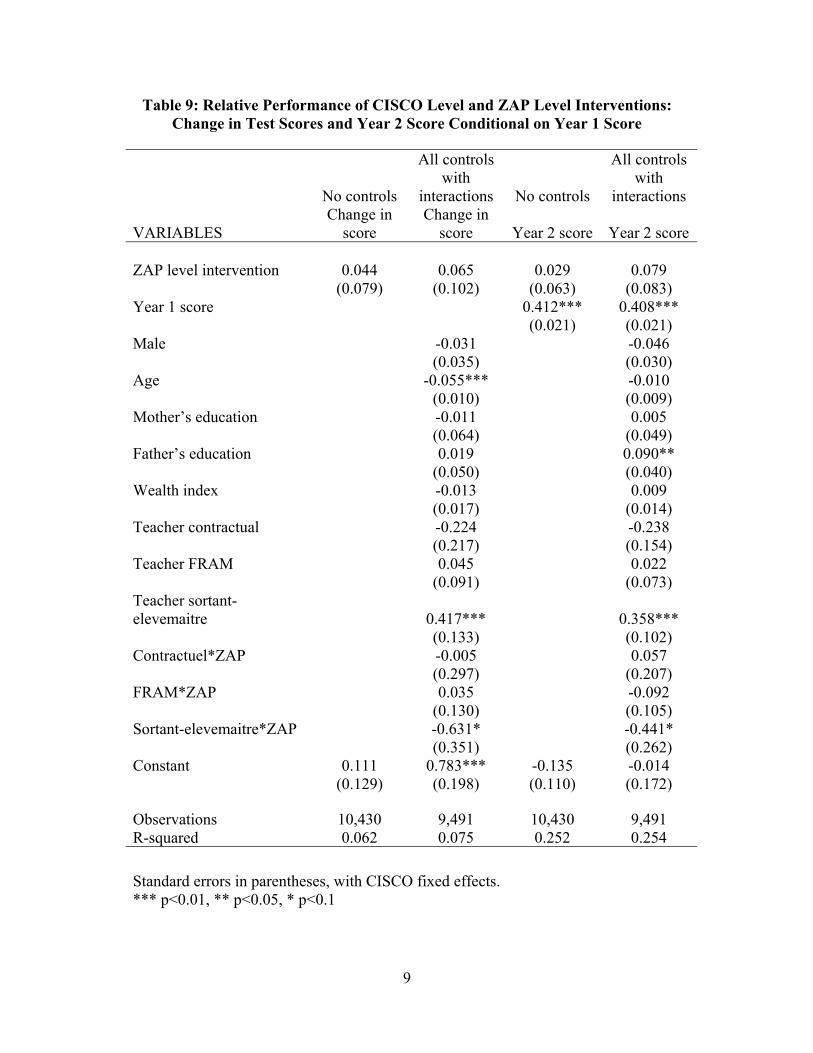
9
Table 9: Relative Performance of CISCO Level and ZAP Level Interventions: Change in Test Scores and Year 2 Score Conditional on Year 1 Score
No controls
All controls with
interactions No controls
All controls with
interactions
VARIABLES Change in
score Change in
score Year 2 score Year 2 score ZAP level intervention 0.044 0.065 0.029 0.079
(0.079) (0.102) (0.063) (0.083) Year 1 score 0.412*** 0.408***
(0.021) (0.021) Male -0.031 -0.046
(0.035) (0.030) Age -0.055*** -0.010
(0.010) (0.009) Mother’s education -0.011 0.005
(0.064) (0.049) Father’s education 0.019 0.090**
(0.050) (0.040) Wealth index -0.013 0.009
(0.017) (0.014) Teacher contractual -0.224 -0.238
(0.217) (0.154) Teacher FRAM 0.045 0.022
(0.091) (0.073) Teacher sortant-elevemaitre 0.417*** 0.358***
(0.133) (0.102) Contractuel*ZAP -0.005 0.057
(0.297) (0.207) FRAM*ZAP 0.035 -0.092
(0.130) (0.105) Sortant-elevemaitre*ZAP -0.631* -0.441*
(0.351) (0.262) Constant 0.111 0.783*** -0.135 -0.014
(0.129) (0.198) (0.110) (0.172)
Observations 10,430 9,491 10,430 9,491 R-squared 0.062 0.075 0.252 0.254
Standard errors in parentheses, with CISCO fixed effects. *** p<0.01, ** p<0.05, * p<0.1
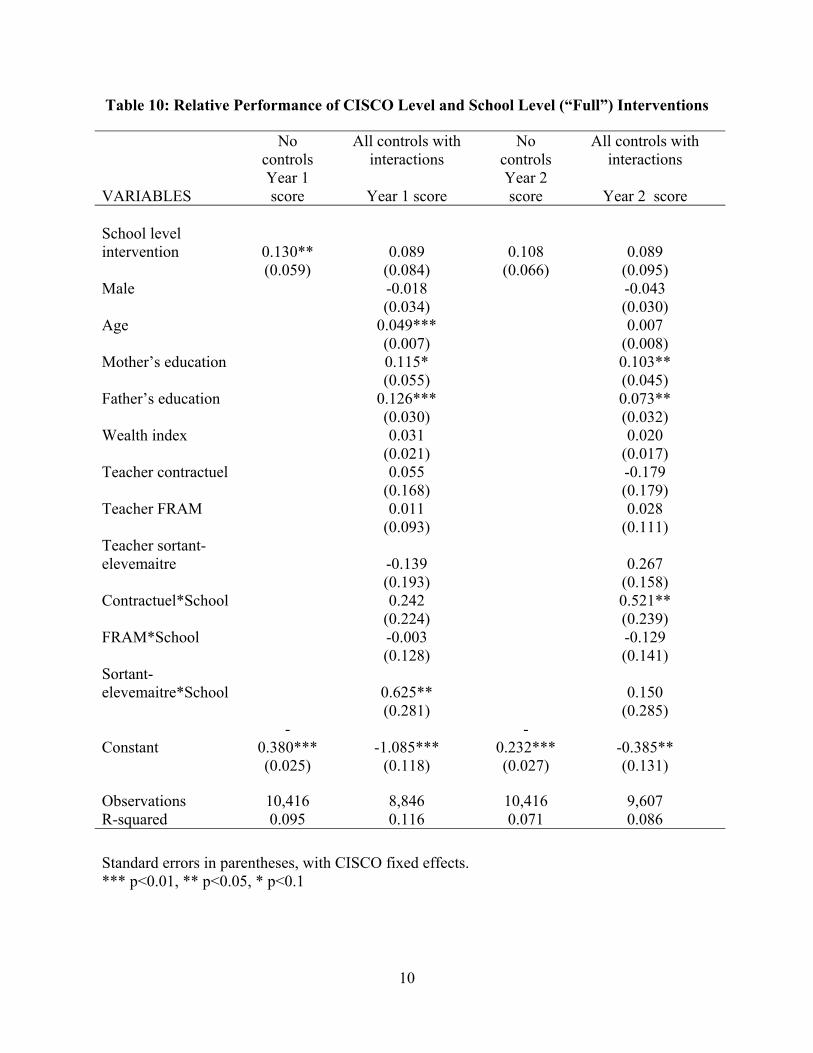
10
Table 10: Relative Performance of CISCO Level and School Level (“Full”) Interventions
No
controls All controls with
interactions No
controls All controls with
interactions
VARIABLES Year 1 score Year 1 score
Year 2 score Year 2 score
School level intervention 0.130** 0.089 0.108 0.089
(0.059) (0.084) (0.066) (0.095) Male -0.018 -0.043
(0.034) (0.030) Age 0.049*** 0.007
(0.007) (0.008) Mother’s education 0.115* 0.103**
(0.055) (0.045) Father’s education 0.126*** 0.073**
(0.030) (0.032) Wealth index 0.031 0.020
(0.021) (0.017) Teacher contractuel 0.055 -0.179
(0.168) (0.179) Teacher FRAM 0.011 0.028
(0.093) (0.111) Teacher sortant-elevemaitre -0.139 0.267
(0.193) (0.158) Contractuel*School 0.242 0.521**
(0.224) (0.239) FRAM*School -0.003 -0.129
(0.128) (0.141) Sortant-elevemaitre*School 0.625** 0.150
(0.281) (0.285)
Constant -
0.380*** -1.085*** -
0.232*** -0.385** (0.025) (0.118) (0.027) (0.131)
Observations 10,416 8,846 10,416 9,607 R-squared 0.095 0.116 0.071 0.086
Standard errors in parentheses, with CISCO fixed effects. *** p<0.01, ** p<0.05, * p<0.1
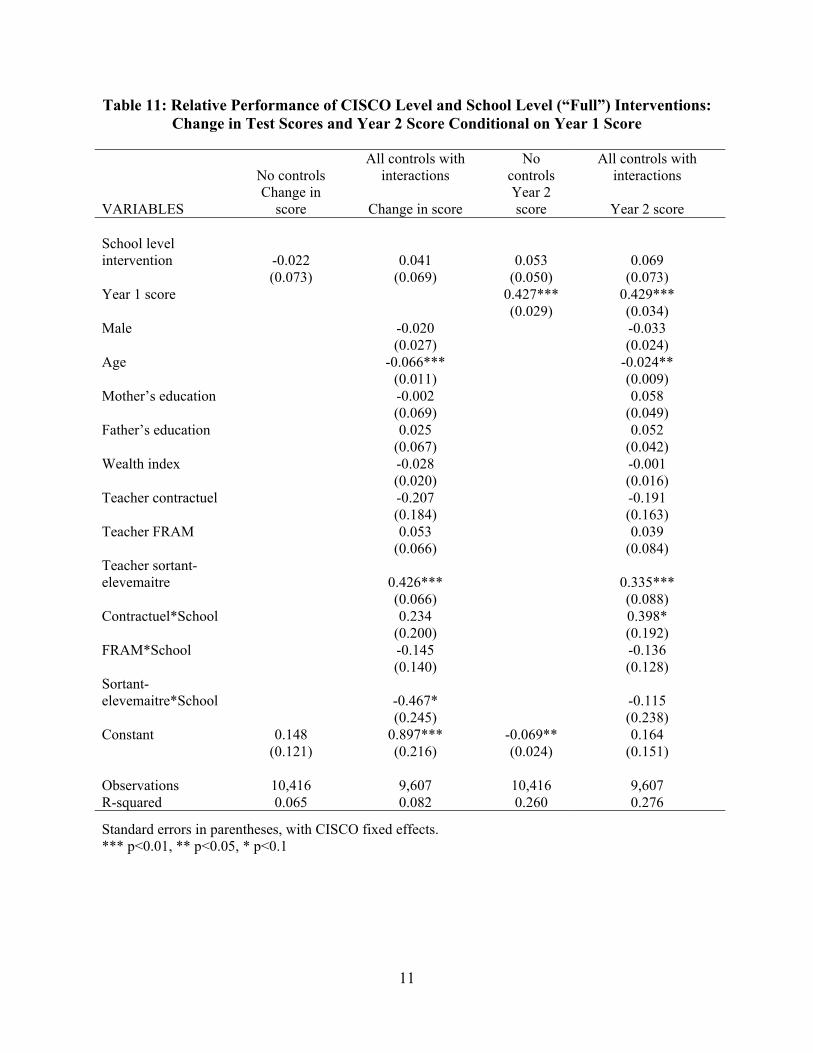
11
Table 11: Relative Performance of CISCO Level and School Level (“Full”) Interventions: Change in Test Scores and Year 2 Score Conditional on Year 1 Score
No controls All controls with
interactionsNo
controlsAll controls with
interactions
VARIABLES Change in
score Change in scoreYear 2 score Year 2 score
School level intervention -0.022 0.041 0.053 0.069
(0.073) (0.069) (0.050) (0.073)Year 1 score 0.427*** 0.429***
(0.029) (0.034)Male -0.020 -0.033
(0.027) (0.024)Age -0.066*** -0.024**
(0.011) (0.009)Mother’s education -0.002 0.058
(0.069) (0.049)Father’s education 0.025 0.052
(0.067) (0.042)Wealth index -0.028 -0.001
(0.020) (0.016)Teacher contractuel -0.207 -0.191
(0.184) (0.163)Teacher FRAM 0.053 0.039
(0.066) (0.084)Teacher sortant-elevemaitre 0.426*** 0.335***
(0.066) (0.088)Contractuel*School 0.234 0.398*
(0.200) (0.192)FRAM*School -0.145 -0.136
(0.140) (0.128)Sortant-elevemaitre*School -0.467* -0.115
(0.245) (0.238)Constant 0.148 0.897*** -0.069** 0.164
(0.121) (0.216) (0.024) (0.151)
Observations 10,416 9,607 10,416 9,607R-squared 0.065 0.082 0.260 0.276
Standard errors in parentheses, with CISCO fixed effects. *** p<0.01, ** p<0.05, * p<0.1

12
Table 12: Relative Performance of ZAP Level and School Level (“Full”) Interventions
No
controls All controls with
interactions No
controls All controls with
interactions
VARIABLES Year 1 score Year 1 score
Year 2 score Year 2 score
School level intervention 0.159** 0.064 0.095 0.031
(0.069) (0.090) (0.059) (0.080) Male -0.014 -0.035
(0.031) (0.037) Age 0.056*** 0.025**
(0.013) (0.010) Mother’s education 0.173*** 0.097**
(0.055) (0.044) Father’s education 0.197*** 0.089**
(0.042) (0.035) Wealth index 0.015 0.017
(0.022) (0.017) Teacher contractuel 0.079 -0.164
(0.135) (0.134) Teacher FRAM -0.209* -0.129
(0.105) (0.083) Teacher sortant-elevemaitre 0.259 0.027
(0.280) (0.254) Contractuel*School 0.194 0.450**
(0.217) (0.188) FRAM*School 0.190 -0.011
(0.152) (0.110) Sortant-elevemaitre*School 0.141 0.289
(0.340) (0.361)
Constant -
0.495*** -1.358*** -
0.378*** -0.691*** (0.056) (0.171) (0.075) (0.173)
Observations 10,472 8,822 10,472 9,668 R-squared 0.080 0.112 0.054 0.068
Standard errors in parentheses, with CISCO fixed effects. *** p<0.01, ** p<0.05, * p<0.1
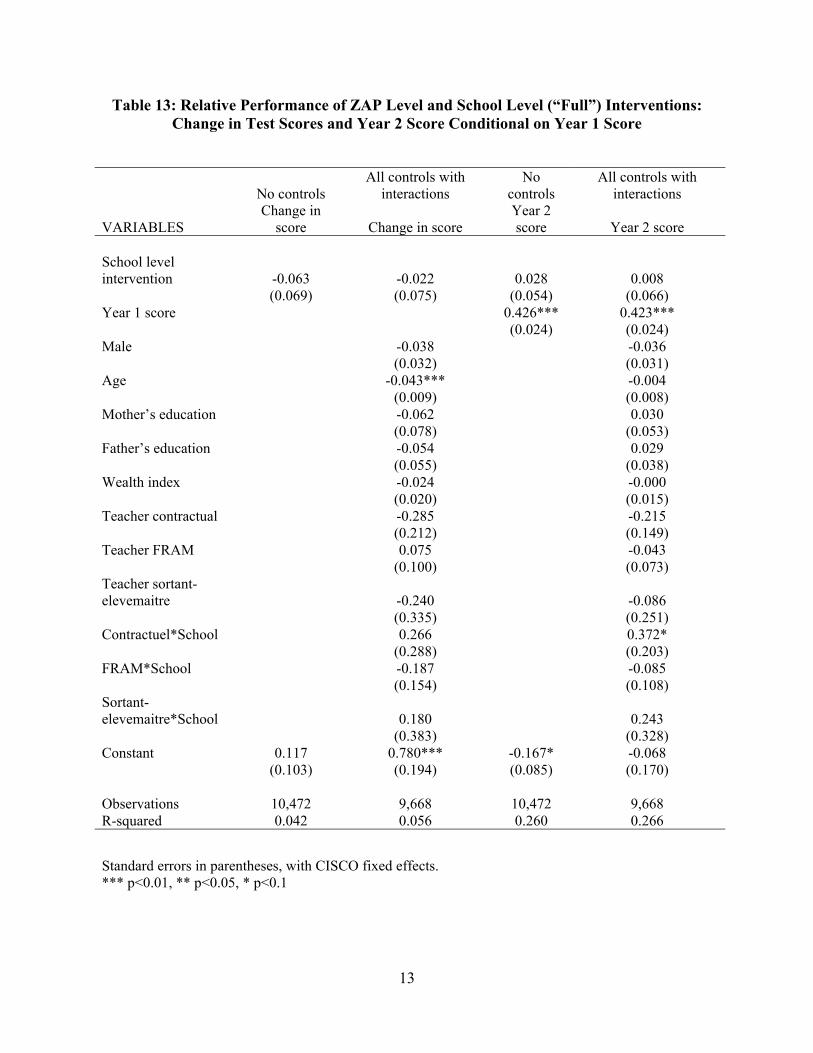
13
Table 13: Relative Performance of ZAP Level and School Level (“Full”) Interventions: Change in Test Scores and Year 2 Score Conditional on Year 1 Score
No controls All controls with
interactionsNo
controlsAll controls with
interactions
VARIABLES Change in
score Change in scoreYear 2 score Year 2 score
School level intervention -0.063 -0.022 0.028 0.008
(0.069) (0.075) (0.054) (0.066)Year 1 score 0.426*** 0.423***
(0.024) (0.024)Male -0.038 -0.036
(0.032) (0.031)Age -0.043*** -0.004
(0.009) (0.008)Mother’s education -0.062 0.030
(0.078) (0.053)Father’s education -0.054 0.029
(0.055) (0.038)Wealth index -0.024 -0.000
(0.020) (0.015)Teacher contractual -0.285 -0.215
(0.212) (0.149)Teacher FRAM 0.075 -0.043
(0.100) (0.073)Teacher sortant-elevemaitre -0.240 -0.086
(0.335) (0.251)Contractuel*School 0.266 0.372*
(0.288) (0.203)FRAM*School -0.187 -0.085
(0.154) (0.108)Sortant-elevemaitre*School 0.180 0.243
(0.383) (0.328)Constant 0.117 0.780*** -0.167* -0.068
(0.103) (0.194) (0.085) (0.170)
Observations 10,472 9,668 10,472 9,668R-squared 0.042 0.056 0.260 0.266
Standard errors in parentheses, with CISCO fixed effects. *** p<0.01, ** p<0.05, * p<0.1
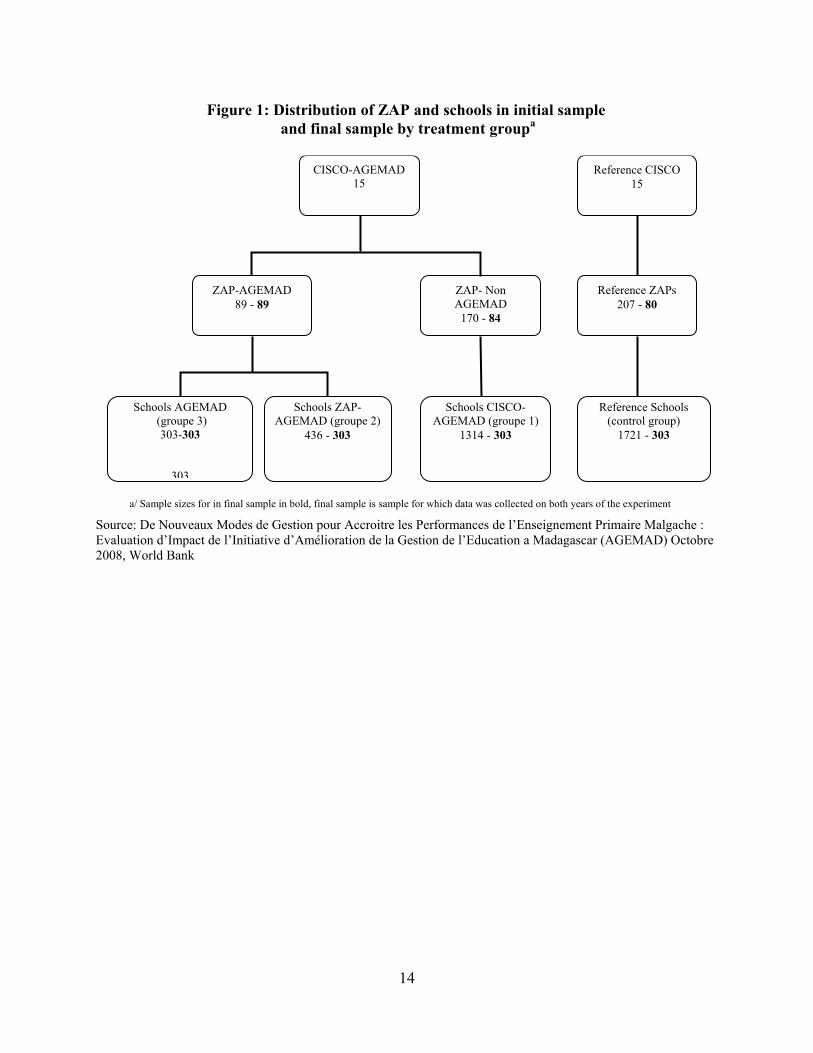
14
Source: De Nouveaux Modes de Gestion pour Accroitre les Performances de l’Enseignement Primaire Malgache : Evaluation d’Impact de l’Initiative d’Amélioration de la Gestion de l’Education a Madagascar (AGEMAD) Octobre 2008, World Bank
CISCO-AGEMAD 15
ZAP-AGEMAD 89 - 89
ZAP- Non AGEMAD
170 - 84
Schools CISCO-AGEMAD (groupe 1)
1314 - 303
Schools AGEMAD (groupe 3)
303-303
303
Schools ZAP-AGEMAD (groupe 2)
436 - 303
Reference Schools (control group)
1721 - 303
Reference ZAPs 207 - 80
Reference CISCO 15
Figure 1: Distribution of ZAP and schools in initial sample and final sample by treatment groupa
a/ Sample sizes for in final sample in bold, final sample is sample for which data was collected on both years of the experiment

15
Appendix
Table A.1: Essential Tasks for Teachers and School Directors
Teachers School Directors Takes daily roll call Prepares daily lesson plan Prepared bi-monthly lesson plans Monitors student learning Has tested the pupils during the past two months Helps lagging students Discusses student learning issues with the director
Keeps a register of enrollments Signs off on daily roll call Analyzes student absences on a monthly or bi-monthly basis Reviews students’ test results Takes stock of teacher absences Informs sub-district or district officer about teacher absences Follows up with teachers on lesson planning
Source: Lassibille et. al., 2010
Table A.2: AGEMAD Tools for Use by Teachers
Objective Activities
AGEPA Tool
Code Description Theme Periodicity
Provide overview of the year’s curriculum and promote systematic lesson planning
Plan time use and calendar of lessons
Prepare lessons
Track pupils’ reception of the lessons
E1A/PED
Bimonthly lesson plan for the entire school year
Pedagogy At start of school year
E1B/PED
Weekly lesson plan for bimonthly periods
Pedagogy At start of each bimonthly period
E2/PED Individual lesson plan Pedagogy Daily
Put focus on student learning
Prepare and mark tests
Record test scores
Identify and help lagging pupils
E3/EVA
Record of bimonthly test scores
(Cahier de notes de class)
Evaluation After each bimonthly test
Mobilize parental support for academic excellence
Inform parents about pupils’ progress in school E4/EVA
Individual pupil report card
(Bulletin individuel de notes)
Evaluation End of each bimonthly period
Reduce student absenteeism
Monitor pupils’ attendance
Detect possible attendance problems and their causes
Take remedial action
E5/APP Class attendance register
Time for learning Daily
Reduce teacher absenteeism
Account for teacher absences
Detect possible attendance problems and their causes
Take remedial action
E6/APP Teacher’s personal leave/travel record card
Time for learning Each occasion of absence
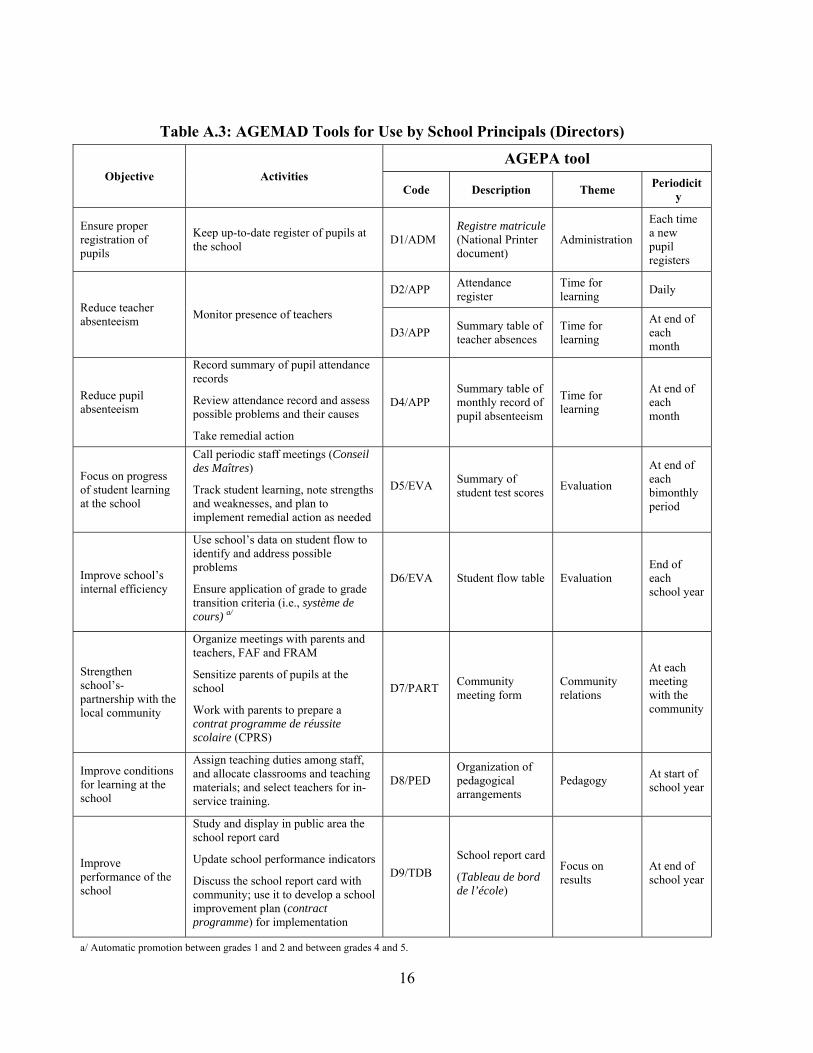
16
Table A.3: AGEMAD Tools for Use by School Principals (Directors)
Objective Activities
AGEPA tool
Code Description Theme Periodicit
y
Ensure proper registration of pupils
Keep up-to-date register of pupils at the school
D1/ADM Registre matricule (National Printer document)
Administration
Each time a new pupil registers
Reduce teacher absenteeism
Monitor presence of teachers
D2/APP Attendance register
Time for learning
Daily
D3/APP Summary table of teacher absences
Time for learning
At end of each month
Reduce pupil absenteeism
Record summary of pupil attendance records
Review attendance record and assess possible problems and their causes
Take remedial action
D4/APP Summary table of monthly record of pupil absenteeism
Time for learning
At end of each month
Focus on progress of student learning at the school
Call periodic staff meetings (Conseil des Maîtres)
Track student learning, note strengths and weaknesses, and plan to implement remedial action as needed
D5/EVA Summary of student test scores
Evaluation
At end of each bimonthly period
Improve school’s internal efficiency
Use school’s data on student flow to identify and address possible problems
Ensure application of grade to grade transition criteria (i.e., système de cours) a/
D6/EVA Student flow table Evaluation End of each school year
Strengthen school’s- partnership with the local community
Organize meetings with parents and teachers, FAF and FRAM
Sensitize parents of pupils at the school
Work with parents to prepare a contrat programme de réussite scolaire (CPRS)
D7/PART Community meeting form
Community relations
At each meeting with the community
Improve conditions for learning at the school
Assign teaching duties among staff, and allocate classrooms and teaching materials; and select teachers for in-service training.
D8/PED Organization of pedagogical arrangements
Pedagogy At start of school year
Improve performance of the school
Study and display in public area the school report card
Update school performance indicators
Discuss the school report card with community; use it to develop a school improvement plan (contract programme) for implementation
D9/TDB
School report card
(Tableau de bord de l’école)
Focus on results
At end of school year
a/ Automatic promotion between grades 1 and 2 and between grades 4 and 5.
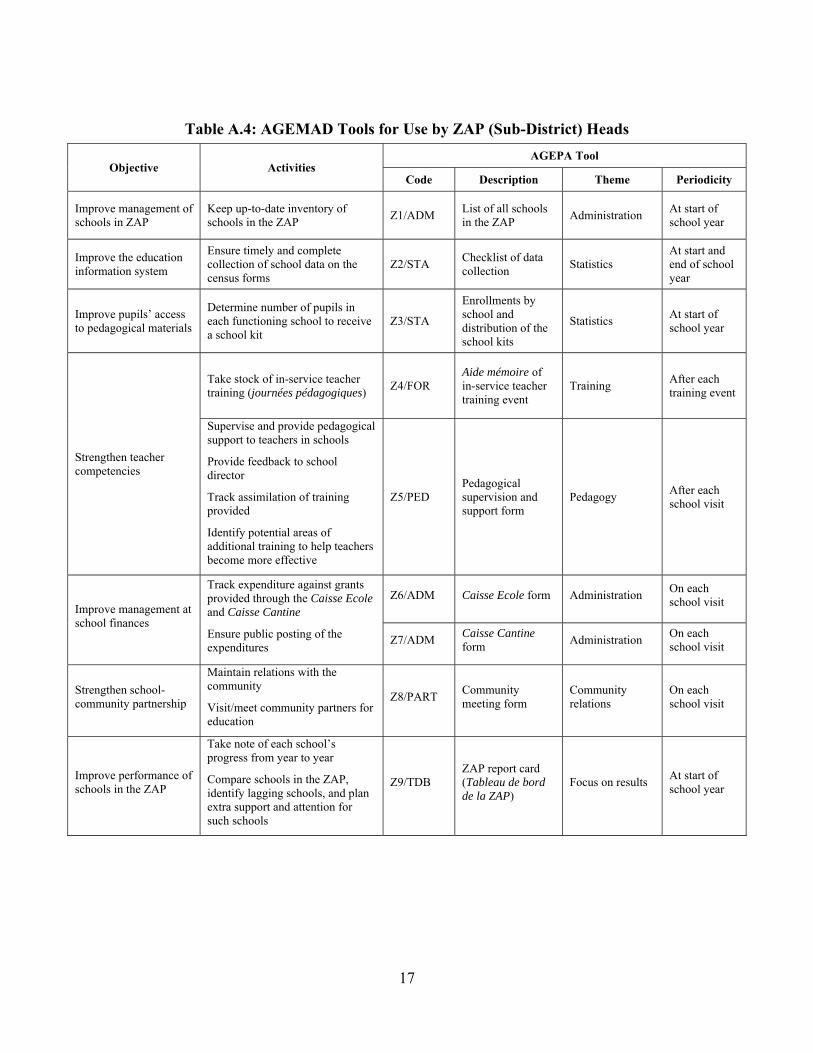
17
Table A.4: AGEMAD Tools for Use by ZAP (Sub-District) Heads
Objective Activities AGEPA Tool
Code Description Theme Periodicity
Improve management of schools in ZAP
Keep up-to-date inventory of schools in the ZAP
Z1/ADM List of all schools in the ZAP
Administration At start of school year
Improve the education information system
Ensure timely and complete collection of school data on the census forms
Z2/STA Checklist of data collection
Statistics At start and end of school year
Improve pupils’ access to pedagogical materials
Determine number of pupils in each functioning school to receive a school kit
Z3/STA
Enrollments by school and distribution of the school kits
Statistics At start of school year
Strengthen teacher competencies
Take stock of in-service teacher training (journées pédagogiques)
Z4/FOR Aide mémoire of in-service teacher training event
Training After each training event
Supervise and provide pedagogical support to teachers in schools
Provide feedback to school director
Track assimilation of training provided
Identify potential areas of additional training to help teachers become more effective
Z5/PED Pedagogical supervision and support form
Pedagogy After each school visit
Improve management at school finances
Track expenditure against grants provided through the Caisse Ecole and Caisse Cantine
Ensure public posting of the expenditures
Z6/ADM Caisse Ecole form Administration On each school visit
Z7/ADM Caisse Cantine form
Administration On each school visit
Strengthen school-community partnership
Maintain relations with the community
Visit/meet community partners for education
Z8/PART Community meeting form
Community relations
On each school visit
Improve performance of schools in the ZAP
Take note of each school’s progress from year to year
Compare schools in the ZAP, identify lagging schools, and plan extra support and attention for such schools
Z9/TDB ZAP report card (Tableau de bord de la ZAP)
Focus on results At start of school year
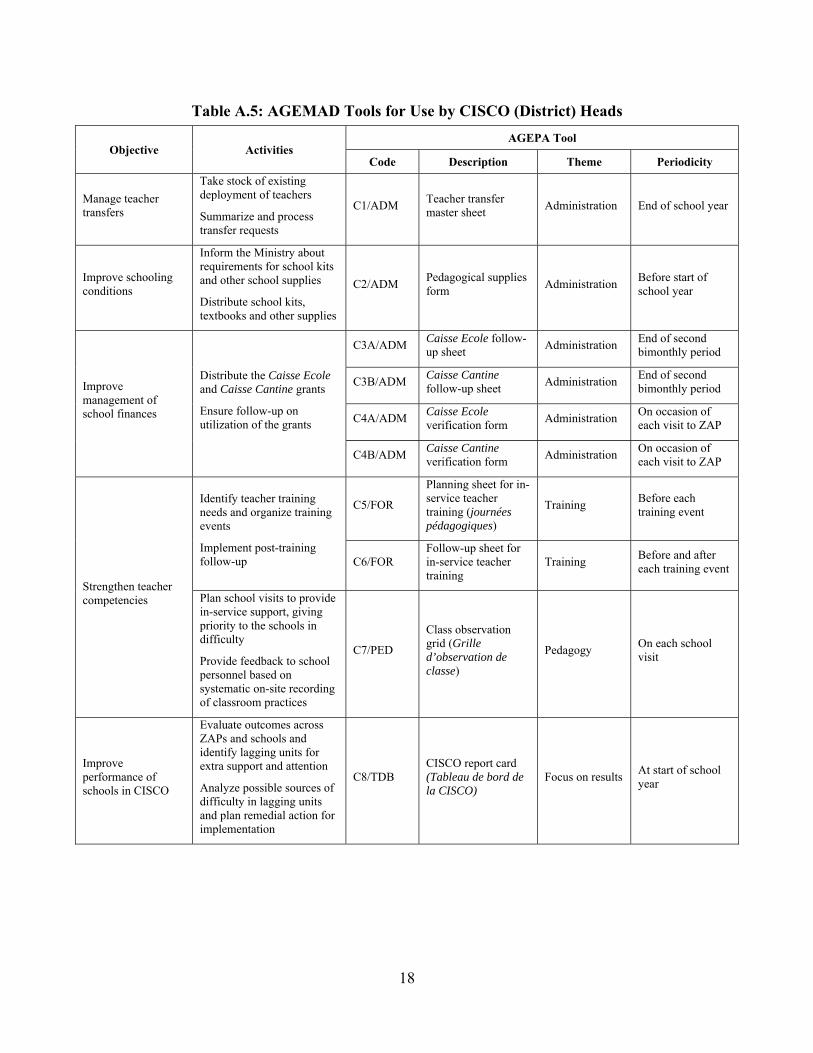
18
Table A.5: AGEMAD Tools for Use by CISCO (District) Heads
Objective Activities AGEPA Tool
Code Description Theme Periodicity
Manage teacher transfers
Take stock of existing deployment of teachers
Summarize and process transfer requests
C1/ADM Teacher transfer master sheet
Administration End of school year
Improve schooling conditions
Inform the Ministry about requirements for school kits and other school supplies
Distribute school kits, textbooks and other supplies
C2/ADM Pedagogical supplies form
Administration Before start of school year
Improve management of school finances
Distribute the Caisse Ecole and Caisse Cantine grants
Ensure follow-up on utilization of the grants
C3A/ADM Caisse Ecole follow-up sheet
Administration End of second bimonthly period
C3B/ADM Caisse Cantine follow-up sheet
Administration End of second bimonthly period
C4A/ADM Caisse Ecole verification form
Administration On occasion of each visit to ZAP
C4B/ADM Caisse Cantine verification form
Administration On occasion of each visit to ZAP
Strengthen teacher competencies
Identify teacher training needs and organize training events
Implement post-training follow-up
C5/FOR
Planning sheet for in-service teacher training (journées pédagogiques)
Training Before each training event
C6/FOR Follow-up sheet for in-service teacher training
Training Before and after each training event
Plan school visits to provide in-service support, giving priority to the schools in difficulty
Provide feedback to school personnel based on systematic on-site recording of classroom practices
C7/PED
Class observation grid (Grille d’observation de classe)
Pedagogy On each school visit
Improve performance of schools in CISCO
Evaluate outcomes across ZAPs and schools and identify lagging units for extra support and attention
Analyze possible sources of difficulty in lagging units and plan remedial action for implementation
C8/TDB CISCO report card (Tableau de bord de la CISCO)
Focus on results At start of school year