Embed Size (px)
Citation preview
The Impacts of ENSO and AO on South Carolina Climate Variability
Prepared by: SC State Climatology Office
http://www.dnr.sc.gov/climate/sco/
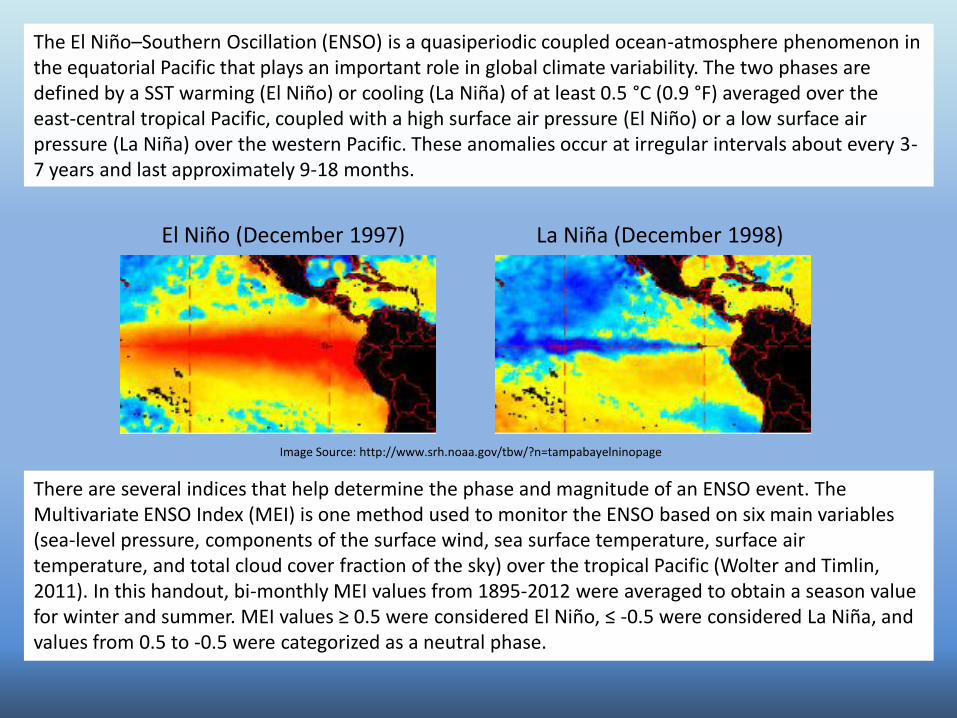
There are several indices that help determine the phase and magnitude of an ENSO event. The Multivariate ENSO Index (MEI) is one method used to monitor the ENSO based on six main variables (sea-level pressure, components of the surface wind, sea surface temperature, surface air temperature, and total cloud cover fraction of the sky) over the tropical Pacific (Wolter and Timlin, 2011). In this handout, bi-monthly MEI values from 1895-2012 were averaged to obtain a season value for winter and summer. MEI values ≥ 0.5 were considered El Niño, ≤ -0.5 were considered La Niña, and values from 0.5 to -0.5 were categorized as a neutral phase.
The El Niño–Southern Oscillation (ENSO) is a quasiperiodic coupled ocean-atmosphere phenomenon in the equatorial Pacific that plays an important role in global climate variability. The two phases are defined by a SST warming (El Niño) or cooling (La Niña) of at least 0.5 °C (0.9 °F) averaged over the east-central tropical Pacific, coupled with a high surface air pressure (El Niño) or a low surface air pressure (La Niña) over the western Pacific. These anomalies occur at irregular intervals about every 3-7 years and last approximately 9-18 months.
El Niño (December 1997)
La Niña (December 1998)
Image Source: http://www.srh.noaa.gov/tbw/?n=tampabayelninopage
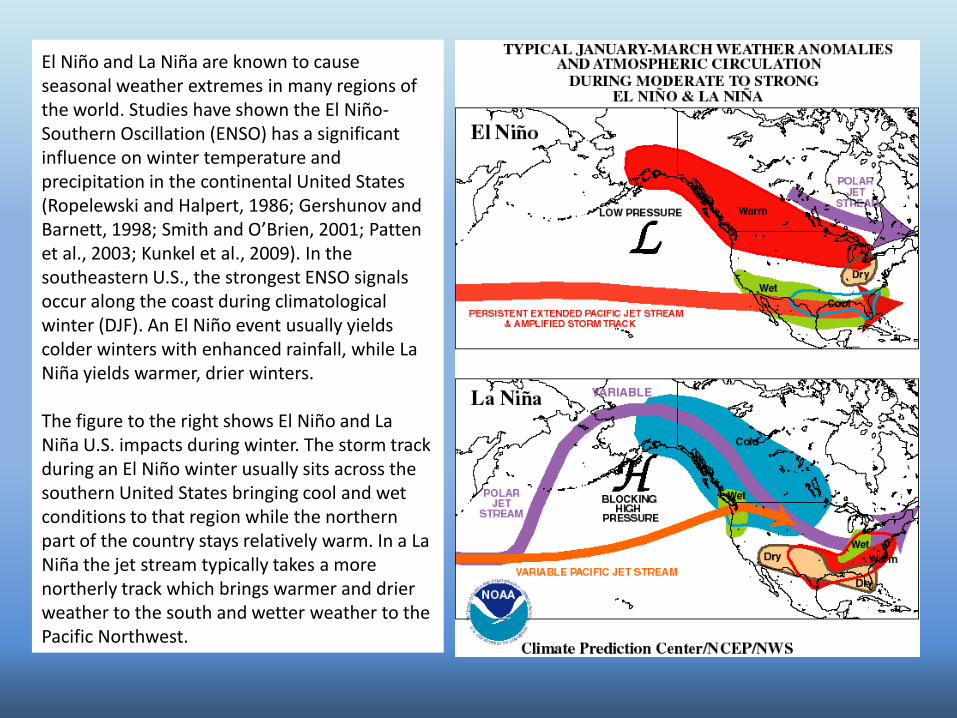
El Niño and La Niña are known to cause seasonal weather extremes in many regions of the world. Studies have shown the El Niño-Southern Oscillation (ENSO) has a significant influence on winter temperature and precipitation in the continental United States (Ropelewski and Halpert, 1986; Gershunov and Barnett, 1998; Smith and O’Brien, 2001; Patten et al., 2003; Kunkel et al., 2009). In the southeastern U.S., the strongest ENSO signals occur along the coast during climatological winter (DJF). An El Niño event usually yields colder winters with enhanced rainfall, while La Niña yields warmer, drier winters. The figure to the right shows El Niño and La Niña U.S. impacts during winter. The storm track during an El Niño winter usually sits across the southern United States bringing cool and wet conditions to that region while the northern part of the country stays relatively warm. In a La Niña the jet stream typically takes a more northerly track which brings warmer and drier weather to the south and wetter weather to the Pacific Northwest.
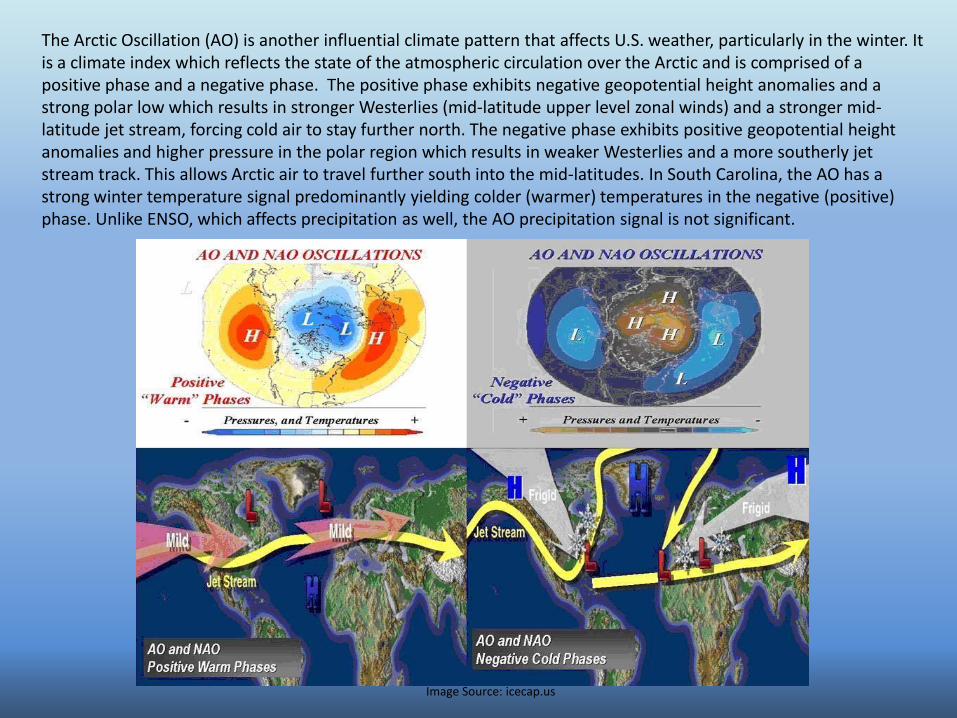
The Arctic Oscillation (AO) is another influential climate pattern that affects U.S. weather, particularly in the winter. It is a climate index which reflects the state of the atmospheric circulation over the Arctic and is comprised of a positive phase and a negative phase. The positive phase exhibits negative geopotential height anomalies and a strong polar low which results in stronger Westerlies (mid-latitude upper level zonal winds) and a stronger mid-latitude jet stream, forcing cold air to stay further north. The negative phase exhibits positive geopotential height anomalies and higher pressure in the polar region which results in weaker Westerlies and a more southerly jet stream track. This allows Arctic air to travel further south into the mid-latitudes. In South Carolina, the AO has a strong winter temperature signal predominantly yielding colder (warmer) temperatures in the negative (positive) phase. Unlike ENSO, which affects precipitation as well, the AO precipitation signal is not significant.
Image Source: icecap.us
35
40
45
50
55
60
All Winters El Nino La Nina Neutral AO+ AO-
Tem
per
atu
re (
°F)
SC Statewide Winter Temperature vs. ENSO and AO
0
5
10
15
20
25
All Winters El Nino La Nina Neutral AO+ AO-
Pre
cip
itat
ion
(in
ches
)
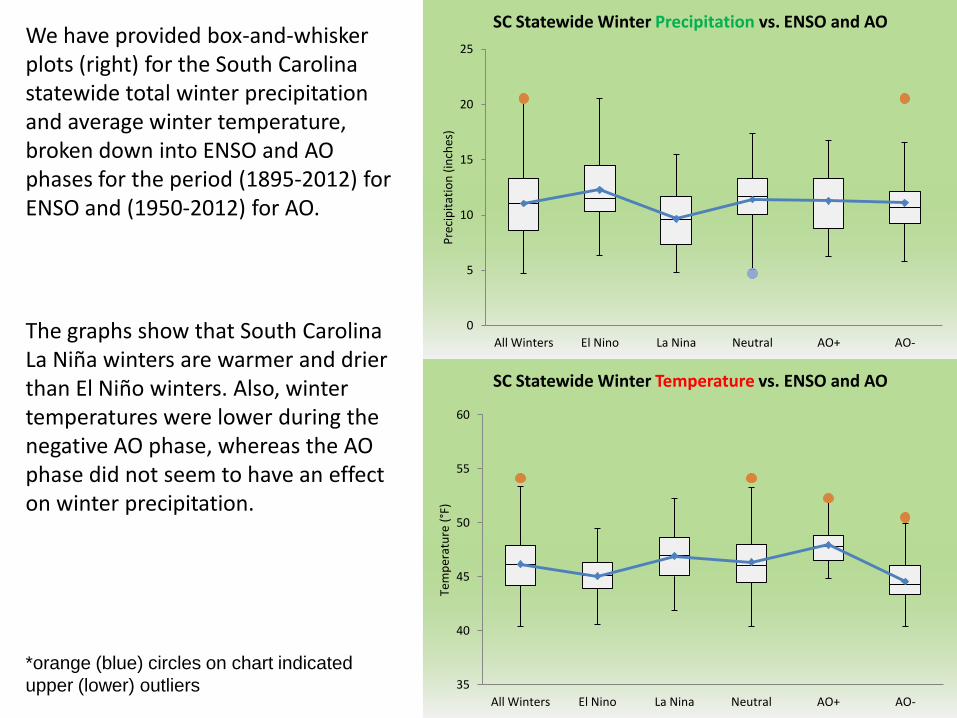
SC Statewide Winter Precipitation vs. ENSO and AO We have provided box-and-whisker plots (right) for the South Carolina statewide total winter precipitation and average winter temperature, broken down into ENSO and AO phases for the period (1895-2012) for ENSO and (1950-2012) for AO.
The graphs show that South Carolina La Niña winters are warmer and drier than El Niño winters. Also, winter temperatures were lower during the negative AO phase, whereas the AO phase did not seem to have an effect on winter precipitation.
*orange (blue) circles on chart indicated
upper (lower) outliers
20
22
24
26
28
30
32
34
36
38
40
All Winters
El Nino La Nina Neutral AO+ AO-
Tem
per
atu
re (
°F)
Avg Winter Min Temp vs. ENSO and AO
45
47
49
51
53
55
57
59
61
63
65
All Winters
El Nino La Nina Neutral AO+ AO-
Tem
per
atu
re (
°F)
Avg Winter Max Temp vs. ENSO and AO
0
5
10
15
20
25
30
35
All Winters
El Nino La Nina Neutral AO+ AO-
Pre
cip
itat
ion
(in
ches
)
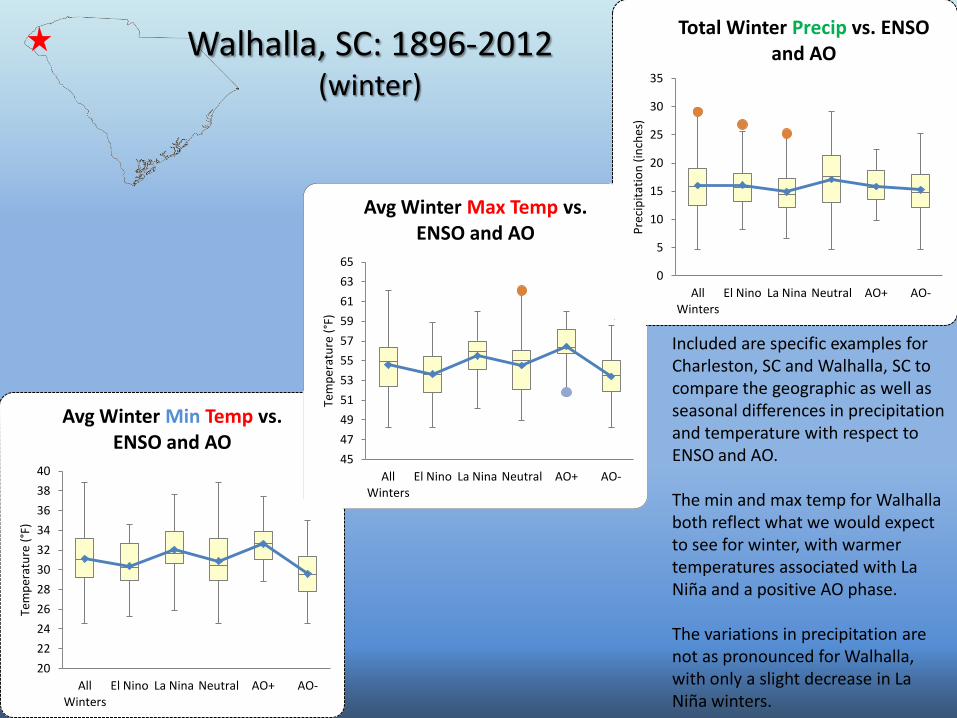
Total Winter Precip vs. ENSO and AO Walhalla, SC: 1896-2012
(winter)
Included are specific examples for Charleston, SC and Walhalla, SC to compare the geographic as well as seasonal differences in precipitation and temperature with respect to ENSO and AO. The min and max temp for Walhalla both reflect what we would expect to see for winter, with warmer temperatures associated with La Niña and a positive AO phase. The variations in precipitation are not as pronounced for Walhalla, with only a slight decrease in La Niña winters.
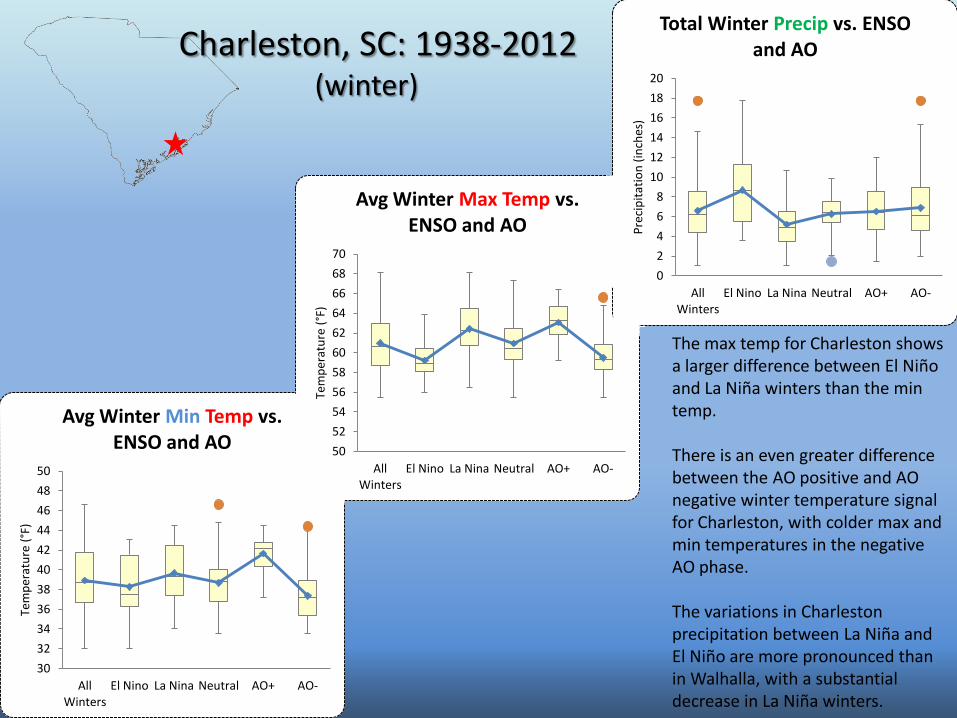
Charleston, SC: 1938-2012 (winter)
30
32
34
36
38
40
42
44
46
48
50
All Winters
El Nino La Nina Neutral AO+ AO-
Tem
per
atu
re (
°F)
Avg Winter Min Temp vs. ENSO and AO 50
52
54
56
58
60
62
64
66
68
70
All Winters
El Nino La Nina Neutral AO+ AO-
Tem
per
atu
re (
°F)
Avg Winter Max Temp vs. ENSO and AO
0
2
4
6
8
10
12
14
16
18
20
All Winters
El Nino La Nina Neutral AO+ AO-
Pre
cip
itat
ion
(in
ches
)
Total Winter Precip vs. ENSO and AO
The max temp for Charleston shows a larger difference between El Niño and La Niña winters than the min temp. There is an even greater difference between the AO positive and AO negative winter temperature signal for Charleston, with colder max and min temperatures in the negative AO phase. The variations in Charleston precipitation between La Niña and El Niño are more pronounced than in Walhalla, with a substantial decrease in La Niña winters.
85 86 87 88 89 90 91 92 93 94 95
All
Sum
mer
s
El N
ino
La N
ina
Neu
tral
AO
+
AO
-
Tem
per
atu
re (
°F)
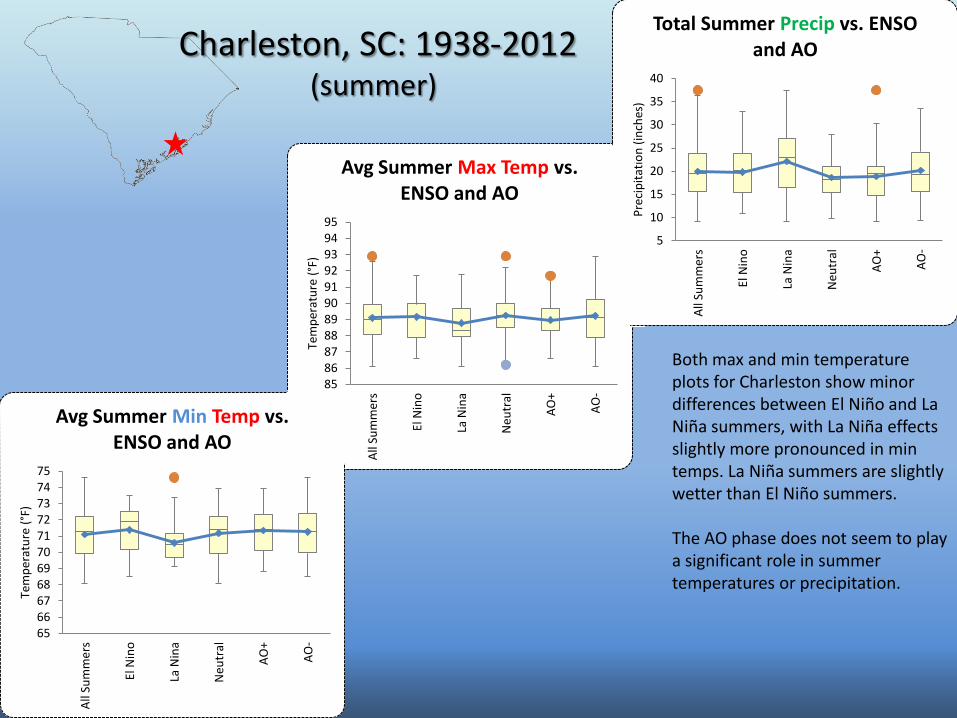
Avg Summer Max Temp vs. ENSO and AO
Charleston, SC: 1938-2012 (summer)
65 66 67 68 69 70 71 72 73 74 75
All
Sum
mer
s
El N
ino
La N
ina
Neu
tral
AO
+
AO
-
Tem
per
atu
re (
°F)
Avg Summer Min Temp vs. ENSO and AO
5
10
15
20
25
30
35
40
All
Sum
mer
s
El N
ino
La N
ina
Neu
tral
AO
+
AO
-
Pre
cip
itat
ion
(in
ches
)
Total Summer Precip vs. ENSO and AO
Both max and min temperature plots for Charleston show minor differences between El Niño and La Niña summers, with La Niña effects slightly more pronounced in min temps. La Niña summers are slightly wetter than El Niño summers. The AO phase does not seem to play a significant role in summer temperatures or precipitation.
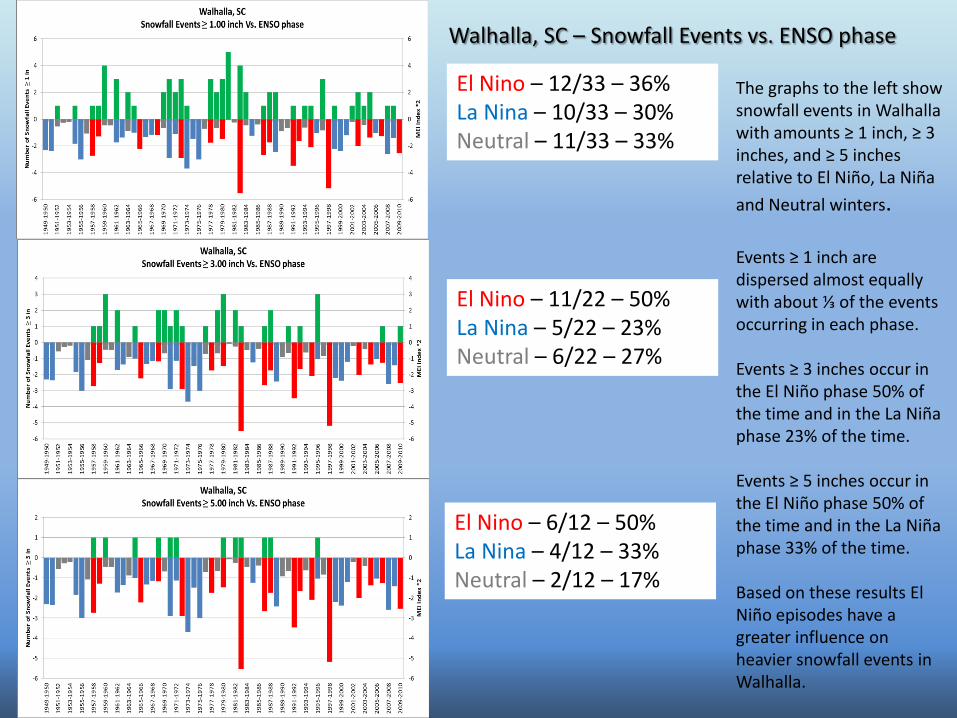
El Nino – 12/33 – 36% La Nina – 10/33 – 30% Neutral – 11/33 – 33%
El Nino – 11/22 – 50% La Nina – 5/22 – 23% Neutral – 6/22 – 27%
El Nino – 6/12 – 50% La Nina – 4/12 – 33% Neutral – 2/12 – 17%
Walhalla, SC – Snowfall Events vs. ENSO phase
The graphs to the left show snowfall events in Walhalla with amounts ≥ 1 inch, ≥ 3 inches, and ≥ 5 inches relative to El Niño, La Niña
and Neutral winters. Events ≥ 1 inch are dispersed almost equally with about ⅓ of the events occurring in each phase. Events ≥ 3 inches occur in the El Niño phase 50% of the time and in the La Niña phase 23% of the time. Events ≥ 5 inches occur in the El Niño phase 50% of the time and in the La Niña phase 33% of the time. Based on these results El Niño episodes have a greater influence on heavier snowfall events in Walhalla.
Gershunov, A., T. P. Barnett, 1998: ENSO Influence on Intraseasonal Extreme Rainfall and Temperature Frequencies in the Contiguous United States: Observations and Model Results. J. Climate, 11, 1575–1586. Kunkel, K. E., M. A. Palecki, L. Ensor, D. Easterling, K. G. Hubbard, D. Robinson, K. Redmond, 2009: Trends in Twentieth-Century U.S. Extreme Snowfall Seasons. J. Climate, 22, 6204–6216. Patten, J. M., S. R. Smith, J. J. O'Brien, 2003: Impacts of ENSO on Snowfall Frequencies in the United States. Wea. Forecasting, 18, 965–980 Ropelewski, C. F., and M. S. Halpert, 1986: North American precipitation and temperature patterns associated with the El Nino/ Southern Oscillation (ENSO). Mon. Wea. Rev., 114, 2352-2362 Smith, S. R., and J. J. O’Brien, 2001: Regional snowfall distributions associated with ENSO: Implications for seasonal forecasting, Bull. Amer. Meteor. Soc., 82, 1179–1191 Wolter, K., and M. S. Timlin, 2011: El Niño/Southern Oscillation behaviour since 1871 as diagnosed in an extended multivariate ENSO index (MEI.ext). International Journal of Climatology, 31, 14pp.
Literature Cited
![Multivariate Nonstationary Oscillation Simulation of Climate ...espace.inrs.ca/9555/1/P3530.pdfand Wallace, 1998], the El Niño-Southern Oscillation (ENSO) [Tsonis et al., 2007; Modarres](https://img.pdfslide.us/doc/110x75/608d757c44af177f8d5b748e/multivariate-nonstationary-oscillation-simulation-of-climate-and-wallace-1998.jpg)