Embed Size (px)
Citation preview
JOURNAL OF SPATIAL INFORMATION SCIENCE
Number 21 (2020), pp. 203–228 doi:10.5311/JOSIS.2020.21.601
RESEARCH ARTICLE
The impact of urban road networkmorphology on pedestrian
wayfinding behavior
Debjit Bhowmick1, Stephan Winter1, Mark Stevenson1,2, andPeter Vortisch3
1Department of Infrastructure Engineering, The University of Melbourne, Australia2Transport, Health and Urban Design Research Lab, The University of Melbourne, Australia
3Institute for Transport Studies, Karlsruhe Institute of Technology (KIT), Germany
Received: November 28, 2019; returned: February 9, 2020; revised: March 18, 2020; accepted: July 14, 2020.
Abstract: Pedestrians do not always choose the shortest available route during the pro-cess of wayfinding. Instead, their route choices are influenced by strategies, also knownas wayfinding heuristics. These heuristics aim to minimize cognitive effort of the pedes-trian and their application usually leads to satisfactory route choices. Our previous studyevaluated and analyzed resultant routes from the application of four well-known pedes-trian wayfinding heuristics across nine distinct network morphologies via simulation. Itwas observed that the variation in the cost (difference in route length between a heuristicroute and the shortest route, expressed as a percentage of the shortest route length) acrossthe four heuristics increased with an increase in the irregularity of the network. Based onthese results, we claimed that, people may opt for more diverse heuristics while walkingthrough relatively regular networks, as route cost across heuristics are more similar in mag-nitude and thus applying any one of them would not result in a substantial difference inthe travelled distance. Likewise, they may prefer specific heuristics in the relatively irregu-lar networks, as some heuristics are significantly costlier than others, thus creating greatervariation in cost across heuristics and hence would result in significantly greater travelleddistances. In this study, we investigated this claim by comparing simulated routes withobserved pedestrian trajectories in Beijing and Melbourne, two cities at opposite ends ofthe regularity spectrum, as established in the literature. Using statistical tests, we claimwith confidence that on an average, heuristic choice distribution is uniform in Melbourne,a city having a regular network morphology. On the contrary, heuristic choice distributionwas skewed in Beijing, a city with more irregularities in its street network morphology.
203
This novel finding could help urban planners and future researchers in producing moreaccurate patterns of aggregate pedestrian movement in outdoor urban spaces.
Keywords: pedestrian wayfinding, wayfinding heuristics, network morphology, trajectorydata analysis, map matching, path similarity, computational movement analysis, GPS.
1 Introduction
Human wayfinding in outdoor spaces involves the process of selecting segments of an ex-isting real-world network to find a viable route between an origin and a destination [13].During wayfinding, pedestrians do not always choose the shortest possible route [8] asthey may not be able to discern it, especially when the shortest routes are complex. Hence,they apply certain strategies or wayfinding heuristics that attempt to minimize their cog-nitive effort [3]. For example, pedestrians may seek routes with fewer turns—routes thatare simpler in nature, hence require less cognitive effort or are shorter to communicateand memorize—even if this route is not geometrically the shortest one. This strategy ofwayfinding in a street network and reaching the destination with the fewest number ofturns is one wayfinding heuristic. Like this ‘Fewest turns strategy’, there exists multiplewell-established wayfinding heuristics that are known to be applied by pedestrians. Thesewayfinding heuristics are applied by pedestrians irrespective of their level of spatial apti-tude or familiarity with a given road network.
Empirical studies have revealed that pedestrians switch between wayfinding strate-gies with a change in the ambient environment. Through his experiments, Golledge [13]inferred that “perceptions of the configuration of the environment itself (particularly dif-ferent perspectives as one changes direction) may influence route choice.” This gives usthe impression that may be human beings are able to understand that, given a type of net-work morphology, certain heuristics are better at optimizing not just cognitive effort, butphysical effort (in terms of distance travelled) as well. We say that certain heuristics are (onaverage) less costly than others in certain types of road networks, taking into account thedifference in route length between the heuristic route and the shortest possible route.
In this regard, our previous work [5] showed through simulation that although someheuristics are consistently cheaper and some are consistently costlier across nine differenttypes of network morphologies, the variation in cost across these wayfinding heuristics isdependent on the regularity of the network structure, as inferred from visual assessment.It was observed that more regular networks had lesser variation in cost across heuristicswhile more irregular networks experienced more variation. For example, in Melbourne,the observed standard deviation in route cost was 6.96% while the corresponding statisticin Beijing was 9.39% (these numbers although not present in [5] are derived from the sameanalysis). Regularity of network morphologies was based on the analysis and findingsby [33]. The results supported the argument that pedestrians possibly opt for a varietyof heuristics in regular networks while opting for specific heuristics (or avoiding them) inirregular ones. While we arrived at this conclusion by thoroughly simulating four wayfind-ing heuristics in nine network morphologies following a systematic methodology, the sim-ulation approach had to use some assumptions. While analysis of the simulated routesacross different network structures helped us formulate this hypothesis, yet we could notclaim with confidence that this is representative of actual pedestrian behavior. For ground-
© by the author(s) Licensed under Creative Commons Attribution 3.0 License CC©
THE IMPACT OF URBAN ROAD NETWORK MORPHOLOGY ON PEDESTRIAN WAYFINDING BEHAVIOR 205
ing of results from our previous study, we had to analyze actual pedestrian routes and thendraw comparisons with our previous results.
Shortest paths have been the foundation of a host of well-established studies involvingcomputational movement analysis of pedestrians. But pedestrians do not always follow(or even know) the shortest available paths. In the literature, we have found studies whichreveal that pedestrians move in outdoor spaces by relying on heuristics and not shortestpaths (these are discussed in detail in Section 2.1). Studies have also proven that mostpeople use such strategies by observing commonalities in their movement patterns [8].Thus, to accurately predict actual pedestrian movement, shortest path algorithms are notappropriate as the computed routes are not representative of actual pedestrian routes formost cases. Studies involving wayfinding heuristics are aimed at understanding actualmovement patterns of people (for example, how and where people actually move in acity or in a neighborhood). Disregarding shortest path strategies, these studies also formthe basis of producing aggregate patterns of pedestrian movement in urban areas [9] andcan serve as a useful tool for urban planners and facility planners, especially when de-signing more walkable neighborhoods. But there exists a host of heuristics (and not justone) which pedestrians make use of during outdoor wayfinding. We also know that thechoice of heuristic is dependent on the environment [13]. Thus, to reproduce actual move-ment patterns, there needs to be an understanding on whether heuristic choice distributionchanges with a change in the environment configuration. We have chosen four well-knownheuristics, all geometric in nature, and thus dependent on the pedestrian network configu-ration (morphology). Hence, this study aims at investigating actual pedestrian movementto ground the simulation finding, i.e. to check whether pedestrian heuristic choice is de-pendent on network morphology. Thus, we chose two cities with contrasting pedestriannetwork morphologies, and analyzed pedestrian trajectory data for these cities, to under-stand whether network morphology has an influence on pedestrian wayfinding behavior,or in other words, the choice of heuristics.
Cost, in this context, means route cost which is the difference in route length betweenthe shortest route and the heuristic route, expressed as a percentage of the shortest route.The use of this term is consistent with our terminology from our previous work. Route costis not the resultant of any detour. It is a measure representing the heuristic routes relativeto the shortest available routes. Heuristic routes are an attempt to simulate usual routesof pedestrians, albeit approximately. Hence, while walking along their usual route, thepedestrian does not intend to take a detour from the shortest route because they may notbe aware of the shortest route in the first place. The term ‘detour’ has been reserved forcases where pedestrians deviate from their usual route for other reasons, such as personalsafety concerns or avoid a busy route during rush hour. We do not possess knowledge ofthe presence of detours in our datasets. Additionally, enriching our dataset with semanticinformation on detours is not within the scope of this paper. Hence, we believe that ‘detourcost’ is not an appropriate term.
We hypothesized that in Melbourne, a city with a relatively regular pedestrian networkmorphology, the choice of heuristics will be uniformly distributed, while in Beijing, a citywith a relatively irregular network, this distribution will be skewed. This paper attemptsto answer the following research question: Does distribution of heuristic choice vary acrossnetwork morphology?
Our study makes use of GPS datasets from Melbourne and Beijing, two cities at oppo-site ends of the regularity spectrum, as described in [33]. As the records in these datasets
JOSIS, Number 21 (2020), pp. 203–228
206 BHOWMICK, WINTER, STEVENSON, VORTISCH
were labelled with their corresponding transportation mode, we filtered walking points,employed trip segmentation thresholds to differentiate between individual trips, and per-formed map matching (matching raw GPS trajectories to appropriate segments of the un-derlying pedestrian network) to obtain the actual traversed routes. For the same origin-destination pairs, we obtained the theoretical heuristic routes using simulation of fourwayfinding heuristics. Consequently, we used Network Hausdorff Distance (NHD) toderive (dis)similarity between actual and simulated routes to infer heuristics chosen bypedestrians, either partially or fully.
The paper is organized as follows. Section 2 contains a review of the existing literaturealong with the heuristic algorithms proposed in our previous study while Section 3 talksabout the datasets used in this study. Section 4 contains the detailed methodology followedin this study. Section 5 presents some preliminary findings and Section 6 discusses thefindings and presents relevant arguments in relation to the same.
2 Related work
2.1 Wayfinding heuristics
Several studies have explored human wayfinding strategies in outdoor spaces. A review ofexisting wayfinding literature reveals the existence of multiple heuristics that are appliedby pedestrians. These heuristics have been theorised based on observations of actual andprobable pedestrian behavior in relatively small environments [3, 8–10, 13, 19]. Compari-son between wayfinding heuristics has been done on a small scale by [20]. In contrast, inour previous work heuristic routes were simulated in a relatively larger, city-wide scaleto investigate the impact of network morphology on pedestrian wayfinding decisions [5].These simulated routes represented theoretical routes chosen by pedestrians applying asingle heuristic consistently during their wayfinding exercise. The heuristics chosen weremodified least angle strategy, longest-leg first strategy, shortest-leg first strategy and fewest turnsstrategy.
Although there exists a host of other wayfinding heuristics, only the aforementionedones are geometric in nature and thus dependent on network morphology. In these heuris-tics, the location of taking a turn or the number of turns taken during wayfinding deter-mine the route choice. Human perceptions and conceptualizations vary, so what accountsto form a turn is vague from a cognitive perspective. But also representations of walkablefeatures in databases vary in their level of abstraction and detail, challenging additionallyto define what constitutes a turn. Accordingly, our previous study [5] defined a ‘turn’ asfollows: “If two consecutive road segments in a route have a deflection angle (difference inbearing) of 45° or more, the move from one to the other is considered a turn." This definitionwas applied to appropriate levels of geometric abstraction. It led to satisfactory outputs ac-cording to visualizations of randomly sampled routes. But any research is sensitive to thechosen threshold value. The four chosen heuristics and the implemented algorithms arediscussed briefly as follows.
Modified Least angle strategy: [19] proposed a real-world wayfinding heuristic called‘least angle strategy’ which can be applied in an unknown environment if the destinationcan be perceived directly by the navigator, at least at the beginning of the navigation pro-cess. At each decision point, the pedestrian prefers the road segment which has the leastdeviation from the direction of the intended destination. However, the original least angle
www.josis.org
THE IMPACT OF URBAN ROAD NETWORK MORPHOLOGY ON PEDESTRIAN WAYFINDING BEHAVIOR 207
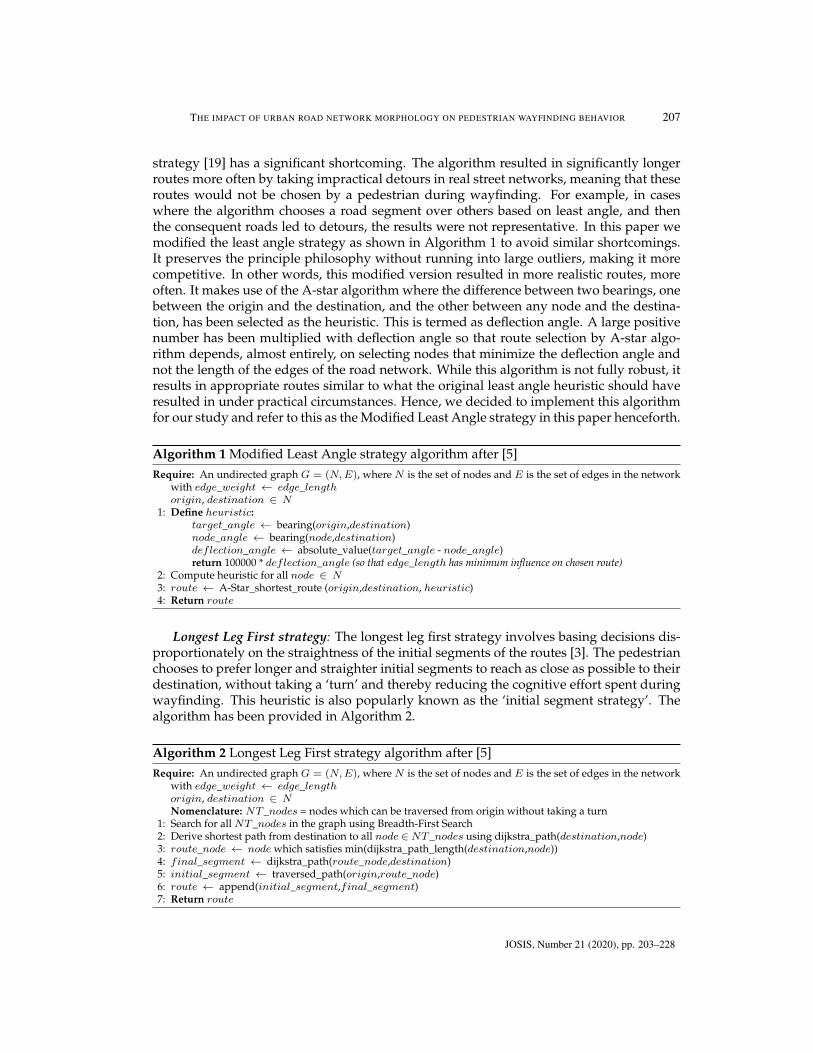
strategy [19] has a significant shortcoming. The algorithm resulted in significantly longerroutes more often by taking impractical detours in real street networks, meaning that theseroutes would not be chosen by a pedestrian during wayfinding. For example, in caseswhere the algorithm chooses a road segment over others based on least angle, and thenthe consequent roads led to detours, the results were not representative. In this paper wemodified the least angle strategy as shown in Algorithm 1 to avoid similar shortcomings.It preserves the principle philosophy without running into large outliers, making it morecompetitive. In other words, this modified version resulted in more realistic routes, moreoften. It makes use of the A-star algorithm where the difference between two bearings, onebetween the origin and the destination, and the other between any node and the destina-tion, has been selected as the heuristic. This is termed as deflection angle. A large positivenumber has been multiplied with deflection angle so that route selection by A-star algo-rithm depends, almost entirely, on selecting nodes that minimize the deflection angle andnot the length of the edges of the road network. While this algorithm is not fully robust, itresults in appropriate routes similar to what the original least angle heuristic should haveresulted in under practical circumstances. Hence, we decided to implement this algorithmfor our study and refer to this as the Modified Least Angle strategy in this paper henceforth.
Algorithm 1 Modified Least Angle strategy algorithm after [5]Require: An undirected graph G = (N,E), where N is the set of nodes and E is the set of edges in the network
with edge_weight ← edge_lengthorigin, destination ∈ N
1: Define heuristic:target_angle ← bearing(origin,destination)node_angle ← bearing(node,destination)deflection_angle ← absolute_value(target_angle - node_angle)return 100000 * deflection_angle (so that edge_length has minimum influence on chosen route)
2: Compute heuristic for all node ∈ N3: route ← A-Star_shortest_route (origin,destination, heuristic)4: Return route
Longest Leg First strategy: The longest leg first strategy involves basing decisions dis-proportionately on the straightness of the initial segments of the routes [3]. The pedestrianchooses to prefer longer and straighter initial segments to reach as close as possible to theirdestination, without taking a ‘turn’ and thereby reducing the cognitive effort spent duringwayfinding. This heuristic is also popularly known as the ‘initial segment strategy’. Thealgorithm has been provided in Algorithm 2.
Algorithm 2 Longest Leg First strategy algorithm after [5]Require: An undirected graph G = (N,E), where N is the set of nodes and E is the set of edges in the network
with edge_weight ← edge_lengthorigin, destination ∈ NNomenclature: NT_nodes = nodes which can be traversed from origin without taking a turn
1: Search for all NT_nodes in the graph using Breadth-First Search2: Derive shortest path from destination to all node ∈NT_nodes using dijkstra_path(destination,node)3: route_node ← node which satisfies min(dijkstra_path_length(destination,node))4: final_segment ← dijkstra_path(route_node,destination)5: initial_segment ← traversed_path(origin,route_node)6: route ← append(initial_segment,final_segment)7: Return route
JOSIS, Number 21 (2020), pp. 203–228
208 BHOWMICK, WINTER, STEVENSON, VORTISCH
Shortest Leg First strategy: Although [13] and [9] have mentioned the shortest leg firststrategy as one of the least preferred wayfinding heuristics by pedestrians, there was noformal definition found in the literature. Hence, for this study, we have assumed that thisstrategy involves taking turns in the initial portion of the route to keep the latter portionsas straight as possible. [20] stated that shorter initial legs provide pedestrians with thechoice to explore further alternatives quickly at the next decision point, to reduce the costof potentially required backtracking when compared to long initial segments. Based on ourunderstanding, we have obtained the shortest leg first route for an OD pair by swappingthe positions of origin and destination in Algorithm 2.
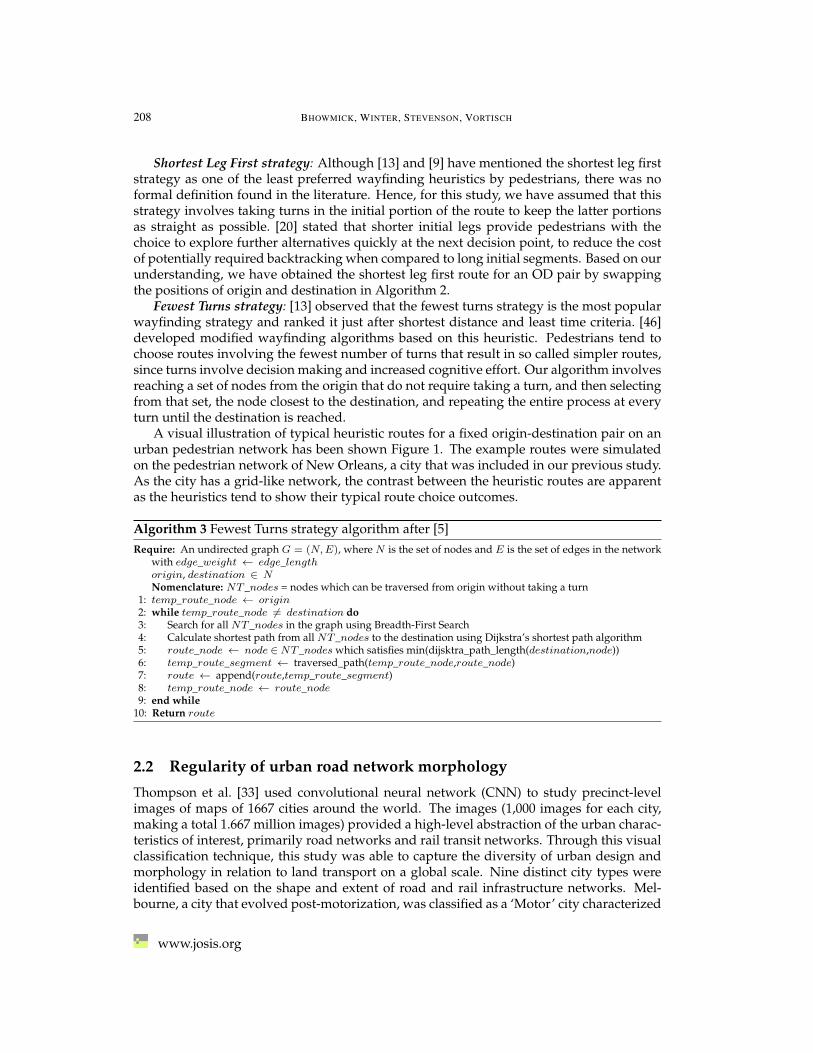
Fewest Turns strategy: [13] observed that the fewest turns strategy is the most popularwayfinding strategy and ranked it just after shortest distance and least time criteria. [46]developed modified wayfinding algorithms based on this heuristic. Pedestrians tend tochoose routes involving the fewest number of turns that result in so called simpler routes,since turns involve decision making and increased cognitive effort. Our algorithm involvesreaching a set of nodes from the origin that do not require taking a turn, and then selectingfrom that set, the node closest to the destination, and repeating the entire process at everyturn until the destination is reached.
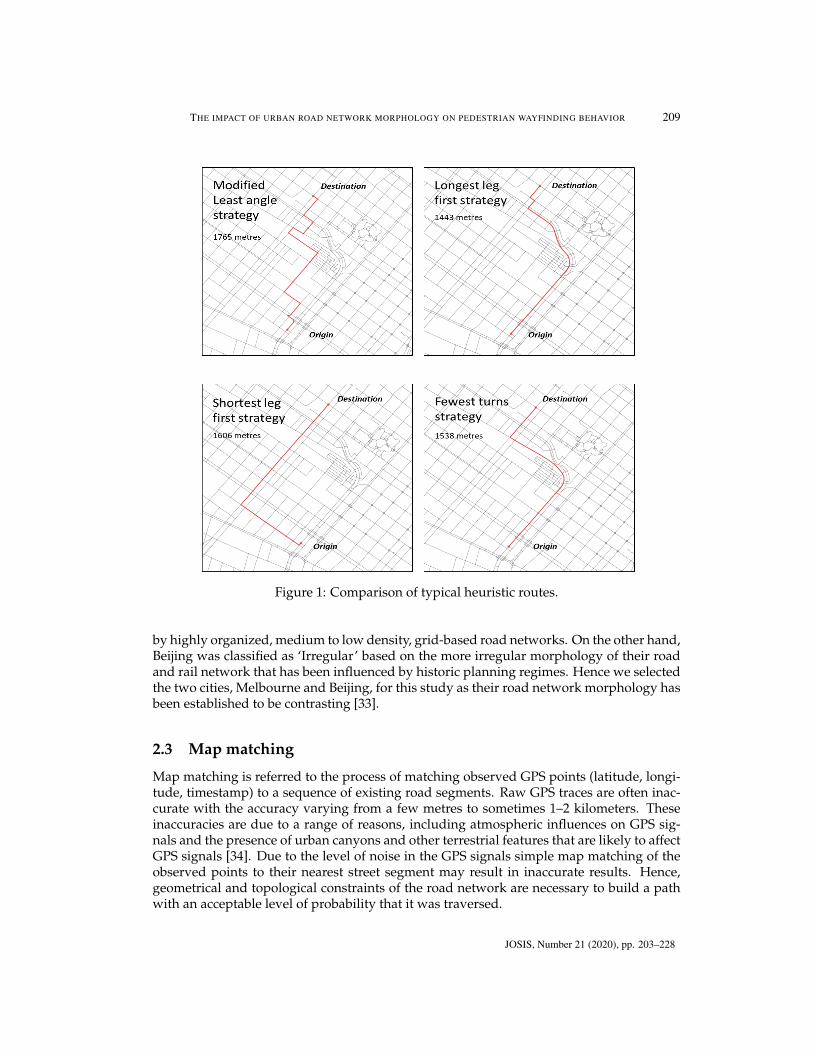
A visual illustration of typical heuristic routes for a fixed origin-destination pair on anurban pedestrian network has been shown Figure 1. The example routes were simulatedon the pedestrian network of New Orleans, a city that was included in our previous study.As the city has a grid-like network, the contrast between the heuristic routes are apparentas the heuristics tend to show their typical route choice outcomes.
Algorithm 3 Fewest Turns strategy algorithm after [5]Require: An undirected graph G = (N,E), where N is the set of nodes and E is the set of edges in the network
with edge_weight ← edge_lengthorigin, destination ∈ NNomenclature: NT_nodes = nodes which can be traversed from origin without taking a turn
1: temp_route_node ← origin2: while temp_route_node 6= destination do3: Search for all NT_nodes in the graph using Breadth-First Search4: Calculate shortest path from all NT_nodes to the destination using Dijkstra’s shortest path algorithm5: route_node ← node ∈NT_nodes which satisfies min(dijsktra_path_length(destination,node))6: temp_route_segment ← traversed_path(temp_route_node,route_node)7: route ← append(route,temp_route_segment)8: temp_route_node ← route_node9: end while
10: Return route
2.2 Regularity of urban road network morphology
Thompson et al. [33] used convolutional neural network (CNN) to study precinct-levelimages of maps of 1667 cities around the world. The images (1,000 images for each city,making a total 1.667 million images) provided a high-level abstraction of the urban charac-teristics of interest, primarily road networks and rail transit networks. Through this visualclassification technique, this study was able to capture the diversity of urban design andmorphology in relation to land transport on a global scale. Nine distinct city types wereidentified based on the shape and extent of road and rail infrastructure networks. Mel-bourne, a city that evolved post-motorization, was classified as a ‘Motor’ city characterized
www.josis.org
THE IMPACT OF URBAN ROAD NETWORK MORPHOLOGY ON PEDESTRIAN WAYFINDING BEHAVIOR 209
Figure 1: Comparison of typical heuristic routes.
by highly organized, medium to low density, grid-based road networks. On the other hand,Beijing was classified as ‘Irregular’ based on the more irregular morphology of their roadand rail network that has been influenced by historic planning regimes. Hence we selectedthe two cities, Melbourne and Beijing, for this study as their road network morphology hasbeen established to be contrasting [33].
2.3 Map matching
Map matching is referred to the process of matching observed GPS points (latitude, longi-tude, timestamp) to a sequence of existing road segments. Raw GPS traces are often inac-curate with the accuracy varying from a few metres to sometimes 1–2 kilometers. Theseinaccuracies are due to a range of reasons, including atmospheric influences on GPS sig-nals and the presence of urban canyons and other terrestrial features that are likely to affectGPS signals [34]. Due to the level of noise in the GPS signals simple map matching of theobserved points to their nearest street segment may result in inaccurate results. Hence,geometrical and topological constraints of the road network are necessary to build a pathwith an acceptable level of probability that it was traversed.
JOSIS, Number 21 (2020), pp. 203–228
210 BHOWMICK, WINTER, STEVENSON, VORTISCH
Multiple solutions of the map matching problem under various ground conditions havebeen suggested [7,16,24,38]. Newson and Krumm [26] proposed a map matching algorithmbased on the principles of hidden-Markov models (HMM). They stated that the HMM wasfound to be successful in accounting for measurement noise and road network layout. Toovercome some limitations of the aforementioned approach, Meert and Verbeke [25] pro-posed a new map matching approach by implementing HMMs with non-emitting states.In this study, we have made use of their algorithm in the form of Python codes publiclyshared in GitHub (https://github.com/wannesm/LeuvenMapMatching).
2.4 Route similarity
One important aspect of trajectory data analysis is the similarity measurement of trajecto-ries. Trajectories are composed of “a sequence of time-stamped locations" [17]. Past studieshave made use of Euclidian space and calculated trajectory similarity based on Euclidiandistance [36,39,45]. But Euclidian distance is not an appropriate measurement tool in roadnetwork space where topological constraints exist. Hence, more recent studies have usednetwork distance instead of Euclidian distance for measuring the similarity between a pairof trajectories [11, 18, 22]. Furthermore, there exists noise in GPS data which results inthe points not coinciding with the underlying road network for which map matching wasdone, as mentioned in Section 2.3. Hence, to compare network-based trajectories whichhave been mapped to the underlying road network (to form a sequence of nodes traversed),it is essential to use appropriate similarity metrics based on network constraints and notthe ones based on Euclidian space. Thus, we employ Hausdorff distance, a commonlyused similarity measure used in computational geometry [21] with recent advances usingit for inferring trajectory similarity [11]. In our study, we use the definition of networkHausdorff distance (NHD) between two trajectories, a version of the original Hausdorffdistance modified for applications on networks, as described in [11]. Calculation of NHDhas been based on Equation 1:
NHD (ti, tj) = maxn∈ti
minm∈tj
dist(nti ,mtj
)(1)
where ti and tj are two trajectories, n and m are nodes belonging to ti and tj respectively,and dist indicates Dijkstra’s shortest-path distance between points n and m. Thus, to com-pute NHD between ti and tj , one needs to
• compute Dijkstra’s shortest path with edge length as weights between a node in tiand all the nodes in tj ,
• choose the minimum value among all the computed shortest route lengths,• repeat the process for all other nodes of ti, and• retrieve minimum values for all other nodes of ti.• The maximum value from the set of obtained minimum values gives the NHD.
As has been shown in [11], NHD between ti and tj and tj and ti may not be the same,meaning NHD could result in assymetric distances depending on network configuration.Hence, during computation, NHD has been calculated between the actual (map-matched)route and the simulated heuristic route and not the other way around, for the sake of con-sistency. Also, the relationship between NHD and lengths of two routes is not trivial, in thesense that they may not be directly proportional.
www.josis.org
THE IMPACT OF URBAN ROAD NETWORK MORPHOLOGY ON PEDESTRIAN WAYFINDING BEHAVIOR 211
NHD (in meters) is a measure of how similar (or dissimilar) two routes in a road net-work are. The greater the magnitude of NHD, the more is the dissimilarity. For example,if NHD between the actual route and theoretical route followed by heuristic A is 50 metersand that with heuristic B is 90 meters, it indicates that the similarity between the actual andheuristic A route is more than that with heuristic B route. A positive NHD value showsthat there exists some difference between two routes and the similarity is approximate. Azero NHD value indicates that the two routes are one and the same, only in cases where thestart and end point of two routes are the same (as is in this study). Thus, from the aboveexample, we infer that the actual route follows heuristic A approximately more closely thanheuristic B.
2.5 OpenStreetMap data quality
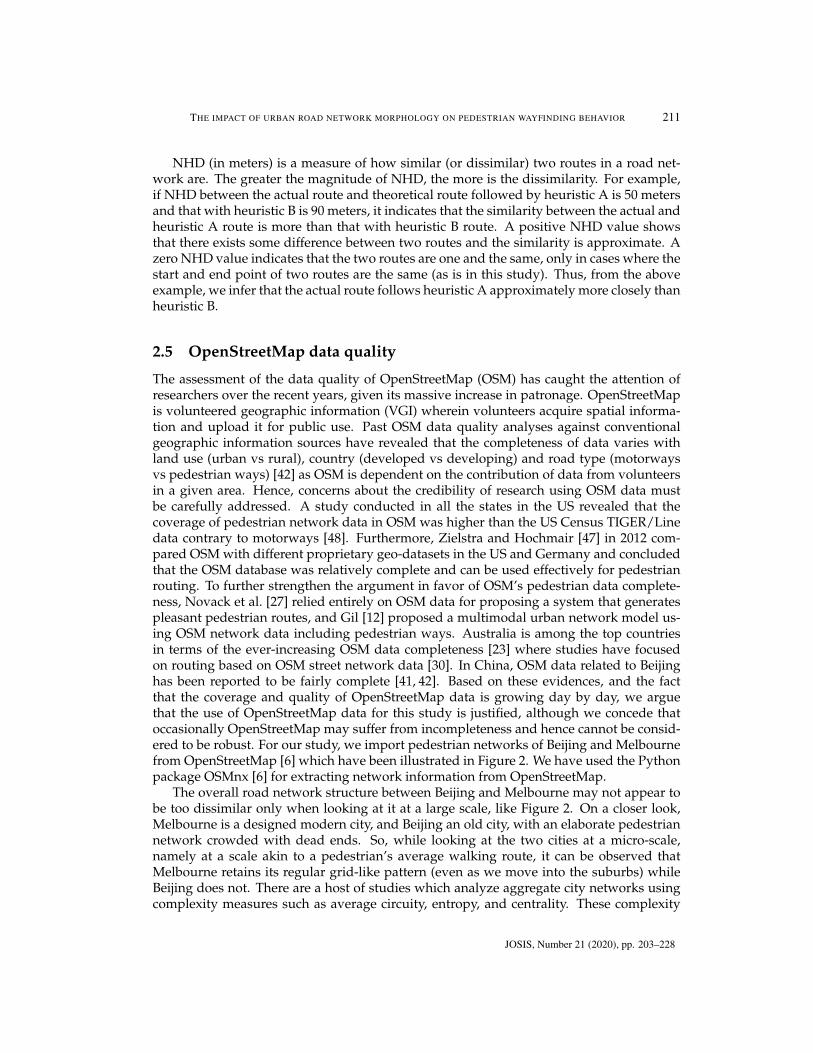
The assessment of the data quality of OpenStreetMap (OSM) has caught the attention ofresearchers over the recent years, given its massive increase in patronage. OpenStreetMapis volunteered geographic information (VGI) wherein volunteers acquire spatial informa-tion and upload it for public use. Past OSM data quality analyses against conventionalgeographic information sources have revealed that the completeness of data varies withland use (urban vs rural), country (developed vs developing) and road type (motorwaysvs pedestrian ways) [42] as OSM is dependent on the contribution of data from volunteersin a given area. Hence, concerns about the credibility of research using OSM data mustbe carefully addressed. A study conducted in all the states in the US revealed that thecoverage of pedestrian network data in OSM was higher than the US Census TIGER/Linedata contrary to motorways [48]. Furthermore, Zielstra and Hochmair [47] in 2012 com-pared OSM with different proprietary geo-datasets in the US and Germany and concludedthat the OSM database was relatively complete and can be used effectively for pedestrianrouting. To further strengthen the argument in favor of OSM’s pedestrian data complete-ness, Novack et al. [27] relied entirely on OSM data for proposing a system that generatespleasant pedestrian routes, and Gil [12] proposed a multimodal urban network model us-ing OSM network data including pedestrian ways. Australia is among the top countriesin terms of the ever-increasing OSM data completeness [23] where studies have focusedon routing based on OSM street network data [30]. In China, OSM data related to Beijinghas been reported to be fairly complete [41, 42]. Based on these evidences, and the factthat the coverage and quality of OpenStreetMap data is growing day by day, we arguethat the use of OpenStreetMap data for this study is justified, although we concede thatoccasionally OpenStreetMap may suffer from incompleteness and hence cannot be consid-ered to be robust. For our study, we import pedestrian networks of Beijing and Melbournefrom OpenStreetMap [6] which have been illustrated in Figure 2. We have used the Pythonpackage OSMnx [6] for extracting network information from OpenStreetMap.
The overall road network structure between Beijing and Melbourne may not appear tobe too dissimilar only when looking at it at a large scale, like Figure 2. On a closer look,Melbourne is a designed modern city, and Beijing an old city, with an elaborate pedestriannetwork crowded with dead ends. So, while looking at the two cities at a micro-scale,namely at a scale akin to a pedestrian’s average walking route, it can be observed thatMelbourne retains its regular grid-like pattern (even as we move into the suburbs) whileBeijing does not. There are a host of studies which analyze aggregate city networks usingcomplexity measures such as average circuity, entropy, and centrality. These complexity
JOSIS, Number 21 (2020), pp. 203–228
212 BHOWMICK, WINTER, STEVENSON, VORTISCH
Figure 2: Pedestrian networks obtained via OpenStreetMap (a) Beijing and (b) Melbourne.Each dimension of the figures represents 20 kilometers on the ground.
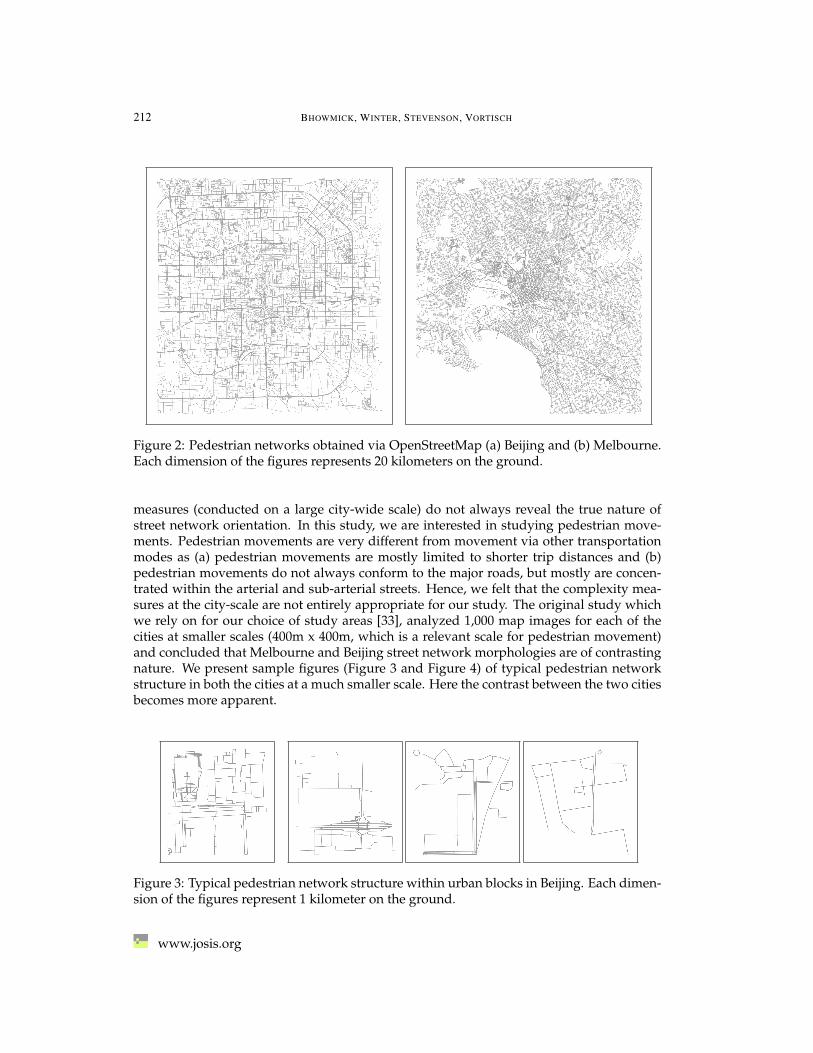
measures (conducted on a large city-wide scale) do not always reveal the true nature ofstreet network orientation. In this study, we are interested in studying pedestrian move-ments. Pedestrian movements are very different from movement via other transportationmodes as (a) pedestrian movements are mostly limited to shorter trip distances and (b)pedestrian movements do not always conform to the major roads, but mostly are concen-trated within the arterial and sub-arterial streets. Hence, we felt that the complexity mea-sures at the city-scale are not entirely appropriate for our study. The original study whichwe rely on for our choice of study areas [33], analyzed 1,000 map images for each of thecities at smaller scales (400m x 400m, which is a relevant scale for pedestrian movement)and concluded that Melbourne and Beijing street network morphologies are of contrastingnature. We present sample figures (Figure 3 and Figure 4) of typical pedestrian networkstructure in both the cities at a much smaller scale. Here the contrast between the two citiesbecomes more apparent.
Figure 3: Typical pedestrian network structure within urban blocks in Beijing. Each dimen-sion of the figures represent 1 kilometer on the ground.
www.josis.org

THE IMPACT OF URBAN ROAD NETWORK MORPHOLOGY ON PEDESTRIAN WAYFINDING BEHAVIOR 213
Figure 4: Typical pedestrian network structure within urban blocks in Melbourne. Eachdimension of the figures represent 1 kilometer on the ground.
3 Data
3.1 Beijing dataset
This GPS trajectory dataset was collected in Microsoft Research Asia’s Geolife project by182 users in a period of over five years (from April 2007 to August 2012) [43, 44]. Theraw dataset contains 17,621 trajectories with a total distance of 1.2 million kilometers anda total duration of more than 50,000 hours. These trajectories were recorded by differentGPS loggers and GPS-phones, and have a variety of sampling rates. 91.5 percent of thetrajectories are logged in a dense representation, e.g. every 1 to 5 seconds or every 5 to 10meters per point. Although this dataset is distributed over 30 cities of China and in somecities located in the USA and Europe, the majority pertains to Beijing, China. A substantialportion of the data was labelled by the users generating the data with the correspondingtravel mode. In our study, we have limited our algorithms to the labelled portion of thislarge dataset (10.4 million GPS points, 9,070 trajectories from 70 users).
3.2 Melbourne dataset
Data for Melbourne was generated from the Victorian Future Mobility Sensing Projectwhich was part of a new Urban Mobility and Intelligent Transportation initiative by theUniversity of Melbourne, in partnership with Department of Economic Development,Jobs, Transport and Resources (DEDJTR), Massachusetts Institute of Technology (MIT), andSingapore-MIT Alliance for Research and Technology (SMART). The project collected per-sonal travel data using a download-able smartphone application developed by SMART.Mode detection techniques were applied on the raw data to infer the transportation mode.The inferred modes were validated from the survey participants by asking them at theend of each day. Survey respondents were typically asked to complete the survey for 14days, including five continuous days [31]. The raw dataset contains 1.2 million GPS pointscontributed by 84 users.
JOSIS, Number 21 (2020), pp. 203–228
214 BHOWMICK, WINTER, STEVENSON, VORTISCH
4 Methodology
4.1 Trip segmentation
In the first step, for each user, raw GPS points having transportation mode label as ‘walk’or equivalent were filtered. Consequently, we obtained a series of GPS data points for eachuser in chronological order. These GPS points needed to be clustered into separate walkingtrips which would then be further analyzed. Thus, in the second step, trip segmentationcriteria were applied to the filtered set of GPS points. A review of existing trip identifi-cation literature indicated that trip segmentation thresholds (also known as ‘dwell time’)are applied under two conditions: GPS signal-available situation and GPS signal-lost sit-uation [14, 15]. It can be observed in [14] that the signal-available dwell time thresholdsare consistently smaller than the signal-lost dwell time thresholds. This dwell time thresh-olds tend to vary with characteristics of local activity and ranges between 45 and 900 sec-onds [32]. Trip Identification and Analysis System (TIAS) concludes ‘confident’ trip endsfor dwell time greater than 300 seconds [2]. For our study, we have selected a threshold of300 seconds for differentiating between consecutive walking trips.
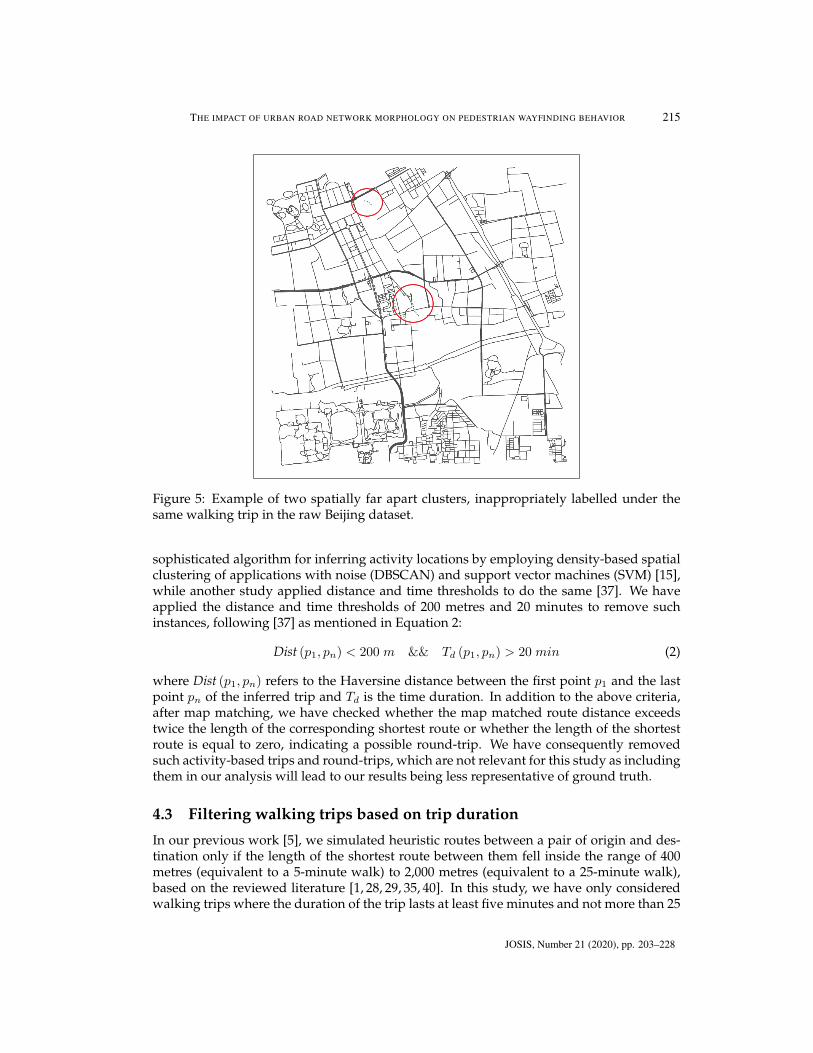
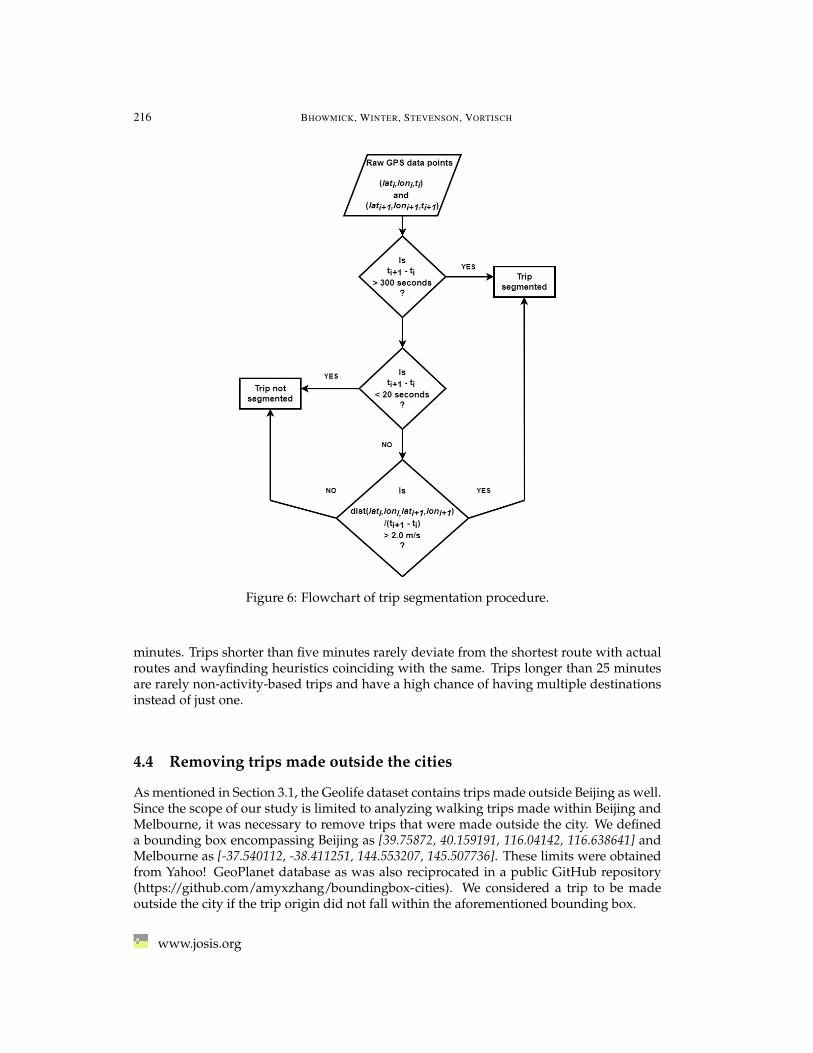
Although the participants in the datasets had labelled their data by stating the dura-tion of travel in certain transportation modes, plotting GPS points clearly indicated un-reasonable spatial gaps between two clusters of points inside the same walking trip. Thisindicated that using only a time-based threshold was not appropriate for trip segmenta-tion due to occasional erroneous labelling of transport mode by the survey participants.For example, there could be a chance that the participant took a motorized mode of trans-port for a very short duration (less than 300 seconds) and instead of differentiating thatnon-walking trip, incorporated it under the encompassing walking trip by mistake. Thisresulted in erroneous map matching, as observed from trials. One such instance from theBeijing dataset is illustrated in Figure 5. But such observations could stem from noisy GPSpoints as well. To remove such potentially erroneous labelling and avoid trip segmenta-tion due to noisy GPS data points (outliers) at the same time, we have supplemented thefirst trip segmentation threshold with an additional threshold. Here, we check whetherthe time difference between two consecutive data points is greater than 20 seconds. If not,then we do not consider trip segmentation and thus try and avoid trip segmentation dueto outliers. Otherwise, we calculate the velocity between the two points by dividing thegreat circle distance by the time gap. If the velocity is unreasonable (greater than 2 meter-s/second) in terms of human walking speeds, the trip is segmented. The flowchart for thismethod has been illustrated in Figure 6. While the aforementioned trip segmentation doesnot guarantee robust results, from our observations on the datasets (with sampling rate lessthan 20 seconds), these thresholds provide satisfactory outcomes.
4.2 Activity locations
Apart from trip segmentation, there is the aspect of identification of activity locations thatreside at the end points of trips [15]. Observation of plots of some trajectories revealedthat their points were clustered in a small geographic area, indicating the occurrence ofan activity, rather than a trip. It was necessary to remove such instances to obtain morerepresentative results, since our study is interested in routes and their characteristics andnot the origins and destinations where activities take place. One study showed the use of a
www.josis.org
THE IMPACT OF URBAN ROAD NETWORK MORPHOLOGY ON PEDESTRIAN WAYFINDING BEHAVIOR 215
Figure 5: Example of two spatially far apart clusters, inappropriately labelled under thesame walking trip in the raw Beijing dataset.
sophisticated algorithm for inferring activity locations by employing density-based spatialclustering of applications with noise (DBSCAN) and support vector machines (SVM) [15],while another study applied distance and time thresholds to do the same [37]. We haveapplied the distance and time thresholds of 200 metres and 20 minutes to remove suchinstances, following [37] as mentioned in Equation 2:
Dist (p1, pn) < 200 m && Td (p1, pn) > 20 min (2)
where Dist (p1, pn) refers to the Haversine distance between the first point p1 and the lastpoint pn of the inferred trip and Td is the time duration. In addition to the above criteria,after map matching, we have checked whether the map matched route distance exceedstwice the length of the corresponding shortest route or whether the length of the shortestroute is equal to zero, indicating a possible round-trip. We have consequently removedsuch activity-based trips and round-trips, which are not relevant for this study as includingthem in our analysis will lead to our results being less representative of ground truth.
4.3 Filtering walking trips based on trip duration
In our previous work [5], we simulated heuristic routes between a pair of origin and des-tination only if the length of the shortest route between them fell inside the range of 400metres (equivalent to a 5-minute walk) to 2,000 metres (equivalent to a 25-minute walk),based on the reviewed literature [1, 28, 29, 35, 40]. In this study, we have only consideredwalking trips where the duration of the trip lasts at least five minutes and not more than 25
JOSIS, Number 21 (2020), pp. 203–228
216 BHOWMICK, WINTER, STEVENSON, VORTISCH
Figure 6: Flowchart of trip segmentation procedure.
minutes. Trips shorter than five minutes rarely deviate from the shortest route with actualroutes and wayfinding heuristics coinciding with the same. Trips longer than 25 minutesare rarely non-activity-based trips and have a high chance of having multiple destinationsinstead of just one.
4.4 Removing trips made outside the cities
As mentioned in Section 3.1, the Geolife dataset contains trips made outside Beijing as well.Since the scope of our study is limited to analyzing walking trips made within Beijing andMelbourne, it was necessary to remove trips that were made outside the city. We defineda bounding box encompassing Beijing as [39.75872, 40.159191, 116.04142, 116.638641] andMelbourne as [-37.540112, -38.411251, 144.553207, 145.507736]. These limits were obtainedfrom Yahoo! GeoPlanet database as was also reciprocated in a public GitHub repository(https://github.com/amyxzhang/boundingbox-cities). We considered a trip to be madeoutside the city if the trip origin did not fall within the aforementioned bounding box.
www.josis.org

THE IMPACT OF URBAN ROAD NETWORK MORPHOLOGY ON PEDESTRIAN WAYFINDING BEHAVIOR 217
4.5 Map matching
As mentioned in Section 2.3, we have made use of a public GitHub repository based on [25]for map matching. For searching for probable consecutive road segments, we have set thesearch radius parameter at 300 metres. A greater value is computationally more expensiveand sometimes results in more inaccurate outcomes, at least in case of walking trajectorieswhere the points are closely spaced as compared to its motorized counterparts. A lesservalue of the search radius often results in impossible map matching, as was experiencedfrom values of 200 and 250 metres. Map matching resulted in the algorithm returning asequence of OSM nodes that were traversed. We have considered the first and last point ofthe obtained sequences as the origin and the destination for each trip, respectively. This wasnecessary to simulate shortest route using Dijkstra’s shortest-path algorithm and heuristicroutes using algorithms mentioned in Section 2.1.
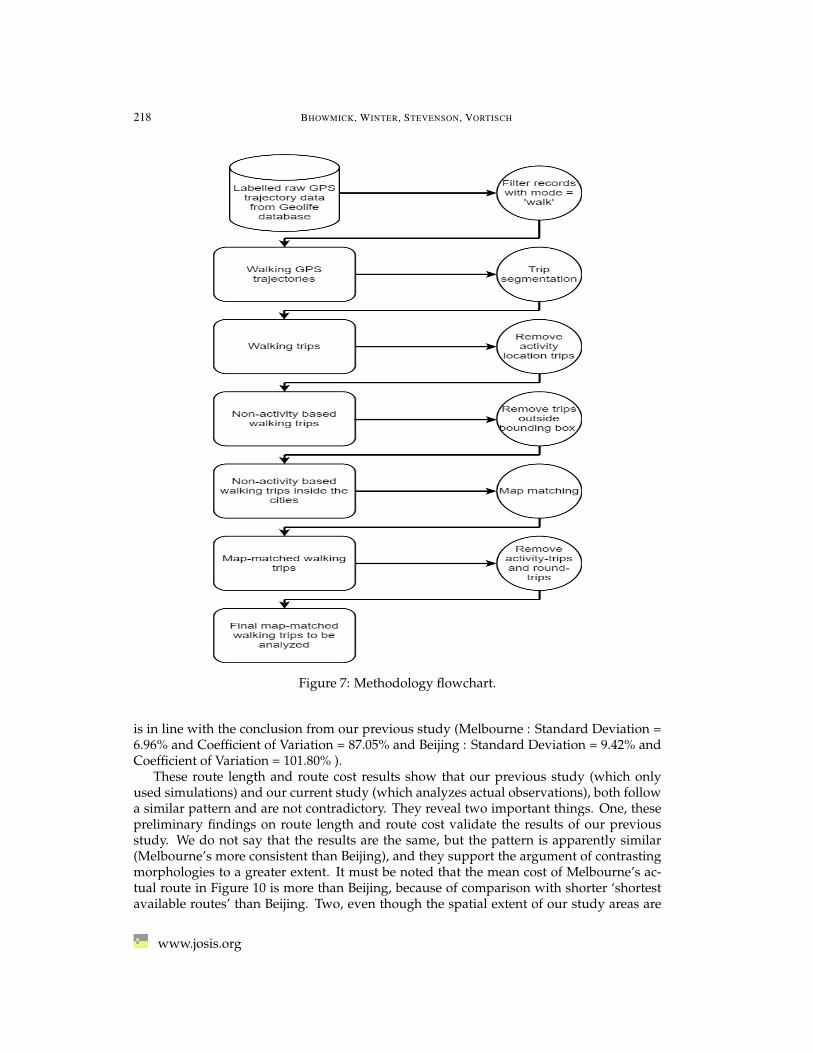
The preprocessing methodology has been illustrated in Figure 7 and the data has beendescribed in Table 1.
Raw labelled dataset Preprocessed datasetCity Labelled GPS
pointsUsers in labelleddataset
Number of walk-ing trips
Number of users
Beijing 10.4 million 70 1458 45Melbourne 1.2 million 84 178 48
Table 1: Data description.
5 Preliminary findings
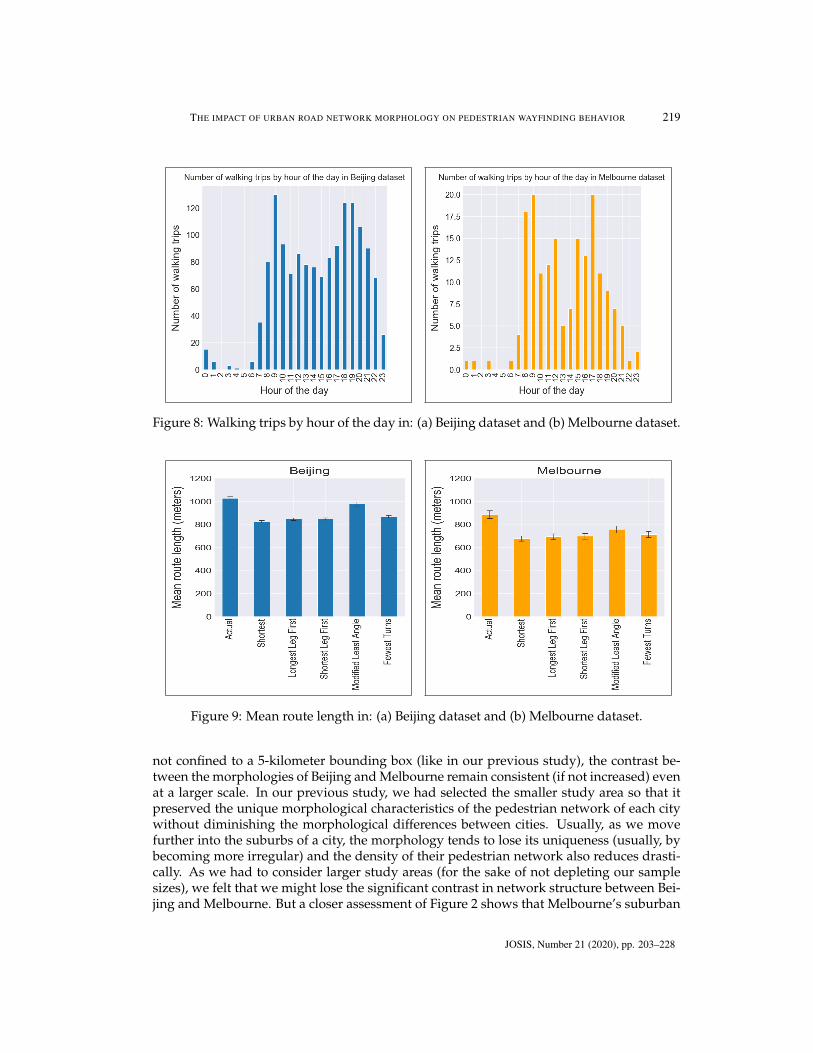
Figure 8, illustrating the temporal distribution of the number of trips, shows two distinctpeaks, one in the morning and one in the evening, in both the datasets. Trips made dur-ing the night and early morning are significantly lower than the other times of the day.Also, the evening peak in Melbourne (5 p.m.) occurs earlier than Beijing (6–7 p.m.), whilethe morning peak is similar (8–9 a.m.) dropping possible hints at the difference in usualworking-hours in both the cities. Furthermore, given the temporal distribution revealed bythe visualizations is typical for the population, we assume some representativeness of ourdatasets.
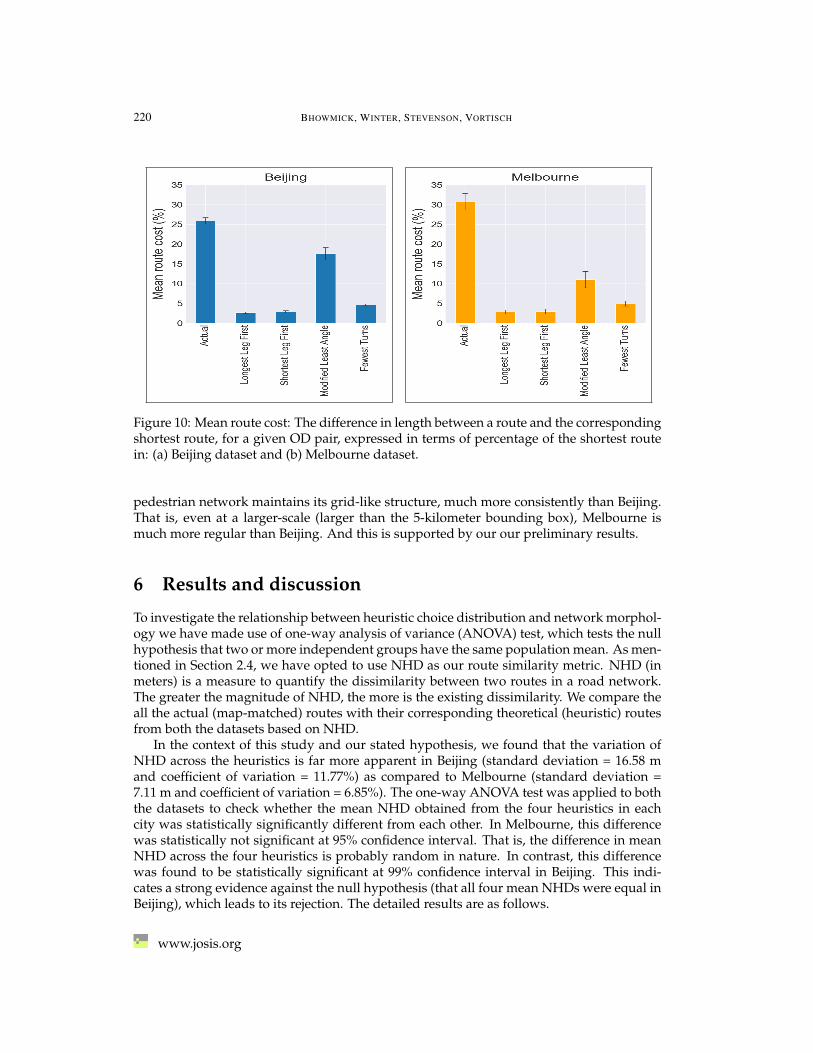
The mean route lengths of the actual (map-matched) route, the shortest possible routeand the routes simulated based on the four wayfinding heuristics have been illustrated inFigure 9. It can be observed that the mean route lengths (both actual and simulated) inMelbourne are consistently lower than those in Beijing, even though we had filtered tripsthat had a duration between 5 and 25 minutes, as mentioned in Section 4.3. This was alsoobserved in our previous study, where actual routes had not been analyzed but rather sim-ulations were undertaken. If anything, the contrast appears even more between Beijingand Melbourne, in comparison to our previous study. The mean route costs (the differencein route length between a given route and the corresponding shortest route expressed in terms of apercentage of the shortest route length) of the actual route and the simulated heuristic routeshave been illustrated in Figure 10. The variation of cost across heuristics is less in Mel-bourne (Standard Deviation = 3.33% and Coefficient of Variation = 61.62%) as compared toBeijing (Standard Deviation = 6.20% and Coefficient of Variation = 90.04%), a pattern that
JOSIS, Number 21 (2020), pp. 203–228
218 BHOWMICK, WINTER, STEVENSON, VORTISCH
Figure 7: Methodology flowchart.
is in line with the conclusion from our previous study (Melbourne : Standard Deviation =6.96% and Coefficient of Variation = 87.05% and Beijing : Standard Deviation = 9.42% andCoefficient of Variation = 101.80% ).
These route length and route cost results show that our previous study (which onlyused simulations) and our current study (which analyzes actual observations), both followa similar pattern and are not contradictory. They reveal two important things. One, thesepreliminary findings on route length and route cost validate the results of our previousstudy. We do not say that the results are the same, but the pattern is apparently similar(Melbourne’s more consistent than Beijing), and they support the argument of contrastingmorphologies to a greater extent. It must be noted that the mean cost of Melbourne’s ac-tual route in Figure 10 is more than Beijing, because of comparison with shorter ‘shortestavailable routes’ than Beijing. Two, even though the spatial extent of our study areas are
www.josis.org
THE IMPACT OF URBAN ROAD NETWORK MORPHOLOGY ON PEDESTRIAN WAYFINDING BEHAVIOR 219
Figure 8: Walking trips by hour of the day in: (a) Beijing dataset and (b) Melbourne dataset.
Figure 9: Mean route length in: (a) Beijing dataset and (b) Melbourne dataset.
not confined to a 5-kilometer bounding box (like in our previous study), the contrast be-tween the morphologies of Beijing and Melbourne remain consistent (if not increased) evenat a larger scale. In our previous study, we had selected the smaller study area so that itpreserved the unique morphological characteristics of the pedestrian network of each citywithout diminishing the morphological differences between cities. Usually, as we movefurther into the suburbs of a city, the morphology tends to lose its uniqueness (usually, bybecoming more irregular) and the density of their pedestrian network also reduces drasti-cally. As we had to consider larger study areas (for the sake of not depleting our samplesizes), we felt that we might lose the significant contrast in network structure between Bei-jing and Melbourne. But a closer assessment of Figure 2 shows that Melbourne’s suburban
JOSIS, Number 21 (2020), pp. 203–228
220 BHOWMICK, WINTER, STEVENSON, VORTISCH
Figure 10: Mean route cost: The difference in length between a route and the correspondingshortest route, for a given OD pair, expressed in terms of percentage of the shortest routein: (a) Beijing dataset and (b) Melbourne dataset.
pedestrian network maintains its grid-like structure, much more consistently than Beijing.That is, even at a larger-scale (larger than the 5-kilometer bounding box), Melbourne ismuch more regular than Beijing. And this is supported by our our preliminary results.
6 Results and discussion
To investigate the relationship between heuristic choice distribution and network morphol-ogy we have made use of one-way analysis of variance (ANOVA) test, which tests the nullhypothesis that two or more independent groups have the same population mean. As men-tioned in Section 2.4, we have opted to use NHD as our route similarity metric. NHD (inmeters) is a measure to quantify the dissimilarity between two routes in a road network.The greater the magnitude of NHD, the more is the existing dissimilarity. We compare theall the actual (map-matched) routes with their corresponding theoretical (heuristic) routesfrom both the datasets based on NHD.
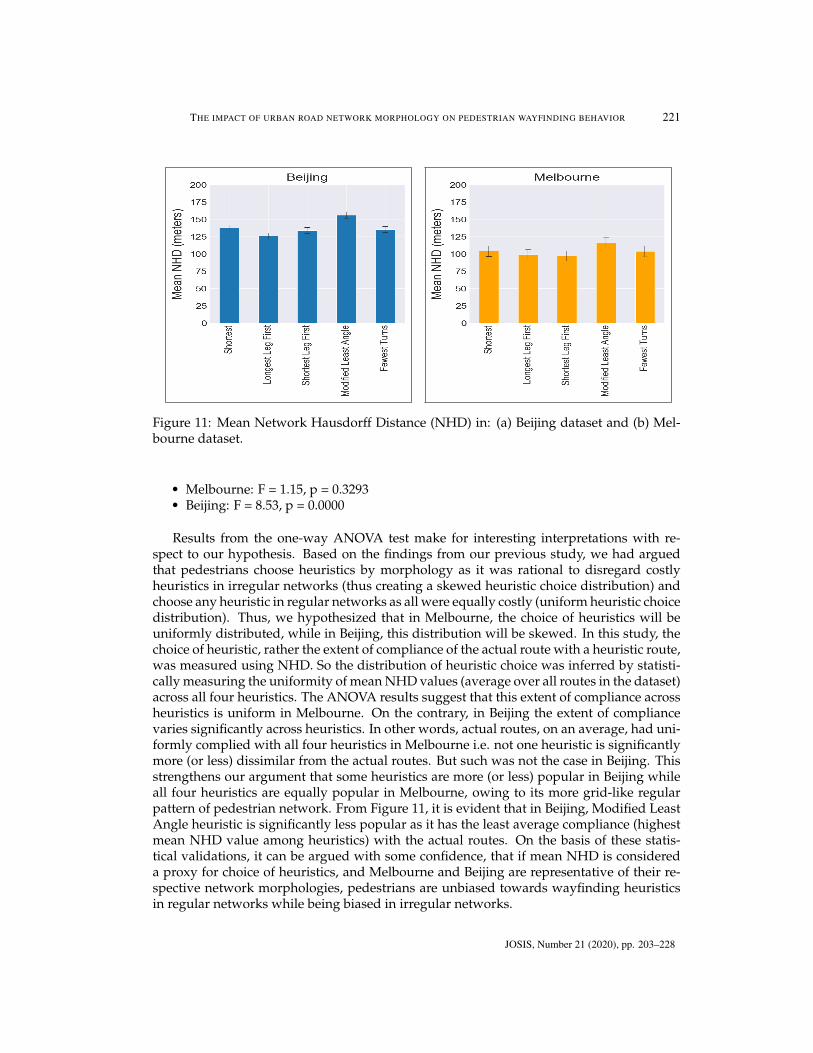
In the context of this study and our stated hypothesis, we found that the variation ofNHD across the heuristics is far more apparent in Beijing (standard deviation = 16.58 mand coefficient of variation = 11.77%) as compared to Melbourne (standard deviation =7.11 m and coefficient of variation = 6.85%). The one-way ANOVA test was applied to boththe datasets to check whether the mean NHD obtained from the four heuristics in eachcity was statistically significantly different from each other. In Melbourne, this differencewas statistically not significant at 95% confidence interval. That is, the difference in meanNHD across the four heuristics is probably random in nature. In contrast, this differencewas found to be statistically significant at 99% confidence interval in Beijing. This indi-cates a strong evidence against the null hypothesis (that all four mean NHDs were equal inBeijing), which leads to its rejection. The detailed results are as follows.
www.josis.org
THE IMPACT OF URBAN ROAD NETWORK MORPHOLOGY ON PEDESTRIAN WAYFINDING BEHAVIOR 221
Figure 11: Mean Network Hausdorff Distance (NHD) in: (a) Beijing dataset and (b) Mel-bourne dataset.
• Melbourne: F = 1.15, p = 0.3293• Beijing: F = 8.53, p = 0.0000
Results from the one-way ANOVA test make for interesting interpretations with re-spect to our hypothesis. Based on the findings from our previous study, we had arguedthat pedestrians choose heuristics by morphology as it was rational to disregard costlyheuristics in irregular networks (thus creating a skewed heuristic choice distribution) andchoose any heuristic in regular networks as all were equally costly (uniform heuristic choicedistribution). Thus, we hypothesized that in Melbourne, the choice of heuristics will beuniformly distributed, while in Beijing, this distribution will be skewed. In this study, thechoice of heuristic, rather the extent of compliance of the actual route with a heuristic route,was measured using NHD. So the distribution of heuristic choice was inferred by statisti-cally measuring the uniformity of mean NHD values (average over all routes in the dataset)across all four heuristics. The ANOVA results suggest that this extent of compliance acrossheuristics is uniform in Melbourne. On the contrary, in Beijing the extent of compliancevaries significantly across heuristics. In other words, actual routes, on an average, had uni-formly complied with all four heuristics in Melbourne i.e. not one heuristic is significantlymore (or less) dissimilar from the actual routes. But such was not the case in Beijing. Thisstrengthens our argument that some heuristics are more (or less) popular in Beijing whileall four heuristics are equally popular in Melbourne, owing to its more grid-like regularpattern of pedestrian network. From Figure 11, it is evident that in Beijing, Modified LeastAngle heuristic is significantly less popular as it has the least average compliance (highestmean NHD value among heuristics) with the actual routes. On the basis of these statis-tical validations, it can be argued with some confidence, that if mean NHD is considereda proxy for choice of heuristics, and Melbourne and Beijing are representative of their re-spective network morphologies, pedestrians are unbiased towards wayfinding heuristicsin regular networks while being biased in irregular networks.
JOSIS, Number 21 (2020), pp. 203–228
222 BHOWMICK, WINTER, STEVENSON, VORTISCH
7 Conclusion
We investigated whether network morphology of an urban pedestrian network has an im-pact on wayfinding heuristic choice distribution. In our previous work, we had shown viasimulation that the variation in the cost of heuristic routes was greater in irregular networksas compared to regular ones. In regular grid-like networks, all heuristics were uniformlycostly and not significantly longer than the shortest available route. On the contrary, inirregular networks, some heuristics were consistently resulting in significantly costlier al-ternatives in comparison to the shortest available routes. Based on this rationale, we hy-pothesized that pedestrian actions on the ground would be in line with these findings. Inother words, we had argued that pedestrians choose heuristics by morphology as it was ra-tional to disregard costly heuristics in irregular networks (thus creating a skewed heuristicchoice distribution) and choose any heuristic in regular networks as all were equally costly(uniform heuristic choice distribution). We chose Beijing and Melbourne as the two citiesfor our study as they were deemed to have contrasting pedestrian network morphologies(as suggested by literature). We also concluded the same via close-up visual observationsof the networks, especially inside the urban and suburban blocks, where Melbourne clearlyhad more regular patterns than Beijing. Our preliminary findings (in terms of route lengthand route cost) suggested the same.
In this paper, we demonstrated the use of raw GPS trajectories from both the cities inconjunction with heuristic route simulation to investigate whether these claims can be aug-mented with actual observations of pedestrian wayfinding behavior. Network HausdorffDistance (NHD) was used as a measure of comparing actual routes with heuristic routesand compute the extent of compliance with our four studied heuristics. Using one-wayANOVA test on NHD values across heuristics, we established statistically that the meanNHD values for all four heuristics were not significantly different in Melbourne, but weresignificantly different in Beijing. This meant that actual routes had uniformly compliedwith all four heuristics in Melbourne but not in Beijing. In other words, heuristic choicedistribution is different between the chosen cities, uniform in Melbourne and skewed inBeijing. This provided sufficient statistical evidence towards proving our hypothesis. Con-sidering Melbourne and Beijing to be representative of regular and irregular network mor-phologies respectively, we generalized our conclusions and argued in favor of our hypoth-esis with requisite statistical evidence. As wayfinding heuristics help generate realisticaggregate movement patterns of people in urban spaces, relevant future studies should beable to make informed decision on the choice distribution of these heuristics (with multiplestrategies under consideration) across the pedestrian population considered for the study,based on network morphology of the urban space studied.
There were certain considerations and assumptions made in this study that need to behighlighted as well. First, we used map matching to infer actual routes from sets of rawtimestamped GPS records. Map matching results in the most probable route, given thefact that GPS data often suffers from positioning errors. We have made use of a sophis-ticated algorithm to overcome these challenges, yet care must be taken while interpretingactual routes. Second, we have employed multiple space-time-based criteria to filter outactivity-based trips, round trips, trips that fall outside the usual walking trip lengths, andtrips where the effect of heuristics will not be pronounced. While one can argue about theappropriateness of the thresholds and their values, our judgments were based on consulta-tion of existing literature and observations of randomly sampled results from our datasets.
www.josis.org
THE IMPACT OF URBAN ROAD NETWORK MORPHOLOGY ON PEDESTRIAN WAYFINDING BEHAVIOR 223
Third, the Melbourne dataset used for the analysis was smaller in comparison to Beijing’s.Although, two datasets with closer sample sizes would have been more desirable, the usualtemporal pattern of pedestrian volume in urban spaces was mirrored precisely by both thedatasets. Also, from our preliminary findings, results from the Melbourne dataset had in-tuitive comparisons with the Beijing data, even though its sample size was considerablyless. Hence, we believe that the findings of our study are not questionable in this regard.
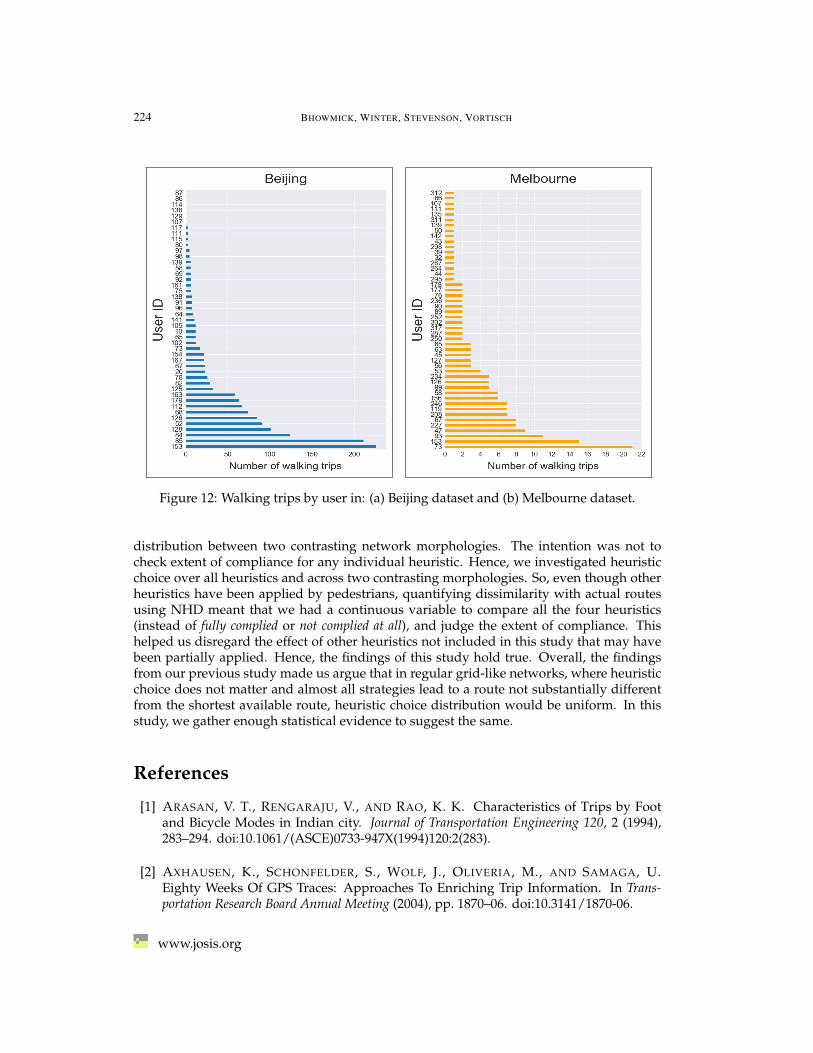
Another important consideration in reference to the datasets is the existence of super-users (users contributing heavily in the datasets). This is evident from looking at Figure 12where clearly some users have contributed more than the rest (users #153 and #86 in Beijingand users #73 and #153 in Melbourne). As they are present in both the datasets, super-users influencing the results and acting as the differentiating factor between the two citiesseems highly unlikely. While user bias can produce misleading results [4], it is importantto note the context of the study, which in this case, is heuristic choice popularity distribu-tion, and not popularity of any specific route or street segment. In relevance to this study,there could be cases where super-users, by recording their weekday walking trips usingthe same route (and thus the same heuristic), influence one heuristic greatly than others.But these super-users have not only shared their weekday walking trips, but also otherrecreational trips with varying heuristics much more than other participants. People donot apply the same heuristics in every situation and they tend to switch depending uponthe environment. From visual assessment of individual heuristic choice distribution, weobserved that these super-users were not disproportionately adhering to any one heuris-tic. Furthermore, it must be kept in mind that we used NHD, a continuous variable, tomeasure route (dis)similarity. In most cases, there is no absolute compliance with idealheuristic routes. We cannot claim that one route follows one heuristic absolutely, and notthe others (no binary outcome) and that was not the goal of our study. Thus, there arepositive NHD values, based on which we supported our hypothesis on choice distributionof heuristics. By using a continuous variable such as NHD and not any binary outcome,the problem of bias of super-users reduces significantly. While there may be argumentsin favor of random undersampling of data to remove user bias, reducing a small datasetfurther would not have necessarily yielded more representative results and reduced thecredibility of statistical claims.
Finally, there are a host of other factors that can influence the wayfinding decisions ofpedestrians. Our study was confined to geometric heuristics, ones that are dependent onpedestrian network structure. But people are not limited solely by these four heuristics,or just geometric heuristics, and urban areas offer much more than just their street orien-tation (in terms of land-use and infrastructure). Pedestrians may select routes with mostlandmarks, maximum weather protection, maximum perceived safety, least crowded andleast pollution. Also, pedestrians may apply multiple heuristics at multiple stages of a sin-gle walking trip, and they are not always strictly adhering to their chosen heuristic. Thisis also reflected in the positive NHD values for the heuristics, meaning that compliancewith ideal heuristic routes is partial in most cases. But these non-geometric heuristics arenot relevant for this study, as our intention was to test heuristic choice distribution acrossnetwork morphologies. For example, when analyzing two urban spaces vastly differentin terms of green space proportion, it will reveal contrasting heuristic choice distributions.Then, of course, the heuristics in consideration have to be relevant to land-use and notnetwork morphology. Yet, one could argue about the relevance of the four heuristics usedin this study. It must be noted that the context of this study was comparing heuristic choice
JOSIS, Number 21 (2020), pp. 203–228
224 BHOWMICK, WINTER, STEVENSON, VORTISCH
Figure 12: Walking trips by user in: (a) Beijing dataset and (b) Melbourne dataset.
distribution between two contrasting network morphologies. The intention was not tocheck extent of compliance for any individual heuristic. Hence, we investigated heuristicchoice over all heuristics and across two contrasting morphologies. So, even though otherheuristics have been applied by pedestrians, quantifying dissimilarity with actual routesusing NHD meant that we had a continuous variable to compare all the four heuristics(instead of fully complied or not complied at all), and judge the extent of compliance. Thishelped us disregard the effect of other heuristics not included in this study that may havebeen partially applied. Hence, the findings of this study hold true. Overall, the findingsfrom our previous study made us argue that in regular grid-like networks, where heuristicchoice does not matter and almost all strategies lead to a route not substantially differentfrom the shortest available route, heuristic choice distribution would be uniform. In thisstudy, we gather enough statistical evidence to suggest the same.
References
[1] ARASAN, V. T., RENGARAJU, V., AND RAO, K. K. Characteristics of Trips by Footand Bicycle Modes in Indian city. Journal of Transportation Engineering 120, 2 (1994),283–294. doi:10.1061/(ASCE)0733-947X(1994)120:2(283).
[2] AXHAUSEN, K., SCHONFELDER, S., WOLF, J., OLIVERIA, M., AND SAMAGA, U.Eighty Weeks Of GPS Traces: Approaches To Enriching Trip Information. In Trans-portation Research Board Annual Meeting (2004), pp. 1870–06. doi:10.3141/1870-06.
www.josis.org
THE IMPACT OF URBAN ROAD NETWORK MORPHOLOGY ON PEDESTRIAN WAYFINDING BEHAVIOR 225
[3] BAILENSON, J. N., SHUM, M. S., AND UTTAL, D. H. The initial segment strat-egy: A heuristic for route selection. Memory & Cognition 28, 2 (2000), 306–318.doi:10.3758/BF03213808.
[4] BERGMAN, C., AND OKSANEN, J. Estimating the Biasing Effect of Behavioural Pat-terns on Mobile Fitness App Data by Density-Based Clustering. In Geospatial Data in aChanging World. Springer, 2016, pp. 199–218. doi:10.1007/978-3-319-33783-8_12.
[5] BHOWMICK, D., WINTER, S., AND STEVENSON, M. Comparing the costs of pedestrianwayfinding heuristics across different urban network morphologies. In GeoComputa-tion 2019 (2019). doi:10.17608/k6.auckland.9846137.v1.
[6] BOEING, G. Osmnx: New methods for acquiring, constructing, analyzing, and visu-alizing complex street networks. Computers, Environment and Urban Systems 65 (2017),126–139. doi:10.1016/j.compenvurbsys.2017.05.004.
[7] BRAKATSOULAS, S., PFOSER, D., SALAS, R., AND WENK, C. On Map-MatchingVehicle Tracking Data. In Proceedings of the 31st international Conference on VeryLarge Databases (2005), VLDB Endowment, Trondheim, Norway, pp. 853–864.doi:10.5555/1083592.1083691.
[8] CHRISTENFELD, N. Choices from identical options. Psychological Science 6, 1 (1995),50–55. doi:10.1111/j.1467-9280.1995.tb00304.x.
[9] DALTON, R. C. The secret is to follow your nose: Route path selection and angularity.Environment and Behavior 35, 1 (2003), 107–131. doi:10.1177/0013916502238867.
[10] DUCKHAM, M., AND KULIK, L. “Simplest” Paths: Automated Route Selection forNavigation. In Spatial Information Theory. Foundations of Geographic Information Science(2003), Springer Berlin Heidelberg, pp. 169–185. doi:10.1007/978-3-540-39923-0_12.
[11] EVANS, M. R., OLIVER, D., SHEKHAR, S., AND HARVEY, F. Fast and exact networktrajectory similarity computation: A case-study on bicycle corridor planning. In Pro-ceedings of the 2nd ACM SIGKDD International Workshop on Urban Computing - UrbComp’13 (2013), ACM, p. 9. doi:10.1145/2505821.2505835.
[12] GIL, J. Building a multimodal urban network model using openstreetmap data forthe analysis of sustainable accessibility. OpenStreetMap in GIScience (2015), 229–251.doi:10.1007/978-3-319-14280-7_12.
[13] GOLLEDGE, R. G. Path selection and route preference in human navigation: Aprogress report. In Spatial Information Theory A Theoretical Basis for GIS (1995), Springer,pp. 207–222. doi:10.1007/3-540-60392-1_14.
[14] GONG, L., MORIKAWA, T., YAMAMOTO, T., AND SATO, H. Deriving Personal TripData from GPS data: A Literature Review on the Existing Methodologies. Procedia-Social and Behavioral Sciences 138 (2014), 557–565. doi:10.1016/j.sbspro.2014.07.239.
[15] GONG, L., SATO, H., YAMAMOTO, T., MIWA, T., AND MORIKAWA, T. Identifica-tion of activity stop locations in GPS trajectories by density-based clustering methodcombined with support vector machines. Journal of Modern Transportation 23, 3 (2015),202–213. doi:10.1007/s40534-015-0079-x.
JOSIS, Number 21 (2020), pp. 203–228
226 BHOWMICK, WINTER, STEVENSON, VORTISCH
[16] GREENFELD, J. S. Matching GPS Observations to Locations on a Digital Map. In81st Annual meeting of the Transportation Research Board (2002), vol. 1, TransportationResearch Board, Washington DC., pp. 164–173.
[17] GUDMUNDSSON, J., LAUBE, P., AND WOLLE, T. Computational Movement Anal-ysis. In Springer Handbook of Geographic Information. Springer, 2011, pp. 423–438.doi:10.1007/978-3-540-72680-7_22.
[18] GÜTING, R. H., DE ALMEIDA, T., AND DING, Z. Modeling and querying movingobjects in networks. The VLDB Journal – The International Journal on Very Large Databases15, 2 (2006), 165–190. doi:10.1007/s00778-005-0152-x.
[19] HOCHMAIR, H. Least angle heuristic: Consequences of errors during navigation. InGIScience (2000), Citeseer, pp. 282–285.
[20] HOCHMAIR, H. H., AND KARLSSON, V. Investigation of Preference Between theLeast-Angle Strategy and the Initial Segment Strategy for Route Selection in UnknownEnvironments. In Spatial Cognition IV. Reasoning, Action, Interaction (2005), SpringerBerlin Heidelberg, pp. 79–97. doi:10.1007/978-3-540-32255-9_5.
[21] HUTTENLOCHER, D. P., AND KEDEM, K. Computing the minimum Hausdorff dis-tance for point sets under translation. In Proceedings of the sixth annual symposium onComputational geometry - SCG ’90 (1990), ACM, pp. 340–349. doi:10.1145/98524.98599.
[22] HWANG, J.-R., KANG, H.-Y., AND LI, K.-J. Spatio-temporal Similarity Analysis Be-tween Trajectories on Road Networks. In International Conference on Conceptual Model-ing (2005), Springer, pp. 280–289. doi:10.1007/11568346_30.
[23] JOKAR ARSANJANI, J., ZIPF, A., MOONEY, P., AND HELBICH, M. An Introduction toOpenStreetMap in Geographic Information Science: Experiences, Research, and Ap-plications. OpenStreetMap in GIScience (2015), 1–15. doi:10.1007/978-3-319-14280-7_1.
[24] LOU, Y., ZHANG, C., ZHENG, Y., XIE, X., WANG, W., AND HUANG, Y. Map-matching for low-sampling-rate GPS trajectories. In 17th ACM SIGSPATIAL Interna-tional Conference on Advances in Geographic Information Systems (2009), ACM, pp. 352–361. doi:10.1145/1653771.1653820.
[25] MEERT, W., AND VERBEKE, M. HMM with non-emitting states for Map Matching. InEuropean Conference on Data Analysis (ECDA), Paderborn, Germany (2018).
[26] NEWSON, P., AND KRUMM, J. Hidden Markov Map Matching Through Noiseand Sparseness. In Proceedings of the 17th ACM SIGSPATIAL International Con-ference on Advances in Geographic Information Systems (2009), ACM, pp. 336–343.doi:10.1145/1653771.1653818.
[27] NOVACK, T., WANG, Z., AND ZIPF, A. A System for Generating Customized Pleas-ant Pedestrian Routes Based on OpenStreetMap Data. Sensors 18, 11 (2018), 3794.doi:10.3390/s18113794.
[28] RAHUL, T., AND VERMA, A. A study of acceptable trip distances using walk-ing and cycling in Bangalore. Journal of Transport Geography 38 (2014), 106–113.doi:10.1016/j.jtrangeo.2014.05.011.
www.josis.org
THE IMPACT OF URBAN ROAD NETWORK MORPHOLOGY ON PEDESTRIAN WAYFINDING BEHAVIOR 227
[29] ROBERTSON, S., AND THOREAU, R. Usability of pedestrian crossings: Further re-sults from fieldwork. In Proceedings of the International Conference on Contemporary Er-gonomics (CE2005), 5-7 April 2005, Hatfield, UK (2005), pp. 608–612.
[30] ROCHA, C. M., KRUGER, E., MCGUIRE, S., AND TENNANT, M. Role of public trans-port in accessibility to emergency dental care in Melbourne, Australia. Australian Jour-nal of Primary Health 21, 2 (2015), 227–232. doi:10.1071/PY13102.
[31] RODDIS, S., WINTER, S., ZHAO, F., AND KUTADINATA, R. Respondent prefer-ences in travel survey design: An initial comparison of narrative, structured andtechnology-based travel survey instruments. Travel Behaviour and Society 16, 7 (2019),1–12. doi:10.1016/j.tbs.2019.03.003.
[32] SCHUESSLER, N., AND AXHAUSEN, K. W. Processing Raw Data from Global Position-ing Systems Without Additional Information. Transportation Research Record: Journal ofthe Transportation Research Board 2105, 1 (2009), 28–36. doi:10.3141/2105-04.
[33] THOMPSON, J., STEVENSON, M., WIJNANDS, J. S., NICE, K. A., ASCHWANDEN,G. D., SILVER, J., NIEUWENHUIJSEN, M., RAYNER, P., SCHOFIELD, R., HARIHARAN,R., ET AL. A global analysis of urban design types and road transport injury: an imageprocessing study. The Lancet Planetary Health 4, 1 (2020), e32–e42. doi:10.1016/S2542-5196(19)30263-3.
[34] VICEK, C., MCLAIN, P., AND MURPHY, M. GPS/dead reckoning for vehi-cle tracking in the “urban canyon” environment. In Proceedings of VNIS’93-Vehicle Navigation and Information Systems Conference (1993), IEEE, pp. 461–34.doi:10.1109/VNIS.1993.585671.
[35] VICTORIA WALKS. Pedestrian access strategy : A strategy to increase walking fortransport in Victoria. Tech. rep., State of Victoria, 2010.
[36] VLACHOS, M., KOLLIOS, G., AND GUNOPULOS, D. Discovering Similar Multidi-mensional Trajectories. In Proceedings 18th International Conference on Data Engineering(2002), IEEE, pp. 673–684. doi:10.1109/ICDE.2002.994784.
[37] WEI, Q., SHE, J., ZHANG, S., AND MA, J. Using Individual GPS Trajecto-ries to Explore Foodscape Exposure: A Case Study in Beijing Metropolitan Area.International Journal of Environmental Research and Public Health 15, 3 (2018), 405.doi:10.3390/ijerph15030405.
[38] WHITE, C. E., BERNSTEIN, D., AND KORNHAUSER, A. L. Some map matching al-gorithms for personal navigation assistants. Transportation Research Part C: EmergingTechnologies 8, 1-6 (2000), 91–108. doi:10.1016/S0968-090X(00)00026-7.
[39] YANAGISAWA, Y., AKAHANI, J.-I., AND SATOH, T. Shape-Based Similarity Query forTrajectory of Mobile Objects. In International Conference on Mobile Data Management(2003), Springer, pp. 63–77. doi:10.1007/3-540-36389-0_5.
[40] YANG, Y., AND DIEZ-ROUX, A. V. Walking Distance by Trip Purpose and Pop-ulation Subgroups. American Journal of Preventive Medicine 43, 1 (2012), 11–19.doi:10.1016/j.amepre.2012.03.015.
JOSIS, Number 21 (2020), pp. 203–228

228 BHOWMICK, WINTER, STEVENSON, VORTISCH
[41] ZHAO, P., JIA, T., QIN, K., SHAN, J., AND JIAO, C. Statistical analysis on the evolutionof OpenStreetMap road networks in Beijing. Physica A: Statistical Mechanics and itsApplications 420 (2015), 59–72. doi:10.1016/j.physa.2014.10.076.
[42] ZHENG, S., AND ZHENG, J. Assessing the Completeness and Positional Accuracyof OpenStreetMap in China. In Thematic Cartography for the Society. Springer, 2014,pp. 171–189. doi:10.1007/978-3-319-08180-9_14.
[43] ZHENG, Y., XIE, X., AND MA, W.-Y. Understanding Mobility Based on GPS Data. InProceedings of the 10th International Conference on Ubiquitous Computing - UbiComp ’08(2008). doi:10.1145/1409635.1409677.
[44] ZHENG, Y., XIE, X., AND MA, W.-Y. Mining Interesting Locations and Travel Se-quences From GPS Trajectories. In Proceedings of the 18th international conference onWorld wide web - WWW ’09 (2009). doi:10.1145/1526709.1526816.
[45] ZHENG, Y., AND ZHOU, X. Computing with Spatial Trajectories. Springer Science &Business Media, 2011. doi:10.1007/978-1-4614-1629-6.
[46] ZHOU, Y., WANG, W., HE, D., AND WANG, Z. A fewest-turn-and-shortest path al-gorithm based on breadth-first search. Geo-spatial Information Science 17, 4 (2014), 201–207. doi:10.1080/10095020.2014.988198.
[47] ZIELSTRA, D., AND HOCHMAIR, H. H. Using Free and Proprietary Data to CompareShortest-Path Lengths for Effective Pedestrian Routing in Street Networks. Transporta-tion Research Record: Journal of the Transportation Research Board 2299, 1 (2012), 41–47.doi:10.3141/2299-05.
[48] ZIELSTRA, D., HOCHMAIR, H. H., AND NEIS, P. Assessing the Effect of Data Importson the Completeness of OpenStreetMap–A United States Case Study. Transactions inGIS 17, 3 (2013), 315–334. doi:10.1111/tgis.12037.
www.josis.org