Embed Size (px)
Citation preview
OECD Economic Studies No . 24. I99511
THE IMPACT OF TRADE AND CAPITAL MOVEMENTS ON LABOUR EVIDENCE ON THE FRENCH CASE
Patrick A . Messerlin
TABLE OF CONTENTS
Introduction ....................................................... 90 The links between trade and total employment ........................... 92
93 97
Trade. terms of trade. wages and skills ................................. 102 Trade and wages ................................................. 102 Terms of trade and relative wages .................................. 106
Foreign direct investment. domestic investment and jobs . . . . . . . . . . . . . . . . . . . 110 Capital flows and gross investment by industry ......................... 1 1 1 Geographical patterns of FDI flows by industry ......................... 113 Capital flows and jobs ............................................. 114
Conclusion ........................................................ 115 Annex: Methodology and sources ..................................... 119 Bibliography . . . . . . . . . . . . . . . . . . . . . . . . . . . . . . . . . . . . . . . . . . . . . . . . . . . . . . . 123
French jobs supported by exports ................................... Jobs and trade: a wider perspective ..................................
The author is Professor of Economics at the lnstitut d'hdes Politiques de Paris . He would like to thank J.P. Martin. B . Larre. N . Vanston and B . Wacquez for very helpful comments on previous drafts .
891
INTRODUCTION
The emergence of high and persistent unemployment in many OECD countries and widening wage inequality in some has generated a lively debate as to the culprits. In particular, much research interest and political debate has focused on the question of the role of trade and foreign direct investment (FDI) flows in accounting for these phenomena. Views are divided on this question. The OECD lobs Study reviewed the available evidence on the impact of trade and FDI on employment and relative wages and concluded that it was very small relative to other influences such as technological progress. But this conclusion has been disputed by other authors.
The debate has been hampered by the fact that most of the empirical work on the topic relates to the case of the United States whereas the labour market phenomena in question are common to many other OECD countries. Consequently, this paper seeks to add another country case study by examining the evidence for France. This example is particularly pertinent given the intense interest that the topic has evoked in France recently.
The past two years have witnessed an increasingly heated debate among French policy-makers about the impact of foreign trade and FDl on French jobs. The debate has been fuelled by reports suggesting that foreign trade and capital out- flows have dramatically reduced the number of jobs available to French workers.' I t has revealed a widespread and strong belief among French policy-makers (and many industrialists as well) that imports from "dissimilar" countries (i.e. countries with wages significantly lower than French wages) are much more costly in terms of numbers of French jobs "lost" than imports from "similar" countries and are lead- ing to a substantial decline in French wages, especially for low-skilled labour.
This paper aims at providing more information about the impact of trade and capital flows on French employment and wages. As underlined by Baldwin (1994). most of the recent empirical literature on these issues tests the hypothesis that growing integration of the world economy is driving a process of worldwide factor price equalisation - hence driving down the relative wage of unskilled labour to skilled labour in OECD countries. This paper does not follow this approach because it seems rather extreme on both theoretical and empirical grounds. First, factor price equalisation requires stringent assumptions if the theorem is to hold. For example, the existence of large labour migration or capital flows reflects the lack of effective factor price equalisation (Woodland, 1982). Second, French labour markets do not exhibit the flexible functioning which is necessary for a rapid process of
The impact oftrode and capitol movements on labour: evidence on the french case
factor price equalisation. Indeed, evidence which would reveal ongoing factor price equalisation at work in France is just not there, as shown below.'
Rather, the paper relies on an approach based on three other lessons sug- gested by pure trade theory. First, trade has a small impact (if any) on the total number of jobs available in an economy: total unemployment is mainly driven by macroeconomic forces and the functioning of labour and product markets itself. Second, changes in the relative prices of traded goods and services have a noticea- ble impact on the relative wages paid to skilled labour by import-competing and export industries - rather than on the relative wage paid t o unskilled labour by both industries. Lastly, capital outflows and inflows are based on very complex motives: as a result, simple relations - such a s a decline of domestic jobs a s a result of capital outflows - are unlikely. These lessons lead to the following conclusion: most of t h e employment and wage developments that the French debate on trade policy focuses on are more related t o domestic causes than to international trade and FDI.
The paper is organised a s follows. The first section examines the relationships between trade and employment in the French case. It starts by looking a t the link between exports and employment: it shows the extent to which during the last 15 years, world demand for French exports ( the derived demand for French labour by foreign consumers) has driven French growth. Then it takes into account imports by estimating the number of French jobs lost because French consumers prefer foreign goods ( the derived "non-demand" for French labour by French consumers). Combining these two derived demands for French labour allows us to make an estimate of the net impact of foreign trade on French employment. As expected by the theory, the estimated net impact of trade on total employment is very small and (for most of the period examined) positive. But the net impact on employment by industry can be substantial in both directions - negative a s well a s positive.
The section on trade, terms of trade, wages and skills (see below) explores the relationships between trade and the composition of employment defined in terms of skill requirements - shifting the focus to the links between trade and relative wages. It provides two main results. First, trade is unlikely to have a straightforward impact on the relative wages of French skilled and unskilled labour because France is not characterised by a high relative endowment of skilled labour (with respect to unskilled labour) when compared with the rest of the world: i f she exports relatively skill-intensive goods and services t o certain countries, s h e exports relatively unskilled labour-intensive goods and services to other countries. The second result is that, by contrast, there are substantial differences in the evolution (from 1984 to 1991) of the relative wages paid to skilled labour: the wages paid to skilled labour by export industries have increased substantially with respect t o the wages paid t o skilled labour by import-competing industries.
Lastly, the section on FDI, domestic investment, and jobs examines French FDI flows and provides three results. First, the shares of French outward and inward FDI flows in domestic gross investments are small for most industrial sectors - and in particular, for those exhibiting net job losses. Second, FDI flows tend to have the same geographical pattern a s trade flows (with a dominant proportion of flows 2.U
OECD Economic Studies No. 24, I99511
towards and from the EC and other OECD countries) and job-contracting industries are no exception to this fact. Third, job-contracting industries do not invest in the rest of the world more than other industries, and they tend to receive as much foreign investment as other sectors.
THE LINKS BETWEEN TRADE AND TOTAL EMPLOYMENT
Trade theory does not predict a strong link between trade openness and the aggregate level of employment even when employment is not fully flexible - for instance, when factors of production are specific to industries (Jones, 1971) or when domestic factors are not flexible because of the existence of minimum wages (Brecher, 1974).3
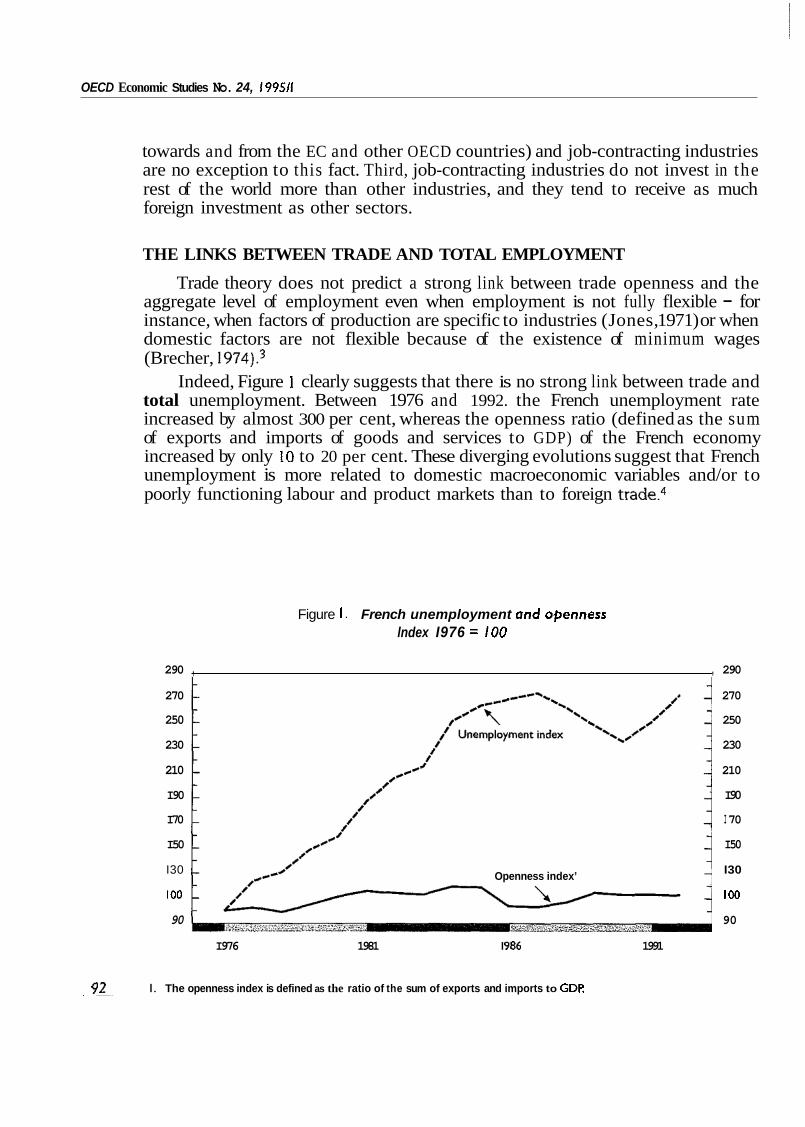
Indeed, Figure 1 clearly suggests that there is no strong link between trade and total unemployment. Between 1976 and 1992. the French unemployment rate increased by almost 300 per cent, whereas the openness ratio (defined as the sum of exports and imports of goods and services to GDP) of the French economy increased by only 10 to 20 per cent. These diverging evolutions suggest that French unemployment is more related to domestic macroeconomic variables and/or to poorly functioning labour and product markets than to foreign trade.4
Figure I. French unemployment and openness lndex I976 = I00
290 , , 290 270 270
250 250
230 230
210 210
I90 I90
I70 I 70
I50 I50
I30 I30
I00 100
90 90
Openness index’
I976 1981 I 986 1991
I. The openness index is defined as the ratio of the sum of exports and imports to GDF
The imbact of trade and cabital movements on labour: evidence on the fiench case
In this context, this section examines more closely two issues: the link between exports and jobs, and the net impact of trade on employment. It analyses not only the links with aggregate employment but it also focuses on individual industries: although foreign trade is not expected to have an impact on total employment, it is expected to have an impact on its composition (the specialisation process requires some reallocation of labour between industries).
The analysis is based on input-output accounting methods. The Annex describes these methods and their limits. However, these methods have a crucial advantage for our purposes: their capacity to link political and economic aspects. Indeed, they provide results easy to interpret in terms of votes (jobs mean votes) and are thus useful for understanding the public debate. And, they offer a close approximation to the results of standard trade theory, as underlined by Krugman and Lawrence ( 1 993).
French jobs supported by exports
In the context of GATT negotiations such as the Uruguay Round, each negotiat- ing country tries hard to improve market access for its exporters. This focus on exports is explained by the fact that policy-makers aim at expanding the derived demand for domestic labour. This first look at the possible links between trade and jobs relies on the method developed by Davis (1992) which is based on the concept of value-added multipliers within an input-output accounting framework [see the Annex for a detailed description of this method). All the figures presented in the section are in constant prices ( I 980 French franc prices) and are based on data including service industries as well as manufacturing and agricultural sectors.
Exports: the engine of French growth
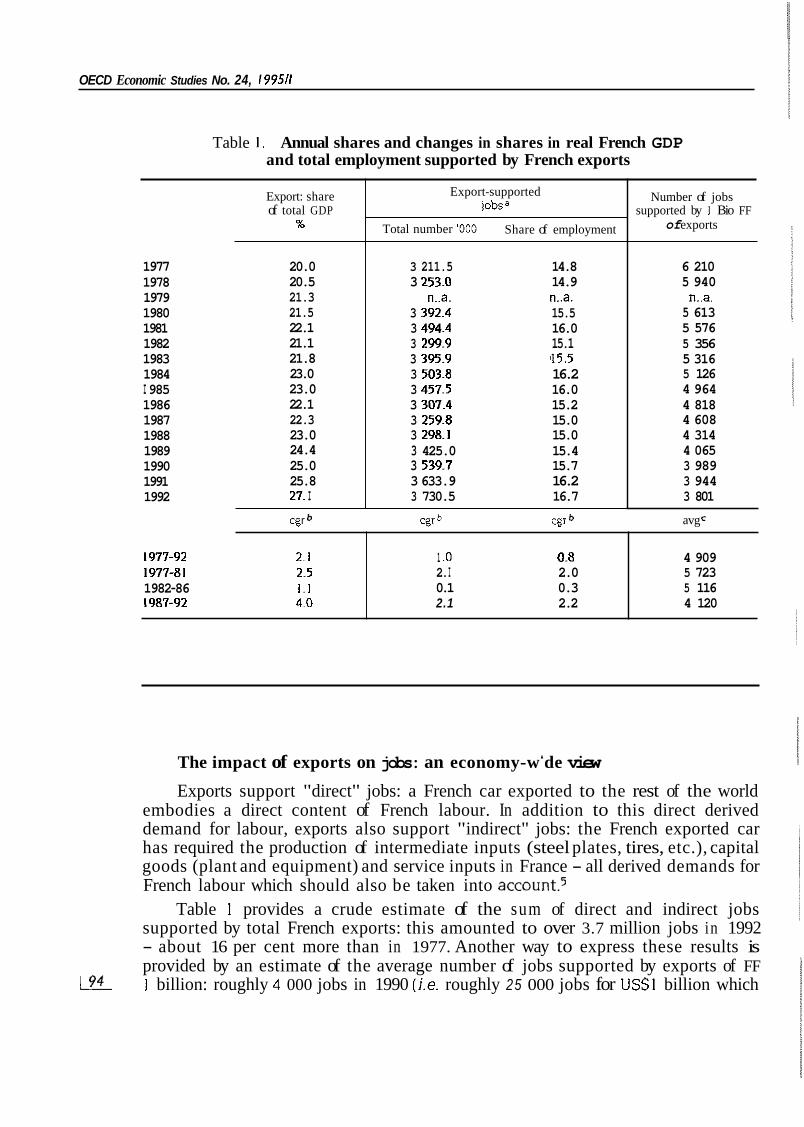
Table 1 shows the important role of exports in French GDP and the degree to which exports of goods and services have been increasingly the engine of growth. It suggests that the prerequisite for an impact of trade on jobs - the existence of large trade flows - is met by the French case.
The share of exports of goods and services in total GDP has increased from 20 to 27 per cent between 1977 and 1992. However, export growth did not evolve smoothly over the period: between 1982 and 1986 it was erratic, whereas it was consistently positive before this period and has been since.
lncreases of exports represented about 37 per cent (on average) of GDP increases in the late 1970s. and almost 75 per cent for the period 1987-92 (exceed- ing 100 per cent in 1991 and 1992). That export growth has represented a very large proportion of (or even surpassed) GDP growth underscores the extent to which exports have been a crucial growth engine in France (a feature shared with the vast majority of other OECD countries).
OECD Economic Studies No. 24, I99511
1977-92 2.1 1977-81 2.5 1982-86 1.1 1987-92 4.0
Table 1 . Annual shares and changes in shares in real French GDP and total employment supported by French exports
1 .o 0.8 4 909 2. I 2.0 5 723 0.1 0.3 5 116 2.1 2.2 4 120
Export: share of total GDP
%
1977 1978 1979 1980 1981 1982 1983 1984 I 985 1986 1987 1988 1989 1990 1991 1992
20.0 20.5 21.3 21.5 22.1 21.1 21.8 23.0 23.0 22.1 22.3 23.0 24.4 25.0 25.8 27. I
cgr b
Export-supported jobsa
Total number '000 Share of employment
3 211.5 14.8 3 253.0 14.9
n..a. n..a. 3 392.4 15.5 3 494.4 16.0 3 299.9 15.1 3 395.9 '15.5 3 503.8 16.2 3 457.5 16.0 3 307.4 15.2 3 259.8 15.0 3 298.1 15.0 3 425.0 15.4 3 539.7 15.7 3 633.9 16.2 3 730.5 16.7
cgr * cgr b
Number of jobs supported by I Bio FF
of exports
6 210 5 940
n..a. 5 613 5 576 5 356 5 316 5 126 4 964 4 818 4 608 4 314 4 065 3 989 3 944 3 801
avg
The impact of exports on jobs: an economy-wide view Exports support "direct" jobs: a French car exported to the rest of the world
embodies a direct content of French labour. In addition to this direct derived demand for labour, exports also support "indirect" jobs: the French exported car has required the production of intermediate inputs (steel plates, tires, etc.), capital goods (plant and equipment) and service inputs in France - all derived demands for French labour which should also be taken into a c c o ~ n t . ~
Table 1 provides a crude estimate of the sum of direct and indirect jobs supported by total French exports: this amounted to over 3.7 million jobs in 1992 - about 16 per cent more than in 1977. Another way to express these results is provided by an estimate of the average number of jobs supported by exports of FF I billion: roughly 4 000 jobs in 1990 (i.e. roughly 25 000 jobs for USSI billion which
The imbact of trade and cabital movements on labour: evidence on the fiench case
is close to the US figure of 19 000 jobs for US$I billion estimated by Davis).6 Table 1 shows that export-supported jobs represent an increasing share of total civilian employment - up from almost 15 per cent in 1977 to almost 17 per cent in 1992.
Export impact on jobs: a sectoral view
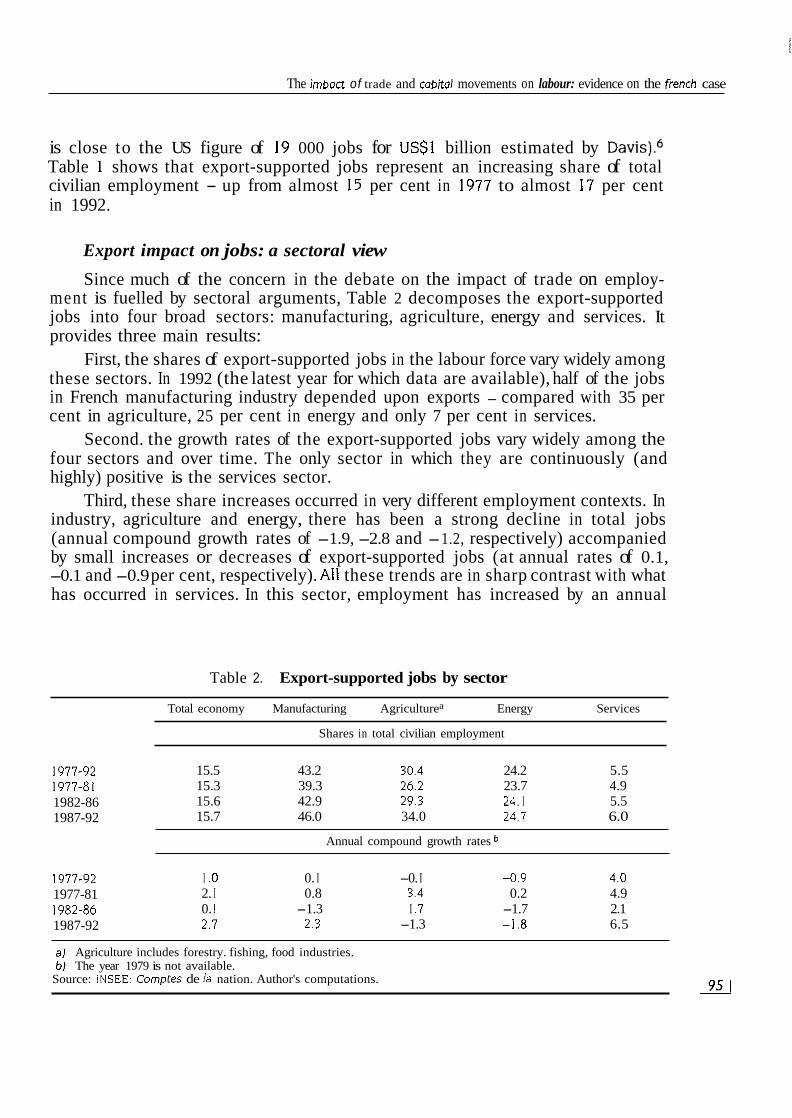
Since much of the concern in the debate on the impact of trade on employ- ment is fuelled by sectoral arguments, Table 2 decomposes the export-supported jobs into four broad sectors: manufacturing, agriculture, energy and services. It provides three main results:
First, the shares of export-supported jobs in the labour force vary widely among these sectors. In 1992 (the latest year for which data are available), half of the jobs in French manufacturing industry depended upon exports - compared with 35 per cent in agriculture, 25 per cent in energy and only 7 per cent in services.
Second. the growth rates of the export-supported jobs vary widely among the four sectors and over time. The only sector in which they are continuously (and highly) positive is the services sector.
Third, these share increases occurred in very different employment contexts. In industry, agriculture and energy, there has been a strong decline in total jobs (annual compound growth rates of -1.9, -2.8 and -1.2, respectively) accompanied by small increases or decreases of export-supported jobs (at annual rates of 0.1, -0.1 and -0.9 per cent, respectively). All these trends are in sharp contrast with what has occurred in services. In this sector, employment has increased by an annual
Table 2. Export-supported jobs by sector
Total economy Manufacturing Agriculturea Energy Services
Shares in total civilian employment
1977-92 1977-81 1982-86 1987-92
15.5 43.2 30.4 24.2 5.5 15.3 39.3 26.2 23.7 4.9 15.6 42.9 29.3 24. I 5.5 15.7 46.0 34.0 24.7 6.0
Annual compound growth rates
1977-92 1977-81 1982-86 1987-92
I .O 0. I -0. I -0.9 4.0 2. I 0.8 3.4 0.2 4.9 0. I -1.3 I .7 -1.7 2.1 2.7 2.3 -1.3 - I .8 6.5
a1 Agriculture includes forestry. fishing, food industries. b) The year 1979 is not available.
Source: INSEE: Cornptes de la nation. Author's computations. 4
OECD Economic Studies No. 24. I99511
French exports to
growth rate of 1.2 per cent whereas export-supported iobs have increased at a 4 per cent rate.
Export-supported jobs
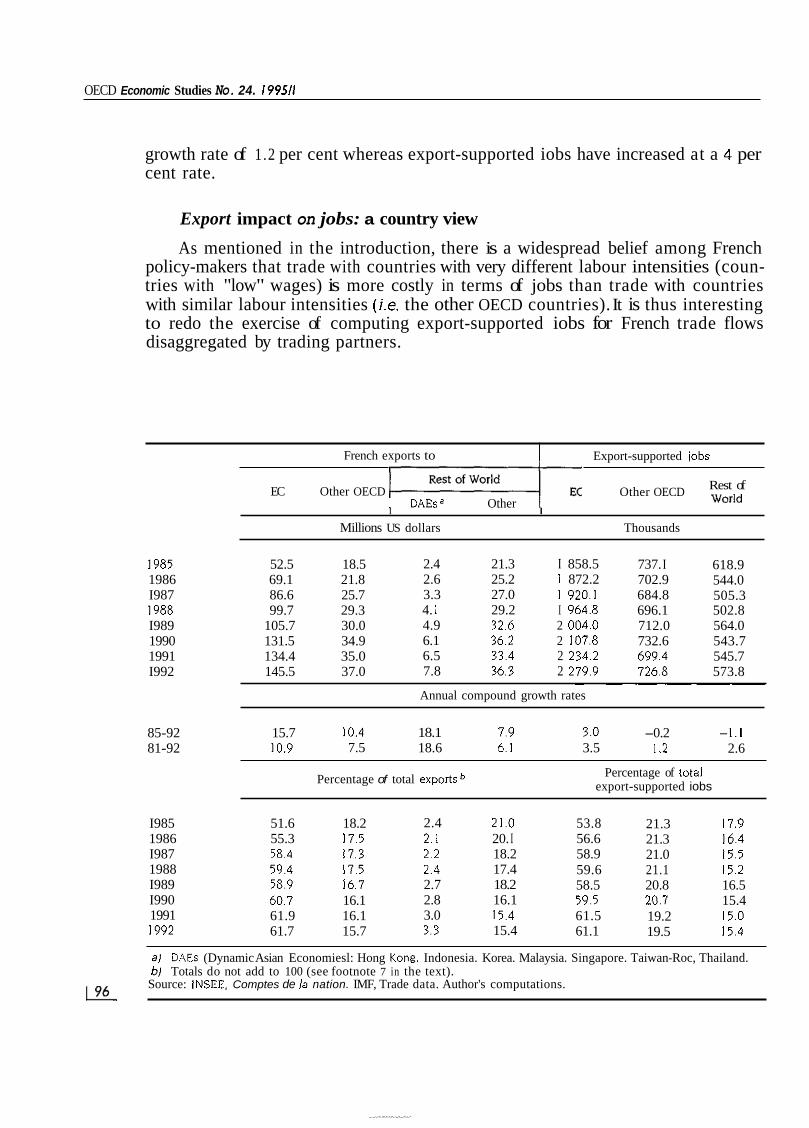
Export impact on jobs: a country view
As mentioned in the introduction, there is a widespread belief among French policy-makers that trade with countries with very different labour intensities (coun- tries with "low" wages) is more costly in terms of jobs than trade with countries with similar labour intensities (i.e. the other OECD countries). It is thus interesting to redo the exercise of computing export-supported iobs for French trade flows disaggregated by trading partners.
Rest of Other OECD world DAEsa Other
EC Other OECD I I
Millions US dollars Thousands
I985 1986 I987 I988 I989 1990 1991 I992
52.5 18.5 69.1 21.8 86.6 25.7 99.7 29.3
105.7 30.0 131.5 34.9 134.4 35.0 145.5 37.0
2.4 21.3 I 858.5 2.6 25.2 1 872.2 3.3 27.0 I 920.1 4. I 29.2 I 964.8 4.9 32.6 2 004.0 6.1 36.2 2 107.8 6.5 33.4 2 234.2 7.8 36.3 2 279.9
737. I 702.9 684.8 696.1 712.0 732.6 699.4 726.8
618.9 544.0 505.3 502.8 564.0 543.7 545.7 573.8
~ ~ ~ ~ _ _ _ _
Annual compound growth rates
85-92 15.7 10.4 18.1 7.9 3.0 -0.2 -1.1 81-92 10.9 7.5 18.6 6. I 3.5 I .2 2.6
Percentage of total exportsb Percentage of tOtal export-supported iobs
I985 1986 I987 1988 I989 I990 1991 I992
51.6 18.2 55.3 17.5 58.4 17.3 59.4 17.5 58.9 16.7 60.7 16.1 61.9 16.1 61.7 15.7
2.4 21.0 2. I 20. I 2.2 18.2 2.4 17.4 2.7 18.2 2.8 16.1 3.0 15.4 3.3 15.4
53.8 56.6 58.9 59.6 58.5 59.5 61.5 61.1
21.3 17.9 21.3 16.4 21.0 15.5 21.1 15.2 20.8 16.5 20.7 15.4 19.2 15.0 19.5 15.4
al DAEs (Dynamic Asian Economiesl: Hong Kong. Indonesia. Korea. Malaysia. Singapore. Taiwan-Roc, Thailand. bl Totals do not add to 100 (see footnote 7 in the text).
Source: INSEE. Comptes de la nation. IMF, Trade data. Author's computations. E
The impact oftrade and capital movements on labour: evidence on the french case
Table 3 presents a breakdown of French trade by trading partners in four major zones in order to address these issue^.^ Two zones involve countries relatively similar to France: the EC countries (with which French trade flows are not hindered by trade barriers) and the other OECD zone. In addition, there is the Rest of World (ROW) zone which can be further divided between the Dynamic Asian Economies (DAEs) and the other ROW countries. During the period 1987-91, export flows shown in Table 3 (they concern all goods and services recorded by the IMF) exhibit very different annual compound growth rates: more than 18 per cent to the DAEs. almost 12 per cent to the EC, 8 per cent to the other OECD countries and less than 6 per cent to the rest of the ROW zone.
Table 3 also presents the computed export-supported jobs. These results do not support the above-mentioned widespread belief, but they match well the results expected from standard economic analysis. In particular, French export-supported jobs for all goods and services have increased at a higher rate with the ROW zone than with the other OECD zone. This evolution may reflect ongoing trade liberalisa- tion as well as domestic growth differentials: during the late 1980s. the ROW zone experienced substantial unilateral trade liberalisations at the level of individual countries, such as Mexico, or at the level of regions, such as in Pacific Asia.
lobs and trade: a wider perspective In sharp contrast to the above approach which makes sense only in the context
of trade negotiations, economic theory shows that gains from trade flow from imports: French consumers prefer foreign goods and services because they are less expensive than French corresponding items or because they are better designed to suit their tastes than French goods and services. As a result of the choices of French consumers, there is less demand for French labour. Combining these two forces - the foreign derived demand for French labour and the French derived “non- demand” for French labour - allows us to estimate the net impact of trade on French jobs.
French trade and net job creation According to standard trade theory, the economic impact of foreign trade is on
real incomes, not on total employment. However, since trade is closely related to growth opportunities existing in the entire world as well as in the country under consideration, one should not be surprised if trade has an impact on total employment.
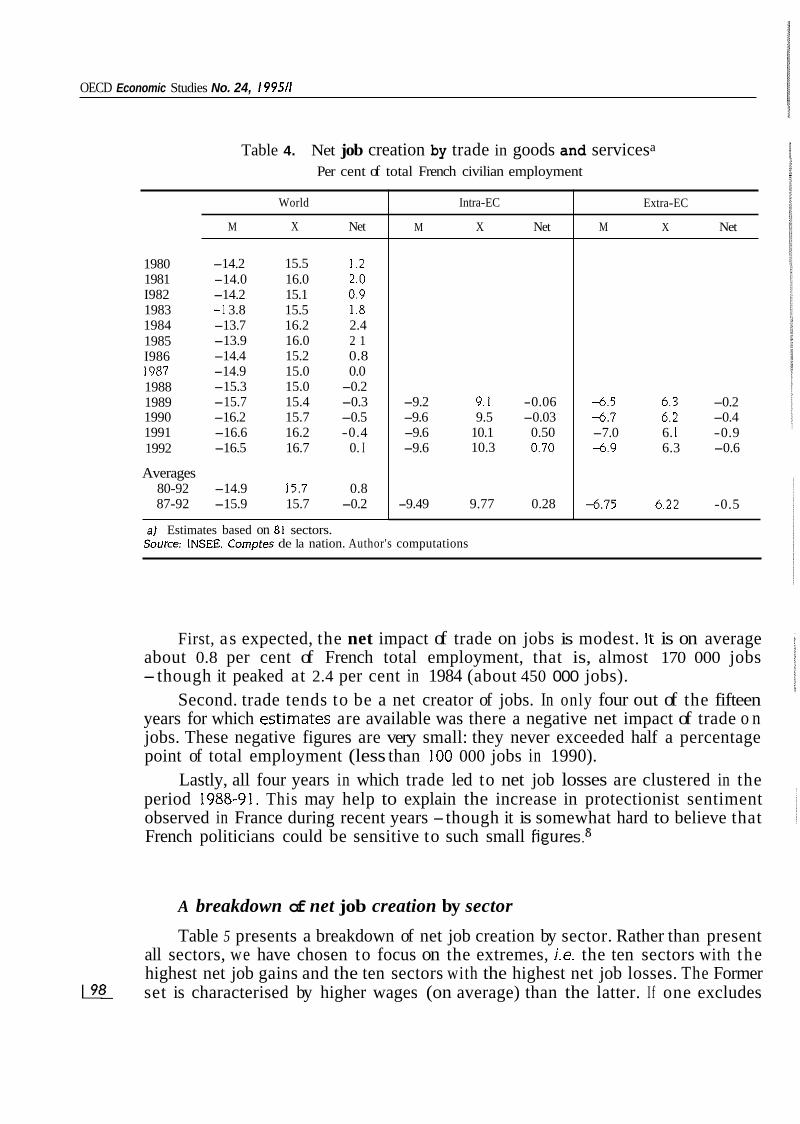
Table 4 allows us to quantify this impact in the case of France. It gives the number of jobs (as a percentage of total employment) “created” by exports and the number of jobs “lost” by imports as well as the net number of jobs. These estimates are derived by using an accounting method (see Annex). It leads to three observations. 971
OECD Economic Studies No. 24, 199511
Table 4. Net job creation by trade in goods and servicesa
Per cent of total French civilian employment
World
M X Net
1980 1981 I982 1983 1984 1985 I986 I987 1988 1989 1990 1991 1992
-14.2 15.5 1.2 -14.0 16.0 2.0 -14.2 15.1 0.9 -I 3.8 15.5 I .8 -13.7 16.2 2.4 -13.9 16.0 2 1 -14.4 15.2 0.8 -14.9 15.0 0.0 -15.3 15.0 -0.2 -15.7 15.4 -0.3 -16.2 15.7 -0.5 -16.6 16.2 -0.4 -16.5 16.7 0. I
Averages 80-92 -14.9 15.7 0.8 87-92 -15.9 15.7 -0.2
a1 Estimates based on 81 sectors.
Intra-EC
M X Net
-9.2 9.1 -0.06 -9.6 9.5 -0.03 -9.6 10.1 0.50 -9.6 10.3 0.70
-9.49 9.77 0.28
Extra-EC
M X Net
4 . 5 6.3 -0.2 4 . 7 6.2 -0.4 -7.0 6. I -0.9 4 . 9 6.3 -0.6
4 . 7 5 4.22 -0.5
Source: INSEE. Comptes de la nation. Author's computations
First, as expected, the net impact of trade on jobs is modest. It is on average about 0.8 per cent of French total employment, that is, almost 170 000 jobs -though it peaked at 2.4 per cent in 1984 (about 450 000 jobs).
Second. trade tends to be a net creator of jobs. In only four out of the fifteen years for which estjmates are available was there a negative net impact of trade o n jobs. These negative figures are very small: they never exceeded half a percentage point of total employment (less than 100 000 jobs in 1990).
Lastly, all four years in which trade led to net job losses are clustered in the period 1988-91. This may help to explain the increase in protectionist sentiment observed in France during recent years -though it is somewhat hard to believe that French politicians could be sensitive to such small figures.8
A breakdown of net job creation by sector
Table 5 presents a breakdown of net job creation by sector. Rather than present all sectors, we have chosen to focus on the extremes, i.e. the ten sectors with the highest net job gains and the ten sectors with the highest net job losses. The Former set is characterised by higher wages (on average) than the latter. I f one excludes K%
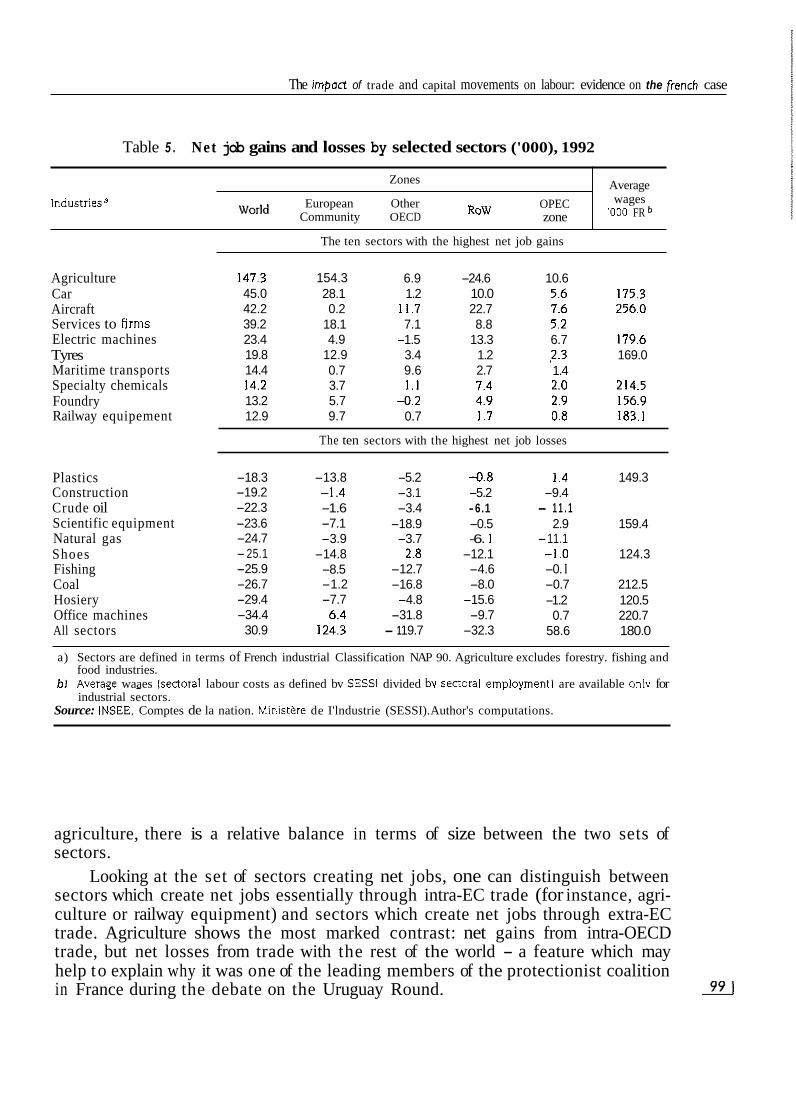
The impact of trade and capital movements on labour: evidence on the french case
Table 5 . Net job gains and losses by selected sectors ('000), 1992
Average wages '000 FR
Zones
Industriesa European Other World Community OECD
OPEC zone
The ten sectors with the highest net job gains
ROW
Agriculture Car Aircraft Services to firms Electric machines Tyres Maritime transports Specialty chemicals Foundry Railway equipement
147.3 154.3 6.9 -24.6 10.6 45.0 28.1 1.2 10.0 5.6 175.3 42.2 0.2 11.7 22.7 7.6 256.0 39.2 18.1 7.1 8.8 5.2 23.4 4.9 -1.5 13.3 6.7 179.6 19.8 12.9 3.4 1.2 2.3 169.0 14.4 0.7 9.6 2.7 1.4 14.2 3.7 1.1 7.4 2.0 214.5 13.2 5.7 -0.2 4.9 2.9 156.9 12.9 9.7 0.7 I .7 0.8 183.1
The ten sectors with the highest net job losses
Plastics Construction Crude oil Scientific equipment Natural gas Shoes Fishing Coal Hosiery Office machines All sectors
-18.3 -19.2 -22.3 -23.6 -24.7 -25.1 -25.9 -26.7 -29.4 -34.4
30.9
-13.8 - I .4 -1.6 -7.1 -3.9 -14.8 -8.5 -1.2 -7.7
6.4 124.3
-5.2 -0.8 1.4 149.3 -3.1 -5.2 -9.4 -3.4 -6.1 - 1 1 . 1 -18.9 -0.5 2.9 159.4 -3.7 -6. I -11.1
2.8 -12.1 -1.0 124.3 -12.7 -4.6 -0. I -16.8 -8.0 -0.7 212.5 -4.8 -15.6 -1.2 120.5 -31.8 -9.7 0.7 220.7 - 1 19.7 -32.3 58.6 180.0
a) Sectors are defined in terms of French industrial Classification NAP 90. Agriculture excludes forestry. fishing and food industries.
bJ Average waaes lsectoral labour costs as defined bv SESSI divided bv sectoral emdovrnentl are available onlv for - . . . . industrial sectors.
Source: INSEE. Comptes de la nation. Ministere de I'lndustrie (SESSI). Author's computations.
agriculture, there is a relative balance in terms of size between the two sets of sectors.
Looking at the set of sectors creating net jobs, one can distinguish between sectors which create net jobs essentially through intra-EC trade (for instance, agri- culture or railway equipment) and sectors which create net jobs through extra-EC trade. Agriculture shows the most marked contrast: net gains from intra-OECD trade, but net losses from trade with the rest of the world - a feature which may help to explain why it was one of the leading members of the protectionist coalition in France during the debate on the Uruguay Round. m
OECD Economic Studies No. 24, I99511
Sectors with net lob losses can be distinguished by two criteria. A few of them are natural-resources based, such as coal, fishing and natural gas, with heavy losses arising from extra-EC trade. By contrast, traditional industries in difficulties (hosiery, shoes) are characterised by high losses arising from both intra-EC trade and non-OECD trade.
A breakdown of net job creation b y trading zone In addition to examining net job gains and losses by sector, it is also instruc-
tive to examine the breakdown of net gains and losses by trading partners. Table 4 shows a different impact of intra-EC trade and extra-EC trade on French jobs. Net job losses seem to be more associated with extra-EC trade and net job gains with intra-EC trade for the period 1989-92 (the only years for which French National Accounts provide consistent trade data for the world and for the EC). This observation requires a more thorough examination.
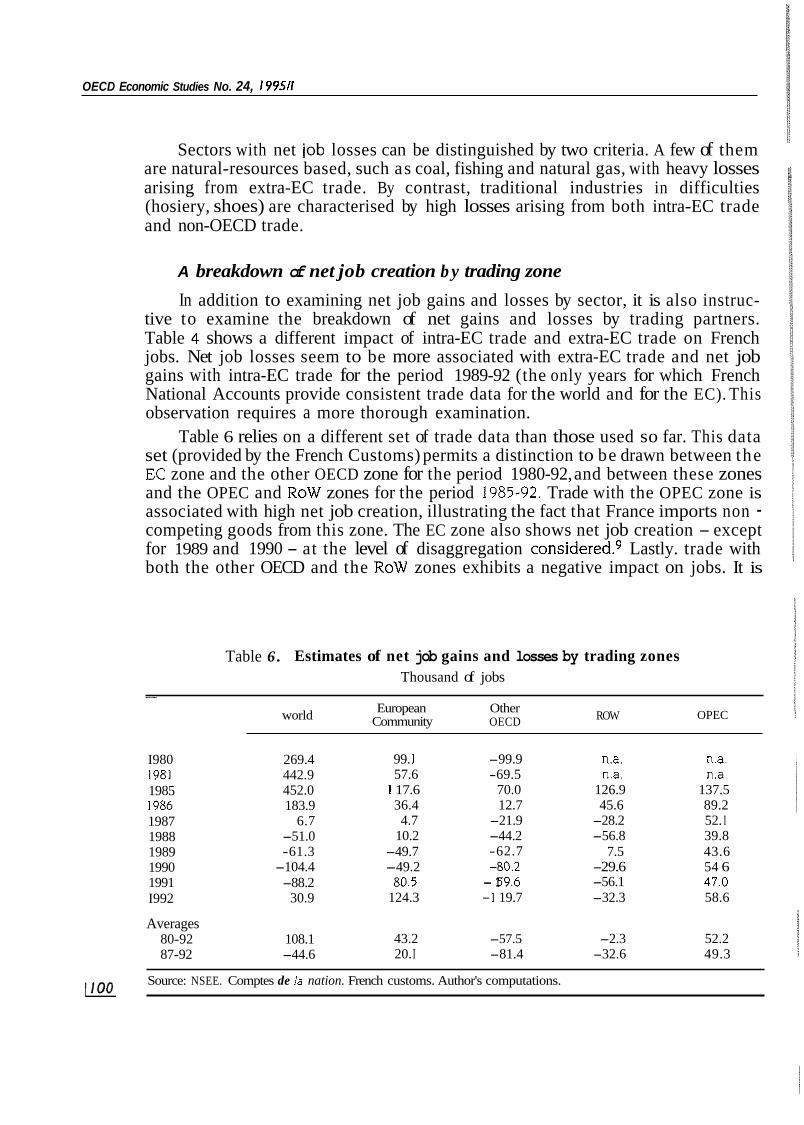
Table 6 relies on a different set of trade data than those used so far. This data set (provided by the French Customs) permits a distinction to be drawn between the EC zone and the other OECD zone for the period 1980-92, and between these zones and the OPEC and ROW zones for the period 1985-92. Trade with the OPEC zone is associated with high net job creation, illustrating the fact that France imports non - competing goods from this zone. The EC zone also shows net job creation - except for 1989 and 1990 - at the level of disaggregation c~ns ide red .~ Lastly. trade with both the other OECD and the ROW zones exhibits a negative impact on jobs. It is
Table 6 . Estimates of net job gains and losses by trading zones Thousand of jobs
~ ~
European Other Community OECD world ROW OPEC
I980 1981 1985 I986 1987 1988 1989 1990 1991 I992
Averages 80-92 87-92
269.4 442.9 452.0 183.9
6.7 -51.0 -61.3
-104.4 -88.2
30.9
108.1 -44.6
99. I 57.6
I 17.6 36.4 4.7
10.2 -49.7 -49.2
80.5 124.3
43.2 20. I
-99.9 -69.5
70.0 12.7
-21.9 -44.2 -62.7 -80.2 - 1 59.6 - I 19.7
-57.5 -81.4
n.a. n.a. n.a. n.a.
126.9 137.5 45.6 89.2 -28.2 52. I -56.8 39.8
7.5 43.6 -29.6 54 6 -56.1 47.0 -32.3 58.6
-2.3 52.2 -32.6 49.3
Source: NSEE. Comptes de la nation. French customs. Author's computations. 1100
The impact of trode and capital movements on labour: evidence on the french case
noteworthy that trade with the ROW zone has a less strong impact in terms of net job losses for a given amount of trade than does trade with the other OECD zone - a fact that does not match with current French preconceptions.
Comparison with other studies Before turning to the section on trade, terms of trade, wages and skills, it is
useful to compare the results of this section with the main results provided by the few available papers which have examined the impact of trade on French labour. Vimont (1993). who used a methodology similar to our approach (at a less disaggre- gated industrial classification), ended up with an estimate of net job creation of 106 000 jobs in 1991, compared with our estimate of a net job destruction of 88 000 jobs. However, this discrepancy can be easily explained by the treatment of the tourism sector: Vimont estimated net job gains from tourism at about 274 000 jobs whereas we were obliged to ignore the trade aspects of this industry because they were not included in the data set provided by the French National Accounts.
Two papers by Mathieu and Sterdyniak (1994) and by the Direction de la Prhision (1994) lead to results more radically different from our estimates: they suggest net job losses, ranging from 190 000 to 330 000, related to trade with developing countries alone (our corresponding result is 56 000 net job losses for 1991). This difference stems from the fact that both papers assume that one franc of imports from developing countries is equivalent to more than one franc of domestic production in the sense that one franc of imports represents, say, two T-shirts, whereas one franc of domestic production represents only one T-shirt. As a result, both papers assume that one franc of imports should eliminate more than one franc of domestic production: using data on imports and domestic production of shoes, both papers state that one thousand francs of imports (say, two pairs of shoes) should eliminate two thousand francs of domestic production (which correspond to the same quantity of two pairs of shoes).
Even if one accepts this assumption about the substitution of imported to domestic shoes and the ratio of two to one (see the Annex for a discussion about this ratio), the results offered by these two studies are subject to the following remarks. These authors have estimated domestic prices from export unit values and import prices from import uni t values. These estimates are likely to be biased towards overestimates in the case of domestic prices and underestimates in the case of import prices. The second bias is the most severe: products like clothing, shoes and electronics are subject to quotas, and quota premiums have been ignored in these computations (in other words, import unit values are likely to be depressed by the expected quota premium). Small changes in these biases could change the final results radically. For instance, if export unit values are 10 per cent higher than domestic prices, and if import unit values are 30 per cent lower than import-competing prices (a plausible premium for quotas), the price differential would be only 1.5 instead of 2.1 which is the differential adopted by these two 1011
OECD Economic Studies No. 24, I99511
studies. With such a lower price differential, their upper-bound estimate of net job losses would decrease from 330 000 to 107 000 jobs (close to our estimate).
TRADE, TERMS OF TRADE, WAGES AND SKILLS The previous section focuses on quantity relationships - namely the impact of
trade flows on (aggregate and sectoral) levels of employment. Such an approach treats jobs with different levels of skills as similar and ignores the role of relative prices of goods and services (the terms of trade) on factor rewards. As a result, it cannot address the other crucial issue raised in the debate about the Uruguay Round: does French trade (in particular, trade with countries with low wages) tend to depress French wages? This general question leads to two very different approaches.
The first approach assumes that labour is very mobile between industries. In such a context, the impact of trade on French wages is mostly determined by the level of skills and is independent of the sectors involved. If France is relatively abundant in skilled labour (and if the terms of trade of skill-intensive goods increase), the wages paid to French unskilled labour should decline. The evidence provided below does not support the existence of this relation.
This negative result suggests the adoption of an alternative approach which recognises that labour is relatively immobile between sectors, especially in the short run. More precisely, skilled labour is assumed to be ”specific” to an industry: it is less mobile between industries than unskilled labour. In this context, the specific-factor model of trade predicts that changes in the terms of trade will have a more noticeable impact on the relative wages paid to skilled labour by export sectors and by import-competing industries respectively than on the relative wages of unskilled labour (see Annex). Evidence provided below tends to support this result, although it also shows that French relative wages are heavily influenced by specific features of the domestic labour market - in particular, minimum wages and early retirement schemes.
Trade and wages
is based on two different interpretations about the nature of French trade. The assertion that trade depresses the average wage of unskilled French labour
Trade patterns and average wages
The first (and most frequent) interpretation is that trade with low-wage coun- tries has a depressing effect on the French average wage (first because workers in these countries allegedly compete directly with French unskilled workers, then because competition in terms of wages allegedly spreads to skilled labour). This interpretation does not generally rely upon the traditional “factor price equalisa- tion” argument - and indeed it does not need to do so (Krueger, 1977).
The impoct of trade and copitol movements on lobour: evidence on the french case
However, such a direct relation between trade patterns and the average French wage has to take into account the fact that France trades not only with countries with lower wages, but also with countries with higher wages. I f trade flows have any impact on the average wage, there is no reason to exclude France’s trading partners with higher wages from the analysis.
As suggested by Krugman and Lawrence (1993), one simple figure can capture the whole argument: it is the average wage of France‘s trading partners weighted by French imports from all her partners. Using the estimates of iabour costs provided by the US Bureau of Labor Statistics suggests that the weighted wage faced by France is close to one. This result flows from the fact that almost half of French trade is with countries with higher wages - the other half being with countries with lower wages (and the lower the trading partners’ wages are, the less important are trade flows between France and the trading partners in question).
Terms of trade and relative wages
The second interpretation states that French trade reduces the relative wages paid to French unskilled and skilled labour, drawing on the traditional “factor price equalisation” approach. This interpretation rests on two crucial hypotheses: i) France should be relatively well endowed with skilled labour (relatively to unskilled labour) vis-2-vis ROW (as a whole); and ii) the relative price of skill- intensive goods should have increased.
The first hypothesis cannot be taken for granted. France is both relatively well endowed with skilled labour vis-2-vis certain countries and relatively rich in unskilled labour vis-2-vis other trading partners.1°
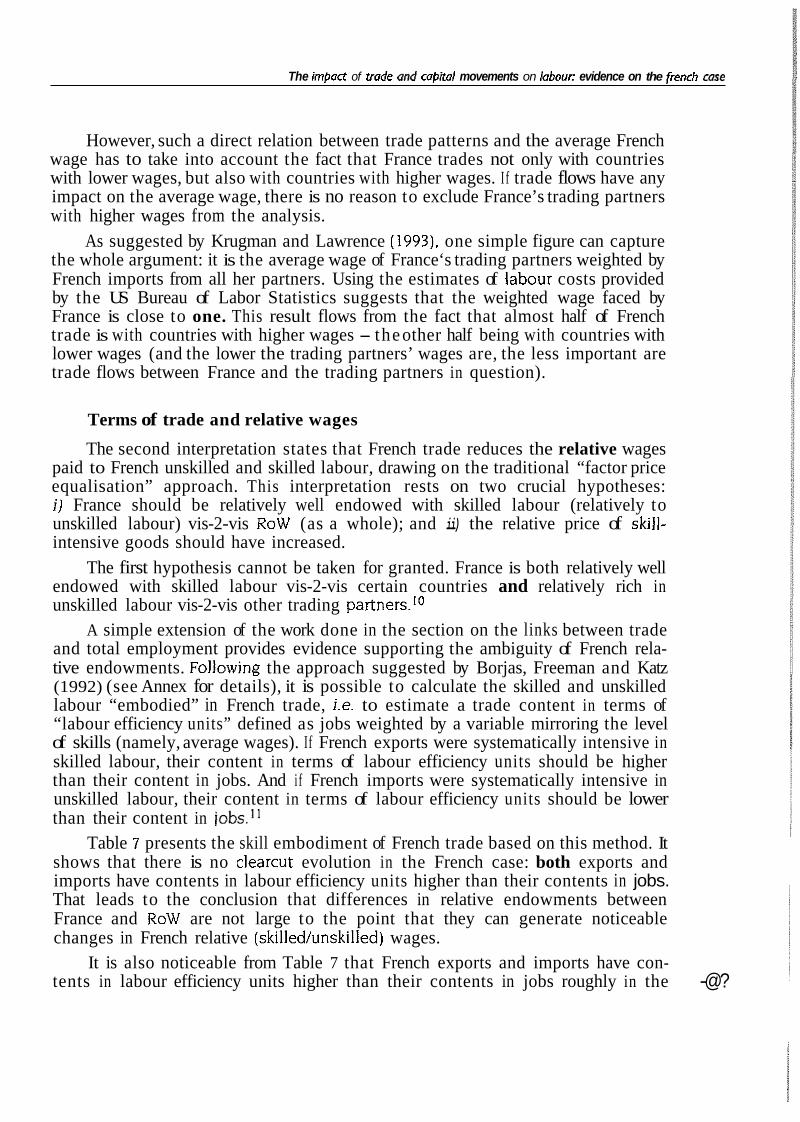
A simple extension of the work done in the section on the links between trade and total employment provides evidence supporting the ambiguity of French rela- tive endowments. Fol~owing the approach suggested by Borjas, Freeman and Katz (1992) (see Annex for details), it is possible to calculate the skilled and unskilled labour “embodied” in French trade, i.e. to estimate a trade content in terms of “labour efficiency units” defined as jobs weighted by a variable mirroring the level of skills (namely, average wages). If French exports were systematically intensive in skilled labour, their content in terms of labour efficiency units should be higher than their content in jobs. And if French imports were systematically intensive in unskilled labour, their content in terms of labour efficiency units should be lower than their content in iobs.I1
Table 7 presents the skill embodiment of French trade based on this method. It shows that there is no clearcut evolution in the French case: both exports and imports have contents in labour efficiency units higher than their contents in jobs. That leads to the conclusion that differences in relative endowments between France and ROW are not large to the point that they can generate noticeable changes in French relative (skilled/unskilled) wages.
It is also noticeable from Table 7 that French exports and imports have con- tents in labour efficiency units higher than their contents in jobs roughly in the -@?
OECD Economic Studies No. 24, I99511
Table 7. Implicit labour input in goods and services trade flowsa
As a % of total French labour input in number of jobs
Import Export Net
1985 1986 1987 1988 1989 1990 1991 1992
Averages
87-92 85-86
As a % of total French labour input in efficiency units
Import Export Net
2. I 0.9 0.1
-0.2 -0.1 -0.3 -0.2
0.4
-14.3 -14.8 -I 5.3 -15.7 -16.1 -16.6 -16.9 -16.8
-20.6 -21.6 -22.6 -22.9 -23.4 -24. I -24.1
n.a.8
16.4 15.7 15.4 15.5 15.9 16.2 16.6 17. I
23.7 3.1 22.8 1.2 22.5 -0.1 22.2 -0.6 22.9 -0.5 23.3 -0.8 24.1 -0.5 n.a. n.a.
14.5 16.0 1.5 1 2 1 . 1 23.2 2.1 16.2 16.1 -0.1 23.5 23.0 -0.5
a ) These estimates are based on 38 sectors. The results are slightly different from those of Table 4 because of this change in the level of disaggregation.
Source: INSEE. Cornptes de la nation and DADS. Author’s computations.
same proportion. As a result, the net trade impact in terms of “labour efficiency units” is still small when compared with total employment (expressed itself in terms of labour efficiency units) though it is higher than the net trade impact in terms of jobs. In sum, the conclusion suggested by the section on the links between trade and total employment (above) (that the trade impact on total employment is small) still appears to be valid when allowance is made for the skill composition of the work force.
Skill-intensities of French industries
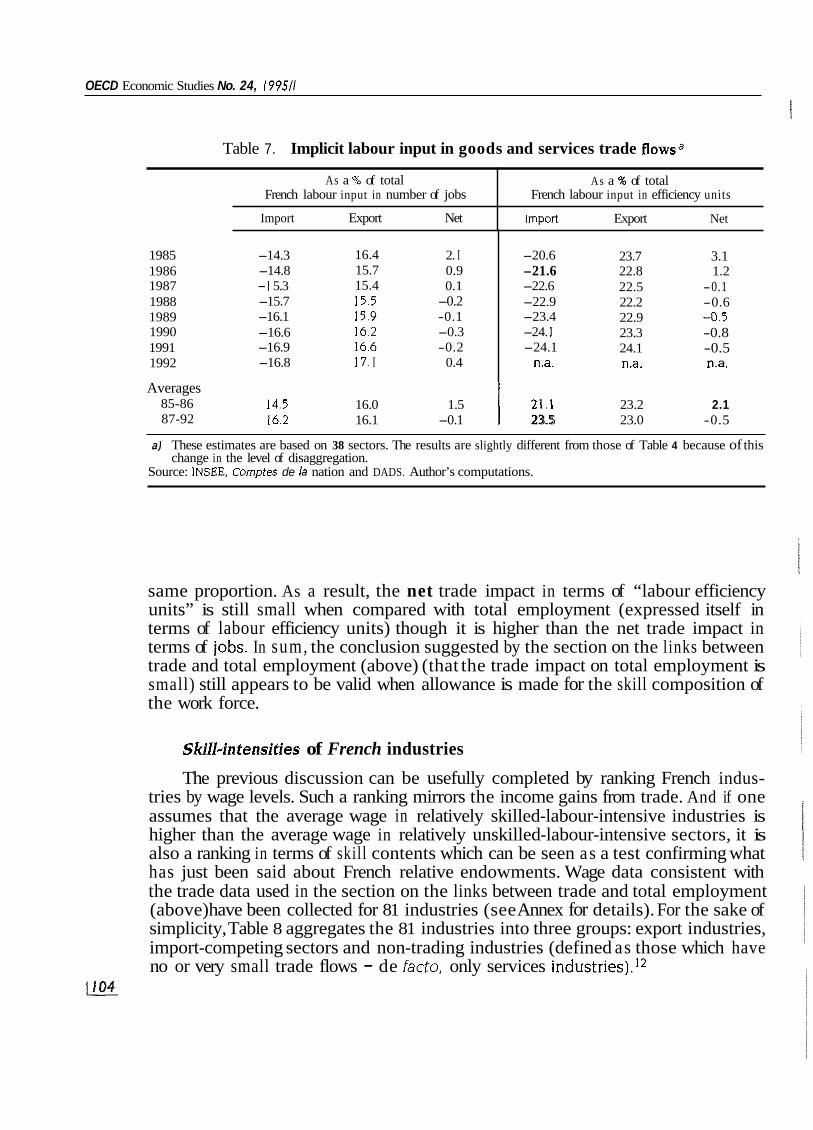
The previous discussion can be usefully completed by ranking French indus- tries by wage levels. Such a ranking mirrors the income gains from trade. And if one assumes that the average wage in relatively skilled-labour-intensive industries is higher than the average wage in relatively unskilled-labour-intensive sectors, it is also a ranking in terms of skill contents which can be seen as a test confirming what has just been said about French relative endowments. Wage data consistent with the trade data used in the section on the links between trade and total employment (above) have been collected for 81 industries (see Annex for details). For the sake of simplicity, Table 8 aggregates the 81 industries into three groups: export industries, import-competing sectors and non-trading industries (defined as those which have no or very small trade flows - de fac to , only services industries).12
1104
The impaa oftrade and capital movements on labour: evidence on the french case
Table 8. Relative wages among French industries, 1985-1991
Industries 1985 1986 1987
A. All sectors (except agriculture) World
Import-competing 103.3 101.2 Exporting 100.3 102.4 Non trading 77.9 82.1
European Community Import-competing 101.6 104.1 Exporting 97.7 93.1
Other OECD Import-competing Exporting
Import-competing Exporting
ROW
102.2 104.3 98.0 98.3
97.6 97.4 101.8 101.8
B. Manufacturing sector (including food processing) World
Import-competing 99.2 97.0 Exporting 101.3 104.4 Non trading 95.2 101.1
Import-competing 96.3 97.9 European Community
Exporting 105.0 99.6
Other OECD Import-competing Exporting
102.5 104.0 96.1 96. I
ROW Import-competing 98.6 98.6 Exporting 100.0 100.4
102.8 100.3 76.6
104.5 93.6
101.2 98.8
98.1 101.9
98.2 104.3 90.9
99.4 98.6
102.0 95.4
100.3 100.0
~~
I988 1989 1991a
101.5 105.1 72.4
104.2 99.6
101.2 101.4
98.4 106.2
98.1 105.1 92.0
100.8 99.1
103.0 95.7
99.8 102.2
102.0 102.1 73. I
102.6 100.4
101.1 99.3
99.6 103.5
98.5 104.1 89.2
98.1 106.9
103.4 93.2
101.4 101.3
102.1 105.6 66.0
101.6 103.3
104.5 98.5
101.0 106.2
98.5 104.5 85.0
98. I 108.8
103.4 93.0
97.4 103.5
aJ Data for 1990 are not available. See text for details. bJ Index 100 for the whole economy (agriculture excluded). CJ Index 100 for the whole manufacturing (including food processing).
Source: INSEE. Comptes de la nation and DADS. Authors’ computations.
Table 8 illustrates French income gains from trade. Workers in export manufac- turing sectors gain on average 6 per cent more than workers in import-competing manufacturing sectors (taking into account services).I3 Combined with the result From the section on the links between trade and total employment (above), this result mirrors the saying about the impact of freer trade: “Better jobs rather than more jobs.”
OECD Economic Studies No. 24, 199511
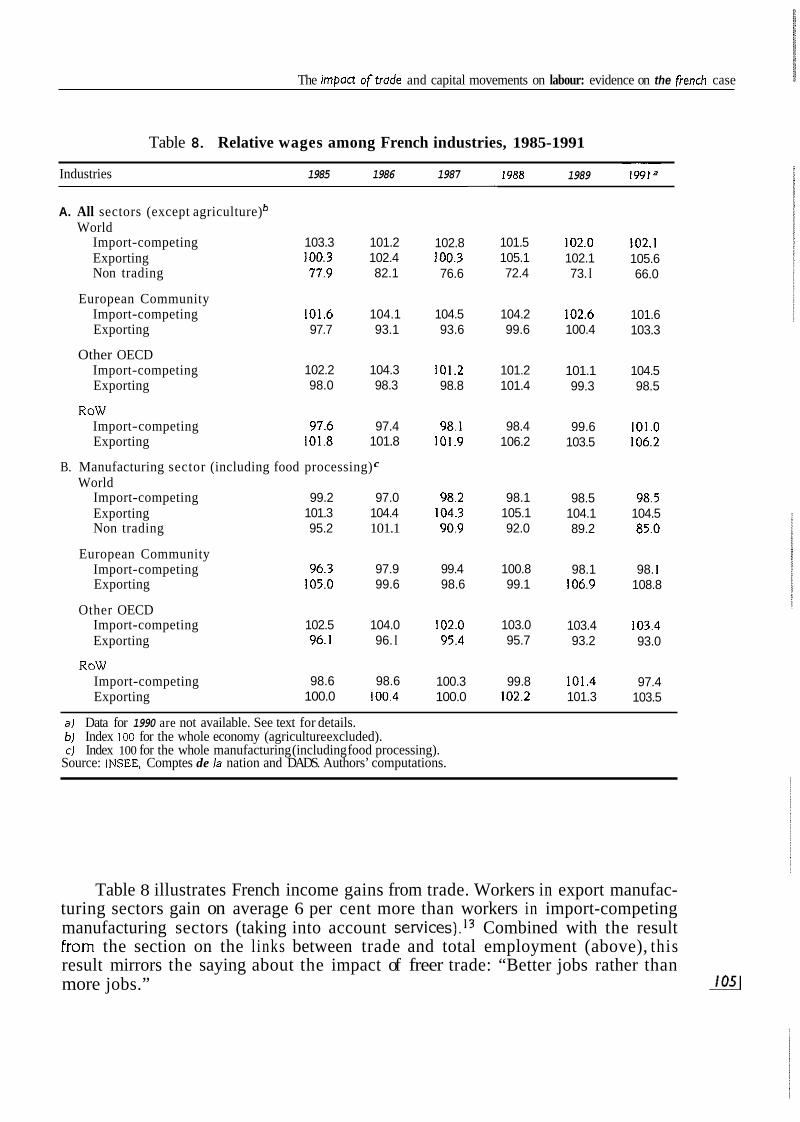
This result requires a caveat: the observed link between French exports and wages may also reflect protection. For instance, trade barriers in textiles and apparel are imposed by all OECD countries on exports from the newly industrial and developing countries. Such trade barriers exclude non-OECD competitors from OECD markets and substitute for them competitors from other OECD countries with the closest factor endowments to those of the industrializing countries. France, which is a large exporter of textiles and clothing, is one of these OECD countries which benefits indirectly the most from such protection. Large French exports of apparel to the other OECD zone may thus mirror the OECD pattern of protection as well as her relative endowments. A similar argument could be made about protec- tion in agriculture and French agricultural exports to the EC.
Table 8 also confirms that France tends to export low-skill-intensive products to the EC and the other OECD zones. This result holds for the other OECD zone for every year irrespective of whether services are included or excluded (though services tend to reduce the strength of the result). The conclusion is less stable for the EC than for the other OECD trading partners, in particular when services are excluded. In sharp contrast with this feature of French trade with industrial countries, France tends to export goods and services which are relatively skill intensive to the ROW zone. This conclusion is relatively stable and it is more marked when services are included.
In sum, these results confirm that France is not the country with the highest relative endowment in skilled labour. Compared with its OECD trading partners (among which there are all the skill-rich countries), France tends to rely on relatively low-skill-intensive exports. When facing industrializing or developing countries which are relatively rich in unskilled labour, France tends to export high-skill- intensive exports.
Terms of trade and relative wages
Examining the impact of the terms of trade on relative wages requires some estimate of the changes in the relative prices of traded goods and services which have triggered changes in relative factor rewards (as is well known, fixed relative prices of traded goods and services and fixed technology lead to constant relative factor rewards, as in the Rybczynski case).I4 Figure 2 suggests that the French terms of trade improved between 1984 and 1991 - with most of the increase occurring between 1984 and 1986 (and essentially because the relative prices of imported goods decreased).
The analytical framework Examining the impact of the terms of trade on French relative wages also
requires an analytical framework which is better adapted than the traditional factor price equalisation theorem. In what follows, we assume some "specificity" (different rates of adjustment) for different types of labour (supposed to be the only factor). More precisely, we rely upon the following hypothesis: skilled labour is specific to /106

The impon aftrode and capital movements an labour: evidence on the french case
Figure 2. French terms of trode
100 = 1980 loo= 1980 122 , , 122
INSEE. all
...... ........ . . ........
94 94
1980 1981 1982 1983 1984 1985 1986 1987 1988 1989 1990 1991 1992
Source: OECD.
the sector where it works, whereas unskilled labour is assumed to be mobile between all sectors.
It must be recognised that this working hypothesis can be criticised on several grounds: labour regulations (such as the minimum wage or employment protection legislation) also create rents which tend to limit the potential mobility of unskilled labour; some skills (for instance, managerial skills) can be more flexible than technical skills (skilled managers could be more mobile between sectors than skilled engineers); higher skills may be associated with better capacities to learn, thus with more flexibility, etc. Because of lack of information (for instance, on the proportion of managers compared with engineers in the skilled labour force, on the proportion of older workers with different skills, etc.) the working hypothesis cannot be tested directly on the data used in this paper.15 However, the results presented below are consistent with the hypothesis that skilled labour is more sector-specific than unskilled labour in the French case.
I f factors are sector-specific to a different extent (adjust at different speeds), economic analysis shows that changes in the terms of trade will trigger magnified reactions of the factor rewards of the specific factors (see Annex for details). For instance, improved terms of trade will have the following consequences: wages paid to skilled labour by export industries will improve by more than export prices; wages paid to skilled labour used in import-competing industries will decline by
OECD Economic Studies No. 24, I99511
more than import prices; and wages paid to unskilled (and mobile between indus- tries) labour will stay within the range set by the changes of the export and import prices.
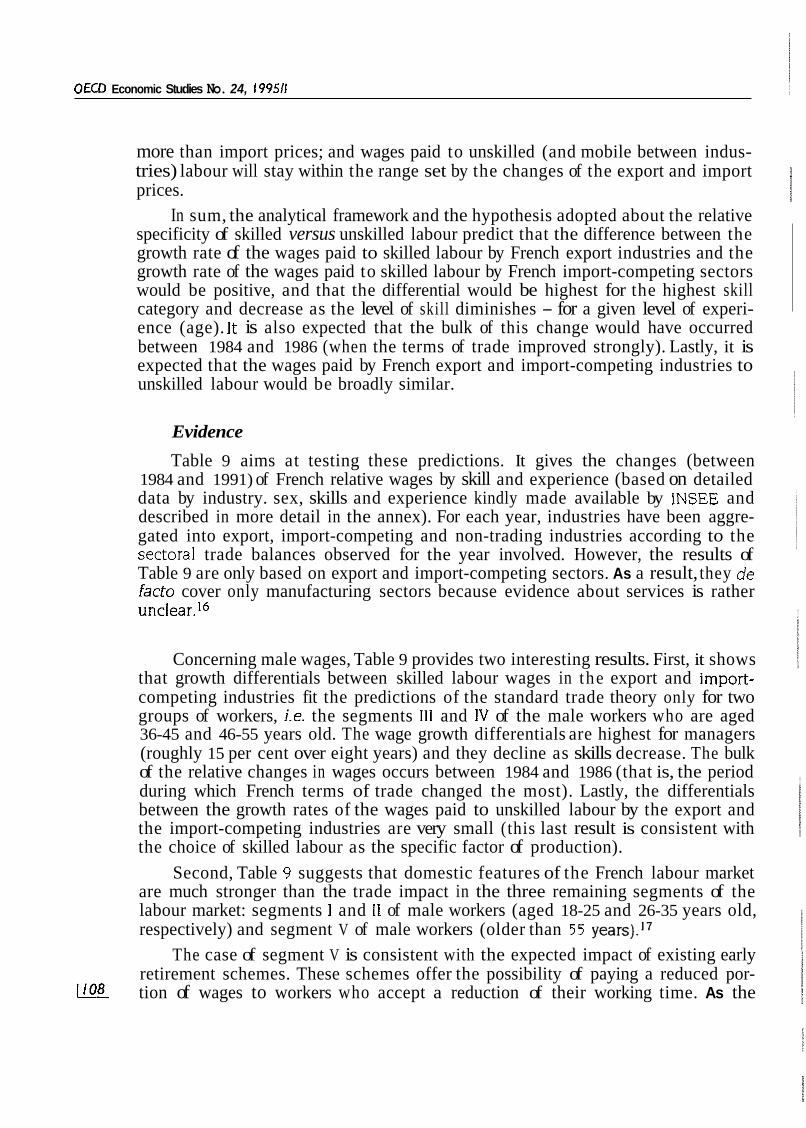
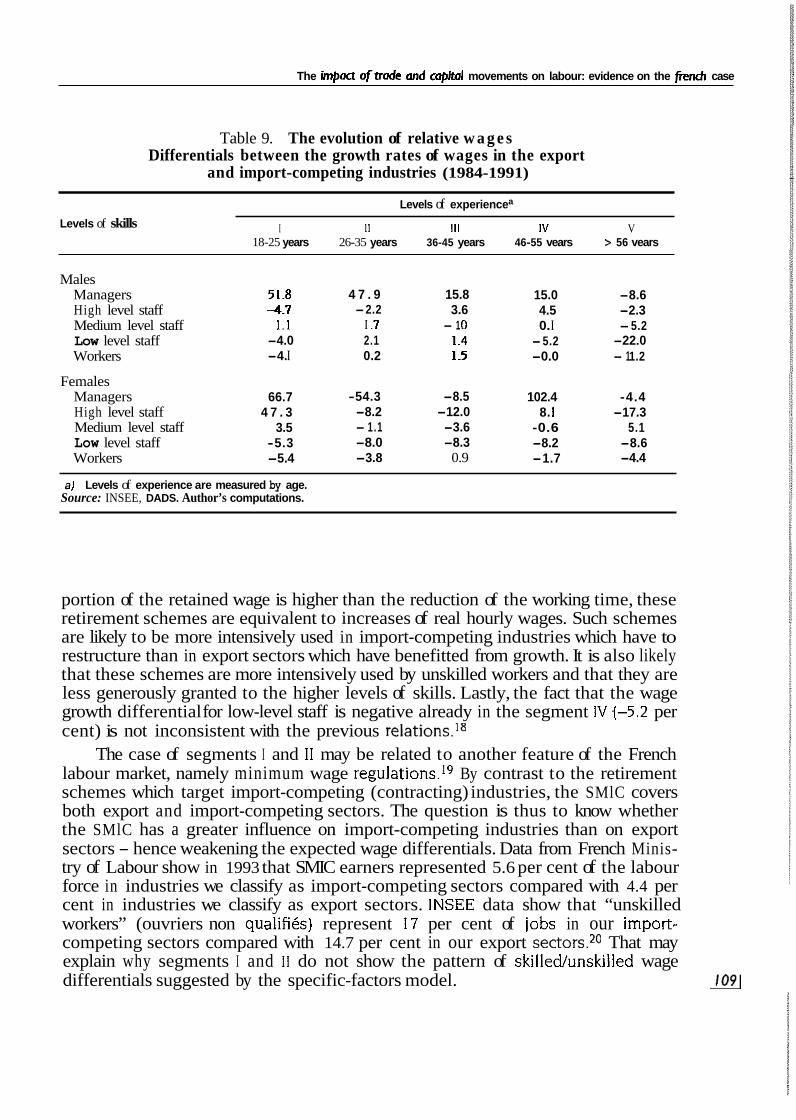
In sum, the analytical framework and the hypothesis adopted about the relative specificity of skilled versus unskilled labour predict that the difference between the growth rate of the wages paid to skilled labour by French export industries and the growth rate of the wages paid to skilled labour by French import-competing sectors would be positive, and that the differential would be highest for the highest skill category and decrease as the level of skill diminishes - for a given level of experi- ence (age). It is also expected that the bulk of this change would have occurred between 1984 and 1986 (when the terms of trade improved strongly). Lastly, it is expected that the wages paid by French export and import-competing industries to unskilled labour would be broadly similar.
Evidence
Table 9 aims at testing these predictions. It gives the changes (between 1984 and 1991) of French relative wages by skill and experience (based on detailed data by industry. sex, skills and experience kindly made available by INSEE and described in more detail in the annex). For each year, industries have been aggre- gated into export, import-competing and non-trading industries according to the sectoral trade balances observed for the year involved. However, the results of Table 9 are only based on export and import-competing sectors. As a result, they de fact0 cover only manufacturing sectors because evidence about services is rather unclear.16
Concerning male wages, Table 9 provides two interesting results. First, it shows that growth differentials between skilled labour wages in the export and import- competing industries fit the predictions of the standard trade theory only for two groups of workers, i.e. the segments 111 and 1V of the male workers who are aged 36-45 and 46-55 years old. The wage growth differentials are highest for managers (roughly 15 per cent over eight years) and they decline as skills decrease. The bulk of the relative changes in wages occurs between 1984 and 1986 (that is, the period during which French terms of trade changed the most). Lastly, the differentials between the growth rates of the wages paid to unskilled labour by the export and the import-competing industries are very small (this last result is consistent with the choice of skilled labour as the specific factor of production).
Second, Table 9 suggests that domestic features of the French labour market are much stronger than the trade impact in the three remaining segments of the labour market: segments I and 11 of male workers (aged 18-25 and 26-35 years old, respectively) and segment V of male workers (older than 55 years).I7
The case of segment V is consistent with the expected impact of existing early retirement schemes. These schemes offer the possibility of paying a reduced por- tion of wages to workers who accept a reduction of their working time. As the 1108
The impoct oftrode and copitol movements on labour: evidence on the french case
Table 9. The evolution of relative w a g e s Differentials between the growth rates of wages in the export
and import-competing industries (1984-1991)
Levels of skills Levels of experiencea
I I1 111 IV V 18-25 years 26-35 years 36-45 years 46-55 vears > 56 vears
Males Managers High level staff Medium level staff Low level staff Workers
Females Managers High level staff Medium level staff Low level staff Workers
51.8 4 . 7
1 .1 -4.0 -4. I
66.7 4 7 . 3
3.5 -5.3 -5.4
4 7 . 9 -2.2
I .7 2.1 0.2
-54.3 -8.2 - 1.1 -8.0 -3.8
15.8 3.6
- 1 .o 1.4 1.5
-8.5 -12.0 -3.6 -8.3
0.9
15.0 4.5 0. I -5.2 -0.0
102.4 8. I
-0.6 -8.2 -1.7
-8.6 -2.3 -5.2 -22.0 - 1 1.2
-4.4 -17.3
5.1 -8.6 -4.4
aj Levels of experience are measured by age. Source: INSEE, DADS. Author’s computations.
portion of the retained wage is higher than the reduction of the working time, these retirement schemes are equivalent to increases of real hourly wages. Such schemes are likely to be more intensively used in import-competing industries which have to restructure than in export sectors which have benefitted from growth. It is also likely that these schemes are more intensively used by unskilled workers and that they are less generously granted to the higher levels of skills. Lastly, the fact that the wage growth differential for low-level staff is negative already in the segment IV {-5.2 per cent) is not inconsistent with the previous relations.I8
The case of segments I and I I may be related to another feature of the French labour market, namely minimum wage reg~1ations.l~ By contrast to the retirement schemes which target import-competing (contracting) industries, the SMlC covers both export and import-competing sectors. The question is thus to know whether the SMlC has a greater influence on import-competing industries than on export sectors - hence weakening the expected wage differentials. Data from French Minis- try of Labour show in 1993 that SMIC earners represented 5.6 per cent of the labour force in industries we classify as import-competing sectors compared with 4.4 per cent in industries we classify as export sectors. INSEE data show that “unskilled workers” (ouvriers non qualifib) represent 17 per cent of jobs in our import- competing sectors compared with 14.7 per cent in our export sectors.20 That may explain why segments I and I 1 do not show the pattern of skilled/unskilied wage differentials suggested by the specific-factors model. 1091
OECD Economic Studies No. 24, I99511
Concerning female wages, Table 9 provides broadly similar, though less clear, results. The major difference with male wages is that domestic features dominate all the segments of the labour markets but one (segment IV).
In sum, Table 9 leads to the conclusion that, when disaggregated by skill level and gender, the evolution of French relative wages (in terms of skills) appears to be more influenced by domestic features of the labour market than by trade flows. The sole exceptions to this are the central segments of the work force (persons aged between 36 and 56 years old). In these two segments, skilled labour employed by export industries gains whereas skilled labour employed by import-competing industries loses (in relative wage terms). It should be kept in mind that these evolutions are the necessary signals for a reallocation of the French labour force which takes into account changing relative world prices.
FOREIGN DIRECT INVESTMENT, DOMESTIC INVESTMENT, AND JOBS The heated debate about France's signature of the Uruguay Round reached a
peak with the arguments about "d6localisation". This issue centred on the fear that French outward FDI was worsening the allegedly negative trade impact on the number of jobs (and on relative wages).
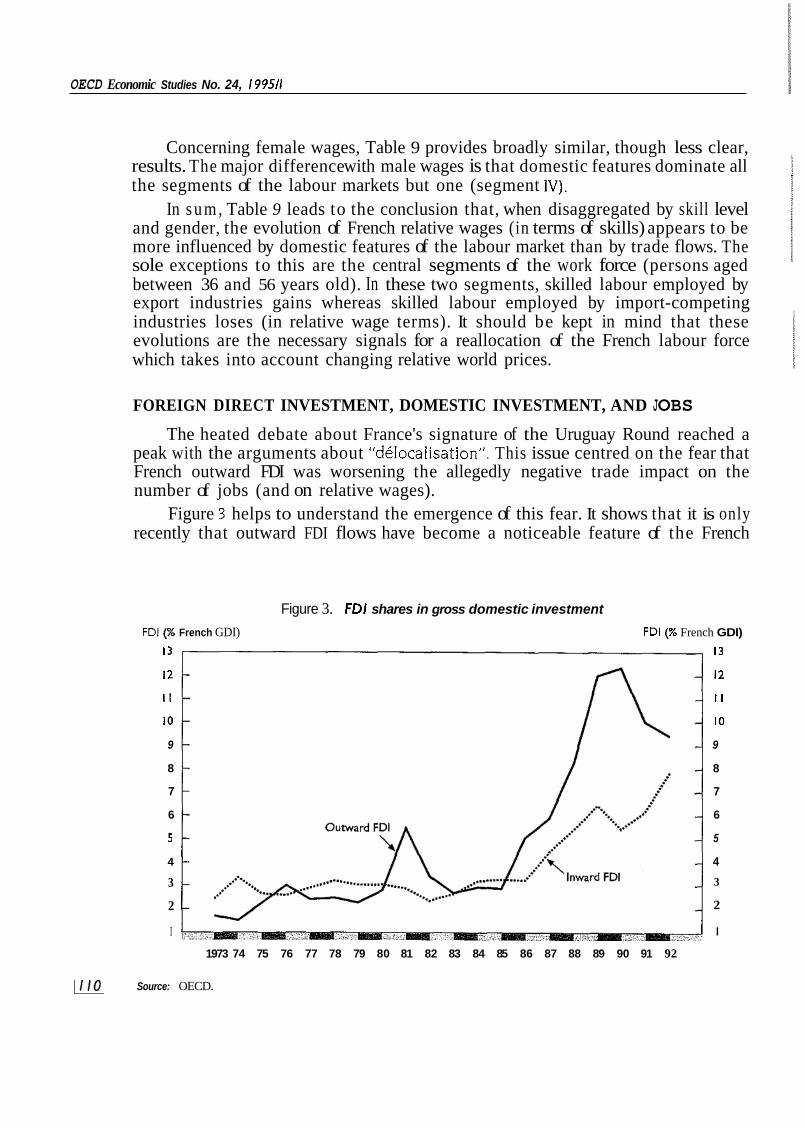
Figure 3 helps to understand the emergence of this fear. It shows that it is only recently that outward FDI flows have become a noticeable feature of the French
Figure 3. FDI shares in gross domestic investment
FDI (% French GDI) FDI @ French GDI) 13 13
12 12
I1 I I
10 10
9 9
8 8
7 7
6 6
5 5
4 4
3
2
I I
3
2
1973 74 75 76 77 78 79 80 81 82 83 84 85 86 87 88 89 90 91 92
1110 Source: OECD.
The impact of trade and capital movements on labour: evidence on the french case
economy. Until 1986, outward FDI was insignificant (it represented less than 3 per cent of domestic gross investment defined by the "formation brute de capital fixe") whereas since 1986, French outward FDI has accounted for 8 to 12 per cent, with a peak in 1990.
However, Figure 3 also shows that inward FDI has followed the same evolution as outward FDI flows. After some lags between 1986 and 1990, the inward FDI share of domestic gross investment has converged towards the outward FDI share since 1991. The imbalance between inward and outward flows was never larger than 7 per cent of French gross domestic investment, and it declined to less than 2 per cent of domestic investment in 1992. These features were generally ignored in the French debate about outward FDI flows. As well as neglecting inward FDI flows by its misplaced focus on outward FDI, the "d6locaiisation" debate has also ignored the relative importance by industry of the outward FDI flows.
This section examines three issues. First, it provides some basic evidence about relationships between (inward and outward) FDI and gross domestic invest- ment by industry. Second, it looks at the FDI geographical patterns by industry - in particular, checking whether import-competing industries have FDI patterns differ- ent from other French industries. Lastly, it provides some evidence about the relationships between FDI and structural changes in jobs by industry.
The section is based on detailed data about FDI by industry from the Balance of Payments statistics which are available only for the period 1989-92. As annual data on such a short period are not very meaningful. the section relies on averages over the four years As usually in Balance of Payments statistics, data are in terms of flows and they concern residents and non-residents. This last point is crucial for a correct interpretation of the results provided below. they capture the relations between French savings and their use for investment purposes either in France or in the rest of the world. They do not capture the investment strategies of French (or foreign) multinationals which could (and indeed, do) rely on funds which are available elsewhere.
Capital flows and gross investment by industry
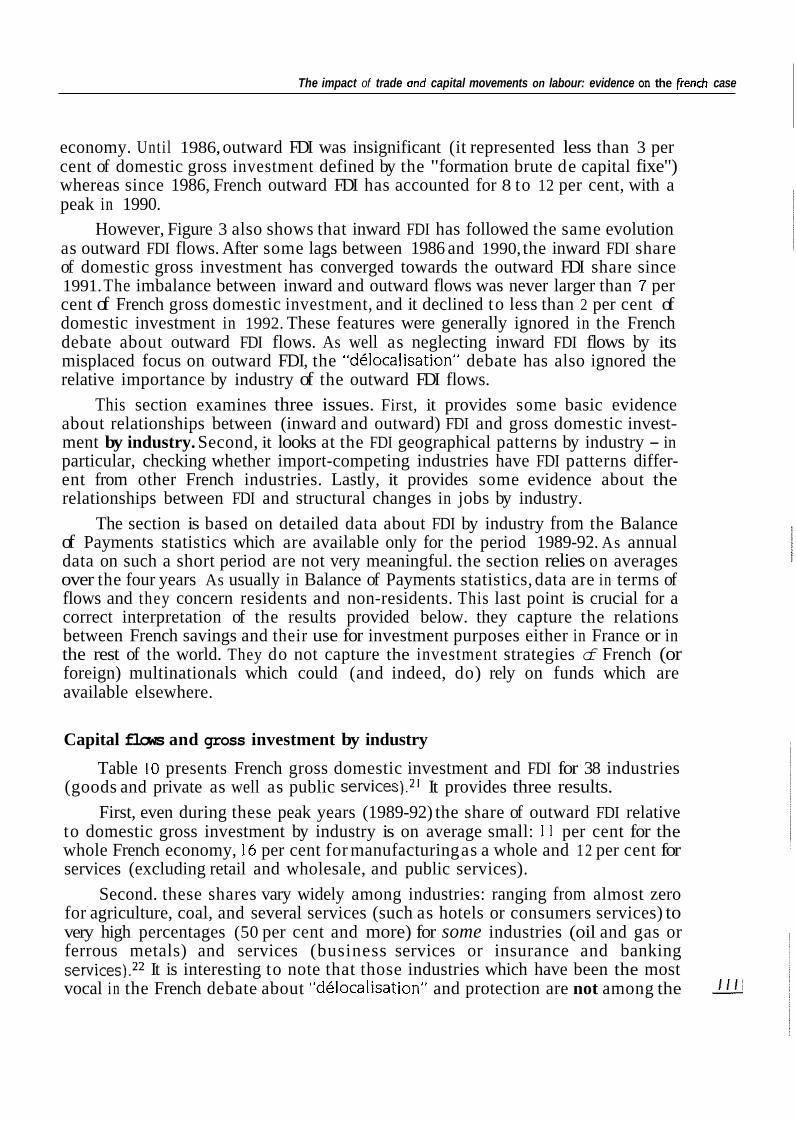
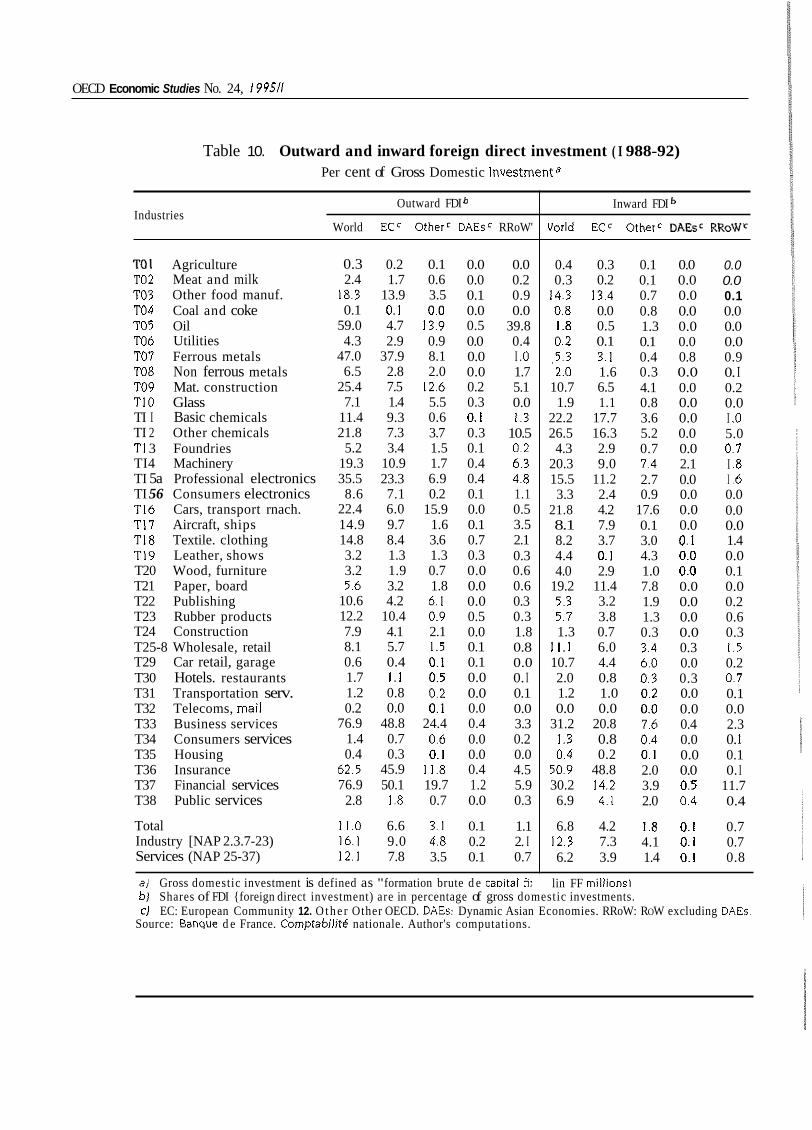
Table 10 presents French gross domestic investment and FDI for 38 industries (goods and private as well as public services).21 It provides three results.
First, even during these peak years (1989-92) the share of outward FDI relative to domestic gross investment by industry is on average small: 1 1 per cent for the whole French economy, 16 per cent for manufacturing as a whole and 12 per cent for services (excluding retail and wholesale, and public services).
Second. these shares vary widely among industries: ranging from almost zero for agriculture, coal, and several services (such as hotels or consumers services) to very high percentages (50 per cent and more) for some industries (oil and gas or ferrous metals) and services (business services or insurance and banking services).22 It is interesting to note that those industries which have been the most vocal in the French debate about "d6localisation" and protection are not among the 111
OECD Economic Studies No. 24, I99511
Table 10. Outward and inward foreign direct investment ( I 988-92) Per cent of Gross Domestic Investmenta
Industries Outward FDI
World ECC OtherC DAEsC RRoW'
TO1 Agriculture TO2 Meat and milk TO3 Other food manuf. TO4 Coal and coke TO5 Oil TO6 Utilities TO7 Ferrous metals TO8 Non ferrous metals TO9 Mat. construction TI0 Glass TI I Basic chemicals TI 2 Other chemicals TI 3 Foundries TI4 Machinery TI 5a Professional electronics TI 56 Consumers electronics TI6 Cars, transport rnach. TI7 Aircraft, ships TI8 Textile. clothing TI9 Leather, shows T20 Wood, furniture T21 Paper, board T22 Publishing T23 Rubber products T24 Construction T25-8 Wholesale, retail T29 Car retail, garage T30 Hotels. restaurants T31 Transportation serv. T32 Telecoms, mail T33 Business services T34 Consumers services T35 Housing T36 Insurance T37 Financial services T38 Public services
Total Industry [NAP 2.3.7-23) Services (NAP 25-37)
0.3 0.2 0.1 0.0 2.4 1.7 0.6 0.0
18.3 13.9 3.5 0.1 0.1 0.1 0.0 0.0
59.0 4.7 13.9 0.5 4.3 2.9 0.9 0.0
47.0 37.9 8.1 0.0 6.5 2.8 2.0 0.0
25.4 7.5 12.6 0.2 7.1 1.4 5.5 0.3
11.4 9.3 0.6 0.1 21.8 7.3 3.7 0.3
5.2 3.4 1.5 0.1 19.3 10.9 1.7 0.4 35.5 23.3 6.9 0.4 8.6 7.1 0.2 0.1
22.4 6.0 15.9 0.0 14.9 9.7 1.6 0.1 14.8 8.4 3.6 0.7 3.2 1.3 1.3 0.3 3.2 1.9 0.7 0.0 5.6 3.2 1.8 0.0
10.6 4.2 6.1 0.0 12.2 10.4 0.9 0.5 7.9 4.1 2.1 0.0 8.1 5.7 1.5 0.1 0.6 0.4 0.1 0.1 1.7 1 .1 0.5 0.0 1.2 0.8 0.2 0.0 0.2 0.0 0.1 0.0
76.9 48.8 24.4 0.4 1.4 0.7 0.6 0.0 0.4 0.3 0.1 0.0
62.5 45.9 11.8 0.4 76.9 50.1 19.7 1.2
2.8 1.8 0.7 0.0
11.0 6.6 3.1 0.1 16.1 9.0 4.8 0.2 12.1 7.8 3.5 0.1
0.0 0.2 0.9 0.0
39.8 0.4 I .O 1.7 5.1 0.0 1.3
10.5 0.2 6.3 4.8 1.1 0.5 3.5 2.1 0.3 0.6 0.6 0.3 0.3 1.8 0.8 0.0 0. I 0.1 0.0 3.3 0.2 0.0 4.5 5.9 0.3
1.1 2. I 0.7
a l Gross domestic investment is defined as "formation brute d e caDital fii
Inward FDI
World ECc OtherC D A B C RRoWc
0.4 0.3 0.3 0.2
14.3 13.4 0.8 0.0 1.8 0.5 0.2 0.1 ,5.3 3.1 2.0 1.6
10.7 6.5 1.9 1.1
22.2 17.7 26.5 16.3 4.3 2.9
20.3 9.0 15.5 11.2 3.3 2.4
21.8 4.2 8.1 7.9 8.2 3.7 4.4 0.1 4.0 2.9
19.2 11.4 5.3 3.2 5.7 3.8 1.3 0.7
1 1 . 1 6.0 10.7 4.4 2.0 0.8 1.2 1.0 0.0 0.0
31.2 20.8 1.3 0.8 0.4 0.2
50.9 48.8 30.2 14.2 6.9 4.1
6.8 4.2 12.3 7.3 6.2 3.9
0.1 0.0 0.1 0.0 0.7 0.0 0.8 0.0 1.3 0.0 0.1 0.0 0.4 0.8 0.3 0.0 4.1 0.0 0.8 0.0 3.6 0.0 5.2 0.0 0.7 0.0 7.4 2.1 2.7 0.0 0.9 0.0
17.6 0.0 0.1 0.0 3.0 0.1 4.3 0.0 1.0 0.0 7.8 0.0 1.9 0.0 1.3 0.0 0.3 0.0 3.4 0.3 6.0 0.0 0.3 0.3 0.2 0.0 0.0 0.0 7.6 0.4 0.4 0.0 0.1 0.0 2.0 0.0 3.9 0.5 2.0 0.4
1.8 0.1 4.1 0.1 1.4 0.1
0.0 0.0 0.1 0.0 0.0 0.0 0.9 0. I 0.2 0.0 I .O 5.0 0.7 I .8 I .6 0.0 0.0 0.0 1.4 0.0 0.1 0.0 0.2 0.6 0.3 1.5 0.2 0.7 0.1 0.0 2.3 0. I 0.1 0. I
11.7 0.4
0.7 0.7 0.8
lin FF millionsl bj Shares of FDI {foreign direct investment) are in percentage of gross domestic investments. CJ EC: European Community 12. O t h e r Other OECD. DAEs: Dynamic Asian Economies. RRoW: ROW excluding DAEs.
Source: Banque d e France. Cornptabilite nationale. Author's computations.
The impon oftrode and capitol movements on labour: evidence on the french case
most active investors in foreign countries: consumer electronics, textiles and cloth- ing, wood and furniture, leather and shoes exhibit shares of outward FDI with respect to gross domestic investment which are lower than the average share for the manufacturing sector as a whole.
Lastly, against a background of inward FDI flows that are globally smaller than outward FDI, there is a noticeable difference between the manufacturing sector (inward FDI is 75 per cent of outward FDI) and the services sector (the correspond- ing ratio is 50 per cent). Inward FDI flows are also less concentrated by individual sector than the corresponding outward FDI flows. It is interesting to note that job- losing industries receive substantial inward FDI flows: these flows are even larger than outward FDI flows for some import-competing industries (leather and shoes, wood and furniture).
Geographical patterns of FDI flows by industry
The French debate about “ddocalisation” has focused almost completely on investment (funded by French savings) in countries with low wages. It is thus worth checking whether a significant share of the French outward FDI is going to such countries, and, if so, whether this phenomenon is more marked for import-compet- ing industries which exhibit high net losses in terms of jobs. Table 10 provides two answers to these questions.
First, the geographical pattern of French outward FDI is very similar to that of French merchandise trade. Most of the outward FDI is exported to the EC and to other OECD countries. Less than 20 per cent of outward FDI - i.e. the equivalent of barely 3 per cent of French gross domestic investment - goes to non-OECD coun- tries. Thus, the idea that “dklocalisation” represents a great threat to the French industrial base is not substantiated by the facts.
Second, it is essential to note that the geographical pattern of outward FDI is broadly the same for all French industries. In particular, labour-intensive industries do not exhibit an outward FDI pattern more oriented towards low-wage countries than other French industries. For instance, the shares of outward FDI (in French gross domestic investment) invested in non-OECD countries range from 2.8 through 1.2 to 0.6 per cent for textile and clothing, consumer electronics, and leather and shoes or wood and furniture, re~pec t ive ly .~~
Table 10 also provides some information about the geographical sources of inward FDI (though this information is much less easy to interpret than the geo- graphical pattern of outward FDI flows because sources of inward FDI may refer to the places where financing packages have been arranged rather than the places where funds have been effectively raised). With this caveat in mind, inward FDI flows come mostly from the EC and other OECD countries. Inward FDI flows from devel- oping or newly industrialised countries represent a very small proportion of French gross domestic investment in manufacturing, except in ferrous metals, machinery, professional electronics, and textile and clothing. 4
OECD Economic Studies No. 24, i 99511
That outward FDI flows have the same geographical pattern for all industries may seem, at a first glance, counter-intuitive. There are several possible explana- tions for this fact. Two seem particularly relevant. First, technological and factor price changes induce unskilled-labour-intensive industries to evolve towards capital or skill-intensive techniques. For instance, clothing can be designed and made electronically, and shoes can be manufactured by capital-intensive techniques (glu- ing instead of stitching). In such cases, outward FDI flows reveal the appropriate technological changes which take place in these industries and which will allow their future growth in developed countries. The second explanation is that inputs other than the two classical factors of production (capital and labour) may be crucial: for instance, gaining good information about markets and their evolution (fashion) may require a lot of investment. I f that is the case, then the large and sophisticated markets - the OECD markets - will attract most of the investment, even for import-competing and job-losing industries [Oman, 1993).
Capital flows and jobs
The debate over "d6localisation" aimed at addressing the issue of the impact of outward FDI flows on total employment: do these flows reinforce the allegedly negative impact of trade flows on employment? It does not seem very logical to limit this kind of question to outward FDI alone, thereby eliminating the possible impact of inward FDI on employment. Hence, this section examines this issue by combining estimates from the section on the links between trade and total employ- ment with available data on French FDI - both inward and outward.
Table 11 presents the shares of French FDI held by industries grouped by their net situation in terms of job losses or gains (as computed in the section on the links between trade and total employment, above). It is based on a breakdown of all the sectors into four different types: those characterised by large job gains, those marked by large job losses and those with relatively small job gains or losses. It suggests two results.
First, outward FDI flows are concentrated in industries exhibiting net job gains. This feature is very clear i f two industries (financial services for investment in the EC, and oil and gas extraction for investment in the non-OECD countries) are excluded for obvious reasons (the first is related to the Single Market programme and the second is related to the location of oil and gas deposits). Table I 1 provides no evidence to support the assertion that "d6localisation" is concentrated in indus- tries experiencing net job losses.
Second, inward FDI flows offer a more complex pattern. Inward FDI flows from the EC are disproportionately invested in French industries suffering substantial net job losses. By contrast, inward FDI flows from non-OECD countries are essentially directed to French industries exhibiting net job gains, while inward FDI flows from the other OECD countries are in-between. These investment patterns suggest two remarks. Inward FDI flows from developed countries seem to be largely consistent with the argument that French comparative advantages are complex vis-his other OECD countries which are mostly capital and skilled labour-rich countries. By 1114

The impact oftrade and copital movements on labour: evidence on the french case
Outward foreign direct investment World 13.9 34.2 EC 21.3 32.0a Other OECD 5.4 16.6 ROW 31.6 38.7
Inward foreign direct investment World 10.9 30.6 EC 16.3 29.1 Other OECD 8.6 19.1 ROW 2.1 2.9
Table 1 I . Shares of French foreign direct investment by industry ranked by net job gains and losses
65.8 53.4 68.0 48.4 83.4 57.2 61.3 28.4
69.4 37.7 70.9 31.9 80.9 43.5 97. I 26.5
Industries with net job losses I Industries with net job gains
Trading partners Industries having gained more than
5 000 jobs
all industries with net job losses
all industries with net job gains
Industries having lost more than
5 000 jobs
contrast, inward FDI flows from newly developed or developing countries mirror the more clear-cut comparative advantages.
CONCLUSION
This paper examines the impact of trade and capital movements on French employment and relative wages. It provides three results which tend to support standard economic analysis.
First, trade has had, at most, a modest impact on total employment which depends more upon macroeconomic factors and policies as well as upon the structure of labour and product markets (and the ways in which labour and product market policies influence these structures). When the calculations are disaggre- gated between skilled and unskilled labour embodied in French trade, this result does not change. Contrary to what some observers believe, French exports are not particularly skilled-labour intensive compared with the rest of the world. Indeed. France is both relatively well endowed with skilled labour vis-his certain trading partners (for instance, developing countries) and relatively intensive in unskilled labour vis-a-vis other countries (for instance, the major OECD countries).
Second, trade has had an impact on relative wages: the paper provides evi- dence supporting the saying that liberal trade is associated with better jobs rather than more jobs, But the paper also shows that the influence of trade on relative -!&?
OECD Economic Studies No. 24, 199511
wages was dampened by domestic labour market policies and regulations, espe- cially for young workers and for those close to retirement.
Lastly, the paper shows that focusing on outward foreign direct investment (FDI) by import-competing industries is misleading: outward FDI is essentially done by exporting sectors, and inward FDI (which is broadly of the same magnitude) occurs in downsizing industries as well as in the exporting sectors -suggesting that French firms ignore opportunities to invest in France that foreign investors find profitable.
The first and third results of this paper are t h u s close to those provided by the existing literature on the US case (Baldwin, 1994). Taking into account the fact that French labour markets are characterised by more wage and quantity rigidities than US labour markets, this similarity is interesting. It confirms that trade policy is the wrong instrument for addressing labour issues, a message particularly useful if one takes into account the fact that the United States and France have been among the staunchest supporters of the introduction of a "social clause" in the G A T arena.
To our knowledge, the existing literature on the US case has not examined the relationship between trade and labour in a factor-specific environment which sup- ports our second result. It would be interesting to see to which extent a crude method, like the one used in this paper, would provide similar or dissimilar results in an economy where labour market flexibility is more marked.
NOTES
I .
2.
3.
4.
5.
6.
7.
8.
9.
10.
I I.
See the Arthuis Report (1993) which was prepared by a member of the French Senate. For an opposite stance, see the Devedjian Report (I 993).
For a more detailed analysis of the relations between trade and factor movements, see Faini and Venturini (I 993).
Beyond these results of pure trade theory, economists tend to see trade as an engine of growth - a dynamic element of competition powerful enough to generate new jobs in the national economy (Edwards, 1993). However, the limited period for which data are available suggests that this argument should be put to one side in the context of this paper.
The year I976 has been chosen as the starting point because it is the f i rs t year with the French unemployment rate higher than 3 per cent (its average during the 20 previous years).
At the level of disaggregation chosen (81 sectors), French national accounts allow to take into account requirements in terms of intermediate goods and services - but not in terms of capital goods.
Since 1977, the decline in this ratio mirrors the increasing role of exports in French GDP.
For the sake of simplicity, Table 3 does not show the number of export-supported jobs related t o trade with the OPEC countries. Jobs supported by French exports to OPEC countries can be computed by subtracting the amount of export-supported jobs related to the zones shown in Table 3 from the total amount of export-supported jobs provided by Table I.
The same observation can be drawn from the results obtained in the United States by Borjas et 01. (I 99 I).
Intra-industry trade opens the possibility of a more complex picture at a more disaggre- gated level of sectors than the 81 industries considered here.
Indeed, Krugman and Lawrence (I 993) have shown that in the US case, factor price equalisation is dominated by more powerful domestic causes.
Indeed, such changes are observed by Borjas et of. in the US case: the implicit labour input in US exports is higher in efficiency units than in jobs, and the implicit labour input in US imports is lower. 117(
OECD Economic Studies No. 24, 199511
12.
13.
14.
15.
16.
17.
18.
19.
20.
21.
22.
23.
l,ls
Table 8 excludes agriculture (but not food industries) because wage data are not very reliable for this sector.
The wage differentials are smaller when services are included. That may be due to the fact that services are protected and workers in these sectors can share in the associated rents.
That remains true when the recent empirical literature has also added immigration in a relatively straightforward manner: the entry of more low-skilled immigrants is assumed to depress unskilled wages relatively to skilled wages. Again, however, a simple Heck- scher-Ohlin model based on skilled and unskilled labour shows that this is not the case unless the terms of trade vary.
Again, what counts is not the absolute specificity of each factor, but the fact that some factors are assumed to be less mobile than others. Kraft (I 994) found that German data (1965-90) show a negative correlation between skilled workers and mobility (as sug- gested by the human capital theory).
Only four service sectors may be considered as tradables (two as exportables and two as importables).
It should be emphasized that segment I accounts for a small share of the French work force.
It may suggest that these schemes are already shaping labour markets for employees aged between 45 and 55 years old (probably between 50 and 55 years old).
The impact of the minimum wage regulation on French employment has been thor- oughly analyzed. See Rosa (I 985) and Bazen and Martin (I 99 I).
These figures are unweighted averages of the shares by sector provided by INSEE
FDI flows differ from gross domestic investment flows because they are also used to finance other purposes, in particular mergers and acquisitions.
These high figures (50 per cent and more) require some explanations. In manufacturing, there are only two cases (oil and non-ferrous mining) which are easy to explain: they clearly correspond to the absence of the raw materials in question in France. In the case of services, there are two plausible explanations. The ways data are recorded by the Banque de France may aggregate capital flows from some industries with capital flows of the services industry involved - in particular, for banking and insurance services. The other explanation is the huge foreign investments made by French banks and insurance companies in order to adjust to the Single Market exercise.
It may be argued that this result mirrors a statistical problem due to the fact that Table I0 aggregates capital and labour-intensive industries together (for instance, tex- tiles and clothing). However, additional computations concerning the geographical FDI pattern at a higher level of disaggregation (81 industries) confirm the results of Table 10.
( I 993).
Annex
METHODOLOGY AND SOURCES
Standard trade propositions
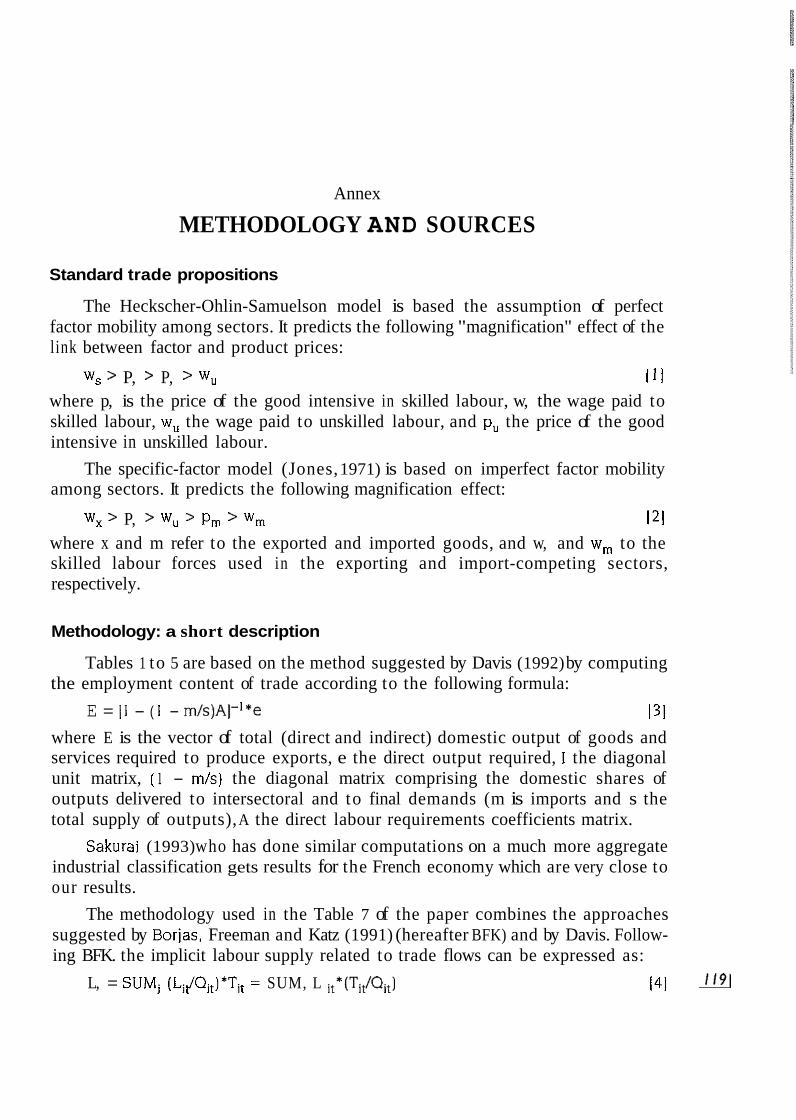
The Heckscher-Ohlin-Samuelson model is based the assumption of perfect factor mobility among sectors. It predicts the following "magnification" effect of the link between factor and product prices:
1 1 1 where p, is the price of the good intensive in skilled labour, w, the wage paid to skilled labour, w, the wage paid to unskilled labour, and pu the price of the good intensive in unskilled labour.
The specific-factor model (Jones, 1971) is based on imperfect factor mobility among sectors. It predicts the following magnification effect:
w, > P, > w, > P, > w, 121 where x and m refer to the exported and imported goods, and w, and w, to the skilled labour forces used in the exporting and import-competing sectors, respectively.
w, > P, > P, > w,
Methodology: a short description
the employment content of trade according to the following formula: Tables 1 to 5 are based on the method suggested by Davis (1992) by computing
E = 11 - ( 1 - m/s)A]-]*e 131 where E is the vector of total (direct and indirect) domestic output of goods and services required to produce exports, e the direct output required, I the diagonal unit matrix, ( 1 - m/s) the diagonal matrix comprising the domestic shares of outputs delivered to intersectoral and to final demands (m is imports and s the total supply of outputs), A the direct labour requirements coefficients matrix.
Sakurai (1993) who has done similar computations on a much more aggregate industrial classification gets results for the French economy which are very close to our results.
The methodology used in the Table 7 of the paper combines the approaches suggested by Borjas, Freeman and Katz (1991) (hereafter BFK) and by Davis. Follow- ing BFK. the implicit labour supply related to trade flows can be expressed as:
L, = SUMi (L,t/Qi,)*Ti, = SUM, L it*(Ti,/Qit) 141 1191
OECD Economic Studies No. 24, I99511
where L, is the number of employees (adjusted for hours worked) in the industry i , Qi the domestic output of the industry i and Ti the net trade flow (imports minus exports) for this industry. All these variables are for the year t (from 1977 until 1992). When Ti, corresponds to net imports of the industry i. L, has a negative sign. When it corresponds to net exports of the industry i. L, has a positive sign.
BFK then refine their approach by introducing a broad distinction between two types of employees: “production workers” and “non-production workers.” In the French case, this distinction has been interpreted as that between workers (”ouvriers”) and other wage earners. As a result, the implicit supply of each type of labour related to trade flows can be expressed as:
Lit = SUM, Jaii*Lit*(Tit/Qit)j 151 where aii is the average proportion of employees of type j ( j = I , 2 ) by the industry during the period examined.
The second refinement introduced by BFK is the concept of “efficiency units.” The number of employees Li is split into 64 efficiency units, according to three criteria: sex, skills and experience. In the French case, male and female workers in each industry i are divided in six levels of ”socio-professional categories” which are the closest proxies for levels of education (managers, high-level staff, medium-level staff, low-level staff, workers, apprentices and trainees) and experience (given by five age-groups: under 26, from 26 to 35, from 36 to 45. from 46 to 55, above 56). Employees from the uni t u in the industry i were weighted by the average hourly wage during the period 1984-91. As a result, the implicit supply of each type of labour efficiency unit related to trade flows can be expressed as:
161 where e, is the average proportion of employees of type u employed by the industry during the period 1984-91 and where Ui, is the total number of labour efficiency units used by the industry i.
The BFK computations are based on total output Oi. Following Davis (1992), this paper is based on domestic output Q, only. Before assessing the pros and cons of this methodology, it is useful to describe the statistical sources.
L,, = (l/U)* SUMi Iei,,*Uit*(Ti(Qit)]
Statistical sources
Data on output, trade flows and total employment by industry were taken from the French National Accounts. The NAP 90 level of the French Industrial Classifica- tion (NAP 90) was used. It is a relatively disaggregated level since it distinguishes 54 agricultural and manufacturing branches and 27 services branches ( the 9 branches of “public services” have been aggregated into one branch). The break- down of trade flows between trade with the European Community and trade with the Rest of the World is also based on the National Accounts for the period 1988-92. 1120
The impact oftrade and capital movements on labour: evidence on the french case
For the years 1977-87, this breakdown is based on (unpublished) data processed by the Direction de la Prhision of the Ministry of the Economy.
All the detailed data on employment and wages were kindly provided by the Division Emploi of INSEE. Wages include all components (including taxable com- pensation) effectively paid after deduction of social charges (for social security, unemployment and retirement). As a result, they are taxable wages (except for compensations paid in kind). These wages are transformed into average wages by taking into account the corresponding number of hours worked. These data were available at the level of NAP 40 (based on 38 sectors).
Data on outward and inward capital flows between 1989 and 1993 were kindly provided by the Banque de France. These data, which follow the 1MF guidelines on Balance of Payments statistics, were made available in terms of the French indus- trial classification (NAP).
Some limitations of the methodology
The methodology used in this paper has attracted several criticisms (Cortes et lean, 1994). The two most frequent criticisms are as follows: the methodology assumes homogeneous domestic and foreign goods; it is based on average and static input-output coefficients. It seems to us that none of these criticisms are decisive and, as a result, that this methodology can provide acceptable results for the French case.
The homogeneity of the goods included in each industry has two interpreta- tions. First, sectors (even in a classification relying on 81 sectors) can be very broad, such as, for instance, the sector “machines-outils” or “materiel klectrique”. Second, domestically produced and imported goods pertaining to the same sector are considered as homogeneous.
The first dimension is a purely statistical problem which leads to the following question: would a more disaggregated classification provide very different results? This paper provides an indirect (though incomplete) answer to this question. In order to use the BFK methodology, it was necessary to shift from the NAP 90 classi- fication to the NAP 40 classification. However, comparing Table 4 (based on the 81 NAP 90 sectors) to Table 7 (based on the 38 NAP 40 sectors) shows that the orders of magnitude are very close. As a result, it seems unlikely that further disaggrega- tion would necessarily lead to very different results.
The second interpretation of homogeneity implicitly assumes that developing countries export low-quality goods and developed countries high-quality goods (as indeed implicitly assumed by Mathieu and Sterdyniak, 1994; and Direction de la Prhision, 1994). This assumed correlation between labour-intensity and low-quality versions of the good concerned on the one hand, and on the other hand between 1211
OECD Economic Studies No. 24, I99511
capital-intensity and high-quality of the good in question is far from certain. For instance, clothing would provide many counter-examples.
The second major criticism concerns the fact that the methodology is based on average input-output coefficients. It is argued that imports eliminate the least efficient plants and exports rely on the most efficient plants (Driver eta/ . , 1988). As a result, marginal input-output coefficients should be used rather than average coefficients. Moreover, it is argued that the least efficient plants are labour-inten- sive and that the most efficient plants are capital-intensive.
This criticism could be valid in the standard Heckscher-Ohlin-Samuelson framework, with two countries, two goods and two factors of production. It is less convincing in a world where it is difficult to locate the relative endowments of a country with respect to the others. As suggested in the text, France is likely to be more labour-abundant than some OECD countries, but less labour-abundant than the other OECD countries and developing countries. In this case, it seems difficult to assume that firms will always eliminate labour-intensive plants and that exports will always be based on capital-intensive plants.
BIBLIOGRAPHY
ARTHUIS, Jean (I 993), Rapport d'information sur les ddocalisations des aaivitb industrielles et de services hon de France, Senat.
BALDWIN, Robert E. (I 994), The effects of trade and foreign direct investment on employ- ment and relative wages, OECD Economic Studies No. 23, Winter.
BAZEN, Stephen and John P. MARTIN (ISSI), The impact of the minimum wage on earnings and employment in France, OECD Economic Studies No. 16, Spring.
BORJAS, George J., Richard B. FREEMAN and Lawrence F. KATZ (I99l), On the labour market effects of immigration and trade, NBER, Working Paper No. 3761.
BRECHER, R. (1974), Minimum wage rates and the pure theory of international trade, Quarterly journal of Economics, 8 8 98- I I 6.
CORTES, 0. et S. JEAN (I 994), Commerce international, emploi et salaires, CEPII, Document de travail 94-08, rnimeo, Paris.
DAVIS, Lester A. (I 992). US jobs supported by merchandise exports, US Department of Commerce, Economics and Statistics Administration, April.
DEVEDJIAN, Patrick ( I 993). Le librkchange, one chance pour la France No. 774, Assemblee Nationale.
DIRECTION DE LA PREVISION (I 994), Le contenu des emplois des echanges industriels de la France avec les pays en developpement, Ministere de I'Economie, mimeo, Paris.
DRIVER, Ciaran, Andrew KILPATRICK and Barry NAlSBlTT (1988). The sensitivity of esti- mated employment effects in input-output studies, Economic Modelling, Vol. 5, No. 2, April, pp. 145- 150.
EDWARDS, Sebastian (I 993), Openness, trade liberalization and growth in developing coun- tries, journal of Economic Literature, September, M I : 1358- 1393.
FAINI, Ricardo and A. VENTURlNl (1993) Trade, aid and migrations: some basic policy issues, European Economic Review, 37, pp. 435-442.
INSEE (1993), Structure des emplois au 31 decembre 1991, Resultats detailles, INSEE Resultats, INSEE, Paris.
JONES, Ronald W. (1971), A three-factor model in theory, trade and history, in J.N. Bhagwati et 01.. (eds.), Trade, Balance ofPaymenq and Growth, Essays in honor of C.P. Kindleberger, North Holland, Amsterdam.
KRAFT, K. (I 994), Wage differentials between skilled and unskilled workers, Weltwirtschafi- liches Archiv, Vol. I30/2, pp. 329-349. 1231

OECD Economic Studies No. 24, I99511
KRUGMAN, Paul and Robert 2. LAWRENCE (I 993), Trade, jobs, and wages, NBER, Working
KRUEGER, Anne 0. (1977), Growth, Distortions and Patterns of Trade Among Many Countries,
MATHIEU, C. and H. STERDYNIAK (l994), Cemergence de I'Asie en developpement mena-
ROSA, Jean-Jacques (I 985), Les effets du SMlC sur I'emploi des jeunes: une analyse bien
SAKURAI, Norihisa (l993), Structural change and employment: empirical evidence for eight
VIMONT, C. ( I 993), Le commerce extbrieur fianpis crboteur ou destructeur d'emplois?, lnstitut
WOODLAND, A.D. ( I 982), International Trade ond Resource Allocation, North Holland,
Paper no 4478.
Princeton Studies in International Finance, Princeton University.
ce-t-elle I'emploi en France?, Observations et diagnostics bconorniques, No. 48, January.
confirmee, mimeo, FNSP, Paris.
OECD countries, OECD, October.
de I'entreprise, Economica, Paris.
Amsterdam.