Embed Size (px)
Citation preview

The Impact of the Youth Criminal Justice Act on Police Charging
Practices with Young Persons: A Preliminary Statistical Assessment
Peter J. Carrington and Jennifer L. Schulenberg
Report to the Department of Justice Canada
© HER MAJESTY THE QUEEN IN RIGHT OF CANADA (2005)
The views presented here are those of the authors and do not necessarily
represent the views of the Department of Justice or the Government of Canada.
The analysis in this document is based, in part, on data from the Canadian Centre for
Justice Statistics. The opinions expressed are those of the author(s) and do not necessarily represent the views of Statistics Canada or the data providers.
The authors wish to thank Tim Leonard, Julie Sauvé, and Marni Wallace of the Canadian Centre
for Justice Statistics, who prepared the custom tabulations on which the analysis is based. We also thank Tim Leonard for providing answers to many questions concerning the Uniform Crime
Reporting Survey. Any errors in interpretation of the data are those of the authors alone.

Executive Summary The objective of this research was to provide a preliminary assessment, based on national statistical data, of the extent to which police practices in Canada relating to the use of charges or other measures are changing in response to the new legislative direction provided by the Youth Criminal Justice Act. Data for 1986 to 2003 from the Uniform Crime Reporting Survey were analyzed in order to identify changes which occurred in 2003 in statistical indicators of police charging practices with young persons. The data indicate that the YCJA has been remarkably successful in bringing about changes in police charging practices with young persons which are consistent with its objectives, principles and provisions. In 2003, there was a substantial reduction at the national level and in most provinces and territories in the number of young persons charged or recommended by police to be charged, and a corresponding increase in the use of extrajudicial measures with apprehended young persons. There is no evidence of an increase at the national level in youth crime in 2003, or of net-widening by police in response to the coming into force of the YCJA. The substitution of extrajudicial measures for the laying of charges has been calibrated by police so that levels of charging were reduced in 2003 by more than one-third for minor offences such as theft under and drug-related offences, while levels of charging for serious property and violent offences (other than common assault) decreased only slightly. In three provinces, while the levels of charging of young persons decreased in 2003, we could not confidently attribute the changes to the impact of the YCJA, because the use of charges with apprehended young persons had been decreasing for some years before 2003. In three other provinces or territories, there was no evidence of a reduction in charging of young persons in 2003. We cannot be sure that the large reduction in 2003 in charging of young persons in incidents involving drug-related offences was entirely due to the YCJA, because the Act came into force only two months before the Cannabis Reform Bill was introduced in Parliament. Although this Bill was not passed, its introduction probably resulted in a reduction in the use of charges in incidents of possession of small amounts of cannabis. Our expectations based on the legislation were not fulfilled in the case of young persons accused of offences against the administration of justice – mainly violations of bail and probation conditions, and fail to appear for court. The data showed little change from previous years in the way in which police respond to youth accused of this type of offence. With these minor exceptions, the initial impact of the YCJA on police charging practices with young persons appears to have been remarkably strong, immediate, and consistent with its objectives, principles, and provisions.

The Impact of the Youth Criminal Justice Act on Police Charging Practices with Young Persons: A Preliminary Statistical Assessment
The Youth Criminal Justice Act (YCJA), which came into force April 1, 2003, contains several provisions which encourage police to use alternatives to charging youth whom they have reasonable grounds to believe have committed criminal offences. This report provides a preliminary assessment, based on national statistical data, of the extent to which police practices in Canada relating to the use of charges or other measures are changing in response to the new legislative direction. 1.0 BACKGROUND In assessing the impact of the YCJA on police charging practices with apprehended young persons, the baseline for comparison is police practices under the previous legislation, the Young Offenders Act, which was in force from 1984 to March 31, 2003. This section begins with a brief review of the provisions of the YOA, and the findings of related empirical research, which are most relevant to police charging practices. The relevant sections of the YCJA are then reviewed, in order to elucidate the aspects of its objectives, principles, and specific provisions which could be expected to have an impact on police charging practices. Our intention here is not to interpret the legislation in order to draw conclusions about how police should react to the new Act; rather it is to identify provisions of the Act which are likely to have affected police charging practices, hence to develop expectations, or hypotheses, to be tested against the statistical data. The section concludes with the research hypotheses which were suggested by our review. 1.1 The Young Offenders Act (YOA) The Declaration of Principle (section 3(1)) of the YOA set out several principles which were to govern the youth justice system: crime prevention (s. 3(1)(a)), the accountability and responsibility of young persons (s. 3(1)(a.1)), the protection of society (s. 3(1)(b)), the limited maturity and special needs of young persons (s. 3(1)(c)), the rehabilitation of young offenders (s. 3(1)(c.1)), restraint in the application of the law, and “least possible interference with freedom” (ss. 3(1)(d) and (f)), special guarantees of the rights and freedoms of the young person (ss. 3(1)(e) and (g)), and the primary responsibility of parents for their children (s. 3(1)(h)). Many writers have pointed out that these principles are broad, diverse, and potentially conflicting, and that the YOA provided practically no guidance to decision-makers as to how to choose among them or to balance them (e.g. Bala, 1997; Doob and Beaulieu, 1992; Platt, 1991). There are suggestions in sections 3(1)(a.1), (c), (d), (f), and (h) that, in some (unspecified) circumstances, a young person who has committed an offence should be treated more leniently, and/or less intrusively, than an adult in the same situation:

Impact of the YCJA on Police Charging Practices with Young Persons
2
(a.1) While young persons should not in all instances be held accountable in the same manner or suffer the same consequences for their behaviour as adults, young persons who commit offences should nonetheless bear responsibility for their contraventions; (c) young persons who commit offences require supervision, discipline and control, but, because of their state of dependency and level of development and maturity, they also have special needs and require guidance and assistance; (d) where it is not inconsistent with the protection of society, taking no measures or taking measures other than judicial proceedings under this Act should be considered for dealing with young persons who have committed offences;
(f) in the application of this Act, the rights and freedoms of young persons include a right to the least possible interference with freedom that is consistent with the protection of society, having regard to the needs of young persons and the interests of their families; (h) parents have responsibility for the care and supervision of their children, and, for that reason, young persons should be removed from parental supervision either partly or entirely only when measures that provide for continuing parental supervision are inappropriate.
These sections – particularly 3(1)(d) and 3(1)(f) – might have led a police officer dealing under the YOA with a young person believed to have committed an offence to take no further action, or use an informal sanction, rather than laying a charge. On the other hand, section 3(1)(b) states that “society must...be afforded the necessary protection from illegal behaviour” and section 3(1)(c) refers to the need of offending young persons for “supervision, discipline and control”: consideration of these sections might have led the officer to lay a charge. The Declaration of Principle of the YOA was relevant to any decision taken under the Act, including decisions made by police officers, by virtue of section 3(2), which states:
This Act shall be liberally construed to the end that young persons will be dealt with in accordance with the principles set out in subsection (1).1
Section 4 of the YOA permits, when certain conditions are fulfilled, the diversion to an alternative measures program of a young person who has committed an offence. These programs were operated by social workers, probation officers or members of the community (under the 1 The substantive force of section 3 was recognized by the Supreme Court of Canada in 1993 in R. v. M. (J.J.) (Bala, 1997: 37)

Impact of the YCJA on Police Charging Practices with Young Persons
3
direction of the provincial/territorial Attorney General) and were intended to be less intrusive than adjudication and sentencing in youth court. The nature of these programs varied across jurisdictions in their mode of referral (pre-charge, post-charge, or both), eligibility (types of offences, prior record, etc.), the degree of record-keeping, and availability (Carrington and Schulenberg, 2004a). Although the YOA provided for the establishment of diversion programs, this did not mean that the police could not continue to deal informally with accused youth. However, research has found that the presence and use of alternative measures programs may have resulted in net-widening, as police officers made referrals to alternative measures in situations where previously they would have used a less intrusive measure such as an informal warning. Also, in some jurisdictions which used a post-charge model for referral to alternative measures, police would sometimes lay a charge in order to qualify the youth for an alternative measures program (Carrington and Schulenberg, 2004a). To summarize, the YOA provided police and other decision-makers with a set of principles which were, according to one authority, “not coherent and, in some instances,...positively inconsistent” (Platt, 1991)2; and practically no guidance on how to resolve its apparent inconsistencies in making decisions under its authority. Research on the impact on police practices of the YOA has found that immediately after the Act came into force, there was a substantial decrease in the exercise of police discretion not to charge apprehended youth, and that this increase in charging persisted throughout most of the period when the YOA was in force (Carrington and Moyer, 1994; Carrington, 1998, 1999; Carrington and Schulenberg, 2004a; Federal-Provincial-Territorial Task Force on Youth Justice, 1996).3 The size and immediacy of this change in police charging practices with young persons, and the fact that it was not mirrored by a similar change in charging practices with adults, leave little doubt that it was somehow related to the YOA. That the YOA should have provoked more formal treatment of young offenders by police is very puzzling, since the Declaration of Principle and Section 4 on alternative measures appear to encourage the use of alternatives to charging. Various explanations for this phenomenon have been offered, including the impact of the influx of older youth into the youth justice systems of several jurisdictions in which they had previously been treated as adults, the increased procedural formality of the YOA, the frustration of police in having to work under what they perceived as an ineffective law, “zero-tolerance” attitudes on the part of police and the public, public and police perceptions of increasing youth crime, a change in police attitudes towards the ability of community members to deal with crime, creating a lower reliance on informal measures that were previously used as sanctions for less serious crime, or simply, inaccurate data on youth crime (Carrington and Moyer, 1994; Carrington, 1998; Carrington and Schulenberg, 2004a; Gabor, 1999; John Howard Society of Ontario, 1994; Markwart and Corrado, 1995; Moyer, 1996; Schulenberg, 2004). However, none of these explanations has been supported with sufficiently convincing evidence to have been widely accepted.
2 Legal Counsel to the Ministry of the Attorney General of Ontario. 3 The use of alternatives to charging began to increase in Canada in 2000: see Table A.2 in the Appendix.

Impact of the YCJA on Police Charging Practices with Young Persons
4
1.2 The Youth Criminal Justice Act (YCJA) From the point of view of police charging practices, the YCJA differs from the YOA in two significant ways. First, its overarching principles are coherent, because they are not inconsistent, and because guidance is provided as to the hierarchy of the stated principles. Second, the exercise of police discretion with alleged young offenders is specifically addressed, in several provisions which provide explicit guidance for police decision-making. According to the Department of Justice Canada (2003a), the YCJA provides legislative direction for the police to encourage an increase in the use of measures outside the formal court system for less serious offences. As in the YOA, the “liberal construction” subsection ((s. 3(2)) of the Declaration of Principle establishes that all decision-making in the youth criminal justice system will be in accordance with the guiding principles set out in section 3(1). Subsection 3(1)(a) states the goals of the youth criminal justice system to be crime prevention, rehabilitation of young offenders, and the provision of meaningful consequences for offences:
the youth criminal justice system is intended to: (i) prevent crime by addressing the circumstances underlying a young person’s offending behaviour, (ii) rehabilitate young persons who commit offences and reintegrate them into society, and (iii) ensure that a young person is subject to meaningful consequences for his or her offence in order to promote the long-term protection of the public.
Subsection 3(1)(b) provides that the youth criminal justice system must emphasize rehabilitation and reintegration, fair and proportionate accountability, procedural protection for a young person’s rights, and timely intervention focusing on linking consequences with the offending behaviour. Subsection 3(1)(c) is particularly relevant to police charging practices:
within the limits of fair and proportionate accountability, the measures taken against young persons who commit offences should (i) reinforce respect for societal values, (ii) encourage the repair of harm done to victims and the community, (iii) be meaningful for the individual young person given his or her needs and level of development and where appropriate, involve the parents, the extended family, the community and social or other agencies in the young person’s rehabilitation and reintegration.
Thus, it is not sufficient merely to hold young offenders accountable for their behaviour; in addition, police officers’ decision-making must emphasize fairness and proportionality through the use of measures that are meaningful in the context of the offending behaviour (Schulenberg, forthcoming). Stated differently, the key principles of the Act for police decision-making are restraint (in the decision on whether to invoke the formal court process), accountability (by using meaningful consequences), proportionality (responses to youth crime should be proportionate to

Impact of the YCJA on Police Charging Practices with Young Persons
5
the degree of responsibility and the seriousness of the offence), promoting rehabilitation that is appropriate for the offence, structured discretion, and protection of the public (holding youths accountable in a fair and proportionate manner may contribute to the protection of the public in the long term) (Barnhorst, 2004: 233-235). The Act requires that “the seriousness of the offence sets the degree of intervention, and efforts to address the rehabilitative needs of youth must fit within the proportionate response” (Barnhorst, 2004: 235). One of the most significant changes in the new Act in relation to police charging practices concerns the use of extrajudicial measures (formerly, informal action) and diversion to extrajudicial sanctions (formerly, alternative measures). The Act includes sections specifically addressed to the police, which encourage a lesser reliance on formal judicial measures in order to decrease the number of minor cases appearing in court (Department of Justice Canada, 2003a, 2003b)). Part 1 of the YCJA (sections 4-12) provides the statutory framework for dealing with youth who are believed to have committed an offence, outside the formal judicial system. Sections 4 and 5 state the principles and objectives for the use of extrajudicial measures. Sections 6 and 7 deal with taking no further action and the use of warnings, cautions, and referrals to other agencies. Finally, section 10 covers the use of extrajudicial sanctions.4 Although the use by police of informal action with alleged young offenders was permissible and encouraged under the YOA, the YCJA formalizes and structures the police use of discretion. Section 4 of the Act encourages the use of extrajudicial measures, and includes a presumption that they will be used in certain circumstances:
(a) extrajudicial measures are often the most appropriate and effective way to address youth crime; (b) extrajudicial measures allow for effective and timely interventions focused on correcting offending behaviour; (c) extrajudicial measures are presumed to be adequate to hold a young person accountable for his or her offending behaviour if the young person has committed a non-violent offence and has not previously been found guilty of an offence; and (d) extrajudicial measures should be used if they are adequate to hold a young person accountable for his or her offending behaviour, and, if the use of extrajudicial measures is consistent with the principles set out in this section, nothing in this Act precludes their use in respect of a young person who (i) has previously been dealt with by the use of extrajudicial measures, or (ii) has previously been found guilty of an offence.
Extrajudicial measures consist of all forms of diversion from the formal judicial system including the decision not to lay a charge and programs known as alternative measures under the YOA. Thus, these measures include taking no further action, informal police warnings, police
4 Although the relevant legislation includes Sections 4 through 12, only those sections which apply to police charging practices will be discussed. Therefore, the following sections are excluded: section 8 introduces Crown cautions, section 9 indicates that the use of warnings, cautions or referrals is not admissible in court as evidence of a prior record, section 11 requires the notification of parents if a young person participates in an extrajudicial sanction, and section 12 allows for the victim to request the identity of a young person participating in extrajudicial sanctions.
Impact of the YCJA on Police Charging Practices with Young Persons
6
cautions, police referrals to a program or agency in the community, pre-charge screening programs, youth justice committees, conferences, and extrajudicial sanctions (Department of Justice Canada, 2003b). Of particular importance for police charging practices is subsection 4(c), which creates a presumption that the use of extrajudicial measures is an appropriate response for a youth who has committed a non-violent offence and has no prior convictions. Further, it is made clear in subsection 4(d), that extrajudicial measures are not precluded for a youth who has a prior conviction or a record of prior extrajudicial measures. According to Bala (2003), the general practice under the YOA was that a youth was eligible only once for alternative measures. Section 4(d) should counteract this assumption by placing the onus of eligibility on the offending behaviour and not the offender’s history. Section 5(e) reaffirms the principle of proportionality established in the Declaration of Principle by stipulating that the application of extrajudicial measures should be proportionate to the seriousness of the offence. Additionally, subsections (b), (c), and (d) highlight that extrajudicial measures should encourage the young person to repair the harm done, involve the family and community, and provide victims with an opportunity to participate. The repairing of the harm done must be within the limits of a fair and proportionate response. Section 6(1) establishes the significant requirement that
A police office shall, before starting judicial proceedings [i.e. before laying a charge] or taking any other measures under this Act against a young person alleged to have committed an offence, consider whether it would be sufficient, having regard to the principles set out in section 4, to take no further action, warn the young person, administer a caution, if a program has been established under section 7, or, with the consent of the young person, refer the young person to a program or agency in the community that may assist the young person not to commit offences. (emphasis added)
Section 6(2) makes clear that a charge laid by a police officer cannot be invalidated on the grounds that the officer has failed to consider the use of extrajudicial measures, as required by section 6(1). Section 7 and 8 provide statutory authority for the provinces to establish police and Crown caution programs. There is no explicit distinction in the Act between informal and formal warnings (cautions); however “the caution is seen as a more formal or intrusive response” (Bala, 2003: 289; see also Tustin and Lutes, 2004: 23-24). Although section 7 authorizes the provinces to establish police cautioning programs, they have not been implemented consistently across Canada (Tustin and Lutes, 2004: 23). Furthermore, individual police agencies may, on their own

Impact of the YCJA on Police Charging Practices with Young Persons
7
initiative, have developed cautioning programs, which, while technically not “cautions” under section 7 of the YCJA, are operationally indistinguishable from them.5 Extrajudicial sanctions (section 10) are a form of extrajudicial measures. They are similar to alternative measures under the YOA. They can be implemented pre- or post-charge, and a charge can be laid in respect of the offence if the conditions of the sanction are not met. According to the YCJA, extrajudicial sanctions are appropriate if the young person cannot be adequately dealt with using a warning, caution, or referral due to the seriousness of the offence, the young person’s prior record, or aggravating circumstances (s. 10(1)). Under the YOA there was considerable interprovincial variation in the eligibility requirements for alternative measures (Carrington and Schulenberg, 2004a), and, according to Bala (2003), this variation is likely to continue under the YCJA. Research conducted when the YOA was in force also suggested that the availability of alternative measures programs varied within and across provinces and territories (Carrington and Schulenberg, 2004a). These variations may persist under the YCJA. Section 10(2) provides the conditions for the use of extrajudicial sanctions. Police officers must take into consideration the needs of the young person and society (s. 10(2)(b)), such that the police decision to use sanctions is consistent with the provisions of sections 3, 4, and 6. The young person must accept responsibility for the offence and consent to extrajudicial sanctions (s. 10(2)(c)). Stated differently, the police cannot divert a youth to sanctions if the youth denies committing the offence, wants to have the charge dealt with by the youth court, or there is insufficient evidence to proceed by way of charge (ss. 10(2)(e) and (f), and ss. 10(3)(a) and (b)). Finally, unlike other extrajudicial measures (e.g., informal warnings), the police decision to use extrajudicial sanctions may be introduced as part of the young person’s prior record in any subsequent proceedings.6 The YCJA does not speak specifically to the appropriate police action when handling offences against the administration of justice, such as violations of conditions of bail or probation orders. Common practice under the YOA was to charge a young person who had violated a condition of a probation order with failure to comply with a disposition (Pulis, 2003), which is an offence created by the YOA. The same offence is created by section 137 of the YCJA.7 The great majority of violations of probation orders8 involve behaviour which is non-violent and which “would not be considered a criminal offence if the behaviour occurred outside the context of a probation order” (Department of Justice Canada, 2003b), and could therefore arguably be dealt with adequately by an extrajudicial measure. A person on probation is necessarily not a first offender; therefore, the presumption in section 4(c) does not apply. However, section 4(d) provides that extrajudicial measures should be used in all cases in which they would be adequate to hold the young person accountable and, as noted above, extrajudicial measures may be used if the young person has previously been found guilty of an offence. Given their low level of seriousness, these offences would be good candidates for extrajudicial measures. 5 For example, in 2002 (i.e. while the YOA was in force) one police force in New Brunswick and another in Ontario had formal cautioning programs (see Carrington and Schulenberg, 2004a), which appeared to be consistent with the principles of sections 4, 5, and 6. 6 See sections 40(2)(d)(iv) and 119(2)(a). 7 Section 55 provides a list of conditions which may be attached to a non-custodial order; e.g., s.1(a): keep the peace and be of good behaviour, s.2(e): attend school, s.2(f): reside with a parent or approved adult, etc. 8 E.g. disobeying a curfew, disobeying “house rules”, violating an order not to associate with a certain person or to be in a certain place, etc.; see Pulis, 2003.
Impact of the YCJA on Police Charging Practices with Young Persons
8
Section 59(1) provides an alternative, or complementary, approach to a breach of a probation order: it allows for an application to be made to youth court for a review of a non-custodial sentence, with a view to changing the conditions. Application to the youth justice court can be made for such a review if: the material circumstances have changed, the young person is experiencing “serious difficulty” or is unable to comply with the conditions, the terms of the probation order are interfering with the young person’s education, employment, access to services (s. 59(2)), or any other grounds that a youth court has previously ruled as admissible (s. 59(2)(e)). However, section 59 restricts the parties who may make such an application, and police officers are not among these, so it would be necessary for a police officer who discovered a probation violation, and who wanted to proceed under section 59 rather than laying a charge, to enlist the cooperation of someone who was authorized to make an application. On the other hand, breaches detected by probation officers, which under the YOA were normally referred to the police to lay a charge, might well be dealt with by the probation officer under section 59 without contacting the police. According to the Department of Justice Canada (2003a, 2003b), the preferred approach to breach of probation cases is to apply to the youth court for a review of the non-custodial order. Police who discover such breaches “should consider referring such situations to a probation officer or a youth worker to determine what, if any, action, should be taken in the matter. One option would be to seek a review...” (Department of Justice Canada, 2003b). The reason given for this position is that:
For a large number of breaches, a review, rather than a charge, is the option that complies with the YCJA’s principle that measures taken against young persons must be fair and proportionate to the seriousness of the offending behaviour. In these cases, a review, rather than a charge, is also more consistent with the YCJA’s objective of reserving the system’s most serious interventions for the most serious offences (Department of Justice Canada, 2003b).
1.3 Research hypotheses On the basis of this review of the relevant provisions of the YCJA, in comparison with those of the YOA, we expect to observe the following changes in 2003 in police charging practices with apprehended young persons:
• A decrease in the number of young persons charged, and a corresponding increase in the number of young persons dealt with by extrajudicial measures.
• The decrease will be concentrated in the less serious and/or non-violent categories of offence, and there will be little or no change in the numbers of young persons charged with more serious and/or violent offences.
• In particular, a decrease:
o in the number of young persons charged with violations of probation condition and other offences against the administration of justice, and
Impact of the YCJA on Police Charging Practices with Young Persons
9
o in the number of young persons charged who have no prior convictions and who are charged with a non-violent offence.
• Continuing interprovincial/territorial variations in the levels of youth apprehended, charged, and not charged; and interprovincial/territorial variations in the impact of the YCJA on police charging practices.
• Some net-widening, taking two forms:
o an increase in the number of young persons dealt with by extrajudicial measures which exceeds any decrease in the number of youth charged, resulting in a net increase in the number of young persons apprehended and dealt with by police, and
o an increase in the level of intrusiveness of extrajudicial measures, evidenced by increased use of the more formal measures, such as cautions and referrals, and decreased use of the less intrusive measures, such as taking no further action and informal warnings.
The majority of these hypotheses are investigated in Section 3 of the report. Due to data limitations, we were unable to address two hypotheses – the hypothesis concerning a decrease specifically in the charging of non-violent first offenders, and the hypothesized increase in the intrusiveness of extrajudicial measures.

Impact of the YCJA on Police Charging Practices with Young Persons
10
2.0 Data and Methods The objective of this research was to use available statistical data to assess the initial impact of the YCJA on police charging practices with apprehended youth. The only source of national data on police practices is the Uniform Crime Reporting (UCR) Survey, operated by the Canadian Centre for Justice Statistics, a division of Statistics Canada. This Survey is a census of all criminal incidents and alleged offenders dealt with by all police services in Canada. UCR data are collected on a monthly basis, but released once a year, generally about eight or nine months after the end of each calendar year. At the time when we began the research, data for 2003 were the most recent available. 2.1 Data elements Since 1988, police services in Canada have had a choice between two formats for reporting data to the UCR Survey. The older “aggregate” format – sometimes called the “aggregate UCR Survey” – was designed when many police services did not yet have electronic Records Management Systems, and requires only the reporting of aggregate monthly numbers of youth charged, youth not charged, etc. The “incident-based” reporting format – sometimes called the “incident-based UCR Survey”, or UCR2 Survey – requires much more detailed information, reported at the level of the individual incident, alleged offender, and victim. Although the objective of the UCR Survey is that all police services will eventually use the UCR2 reporting format, adoption by a police service of the UCR2 necessitates modification of its Records Management System, so the new format is being phased in gradually. In 2003, police services accounting for approximately 61% of reported crime in Canada were using the UCR2 reporting format (Canadian Centre for Justice Statistics, 2004: 73). In order to report aggregate crime data for the whole of Canada, the Canadian Centre for Justice Statistics converts data reported by police in the incident-based (UCR2) format to the aggregate format and combines it with the aggregate data supplied by the remaining police services (Canadian Centre for Justice Statistics, 2004: 78). The UCR2 format was modified as of April 1, 2003 to require reporting of the type of extrajudicial measure used with each chargeable youth who was not charged (Canadian Centre for Justice Statistics, 2003). Therefore, our original research plan included analysis of this data element, for the police services which report to the UCR2 Survey. However, due to some reporting problems, the data reflecting the new requirements for reporting extrajudicial measures will not be available until the release of the 2004 UCR2 data (private communication, Canadian Centre for Justice Statistics, March 8, 2005). The results reported below are based on analyses of data covering all of Canada, supplied for this research in the form of custom tabulations by the Canadian Centre for Justice Statistics. These tabulations are based on the aggregate UCR Survey (i.e. data reported by some police services in the aggregate UCR format, combined with data reported by other police services in the incident-based UCR2 format and converted to the aggregate format).

Impact of the YCJA on Police Charging Practices with Young Persons
11
For the purposes of the present research, the two key data elements of the UCR are the per capita rate9 of young persons who were charged or recommended by police to be charged,10 and the rate of youth who were not charged. The sum of these two quantities is the total rate of chargeable youth, also known as the police-reported youth crime rate. A “chargeable” person11 is defined by the UCR2 Survey as one who “has been identified by police as being involved in a criminal incident and against whom an information [i.e. charge] could be laid as a result of sufficient evidence/information” (Canadian Centre for Justice Statistics, 2004: 80). Thus, the rate of young persons who were chargeable but not charged is an indicator of the use of extrajudicial measures, since extrajudicial measures in the YCJA are measures other than judicial proceedings (i.e. other than laying a charge) used with a young person whom an officer has reasonable grounds to believe has committed an offence. There has been some controversy in the criminological literature concerning the accuracy of the UCR data on youth not charged.12 The problem is that the UCR Survey is a form of “administrative data” – that is, data which are extracted from records created and maintained by organizations (in this case, police services) primarily for operational purposes, rather than to serve the needs of criminological research. For police operations, it is crucial to maintain complete and accurate records of youth who are charged, but not so important to record every youth who could have been charged but was not. Indeed, the notion of “chargeable” is open to individual interpretation. Individual police officers could be expected to vary considerably in the completeness of their recording of chargeable youth, and research has found that police services vary widely in the numbers of youth which they report as “not charged”, relative to the numbers which they report as charged. Some police services report zero youth not charged, so that their calculated “proportion of chargeable youth who were charged” – an indicator of the level of the (non-)use of police discretion – is 100%. Because of the unreliability of the reporting by some police services of numbers of youth not charged, some criminologists have warned against using this data element in analyses (e.g. Hackler and Don, 1990; Hackler and Paranjape, 1983, 1984; Markwart and Corrado, 1995). Others, including the authors of this report, have argued that although this data element should probably not be used to compare the charging practices of individual police services, the biases in reporting are sufficiently stable over time that it can be used in time series analyses, especially when it is aggregated to the level of the province or territory (Carrington, 1995, 1999; Carrington and Schulenberg, 2004a; Scanlon, 1986).
9 All numbers of young persons were standardized to rates per 100,000 youth population by dividing by the relevant annual youth population estimate, supplied by the Canadian Centre for Justice Statistics. 10 In New Brunswick, Quebec, and British Columbia, the decision whether to lay a charge against a young person is made by the Crown, on receipt from police of a recommendation to charge. UCR data on youth charged for New Brunswick and parts of Quebec report the numbers of youth who were actually charged, as a result of the Crown’s decision. UCR data for British Columbia and the remainder of Quebec reflect the numbers of youth who were recommended by police to be charged, not the numbers actually charged (Canadian Centre for Justice Statistics, 2004: 79). 11 The term used by Canadian Centre for Justice Statistics is “charged/suspect-chargeable (accused)”, which we have shortened to “chargeable”. In this report, we use the term “apprehended youth” to refer to the concept of a young person who a police officer has reasonable grounds to believe has committed an offence. We use the term “chargeable youth” to refer to the UCR data element which is used in the analysis as an indicator, or operationalization, of the concept. 12 See, e.g., Carrington, 1995, 1999; Federal-Provincial-Territorial Task Force on Youth Justice, 1996; Hackler and Don, 1990; Hackler and Paranjape, 1983, 1984; Markwart and Corrado, 1995.

Impact of the YCJA on Police Charging Practices with Young Persons
12
The coming into force of the YCJA introduced a new consideration concerning this methodological issue. Unlike the Young Offenders Act, the YCJA explicitly addresses the exercise of discretion by police in the decision whether to lay a charge against an alleged young offender, or to deal with him or her by extrajudicial measures.13 Police are required by the YCJA to consider using extrajudicial measures before laying a charge. One would expect that, in response to this requirement, individual police officers would begin to record more instances of their use of extrajudicial measures, in order to demonstrate compliance with the Act, and that police services would modify their Records Management Systems and their reporting expectations for their officers, in order to monitor compliance. The new requirement in the UCR2 Survey for more detailed reporting of extrajudicial measures (see above) has necessitated modifications to police Records Management Systems, from which the UCR2 data are extracted. This, in turn, can be expected to increase the reporting by police officers and police services of the use of extrajudicial measures. These developments suggest the distinct possibility of an increase in 2003 in the number of young persons reported to the UCR Survey as receiving extrajudicial measures (formerly, “youth not charged”),14 which in reality reflects nothing more than improved recording and reporting to the UCR Survey by police. The analysis reported in Section 3 takes this possibility into account. 2.2 Research design This research uses the interrupted time series design: that is, a series of annual measurements (in this case, of youth charged and youth not charged) is “interrupted” by an intervention whose impact is to be assessed – in this case, the coming into force on April 1, 2003 of the YCJA. Changes in the level and/or trend of the time series following the intervention are interpreted in this design as evidence of the effect of the intervention.15 Although many of the changes reported below are based on comparisons of levels in 2002 and 2003, the analyses always refer to the entire time series from 1986 to 2003 as the context for the comparisons, for two reasons: first, to protect against the possibility that 2002 was an anomalous year; and, second, to protect against the possibility of misinterpreting changes from 2002 to 2003 as evidence of the effect of the YCJA, when in fact they might have been merely the continuation of pre-existing upward or downward trends. Since the UCR data for 2003 include three months (January to March) when the YOA was in force, we also analyzed quarterly data for 2001 to 2003. These data enabled us to distinguish between the levels of the statistical indicators during the first quarter of 2003, under the YOA, from levels during the last three quarters under the YCJA. The quarterly analyses also enabled us to identify changes which began to occur during the second quarter of 2003. One can have more confidence that such changes were the result of the YCJA than changes known only to have occurred at some time in 2003.16 13 See Section 1.2 above. 14 And therefore, an increase in the total number of youth reported as chargeable (that is, in the police-reported youth crime rate). 15 See, e.g., Campbell and Stanley, 1963: 37-42; Mohr, 1995: Chapter 9. 16 The precise location in time of a change in the time series is a valuable form of protection against a threat, usually referred to as “history”, to the validity of conclusions from an interrupted time series evaluation design. The threat of “history” is that changes in the phenomenon of interest are mistakenly attributed to the intervention when in fact

Impact of the YCJA on Police Charging Practices with Young Persons
13
2.3 Data limitations Due to implementation of a new Records Management System, UCR data for the Toronto Police Service were not available for September to December, 2003, and were estimated by the Canadian Center for Justice Statistics, based on data for the same period in 2002 (Canadian Centre for Justice Statistics, 2004: 75). This posed a potential problem for the research, since Toronto accounts for approximately 12% of reported youth crime in Ontario. The period in question includes four of the nine months during which the YCJA was in force, and the substitution of data from 2002 could be expected partially to obscure any impact of the YCJA on police charging practices in Toronto, and therefore to bias downwards any assessment of its impact on police practices in Ontario. Therefore, we obtained two sets of data for Ontario and for Canada - one which included Toronto and one which excluded it – and have reported the results for analyses of both datasets. As it turned out, the inclusion or exclusion of data for Toronto did not materially affect the overall results. It is possible, using UCR2 data, to construct variables capturing aspects of the prior contacts with police of a chargeable person.17 This is done by searching the data for other records pertaining to the same person (which is not a straightforward process, since personal identifiers such as name, address, etc. are not captured by the UCR2 Survey). Such a procedure would have enabled us to address the hypothesis concerning the impact of the provision in Section 4(c) that extrajudicial measures are presumed to be sufficient to deal with a non-violent first offender. However, constructing a prior record variable using UCR2 data is a highly resource-intensive procedure which (like any record linkage project using Statistics Canada data) requires the approval of the Chief Statistician of Canada. We concluded that the time and resources which would have been required to carry out such an analysis were not warranted by its likely contribution to the results of this preliminary assessment.
they are due to other events which took place at approximately the same time as the intervention. For example, if there had been a substantial change in 2003 in the underlying level of youth crime, unrelated to the coming into force of the YCJA, it would probably have caused changes in the levels of reported youth charged and youth not charged, which could be misinterpreted as an effect of the YCJA. The more precisely the research can identify the point in time when the change occurred, the more confident one can be in distinguishing between effects of the intervention and effects of other social changes. 17 For examples of analyses of UCR2 data incorporating a prior contacts variable, see Carrington and Schulenberg (2004a; 2004c) and Schulenberg (2004).

Impact of the YCJA on Police Charging Practices with Young Persons
14
3.0 Findings
3.1 A substantial reduction in charging at the national level, and a corresponding increase in the use of extrajudicial measures
Figure 1 shows the per capita rates of young persons who were charged with criminal offences,18 and who were chargeable but not charged (i.e. who were dealt with by extrajudicial measures), for Canada, for 1986 to 2003. In 2003, the rate of young persons charged was 3,760 per 100,000 youth population.19 This is a drop of 1,440, or 28%, from the average annual rate during 1986-2002, under the Young Offenders Act. It is a drop of 733 per 100,000, or 16%, from the rate in 2002.20 To put it differently: in 2003, approximately one out of six young people apprehended in Canada was not charged, who would have been charged if police had continued to use the same charging practices as in 2002. Figure 1. Rates of young persons charged and not charged (extrajudicial measures),
Canada, 1986-2003
0
1,000
2,000
3,000
4,000
5,000
6,000
7,000
1986 1987 1988 1989 1990 1991 1992 1993 1994 1995 1996 1997 1998 1999 2000 2001 2002 2003
Rat
e pe
r 100
,000
you
th p
opul
atio
n
Charged Not charged (extrajudicial measures)
Source: Uniform Crime Reporting Survey, Canadian Centre for Justice Statistics. See Appendix Table A.1. The data shown above for 2003 understate the impact of the new Act, because they include three months (January to March) when the YOA was in force. In Figure 2, the youth charge rates for
18 Or recommended for charging in British Columbia and parts of Quebec (see footnote 10 above). 19 All numbers cited in the text are taken from the Appendix Tables. 20 The drop in charging in 2003 is 17% if Toronto is omitted from the data (see Section 2.3 above for the reason for omitting Toronto).

Impact of the YCJA on Police Charging Practices with Young Persons
15
2001 to 2003 are compared by quarter.21 As expected, there is very little difference between the rates in the first quarter of each year, but a large drop (20%) in the charge rate in the last three quarters of 2003, when the YCJA was in effect, compared with the same period in 2002.22 Figure 2. Rates of young persons charged, by quarter, Canada, 2001-2003
2001
20012001
2001
2002
20022002
2002
2003
2003 20032003
0
500
1,000
1,500
2,000
2,500
3,000
3,500
4,000
4,500
5,000
5,500
January-March April-June July-September October-December
Ann
ualiz
ed ra
te p
r 100
,000
you
th p
opul
atio
n
Note: The quarterly rates are annualized by multiplying by 4. Source: Uniform Crime Reporting Survey, Canadian Centre for Justice Statistics. See Appendix Table A.4. Before attributing this drop in the charging of young persons to a change in police practices due to the Youth Criminal Justice Act, alternative explanations should be considered. One possibility is that this drop was simply the continuation of a downward trend in charging which predated the YCJA. Figures 1 and 2 show that this is not the case. Although the rate of charging declined from 1991 to 1999, by an annual average of 250 per 100,000, this trend ended in 1999, when the rate of charging stabilized at 4,500 per 100,000, and remained at approximately that level through 2002 (Figure 1). Although there was a small decrease in 2002, the drop in 2003 was much larger and happened suddenly in the second quarter (Figure 2). Another possible explanation would be that other events than the coming into force of the YCJA were responsible for the drop in police charging. Again, Figure 2 is strong evidence against this rival explanation. The drop clearly occurred in the second quarter of 2003, just when the YCJA
21 Youth population estimates as of July 1 of each year were used to calculate annualized rates per 100,000 for each quarter of the year. Since the population changes slightly during the year, this procedure may have resulted in very slight under- or over-estimates of the rates for a given quarter, but these possible over- or under-estimates would be consistent over corresponding quarters for the three years and therefore would have no effect on the comparisons across the three years. 22 The drop in charging in the last three quarters of 2003 is 21% if Toronto is omitted from the data (see Section 2.3 above).

Impact of the YCJA on Police Charging Practices with Young Persons
16
came into force, and persisted through the third and last quarters of 2003. We are not aware of any other event occurring in the second quarter of 2003 which could explain such a marked change in police charging practices. Another possible explanation for the drop in 2003 in the rate of young persons charged is that it simply reflects a drop in youth crime: that is, in the rate of young persons apprehended by police for alleged offences. Thus, the drop in the charge rate would reflect not a change in police charging practices, but a change in young persons’ criminal behaviour.23 This explanation is also not consistent with the evidence presented in Figure 1. The decrease in the rate of youth charged was mirrored by an increase in youth who were not charged, so that the total number of chargeable youth – that is, the police-reported youth crime rate – did not decrease. In fact, it increased slightly to 8,232 per 100,000, which is almost exactly the same as the average rate during 1986 to 2002 (Figure 3). Figure 3. Rate of chargeable young persons, Canada, 1986-2003
0
1,000
2,000
3,000
4,000
5,000
6,000
7,000
8,000
9,000
10,000
1986 1987 1988 1989 1990 1991 1992 1993 1994 1995 1996 1997 1998 1999 2000 2001 2002 2003
Rat
e pe
r 100
,000
you
th p
opul
atio
n
Source: Uniform Crime Reporting Survey, Canadian Centre for Justice Statistics. See Appendix Table A.1.
While the rate of youth charged decreased substantially from 2002 to 2003, the rate of youth who were chargeable but not charged (i.e. who were dealt with by extrajudicial measures) increased substantially, from 3,467 to 4,473 per 100,000 in 2003 (Figure 1). The number of chargeable youth who were dealt with by extrajudicial measures in 2003 exceeded the number charged, for the first time since these data have been reported by the UCR Survey (Figure 1).24 In Figure 4, the rates of youth receiving extrajudicial measures for 2001 to 2003 are compared by quarter. 23 Or the success of the police in detecting crime and identifying young offenders. 24 Data on youth charged and not charged have been collected by the UCR Survey since 1977; for the years prior to 1986, see Carrington, 1999.

Impact of the YCJA on Police Charging Practices with Young Persons
17
There is an increase of 16% in the first quarter of 2003, perhaps in anticipation of the new Act, but a much larger increase (32%) in the use of extrajudicial measures in the last three quarters of 2003, when the YCJA was in effect, compared with the same period in 2002.25 Figure 4. Rates of young persons dealt with by extrajudicial measures, by quarter,
Canada, 2001-2003
2001
2001
2001
2001
2002
2002
2002
2002
2003
2003
20032003
0
500
1,000
1,500
2,000
2,500
3,000
3,500
4,000
4,500
5,000
5,500
January-March April-June July-September October-December
Ann
ualiz
ed ra
te p
er 1
00,0
00 y
outh
pop
ulat
ion
Note: The quarterly rates are annualized by multiplying by 4. Source: Uniform Crime Reporting Survey, Canadian Centre for Justice Statistics. See Appendix Table A.4. The change in 2003 in the relative use of charging and extrajudicial measures is shown in a different way in Figure 5 (below). The proportion of chargeable youth who were charged dropped to 46% in 2003, from an average of 63% during 1986 to 2002, and from 56% in 2002. Taking the lower figure of 56% for 2002 as the baseline, the figure of 46% for 2003 represents an absolute drop of 10%, and a relative drop of 19% in this indicator of police charging practices. The change from 2002 to 2003 is even more pronounced if it is broken down by quarter (Figure 6, below). Although there was a small decrease (4%) in the first quarter of 2003 compared with the first quarter of 2002, the decrease in the proportion charged was much greater in the last three quarters: 15%, 13%, and 10% respectively, for an overall decrease in the last three quarters of 13%. On a base proportion charged of 56% in the last three quarters of 2002, this absolute drop of 13% in the last three quarters of 2003 represents a relative decrease of 23%.
25 The increase in the rate of youth receiving extrajudicial measures in the last three quarters of 2003 is also 32% if Toronto is omitted from the data (see Section 2.3 above).

Impact of the YCJA on Police Charging Practices with Young Persons
18
Figure 5. Proportion of chargeable young persons who were charged, Canada, 1986-2003
46%
0%
10%
20%
30%
40%
50%
60%
70%
80%
90%
100%
1986 1987 1988 1989 1990 1991 1992 1993 1994 1995 1996 1997 1998 1999 2000 2001 2002 2003
Charged
Not charged
63%
Source: Uniform Crime Reporting Survey, Canadian Centre for Justice Statistics. See Appendix Table A.2. Figure 6. Proportion of chargeable young persons who were charged, by quarter,
Canada, 2001-2003
20012001
2001 200120022002
200220022003
20032003 2003
0%
10%
20%
30%
40%
50%
60%
70%
80%
90%
100%
2002 2002 2002 2003
Source: Uniform Crime Reporting Survey, Canadian Centre for Justice Statistics. See Appendix Table A.5.

Impact of the YCJA on Police Charging Practices with Young Persons
19
3.2 No evidence of increased youth crime or net-widening at the national level The data presented in Figures 1 and 2 also bear on two possible unintended consequences of the YCJA: an increase in youth crime, and net-widening. For years after the Young Offenders Act came into force, many commentators argued that it had caused an increase in youth crime, because young persons considered the Act to lack meaningful consequences.26 If the provisions of the YCJA are also an inducement to increased youth crime, this should be reflected in an increase in the rate of young persons apprehended by police and recorded as chargeable. However, this hypothesized effect might become evident rather gradually, as news about the supposed nature of the YCJA “got out on the street”, rather than being noticeable immediately in youth crime statistics for 2003. Alternatively, an increase in the recorded number of chargeable young persons might be evidence of net-widening. That is the phenomenon in which the introduction of new informal criminal justice measures, which are intended to reduce the number of offenders subjected to formal treatment, has the unintended effect of increasing the number of offenders drawn into the system and subjected to informal measures. In relation to the provisions of the YCJA concerning charging, net-widening would have occurred if, as a result of the YCJA, any increase in the rate of young persons apprehended and dealt with by extrajudicial measures exceeded any decrease in the rate of young persons charged, resulting in an increase in the total rate of young persons apprehended by police. A weaker form of net-widening would have occurred if the YCJA resulted in police using more formal extrajudicial measures than they would have used under the YOA: e.g. an officer using a verbal warning where previously s/he would have taken no further action, or a formal caution in a case which s/he would previously handled with a verbal warning. An even weaker form of net-widening, which might nevertheless have consequences in the future, would have occurred if the provisions of the YCJA resulted in improved recording by police forces of their use of extrajudicial measures with chargeable youth. When police are deciding whether to charge or deal with a youth informally, they take into account his or her record on the police Records Management System (RMS) of previous apprehensions, whether or not they resulted in a charge or a conviction (Carrington and Schulenberg, 2004a, 2004c; Schulenberg, 2004). Thus, improved recording on the RMS of informally resolved apprehensions could result in increased levels of charging in future apprehensions. If the YCJA resulted in an increased level of youth crime in 2003, this would be reflected, other things being equal, in a higher level of apprehensions of young persons, and therefore a higher recorded rate of chargeable young persons. An increased level of recorded chargeable youth could equally reflect net-widening, if police began to apprehend more young people although no more were committing crimes, or could reflect improved recording of apprehensions in which extrajudicial measures were used, although there was no increase in actual apprehensions. It is extremely difficult to distinguish to what extent each of these three phenomena is contributing to a change in the recorded rate of chargeable youth. The available data do not address the fourth dimension of possible net-widening - increases in the level of formality of informal action (e.g. a
26 These commentators were not deterred by the fact that there was practically no increase in recorded youth crime during the period when the Young Offenders Act was in force (Carrington and Moyer, 1994; Carrington, 1999).

Impact of the YCJA on Police Charging Practices with Young Persons
20
move from verbal warnings to formal cautions) - since the data do not distinguish among the types of extrajudicial measures applied by police.27 It is difficult even to draw definite conclusions from UCR data about the rate of actual youth crime or the numbers of young persons to whom extrajudicial measures were applied by police (or, equivalently, who were “not charged”, prior to the YCJA). Changes in reported annual rates of chargeable young persons do not necessarily mirror changes in levels of actual youth crime, because only a small proportion of youth crimes are reflected in UCR statistics.28 Therefore, even small annual fluctuations in this proportion could result in noticeable changes in youth crime statistics which were unrelated to changes in actual youth crime. For example, increased reporting of crime to the police by the public, perhaps because of a decreased public tolerance for minor youth crime, would produce an increase in the recorded youth crime rate (rate of chargeable young persons). So would improvements in the ability of police to clear, or “solve”, reported crime. Similarly, young persons to whom extrajudicial measures are applied by police are not always reported to the police service’s Record Management System (RMS), hence to the UCR Survey, so changes in the rate of “youth not charged” may reflect changes in reporting rather than changes in actual police charging practices. In many cases, the question of whether a young person who is not charged is “chargeable” according to law and/or the definition used by the UCR Survey, and therefore properly reportable to the Survey, is not entirely clear. In other cases, the reporting policy of the police service or the capabilities of the police service’s RMS may mitigate against reporting of youth who are chargeable but not charged. Thus, changes in reported rates of chargeable youth may reflect changes in reporting practices at the level of the police information system, rather than behavioural changes at the level of the individual officer. Improvements in the recording and reporting by police of youth receiving extrajudicial measures were especially likely in 2003, since the requirements for reporting extrajudicial measures to the UCR2 Survey were expanded and clarified, because of the YCJA.29 There is a prima facie suggestion in Figures 1 and 3 of a very small amount of net-widening and/or increased youth crime in 2003, since the increase in 2003 in the rate of youth receiving extrajudicial measures was larger by 273 per 100,000 than the decrease in youth charged. This accounts for the 3.4% increase in the rate of chargeable youth (Figure 3). However, in view of the considerations discussed in the preceding paragraphs, we believe that the data provide no evidence of an national increase in 2003 in youth crime or of police net-widening, other than possibly some improvement in police reporting of youth receiving extrajudicial measures. The rate of chargeable young persons in 2003 was 8,232 per 100,000, which is practically the same as the average rate of 8,200 during 1986 to 2002. The increase of 3.4% over the figure for 2002 is well within the range of annual fluctuations during 1986 to 2002: the average annual change in the chargeable rate (whether increase or decrease) during that period was 3.8%. Thus, the increase in 2003 of 3.4% may be simply a random annual fluctuation rather than a meaningful change. Furthermore, there has been a small upward trend in the rate of recorded chargeable 27 See Section 2.1 above. 28 Although precise data are not available, victimization surveys suggest that fewer than 50% of crimes with victims are reported to the police; the proportion of victimless crimes reported is probably much lower. Of crimes reported to police, fewer than 50% are cleared, i.e. one or more perpetrators are identified and sufficient evidence is available that the offender(s) are chargeable. Thus, substantially fewer than 25% of young offenders are recorded in the UCR statistics (Frank and Carrington, 2003). 29 See Section 2.1 above.

Impact of the YCJA on Police Charging Practices with Young Persons
21
youth since 1999, with changes of +8.2%, +4.3%, and -1.8% in 2000, 2001, and 2002 respectively (see Figure 3). These increases in recorded youth crime are very unlikely to be due to the YCJA, since they predate its coming into effect by up to 3 years. Even if the small increase in chargeable youth in 2003 is not a random annual fluctuation or the continuation of a pre-existing trend, there are more plausible explanations than an increase in actual youth crime, or net-widening. In our view, part of the explanation lies in a temporary drop in 2002 in recorded youth crime in Quebec. The other part, we believe, is the improvement hypothesized above in the recording of young persons receiving extrajudicial measures in some police services’ Record Management Systems. In 2003, the number of recorded chargeable youth in Canada increased by 8,013 persons,30 over 2002. An increase of 2,469 chargeable young persons was reported by police services in Quebec, and represents a return to the level reported by police in Quebec during 1991 to 2001 (see Figure A.5f in the Appendix). In other words, the “increase” in 2003 in recorded numbers of chargeable youth in Quebec was due to a temporary drop in 2002. Although we have no definite evidence, we would speculate that this temporary drop in 2002 was due to the extensive reorganization of policing which took place in Quebec in 2002: many police services were merged or ceased to exist, and responsibility for policing many small jurisdictions passed to the Sûreté du Québec (see Ministère de la Sécurité publique du Québec, 2002a, 2002b). An additional increase in 2003 of 8,912 chargeable youth was reported by a group of police services in Ontario which all use a particular RMS. Prior to 2003, users of this RMS reported very low rates of chargeable youth who were not charged – in the range of 13% to 17%, compared to about 30% for Ontario as a whole. Suddenly, in 2003, the number of youth not charged reported by these particular police services increased by a total of 8,912 persons, bringing their reported use of extrajudicial measures (47% of chargeable youth) into the same range as that of other police services in Ontario in 2003 (49% of chargeable youth). It is highly improbable that these increases in reported chargeable youth represent an increase in actual youth crime, or youths apprehended, or the actual use of extrajudicial measures, when they occurred only in certain Ontario police services whose only common factor was the type of RMS, and whose jurisdictions were interspersed geographically among those of other police services which did not report such changes. A much more plausible explanation is an improvement in data capture for youth receiving extrajudicial measures, due to modifications in the RMS - possibly resulting from the enhanced reporting requirements of the UCR2 Survey arising from the implementation of the YCJA. Thus, the small increase in the national rate of chargeable youth in 2003 can be accounted for by technical reporting factors, rather than any substantive change in the level of youth crime or the charging practices of police.31 This is not to say that police charging practices did not change in response to the YCJA. On the contrary, there was a dramatic change: an decrease of 16% in the
30 This is the actual number, not the per capita rate. 31 While this statement is true at the national level, it appears that there may have been increases in 2003 in the level of youth crime and/or net-widening by police in certain provinces and territories (see Table 1, below). However, the populations of these provinces/territories are so small relative to that of Canada that they have little impact on the aggregate national picture.

Impact of the YCJA on Police Charging Practices with Young Persons
22
per capita rate of youth charged, and a corresponding increase in the rate of youth receiving extrajudicial measures. But the analysis above strongly supports the view that - once technical factors are taken into account - the increase in 2003 in the number of youth receiving extrajudicial measures did not differ appreciably from the decrease in the number of youth charged.
3.3 Substantial interprovincial/territorial variations in charging in 2003 As expected, there was considerable variation among the provinces and territories32 in the annual levels of recorded youth crime and of young persons charged. There was also considerable interprovincial/territorial variation in the changes in these indicators which occurred in 2003. In Table 1 (below), the provinces and territories are classified into three groups: those in which it appears that the YCJA has had the expected effect on police charging; those in which the evidence is equivocal; and those in which the YCJA does not appear to have had the expected effect.
32 Although Nunavut came into existence as a separate territory in 1999, it is combined in this report with the Northwest Territories for analyses of the period 1986 to 2003, in order to maintain a consistent time series from 1986.

Impact of the YCJA on Police Charging Practices with Young Persons
23
Table 1. Changes from 2002 to 2003 in annual rates and proportions of young persons charged, Canada and provinces/territories
Change
in rate charged
Change in %
charged
Change in rate
chargeable
Conclusion
Canada - 16% - 19% + 3% Large reduction in charging
Provinces/territories in which the expected changes occurred
Yukon - 49% - 41% - 13% Very large reduction in charging
Manitoba - 24% - 22% - 3% Large reduction in charging
Ontario - 23% - 27% + 5% Large reduction in charging
New Brunswick - 17% - 14% - 5% Large reduction in charging
Alberta - 12% - 11% - 1% Reduction in charging
Nova Scotia - 11% - 21% + 12% Reduction in charging
British Columbia
- 20% - 17% - 4% Large reduction in charging; may be partly due to a pre-existing trend
Provinces in which the evidence is equivocal Prince Edward Island
- 30% - 44% + 24% Large reduction in charging; may be due to a pre-existing trend; evidence of increased youth crime or increased use or recording of extrajudicial measures.
Newfoundland and Labrador
- 8% - 21% + 16% Small reduction in charging; may be due to a pre-existing trend; evidence of increased youth crime or increased use or recording of extrajudicial measures.
Quebec - 4% - 11% + 8% Very small reduction in charging; may be due to a pre-existing trend
Provinces/territories in which there is no evidence of the expected changes
Saskatchewan - - 12% + 14% No change in charging; evidence of increased use or recording of extrajudicial measures.
Northwest Territories (including Nunavut)
+ 5% - 11% + 19% Increase in charging; evidence of increased youth crime or increased recording of extrajudicial measures.
Source: Appendix, Tables A.1 and A.2

Impact of the YCJA on Police Charging Practices with Young Persons
24
Ontario is a good example of a province in which the changes in 2003 in the indicators of police charging practices with young persons are consistent with expectations based on the legislation. The rate of young persons charged in Ontario decreased by 1,056 in 2003 to 3,500 per 100,000: a drop of 23% from the level in 2002 and of 33% from the average level during 1986 to 2002 (Figure 7).33 Figure 7. Rates of young persons charged and not charged (extrajudicial measures),
Ontario, 1986-2003
0
1,000
2,000
3,000
4,000
5,000
6,000
7,000
1986 1987 1988 1989 1990 1991 1992 1993 1994 1995 1996 1997 1998 1999 2000 2001 2002 2003
Rat
e pe
r 100
,000
you
th p
opul
atio
n
Charged Not charged (extrajudicial measures) Source: Uniform Crime Reporting Survey, Canadian Centre for Justice Statistics. See Appendix Table A.1. The decrease in charging from 2002 to 2003 is even more pronounced if it is broken down by quarter (Figure 8, below). Although there was a small decrease (6%) in the first quarter of 2003 compared with the first quarter of 2002, the decrease from 2002 to 2003 was much greater in the last three quarters: 32%, 30%, and 23% respectively, for an overall decrease in the last three quarters of 28%.34
33 When Toronto is omitted from the data, the decreases in 2003 in charging in Ontario are 26% from 2002 and 33% from the average level for 1986-2002 (see Section 2.3 above for the reason for omitting Toronto). 34 When Toronto is omitted, the decreases in charging in Ontario in the last three quarters of 2003, compared with the corresponding quarters of 2002, are 34%, 33%, and 27% respectively, resulting in an overall decrease in the last three quarters of 2003 of 31%.

Impact of the YCJA on Police Charging Practices with Young Persons
25
Figure 8. Rates of young persons charged, by quarter, Ontario, 2001-2003
2001
2001
2001
2001
2002
2002
20022002
2003
20032003
2003
0
500
1,000
1,500
2,000
2,500
3,000
3,500
4,000
4,500
5,000
5,500
January-March April-June July-September October-December
Ann
ualiz
ed ra
te p
er 1
00,0
00 y
outh
pop
ulat
ion
Note: The quarterly rates are annualized by multiplying by 4. Source: Uniform Crime Reporting Survey, Canadian Centre for Justice Statistics. See Appendix Table A.4. The rate of young persons in Ontario who were dealt with by extrajudicial measures increased in 2003 by 1,389 per 100,000, which was greater than the decrease of 1,056 in the rate of youth charged. As with the decrease in charging in 2003, the increase in the recorded use of extrajudicial measures becomes clearer if it is examined separately by quarter (Figure 9, below). Compared with the corresponding quarter of 2002, there was a small increase in the use of extrajudicial measures in the first quarter of 2003, then extremely large increases in the last three quarters: 93%, 77%, and 71% respectively, for an overall increase of 80% during the last three quarters.35
35 If Toronto is excluded from the Ontario data, the quarterly increases are 89%, 75%, and 75%, with an overall increase in the last three quarters of 2003 of 80%.

Impact of the YCJA on Police Charging Practices with Young Persons
26
Figure 9. Rates of young persons dealt with by extrajudicial measures, by quarter, Ontario, 2001-2003
2001
2001
2001
2001
2002
2002
2002
20022003
2003
2003
2003
0
500
1,000
1,500
2,000
2,500
3,000
3,500
4,000
4,500
January-March April-June July-September October-December
Ann
ualiz
ed ra
te p
er 1
00,0
00 y
outh
pop
ulat
ion
Note: The quarterly rates are annualized by multiplying by 4. Source: Uniform Crime Reporting Survey, Canadian Centre for Justice Statistics. See Appendix Table A.4. The proportion of chargeable young persons who were charged in Ontario in 2003 was 51%, which represents an absolute drop of 19% and a relative drop of 27% from the level in 2002 (Figure 10, below).36 Although there was a small decrease (8%) in the proportion charged in the first quarter of 2003, much larger decreases occurred in the final three quarters, when the YCJA was in force: 25%, 22%, and 19% respectively, for an overall decrease of 22% in the last three quarters of 2003, or 32% relative to the level in 2002 (Figure 11, below).37
36 The absolute and relative decreases are 20% and 30% respectively, if Toronto is omitted from the Ontario data (see Section 2.3 above). 37 The absolute and relative decreases in the last three quarters of 2003 are 23% and 35% if Toronto is omitted from the Ontario data.

Impact of the YCJA on Police Charging Practices with Young Persons
27
Figure 10. Proportion of chargeable young persons who were charged, Ontario, 1986-2003
51%
0%
10%
20%
30%
40%
50%
60%
70%
80%
90%
100%
1986 1987 1988 1989 1990 1991 1992 1993 1994 1995 1996 1997 1998 1999 2000 2001 2002 2003
66%
Source: Uniform Crime Reporting Survey, Canadian Centre for Justice Statistics. See Appendix Table A.2. Figure 11. Proportion of chargeable young persons who were charged, by quarter,
Ontario, 2001-2003
20012001
200120012002
2002 20022002
2003
20032003 2003
0%
10%
20%
30%
40%
50%
60%
70%
80%
90%
100%
January-March April-June July-September October-December
Source: Uniform Crime Reporting Survey, Canadian Centre for Justice Statistics. See Appendix Table A.5.

Impact of the YCJA on Police Charging Practices with Young Persons
28
The total rate of chargeable young persons in Ontario was 6,860 per 100,000 in 2003, which is well below the average rate of 7,910 for the period 1986 to 2002, but 5%, higher than the average rate of 6,550 for the period of 1999 to 2002 (Figure 12).38 The evidence suggests that this increase was mainly or entirely the result of improvements in police reporting of youth dealt with by extrajudicial measures, rather than representing an increase in youth crime or net-widening by the police (see Section 3.2 above). Figure 12. Rates of chargeable young persons, Ontario, 1986-2003
0
1,000
2,000
3,000
4,000
5,000
6,000
7,000
8,000
9,000
10,000
1986 1987 1988 1989 1990 1991 1992 1993 1994 1995 1996 1997 1998 1999 2000 2001 2002 2003
Rat
e pe
r 100
,000
you
th p
opul
atio
n
Source: Uniform Crime Reporting Survey, Canadian Centre for Justice Statistics. See Appendix Table A.3. In summary, it appears that the YCJA caused a large reduction – approximately 23% - in 2003 in the rate of young persons charged in Ontario, and a corresponding increase in the rate of youth dealt with by extrajudicial measures. The proportion of chargeable young persons who were charged dropped by 27% relative to the level in 2002. These numbers understate the impact of the YCJA because they include the first quarter of 2003, when the YOA was still in force. Similar changes, of varying magnitudes, occurred in the Yukon, Manitoba, New Brunswick,39 and Alberta.40 38 The increase is 5% if Toronto is omitted from the data (see Section 2.3 above). 39 New Brunswick (like Quebec and British Columbia) is a “Crown screening” province, in which the decision whether to lay charges against young persons is made by the Crown, after receiving a recommendation to charge from the police. In New Brunswick (and parts of Quebec; see below), if the Crown decides there is insufficient evidence to proceed with a charge, the police revise their records to take into account the recommendation of the Crown (Canadian Centre for Justice Statistics, 2004: 79). Therefore, data on rates of youth charged and not charged in New Brunswick reflect decision-making by both the police and the Crown. 40 See Table 1 (above) and Figures A.10, A.6, A.4, and A.8 in the Appendix. Note that the scales differ in these charts, in order to accommodate differing levels of chargeable youth.

Impact of the YCJA on Police Charging Practices with Young Persons
29
In Nova Scotia, the rate of charging of young persons was 11% lower in 2003 than in 2002 (Appendix, Figure A.3a). This suggests the expected impact of the YCJA, although the drop in charging was evident only in the last two quarters of 2003 (Figure A.3b). The recorded rate of use of extrajudicial measures was 32% higher in 2003 than in 2002 (Figure A.3a), and this increase occurred only in the last three quarters (Figure A.3c). The proportion of chargeable youth who were charged dropped by 21% in 2003, and this drop was concentrated in the last three quarters (Figures A.3d and A.3e). The recorded rate of chargeable young persons was 12% higher in 2003 than in 2002 (Figure A.3f). This increase in the rate of chargeable youth appears to be a continuation of a trend which began in 2000, and is therefore unlikely to be related to the YCJA. This four-year rising trend could be due to any or all of the following: increased levels of youth crime, increased success of the police in detecting youth crime and apprehending young offenders, increased use by the police of alternatives to charging, and/or increased reporting of the use of alternatives. We were not able to distinguish among these possibilities with the available data. In British Columbia, the rate of youth charged was 20% lower in 2003 than in 2002, but the rate of charging young persons has been decreasing in that province since 1991 (Appendix, Figure A.9a).41 The average annual decrease in the charge rate from 1991 to 2002 was 364 per 100,000, whereas the decrease from 2002 to 2003 was twice as large: 721 per 100,000. Therefore, it appears that approximately half of the decrease in 2003 can be attributed to the impact of the YCJA on police practices with respect to recommendations to charge and the use of extrajudicial measures. The impact of the YCJA, versus the secular downward trend in charging, can be seen clearly when the annual rates of charging are disaggregated by quarter (Figures A.9b and A.9e). The decreases in charging are much greater in the last three quarters than in the first quarter. In 2002, British Columbia had the lowest proportion of chargeable youth who were charged (37%)42 of any province or territory in Canada; nevertheless, this decreased by a further 17% to the very low figure of 31% in 2003 (Figure A.9d). The drop was concentrated in the last three quarters of 2003, strongly suggesting the impact of the YCJA (Figure A.9e). In Prince Edward Island and Newfoundland and Labrador, the rate of young persons charged in 2003 was lower than in 2002, but in both provinces, the rate of charging had been decreasing since 2001; therefore it is unclear to what extent the decreases in 2003 were due to the provisions of the YCJA, rather than being continuations of pre-existing trends.43 The proportions of chargeable young persons who were charged decreased much more in both provinces in 2003 than in previous years (Figures A.1d and A.2d), but these decreases reflect very large increases in 2003 in the recorded numbers of youth receiving extrajudicial measures,44 rather than substantial decreases in charging. As a result, the number of youth recorded as chargeable in these two provinces increased substantially (by 16% in Newfoundland, and 24% in P.E.I.; see
41 Although British Columbia is a Crown screening province, police do not revise the data which they submit to the UCR Survey to reflect charging decisions by the Crown; thus, the UCR “charged” data for British Columbia reflect police recommendations to charge rather than young persons actually charged (Canadian Centre for Justice Statistics, 2004: 79). 42 The proportion of chargeable youth who were charged (actually, recommended for charging) in British Columbia was also the lowest, on average, of any province or territory from 1986 to 2001. See Table A.2 in the Appendix. 43 See Figures A.1 and A.2 in the Appendix. 44 Compared to 2002, the rates of youth dealt with by extrajudicial measures increased by 54% in Newfoundland and by 72% in P.E.I.; see Figures A.1a and A.2a in the Appendix.

Impact of the YCJA on Police Charging Practices with Young Persons
30
Figures A.1f and A.2f and Table A.1). These findings suggest any or all of the following: increased levels of youth crime, increased success of the police in detecting youth crime and apprehending young persons, increased use by the police of alternatives to charging, and/or increased reporting of the use of alternatives. We were not able to distinguish among these possibilities with the available data. Looking at the breakdowns by quarter does not clarify the situation in these two provinces. In Prince Edward Island, the decreases in the rate of youth charged were much greater in the last three quarters of 2003 than in the first, but this does not necessarily indicate the impact of the YCJA, since it was also true in 2002 (Figure A.2b). The decreases in the proportion of chargeable youth who were charged were much larger in the last three quarters of 2003 (Figure A.2e), but this was due primarily to the increases in the numbers of youth receiving extrajudicial measures (Figure A.2c), rather than decreases in charging. In Newfoundland and Labrador, there were substantial decreases in charging in the second and fourth (but not the third) quarters of 2003, but this was also true in 2002 (Figure A.1b). As in P.E.I., the substantial drops in the last three quarters of 2003 in Newfoundland and Labrador in the proportion of chargeable youth who were charged (Figure A.1e) were due more to increased recorded use of extrajudicial measures (Figure A.1c) than to decreases in charging. In Quebec, the rate of youth charged or recommended by police to be charged45 has been declining since 1991; thus, the small decrease (4%) in 2003 is not necessarily a result of the coming into force of the YCJA (Figure A.5a). The 11% decrease in 2003 in the proportion of chargeable youth who were charged (Figure A.5e) reflects the 18% increase in the recorded use of extrajudicial measures (Figure A.5a), and a corresponding increase (of 8%) in the total rate of chargeable youth (Figure A.5f), more than a decrease in charging. The breakdowns by quarter show a substantial drop in the rate and proportion of youth charged (Figures A.5b and A.5e), and a corresponding increase in the recorded use of extrajudicial measures (Figure A.5c) only in the second quarter of 2003. The overall conclusion is that the YCJA has had little or no impact on police (and Crown) charging practices in Quebec: there was a small (4%) decrease in 2003 in the rate of youth charged or recommended to be charged in Quebec, but it is possible that it was simply the continuation of a pre-existing downward trend. In Saskatchewan, the rate of young persons charged in 2003 was unchanged from 2002, and higher than in all but one year since 1986 (Appendix, Figure A.7a). The recorded rate of young persons receiving extrajudicial measures increased in 2003 by 38% over 2002 (Figure A.7a) and the overall rate of chargeable youth increased by 14%, to an all-time high of 21,040 per 100,000 (Figure A.7f). The result of these changes in rates is that the proportion of chargeable young persons who were charged dropped from 64% in 2002 to 56% in 2003 (Figure A.7d). Since the increase in the recorded use of extrajudicial measures was concentrated in the last three quarters of 2003 (Figure A.7c), it is very likely to be the result of the coming into force of the YCJA and not the continuation of a pre-existing trend. Given the suddenness of the change, it is unlikely to reflect an increase in the level of actual youth crime – we cannot believe that potential young 45 Like New Brunswick and British Columbia, Quebec is a “Crown screening” province, in which a charge is not laid against a young person unless the police recommendation to charge has been approved by a Crown. Police services in Quebec vary in the way they report recommendations to charge which are not accepted by the Crown: the Sûrete du Québec (like police in New Brunswick) does not include rejected recommendations to charge in the numbers of youth charged reported to the UCR, but the other police services in Quebec do include these (like police services in British Columbia). Thus, UCR data on youth charged in Quebec reflect decision-making by both police and Crown (Canadian Centre for Justice Statistics, 2004: 79).

Impact of the YCJA on Police Charging Practices with Young Persons
31
offenders would have reacted so quickly to this change in legislation. However, we cannot tell from these data to what extent this increase in the recorded use of extrajudicial measures in Saskatchewan reflects an increase in the actual use by police extrajudicial measures (i.e. net-widening), or in the recording of the use of extrajudicial measures. In the Northwest Territories (including Nunavut), unlike every other jurisdiction in Canada, the rate of young persons charged increased in 2003, as did the rates of youth receiving extrajudicial measures and the overall rate of chargeable youth (Figures A.11a and A.11f). Both of these increases appear to be the continuation of trends beginning in 2001. Since the rate of chargeable young persons has been increasing faster than the rate of young persons charged, the proportion of chargeable young persons who were charged has been decreasing since 2001 (Figure A.11d). Although there was a decrease in the second quarter of 2003 in rate and proportion of young persons charged, there was none in the third and fourth quarters (Figures A.11b and A.11e). In general, any changes occurring in 2003 appear to be simply continuations of pre-existing trends which predate the coming into force of YCJA, and there is no evidence from these data that the YCJA has had an impact on police charging practices in the Northwest Territories.
3.3 Substantial reductions in charging in incidents involving less serious
offences; small reductions in incidents involving more serious offences Table 2 summarizes the changes in 2003 in the per capita rates of young persons charged and chargeable in incidents involving different types of offences. In general, the results are as one would expect from the provisions of the YCJA: substantial reductions in charging in incidents involving less serious offences, and small reductions in charging in incidents involving more serious offences. Contrary to expectations, there was only a very small reduction in charging in incidents involving offences against the administration of justice; that is, bail violations (including failure to appear for court), and violations of probation conditions. In this section, we examine trends in charging for each major category of offence separately. In the UCR Survey, youth who are apprehended or charged are classified under the most serious alleged offence in the incident. For example, a youth who was apprehended or charged in connection with an incident allegedly involving a break and enter and a violation of a probation condition would be counted in the UCR Survey only under the more serious offence of break and enter. Thus, the data understate the rates of youth involved in less serious offences. However, this does not affect the present analysis of changes in charging in 2003, since the understatement of rates of less serious offences is consistent over the period of years which are being analyzed.
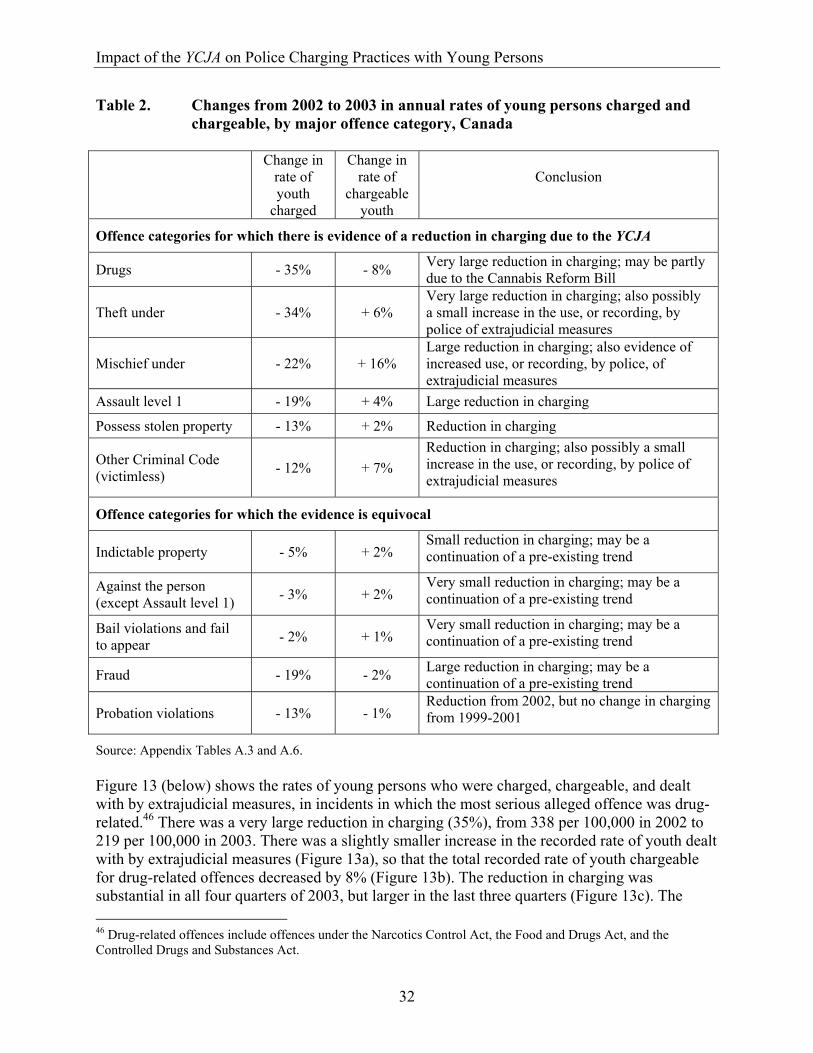
Impact of the YCJA on Police Charging Practices with Young Persons
32
Table 2. Changes from 2002 to 2003 in annual rates of young persons charged and chargeable, by major offence category, Canada
Change in
rate of youth
charged
Change in rate of
chargeable youth
Conclusion
Offence categories for which there is evidence of a reduction in charging due to the YCJA
Drugs - 35% - 8% Very large reduction in charging; may be partly due to the Cannabis Reform Bill
Theft under - 34% + 6% Very large reduction in charging; also possibly a small increase in the use, or recording, by police of extrajudicial measures
Mischief under - 22% + 16% Large reduction in charging; also evidence of increased use, or recording, by police, of extrajudicial measures
Assault level 1 - 19% + 4% Large reduction in charging
Possess stolen property - 13% + 2% Reduction in charging
Other Criminal Code (victimless) - 12% + 7%
Reduction in charging; also possibly a small increase in the use, or recording, by police of extrajudicial measures
Offence categories for which the evidence is equivocal
Indictable property - 5% + 2% Small reduction in charging; may be a continuation of a pre-existing trend
Against the person (except Assault level 1) - 3% + 2%
Very small reduction in charging; may be a continuation of a pre-existing trend
Bail violations and fail to appear - 2% + 1%
Very small reduction in charging; may be a continuation of a pre-existing trend
Fraud - 19% - 2% Large reduction in charging; may be a continuation of a pre-existing trend
Probation violations - 13% - 1% Reduction from 2002, but no change in charging from 1999-2001
Source: Appendix Tables A.3 and A.6. Figure 13 (below) shows the rates of young persons who were charged, chargeable, and dealt with by extrajudicial measures, in incidents in which the most serious alleged offence was drug-related.46 There was a very large reduction in charging (35%), from 338 per 100,000 in 2002 to 219 per 100,000 in 2003. There was a slightly smaller increase in the recorded rate of youth dealt with by extrajudicial measures (Figure 13a), so that the total recorded rate of youth chargeable for drug-related offences decreased by 8% (Figure 13b). The reduction in charging was substantial in all four quarters of 2003, but larger in the last three quarters (Figure 13c). The 46 Drug-related offences include offences under the Narcotics Control Act, the Food and Drugs Act, and the Controlled Drugs and Substances Act.

Impact of the YCJA on Police Charging Practices with Young Persons
33
increase in the recorded use of extrajudicial measures occurred only in the second and last quarters (Figure 13d).47 Figure 13. Rates of young persons charged, not charged (extrajudicial measures), and
chargeable, drug-related offences, Canada, 1986-2003 (a) Rates of youth charged and not charged (b) Rates of chargeable youth
0
50
100
150
200
250
300
350
400
450
1986 1987 1988 1989 1990 1991 1992 1993 1994 1995 1996 1997 1998 1999 2000 2001 2002 2003
Rat
e pe
r 100
,000
you
th p
opul
atio
n
Charged Not charged (extrajudicial measures)
629
0
100
200
300
400
500
600
700
1986 1987 1988 1989 1990 1991 1992 1993 1994 1995 1996 1997 1998 1999 2000 2001 2002 2003
Rat
e pe
r 100
,000
you
th p
opul
atio
n
(c) Rates of youth charged, by quarter, 2001-2003 (d) Rates of youth receiving extrajudicial measures, by quarter, 2001-2003
2001
20012001
2001
2002
2002
2002
2002
2003
2003
2003
2003
0
50
100
150
200
250
300
350
400
450
500
550
January-March April-June July-September October-December
2001
2001
2001
2001
2002
2002
2002
2002
2003
2003
2003
2003
0
50
100
150
200
250
300
350
400
450
500
550
January-March April-June July-September October-December
Source: Uniform Crime Reporting Survey, Canadian Centre for Justice Statistics. See Appendix Tables A.3 and A.6. The Cannabis Reform Bill (see Health Canada, 2003) was introduced in Parliament in May, 2003, but was not passed. According to the Canadian Centre for Justice Statistics (2004: 77), because of “uncertainty about the eventual outcome of proposed amendments, many police services have continued to count incidents of, but stopped laying charges for possession of small amounts of cannabis.” Since the introduction of the Bill occurred in the same quarter as the coming into force of the YCJA, we were unable to distinguish between the impact on police charging practices of the YCJA and that of the Bill.
47 The lower rates of youth dealt with by extrajudicial measures in the third quarter (of all three years) may be due to the summer school vacation, during which young persons are not at risk of being caught with drugs by school staff.

Impact of the YCJA on Police Charging Practices with Young Persons
34
Figure 14 shows the rates of young persons who were charged, chargeable, and dealt with by extrajudicial measures in incidents in which the most serious alleged offence was theft under.48 There was a very large reduction in charging (34%), from 739 per 100,000 in 2002 to 486 per 100,000 in 2003 (Figure 14a), which was concentrated in the last three quarters (Figure 14c). There was a slightly larger increase in the recorded rate of youth dealt with by extrajudicial measures, which was also concentrated in the last three quarters of 2003 (Figure 14d). The total recorded rate of youth chargeable for theft under increased by 6% (Figure 14b). The sudden increase in the second quarter of 2003 in the recorded rate of youth apprehended for theft under, and dealt with by extrajudicial measures (Figure 14d) is highly unlikely to be due to a sudden increase in this type of youth crime; rather, it suggests a small increase in the use, or the reporting, of extrajudicial measures. Figure 14. Rates of young persons charged, not charged (extrajudicial measures), and
chargeable, theft under, Canada, 1986-2003 (a) Rates of youth charged and not charged (b) Rates of chargeable youth
0
200
400
600
800
1,000
1,200
1,400
1,600
1,800
2,000
1986 1987 1988 1989 1990 1991 1992 1993 1994 1995 1996 1997 1998 1999 2000 2001 2002 2003
Rat
e pe
r 100
,000
you
th p
opul
atio
n
Charged Not charged (extrajudicial measures)
1,771
0
500
1,000
1,500
2,000
2,500
3,000
3,500
1986 1987 1988 1989 1990 1991 1992 1993 1994 1995 1996 1997 1998 1999 2000 2001 2002 2003
Rat
e pe
r 100
,000
you
th p
opul
atio
n
(c) Rates of youth charged, by quarter, 2001-2003 (d) Rates of youth receiving extrajudicial measures, by quarter, 2001-2003
20012001 2001
2001
20022002
2002
2002
2003
20032003
2003
0
100
200
300
400
500
600
700
800
900
1,000
1,100
1,200
1,300
1,400
1,500
1,600
January-March April-June July-September October-December
2001
2001
2001
2001
2002
2002
2002
2002
2003
2003
2003 2003
0
100
200
300
400
500
600
700
800
900
1,000
1,100
1,200
1,300
1,400
1,500
1,600
January-March April-June July-September October-December
Source: Uniform Crime Reporting Survey, Canadian Centre for Justice Statistics. See Appendix Tables A.3 and A.6.
48 The threshold value which determines whether a theft is theft under or theft over was $1,000 from 1986 to 1994, and $5,000 thereafter.

Impact of the YCJA on Police Charging Practices with Young Persons
35
Figure 15 shows the rates of young persons who were charged, chargeable, and dealt with by extrajudicial measures in incidents in which the most serious alleged offence was mischief under.49 There was a large reduction in charging (22%), from 266 per 100,000 in 2002 to 207 per 100,000 in 2003, which was concentrated in the last three quarters (Figures 15a and 15c). There was a considerably larger increase in the recorded rate of youth dealt with by extrajudicial measures (Figure 15a), also concentrated in the last three quarters (Figure 15d), so that the total recorded rate of youth chargeable for mischief under increased by 16% (Figure 15b). The sudden increase in the second quarter of 2003 in the recorded rate of youth apprehended for mischief under and dealt with by extrajudicial measures (and the sudden decrease in charging) are highly unlikely to be due to a sudden increase in this type of youth crime; rather, they suggest an increase in the use, or the reporting, of extrajudicial measures. Figure 15. Rates of young persons charged, not charged (extrajudicial measures), and
chargeable, mischief under, Canada, 1986-2003 (a) Rates of youth charged and not charged (b) Rates of chargeable youth
0
100
200
300
400
500
600
700
1986 1987 1988 1989 1990 1991 1992 1993 1994 1995 1996 1997 1998 1999 2000 2001 2002 2003
Rat
e pe
r 100
,000
you
th p
opul
atio
n
Charged Not charged (extrajudicial measures)
907
0
100
200
300
400
500
600
700
800
900
1,000
1986 1987 1988 1989 1990 1991 1992 1993 1994 1995 1996 1997 1998 1999 2000 2001 2002 2003
Rat
e pe
r 100
,000
you
th p
opul
atio
n
(c) Rates of youth charged, by quarter, 2001-2003 (d) Rates of youth receiving extrajudicial measures, by quarter, 2001-2003
2001
20012001 2001
2002
2002 2002 2002
20032003 2003
2003
0
100
200
300
400
500
600
700
800
900
January-March April-June July-September October-December
2001
2001
20012001
2002
2002 2002
2002
2003
2003
2003
2003
0
100
200
300
400
500
600
700
800
900
January-March April-June July-September October-December
Source: Uniform Crime Reporting Survey, Canadian Centre for Justice Statistics. See Appendix Tables A.3 and A.6.
49 The threshold value which determines whether mischief is mischief under or mischief over was $1,000 from 1986 to 1994, and $5,000 thereafter.
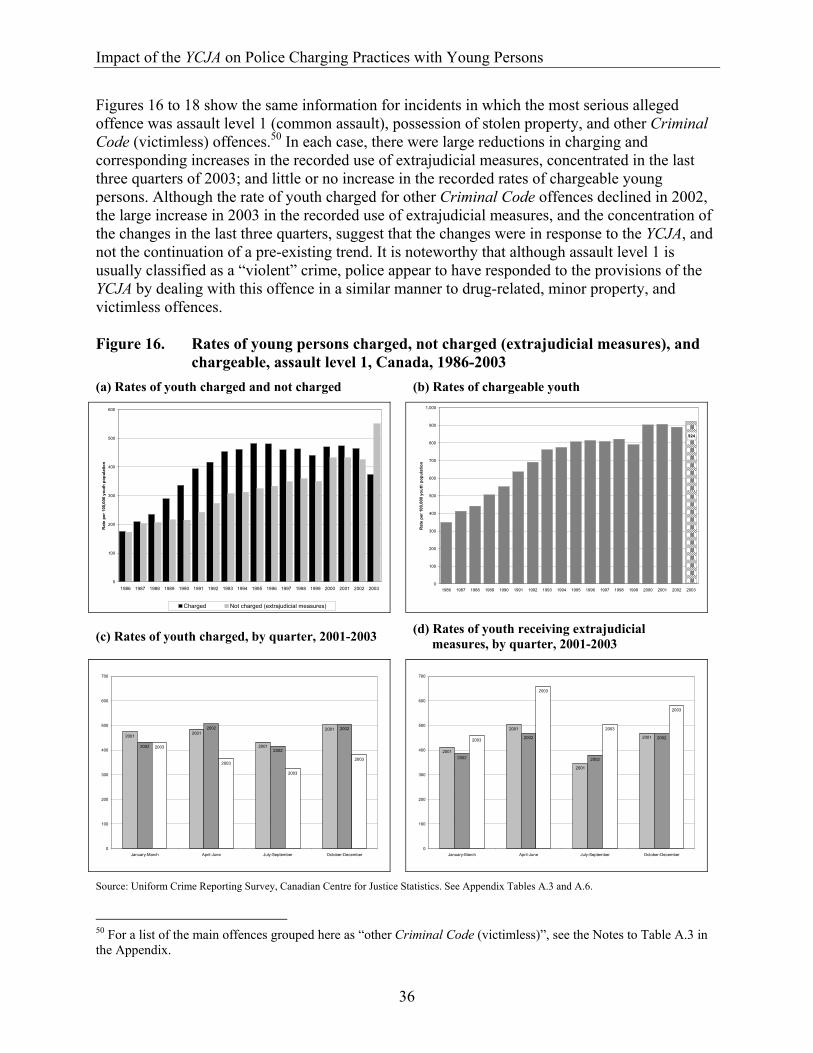
Impact of the YCJA on Police Charging Practices with Young Persons
36
Figures 16 to 18 show the same information for incidents in which the most serious alleged offence was assault level 1 (common assault), possession of stolen property, and other Criminal Code (victimless) offences.50 In each case, there were large reductions in charging and corresponding increases in the recorded use of extrajudicial measures, concentrated in the last three quarters of 2003; and little or no increase in the recorded rates of chargeable young persons. Although the rate of youth charged for other Criminal Code offences declined in 2002, the large increase in 2003 in the recorded use of extrajudicial measures, and the concentration of the changes in the last three quarters, suggest that the changes were in response to the YCJA, and not the continuation of a pre-existing trend. It is noteworthy that although assault level 1 is usually classified as a “violent” crime, police appear to have responded to the provisions of the YCJA by dealing with this offence in a similar manner to drug-related, minor property, and victimless offences. Figure 16. Rates of young persons charged, not charged (extrajudicial measures), and
chargeable, assault level 1, Canada, 1986-2003 (a) Rates of youth charged and not charged (b) Rates of chargeable youth
0
100
200
300
400
500
600
1986 1987 1988 1989 1990 1991 1992 1993 1994 1995 1996 1997 1998 1999 2000 2001 2002 2003
Rat
e pe
r 100
,000
you
th p
opul
atio
n
Charged Not charged (extrajudicial measures)
924
0
100
200
300
400
500
600
700
800
900
1,000
1986 1987 1988 1989 1990 1991 1992 1993 1994 1995 1996 1997 1998 1999 2000 2001 2002 2003
Rat
e pe
r 100
,000
you
th p
opul
atio
n
(c) Rates of youth charged, by quarter, 2001-2003 (d) Rates of youth receiving extrajudicial measures, by quarter, 2001-2003
20012001
2001
2001
2002
2002
2002
2002
2003
2003
2003
2003
0
100
200
300
400
500
600
700
January-March April-June July-September October-December
2001
2001
2001
2001
2002
2002
2002
20022003
2003
2003
2003
0
100
200
300
400
500
600
700
January-March April-June July-September October-December
Source: Uniform Crime Reporting Survey, Canadian Centre for Justice Statistics. See Appendix Tables A.3 and A.6.
50 For a list of the main offences grouped here as “other Criminal Code (victimless)”, see the Notes to Table A.3 in the Appendix.

Impact of the YCJA on Police Charging Practices with Young Persons
37
Figure 17. Rates of young persons charged, not charged (extrajudicial measures), and chargeable, possess stolen property, Canada, 1986-2003
(a) Rates of youth charged and not charged (b) Rates of chargeable youth
0
50
100
150
200
250
300
350
1986 1987 1988 1989 1990 1991 1992 1993 1994 1995 1996 1997 1998 1999 2000 2001 2002 2003
Rat
e pe
r 100
,000
you
th p
opul
atio
n
Charged Not charged (extrajudicial measures)
275
0
25
50
75
100
125
150
175
200
225
250
275
300
325
350
375
400
1986 1987 1988 1989 1990 1991 1992 1993 1994 1995 1996 1997 1998 1999 2000 2001 2002 2003
Rat
e pe
r 100
,000
you
th p
opul
atio
n(c) Rates of youth charged, by quarter, 2001-2003 (d) Rates of youth receiving extrajudicial
measures, by quarter, 2001-2003
2001
20012001
20012002
2002
2002
2002
2003
2003
2003 2003
0
50
100
150
200
250
January-March April-June July-September October-December
2001 2001 2001
2001
2002
20022002
20022003
2003 20032003
0
50
100
150
200
250
January-March April-June July-September October-December
Source: Uniform Crime Reporting Survey, Canadian Centre for Justice Statistics. See Appendix Tables A.3 and A.6.

Impact of the YCJA on Police Charging Practices with Young Persons
38
Figure 18. Rates of young persons charged, not charged (extrajudicial measures), and chargeable, other Criminal Code offences, Canada, 1986-2003
(a) Rates of youth charged and not charged (b) Rates of chargeable youth
0
200
400
600
800
1,000
1,200
1,400
1,600
1986 1987 1988 1989 1990 1991 1992 1993 1994 1995 1996 1997 1998 1999 2000 2001 2002 2003
Rat
e pe
r 100
,000
you
th p
opul
atio
n
Charged Not charged (extrajudicial measures)
2,644
0
500
1,000
1,500
2,000
2,500
3,000
1986 1987 1988 1989 1990 1991 1992 1993 1994 1995 1996 1997 1998 1999 2000 2001 2002 2003
Rat
e pe
r 100
,000
you
th p
opul
atio
n(c) Rates of youth charged, by quarter, 2001-2003 (d) Rates of youth receiving extrajudicial
measures, by quarter, 2001-2003
2001
20012001
2001
2002
2002 20022002
2003 2003 2003 2003
0
200
400
600
800
1,000
1,200
1,400
1,600
1,800
January-March April-June July-September October-December
2001
2001
2001 2001
2002
20022002
2002
2003
2003
2003
2003
0
200
400
600
800
1,000
1,200
1,400
1,600
1,800
January-March April-June July-September October-December
Source: Uniform Crime Reporting Survey, Canadian Centre for Justice Statistics. See Appendix Tables A.3 and A.6.

Impact of the YCJA on Police Charging Practices with Young Persons
39
Figure 19 shows that there was a small reduction (5%) in 2003 in charging in incidents involving an indictable property offence.51 However, the rate of young persons charged for indictable property offences has been declining since 1991, and the recorded rate of young persons not charged (i.e. dealt with by extrajudicial measures) has been increasing since 1999, so the changes in 2003 could be seen as continuations of pre-existing trends (Figure 19a). On the other hand, the increase in the recorded use of extrajudicial measures in 2003 was larger than in 2000 to 2002, and was concentrated in the last three quarters, suggesting that at least part of the change in 2003 in police charging practices with indictable property offences was in response to the coming into force of the YCJA. Figure 19. Rates of young persons charged, not charged (extrajudicial measures), and
chargeable, indictable property offences, Canada, 1986-2003 (a) Rates of youth charged and not charged (b) Rates of chargeable youth
0
200
400
600
800
1,000
1,200
1,400
1,600
1,800
1986 1987 1988 1989 1990 1991 1992 1993 1994 1995 1996 1997 1998 1999 2000 2001 2002 2003
Rat
e pe
r 100
,000
you
th p
opul
atio
n
Charged Not charged (extrajudicial measures)
994
0
500
1,000
1,500
2,000
2,500
1986 1987 1988 1989 1990 1991 1992 1993 1994 1995 1996 1997 1998 1999 2000 2001 2002 2003
Rat
e pe
r 100
,000
you
th p
opul
atio
n
(c) Rates of youth charged, by quarter, 2001-2003 (d) Rates of youth receiving extrajudicial measures, by quarter, 2001-2003
2001
2001
20012001
2002 2002
20022002
2003
2003
20032003
0
100
200
300
400
500
600
700
800
January-March April-June July-September October-December
2001
2001 2001 2001
2002
2002 2002 2002
2003
2003 20032003
0
100
200
300
400
500
600
700
800
January-March April-June July-September October-December
Source: Uniform Crime Reporting Survey, Canadian Centre for Justice Statistics. See Appendix Tables A.3 and A.6.
51 In the case of young persons, the majority of indictable property offences are break and enter, but the category also includes theft over and motor vehicle theft. Fraud is discussed separately below.

Impact of the YCJA on Police Charging Practices with Young Persons
40
There was also a small reduction (3%) in 2003 in charging for “violent” offences, or offences against the person (Figure 20)52. However, the rate of charging for this category of offences also declined in 2002, and the recorded use of alternatives to charging has been increasing since 1999. As with indictable property offences (above), there was an increase in the recorded use of extrajudicial measures in 2003, and the changes were concentrated in the last three quarters. The evidence suggests that, as expected, the YCJA has had at most a very small impact on charging practices with this category of offence. Figure 20. Rates of young persons charged, not charged (extrajudicial measures), and
chargeable, all offences against the person except assault level 1, Canada, 1986-2003
(a) Rates of youth charged and not charged (b) Rates of chargeable youth
0
50
100
150
200
250
300
350
400
450
500
1986 1987 1988 1989 1990 1991 1992 1993 1994 1995 1996 1997 1998 1999 2000 2001 2002 2003
Rat
e pe
r 100
,000
you
th p
opul
atio
n
Charged Not charged (extrajudicial measures)
586
0
100
200
300
400
500
600
700
1986 1987 1988 1989 1990 1991 1992 1993 1994 1995 1996 1997 1998 1999 2000 2001 2002 2003
Rat
e pe
r 100
,000
you
th p
opul
atio
n
(c) Rates of youth charged, by quarter, 2001-2003 (d) Rates of youth receiving extrajudicial measures, by quarter, 2001-2003
2001
2001
2001
2001
2002
2002
2002 20022003
2003
2003
2003
0
50
100
150
200
250
300
350
400
450
500
550
January-March April-June July-September October-December
2001
20012001
20012002
2002
200220022003
2003
2003
2003
0
50
100
150
200
250
300
350
400
450
500
550
January-March April-June July-September October-December
Source: Uniform Crime Reporting Survey, Canadian Centre for Justice Statistics. See Appendix Tables A.3 and A.6.
52 These include robbery, homicide, attempt murder, assault levels 2 and 3, all levels of sexual assault, abduction, and all other offences against the person except assault level 1, which was discussed separately above.

Impact of the YCJA on Police Charging Practices with Young Persons
41
Figure 21a shows that very little discretion not to charge is exercised by police in recorded incidents of bail violations and failure to appear for court. The reasons for this are complex, and the data probably understate the number of cases in which charges were not laid, due to under-reporting of such cases by police.53 In 2003, there was a very small reduction (2%) in the rate of young persons charged with violations of bail conditions and fail to appear for court, and a slightly larger increase in the recorded use of extrajudicial measures. The overall rate of chargeable young persons increased very slightly (1%; see Figure 21b). Although the rate of charging for these offences has been decreasing since 2001, the increase in 2003 in the use of extrajudicial measures, and the concentration of the changes in the last three quarters, suggests that the changes in 2003 were at least partly the result of the YCJA, and not simply a continuation of a pre-existing trend. However, the changes were very small, contrary to our expectations. Figure 21. Rates of young persons charged, not charged (extrajudicial measures), and
chargeable, bail violations and fail to appear, Canada, 1986-2003 (a) Rates of youth charged and not charged (b) Rates of chargeable youth
0
50
100
150
200
250
300
350
400
450
500
1986 1987 1988 1989 1990 1991 1992 1993 1994 1995 1996 1997 1998 1999 2000 2001 2002 2003
Rat
e pe
r 100
,000
you
th p
opul
atio
n
Charged Not charged (extrajudicial measures)
475
0
50
100
150
200
250
300
350
400
450
500
1986 1987 1988 1989 1990 1991 1992 1993 1994 1995 1996 1997 1998 1999 2000 2001 2002 2003
Rat
e pe
r 100
,000
you
th p
opul
atio
n
(c) Rates of youth charged, by quarter, 2001-2003 (d) Rates of youth receiving extrajudicial measures, by quarter, 2001-2003
2001
2001 2001
2001
2002
20022002
20022003
20032003
2003
0
50
100
150
200
250
300
350
400
450
500
January-March April-June July-September October-December
2001 2001 2001 20012002 2002 2002 200220032003 2003 2003
0
50
100
150
200
250
300
350
400
450
500
January-March April-June July-September October-December
Source: Uniform Crime Reporting Survey, Canadian Centre for Justice Statistics. See Appendix Tables A.3 and A.6.
53 For discussion of this issue, see Carrington and Schulenberg 2004a; Schulenberg 2004; Schulenberg, forthcoming.
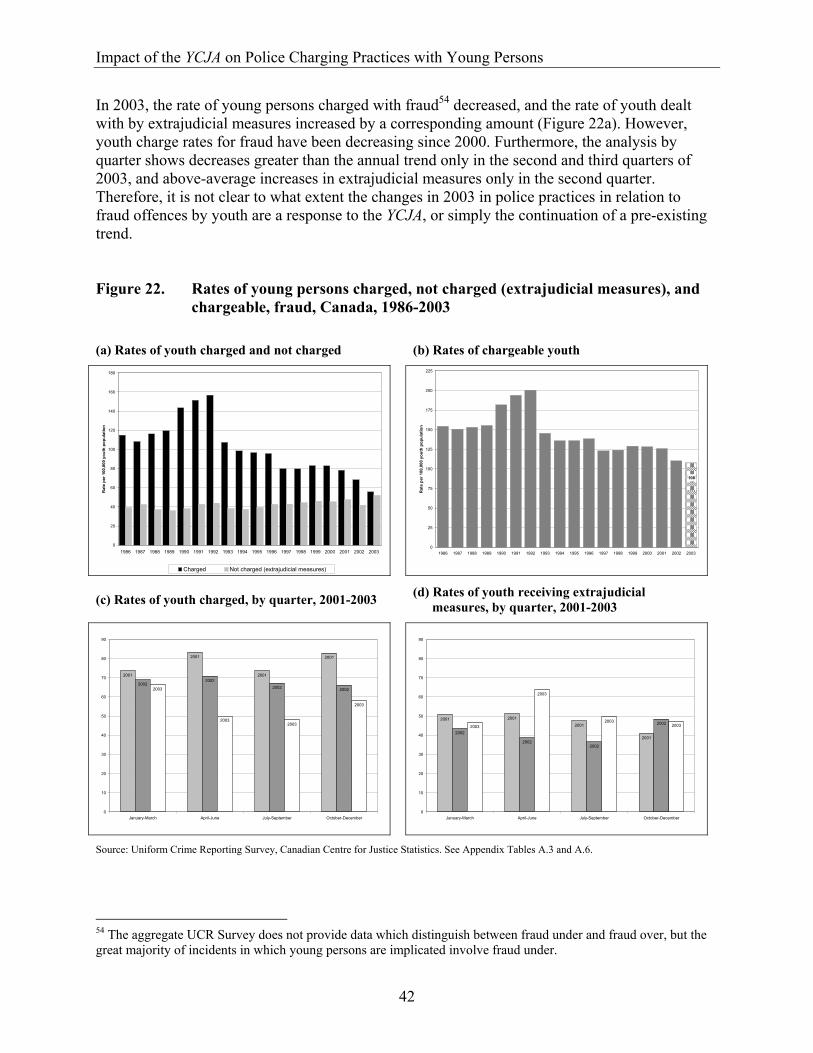
Impact of the YCJA on Police Charging Practices with Young Persons
42
In 2003, the rate of young persons charged with fraud54 decreased, and the rate of youth dealt with by extrajudicial measures increased by a corresponding amount (Figure 22a). However, youth charge rates for fraud have been decreasing since 2000. Furthermore, the analysis by quarter shows decreases greater than the annual trend only in the second and third quarters of 2003, and above-average increases in extrajudicial measures only in the second quarter. Therefore, it is not clear to what extent the changes in 2003 in police practices in relation to fraud offences by youth are a response to the YCJA, or simply the continuation of a pre-existing trend. Figure 22. Rates of young persons charged, not charged (extrajudicial measures), and
chargeable, fraud, Canada, 1986-2003 (a) Rates of youth charged and not charged (b) Rates of chargeable youth
0
20
40
60
80
100
120
140
160
180
1986 1987 1988 1989 1990 1991 1992 1993 1994 1995 1996 1997 1998 1999 2000 2001 2002 2003
Rat
e pe
r 100
,000
you
th p
opul
atio
n
Charged Not charged (extrajudicial measures)
108
0
25
50
75
100
125
150
175
200
225
1986 1987 1988 1989 1990 1991 1992 1993 1994 1995 1996 1997 1998 1999 2000 2001 2002 2003
Rat
e pe
r 100
,000
you
th p
opul
atio
n
(c) Rates of youth charged, by quarter, 2001-2003 (d) Rates of youth receiving extrajudicial measures, by quarter, 2001-2003
2001
2001
2001
2001
20022002
2002 20022003
20032003
2003
0
10
20
30
40
50
60
70
80
90
January-March April-June July-September October-December
2001 2001
2001
20012002
20022002
20022003
2003
20032003
0
10
20
30
40
50
60
70
80
90
January-March April-June July-September October-December
Source: Uniform Crime Reporting Survey, Canadian Centre for Justice Statistics. See Appendix Tables A.3 and A.6.
54 The aggregate UCR Survey does not provide data which distinguish between fraud under and fraud over, but the great majority of incidents in which young persons are implicated involve fraud under.

Impact of the YCJA on Police Charging Practices with Young Persons
43
Figure 23 shows the rates of young persons charged, chargeable, and dealt with by extrajudicial measures in incidents in which the most serious alleged offence was a breach of a probation condition. Although the UCR Survey does not have a separate category for violations of probation conditions, the numbers provided for “other federal statutes” are used here as a proxy for this offence.55 This can be done because alleged breaches of probation orders by young persons are normally classified as “failure to comply with a disposition” under the YOA and YCJA, rather than as violations of probation conditions under the Criminal Code, and are therefore reported under “other federal statutes” by the UCR. The number of young persons implicated in offences under the remaining federal statutes included in this UCR category is negligible.56 Figure 23. Rates of young persons charged, not charged (extrajudicial measures), and
chargeable, violations of probation conditions, Canada, 1986-2003 (a) Rates of youth charged and not charged (b) Rates of chargeable youth
0
50
100
150
200
250
1986 1987 1988 1989 1990 1991 1992 1993 1994 1995 1996 1997 1998 1999 2000 2001 2002 2003
Rat
e pe
r 100
,000
you
th p
opul
atio
n
Charged Not charged (extrajudicial measures)
294
0
50
100
150
200
250
300
1986 1987 1988 1989 1990 1991 1992 1993 1994 1995 1996 1997 1998 1999 2000 2001 2002 2003
Rat
e pe
r 100
,000
you
th p
opul
atio
n
(c) Rates of youth charged, by quarter, 2001-2003 (d) Rates of youth not charged, by quarter, 2001-2003
2001
2001
2001
2001
2002
2002
2002 2002
2003
20032003
2003
0
50
100
150
200
250
January-March April-June July-September October-December
2001
2001
2001 2001
2002
2002
2002
20022003
2003
2003
2003
0
50
100
150
200
250
January-March April-June July-September October-December
Note: The chart includes all youth classified under “other federal statutes”, almost all of whom were apprehended for probation violations.. Source: Uniform Crime Reporting Survey, Canadian Centre for Justice Statistics. See Appendix Tables A.3 and A.6.
55 See Carrington and Schulenberg, 2004a: note 15, p. 47. 56 The UCR category “Other federal statutes” includes the YOA, YCJA, Income Tax Act, Competition Act, National Defence Act, and miscellaneous other federal statutes (Canadian Centre for Justice Statistics, 2002: Section 6).

Impact of the YCJA on Police Charging Practices with Young Persons
44
The evidence presented in Figure 23 is difficult to interpret. There was a reduction from 2002 to 2003 of 13% in the rate of young persons charged, but the charge rate in 2002 was unusually high; the rate in 2003 was not substantially different from the rates in 1999 to 2001 (Figures 23a and 23c). The recorded rate of youth dealt with by extrajudicial measures in 2003 was substantially higher than in 1999 to 2002 (Figure 23a), but this increase was evident in all four quarters of 2003 (Figure 23d). The overall recorded rate of chargeable youth was higher in 2003 than in 1999 to 2001, though not higher than in 2002 (Figure 23b). Thus, there is no clear evidence that the coming into force of the YCJA has resulted in a decrease in charging with this type of offence.
4.0 Conclusions On the evidence of data from the Uniform Crime Reporting Survey, the YCJA has been remarkably successful in bringing about changes in police charging practices with young persons which are consistent with its objectives, principles and provisions. Consistent with the principle of restraint and the objective of reducing the use of formal court proceedings with accused young persons, there was, in 2003, a substantial reduction at the national level and in most provinces and territories in the number of young persons charged or recommended by police to be charged, and a corresponding increase in the use of extrajudicial measures with apprehended young persons. There is no evidence of an increase at the national level in youth crime in 2003, or of net-widening by police in response to the coming into force of the YCJA. Consistent with the principles of accountability and proportionality, the substitution of extrajudicial measures for the laying of charges has been calibrated by police so that levels of charging were reduced in 2003 by more than one-third for minor offences such as theft under and drug-related offences, while levels of charging for serious property and violent offences (other than common assault) decreased only slightly. In three provinces – Newfoundland and Labrador, Prince Edward Island, and Quebec – while the levels of charging of young persons decreased in 2003, we could not confidently attribute the changes to the impact of the YCJA, because the use of charges with apprehended young persons had been decreasing for some years before 2003. In three other jurisdictions – Saskatchewan, the Northwest Territories and Nunavut Territory – there was no evidence of a reduction in charging of young persons in 2003. We cannot be sure that the large reduction in charging of young persons in incidents involving drug-related offences was entirely due to the YCJA, because the Act came into force only two months before the Cannabis Reform Bill was introduced in Parliament. Although this Bill was not passed, its introduction probably resulted in a reduction in the use of charges in incidents of possession of small amounts of cannabis. Our expectations based on the legislation were not fulfilled in the case of young persons accused of offences against the administration of justice – mainly violations of bail and probation conditions, and fail to appear for court. We had expected a substantial decrease in 2003 in the use of charges, and an increase in the use of extrajudicial measures with these non-violent,

Impact of the YCJA on Police Charging Practices with Young Persons
45
victimless offences. However, the data showed little change from previous years in the way in which police respond to youth accused of this type of offence. With these minor exceptions, the initial impact of the YCJA on police charging practices with young persons appears to have been remarkably strong, immediate, and consistent with its objectives, principles, and provisions. Our review of the statute and related literature suggested certain research questions which we were unable to address with the available data. Some unanswered questions concern the types of extrajudicial measures which are being used by police under the YCJA: Do the choices of extrajudicial measures reflect the principles of restraint, accountability and proportionality? Do these choices represent a type of net-widening by police? Another unanswered question concerns the impact of Section 4(c), which states that extrajudicial measures are presumed to be sufficient to respond to a youth with no prior record who is accused of a non-violent offence. We were also unable to assess to what extent violations of probation conditions are being dealt with by police by way of an application for a review of the order, rather than laying a charge of fail to comply. Probably the most important question which necessarily remains unanswered by this preliminary assessment is whether the remarkable success of the YCJA in relation to police charging practices will prove to be temporary, and followed by a return to former police practices, or whether this new approach to the exercise of police discretion will be entrenched, and possibly even enhanced, in the future. A related question is whether the improved recording by some police services of the use of extrajudicial measures with young persons, which appears to have resulted from the coming into force of the YCJA, will result in increases in the future in the charging of young persons in these jurisdictions, as a result of the availability of more complete information on their previous encounters with police.

List of References Bala, Nicholas. 1997. Young Offenders Law. Concord, ON: Irwin Law. Bala, Nicholas. 2003. Youth Criminal Justice Law. Toronto, ON: Irwin Law. Barnhorst, Richard. 2004. The Youth Criminal Justice Act: New Directions and Implementation
Issues. Canadian Journal of Criminology and Criminal Justice 46(3): 231-250. Campbell, Donald T. and Julian C. Stanley. 1963. Experimental and Quasi-Experimental
Designs for Research. Boston: Houghton Mifflin. Canadian Centre for Justice Statistics. 2002. Uniform Crime Reporting Incident-Based Survey
Reporting Manual. Version 2.0. Unpublished. Canadian Centre for Justice Statistics. 2003. Proposed National Data Requirement Changes to
the UCR2 Survey due to the YCJA. Unpublished working document, February 27, 2003. Canadian Centre for Justice Statistics. 2004. Canadian Crime Statistics 2003. Ottawa: Canadian
Centre for Justice Statistics, Statistics Canada. Cat. No. 85-205. Carrington, Peter J. 1995. Has violent youth crime increased? Comment on Corrado and
Markwart. Canadian Journal of Criminology 37(1): 61-93. Carrington, Peter J. 1998. Changes in police charging of young offenders in Ontario and
Saskatchewan after 1984. Canadian Journal of Criminology 40: 153-164. Carrington, Peter J. 1999. Trends in youth crime in Canada, 1977-1996. Canadian Journal of
Criminology 41(1): 1-32. Carrington, Peter J., and Sharon Moyer. 1994. Trends in youth crime and police response, pre-
and post-YOA. Canadian Journal of Criminology 36(1): 1-28. Carrington, Peter J. and Jennifer L. Schulenberg, with A. Brunelle, J. Jacob, and I. Pickles.
2004a. Police Discretion with Young Offenders. Ottawa: Department of Justice Canada. At: http://canada.justice.gc.ca/en/ps/yj/research/carrington-schulenberg/report.html. Accessed on March 23, 2005.
Carrington, Peter J., and Jennifer L. Schulenberg. 2004b. Introduction: The Youth Criminal
Justice Act – A New Era in Canadian Juvenile Justice? Canadian Journal of Criminology and Criminal Justice 46(3): 219-223.
Carrington, Peter J. and Jennifer L. Schulenberg. 2004c. Prior Police Contacts and Police
Discretion with Apprehended Youth. Ottawa: Canadian Centre for Justice Statistics, Statistics Canada. Crime and Justice Research Paper Series. Cat. No. 85-561-MIE-003.

Impact of the YCJA on Police Charging Practices with Young Persons DRAFT 17/11/2005
47
Department of Justice Canada. 2003a. YCJA Explained. Accessed on April 24, 2005. At: http://canada.justice.gc.ca/en/ps/yj/repository/index.html.
Department of Justice Canada. 2003b. Youth Criminal Justice Act: Resource Manual for Police.
Ottawa: Department of Justice Canada. Doob, Anthony N., and Lucien A. Beaulieu. 1992. Variation in the exercise of judicial discretion
with young offenders. Canadian Journal of Criminology 34(1): 35-50. Federal-Provincial-Territorial Task Force on Youth Justice. 1996. A Review of the Young
Offenders Act and the Youth Justice System in Canada. Ottawa, ON: Report of the Federal-Provincial-Territorial Task Force on Youth Justice for the Standing Committee on Justice and Legal Affairs of the House of Commons, Department of Justice Canada.
Frank, Ove and Peter J. Carrington. 2003. Estimation of offending and co-offending using
available data with model support. Stockholm University, Department of Sociology. At: http://www.statistics.su.se/personalen/ove.shtml. Accessed on March 21, 2005.
Gabor, Thomas. 1999. Trends in youth crime: Some evidence pointing to increases in the
severity and volume of violence on the part of young people. Canadian Journal of Criminology 41(3): 385-392.
Hackler, Jim and Kim Don. 1990. Estimating system biases: Crime indices that permit
comparison across provinces. Canadian Journal of Criminology 32(2): 243-264. Hackler, Jim and Wasanti Paranjape. 1983. Juvenile justice statistics: Mythmaking or measure of
system response? Canadian Journal of Criminology 25(1): 209-226. Hackler, Jim and Wasanti Paranjape. 1984. Official reaction to juvenile theft: Comparison across
provinces. Canadian Journal of Criminology 26(1): 179-198. Health Canada. 2003. Cannabis Reform Bill. At:
http://www.hc-sc.gc.ca/english/media/releases/2003/2003_34bk2.htm. Accessed on May 14, 2005.
John Howard Society of Ontario. 1994. Youth crime: Sorting fact from fiction. Fact Sheet #3.
Toronto: John Howard Society of Ontario. Markwart, Alan, and Raymond R. Corrado. 1995. A response to Carrington. Canadian Journal
of Criminology 37(1): 74-87. Ministère de la Sécurité publique du Québec. 2002a. La desserte policière. Modifications
détaillés à l’organisation policière en 2002. Accessed on: March 23, 2005. At: http://www.msp.gouv.qc.ca/police/police.asp?ndn=032&txtSection=orgapoli&txtCategorie=desserte.
Impact of the YCJA on Police Charging Practices with Young Persons DRAFT 17/11/2005
48
Ministère de la Sécurité publique du Québec. 2002b. Police Acts and Regulations. At: http://www.msp.gouv.qc.ca/police/police_en.asp?ndn=020&txtSection=orgapoli&txtCategorie=loi. Accessed on: March 23, 2005.
Mohr, Lawrence B. 1995. Impact Analysis for Program Evaluation. 2nd ed. Thousand Oaks, CA:
Sage. Moyer, Sharon. 1996. A Profile of the Juvenile Justice System in Canada. Report to the Federal-
Provincial-Territorial Task Force on Youth Justice. Ottawa: Department of Justice Canada.
Platt, Priscilla. 1991. A Police Guide to the Young Offenders Act. Toronto: Butterworths. Pulis, Jessica E. 2003. A critical analysis of probation for young offenders in Canada.
Unpublished MA thesis, University of Guelph. Scanlon, R. Lorcan. 1986. Canadian crime trends. In Robert A. Silverman and James J. Teevan,
Jr. (eds.), Crime in Canadian Society. 3rd ed. Toronto: Butterworths. Schulenberg, Jennifer L. 2004. Policing Young Offenders: A Multi-Method Analysis of
Variations in Police Discretion. Unpublished doctoral dissertation, University of Waterloo.
Schulenberg, Jennifer L. (forthcoming, 2006). Police Culture and Young Offenders: The Effect
of Legislative Change on Definitions of Crime and Delinquency. Police Quarterly. Tustin, Lee, and Robert E. Lutes. 2004. A Guide to the Youth Criminal Justice Act. Markham,
ON: Lexis Nexis, Butterworths. Wallace, Marni. 2004. Crime Statistics in Canada, 2003. Juristat 26(6). Ottawa: Canadian
Centre for Justice Statistics, Statistics Canada. Cat. No. 85-002-XIE.

Appendix
Supplementary Figures and Tables

50
Figure A.1 Rates and proportions of young persons charged, not charged (extrajudicial measures), and chargeable, Newfoundland and Labrador (a) Rates of youth charged and not charged (extrajudicial measures), 1986-2003
0
1,000
2,000
3,000
4,000
5,000
6,000
7,000
1986 1987 1988 1989 1990 1991 1992 1993 1994 1995 1996 1997 1998 1999 2000 2001 2002 2003
Rat
e pe
r 100
,000
you
th p
opul
atio
n
Charged Not charged (extrajudicial measures) (b) Rates of youth charged, by quarter, 2001-2003
2001
20012001
2001
2002 2002
2002
2002
2003
2003
20032003
0
1,000
2,000
3,000
4,000
5,000
6,000
7,000
January-March April-June July-September October-December (c) Rates of youth receiving extrajudicial measures, by quarter, 2001-2003
2001
2001
2001
2001
2002
20022002
2002
2003
2003
2003
2003
0
500
1,000
1,500
2,000
2,500
3,000
3,500
4,000
4,500
5,000
5,500
6,000
January-March April-June July-September October-December

51
Figure A.1 (Newfoundland and Labrador, cont’d)
(d) Proportion of chargeable youth who were charged, 1986-2003
48%
0%
10%
20%
30%
40%
50%
60%
70%
80%
90%
100%
1986 1987 1988 1989 1990 1991 1992 1993 1994 1995 1996 1997 1998 1999 2000 2001 2002 2003
% c
harg
ed
70%
(e) Proportion of chargeable youth who were charged, by quarter, 2001-2003
2001 20012001
20012002
2002
200220022003
2003 20032003
0.0%
10.0%
20.0%
30.0%
40.0%
50.0%
60.0%
70.0%
80.0%
90.0%
100.0%
January-March April-June July-September October-December (f) Rates of chargeable youth, 1986-2003
0
1,000
2,000
3,000
4,000
5,000
6,000
7,000
8,000
9,000
10,000
1986 1987 1988 1989 1990 1991 1992 1993 1994 1995 1996 1997 1998 1999 2000 2001 2002 2003
Rat
e pe
r 100
,000
you
th p
opul
atio
n
Source: Uniform Crime Reporting Survey, Canadian Centre for Justice Statistics. See Appendix Tables A.1-A.5.

52
Figure A.2 Rates and proportions of young persons charged, not charged (extrajudicial measures), and chargeable, Prince Edward Island (a) Rates of youth charged and not charged (extrajudicial measures), 1986-2003
0
1,000
2,000
3,000
4,000
5,000
6,000
7,000
1986 1987 1988 1989 1990 1991 1992 1993 1994 1995 1996 1997 1998 1999 2000 2001 2002 2003
Rat
e pe
r 100
,000
you
th p
opul
atio
n
Charged Not charged (extrajudicial measures) (b) Rates of youth charged, by quarter, 2001-2003
2001
2001
2001
2001
20022002
2002
2002
2003
20032003
2003
0
500
1,000
1,500
2,000
2,500
3,000
3,500
4,000
January-March April-June July-September October-December (c) Rates of youth receiving extrajudicial measures, by quarter, 2001-2003
2001
2001
20012001
2002
2002
20022002
2003
2003
2003
2003
0
500
1,000
1,500
2,000
2,500
3,000
3,500
4,000
4,500
5,000
5,500
6,000
January-March April-June July-September October-December

53
Figure A.2 (Prince Edward Island, cont’d)
(d) Proportion of chargeable youth who were charged, 1986-2003
26%
0%
10%
20%
30%
40%
50%
60%
70%
80%
90%
100%
1986 1987 1988 1989 1990 1991 1992 1993 1994 1995 1996 1997 1998 1999 2000 2001 2002 2003
% c
harg
ed
63%
(e) Proportion of chargeable youth who were charged, by quarter, 2001-2003
2001
2001
2001
2001
2002
2002
2002
2002
2003
2003 20032003
0.0%
10.0%
20.0%
30.0%
40.0%
50.0%
60.0%
70.0%
80.0%
90.0%
100.0%
January-March April-June July-September October-December (f) Rates of chargeable youth, 1986-2003
0
1,000
2,000
3,000
4,000
5,000
6,000
7,000
8,000
9,000
1986 1987 1988 1989 1990 1991 1992 1993 1994 1995 1996 1997 1998 1999 2000 2001 2002 2003
Rat
e pe
r 100
,000
you
th p
opul
atio
n
Source: Uniform Crime Reporting Survey, Canadian Centre for Justice Statistics. See Appendix Tables A.1-A.5.

54
Figure A.3 Rates and proportions of young persons charged, not charged (extrajudicial measures), and chargeable, Nova Scotia (a) Rates of youth charged and not charged (extrajudicial measures), 1986-2003
0
1,000
2,000
3,000
4,000
5,000
6,000
7,000
8,000
1986 1987 1988 1989 1990 1991 1992 1993 1994 1995 1996 1997 1998 1999 2000 2001 2002 2003
Rat
e pe
r 100
,000
you
th p
opul
atio
n
Charged Not charged (extrajudicial measures) (b) Rates of youth charged, by quarter, 2001-2003
20012001
2001
2001
2002 20022002
2002
2003 2003
2003
2003
0
500
1,000
1,500
2,000
2,500
3,000
3,500
4,000
4,500
5,000
January-March April-June July-September October-December (c) Rates of youth receiving extrajudicial measures, by quarter, 2001-2003
2001
2001
2001 2001
2002
2002
2002
2002
2003
2003
20032003
0
1,000
2,000
3,000
4,000
5,000
6,000
7,000
8,000
January-March April-June July-September October-December

55
Figure A.3 (Nova Scotia, cont’d)
(d) Proportion of chargeable youth who were charged, 1986-2003
36%
0%
10%
20%
30%
40%
50%
60%
70%
80%
90%
100%
1986 1987 1988 1989 1990 1991 1992 1993 1994 1995 1996 1997 1998 1999 2000 2001 2002 2003
% c
harg
ed
71%
(e) Proportion of chargeable youth who were charged, by quarter, 2001-2003
2001
2001
2001 20012002
20022002
20022003
2003 2003 2003
0.0%
10.0%
20.0%
30.0%
40.0%
50.0%
60.0%
70.0%
80.0%
90.0%
100.0%
January-March April-June July-September October-December (f) Rates of chargeable youth, 1986-2003
0
1,000
2,000
3,000
4,000
5,000
6,000
7,000
8,000
9,000
10,000
11,000
1986 1987 1988 1989 1990 1991 1992 1993 1994 1995 1996 1997 1998 1999 2000 2001 2002 2003
Rat
e pe
r 100
,000
you
th p
opul
atio
n
Source: Uniform Crime Reporting Survey, Canadian Centre for Justice Statistics. See Appendix Tables A.1-A.5.

56
Figure A.4 Rates and proportions of young persons charged, not charged (extrajudicial measures), and chargeable, New Brunswick (a) Rates of youth charged and not charged (extrajudicial measures), 1986-2003
0
1,000
2,000
3,000
4,000
5,000
6,000
1986 1987 1988 1989 1990 1991 1992 1993 1994 1995 1996 1997 1998 1999 2000 2001 2002 2003
Rat
e pe
r 100
,000
you
th p
opul
atio
n
Charged Not charged (extrajudicial measures) (b) Rates of youth charged, by quarter, 2001-2003
2001
2001 2001
2001
20022002 2002
2002
2003
2003 2003 2003
0
500
1,000
1,500
2,000
2,500
3,000
3,500
4,000
4,500
5,000
5,500
January-March April-June July-September October-December (c) Rates of youth receiving extrajudicial measures, by quarter, 2001-2003
2001
2001
2001
2001
2002
2002
2002
2002
2003
2003
20032003
0
500
1,000
1,500
2,000
2,500
3,000
3,500
4,000
January-March April-June July-September October-December

57
Figure A.4 (New Brunswick, cont’d)
(d) Proportion of chargeable youth who were charged, 1986-2003
56%
0%
10%
20%
30%
40%
50%
60%
70%
80%
90%
100%
1986 1987 1988 1989 1990 1991 1992 1993 1994 1995 1996 1997 1998 1999 2000 2001 2002 2003
% c
harg
ed
69%
(e) Proportion of chargeable youth who were charged, by quarter, 2001-2003
2001
20012001
20012002
20022002
20022003
2003
2003 2003
0.0%
10.0%
20.0%
30.0%
40.0%
50.0%
60.0%
70.0%
80.0%
90.0%
100.0%
January-March April-June July-September October-December (f) Rates of chargeable youth, 1986-2003
0
1,000
2,000
3,000
4,000
5,000
6,000
7,000
8,000
9,000
1986 1987 1988 1989 1990 1991 1992 1993 1994 1995 1996 1997 1998 1999 2000 2001 2002 2003
Rat
e pe
r 100
,000
you
th p
opul
atio
n
Source: Uniform Crime Reporting Survey, Canadian Centre for Justice Statistics. See Appendix Tables A.1-A.5.

58
Figure A.5 Rates and proportions of young persons charged, not charged (extrajudicial measures), and chargeable, Quebec (a) Rates of youth charged and not charged (extrajudicial measures), 1986-2003
0
500
1,000
1,500
2,000
2,500
3,000
3,500
4,000
4,500
1986 1987 1988 1989 1990 1991 1992 1993 1994 1995 1996 1997 1998 1999 2000 2001 2002 2003
Rat
e pe
r 100
,000
you
th p
opul
atio
n
Charged Not charged (extrajudicial measures) (b) Rates of youth charged, by quarter, 2001-2003
2001
2001 2001
2001
2002
2002
2002
2002
2003
2003 2003
2003
0
250
500
750
1,000
1,250
1,500
1,750
2,000
2,250
2,500
January-March April-June July-September October-December (c) Rates of youth receiving extrajudicial measures, by quarter, 2001-2003
2001
2001
2001
2001
2002
2002
2002
2002
2003
2003
2003
2003
0
500
1,000
1,500
2,000
2,500
3,000
3,500
4,000
January-March April-June July-September October-December

59
Figure A.5 (Quebec, cont’d)
(d) Proportion of chargeable youth who were charged, 1986-2003
41%
0%
10%
20%
30%
40%
50%
60%
70%
80%
90%
100%
1986 1987 1988 1989 1990 1991 1992 1993 1994 1995 1996 1997 1998 1999 2000 2001 2002 2003
% c
harg
ed
60%
(e) Proportion of chargeable youth who were charged, by quarter, 2001-2003
20012001
20012001
20022002
200220022003
2003
2003 2003
0.0%
10.0%
20.0%
30.0%
40.0%
50.0%
60.0%
70.0%
80.0%
90.0%
100.0%
January-March April-June July-September October-December (f) Rates of chargeable youth, 1986-2003
0
1,000
2,000
3,000
4,000
5,000
6,000
1986 1987 1988 1989 1990 1991 1992 1993 1994 1995 1996 1997 1998 1999 2000 2001 2002 2003
Rat
e pe
r 100
,000
you
th p
opul
atio
n
Source: Uniform Crime Reporting Survey, Canadian Centre for Justice Statistics. See Appendix Tables A.1-A.5.

60
Figure A.6 Rates and proportions of young persons charged, not charged (extrajudicial measures), and chargeable, Manitoba (a) Rates of youth charged and not charged (extrajudicial measures), 1986-2003
0
1,000
2,000
3,000
4,000
5,000
6,000
7,000
8,000
9,000
10,000
1986 1987 1988 1989 1990 1991 1992 1993 1994 1995 1996 1997 1998 1999 2000 2001 2002 2003
Rat
e pe
r 100
,000
you
th p
opul
atio
n
Charged Not charged (extrajudicial measures) (b) Rates of youth charged, by quarter, 2001-2003
2001
2001
20012001
2002
2002
2002
2002
2003
20032003 2003
0
1,000
2,000
3,000
4,000
5,000
6,000
7,000
8,000
9,000
January-March April-June July-September October-December (c) Rates of youth receiving extrajudicial measures, by quarter, 2001-2003
2001
2001
2001
2001
2002
20022002
2002
2003
2003
20032003
0
500
1,000
1,500
2,000
2,500
3,000
3,500
4,000
4,500
5,000
5,500
6,000
6,500
7,000
January-March April-June July-September October-December

61
Figure A.6 (Manitoba, cont’d)
(d) Proportion of chargeable youth who were charged, 1986-2003
53%
0%
10%
20%
30%
40%
50%
60%
70%
80%
90%
100%
1986 1987 1988 1989 1990 1991 1992 1993 1994 1995 1996 1997 1998 1999 2000 2001 2002 2003
% c
harg
ed
78
(e) Proportion of chargeable youth who were charged, by quarter, 2001-2003
2001 20012001
2001
2002
20022002
20022003
2003
2003 2003
0.0%
10.0%
20.0%
30.0%
40.0%
50.0%
60.0%
70.0%
80.0%
90.0%
100.0%
January-March April-June July-September October-December (f) Rates of chargeable youth, 1986-2003
0
1,000
2,000
3,000
4,000
5,000
6,000
7,000
8,000
9,000
10,000
11,000
12,000
13,000
1986 1987 1988 1989 1990 1991 1992 1993 1994 1995 1996 1997 1998 1999 2000 2001 2002 2003
Rat
e pe
r 100
,000
you
th p
opul
atio
n
Source: Uniform Crime Reporting Survey, Canadian Centre for Justice Statistics. See Appendix Tables A.1-A.5.
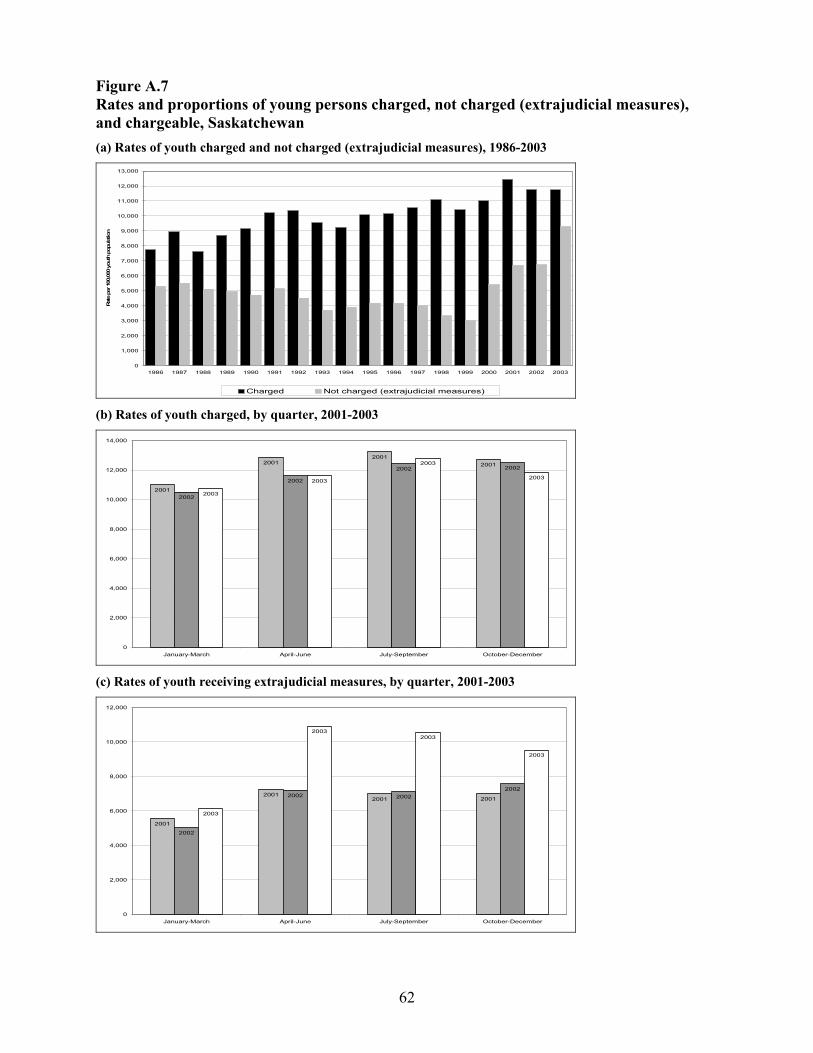
62
Figure A.7 Rates and proportions of young persons charged, not charged (extrajudicial measures), and chargeable, Saskatchewan (a) Rates of youth charged and not charged (extrajudicial measures), 1986-2003
0
1,000
2,000
3,000
4,000
5,000
6,000
7,000
8,000
9,000
10,000
11,000
12,000
13,000
1986 1987 1988 1989 1990 1991 1992 1993 1994 1995 1996 1997 1998 1999 2000 2001 2002 2003
Rat
e pe
r 100
,000
you
th p
opul
atio
n
Charged Not charged (extrajudicial measures) (b) Rates of youth charged, by quarter, 2001-2003
2001
20012001
2001
2002
2002
2002 2002
2003
2003
2003
2003
0
2,000
4,000
6,000
8,000
10,000
12,000
14,000
January-March April-June July-September October-December (c) Rates of youth receiving extrajudicial measures, by quarter, 2001-2003
2001
20012001 2001
2002
2002 20022002
2003
20032003
2003
0
2,000
4,000
6,000
8,000
10,000
12,000
January-March April-June July-September October-December
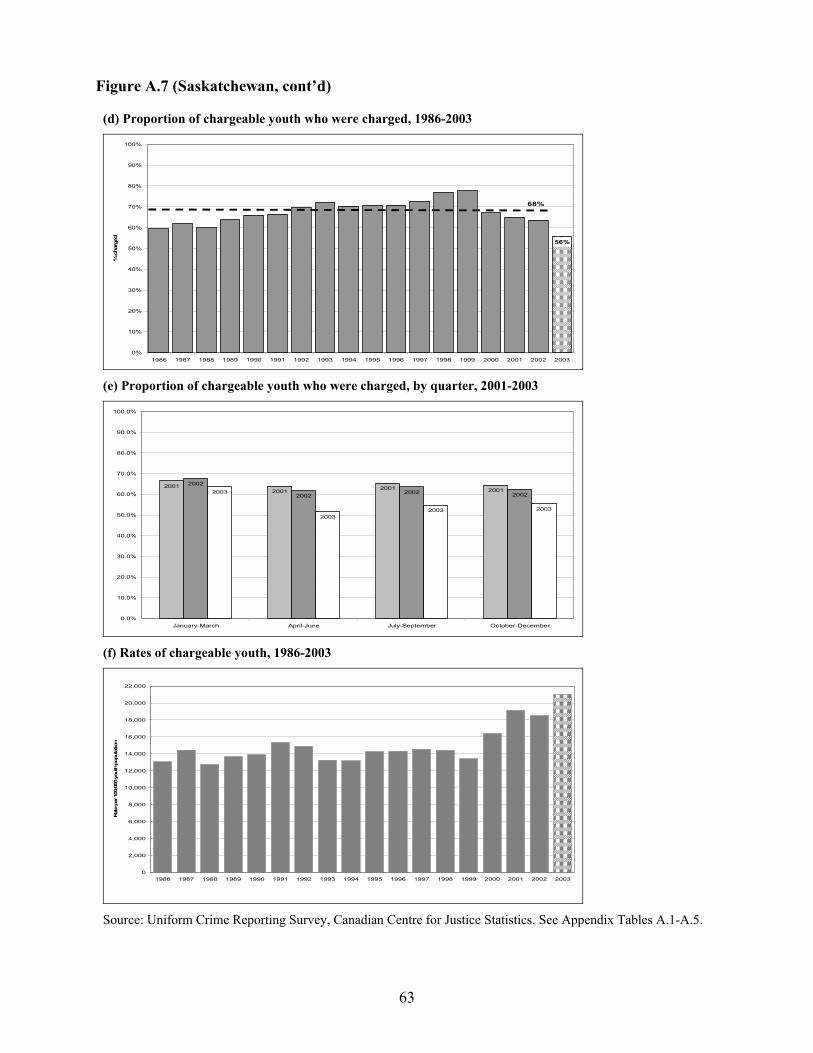
63
Figure A.7 (Saskatchewan, cont’d)
(d) Proportion of chargeable youth who were charged, 1986-2003
56%
0%
10%
20%
30%
40%
50%
60%
70%
80%
90%
100%
1986 1987 1988 1989 1990 1991 1992 1993 1994 1995 1996 1997 1998 1999 2000 2001 2002 2003
% c
harg
ed
68%
(e) Proportion of chargeable youth who were charged, by quarter, 2001-2003
20012001 2001 2001
2002
20022002 20022003
20032003 2003
0.0%
10.0%
20.0%
30.0%
40.0%
50.0%
60.0%
70.0%
80.0%
90.0%
100.0%
January-March April-June July-September October-December (f) Rates of chargeable youth, 1986-2003
0
2,000
4,000
6,000
8,000
10,000
12,000
14,000
16,000
18,000
20,000
22,000
1986 1987 1988 1989 1990 1991 1992 1993 1994 1995 1996 1997 1998 1999 2000 2001 2002 2003
Rat
e pe
r 100
,000
you
th p
opul
atio
n
Source: Uniform Crime Reporting Survey, Canadian Centre for Justice Statistics. See Appendix Tables A.1-A.5.
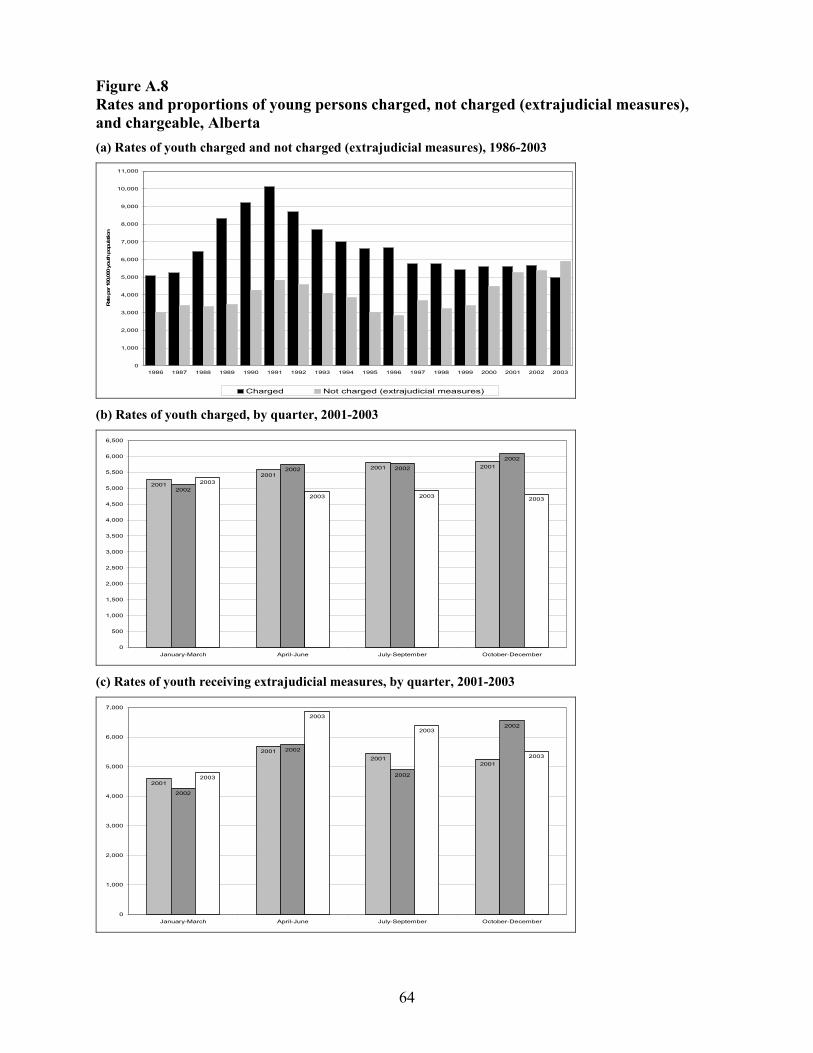
64
Figure A.8 Rates and proportions of young persons charged, not charged (extrajudicial measures), and chargeable, Alberta (a) Rates of youth charged and not charged (extrajudicial measures), 1986-2003
0
1,000
2,000
3,000
4,000
5,000
6,000
7,000
8,000
9,000
10,000
11,000
1986 1987 1988 1989 1990 1991 1992 1993 1994 1995 1996 1997 1998 1999 2000 2001 2002 2003
Rat
e pe
r 100
,000
you
th p
opul
atio
n
Charged Not charged (extrajudicial measures) (b) Rates of youth charged, by quarter, 2001-2003
2001
20012001 2001
2002
2002 2002
2002
2003
2003 2003 2003
0
500
1,000
1,500
2,000
2,500
3,000
3,500
4,000
4,500
5,000
5,500
6,000
6,500
January-March April-June July-September October-December (c) Rates of youth receiving extrajudicial measures, by quarter, 2001-2003
2001
20012001
2001
2002
2002
2002
2002
2003
2003
2003
2003
0
1,000
2,000
3,000
4,000
5,000
6,000
7,000
January-March April-June July-September October-December

65
Figure A.8 (Alberta, cont’d)
(d) Proportion of chargeable youth who were charged, 1986-2003
46%
0%
10%
20%
30%
40%
50%
60%
70%
80%
90%
100%
1986 1987 1988 1989 1990 1991 1992 1993 1994 1995 1996 1997 1998 1999 2000 2001 2002 2003
% c
harg
ed
63
(e) Proportion of chargeable youth who were charged, by quarter, 2001-2003
20012001
2001 20012002
2002
2002
2002
2003
20032003
2003
0.0%
10.0%
20.0%
30.0%
40.0%
50.0%
60.0%
70.0%
80.0%
90.0%
100.0%
January-March April-June July-September October-December (f) Rates of chargeable youth, 1986-2003
0
2,000
4,000
6,000
8,000
10,000
12,000
14,000
16,000
1986 1987 1988 1989 1990 1991 1992 1993 1994 1995 1996 1997 1998 1999 2000 2001 2002 2003
Rat
e pe
r 100
,000
you
th p
opul
atio
n
Source: Uniform Crime Reporting Survey, Canadian Centre for Justice Statistics. See Appendix Tables A.1-A.5.

66
Figure A.9 Rates and proportions of young persons charged, not charged (extrajudicial measures), and chargeable, British Columbia (a) Rates of youth charged and not charged (extrajudicial measures), 1986-2003
0
1,000
2,000
3,000
4,000
5,000
6,000
7,000
8,000
1986 1987 1988 1989 1990 1991 1992 1993 1994 1995 1996 1997 1998 1999 2000 2001 2002 2003
Rat
e pe
r 100
,000
you
th p
opul
atio
n
Charged Not charged (extrajudicial measures) (b) Rates of youth charged, by quarter, 2001-2003
20012001
200120012002
2002
2002 20022003
20032003 2003
0
500
1,000
1,500
2,000
2,500
3,000
3,500
4,000
4,500
January-March April-June July-September October-December (c) Rates of youth receiving extrajudicial measures, by quarter, 2001-2003
2001
2001
2001 2001
2002
2002
2002 20022003
2003
2003
2003
0
1,000
2,000
3,000
4,000
5,000
6,000
7,000
8,000
January-March April-June July-September October-December

67
Figure A.9 (British Columbia, cont’d)
(d) Proportion of chargeable youth who were charged, 1986-2003
31%
0%
10%
20%
30%
40%
50%
60%
70%
80%
90%
100%
1986 1987 1988 1989 1990 1991 1992 1993 1994 1995 1996 1997 1998 1999 2000 2001 2002 2003
% c
harg
ed 51%
(e) Proportion of chargeable youth who were charged, by quarter, 2001-2003
20012001 2001 2001
2002 2002 2002 20022003
2003 20032003
0.0%
10.0%
20.0%
30.0%
40.0%
50.0%
60.0%
70.0%
80.0%
90.0%
100.0%
January-March April-June July-September October-December (f) Rates of chargeable youth, 1986-2003
0
2,000
4,000
6,000
8,000
10,000
12,000
14,000
1986 1987 1988 1989 1990 1991 1992 1993 1994 1995 1996 1997 1998 1999 2000 2001 2002 2003
Rat
e pe
r 100
,000
you
th p
opul
atio
n
Source: Uniform Crime Reporting Survey, Canadian Centre for Justice Statistics. See Appendix Tables A.1-A.5.

68
Figure A.10 Rates and proportions of young persons charged, not charged (extrajudicial measures), and chargeable, Yukon Territory (a) Rates of youth charged and not charged (extrajudicial measures), 1986-2003
0
1,000
2,000
3,000
4,000
5,000
6,000
7,000
8,000
9,000
10,000
11,000
12,000
13,000
14,000
15,000
16,000
17,000
18,000
19,000
20,000
21,000
1986 1987 1988 1989 1990 1991 1992 1993 1994 1995 1996 1997 1998 1999 2000 2001 2002 2003
Rat
e pe
r 100
,000
you
th p
opul
atio
n
Charged Not charged (extrajudicial measures) (b) Rates of youth charged, by quarter, 2001-2003
2001
2001
2001
2001
2002 2002
2002
2002
2003
20032003
2003
0
1,000
2,000
3,000
4,000
5,000
6,000
7,000
8,000
9,000
10,000
11,000
12,000
13,000
January-March April-June July-September October-December (c) Rates of youth receiving extrajudicial measures, by quarter, 2001-2003
2001
2001
2001
2001
2002
20022002
2002
2003
2003
2003
2003
0
2,000
4,000
6,000
8,000
10,000
12,000
14,000
16,000
18,000
20,000
22,000
24,000
26,000
January-March April-June July-September October-December

69
Figure A.10 (Yukon Territory, cont’d)
(d) Proportion of chargeable youth who were charged, 1986-2003
23%
0%
10%
20%
30%
40%
50%
60%
70%
80%
90%
100%
1986 1987 1988 1989 1990 1991 1992 1993 1994 1995 1996 1997 1998 1999 2000 2001 2002 2003
% c
harg
ed
60%
(e) Proportion of chargeable youth who were charged, by quarter, 2001-2003
2001
2001
2001
2001
2002
2002
2002
2002
2003
20032003
2003
0.0%
10.0%
20.0%
30.0%
40.0%
50.0%
60.0%
70.0%
80.0%
90.0%
100.0%
January-March April-June July-September October-December (f) Rates of chargeable youth, 1986-2003
0
2,000
4,000
6,000
8,000
10,000
12,000
14,000
16,000
18,000
20,000
22,000
24,000
26,000
28,000
30,000
32,000
1986 1987 1988 1989 1990 1991 1992 1993 1994 1995 1996 1997 1998 1999 2000 2001 2002 2003
Rat
e pe
r 100
,000
you
th p
opul
atio
n
Source: Uniform Crime Reporting Survey, Canadian Centre for Justice Statistics. See Appendix Tables A.1-A.5.

70
Figure A.11 Rates and proportions of young persons charged, not charged (extrajudicial measures), and chargeable, Northwest Territories (a) Rates of youth charged and not charged (extrajudicial measures), 1986-2003
0
2,000
4,000
6,000
8,000
10,000
12,000
14,000
16,000
18,000
20,000
22,000
24,000
26,000
1986 1987 1988 1989 1990 1991 1992 1993 1994 1995 1996 1997 1998 1999 2000 2001 2002 2003
Rat
e pe
r 100
,000
you
th p
opul
atio
n
Charged Not charged (extrajudicial measures) (b) Rates of youth charged, by quarter, 2001-2003
2001
2001
2001
20012002
20022002
2002
2003
2003
2003
2003
0
2,000
4,000
6,000
8,000
10,000
12,000
14,000
16,000
18,000
20,000
22,000
January-March April-June July-September October-December (c) Rates of youth receiving extrajudicial measures, by quarter, 2001-2003
2001
2001 2001
20012002
2002
2002
2002
2003
2003
2003
2003
0
3,000
6,000
9,000
12,000
15,000
18,000
21,000
24,000
27,000
30,000
33,000
January-March April-June July-September October-December

Figure A.11 (Northwest Territories, cont’d)
(d) Proportion of chargeable youth who were charged, 1986-2003
35%
0%
10%
20%
30%
40%
50%
60%
70%
80%
90%
100%
1986 1987 1988 1989 1990 1991 1992 1993 1994 1995 1996 1997 1998 1999 2000 2001 2002 2003
% c
harg
ed
58%
(e) Proportion of chargeable youth who were charged, by quarter, 2001-2003
2001 2001
2001
200120022002
20022002
2003
2003
20032003
0.0%
10.0%
20.0%
30.0%
40.0%
50.0%
60.0%
70.0%
80.0%
90.0%
100.0%
January-March April-June July-September October-December (f) Rates of chargeable youth, 1986-2003
0
5,000
10,000
15,000
20,000
25,000
30,000
35,000
40,000
1986 1987 1988 1989 1990 1991 1992 1993 1994 1995 1996 1997 1998 1999 2000 2001 2002 2003
Rat
e pe
r 100
,000
you
th p
opul
atio
n
Note: Panels a, d, and f (covering 1986-2003) include Nunavut. Source: Uniform Crime Reporting Survey, Canadian Centre for Justice Statistics. See Appendix Tables A.1-A.5.

72
Figure A.12 Rates and proportions of young persons charged, not charged (extrajudicial measures), and chargeable, Nunavut (a) Rates of youth charged, by quarter, 2001-2003
20012001
2001
2001
2002
2002
2002
2002
2003
2003
2003
2003
0
2,000
4,000
6,000
8,000
10,000
12,000
14,000
16,000
18,000
January-March April-June July-September October-December (b) Rates of youth receiving extrajudicial measures, by quarter, 2001-2003
2001
2001
2001
20012002
2002
2002
2002
2003
2003
2003
2003
0
5,000
10,000
15,000
20,000
25,000
30,000
35,000
January-March April-June July-September October-December (c) Proportion of chargeable youth who were charged, by quarter, 2001-2003
2001
2001
2001
20012002
2002
2002
20022003
20032003
2003
0.0%
10.0%
20.0%
30.0%
40.0%
50.0%
60.0%
70.0%
80.0%
90.0%
100.0%
January-March April-June July-September October-December Note: Nunavut is combined with the Northwest Territories in the analyses for 1986-2003. See Table A.11. Source: Uniform Crime Reporting Survey, Canadian Centre for Justice Statistics. See Appendix Tables A.4-A.5.
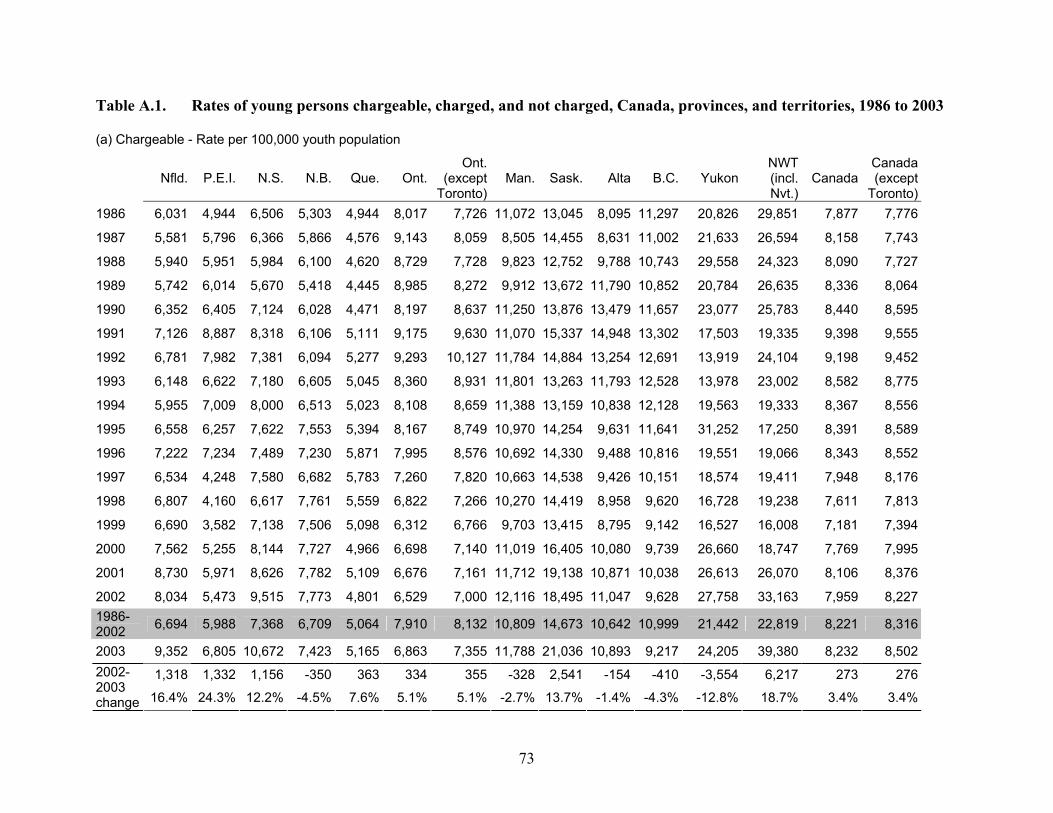
73
Table A.1. Rates of young persons chargeable, charged, and not charged, Canada, provinces, and territories, 1986 to 2003
(a) Chargeable - Rate per 100,000 youth population
Nfld. P.E.I. N.S. N.B. Que. Ont.Ont.
(except Toronto)
Man. Sask. Alta B.C. YukonNWT (incl. Nvt.)
CanadaCanada (except
Toronto)1986 6,031 4,944 6,506 5,303 4,944 8,017 7,726 11,072 13,045 8,095 11,297 20,826 29,851 7,877 7,776
1987 5,581 5,796 6,366 5,866 4,576 9,143 8,059 8,505 14,455 8,631 11,002 21,633 26,594 8,158 7,743
1988 5,940 5,951 5,984 6,100 4,620 8,729 7,728 9,823 12,752 9,788 10,743 29,558 24,323 8,090 7,727
1989 5,742 6,014 5,670 5,418 4,445 8,985 8,272 9,912 13,672 11,790 10,852 20,784 26,635 8,336 8,064
1990 6,352 6,405 7,124 6,028 4,471 8,197 8,637 11,250 13,876 13,479 11,657 23,077 25,783 8,440 8,595
1991 7,126 8,887 8,318 6,106 5,111 9,175 9,630 11,070 15,337 14,948 13,302 17,503 19,335 9,398 9,555
1992 6,781 7,982 7,381 6,094 5,277 9,293 10,127 11,784 14,884 13,254 12,691 13,919 24,104 9,198 9,452
1993 6,148 6,622 7,180 6,605 5,045 8,360 8,931 11,801 13,263 11,793 12,528 13,978 23,002 8,582 8,775
1994 5,955 7,009 8,000 6,513 5,023 8,108 8,659 11,388 13,159 10,838 12,128 19,563 19,333 8,367 8,556
1995 6,558 6,257 7,622 7,553 5,394 8,167 8,749 10,970 14,254 9,631 11,641 31,252 17,250 8,391 8,589
1996 7,222 7,234 7,489 7,230 5,871 7,995 8,576 10,692 14,330 9,488 10,816 19,551 19,066 8,343 8,552
1997 6,534 4,248 7,580 6,682 5,783 7,260 7,820 10,663 14,538 9,426 10,151 18,574 19,411 7,948 8,176
1998 6,807 4,160 6,617 7,761 5,559 6,822 7,266 10,270 14,419 8,958 9,620 16,728 19,238 7,611 7,813
1999 6,690 3,582 7,138 7,506 5,098 6,312 6,766 9,703 13,415 8,795 9,142 16,527 16,008 7,181 7,394
2000 7,562 5,255 8,144 7,727 4,966 6,698 7,140 11,019 16,405 10,080 9,739 26,660 18,747 7,769 7,995
2001 8,730 5,971 8,626 7,782 5,109 6,676 7,161 11,712 19,138 10,871 10,038 26,613 26,070 8,106 8,376
2002 8,034 5,473 9,515 7,773 4,801 6,529 7,000 12,116 18,495 11,047 9,628 27,758 33,163 7,959 8,2271986-2002 6,694 5,988 7,368 6,709 5,064 7,910 8,132 10,809 14,673 10,642 10,999 21,442 22,819 8,221 8,316
2003 9,352 6,805 10,672 7,423 5,165 6,863 7,355 11,788 21,036 10,893 9,217 24,205 39,380 8,232 8,502
1,318 1,332 1,156 -350 363 334 355 -328 2,541 -154 -410 -3,554 6,217 273 2762002-2003 change 16.4% 24.3% 12.2% -4.5% 7.6% 5.1% 5.1% -2.7% 13.7% -1.4% -4.3% -12.8% 18.7% 3.4% 3.4%

74
Table A.1 (continued) (b) Charged (or recommended for charging) - Rate per 100,000 youth population
Nfld. P.E.I. N.S. N.B. Que. Ont.Ont.
(except Toronto)
Man. Sask. Alta B.C. YukonNWT (incl. Nvt.)
CanadaCanada (except
Toronto)1986 3,259 2,801 4,459 3,526 3,948 4,561 4,428 8,837 7,753 5,081 6,678 11,522 19,516 4,984 4,977
1987 3,196 3,488 4,396 3,784 3,749 4,820 4,723 6,198 8,938 5,238 6,394 11,034 18,129 4,949 4,929
1988 3,269 3,760 4,434 4,119 3,877 4,820 4,671 7,225 7,636 6,463 6,195 16,593 15,972 5,075 5,048
1989 4,227 4,264 4,490 4,035 3,329 5,270 5,209 7,476 8,722 8,341 6,218 12,444 16,983 5,361 5,348
1990 5,256 4,903 5,734 4,484 3,380 5,660 5,638 8,488 9,157 9,215 6,814 15,963 16,257 5,814 5,818
1991 6,071 6,128 6,522 4,447 3,719 6,476 6,428 8,683 10,202 10,117 7,596 11,626 13,752 6,460 6,444
1992 5,833 5,789 5,672 4,285 3,516 6,285 6,454 9,054 10,366 8,693 6,866 7,204 14,331 6,094 6,133
1993 5,211 4,876 5,798 4,813 3,063 5,905 5,935 9,758 9,555 7,700 6,550 10,443 14,042 5,712 5,708
1994 4,857 4,403 6,188 4,798 2,807 5,595 5,587 8,811 9,245 6,998 6,312 14,309 10,538 5,394 5,378
1995 4,908 3,382 5,655 5,204 2,831 5,674 5,700 9,132 10,077 6,624 5,960 20,158 8,815 5,402 5,391
1996 5,329 4,317 5,971 5,024 2,943 5,421 5,426 9,000 10,155 6,665 5,526 14,180 11,030 5,321 5,315
1997 4,436 2,854 5,978 4,569 2,660 4,962 5,012 8,894 10,550 5,763 5,046 14,960 11,695 4,923 4,936
1998 4,876 2,435 5,190 5,638 2,549 4,742 4,728 8,510 11,091 5,755 4,517 12,160 11,806 4,775 4,773
1999 4,347 2,288 5,316 5,261 2,381 4,402 4,485 8,342 10,414 5,420 4,257 11,107 11,199 4,500 4,535
2000 4,480 2,615 4,400 5,066 2,268 4,761 4,829 8,156 11,000 5,602 4,007 14,024 9,097 4,589 4,599
2001 5,403 3,186 4,079 5,049 2,293 4,788 4,929 8,228 12,445 5,621 3,817 9,577 12,845 4,656 4,694
2002 4,857 2,550 4,353 5,055 2,221 4,552 4,709 8,183 11,767 5,684 3,589 10,611 13,145 4,492 4,5411986-2002 4,695 3,767 5,214 4,656 3,031 5,217 5,229 8,410 9,945 6,764 5,667 12,818 13,480 5,206 5,210
2003 4,470 1,791 3,856 4,177 2,133 3,497 3,487 6,221 11,746 4,995 2,868 5,463 13,838 3,759 3,775
-387 -759 -497 -878 -88 -1,056 -1,222 -1,961 -20 -689 -721 -5,148 693 -733 -7662002-2003 change -8.0% -29.8% -11.4% -17.4% -4.0% -23.2% -26.0% -24.0% -0.2% -12.1% -20.1% -48.5% 5.3% -16.3% -16.9%

75
Table A.1 (continued) (c) Not charged (extrajudicial measures) - Rate per 100,000 youth population
Nfld. P.E.I. N.S. N.B. Que. Ont.Ont.
(except Toronto)
Man. Sask. Alta. B.C. YukonN.W.T
(incl. Nvt.)
CanadaCanada (except
Toronto)1986 2,772 2,143 2,047 1,777 996 3,456 3,298 2,236 5,292 3,014 4,618 9,304 10,336 2,893 2,800
1987 2,385 2,309 1,970 2,082 827 4,322 3,336 2,307 5,517 3,392 4,608 10,599 8,466 3,209 2,815
1988 2,670 2,191 1,550 1,981 743 3,909 3,056 2,598 5,116 3,325 4,548 12,965 8,351 3,014 2,678
1989 1,514 1,750 1,180 1,383 1,116 3,715 3,064 2,436 4,951 3,450 4,635 8,341 9,652 2,975 2,716
1990 1,096 1,502 1,390 1,544 1,091 2,537 2,999 2,762 4,719 4,264 4,843 7,114 9,525 2,626 2,777
1991 1,055 2,759 1,796 1,659 1,391 2,699 3,202 2,388 5,135 4,831 5,706 5,877 5,583 2,937 3,111
1992 947 2,193 1,709 1,809 1,761 3,008 3,673 2,730 4,517 4,561 5,826 6,716 9,774 3,104 3,318
1993 937 1,746 1,382 1,792 1,982 2,456 2,996 2,043 3,708 4,093 5,978 3,535 8,961 2,870 3,066
1994 1,098 2,607 1,813 1,715 2,216 2,514 3,071 2,576 3,914 3,840 5,816 5,255 8,794 2,973 3,179
1995 1,649 2,875 1,967 2,349 2,563 2,493 3,050 1,839 4,177 3,007 5,681 11,094 8,435 2,988 3,197
1996 1,894 2,917 1,519 2,205 2,928 2,573 3,150 1,692 4,175 2,823 5,290 5,370 8,036 3,023 3,236
1997 2,098 1,394 1,602 2,114 3,123 2,298 2,808 1,770 3,988 3,663 5,105 3,614 7,716 3,025 3,240
1998 1,931 1,724 1,426 2,123 3,010 2,079 2,538 1,760 3,329 3,203 5,102 4,568 7,432 2,836 3,040
1999 2,344 1,295 1,822 2,245 2,717 1,910 2,281 1,362 3,001 3,375 4,884 5,420 4,809 2,681 2,859
2000 3,082 2,640 3,744 2,661 2,697 1,937 2,311 2,863 5,405 4,477 5,732 12,636 9,650 3,180 3,396
2001 3,328 2,785 4,546 2,733 2,816 1,888 2,232 3,484 6,693 5,250 6,221 17,037 13,226 3,450 3,683
2002 3,177 2,924 5,163 2,718 2,580 1,976 2,291 3,933 6,728 5,363 6,038 17,147 20,018 3,467 3,6861986-2002 1,999 2,221 2,154 2,052 2,033 2,692 2,903 2,399 4,727 3,878 5,331 8,623 9,339 3,015 3,106
2003 4,882 5,014 6,816 3,245 3,032 3,366 3,868 5,566 9,289 5,898 6,349 18,741 25,542 4,473 4,727
1,704 2,091 1,654 528 451 1,389 1,577 1,633 2,561 535 311 1,594 5,525 1,006 1,0422002-2003 change 53.6% 71.5% 32.0% 19.4% 17.5% 70.3% 68.8% 41.5% 38.1% 10.0% 5.1% 9.3% 27.6% 29.0% 28.3%
Source: Canadian Centre for Justice Statistics, Uniform Crime Reporting Survey
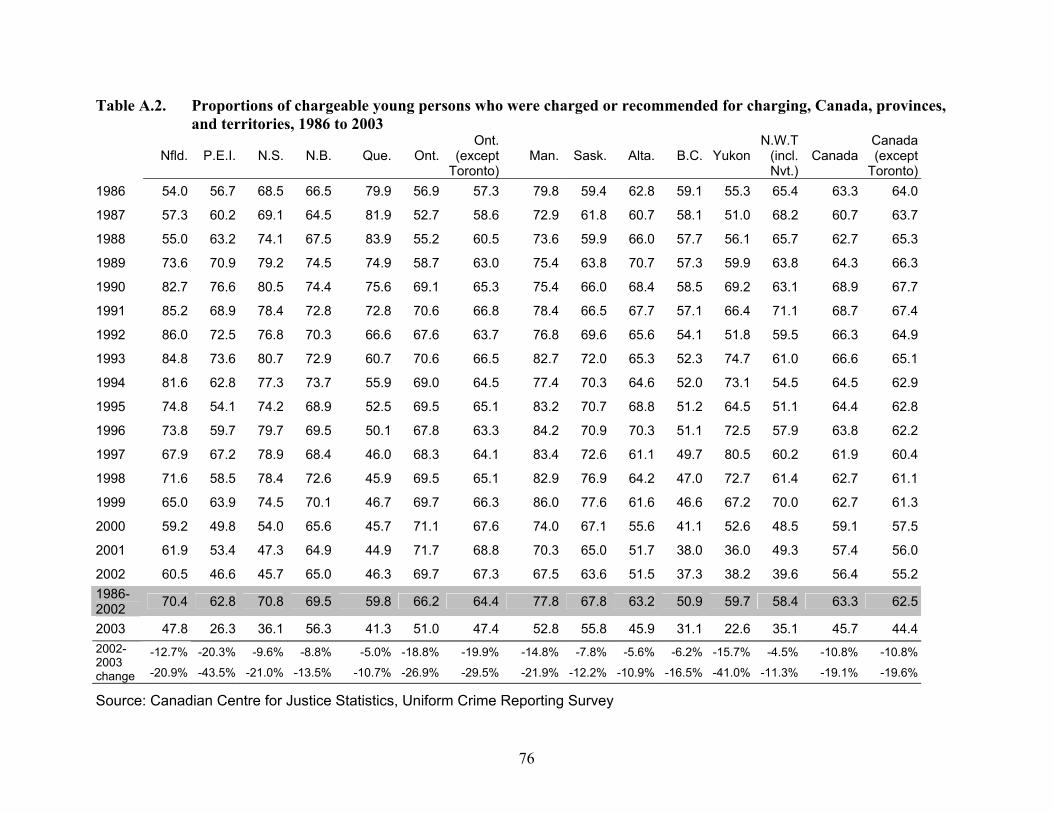
76
Table A.2. Proportions of chargeable young persons who were charged or recommended for charging, Canada, provinces, and territories, 1986 to 2003
Nfld. P.E.I. N.S. N.B. Que. Ont.Ont.
(except Toronto)
Man. Sask. Alta. B.C. YukonN.W.T
(incl. Nvt.)
CanadaCanada (except
Toronto)1986 54.0 56.7 68.5 66.5 79.9 56.9 57.3 79.8 59.4 62.8 59.1 55.3 65.4 63.3 64.0
1987 57.3 60.2 69.1 64.5 81.9 52.7 58.6 72.9 61.8 60.7 58.1 51.0 68.2 60.7 63.7
1988 55.0 63.2 74.1 67.5 83.9 55.2 60.5 73.6 59.9 66.0 57.7 56.1 65.7 62.7 65.3
1989 73.6 70.9 79.2 74.5 74.9 58.7 63.0 75.4 63.8 70.7 57.3 59.9 63.8 64.3 66.3
1990 82.7 76.6 80.5 74.4 75.6 69.1 65.3 75.4 66.0 68.4 58.5 69.2 63.1 68.9 67.7
1991 85.2 68.9 78.4 72.8 72.8 70.6 66.8 78.4 66.5 67.7 57.1 66.4 71.1 68.7 67.4
1992 86.0 72.5 76.8 70.3 66.6 67.6 63.7 76.8 69.6 65.6 54.1 51.8 59.5 66.3 64.9
1993 84.8 73.6 80.7 72.9 60.7 70.6 66.5 82.7 72.0 65.3 52.3 74.7 61.0 66.6 65.1
1994 81.6 62.8 77.3 73.7 55.9 69.0 64.5 77.4 70.3 64.6 52.0 73.1 54.5 64.5 62.9
1995 74.8 54.1 74.2 68.9 52.5 69.5 65.1 83.2 70.7 68.8 51.2 64.5 51.1 64.4 62.8
1996 73.8 59.7 79.7 69.5 50.1 67.8 63.3 84.2 70.9 70.3 51.1 72.5 57.9 63.8 62.2
1997 67.9 67.2 78.9 68.4 46.0 68.3 64.1 83.4 72.6 61.1 49.7 80.5 60.2 61.9 60.4
1998 71.6 58.5 78.4 72.6 45.9 69.5 65.1 82.9 76.9 64.2 47.0 72.7 61.4 62.7 61.1
1999 65.0 63.9 74.5 70.1 46.7 69.7 66.3 86.0 77.6 61.6 46.6 67.2 70.0 62.7 61.3
2000 59.2 49.8 54.0 65.6 45.7 71.1 67.6 74.0 67.1 55.6 41.1 52.6 48.5 59.1 57.5
2001 61.9 53.4 47.3 64.9 44.9 71.7 68.8 70.3 65.0 51.7 38.0 36.0 49.3 57.4 56.0
2002 60.5 46.6 45.7 65.0 46.3 69.7 67.3 67.5 63.6 51.5 37.3 38.2 39.6 56.4 55.21986-2002 70.4 62.8 70.8 69.5 59.8 66.2 64.4 77.8 67.8 63.2 50.9 59.7 58.4 63.3 62.5
2003 47.8 26.3 36.1 56.3 41.3 51.0 47.4 52.8 55.8 45.9 31.1 22.6 35.1 45.7 44.4
-12.7% -20.3% -9.6% -8.8% -5.0% -18.8% -19.9% -14.8% -7.8% -5.6% -6.2% -15.7% -4.5% -10.8% -10.8%2002-2003 change -20.9% -43.5% -21.0% -13.5% -10.7% -26.9% -29.5% -21.9% -12.2% -10.9% -16.5% -41.0% -11.3% -19.1% -19.6%
Source: Canadian Centre for Justice Statistics, Uniform Crime Reporting Survey

77
Table A.3. Rates of young persons chargeable, charged, and not charged, by type of offence, Canada, 1986 to 2003
(a) Chargeable - Rate per 100,000 youth population
Drugs Theft under
Mischief under
Assault level 1
Possess stolen
property
Other Criminal
Code
Indictable property
Violent (except
Assault 1)
Bail violations and FTA
Fraud Probation violations
1986 210 2,729 514 349 247 1,865 1,961 301 143 154 58
1987 203 2,775 634 413 254 2,095 1,861 318 162 151 84
1988 201 2,657 699 442 264 2,107 1,817 352 169 153 92
1989 189 2,720 723 505 273 2,197 1,766 411 206 155 114
1990 172 2,752 710 552 301 2,010 1,924 446 226 182 95
1991 143 2,933 782 636 366 2,338 2,119 540 298 194 123
1992 151 2,790 823 691 371 2,324 1,959 561 327 200 142
1993 207 2,388 731 761 343 2,178 1,814 572 328 146 168
1994 299 2,250 725 774 336 2,121 1,682 562 310 136 202
1995 336 2,470 731 807 314 2,136 1,467 557 346 136 161
1996 367 2,402 728 814 305 2,109 1,426 545 357 138 234
1997 358 2,134 697 808 278 2,110 1,306 552 368 123 276
1998 392 1,876 665 822 247 2,121 1,226 541 397 124 261
1999 469 1,693 616 791 249 2,053 1,015 510 378 129 272
2000 593 1,683 720 902 270 2,342 1,029 563 408 128 256
2001 684 1,670 787 906 257 2,562 1,048 591 480 126 254
2002 683 1,674 782 890 270 2,479 973 576 471 110 296
1986-2002 339 2,312 710 704 290 2,188 1,538 502 350 145 185
2003 629 1,771 907 924 275 2,644 994 586 475 108 294
-54 98 124 34 5 165 20 10 4 -3 -22002-2003 change -7.9% 5.8% 15.9% 3.9% 2.0% 6.7% 2.1% 1.7% 0.9% -2.3% -0.6%
See notes at foot of table.

78
Table A.3 (continued) (b) Charged (or recommended for charging) - Rate per 100,000 youth population
Drugs Theft under
Mischief under
Assault level 1
Possess stolen
property
Other Criminal
Code
Indictable property
Violent (except
Assault 1)
Bail violations and FTA
Fraud Probation violations
1986 157 1,607 207 176 202 920 1,553 233 131 115 18
1987 145 1,556 255 210 210 1,008 1,437 241 151 108 32
1988 145 1,554 316 236 223 1,074 1,413 273 156 116 38
1989 139 1,656 313 290 234 1,153 1,392 324 190 119 50
1990 138 1,804 315 337 265 1,202 1,500 359 216 143 64
1991 116 1,898 347 394 322 1,396 1,660 438 290 151 82
1992 115 1,638 354 417 325 1,375 1,511 452 318 157 100
1993 147 1,442 315 454 302 1,307 1,369 469 318 107 111
1994 204 1,300 295 462 293 1,234 1,233 456 299 98 110
1995 213 1,378 310 482 273 1,263 1,109 459 335 97 127
1996 225 1,317 305 480 264 1,250 1,084 452 345 96 151
1997 207 1,086 277 460 236 1,242 987 448 357 80 175
1998 226 986 275 463 210 1,266 922 439 384 80 183
1999 266 871 261 441 215 1,224 776 414 366 83 208
2000 317 812 268 470 225 1,291 749 445 391 83 196
2001 343 768 266 474 222 1,359 743 473 461 78 191
2002 338 739 266 465 226 1,285 681 455 450 68 230
1986-2002 205 1,304 290 398 249 1,229 1,171 404 307 104 124
2003 219 486 207 374 197 1,135 647 442 442 56 200
-119 -253 -59 -90 -29 -150 -34 -13 -8 -13 -312002-2003 change -35.3% -34.3% -22.1% -19.4% -12.8% -11.7% -5.0% -2.9% -1.8% -18.5% -13.3%
See notes at foot of table.

79
Table A.3 (continued) (c) Not charged - Rate per 100,000 youth population
Drugs Theft under
Mischief under
Assault level 1
Possess stolen
property
Other Criminal
Code
Indictable property
Violent (except
Assault 1)
Bail violations and FTA
Fraud Probationviolations
1986 53 1,122 307 173 44 945 408 68 12 39 401987 58 1,219 379 204 44 1,087 424 77 11 42 521988 56 1,102 384 206 41 1,034 404 78 13 37 541989 50 1,064 410 215 39 1,044 374 87 16 36 641990 35 948 394 215 36 808 425 87 9 38 311991 27 1,036 435 242 44 942 460 101 8 43 411992 36 1,153 469 273 46 949 449 109 9 44 421993 60 945 415 307 42 871 444 103 9 38 571994 95 950 430 312 43 887 449 106 10 37 921995 124 1,093 421 324 41 873 358 98 11 39 351996 142 1,085 423 333 41 859 342 94 12 43 821997 151 1,048 420 349 42 868 319 103 11 43 1011998 166 890 391 360 37 856 303 102 14 44 781999 202 821 355 350 33 828 239 96 12 46 642000 276 871 452 432 44 1,051 281 118 17 45 602001 341 902 521 432 35 1,203 305 118 20 48 622002 345 935 517 425 44 1,194 292 121 21 42 661986-2002 134 1,008 420 306 41 960 367 98 13 42 612003 410 1,285 700 550 78 1,510 347 144 33 52 95
65 351 183 125 34 316 54 23 12 10 292002-2003 change 18.9% 37.5% 35.4% 29.3% 77.4% 26.4% 18.6% 18.9% 59.9% 24.1% 43.9%
Source: Uniform Crime Reporting Survey, Canadian Centre for Justice Statistics
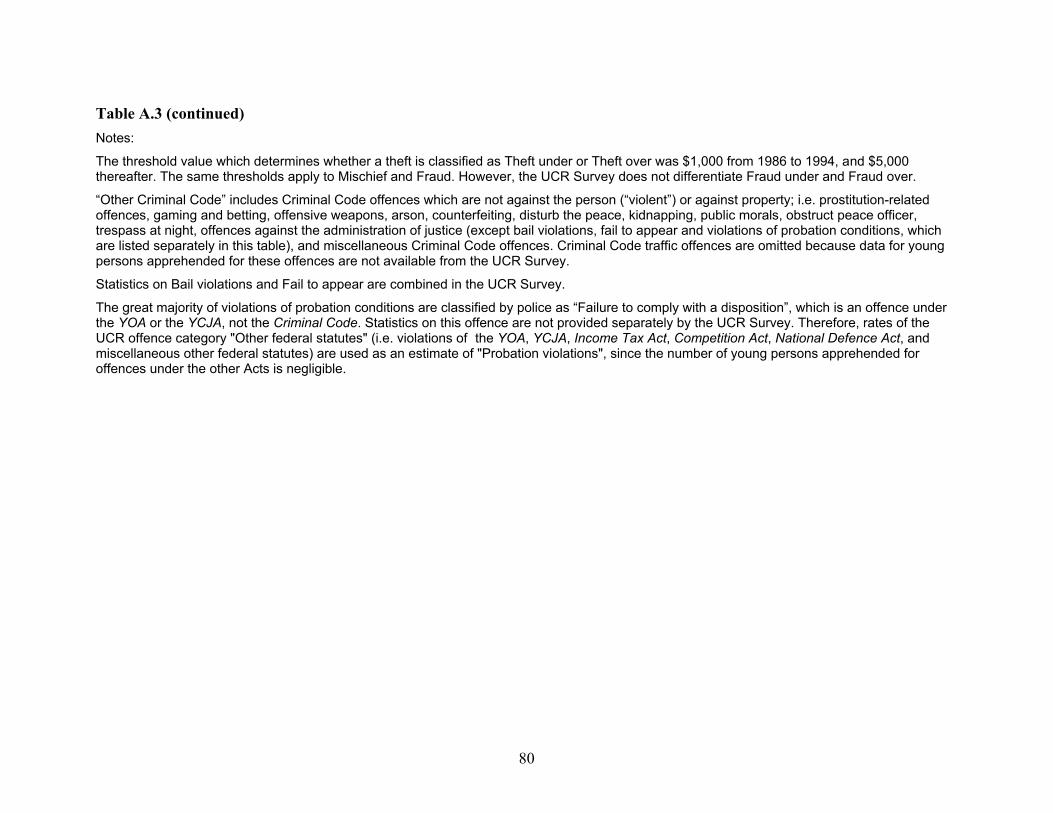
80
Table A.3 (continued) Notes:
The threshold value which determines whether a theft is classified as Theft under or Theft over was $1,000 from 1986 to 1994, and $5,000 thereafter. The same thresholds apply to Mischief and Fraud. However, the UCR Survey does not differentiate Fraud under and Fraud over.
“Other Criminal Code” includes Criminal Code offences which are not against the person (“violent”) or against property; i.e. prostitution-related offences, gaming and betting, offensive weapons, arson, counterfeiting, disturb the peace, kidnapping, public morals, obstruct peace officer, trespass at night, offences against the administration of justice (except bail violations, fail to appear and violations of probation conditions, which are listed separately in this table), and miscellaneous Criminal Code offences. Criminal Code traffic offences are omitted because data for young persons apprehended for these offences are not available from the UCR Survey.
Statistics on Bail violations and Fail to appear are combined in the UCR Survey.
The great majority of violations of probation conditions are classified by police as “Failure to comply with a disposition”, which is an offence under the YOA or the YCJA, not the Criminal Code. Statistics on this offence are not provided separately by the UCR Survey. Therefore, rates of the UCR offence category "Other federal statutes" (i.e. violations of the YOA, YCJA, Income Tax Act, Competition Act, National Defence Act, and miscellaneous other federal statutes) are used as an estimate of "Probation violations", since the number of young persons apprehended for offences under the other Acts is negligible.

81
Table A.4. Rates of young persons chargeable, charged, and not charged, Canada, provinces, and territories, by quarter, 2001 to 2003 (a) Chargeable - Rate per 100,000 youth population
Nfld. P.E.I. N.S. N.B. Que. Ont.Ont.
(except Toronto)
Man. Sask. Alta B.C. Yukon NWT Nvt. CanadaCanada (except
Toronto)2001 7,245 4,783 7,954 6,959 4,538 6,090 6,411 10,042 16,551 9,877 9,978 26,232 26,014 15,798 7,387 7,593
2002 7,335 5,425 9,063 7,632 4,379 5,879 6,259 10,497 15,541 9,384 9,146 20,801 25,468 21,741 7,131 7,354
2003 8,321 5,438 9,268 7,120 4,782 6,161 6,449 10,251 16,878 10,151 9,364 21,024 30,319 31,749 7,497 7,695
986 13 205 -512 403 281 190 -246 1,337 767 219 222 4,851 10,008 366 340
January-March
2002-2003 change 13.4% 0.2% 2.3% -6.7% 9.2% 4.8% 3.0% -2.3% 8.6% 8.2% 2.4% 1.1% 19.0% 46.0% 5.1% 4.6%
2001 8,558 6,519 8,919 7,960 5,322 7,215 7,814 12,708 20,087 11,264 10,801 29,008 32,938 20,840 8,596 8,902
2002 7,832 5,002 9,489 7,747 5,202 6,946 7,386 12,477 18,821 11,493 10,381 27,407 34,022 28,989 8,368 8,624
2003 8,879 7,456 11,868 7,968 5,674 7,372 7,879 12,852 22,518 11,772 9,820 30,014 38,442 34,047 8,852 9,135
1,047 2,454 2,380 221 473 426 493 375 3,698 279 -561 2,607 4,420 5,058 484 511
April- June
2002-2003 change 13.4% 49.1% 25.1% 2.8% 9.1% 6.1% 6.7% 3.0% 19.6% 2.4% -5.4% 9.5% 13.0% 17.4% 5.8% 5.9%
2001 8,710 6,061 8,583 7,607 4,811 6,279 6,764 11,719 20,209 11,248 9,666 29,424 36,993 22,409 7,932 8,219
2002 7,500 5,262 8,967 7,382 4,547 6,356 6,891 12,756 19,555 10,671 9,422 31,342 36,938 43,050 7,823 8,116
2003 9,919 6,577 10,552 7,359 4,733 6,429 6,971 11,955 23,378 11,305 9,052 26,418 50,437 45,326 8,118 8,429
2,419 1,315 1,585 -23 186 73 80 -801 3,823 634 -371 -4,925 13,499 2,276 294 313
July- Sept.
2002-2003 change 32.2% 25.0% 17.7% -0.3% 4.1% 1.1% 1.2% -6.3% 19.6% 5.9% -3.9% -15.7% 36.5% 5.3% 3.8% 3.9%
2001 10,408 6,519 9,020 8,602 5,766 7,121 7,656 12,378 19,707 11,094 9,707 21,790 25,124 26,218 8,506 8,790
2002 9,470 6,204 10,544 8,329 5,077 6,934 7,463 12,732 20,063 12,639 9,561 31,483 38,299 36,560 8,514 8,812
2003 10,288 7,749 11,000 7,243 5,469 7,489 8,121 12,093 21,369 10,344 8,633 19,364 41,842 42,507 8,462 8,751
818 1,545 456 -1,086 392 555 658 -639 1,305 -2,294 -929 -12,119 3,543 5,946 -52 -61
October-December
2002-2003 change 8.6% 24.9% 4.3% -13.0% 7.7% 8.0% 8.8% -5.0% 6.5% -18.2% -9.7% -38.5% 9.3% 16.3% -0.6% -0.7%
1,428 1,771 1,474 -296 350 351 410 -355 2,942 -461 -620 -4,812 7,154 4,427 242 254April-December
2002-2003 change 17.3% 32.3% 15.2% -3.8% 7.1% 5.2% 5.7% -2.8% 15.1% -4.0% -6.3% -16.0% 19.6% 12.2% 2.9% 3.0%

82
Table A.4. (cont’d) (b) Charged (or recommended for charging) - Rate per 100,000 youth population
Nfld. P.E.I. N.S. N.B. Que. Ont.Ont.
(except Toronto)
Man. Sask. Alta B.C. Yukon NWT Nvt. CanadaCanada (except
Toronto)2001 4,619 2,555 3,830 4,762 2,137 4,417 4,448 7,231 10,999 5,270 4,035 11,103 13,749 8,403 4,340 4,345
2002 4,795 2,306 4,236 5,091 2,078 4,215 4,316 7,537 10,514 5,115 3,508 9,557 12,345 11,033 4,175 4,206
2003 5,030 2,116 3,986 4,706 2,173 3,955 3,978 6,649 10,736 5,348 3,361 8,299 13,506 15,561 4,060 4,075
236 -190 -249 -385 95 -260 -338 -888 222 234 -147 -1,259 1,161 4,528 -115 -131
January-March
2002-2003 change 4.9% -8.2% -5.9% -7.6% 4.6% -6.2% -7.8% -11.8% 2.1% 4.6% -4.2% -13.2% 9.4% 41.0% -2.8% -3.1%
2001 5,324 2,948 3,723 5,042 2,292 4,977 5,145 8,988 12,847 5,573 4,125 8,050 17,606 7,843 4,794 4,837
2002 4,776 2,436 4,161 4,921 2,361 4,841 4,952 8,306 11,625 5,750 3,824 9,698 15,942 8,437 4,657 4,682
2003 3,981 1,628 4,056 3,987 2,049 3,307 3,273 6,001 11,605 4,900 2,753 5,256 11,429 8,877 3,609 3,619
-795 -808 -105 -934 -311 -1,534 -1,679 -2,305 -20 -850 -1,071 -4,442 -4,513 440 -1,048 -1,062
April- June
2002-2003 change -16.7% -33.2% -2.5% -19.0% -13.2% -31.7% -33.9% -27.8% -0.2% -14.8% -28.0% -45.8% -28.3% 5.2% -22.5% -22.7%
2001 5,146 3,276 4,193 4,969 2,253 4,661 4,865 8,497 13,227 5,807 3,592 12,491 21,266 5,938 4,634 4,701
2002 4,252 2,144 4,246 4,955 2,139 4,500 4,714 8,748 12,432 5,784 3,492 12,930 15,358 9,627 4,483 4,555
2003 4,520 1,498 3,544 4,001 2,030 3,141 3,152 6,151 12,811 4,913 2,665 5,533 20,307 10,653 3,592 3,629
268 -646 -702 -954 -110 -1,359 -1,562 -2,597 379 -871 -827 -7,398 4,949 1,026 -891 -926
July- Sept.
2002-2003 change 6.3% -30.1% -16.5% -19.3% -5.1% -30.2% -33.1% -29.7% 3.0% -15.1% -23.7% -57.2% 32.2% 10.7% -19.9% -20.3%
2001 6,521 3,964 4,545 5,423 2,492 5,096 5,259 8,196 12,708 5,836 3,515 6,662 11,869 14,342 4,854 4,891
2002 5,605 3,313 4,768 5,253 2,306 4,654 4,854 8,139 12,496 6,087 3,532 10,260 14,872 16,874 4,654 4,722
2003 4,350 1,921 3,837 4,015 2,280 3,585 3,544 6,084 11,834 4,820 2,694 2,766 15,679 14,099 3,777 3,777
-1,255 -1,392 -931 -1,238 -25 -1,069 -1,309 -2,055 -662 -1,267 -839 -7,494 806 -2,775 -877 -944
October-December
2002-2003 change -22.4% -42.0% -19.5% -23.6% -1.1% -23.0% -27.0% -25.2% -5.3% -20.8% -23.7% -73.0% 5.4% -16.4% -18.8% -20.0%
-594 -949 -580 -1,042 -149 -1,321 -1,517 -2,319 -101 -996 -912 -6,445 414 -436 -939 -977April-December
2002-2003 change -12.2% -36.1% -13.2% -20.7% -6.6% -28.3% -31.3% -27.6% -0.8% -17.0% -25.2% -58.8% 2.7% -3.7% -20.4% -21.0%

83
Table A.4. (cont’d) (c) Not Charged – Rate per 100,000 youth population
Nfld. P.E.I. N.S. N.B. Que. Ont.Ont.
(except Toronto)
Man. Sask. Alta B.C. Yukon NWT Nvt. CanadaCanada (except
Toronto)2001 2,626 2,228 4,123 2,197 2,402 1,672 1,963 2,811 5,552 4,608 5,943 15,128 12,265 7,395 3,047 3,248
2002 2,540 3,118 4,827 2,542 2,301 1,665 1,943 2,960 5,027 4,269 5,638 11,244 13,123 10,708 2,956 3,148
2003 3,291 3,321 5,281 2,414 2,609 2,206 2,471 3,601 6,142 4,803 6,003 12,725 16,812 16,188 3,437 3,619
751 203 454 -128 309 541 528 642 1,115 533 366 1,481 3,690 5,479 481 471
January-March
2002-2003 change 29.6% 6.5% 9.4% -5.0% 13.4% 32.5% 27.2% 21.7% 22.2% 12.5% 6.5% 13.2% 28.1% 51.2% 16.3% 15.0%
2001 3,234 3,571 5,196 2,918 3,030 2,238 2,669 3,720 7,240 5,691 6,676 20,958 15,331 12,997 3,802 4,064
2002 3,055 2,566 5,328 2,826 2,841 2,106 2,434 4,171 7,196 5,743 6,557 17,709 18,080 20,552 3,711 3,943
2003 4,898 5,828 7,813 3,981 3,625 4,066 4,606 6,851 10,913 6,872 7,067 24,758 27,013 25,170 5,243 5,516
1,843 3,262 2,485 1,155 784 1,960 2,172 2,680 3,717 1,129 510 7,049 8,933 4,618 1,532 1,573
April- June
2002-2003 change 60.3% 127.1% 46.6% 40.9% 27.6% 93.1% 89.2% 64.3% 51.7% 19.7% 7.8% 39.8% 49.4% 22.5% 41.3% 39.9%
2001 3,564 2,785 4,390 2,638 2,559 1,619 1,899 3,221 6,982 5,441 6,074 16,933 15,727 16,471 3,298 3,518
2002 3,249 3,118 4,720 2,427 2,408 1,856 2,177 4,008 7,123 4,887 5,931 18,412 21,580 33,423 3,340 3,561
2003 5,399 5,079 7,008 3,358 2,703 3,288 3,819 5,803 10,568 6,392 6,386 20,885 30,130 34,674 4,526 4,800
2,151 1,961 2,288 931 295 1,432 1,642 1,796 3,444 1,504 456 2,473 8,550 1,250 1,185 1,239
July- Sept.
2002-2003 change 66.2% 62.9% 48.5% 38.4% 12.3% 77.1% 75.4% 44.8% 48.4% 30.8% 7.7% 13.4% 39.6% 3.7% 35.5% 34.8%
2001 3,886 2,555 4,476 3,179 3,274 2,025 2,397 4,182 6,999 5,258 6,192 15,128 13,254 11,877 3,652 3,899
2002 3,865 2,891 5,775 3,076 2,772 2,280 2,609 4,593 7,568 6,552 6,029 21,223 23,426 19,686 3,860 4,091
2003 5,938 5,828 7,163 3,228 3,189 3,904 4,577 6,009 9,535 5,524 5,939 16,598 26,163 28,407 4,685 4,974
2,073 2,937 1,387 152 417 1,625 1,968 1,416 1,967 -1,028 -90 -4,625 2,736 8,721 825 883
October-December
2002-2003 change 53.6% 101.6% 24.0% 5.0% 15.0% 71.3% 75.4% 30.8% 26.0% -15.7% -1.5% -21.8% 11.7% 44.3% 21.4% 21.6%
2,022 2,720 2,053 746 499 1,672 1,927 1,964 3,043 535 292 1,632 6,740 4,863 1,181 1,232April-December
2002-2003 change 59.7% 95.2% 38.9% 26.9% 18.7% 80.4% 80.1% 46.1% 41.7% 9.3% 4.7% 8.5% 32.1% 19.8% 32.5% 31.9%
Source: Uniform Crime Reporting Survey, Canadian Centre for Justice Statistics.

84
Table A.5. Proportions of chargeable young persons who were charged or recommended for charging, Canada, provinces, and territories, by quarter, 2001 to 2003
Nfld. P.E.I. N.S. N.B. Que. Ont.Ont.
(except Toronto)
Man. Sask. Alta B.C. Yukon NWT Nvt. CanadaCanada (except
Toronto) 2001 63.7% 53.4% 48.2% 68.4% 47.1% 72.5% 69.4% 72.0% 66.5% 53.4% 40.4% 42.3% 52.9% 53.2% 58.7% 57.2%
2002 65.4% 42.5% 46.7% 66.7% 47.5% 71.7% 69.0% 71.8% 67.7% 54.5% 38.4% 45.9% 48.5% 50.7% 58.5% 57.2%
2003 60.5% 38.9% 43.0% 66.1% 45.4% 64.2% 61.7% 64.9% 63.6% 52.7% 35.9% 39.5% 44.5% 49.0% 54.2% 53.0%
-4.9% -3.6% -3.7% -0.6% -2.0% -7.5% -7.3% -6.9% -4.0% -1.8% -2.5% -6.5% -3.9% -1.7% -4.4% -4.2%
January-March
2002-2003 change -7.5% -8.5% -8.0% -0.9% -4.3% -10.5% -10.5% -9.7% -6.0% -3.3% -6.4% -14.1% -8.1% -3.4% -7.5% -7.4%
2001 62.2% 45.2% 41.7% 63.3% 43.1% 69.0% 65.8% 70.7% 64.0% 49.5% 38.2% 27.8% 53.5% 37.6% 55.8% 54.3%
2002 61.0% 48.7% 43.9% 63.5% 45.4% 69.7% 67.0% 66.6% 61.8% 50.0% 36.8% 35.4% 46.9% 29.1% 55.7% 54.3%
2003 44.8% 21.8% 34.2% 50.0% 36.1% 44.9% 41.5% 46.7% 51.5% 41.6% 28.0% 17.5% 29.7% 26.1% 40.8% 39.6%
-16.2% -26.9% -9.7% -13.5% -9.3% -24.8% -25.5% -19.9% -10.2% -8.4% -8.8% -17.9% -17.1% -3.0% -14.9% -14.7%
April- June
2002-2003 change -26.5% -55.2% -22.1% -21.2% -20.4% -35.6% -38.0% -29.9% -16.6% -16.8% -23.9% -50.5% -36.6% -10.4% -26.7% -27.0%
2001 59.1% 54.1% 48.9% 65.3% 46.8% 74.2% 71.9% 72.5% 65.4% 51.6% 37.2% 42.5% 57.5% 26.5% 58.4% 57.2%
2002 56.7% 40.7% 47.4% 67.1% 47.0% 70.8% 68.4% 68.6% 63.6% 54.2% 37.1% 41.3% 41.6% 22.4% 57.3% 56.1%
2003 45.6% 22.8% 33.6% 54.4% 42.9% 48.9% 45.2% 51.5% 54.8% 43.5% 29.4% 20.9% 40.3% 23.5% 44.2% 43.1%
-11.1% -18.0% -13.8% -12.8% -4.2% -21.9% -23.2% -17.1% -8.8% -10.7% -7.6% -20.3% -1.3% 1.1% -13.1% -13.1%
July- Sept.
2002-2003 change -19.6% -44.1% -29.1% -19.0% -8.8% -31.0% -33.9% -25.0% -13.8% -19.8% -20.5% -49.2% -3.2% 5.1% -22.8% -23.3%
2001 62.7% 60.8% 50.4% 63.0% 43.2% 71.6% 68.7% 66.2% 64.5% 52.6% 36.2% 30.6% 47.2% 54.7% 57.1% 55.6%
2002 59.2% 53.4% 45.2% 63.1% 45.4% 67.1% 65.0% 63.9% 62.3% 48.2% 36.9% 32.6% 38.8% 46.2% 54.7% 53.6%
2003 42.3% 24.8% 34.9% 55.4% 41.7% 47.9% 43.6% 50.3% 55.4% 46.6% 31.2% 14.3% 37.5% 33.2% 44.6% 43.2%
-16.9% -28.6% -10.3% -7.6% -3.7% -19.3% -21.4% -13.6% -6.9% -1.6% -5.7% -18.3% -1.4% -13.0% -10.0% -10.4%
October-December
2002-2003 change -28.6% -53.6% -22.9% -12.1% -8.2% -28.7% -32.9% -21.3% -11.1% -3.2% -15.5% -56.2% -3.5% -28.1% -18.3% -19.4%
-14.8% -24.8% -11.2% -11.3% -5.8% -22.0% -23.4% -16.9% -8.7% -6.8% -7.5% -18.6% -6.0% -4.6% -12.7% -12.7% April-December
2002-2003 change -25.1% -52.0% -24.7% -17.5% -12.7% -31.8% -35.0% -25.5% -13.8% -13.5% -20.2% -51.0% -14.1% -14.1% -22.7% -23.3%
Source: Uniform Crime Reporting Survey, Canadian Centre for Justice Statistics.

85
Table A.6. Rates of young persons chargeable, charged, and not charged, by type of offence, Canada, by quarter, 2001 to 2003 (a) Chargeable - Rate per 100,000 youth population
Drugs Theft under
Mischief under
Assault level 1
Possess stolen
property
Other Criminal
Code (victimless)
Indictable property
Violent (except Assault level 1)
Bail violations
and Fail to appear
Fraud Probation violations
2001 604 1,564 601 885 245 2,224 954 556 427 124 228
2002 645 1,534 627 818 242 2,103 915 524 422 112 236
2003 597 1,663 654 888 250 2,231 876 570 454 113 307
-47 129 27 69 8 128 -40 46 31 1 72
January-March
2002-2003 change -7.3% 8.4% 4.2% 8.5% 3.4% 6.1% -4.3% 8.9% 7.4% 0.6% 30.4%
2001 679 1,710 878 989 275 2,810 1,055 640 501 134 300
2002 744 1,722 808 975 274 2,640 949 642 486 110 307
2003 674 1,975 1,039 1,021 267 2,879 973 630 481 114 312
-71 253 231 47 -6 238 24 -13 -5 4 5
April- June
2002-2003 change -9.5% 14.7% 28.6% 4.8% -2.3% 9.0% 2.5% -1.9% -1.0% 3.9% 1.6%
2001 627 1,577 826 777 278 2,639 1,078 562 507 121 255
2002 621 1,556 817 795 283 2,570 995 561 503 104 315
2003 474 1,681 979 827 290 2,803 1,090 545 487 98 293
-147 124 161 32 8 233 96 -16 -15 -6 -22
July- September
2002-2003 change -23.7% 8.0% 19.7% 4.0% 2.8% 9.1% 9.6% -2.9% -3.1% -5.9% -7.0%
2001 828 1,831 842 971 230 2,577 1,104 608 487 124 231
2002 721 1,884 876 971 282 2,601 1,035 576 472 115 326
2003 770 1,768 955 960 294 2,664 1,036 597 479 106 265
49 -116 79 -11 12 62 2 21 7 -9 -61
October-December
2002-2003 change 6.7% -6.2% 9.0% -1.1% 4.1% 2.4% 0.2% 3.7% 1.4% -7.9% -18.7%
-56 87 157 23 4 178 40 -2 -4 -4 -26April-December 2002-2003
change -8.1% 5.1% 18.8% 2.5% 1.5% 6.8% 4.1% -0.4% -0.9% -3.3% -8.2%

86
Table A.6. (cont’d) (b) Charged (or recommended for charging) - Rate per 100,000 youth population
Drugs Theft under
Mischief under
Assault level 1
Possess stolen
property
Other Criminal
Code (victimless)
Indictable property
Violent (except Assault level 1)
Bail violations
and Fail to appear
Fraud Probation violations
2001 301 726 227 474 204 1,238 695 448 411 74 1792002 329 716 230 432 207 1,152 655 417 401 69 1972003 260 663 213 430 200 1,135 626 447 432 66 232
-69 -54 -17 -3 -6 -17 -29 30 31 -3 35
January-March
2002-2003 change -21.0% -7.5% -7.3% -0.6% -3.1% -1.5% -4.4% 7.2% 7.6% -3.8% 17.8%2001 336 757 290 486 233 1,450 730 509 481 83 2092002 359 758 275 507 227 1,354 656 494 465 71 2282003 202 423 196 364 181 1,125 589 471 442 50 198
-157 -335 -79 -143 -46 -229 -66 -24 -23 -21 -30
April- June
2002-2003 change -43.6% -44.2% -28.8% -28.2% -20.3% -16.9% -10.1% -4.8% -4.9% -29.3% -13.3%2001 323 744 275 433 239 1,398 763 451 487 74 1982002 306 701 284 415 241 1,338 693 457 482 67 2492003 166 397 199 324 204 1,140 703 410 453 48 190
-140 -304 -85 -92 -37 -198 10 -47 -29 -19 -59
July- September
2002-2003 change -45.8% -43.4% -29.9% -22.1% -15.5% -14.8% 1.4% -10.3% -6.0% -28.5% -23.7%2001 412 845 271 502 214 1,351 782 487 464 83 1782002 358 782 273 504 228 1,295 721 450 451 66 2472003 246 462 219 380 202 1,138 671 439 440 58 179
-112 -320 -53 -124 -26 -157 -50 -11 -11 -8 -68
October-December
2002-2003 change -31.2% -41.0% -19.6% -24.6% -11.3% -12.1% -7.0% -2.5% -2.4% -12.0% -27.4%
-136 -320 -73 -119 -36 -195 -36 -27 -21 -16 -52April-
December 2002-2003 change -40.0% -42.8% -26.2% -25.1% -15.7% -14.6% -5.1% -5.9% -4.5% -23.5% -21.7%

87
Table A.6. (cont’d) (c) Not charged - Rate per 100,000 youth population
Drugs Theft under
Mischief under
Assault level 1
Possess stolen
property
Other Criminal
Code (victimless)
Indictable property
Violent (except Assault level 1)
Bail violations
and Fail to appear
Fraud Probation violations
2001 303 838 374 411 41 986 259 108 16 51 492002 316 818 397 386 35 951 260 106 21 44 392003 338 1,000 441 458 49 1,096 250 123 22 47 76
22 182 43 72 15 145 -11 16 1 3 37
January-March
2002-2003 change 6.9% 22.3% 10.9% 18.6% 42.1% 15.2% -4.1% 15.5% 4.0% 7.4% 93.7%2001 343 953 587 504 42 1,360 326 131 20 51 912002 386 964 532 468 46 1,287 294 148 21 39 792003 472 1,552 843 658 86 1,754 384 159 39 64 114
86 588 311 189 40 467 90 11 18 25 35
April- June
2002-2003 change 22.3% 61.0% 58.3% 40.5% 86.2% 36.3% 30.7% 7.5% 84.7% 64.7% 44.9%2001 304 833 551 345 39 1,241 315 112 20 47 562002 315 856 533 380 41 1,232 302 104 20 37 662003 308 1,284 779 504 87 1,664 388 135 34 50 103
-7 428 246 124 45 431 86 31 14 13 37
July- September
2002-2003 change -2.2% 50.1% 46.2% 32.7% 108.8% 35.0% 28.5% 30.0% 67.6% 35.8% 56.0%2001 416 986 571 469 16 1,226 321 121 23 41 532002 363 1,101 604 467 54 1,306 313 125 21 48 792003 524 1,306 736 580 92 1,525 365 158 38 47 86
161 204 132 113 37 219 52 33 17 -1 7
October-December
2002-2003 change 44.2% 18.6% 21.8% 24.2% 68.5% 16.8% 16.6% 26.1% 83.1% -2.2% 8.4%
80 407 230 142 41 373 76 25 16 12 26April-
December 2002-2003 change 22.5% 41.8% 41.3% 32.4% 86.0% 29.2% 25.1% 19.9% 78.6% 30.0% 35.2%
Notes: see Notes to Table A.3. Source: Uniform Crime Reporting Survey, Canadian Centre for Justice Statistics.