Embed Size (px)
Citation preview
The impact of the sovereign debt crisis
on bank lending rates in the euro area
Stefano Neri*
May 2013
Abstract
Since the early part of 2010 tensions in the sovereign debt markets of some euro-area countries have progressively distorted monetary and credit conditions, hindering the ECB monetary policy transmission mechanism and raising the cost of loans to non-financial corporations and households. This paper makes an empirical assessment of the impact of the tensions on bank lending rates in the main euro-area countries, concluding that they have had a significant impact on the cost of credit in the peripheral countries. A counterfactual exercise indicates that if the spreads had remained constant at the average levels recorded in April 2010, the interest rates on new loans to non-financial corporations and on residential mortgage loans to households in the peripheral countries would have been, on average, lower by 130 and 60 basis points, respectively, at the end of 2011. These results are robust to alternative measures of the cost of credit and econometric techniques.
JEL Classification: C32, E43, G21.
Keywords: sovereign debt crisis, bank lending rates, seemingly unrelated regression.
Paper presented at the Workshop “The Sovereign Debt Crisis and the Euro Area” organized by the Bank of Italy and held in Rome on February 15, 2013. The proceedings are available at: http://www.bancaditalia.it/studiricerche/convegni/atti.
The paper has been published as Bank of Italy Occasional Paper, No. 170, June 2013.
Bank of Italy, Economic Research and International Relations Area, Economic Outlook and Monetary Policy Department. I thank Tiziano Ropele, Paolo Del Giovane, Eugenio Gaiotti, Alberto Pozzolo e Giovanni Ferri for their comments and suggestions. E-mail: [email protected]. The views expressed in the paper do not necessarily reflect those of the Banca d’Italia. All errors are the responsibility of the author.
144
1. Introduction
Since early 2010 tensions in the sovereign debt markets of several euro-area countries have
progressively distorted monetary and credit conditions, raising the cost of credit for non-financial
corporations and of residential mortgage loans to households. The financial strains spread rapidly
from Greece, whose budget situation had been concealed by the official statistics, to Ireland, which
suffered the consequences of a profound banking crisis, and to Portugal, penalized by its balance-
of-trade deficit. In the summer of 2011, tensions in the financial markets hit Italian and Spanish
government bonds and assumed systemic proportions. Banks’ heightened problems with wholesale
funding worsened credit supply conditions (see the Eurosystem Bank Lending Survey for the fourth
quarter of 2011).1
The sovereign debt crisis has increased the heterogeneity of financial conditions within the
euro area. Given the predominant role of banks in financing the private sector, these cross-border
differences have posed a serious challenge to the ECB’s conduct of monetary policy, making the
transmission of monetary impulses to euro-area countries less uniform.2
The debate on the origins of the euro-area debt crisis has brought out several factors: the
macroeconomic weaknesses of some member states, which fuelled doubts about the sustainability
of their public debt; the incompleteness of the European construction (see, among others, Visco,
2012); and some form of “wake-up contagion” (Giordano et al., 2013). This paper presents an
econometric analysis of the transmission of the tensions in sovereign debt markets to the cost of
new short-term loans to non-financial corporations and mortgage loans to households in a group of
euro-area countries (Germany, France, Italy, Spain, Netherlands, Belgium, Austria, Greece,
Portugal and Finland).3 The analysis, based on monthly data for the 2003-2012 period, uses the
seemingly unrelated regression approach (SUR), which provides more efficient estimation by taking
account of the correlations between the disturbances in the equations. As a robustness check, the
estimation is also performed by ordinary least squares and for the period 2008-2012. The paper
complements the analysis by Albertazzi et al. (2012), which gauges the effects of the sovereign debt
crisis on the activity of Italian banks. Neri and Ropele (2013) assess the macroeconomic impact of
1 The report is available at http://www.ecb.int/stats/pdf/blssurvey_201201.pdf?a28f705bb565d645677ba8ce15ba6049. 2 The sovereign crisis “[…] has made difficult the transmission of impulses coming from an accommodative monetary policy through adjustments in interest rates on loans to households and firms by banks. Interest rates do not have to be identical across the euro area, but it is unacceptable if significant differences arise because of the fragmentation of capital markets or the perception of a break-up of the euro area. […] The fragmentation of the single financial market has led to a fragmentation of the single monetary policy.” See “The monetary policy of the European Central Bank and its transmission in the euro area”, speech by Mario Draghi, President of the ECB, Università Bocconi, Milan, 15 November 2012. 3 Ireland is excluded for lack of continuous series for confidence indexes.

145
the sovereign debt crisis for a set of euro-area countries using a factor augmented vector
autoregressive (FAVAR) model.
The econometric analysis set out here shows that the sovereign debt tensions have had a
substantial impact on bank lending rates in the peripheral countries (Italy, Spain, Greece and
Portugal), but practically none in the core countries (Germany, France, Belgium, the Netherlands,
Austria and Finland). A counterfactual exercise suggests that if sovereign spreads (defined as the
difference between the yields on 10-year government bonds and the yield on swap contracts with
the same maturity) had remained constant at their average levels of April 2010, at the end of 2011
the interest rates on new loans to non-financial corporations and residential mortgages in the
peripheral countries would have averaged respectively 130 and 60 basis points lower than their
actual values. For non-financial corporations in particular, rates would have been 180, 140, 130 and
50 basis points lower in Greece, Portugal, Italy and Spain respectively.
The remainder of the paper is organized as follows. Section 2 describes developments in
sovereign spreads and bank rates in the course of the debt crisis, Section 3 studies the impact on
bank rates, Section 4 presents some robustness checks and Section 5 concludes.
2. The sovereign crisis and bank lending rates in euro-area countries
In view of the importance of banks in financing the private sector, the pass-through of changes
in ECB policy rates to bank lending rates is a key element of the euro-area monetary policy
transmission mechanism (see ECB, 2008b and Draghi, 2012). Normally the marginal cost of
funding for banks is related to the interest rates on unsecured borrowing in the interbank market,
which in turn are related to policy rates. By means of its supply of reserves through refinancing
operations, the ECB can influence short-term money market rates (such as EONIA, the average
overnight rate) which in turn affect lending rates and ultimately the real economy and inflation.
2.1 The evolution of the sovereign debt crisis
The financial crisis has caused severe fragmentation of the European financial market along
national lines, hampering the transmission of ECB monetary policy and preventing the uniform
transmission of monetary impulses to the different euro-area countries. The Governing Council of
the ECB responded to such malfunctions by adopting, after October 2008, a series of extraordinary
measures (see Trichet, 2009, “The ECB’s enhanced credit support”) to sustain credit to the private
sector and maintain the correct transmission of monetary policy (see Cecioni et al. 2011). These
extraordinary measures helped to improve financial conditions in 2009.

146
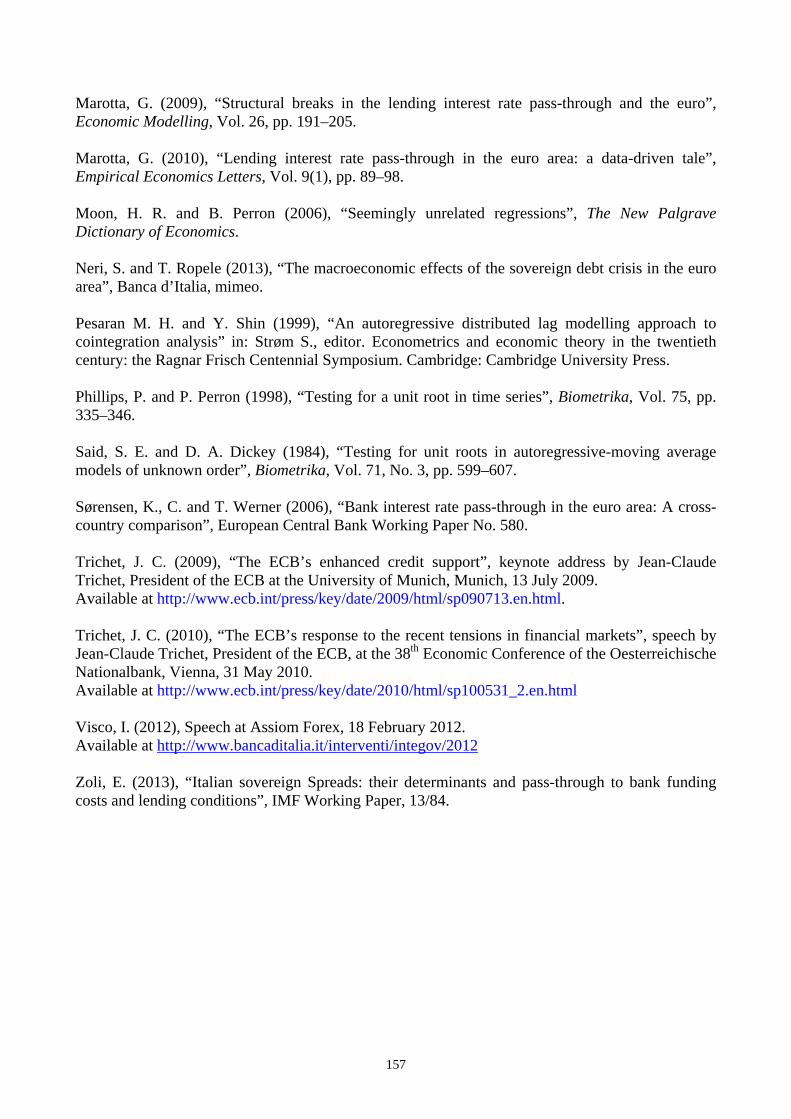
Early in 2010, however, the government securities markets of some euro-area countries with
weak fiscal and macroeconomic fundamentals were strained severely (Fig. 1). The sovereign
spreads of several countries rose to unprecedented levels, and in some government bond markets
liquidity nearly evaporated. These tensions spread to other market segments, including equity and
money markets (see Trichet, 2010). The ECB responded by reinstating some measures that had
been withdrawn in the preceding months and instituting the Securities Markets Programme (SMP)
to ensure the proper transmission of monetary policy impulses to the economy through secondary-
market purchases of government securities.
The strains spread from Greece, where they had been triggered by fears for the sustainability
of the public finances, to the Irish and Portuguese government bond markets in the autumn and
winter of 2010-2011. In July 2011, the spreads of Italian and Spanish government bonds vis-à-vis
the German Bund increased significantly, following further downgrades of Greek bonds and the
announcement by the European Council of the involvement of the private sector in the second bail-
out package for Greece. In order to ease the tensions in financial markets and halt the contagion, the
ECB revived the Securities Markets Programme. Banks’ funding conditions worsened significantly,
affecting their lending standards, particularly on loans to firms. The extraordinary measures taken in
December by the ECB, including two three-year refinancing operations, and the lowering of policy
rates, together with the fiscal adjustment measures of some governments, helped to allay the
tensions and alleviate banks’ funding difficulties.
Financial market tensions resurfaced in March 2012 as investor worries heightened over the
political situation in Greece, the difficulties of the Spanish banking sector and the inability of
governments to reform European Union governance arrangements or create effective crisis
management tools for the euro area. The sovereign spreads of the peripheral countries increased
steadily until August, when the Governing Council of the ECB announced extraordinary measures
to address the bond market disruptions, which stemmed in part from concern that the euro might
prove reversible (“redenomination risk”), and to preserve the singleness of the ECB monetary
policy and the correct functioning of its transmission mechanism.4 Di Cesare et al., 2012 and
Giordano et al., 2013, have shown that in 2012 the sovereign spreads of several countries had
reached levels that were higher than those consistent with fiscal and macroeconomic fundamentals,
partly because of the perceived risk of a break-up of the euro area. After its meeting on 6 September
2012, the Governing Council described the new Outright Monetary Transactions programme for the
4 From the introductory statement to the press conference of 2 August 2012: “The Governing Council, within its mandate to maintain price stability over the medium term and in observance of its independence in determining monetary policy, may undertake outright open market operations of a size adequate to reach its objective.”
147
purchase of government securities in secondary markets in detail. The programme, which is fully
within the remit of the ECB, helps to maintain price stability.5
2.1. Sovereign spreads and bank lending rates
Several channels have been suggested for the transmission of government bond market
tensions to the banking system.6 According to the so-called price channel thesis, the interest rate on
government bonds is a benchmark for determining the cost of loans to households and non-financial
corporations. The balance-sheet thesis is that a capital loss on banks’ government bond portfolios,
via its effects on profitability and capital, may induce a tightening of credit supply. And working via
the liquidity channel, the loss of value of bonds, which are typically used as collateral for interbank
transactions, could reduce banks’ ability to procure funds in the money market.7
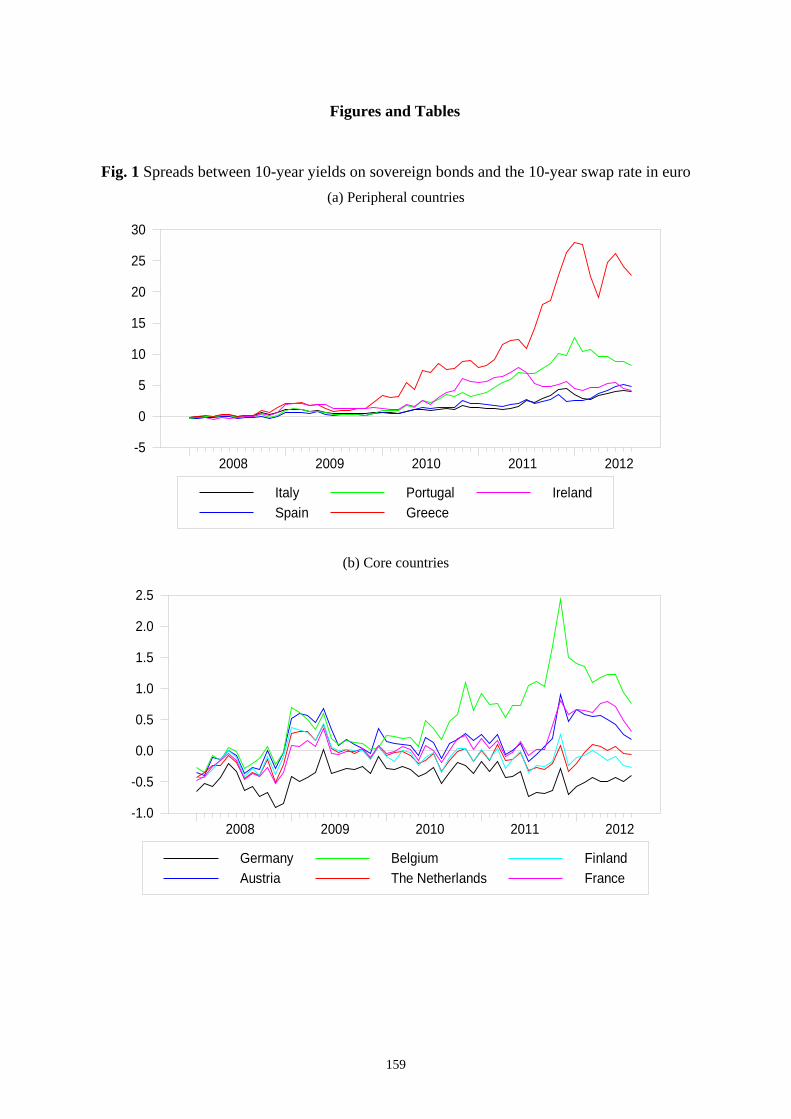
As a gauge of the impact of the sovereign tensions on lending rates, Figures 2 and 3 show the
mean cost of new loans to non-financial corporations and of residential mortgages in the euro area
and the interval between the 10th and the 90th percentile of the distribution of these rates across
countries. The heterogeneity in these costs has increased significantly during the sovereign debt
crisis. The standard deviation of interest rates on new loans to non-financial corporations increased
from 62 basis points in January 2003-April 2010 to 139 points in May 2010-August 2011 (Fig. 2);
for households the increase was more modest, from 45 to 56 basis points (Fig. 3).
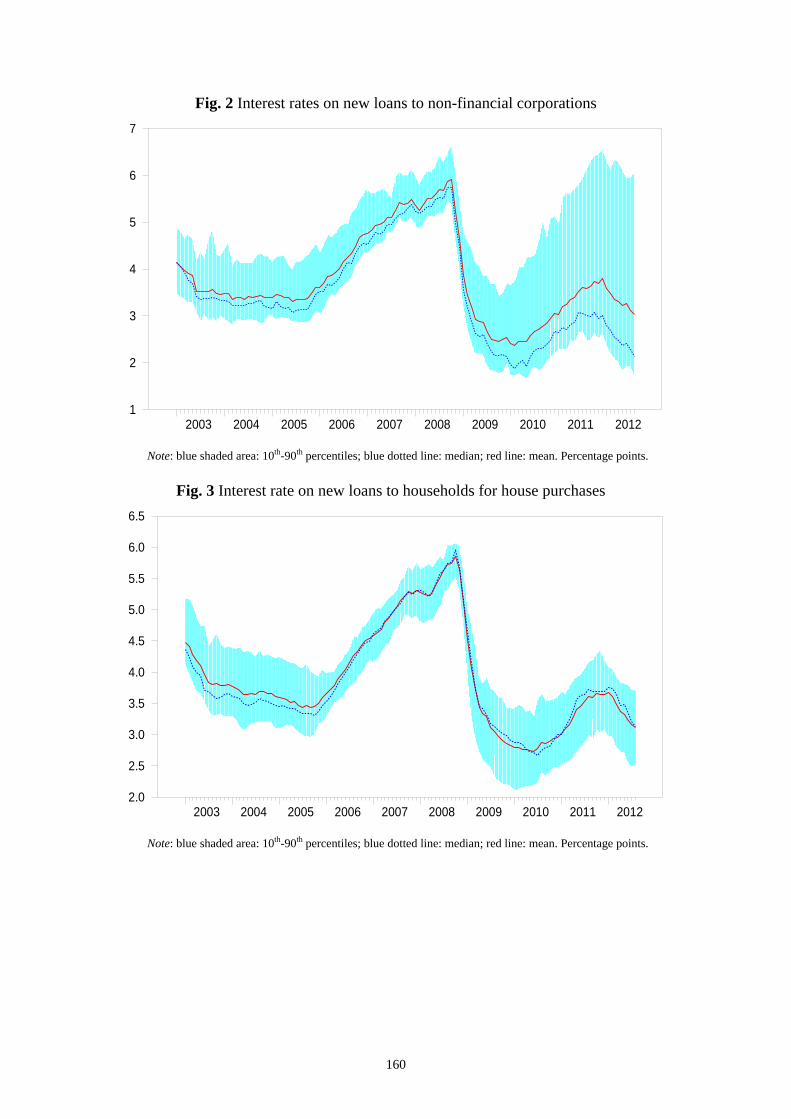
The picture as regards real interest rates (net of inflation), the relevant variable for the
investment and consumption decisions of firms and households, is similar. As for the most
appropriate gauge of inflation, economic theory holds that lenders require compensation for the
monetary erosion produced by the expected change in the price level. This suggests that the best
indicator may be the ex-ante real interest rate. However, euro-area inflation expectations, such as
those of Consensus Economics, are generally available at quarterly frequency only for the four
largest countries and for the area as a whole. To compute real inflation rates for more countries, one
can use rates based on the Harmonized Index of Consumer Prices (HICP), which have a high
correlation with expected inflation rates, and so permit the calculation of an ex-post measure of the
real interest rate. Figures 4 and 5 show the mean and median real rates on loans and the 10th and
90th percentile interval of the distribution across countries. The figures confirm that the
5 Implementation of the OMT is subject to strict conditionality connected with the application to the European Financial Stability Facility (EFSF) or the European Stability Mechanism (ESM) for financial support. 6 For a description of the relationship between sovereign risk and funding conditions for banks, see Committee on the Global Financial System (2011) and Trichet (2010). 7 Sovereign downgrades are generally followed by downgrades of domestic banks, while a weakening of the public finances reduces the availability of implicit and explicit government guarantees.
148
heterogeneity in the real cost of new loans to non-financial corporations increased significantly after
the beginning of the sovereign debt crisis, while for households the increase was more moderate.
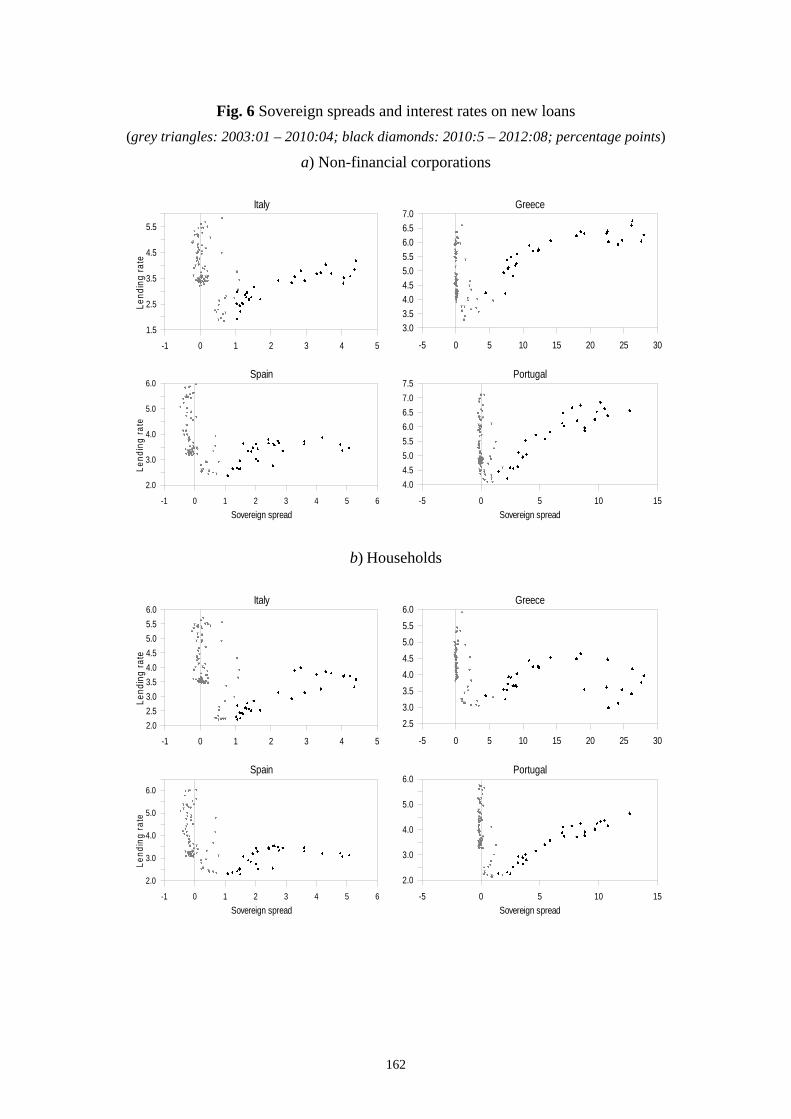
The increase in the dispersion of lending rates reflects the asymmetrical nature of the
sovereign debt crisis. Before the crisis, lending rates were not correlated with sovereign spreads in
Greece, Portugal, Spain and Italy (Fig. 6). The correlation emerged only once the crisis had broken
out. The correlation is analyzed more closely, through an econometric model, in Section 3.
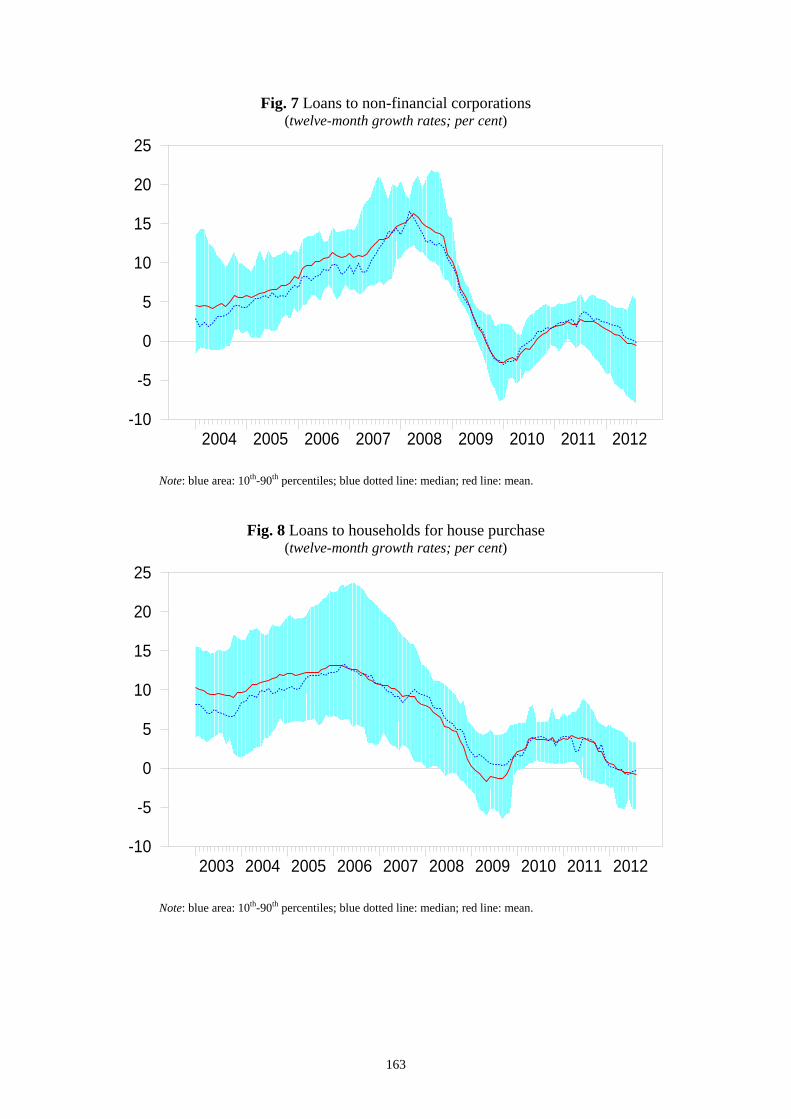
Despite the increase in the dispersion of bank rates, the heterogeneity in trends in loans to
non-financial corporations (Fig. 7) and households (Fig. 8) diminished, albeit to varying extent, in
the course of the financial and the sovereign debt crises. This diminution mainly reflected the
impact of the financial crisis on banking and on the real economy, which has tended to synchronize
credit developments in euro-area countries. Before the crises, these variables were driven by
country-specific factors such as buoyant housing markets (Spain and Ireland), or strong corporate
cash-flow (Germany).
The standard deviation of the growth rates of credit to non-financial corporations fell from 6.4
percentage points in the period from 2003 to the summer of 2007 to 3.8 points between autumn
2007 and August 2012 (Table 1). By contrast, the sovereign debt crisis did not affect the volatility
of credit dynamics significantly: the standard deviation for the period from May 2010 to August
2012 is identical to that between September 2007 and April 2010. As for residential mortgage loans,
the decline in volatility between these two periods was comparable (from 7.5 to 4.8 percentage
points), but such decline occurred mainly during the sovereign debt crisis (3.4 percentage points
between May 2010 and August 2012). As for lending rates, the statistics in Table 1 confirm these
results: for non-financial corporations the standard deviation increased from 0.6 percentage points
between 2003 and the summer of 2007 to 0.7 during the financial crisis (from September 2007 to
April 2010) and to 1.4 during the sovereign debt crisis. For households the increase in volatility was
more muted.
To sum up, the financial crisis brought a decline in the standard deviation of credit growth and
almost no change in the dispersion of bank lending rates, whereas the sovereign debt crisis
increased the dispersion of lending rates, in particular to non-financial corporations, while further
lowering the volatility of growth rates of credit to households.
3. Econometric analysis
The indicator used here for tensions in sovereign debt markets is the spread between the yields
on government bonds and the 10-year swap rate of equal maturity. Unlike the German Bund yield,
149
the swap rate as benchmark enables us to include an equation for lending rates in Germany and to
assess the possible effect on these rates of the decline of the Bund yield due to the “flight to quality”
during the worst of the financial and sovereign debt crises. The system describing lending rates to
non-financial corporations (k = f) and households for house purchase (k = h) in country j:
tk
tjk
tswap
ttjovt
mt
ovtt
crisist
kj
ktj RYRRRRRDDRR 1,716
,101
101,51
31413
200821, (1)
is estimated by the SUR method.8 Each equation in (1) is set up on the autoregressive distributed
lags model (ARDL), which has been used extensively to assess the transmission of changes in
monetary policy rates to lending rates (Cottarelli and Kourelis, 1994; Favero et al., 1997; Marotta,
2010).9 The explanatory variables are: the constant kjR , a dummy Dcrisis that takes the value one
from the Lehman Brothers default to the end of the sample period, a dummy D2008 taking value one
between November 2008 and February 2009 (to avoid large residuals in some of the equations), the
EONIA rate, the spread between three-month Euribor and EONIA ovm RR 3 (a proxy for credit risk
in the money market), the spread between the yields on 10-year government bonds and that of swap
contracts in euro of equal maturity, swapj RR ,1010 , a confidence indicator Yk, and the lagged value of
the bank rate.10 The independent variables are introduced at time t-1 in order to avoid endogeneity
problems. The sovereign spread can be thought of as a summary statistic for the impact of banks’
funding difficulties on lending standards.11 This thesis finds support in Del Giovane et al. (2013),
according to which developments in banks’ balance sheet and funding conditions mainly reflect
those in the sovereign debt markets.
The interest rates are the rates on new loans (excluding overdrafts) to non-financial
corporations and on residential mortgages, with initial maturity up to one year (see the Appendix for
a detailed description). These data are available from January 2003 onwards on the ECB website.12
The monetary financial institutions interest rate statistics cover all the interest rates that credit
institutions apply to euro-denominated deposits and loans (outstanding amounts and new business)
8 The rationale for the seemingly unrelated regression approach is that there could be common factors not included as independent variables affecting all the equations at once, inducing correlation between the error terms. 9 Depending on the nature of the dataset available, other empirical approaches are also possible. For example, panel-econometric methods have been used (Sørensen and Werner, 2006) to study heterogeneity in the pass-through of changes in money market rates to lending rates in the euro area. 10 Since mid-2011 Eurepo rates have been affected by the strong demand for high-quality collateral, which has pushed them down close to or even below zero. Data on Eonia swap rate contracts are available only after mid-2005. The use of the spread between Euribor and Eurepo and between Euribor and Eonia swaps results in only marginally different coefficients; and the coefficients on sovereign spreads and counterfactual simulations are identical (Section 3.1). 11 See the ad hoc questions on the impact of the sovereign debt crisis on banks’ funding conditions and credit standards in the Eurosystem Bank Lending Survey (http://www.ecb.int/stats/money/surveys/lend/html/index.en.html). 12 See, for instance, http://www.ecb.int/stats/pdf/mir_general_description.pdf?a13000d3717c100bef08c0c137f28bcd.
150
to all households and resident non-financial corporations of all sizes.13 These data have been used,
among others, by Marotta (2009) to study the pass-through of changes in the ECB rate to lending
rates. The rates used in the estimation are among the most responsive to changes in banks’ funding
costs and the policy rate.
Before estimating the model, the stationarity of the time series for lending rates was tested
using the Augmented Dicky-Fuller test (Said and Dickey, 1984), which rejected the null of
stationarity at the 5 per cent significance level for the interest rates on new loans to both non-
financial corporations and households. These results were also confirmed by the Kwiatowski et al.
(KPSS, 1992) and Phillips-Perron (PP, 1998) tests (see Table 2).14 When the dependent variables
follow unit root processes, the estimation of ARDL models is equivalent to estimating error
correction models (Pesaran and Shin, 1999); the results are discussed in Section 4.4.
Tables 3 and 4 show the estimates for the period from January 2003 to August 2012.15 For
non-financial corporations (Table 3): (i) the adjustment of lending rates to changes in the
explanatory variables is gradual (column h); (ii) both EONIA (column b) and the spread between
three-month Euribor and EONIA (column e) are significant in all the equations; (iii) the
transmission of changes in EONIA is incomplete in both the short and the long run; (iv) the
sovereign spread (column f) is statistically significant in the peripheral but not the core countries.
After one quarter, an increase of 100 basis points in these spreads raises lending rates by 33 basis
points in Italy, 20 in Portugal, 16 in Spain and 7 in Greece.
For Italy, Albertazzi et al. (2012) estimate the effect on rates on new short-term loans
(excluding overdrafts) at 35 basis points using monthly data over the period 2003-2012; the impact
is greater, 50 basis points, when overdrafts are included, the period considered is 1991-2011, and
the data used are quarterly rates on (outstanding) short-term loans.16 Del Giovane et al. (2013) find
that an increase of 100 basis points in the sovereign spread raises the interest rate on new short-term
loans by around 30 basis points with a one- quarter lag;17 Zoli (2013) estimates that between 30 and
40 per cent of the increase in the Italian sovereign spread is transmitted to the interest rates in loans 13 The MFI interest rate statistics provide monthly data on 45 instrument categories of euro-denominated deposits and loans, disaggregated by original maturity, notice periods or periods of interest rate fixation. The statistics are produced for the euro area as a whole and individually for each member country. 14 KPSS is often used to confirm the results obtained from other tests in which the null hypothesis is the non-stationarity of the time series. However, inferences based on the KPSS test can be sensitive to the number of lags in the estimation of the heteroskedasticity and autocorrelation consistent covariance matrix (Maddala and Kim, 1998). In fact, with more lags the assumption of stationarity cannot be rejected for some countries, including Italy and Spain. 15 The correlation between the residuals (on average 0.2, in some cases 0.6) justifies the SUR approach. 16 The difference between the estimates may reflect both the different sample periods and the types of loans used. 17 Del Giovane et al. (2013) analyze the relative role of demand and supply factors in explaining credit developments, focusing on the differences between the global financial crisis and the sovereign debt crisis.
151
to non-financial corporations within three months. The positive coefficients on Dcrisis indicate that
the spread between the interest rate on loans to non-financial corporations and EONIA was larger
after the collapse of Lehman Brothers than before.
For new residential mortgage loans, the estimation yields the following results (Table 4): (i) in
all countries, the adjustment to changes in the explanatory variables is more gradual than for non-
financial corporations (column h); (ii) EONIA is significant in all equations (column b); (iii) the
transmission of changes in EONIA is incomplete both in the short and in the long run; (iv) the
sovereign spread is statistically and economically significant in Spain, Italy and Portugal and,
among the core countries, also in Belgium and Finland (column f).
Section 4 assesses the robustness of these estimations.
3.1. The impact of sovereign spreads on lending rates
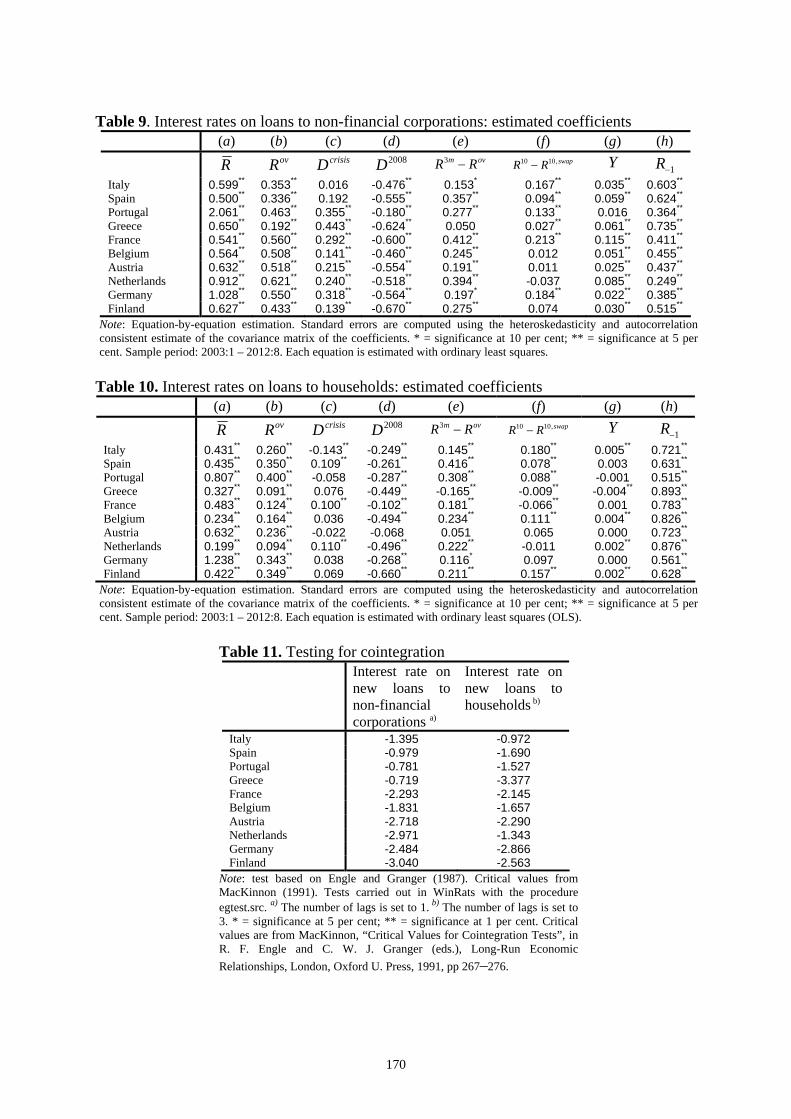
Using the system estimated in (1), we can quantify the effect of increases in sovereign spreads
on lending rates by means of two counterfactual exercises; namely, we assume that the spreads
remain constant at the values recorded in April 2010, before the heightening of the tensions on
Greek bonds, or, alternatively, at the level of June 2011, before the tensions hit the markets for
Italian and Spanish bonds. All the other variables are assumed to follow their actual paths. By
construction, the exercises do not consider that in the absence of the sovereign crisis the ECB would
have followed different (conventional and unconventional) policies and the macroeconomic outlook
of the euro-area countries would also have been better.18 Therefore the counterfactual exercise
offers a conservative estimate of the impact of the sovereign debt market tensions.
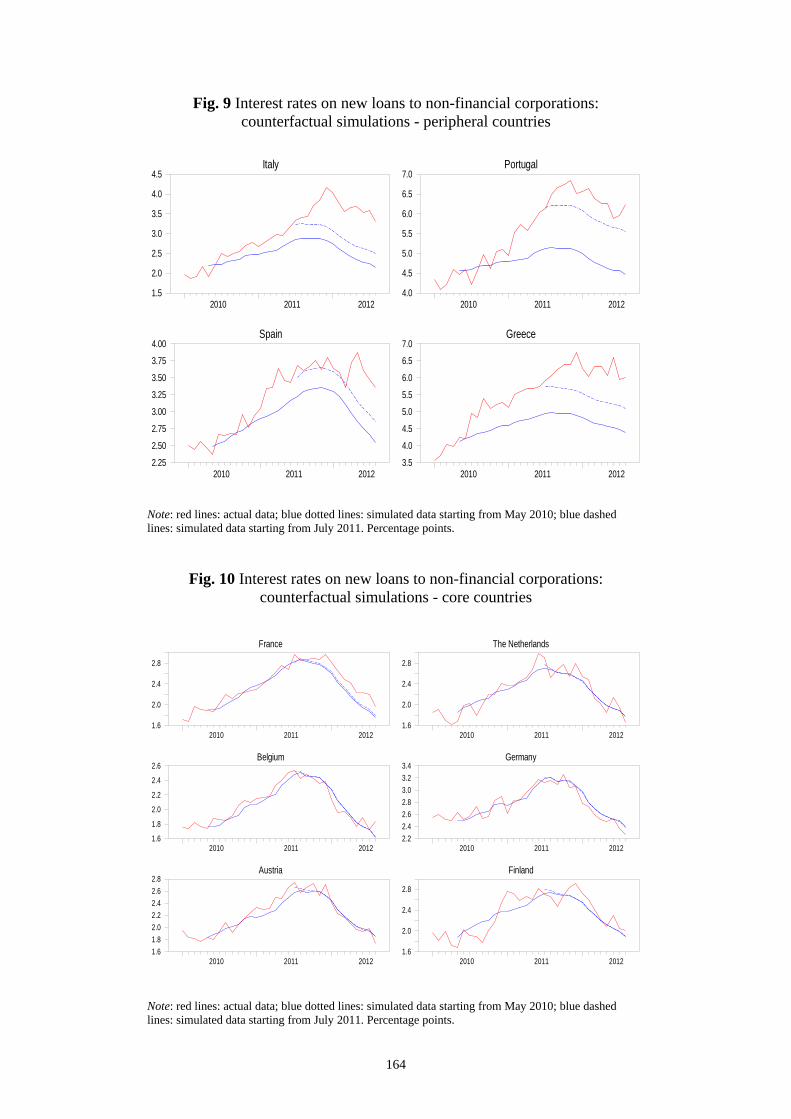
The differences between the actual values of bank rates and those obtained with the two
counterfactual exercises are set out in Tables 5 and 6 and Figures 9-12. If sovereign spreads had
remained constant at the levels recorded in April 2010, the average interest rates on loans to non-
financial corporations in 2011 would have been lower than the actual rates by around 50 basis
points in Italy and 40 in Spain; and at the end of the year the rates would have been lower than their
actual values by 130 and 50 basis points respectively (Table 5). Albertazzi et al. (2012), using
quarterly data, estimate that if the sovereign debt crisis had not occurred the interest rate on short-
term (outstanding) loans in the last quarter of 2011would have been lower than actual rates by 170
basis points.19 They would have been about 140 basis points lower in Greece and 180 points lower
18 Using the actual data for business and household confidence and the Euribor-Eonia spread, we ignore the fact that if our counterfactual scenarios had been realized, these variables would probably have taken a different course. 19 An update of these results, presented in Banca d’Italia, Financial Stability Report No. 4, November 2012, shows that if the spread had remained at the same level as in the first quarter of 2010, the interest rate on new loans to firms in the second quarter of 2012 would have been lower than the actual value by 160 basis points.
152
in Portugal. The average rate in the peripheral countries would have been 130 basis points lower,
while the average dispersion of rates on new loans to non-financial corporations would have been
equal to 1 percentage point, compared with an actual value of 1.39 (Table 1).
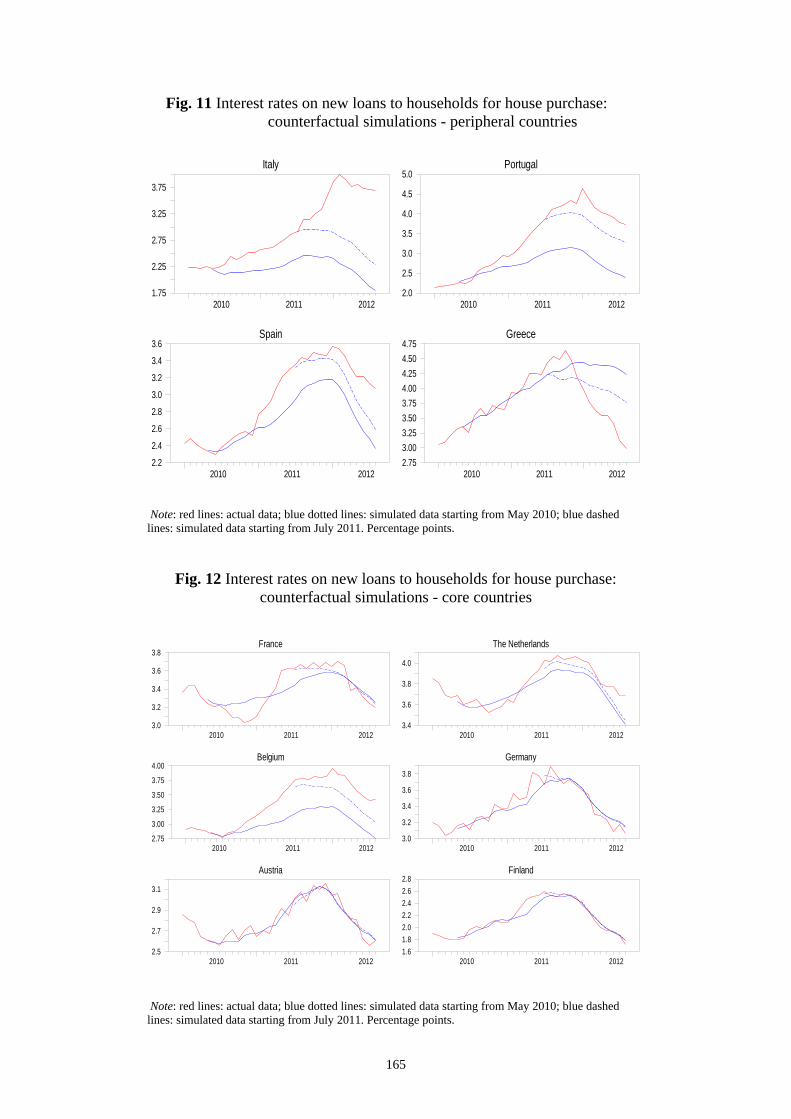
For households, the counterfactual exercise suggests that the effects of the tensions on lending
rates were somewhat smaller than for non-financial corporations. Had the spreads remained
constant at the levels recorded in April 2010, then in December 2011 the lending rates in Italy,
Portugal and Spain would have been lower than the actual values by around 120, 110 and 30 basis
points respectively. The average rate in the peripheral countries would have been 60 basis points
lower, while the average dispersion of bank rates on new loans to households between May 2010
and August 2012 would have not changed much (0.60, compared with 0.56).
Qualitatively similar results both for non-financial corporations and for households are
obtained with the counterfactual exercise taking July 2011 as reference level (Table 6). Comparing
the two simulations, we see that in Italy a large part of the rise in banks’ lending rates occurred after
July 2011. In Spain, by contrast, a good part of the increase in lending rates came after the renewed
tensions for Spanish bonds in the spring of 2012. In Greece and Portugal, the effects on lending
rates are already largely incorporated in the exercise taking May 2010 as reference date, suggesting
that the cost of credit in these countries increased mainly in the first part of the sovereign crisis.
4. Robustness checks
In this section we assess the robustness of the results to changes in sample period, to an
alternative econometric approach and to different data on the cost of loans.
4.1. Sub-sample analysis
Here we give the results obtained by estimating our system of equations over the entire crisis
period (2008-2012). Comparing the results on the cost of new loans to non-financial corporations
(Table 7 and Table 3) suggests that the results are qualitatively robust to the choice of the sample
period; the adjustment to changes in EONIA is, on average, slightly greater in the shorter sample,
and the sensitivity of bank rates to changes in sovereign spreads is almost identical in the two
periods. The speed of adjustment (measured by the coefficient of the lagged bank rate), is on
average slower. The similarity in the coefficients of the system of equations translates into similar
results for the counterfactual exercises described in Section 3.1 as well.
Similarly, a look at the results for the rates on new residential mortgages (Table 8 and Table
4) indicates very little difference between the two sample periods. The sensitivity of lending rates to
sovereign spreads is slightly greater in the peripheral countries in the shorter sample, whereas the
153
results of the counterfactual simulations are similar to those discussed in Section 3.1. Interestingly,
if the system of equations in (1) is estimated over the period 2003-2007 the parameters measuring
the pass-through of changes in sovereign spreads to bank lending rates in all the countries
considered are not statistically different from zero. This is in accordance with the thesis that prior to
the crisis government bond yields had little importance for banks’ price-setting policies for short-
term loans.
4.2. Single equation ordinary least squares
In this section we test for robustness of the results using ordinary least squares (OLS) instead
of the seemingly unrelated regression approach to estimate the system of equations in (1). There are
two reasons for choosing the SUR methodology: a gain in efficiency thanks to combining
information from the different equations and the possibility of testing restrictions across equations
(Moon and Perron, 2006). There is no theoretical result that applies to our case, as the equations
have different explanatory variables and the disturbances are allowed to be correlated. However, it
can be shown (Greene, 2011) that the gain in efficiency tends to be greater when the correlation
among the disturbances is stronger and when the explanatory variables are not strongly correlated.
One potential problem with the SUR approach is that it may propagate misspecification and
inconsistency across equations. For if even one of the equations is misspecified then under SUR all
the parameters are estimated inconsistently. This danger suggests the advisability of estimating each
equation separately.
In our case, despite the potential disadvantages of the SUR methodology, comparison of
Tables 3-4 with Tables 9-10 shows that our results are robust to the use of OLS. The coefficients on
the sovereign spreads and EONIA are, on average, marginally higher with OLS, but the results of
the counterfactual simulations are nearly identical both for non-financial corporations and for
households.
4.3 Alternative measures of the cost of loans
The dependent variable in the foregoing analysis has been interest rates on new loans. But the
overall impact of the sovereign spread on the debt-service burden of non-financial corporations and
households depends on the interest paid on existing loans as well. While for firms the fraction of
variable rates – which naturally react more rapidly and strongly to changes in banks’ funding costs
– is above 90 per cent in all the countries considered, for households the proportion averages only
60 per cent.
154
In this light it is important to test the robustness of our results to alternative definitions of
lending rates. For non-financial corporations the system in (1) is estimated using the interest rate on
outstanding loans (up to one year) including overdrafts; for households, the dependent variable is
the average cost of outstanding loans at both variable and fixed rates. The results, which are not
reported, are qualitatively similar albeit with some quantitative differences. The coefficient of the
EONIA rate is lower, on average across countries, than in the estimation discussed in Section 3; the
coefficient of the sovereign spreads is lower and that of the lagged value of the bank rate is higher.
The counterfactual exercises confirm that the sovereign debt tensions had a significant effect on the
cost of loans to non-financial corporations.
For households, when the dependent variable is the average rate on existing loans at variable
and fixed rates, the coefficients of the sovereign spreads are positive and significant also in the core
countries, while those of EONIA are much smaller. The former finding can be explained by the fact
that fixed rates on loans to households are generally set on the basis of long-term yields, including
government bond yields. In fact, if sovereign spreads are replaced with the yields, the associated
coefficients are high and significant in some core countries as well.
4.4 Error correction models
Error correction models have been used extensively in the literature on the bank interest rate
pass-through (Sørensen and Werner, 2006 and Marotta, 2010). Changes in a specific bank rate are
regressed on simultaneous and lagged changes in a relevant market rate and on an error correction
term that captures the divergence of the bank rate from its long-run equilibrium relationship with
the market rate.
Section 3 shows that all lending rates are non-stationary and follow unit root processes. Here
we test for the presence of cointegration relationships between lending rates and EONIA. The Engle
and Granger (1987) tests reported in Table 11 find no cointegrating relationship between the interest
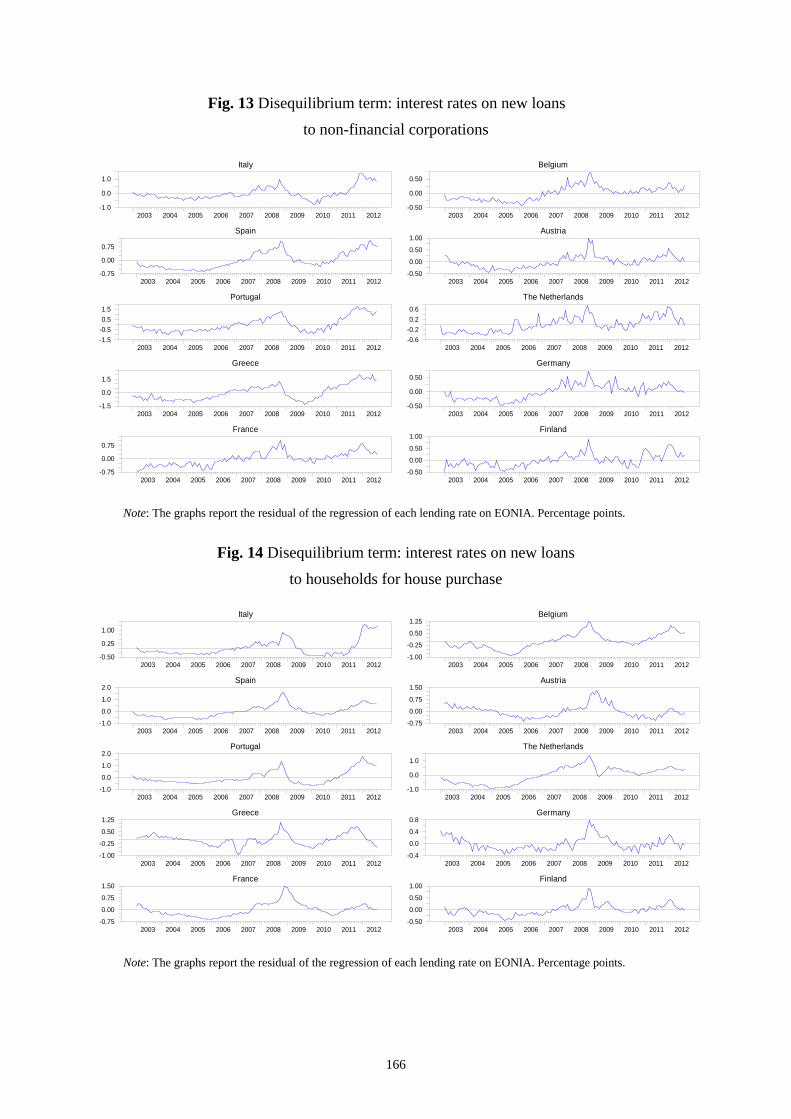
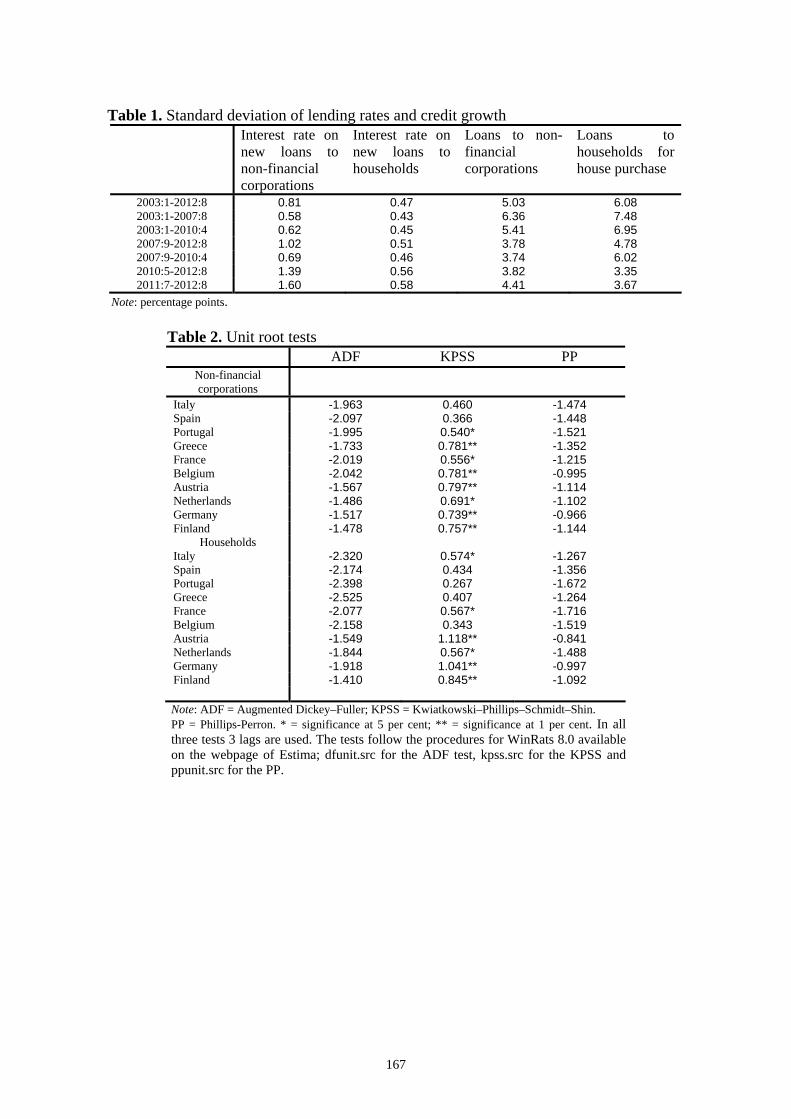
rate on new loans to non-financial corporations and EONIA. A graphical analysis of the residuals of
the first-step regression (Figures 11 and 12) suggests that the sovereign crisis may have caused a
break in the cointegrating relationship in the peripheral countries. If instead of EONIA we use
three-month Euribor, a cointegrating relationship is found for households only for Germany and
Finland; for non-financial corporations, only for Austria, Germany, Finland and the Netherlands. In
these cases, the estimation of an error correction model shows that the sovereign spreads are not
statistically significant, confirming the findings of Section 3.
155
5. Conclusion
Since the beginning of 2010, the strains in some sovereign debt markets have progressively
distorted monetary conditions in the euro area as a whole and in some member countries. The
fragmentation of financial markets along national lines has prevented the homogeneous
transmission of the ECB monetary policy stance to the interest rates on new bank loans to
households and firms. The three-year refinancing operations, the expansion of eligible collateral in
late 2011 and more recently the introduction Outright Monetary Transactions have been designed to
preserve the singleness of monetary policy of the ECB and the correct functioning of its
transmission mechanism.
This paper presents the results of an econometric assessment of the transmission of sovereign
tensions to lending rates in the main euro-area countries. The model estimated finds that the
sovereign debt tensions have had a significant impact on lending rates in the peripheral but not in
the core countries. A counterfactual exercise suggests that, all else constant, if the sovereign crisis
had not occurred, then the rates on new bank loans to non-financial corporations and residential
mortgages loans to households in the peripheral countries would have been significantly lower.
The analysis is based on the estimation of simple interest-rate equations. Future research
might explore the role of time variation in the parameters and the possibility of non-linear effects of
the sovereign spreads. An extension of the analysis by means of Vector Auto-Regressive models,
moreover, could quantify the impact of the sovereign debt crisis not only on the cost of credit but
also on the main macroeconomic variables, including money, credit and economic activity.
156
References
Albertazzi, U., T. Ropele, G. Sene and F. M. Signoretti (2012), “The impact of the sovereign debt crisis on the activity of Italian banks”, Banca d’Italia Occasional Papers, No. 133. Cecioni, M., G. Ferrero and A. Secchi (2011), “Unconventional monetary policy in theory and in practice?”, Banca d’Italia Occasional Papers, No. 102. Committee on the Global Financial System (2011), “The impact of sovereign credit risk on bank funding conditions”, Committee on the Global Financial System Paper No. 43. Cottarelli, C. and A. Kourelis (1994), “Financial structure, bank lending rates, and the transmission mechanism of monetary policy”, IMF Staff Papers, Vol. 41, No. 4. Del Giovane, P., A. Nobili and F. M. Signoretti (2013), “Supply tightening or lack in demand: Is the sovereign debt crisis different from Lehman?”, Banca d’Italia, mimeo. Draghi, M. (2012), “The monetary policy of the European Central Bank and its transmission in the euro area”, speech at Università Bocconi, Opening of the 2012-13 Academic Year, Milan, 15 November 2012. Engle, R. F. and C. W. J. Granger (1987), “Co-integration and error correction: representation, estimation and testing,” Econometrica, Vol. 55, pp. 251–276. European Central Bank (2008a), Monthly Bulletin, 10th anniversary of the ECB. European Central Bank (2008b), “The role of banks in the monetary policy transmission mechanism”, Monthly Bulletin, August. European Central Bank (2009), “Recent developments in the retail bank interest rate pass-through in the euro area”, Monthly Bulletin, August. Favero, C. A., F. Giavazzi and L. Spaventa (1997), “High yields: the spread on German interest rates”, The Economic Journal, Vol. 105, pp. 956–986. Giordano R., M. Pericoli and P. Tommasino (2013), “‘Pure’ or ‘Wake-up call’ contagion? Another look at the EMU sovereign debt crisis”, Banca d’Italia Working Papers, No. 904. Green, W. H. (2011), Econometric Analysis, 7th Edition, Prentice Hall. Kwiatowski, D., P. C. B. Phillips, P. Schmidt and Y. Shin (1992), “Testing the null of stationarity against the alternative of a unit root: how sure are we that economic time series have a unit root?” Journal of Econometrics, Vol. 54, pp. 159–178. MacKinnon, J. G. (1991), “Critical values for cointegration tests”, in R. F. Engle and C. W. J. Granger (eds.), Long-Run Economic Relationships, London, Oxford University Press, pp. 267–276. Maddala, G. S. and I. M. Kim (1998), Unit Roots, Cointegration and Time Series, Cambridge University Press.
157
Marotta, G. (2009), “Structural breaks in the lending interest rate pass-through and the euro”, Economic Modelling, Vol. 26, pp. 191–205. Marotta, G. (2010), “Lending interest rate pass-through in the euro area: a data-driven tale”, Empirical Economics Letters, Vol. 9(1), pp. 89–98. Moon, H. R. and B. Perron (2006), “Seemingly unrelated regressions”, The New Palgrave Dictionary of Economics. Neri, S. and T. Ropele (2013), “The macroeconomic effects of the sovereign debt crisis in the euro area”, Banca d’Italia, mimeo. Pesaran M. H. and Y. Shin (1999), “An autoregressive distributed lag modelling approach to cointegration analysis” in: Strøm S., editor. Econometrics and economic theory in the twentieth century: the Ragnar Frisch Centennial Symposium. Cambridge: Cambridge University Press. Phillips, P. and P. Perron (1998), “Testing for a unit root in time series”, Biometrika, Vol. 75, pp. 335–346. Said, S. E. and D. A. Dickey (1984), “Testing for unit roots in autoregressive-moving average models of unknown order”, Biometrika, Vol. 71, No. 3, pp. 599–607. Sørensen, K., C. and T. Werner (2006), “Bank interest rate pass-through in the euro area: A cross-country comparison”, European Central Bank Working Paper No. 580. Trichet, J. C. (2009), “The ECB’s enhanced credit support”, keynote address by Jean-Claude Trichet, President of the ECB at the University of Munich, Munich, 13 July 2009. Available at http://www.ecb.int/press/key/date/2009/html/sp090713.en.html. Trichet, J. C. (2010), “The ECB’s response to the recent tensions in financial markets”, speech by Jean-Claude Trichet, President of the ECB, at the 38th Economic Conference of the Oesterreichische Nationalbank, Vienna, 31 May 2010. Available at http://www.ecb.int/press/key/date/2010/html/sp100531_2.en.html Visco, I. (2012), Speech at Assiom Forex, 18 February 2012. Available at http://www.bancaditalia.it/interventi/integov/2012 Zoli, E. (2013), “Italian sovereign Spreads: their determinants and pass-through to bank funding costs and lending conditions”, IMF Working Paper, 13/84.

158
Appendix: Data
All the data are available in the ECB Statistical Dataware House (SDW) or in the OECD.StatExtracts webpage. Data in the SDW for each country can be obtained by replacing the percentage sign % with the following codes:
Austria = AT Belgium = BE Germany = DE Spain = ES Finland = FI France = FR Greece = GR Italy = IT The Netherlands = NL Portugal = PT
Interest rate on loans to non-financial corporations: Annualised agreed rate / Narrowly defined
effective rate, credit and other institutions (Monetary Financial Institutions, MFIs, except money market funds and central banks) reporting sector - loans other than revolving loans and overdrafts, convenience and extended credit card debt, initial maturity up to one year maturity, total amount, new business coverage, euro, non-financial corporations sector. Statistical Dataware House: MIR.M.%.B.A2A.F.R.A.2240.EUR.N
Interest rate on residential mortgages (loans to households for house purchase): Annualised agreed
rate / Narrowly defined effective rate, credit and other institutions (MFIs except money market funds and central banks) reporting sector - lending for house purchase excluding revolving loans and overdrafts, initial maturity up to one year maturity, new business coverage, euro, households and non-profit institutions serving households. Statistical Dataware House: MIR.M.%.B.A2C.F.R.A.2250.EUR.N
Loans to non-financial corporations: Index of notional stocks, MFIs excluding the ESCB reporting
sector - loans, total maturity, all currencies combined - euro area (changing composition) counterpart, non-financial corporations sector, annual growth rate, data not adjusted for seasonal or calendar effects. Statistical Dataware House: BSI.M.%.N.A.A20.A.I.U2.2240.Z01.A
Loans to households: Index of notional stocks, MFIs excluding ESCB reporting sector - loans, total maturity, all currencies combined - euro area (changing composition) counterpart, households and non-profit institutions serving households sector, annual growth rate, data not adjusted for seasonal or calendar effects. Statistical Dataware House: BSI.M.%.N.A.A20.A.I.U2.2250.Z01.A
EONIA rate: Eonia rate - Historical close, average of observations through period - provided by ECB
Statistical Dataware House: FM.M.U2.EUR.4F.MM.EONIA.HSTA Three-month EURIBOR rate: Euribor three-month - Historical close, average of observations through
period - Euro, provided by Reuters Statistical Dataware House: FM.M.U2.EUR.RT.MM.EURIBOR3MD_.HSTA
Non-financial corporations’ confidence indicator: Main Economic Indicators (OECD); monthly;
business tendency surveys, seasonally adjusted. Available at http://stats.oecd.org/ Households’ confidence indicator: Main Economic Indicators (OECD); monthly; consumer opinion
surveys, seasonally adjusted. Available at http://stats.oecd.org/
159
Figures and Tables
Fig. 1 Spreads between 10-year yields on sovereign bonds and the 10-year swap rate in euro
(a) Peripheral countries
ItalySpain
PortugalGreece
Ireland
2008 2009 2010 2011 2012-5
0
5
10
15
20
25
30
(b) Core countries
GermanyAustria
BelgiumThe Netherlands
FinlandFrance
2008 2009 2010 2011 2012-1.0
-0.5
0.0
0.5
1.0
1.5
2.0
2.5
160
Fig. 2 Interest rates on new loans to non-financial corporations
2003 2004 2005 2006 2007 2008 2009 2010 2011 20121
2
3
4
5
6
7
Note: blue shaded area: 10th-90th percentiles; blue dotted line: median; red line: mean. Percentage points.
Fig. 3 Interest rate on new loans to households for house purchases
2003 2004 2005 2006 2007 2008 2009 2010 2011 20122.0
2.5
3.0
3.5
4.0
4.5
5.0
5.5
6.0
6.5
Note: blue shaded area: 10th-90th percentiles; blue dotted line: median; red line: mean. Percentage points.
161
Fig. 4 Real interest rates on new loans to firms, deflated with current HICP inflation rates
2003 2004 2005 2006 2007 2008 2009 2010 2011 2012-2
-1
0
1
2
3
4
5
Note: blue shaded area: 10th-90th percentiles; blue dotted line: mean; red line: median. Percentage points.
Fig. 5 Real interest rates on new loans to households for house purchase, deflated with current HICP inflation rates
2003 2004 2005 2006 2007 2008 2009 2010 2011 2012-1
0
1
2
3
4
5
Note: blue shaded area: 10th-90th percentiles; blue dotted line: mean; red line: median. Percentage points.
162
Fig. 6 Sovereign spreads and interest rates on new loans
(grey triangles: 2003:01 – 2010:04; black diamonds: 2010:5 – 2012:08; percentage points)
a) Non-financial corporations
Italy
Lend
ing
rate
-1 0 1 2 3 4 5
1.5
2.5
3.5
4.5
5.5
Spain
Sovereign spread
Lend
ing
rate
-1 0 1 2 3 4 5 6
2.0
3.0
4.0
5.0
6.0
Greece
-5 0 5 10 15 20 25 30
3.03.54.04.55.05.56.06.57.0
Portugal
Sovereign spread-5 0 5 10 15
4.04.55.05.56.06.57.07.5
b) Households
Italy
Lend
ing
rate
-1 0 1 2 3 4 5
2.02.53.03.54.04.55.05.56.0
Spain
Sovereign spread
Lend
ing
rate
-1 0 1 2 3 4 5 6
2.0
3.0
4.0
5.0
6.0
Greece
-5 0 5 10 15 20 25 30
2.53.03.54.04.55.05.56.0
Portugal
Sovereign spread-5 0 5 10 15
2.0
3.0
4.0
5.0
6.0
163
Fig. 7 Loans to non-financial corporations (twelve-month growth rates; per cent)
2004 2005 2006 2007 2008 2009 2010 2011 2012-10
-5
0
5
10
15
20
25
Note: blue area: 10th-90th percentiles; blue dotted line: median; red line: mean.
Fig. 8 Loans to households for house purchase
(twelve-month growth rates; per cent)
2003 2004 2005 2006 2007 2008 2009 2010 2011 2012-10
-5
0
5
10
15
20
25
Note: blue area: 10th-90th percentiles; blue dotted line: median; red line: mean.
164
Fig. 9 Interest rates on new loans to non-financial corporations: counterfactual simulations - peripheral countries
Italy
2010 2011 20121.5
2.0
2.5
3.0
3.5
4.0
4.5
Spain
2010 2011 20122.25
2.50
2.75
3.00
3.25
3.50
3.75
4.00
Portugal
2010 2011 20124.0
4.5
5.0
5.5
6.0
6.5
7.0
Greece
2010 2011 20123.5
4.0
4.5
5.0
5.5
6.0
6.5
7.0
Note: red lines: actual data; blue dotted lines: simulated data starting from May 2010; blue dashed lines: simulated data starting from July 2011. Percentage points.
Fig. 10 Interest rates on new loans to non-financial corporations: counterfactual simulations - core countries
France
2010 2011 20121.6
2.0
2.4
2.8
Belgium
2010 2011 20121.6
1.8
2.0
2.2
2.4
2.6
Austria
2010 2011 20121.61.82.02.22.42.62.8
The Netherlands
2010 2011 20121.6
2.0
2.4
2.8
Germany
2010 2011 20122.22.42.62.83.03.23.4
Finland
2010 2011 20121.6
2.0
2.4
2.8
Note: red lines: actual data; blue dotted lines: simulated data starting from May 2010; blue dashed lines: simulated data starting from July 2011. Percentage points.
165
Fig. 11 Interest rates on new loans to households for house purchase: counterfactual simulations - peripheral countries
Italy
2010 2011 20121.75
2.25
2.75
3.25
3.75
Spain
2010 2011 20122.2
2.4
2.6
2.8
3.0
3.2
3.4
3.6
Portugal
2010 2011 20122.0
2.5
3.0
3.5
4.0
4.5
5.0
Greece
2010 2011 20122.753.003.253.503.754.004.254.504.75
Note: red lines: actual data; blue dotted lines: simulated data starting from May 2010; blue dashed lines: simulated data starting from July 2011. Percentage points.
Fig. 12 Interest rates on new loans to households for house purchase: counterfactual simulations - core countries
France
2010 2011 20123.0
3.2
3.4
3.6
3.8
Belgium
2010 2011 20122.75
3.00
3.25
3.50
3.75
4.00
Austria
2010 2011 20122.5
2.7
2.9
3.1
The Netherlands
2010 2011 20123.4
3.6
3.8
4.0
Germany
2010 2011 20123.0
3.2
3.4
3.6
3.8
Finland
2010 2011 20121.61.82.02.22.42.62.8
Note: red lines: actual data; blue dotted lines: simulated data starting from May 2010; blue dashed lines: simulated data starting from July 2011. Percentage points.
166
Fig. 13 Disequilibrium term: interest rates on new loans
to non-financial corporations
Italy
2003 2004 2005 2006 2007 2008 2009 2010 2011 2012-1.0
0.0
1.0
Spain
2003 2004 2005 2006 2007 2008 2009 2010 2011 2012-0.75
0.00
0.75
Portugal
2003 2004 2005 2006 2007 2008 2009 2010 2011 2012-1.5-0.50.51.5
Greece
2003 2004 2005 2006 2007 2008 2009 2010 2011 2012-1.5
0.0
1.5
France
2003 2004 2005 2006 2007 2008 2009 2010 2011 2012-0.75
0.00
0.75
Belgium
2003 2004 2005 2006 2007 2008 2009 2010 2011 2012-0.50
0.00
0.50
Austria
2003 2004 2005 2006 2007 2008 2009 2010 2011 2012-0.50
0.00
0.50
1.00
The Netherlands
2003 2004 2005 2006 2007 2008 2009 2010 2011 2012-0.6-0.20.20.6
Germany
2003 2004 2005 2006 2007 2008 2009 2010 2011 2012-0.50
0.00
0.50
Finland
2003 2004 2005 2006 2007 2008 2009 2010 2011 2012-0.50
0.00
0.50
1.00
Note: The graphs report the residual of the regression of each lending rate on EONIA. Percentage points.
Fig. 14 Disequilibrium term: interest rates on new loans
to households for house purchase
Italy
2003 2004 2005 2006 2007 2008 2009 2010 2011 2012-0.50
0.25
1.00
Spain
2003 2004 2005 2006 2007 2008 2009 2010 2011 2012-1.0
0.0
1.0
2.0
Portugal
2003 2004 2005 2006 2007 2008 2009 2010 2011 2012-1.0
0.0
1.0
2.0
Greece
2003 2004 2005 2006 2007 2008 2009 2010 2011 2012-1.00
-0.25
0.50
1.25
France
2003 2004 2005 2006 2007 2008 2009 2010 2011 2012-0.75
0.00
0.75
1.50
Belgium
2003 2004 2005 2006 2007 2008 2009 2010 2011 2012-1.00
-0.25
0.50
1.25
Austria
2003 2004 2005 2006 2007 2008 2009 2010 2011 2012-0.75
0.00
0.75
1.50
The Netherlands
2003 2004 2005 2006 2007 2008 2009 2010 2011 2012-1.0
0.0
1.0
Germany
2003 2004 2005 2006 2007 2008 2009 2010 2011 2012-0.4
0.0
0.4
0.8
Finland
2003 2004 2005 2006 2007 2008 2009 2010 2011 2012-0.50
0.00
0.50
1.00
Note: The graphs report the residual of the regression of each lending rate on EONIA. Percentage points.
167
Table 1. Standard deviation of lending rates and credit growth Interest rate on
new loans to non-financial corporations
Interest rate on new loans to households
Loans to non-financial corporations
Loans to households for house purchase
2003:1-2012:8 0.81 0.47 5.03 6.08 2003:1-2007:8 0.58 0.43 6.36 7.48 2003:1-2010:4 0.62 0.45 5.41 6.95 2007:9-2012:8 1.02 0.51 3.78 4.78 2007:9-2010:4 0.69 0.46 3.74 6.02 2010:5-2012:8 1.39 0.56 3.82 3.35 2011:7-2012:8 1.60 0.58 4.41 3.67
Note: percentage points.
Table 2. Unit root tests ADF KPSS PP
Non-financial corporations
Italy -1.963 0.460 -1.474 Spain -2.097 0.366 -1.448 Portugal -1.995 0.540* -1.521 Greece -1.733 0.781** -1.352 France -2.019 0.556* -1.215 Belgium -2.042 0.781** -0.995 Austria -1.567 0.797** -1.114 Netherlands -1.486 0.691* -1.102 Germany -1.517 0.739** -0.966 Finland -1.478 0.757** -1.144
Households Italy -2.320 0.574* -1.267 Spain -2.174 0.434 -1.356 Portugal -2.398 0.267 -1.672 Greece -2.525 0.407 -1.264 France -2.077 0.567* -1.716 Belgium -2.158 0.343 -1.519 Austria -1.549 1.118** -0.841 Netherlands -1.844 0.567* -1.488 Germany -1.918 1.041** -0.997 Finland -1.410 0.845** -1.092
Note: ADF = Augmented Dickey–Fuller; KPSS = Kwiatkowski–Phillips–Schmidt–Shin. PP = Phillips-Perron. * = significance at 5 per cent; ** = significance at 1 per cent. In all three tests 3 lags are used. The tests follow the procedures for WinRats 8.0 available on the webpage of Estima; dfunit.src for the ADF test, kpss.src for the KPSS and ppunit.src for the PP.

168
Table 3. Interest rates on loans to non-financial corporations: estimated coefficients
(a) (b) (c) (d) (e) (f) (g) (h)
R ovR crisisD 2008D ovm RR 3 swapRR ,1010 Y 1R
Italy 0.592** 0.360** 0.008 -0.518** 0.138* 0.165** 0.014 0.604** Spain 0.480** 0.314** 0.176** -0.586** 0.331** 0.079** 0.045** 0.648** Portugal 2.040** 0.459** 0.352** -0.200** 0.280** 0.130** 0.012 0.371** Greece 0.816** 0.246** 0.443** -0.651** 0.067 0.033** 0.047* 0.675** France 0.481** 0.501** 0.259** -0.655** 0.366** 0.151** 0.088** 0.475** Belgium 0.556** 0.509** 0.140** -0.502** 0.249** 0.001 0.034** 0.458** Austria 0.539** 0.453** 0.194** -0.612** 0.172** -0.048 0.009 0.512** Netherlands 0.875** 0.609** 0.229** -0.558** 0.386** -0.108 0.071** 0.268** Germany 1.045** 0.564** 0.306** -0.623** 0.200** 0.108* 0.010 0.368** Finland 0.679** 0.466** 0.136** -0.690** 0.295** 0.035 0.024* 0.476**
Note: Standard errors are computed using the heteroskedasticity and autocorrelation consistent estimate of the covariance matrix of the coefficients. * = significance at 10 per cent; ** = significance at 5 per cent. Sample period: 2003:1 – 2012:8.
Table 4. Interest rates on loans to households for house purchase: estimated coefficients
(a) (b) (c) (d) (e) (f) (g) (h)
R ovR crisisD 2008D ovm RR 3 swapRR ,1010 Y 1R
Italy 0.395** 0.230** -0.135** -0.272** 0.145** 0.155** 0.004** 0.750** Spain 0.385** 0.287** 0.079* -0.329** 0.373** 0.052** 0.001 0.689** Portugal 0.809** 0.390** -0.054 -0.310** 0.320** 0.081** -0.001 0.521** Greece 0.386** 0.091** 0.079 -0.453** -0.149* -0.010** -0.004** 0.879** France 0.421** 0.115** 0.091** -0.110* 0.170** -0.050 0.001 0.806** Belgium 0.279** 0.170** 0.058 -0.515** 0.224** 0.097** 0.003** 0.810** Austria 0.648** 0.249** -0.020 -0.070 0.035 0.098 -0.001 0.713** Netherlands 0.181** 0.099** 0.109** -0.512** 0.204** 0.074 0.002** 0.883** Germany 1.220** 0.343** 0.041 -0.299** 0.114* 0.075 0.000 0.563** Finland 0.526** 0.412** 0.088** -0.678** 0.217** 0.266** 0.001 0.558**
Note: Standard errors are computed using the heteroskedasticity and autocorrelation consistent estimate of the covariance matrix of the coefficients. * = significance at 10 per cent; ** = significance at 5 per cent. Sample period: 2003:1 – 2012:8.
Table 5. The impact of sovereign spreads on bank rates on loans to non-financial corporations and households: counterfactual exercise starting in May 2010 (a) (b) (c) (d) (e) (d) (e) swapRR ,1010 NFCs households NFCs households NFCs households
April 2010 2011(a) 2011(a) Dec. 2011 Dec. 2011 Aug. 2012 Aug. 2012 Italy 0.71 0.54 0.62 1.34 1.16 1.15 1.91 Spain 0.71 0.37 0.33 0.47 0.29 0.81 0.70 Portugal 1.82 1.08 0.80 1.45 1.14 1.75 1.34 Greece 5.53 1.07 0.12 1.85 -0.26 1.62 -1.25 peripheral(b) 2.19 0.77 0.47 1.28 0.58 1.33 0.68 France 0.02 0.05 0.08 0.28 0.12 0.20 -0.06 Belgium 0.21 0.03 0.45 0.02 0.53 0.21 0.67 Austria 0.10 0.10 0.00 0.18 0.05 -0.11 0.00 Netherlands -0.10 0.09 0.07 0.27 0.15 -0.13 0.28 Germany -0.30 -0.01 0.08 -0.01 -0.02 -0.13 -0.08 Finland -0.05 0.10 0.07 0.29 0.05 0.10 -0.06 Euro area(c) 0.87 0.35 0.26 0.61 0.32 0.55 0.35
Note: Based on coefficients estimated over the period 2003:1 – 2012:8. The sovereign spreads are assumed to remain constant at their April 2010 levels over the period between May 2010 and August 2012. Columns from (b) to (g) report the differences between actual and simulated values. (a) Average in 2011. (b) Simple average over the peripheral countries. (c) Simple average.
169
Table 6. The impact of sovereign spreads on bank rate on loans to non-financial corporations and households: counterfactual exercise starting in July 2011 (a) (b) (c) (d) (e) (d) (e) swapRR ,1010 NFCs households NFCs households NFCs households
June 2011 2011(a) 2011(a) Dec. 2011 Dec. 2011 Aug. 2012 Aug. 2012 Italy 1.52 0.43 0.29 1.00 0.66 0.82 1.42 Spain 2.06 0.08 0.05 0.18 0.04 0.51 0.48 Portugal 7.06 0.38 0.20 0.37 0.25 0.67 0.45 Greece 12.34 0.59 0.28 1.13 0.01 0.92 -0.77 peripheral (b) 5.74 0.37 0.20 0.67 0.24 0.73 0.39 France 0.14 0.08 0.04 0.24 0.08 0.17 -0.04 Belgium 0.73 -0.03 0.14 0.02 0.20 0.21 0.39 Austria 0.12 0.05 0.02 0.18 0.05 -0.11 -0.01 Netherlands -0.03 0.07 0.06 0.28 0.09 -0.13 0.24 Germany -0.34 -0.03 -0.01 -0.01 -0.02 -0.12 -0.07 Finland -0.02 -0.01 0.00 0.29 0.03 0.10 -0.07 Euro area(c) 2.36 0.16 0.11 0.37 0.14 0.30 0.20
Note: Based on coefficients estimated over the period 2003:1 – 2012:8. The sovereign spreads are assumed to remain constant at their June 2011 levels over the period between July 2011 and August 2012. Columns from (b) to (g) report the differences between actual and simulated values. (a) Average in 2011. (b) Simple average over the peripheral countries. (c) Simple average.
Table 7. Interest rates on loans to non-financial corporations: estimated coefficients
(a) (b) (c) (d) (e) (f) (g) (h)
R ovR crisisD 2008D ovm RR 3 swapRR ,1010 Y 1R
Italy 0.578** 0.409** 0.093 -0.496** 0.013 0.176** 0.027** 0.585** Spain 0.713** 0.306** 0.077 -0.473** 0.202* 0.072** 0.057** 0.634** Portugal 1.549** 0.360** 0.292** -0.184** 0.141 0.103** 0.045* 0.527** Greece 0.840** 0.108** 0.341** -0.451** -0.194 0.019** 0.098** 0.787** France 0.598** 0.496** 0.206** -0.601** 0.221 0.142** 0.078** 0.478** Belgium 1.688** 1.031** -0.052* -0.256** 0.381** 0.009 0.038** -0.167 Austria 1.039** 0.808** 0.292** -0.479** 0.476** 0.025 0.036** 0.085 Netherlands 1.048** 0.680** 0.245** -0.486** 0.387** -0.123 0.081** 0.167* Germany 2.050** 0.775** 0.140** -0.458** 0.166* 0.169** 0.001 0.041 Finland 0.591** 0.428** 0.156** -0.669** 0.277** 0.055 0.034** 0.525**
Note: Standard errors are computed using the heteroskedasticity and autocorrelation consistent estimate of the covariance matrix of the coefficients. * = significance at 10 per cent; ** = significance at 5 per cent. Sample period: 2008:1 – 2012:8.
Table 8. Interest rates on loans to households for house purchase: estimated coefficients
(a) (b) (c) (d) (e) (f) (g) (h)
R ovR crisisD 2008D ovm RR 3 swapRR ,1010 Y 1R
Italy 0.441** 0.228** -0.149** -0.229** 0.067 0.157** 0.004** 0.750** Spain 0.403** 0.285** 0.065 -0.327** 0.444** 0.057** 0.001 0.675** Portugal 1.005** 0.644** 0.085 -0.236** 0.484** 0.134** 0.000 0.271** Greece 0.195 0.067 0.065 -0.469** -0.286** -0.012** -0.004** 0.959** France 0.687** 0.155** 0.095** -0.054 0.215** -0.025 0.000 0.713** Belgium 0.510** 0.203** 0.020** -0.438 0.067** 0.123** 0.001 0.764** Austria 0.835** 0.303** -0.017 -0.030 0.001 0.080 -0.002* 0.646** Netherlands 0.592** 0.134** 0.075 -0.431** 0.189** 0.008 0.001* 0.779** Germany 2.200** 0.616** 0.095** -0.224** 0.466** 0.036 -0.001 0.168** Finland 0.691** 0.537** 0.142** -0.672** 0.287** 0.208** 0.000 0.410**
Note: Standard errors are computed using the heteroskedasticity and autocorrelation consistent estimate of the covariance matrix of the coefficients. * = significance at 10 per cent; ** = significance at 5 per cent. Sample period: 2008:1 – 2012:8.
170
Table 9. Interest rates on loans to non-financial corporations: estimated coefficients
(a) (b) (c) (d) (e) (f) (g) (h)
R ovR crisisD 2008D ovm RR 3 swapRR ,1010 Y 1R
Italy 0.599** 0.353** 0.016 -0.476** 0.153* 0.167** 0.035** 0.603** Spain 0.500** 0.336** 0.192 -0.555** 0.357** 0.094** 0.059** 0.624** Portugal 2.061** 0.463** 0.355** -0.180** 0.277** 0.133** 0.016 0.364** Greece 0.650** 0.192** 0.443** -0.624** 0.050 0.027** 0.061** 0.735** France 0.541** 0.560** 0.292** -0.600** 0.412** 0.213** 0.115** 0.411** Belgium 0.564** 0.508** 0.141** -0.460** 0.245** 0.012 0.051** 0.455** Austria 0.632** 0.518** 0.215** -0.554** 0.191** 0.011 0.025** 0.437** Netherlands 0.912** 0.621** 0.240** -0.518** 0.394** -0.037 0.085** 0.249** Germany 1.028** 0.550** 0.318** -0.564** 0.197* 0.184** 0.022** 0.385** Finland 0.627** 0.433** 0.139** -0.670** 0.275** 0.074 0.030** 0.515**
Note: Equation-by-equation estimation. Standard errors are computed using the heteroskedasticity and autocorrelation consistent estimate of the covariance matrix of the coefficients. * = significance at 10 per cent; ** = significance at 5 per cent. Sample period: 2003:1 – 2012:8. Each equation is estimated with ordinary least squares.
Table 10. Interest rates on loans to households: estimated coefficients
(a) (b) (c) (d) (e) (f) (g) (h)
R ovR crisisD 2008D ovm RR 3 swapRR ,1010 Y 1R
Italy 0.431** 0.260** -0.143** -0.249** 0.145** 0.180** 0.005** 0.721** Spain 0.435** 0.350** 0.109** -0.261** 0.416** 0.078** 0.003 0.631** Portugal 0.807** 0.400** -0.058 -0.287** 0.308** 0.088** -0.001 0.515** Greece 0.327** 0.091** 0.076 -0.449** -0.165** -0.009** -0.004** 0.893** France 0.483** 0.124** 0.100** -0.102** 0.181** -0.066** 0.001 0.783** Belgium 0.234** 0.164** 0.036 -0.494** 0.234** 0.111** 0.004** 0.826** Austria 0.632** 0.236** -0.022 -0.068 0.051 0.065 0.000 0.723** Netherlands 0.199** 0.094** 0.110** -0.496** 0.222** -0.011 0.002** 0.876** Germany 1.238** 0.343** 0.038 -0.268** 0.116* 0.097 0.000 0.561** Finland 0.422** 0.349** 0.069 -0.660** 0.211** 0.157** 0.002** 0.628**
Note: Equation-by-equation estimation. Standard errors are computed using the heteroskedasticity and autocorrelation consistent estimate of the covariance matrix of the coefficients. * = significance at 10 per cent; ** = significance at 5 per cent. Sample period: 2003:1 – 2012:8. Each equation is estimated with ordinary least squares (OLS).
Table 11. Testing for cointegration
Interest rate on new loans to non-financial corporations a)
Interest rate on new loans to households b)
Italy -1.395 -0.972 Spain -0.979 -1.690 Portugal -0.781 -1.527 Greece -0.719 -3.377 France -2.293 -2.145 Belgium -1.831 -1.657 Austria -2.718 -2.290 Netherlands -2.971 -1.343 Germany -2.484 -2.866 Finland -3.040 -2.563
Note: test based on Engle and Granger (1987). Critical values from MacKinnon (1991). Tests carried out in WinRats with the procedure egtest.src. a) The number of lags is set to 1. b) The number of lags is set to 3. * = significance at 5 per cent; ** = significance at 1 per cent. Critical values are from MacKinnon, “Critical Values for Cointegration Tests”, in R. F. Engle and C. W. J. Granger (eds.), Long-Run Economic
Relationships, London, Oxford U. Press, 1991, pp 267–276.