Embed Size (px)
Citation preview
0
The Impact of the Shale Oil Revolution on U.S. Oil and Gasoline Prices
June 26, 2015
Lutz Kilian
University of Michigan CEPR
Abstract: This article examines how the shale oil revolution has shaped the evolution of U.S. crude oil and gasoline prices. It puts the evolution of shale oil production into historical perspective, highlights uncertainties about future shale oil production, and cautions against the view that the U.S. may become the next Saudi Arabia. It then reviews the effects of the ban on U.S. crude oil exports, of capacity constraints in refining and transporting crude oil, of differences in the quality of conventional and unconventional crude oil, and of the recent regional fragmentation of the global market for crude oil on the determination of U.S. oil and gasoline prices. It discusses the reasons for the persistent wedge between U.S. crude oil prices and global crude oil prices in recent years and for the fact that domestic oil prices below global levels have not translated to lower U.S. gasoline prices. It also examines the role of shale oil in causing the 2014 oil price decline. Finally, it explains why the shale oil revolution unlike the shale gas revolution is unlikely to stimulate a boom in oil-intensive manufacturing industries, and it explores more generally the implications of the shale oil revolution for the U.S. economy. JEL Code: Q43 Key Words: Shale oil; unconventional oil; tight oil; infrastructure; export ban; refining; U.S. oil independence; oil sands; capacity constraints; oil trade. Acknowledgements: I thank Severin Borenstein, Tim Fitzgerald, Vincent Kaminski, Ryan Kellogg, John Mackowiak, and two anonymous referees for helpful comments and discussion. I also thank Alexander Metelitsa and Thomas Lee at the EIA for technical assistance in producing Figure 6.
Lutz Kilian, Department of Economics, 611 Tappan Street, Ann Arbor, MI 48109-1220, USA. Email: [email protected].
1
1. Introduction
The production of shale oil (also referred to as tight (rock) oil) exploits technological advances in
drilling. It involves horizontal drilling and the hydraulic fracturing (or fracking) of underground
rock formations containing deposits of crude oil that are trapped within the rock. The hydraulic
fracturing causes cracks and fissures in the rock formation that allow the crude oil to escape and
to flow into the borehole, where it can be recovered. In some cases, advanced microseismic
imaging is used to maximize the effects of hydraulic fracturing. This process is used to extract
crude oil that would be impossible to release by conventional drilling methods designed for
extracting oil from permeable rock formations.1 The rapid expansion of U.S. shale oil production
after 2003 was stimulated by the high price of conventional crude oil, which made this new
technology competitive. Shale oil production is capital intensive. Production levels are primarily
determined by the availability of suitable drilling rigs and skilled labor, which is one of the
reasons why the U.S. shale oil boom so far has been difficult to replicate in other countries.
The expansion of U.S. shale oil production soon captured the imagination of
policymakers and industry analysts and fuelled visions of the U.S. becoming independent of oil
imports, of a rebirth of U.S. manufacturing, and of net oil exports improving the U.S. current
account. At the same time, energy experts were forced to revise their models and forecasts to
incorporate U.S. shale oil production. By 2012, the International Energy Agency projected that
the United States would become the world’s leading crude oil producer, overtaking Saudi Arabia
by the mid-2020s and evolving into a net oil exporter by 2030 (see International Energy Agency
2012). Figure 1 examines the evidence to date. The left panel plots the average annual
production of crude oil of the three largest crude oil producers in the world from 1973 until
1 The terms shale oil and tight oil do not have a precise geological definition, but are commonly used by the oil industry and by government agencies to refer generically to crude oil produced from shale, sandstone and carbonate formations characterized by low permeability.
2
2014.2 It shows that Russia, Saudi Arabia and the United States all increased their oil production
after 2002. As of 2014, not only Saudi Arabia is producing more crude oil than the United States,
but so is Russia, which in fact has become the world’s largest producer of crude oil.3
The plot also shows that the United States has in fact been the world’s largest oil
producing country repeatedly during 1973-2014. This fact has not, however, protected the United
States from being exposed to major oil price shocks in the past. For example, the United States
was the world’s leading oil producer, ahead of Saudi Arabia, during the first major oil crisis of
1973/74. The vulnerability of the U.S. economy to oil price shocks in 1973/74 is not surprising
upon reflection. Although U.S. oil production at the time was the highest in the world, it was not
sufficient to meet U.S. domestic demand for crude oil. Thus, there was no spare capacity to allow
the United States to deal with a global shortfall of oil production, exposing the U.S. economy to
shocks to the price of imported crude oil. U.S. oil production also exceeded that of Saudi Arabia
during 1981-1990, mainly because Saudi Arabia reduced its oil production in the early 1980s in
an effort to prop up the price of oil. The larger volume of U.S. oil production did not prevent the
United States from being exposed to the 1990 oil price spike, following the invasion of Kuwait.
These examples suggest that there is limited comfort in being the leading oil producer in the
world.
The right panel of Figure 1 highlights the fact that all three leading oil producers account
for only a modest fraction of global oil production, with the United States reaching 11% in 2014.
This means that the additional oil production in the United States in recent years, although
2 Production data for the former Soviet Union have been excluded to maintain consistency over time and because the Soviet Union was not a major participant in global oil markets. 3 The Financial Times recently reported that, as of September 2014, U.S. liquid petroleum production exceeded that of Saudi Arabia and Russia (see Crooks and Raval 2014). This comparison includes natural gas liquids in addition to crude oil and condensate. Because natural gas liquids tend to be used as feedstocks for the petrochemical industry rather than for producing fuel, they are excluded from our analysis of the crude oil and gasoline markets. It should be noted, however, that some natural gas liquids can be used in gasoline blending and as feedstocks in gasoline production.
3
important from a domestic point of view, has been small compared with the size of the global oil
market. This fact is important to keep in mind in discussing the impact of the U.S. shale oil
revolution. The price of oil is largely determined in global markets. As dramatic as the increase
in U.S. shale oil production has been by historical standards, the right panel of Figure 1 reminds
us that it is unrealistic to expect the changes in U.S. oil production alone to have a large impact
on global oil prices (also see Alquist and Guénette 2014).
2. The Evolution of U.S. Shale Oil Production
So far we have examined overall U.S. crude oil production. Figure 2 traces in more detail the
evolution of the production of U.S. shale oil. Two observations stand out. First, shale oil
production initially increased exponentially, but the trend growth has become nearly linear as of
late. Second, much of shale oil production is concentrated in a few geographic regions of the
United States. By far the most productive shale oil plays are Eagle Ford and the Permian Basin in
Texas and the Bakken in Montana/Dakota, which alone account for considerably more than half
the output.4 To gauge how big these production numbers really are, it is useful to observe that in
March 2014 the U.S. economy produced on average 8.2 millions of barrels/day (mbd) and
imported an additional 7.3 mbd to meet its oil needs. Of the total 15.5 mbd of crude oil only
about 3.6 mbd were produced from shale oil. In other words, as of March 2014, shale oil
accounted for almost half of U.S. oil production, but only about a quarter of the total quantity of
oil used by the U.S. economy. This magnitude is far from negligible, but to understand the
excitement about shale oil one has to consider projections of future U.S. shale oil production.
Figure 3 displays EIA production estimates and projections for all forms of U.S. crude oil
production as of 2012. The projections shown are based on the reference case or business-as-
4 A shale oil play refers to a geographical area suitable for shale oil production, whereas oil fields refer to areas suitable for conventional crude oil production.
4
usual trend estimate, given known technology and technological and demographic trends. There
is no expectation that conventional onshore oil production (or for that matter off-shore oil
production) will increase in the foreseeable future. At best they will remain stable at current
levels in the long run. All of the growth in U.S. oil production going forward, if there is to be
any, therefore must come from shale oil (referred to as “tight oil” in the figure). The projection
shows a sharp increase in shale oil production until 2015, followed by zero growth until 2020
and a steady decline to today’s level of production by 2040.5
It has to be kept in mind that these projections are based on a host of assumptions most of
which could be debated. Four concerns stand out. First, increases in shale oil production are not
permanent. As Figure 3 illustrates, one would expect shale oil production to taper off in the
2020s, unless new promising shale oil plays can be found.
Second, the projected flow of shale oil production reflects estimates of the stock of shale
oil that can be recovered using current technology that in turn are subject to substantial error.6
For example, in the summer of 2014 the EIA reduced its estimate of the recoverable Monterey
shale oil stocks from 15.4 million barrels to 0.6 million barrels. This implied a 64% reduction in
previous estimates of recoverable U.S. shale oil stocks. Clearly, such reductions in the stock of
recoverable shale oil also affect the expected flow of shale oil production. This particular
revision resulted from the realization that the geology of the Monterey shale oil play made it
technically more difficult and more costly to exploit than anticipated. It is important to stress that
5 Figure 3 also relates the peak level of U.S. oil production projected for the second half of this decade to the maximum level of U.S. oil production in 1970, shortly before the United States became heavily dependent on crude oil imports from the Middle East. There is little comfort in the fact that the United States is projected to reach this level again within a few years, however, given that the size of the U.S. industrial sector has more than doubled since then. Even accounting for higher oil efficiency, one would expect the U.S. economy to remain dependent on oil imports on that basis. 6 The EIA refers to these stocks as recoverable resources. This concept is distinct from the more conventional concept of oil reserves (which itself is a somewhat ambiguous concept) and less clearly defined. It should be noted that EIA estimates of recoverable resources in the past have been based more on information provided by industry sources than on independent in-depth geological studies.
5
not all revisions of the stock of shale oil are necessarily downward. There is uncertainty in both
directions. For example, there is evidence of significant productivity gains in shale oil production
in 2014 that could raise future estimates of recoverable shale oil (see Covert 2014). There is also
the possibility of further technological breakthroughs.
Third, the projected flow of shale oil production depends not only on the stock of
recoverable shale oil below the ground, but also on the price of crude oil. Implicit in projections
of the flow of shale oil production is the premise that the price of oil will remain high enough in
the future such that continued investment in shale oil plays takes place. The sharp decline in the
price of WTI crude oil from $106 in June 2014 to $47 in January 2015, followed by a recovery to
$59 by May 2015, serves as a reminder that the shale oil industry is vulnerable to downside oil
price risk. Assessing this oil price risk is not straightforward. For example, the price at which
continued shale oil production becomes unprofitable not only differs across shale oil plays, but
also has continuously evolved over time, as shale oil producers have become more cost-efficient.
Whereas Platts (2013) suggested that it may take a price of oil below $50 per barrel to shut down
production at Eagle Ford, for example, more recent sources put this price closer to $35.
A final concern is that Figure 3 – by adding up barrels of oil as though all crude oil were
the same – ignores the inherent differences in the quality of shale oil compared with
conventional crude oil. The quality of crude oil can be characterized mainly along two
dimensions. One is the oil’s density (ranging from light to heavy) and is typically measured
based on the American Petroleum Institute (API) gravity formula; the other is its sulfur content
(with sweet referring to low-sulfur content and sour to high-sulfur content). Figure 4 provides an
overview of how commonly quoted crude oil benchmarks (including WTI and Brent) can be
characterized along these dimensions. Conventional U.S. light sweet crude has an API under 40.
6
Shale oil consists of light sweet crude (at most 45 API), ultra-light sweet crude (about 47 API)
and condensates (as high as 60API).7 Thus, not all shale oil is a good substitute for conventional
light sweet crude oil such as the WTI or Brent benchmarks. The quality of the crude may affect
the yield of refined products obtained in the refining process. Moreover, there have been reports
that refining shale oil may cause technical problems in running refineries not encountered with
conventional crude oil.8 This point is ignored in Figure 3.
To conclude, whether the United States will ever become independent of imported crude
oil seems highly uncertain at this point. Such predictions are predicated on very rapid growth in
shale oil production in years to come as well as stable production levels for conventional U.S.
crude oil. There is considerable risk that U.S. oil production may decline earlier than projected.
At the same time, it is possible that technological improvements and efficiency gains may lower
the cost of shale oil production and sustain the U.S. shale oil boom longer than anticipated by
current projections. Even taking the projections in Figure 3 at face value, however, any aggregate
analysis of the oil market is likely to be misleading given the regional and international
fragmentation of the market for crude oil after 2010.
3. The Fragmentation of the Market for Crude Oil after 2010
Crude oil is purchased by refineries which convert the crude oil to refined products such a diesel,
gasoline, jet fuel or bunker fuel. To understand the impact of the shale oil revolution on the U.S.
price of oil, it is important to understand the structure of the U.S. refining market. Not all
refineries are alike. Their technical configuration determines which type of crude oil they can
7 Data on the relative importance of shale oil production by API are not readily available, but the EIA recently published a report for annual U.S. crude oil production by API that sheds some light on this question (see EIA 2015a). For 2013, more than half of crude oil with at least API 40 was in the API 40-45 range and perhaps a quarter was above API 50. Regional disaggregates show that much of the ultra-light crude and condensate is from the Gulf Coast region (most prominently from the Eagle Ford play) and none from the Northern Great Plains (which includes the Bakken). 8 See, e.g., Baker Hughes (2013) and Benoit and Zurlo (2014).
7
process. Light sweet crudes are well suited for the production of gasoline, whereas heavier and
sourer crudes are best suited for producing diesel fuel and for producing heavy fuel oils sold at a
discount to run ships or power plants. Refining heavier crudes into gasoline requires more
advanced technologies and is more costly. Nevertheless, there are refineries that employ such
expensive technologies because heavier and sourer crudes tend to be much lower priced than
conventional light sweet crude oil such as the Brent or WTI benchmark.
U.S. refineries are heavily concentrated along the Gulf Coast and along the East coast
with additional refineries located near major population centers (see Figure 5). Not all of these
refineries are able to process heavier and sourer crudes. Whereas many refineries along the Gulf
coast rely on advanced technologies to produce gasoline from low-priced medium and heavier
crudes imported from Saudi Arabia, Venezuela and Mexico, U.S. refineries along the East Coast
specialize in processing light sweet crude oil which can be refined using more conventional
technology. It is against this backdrop that we need to view the shale oil revolution. Most shale
oil is well suited for the production of gasoline. One would have thought that this additional
supply of light sweet crude should have been easily absorbed by U.S. refiners, but instead the
surge in shale oil production caught the U.S. refining industry off guard.
For many years, there had been signs of light sweet crude oil becoming increasingly
scarce in the world. As the composition of the grades of crude oil available in the market shifted
toward heavier and sourer crudes, many refiners in Texas invested in technology that allowed
them to become the world leader in processing heavier crudes, despite their higher sulfur content.
In contrast, European refiners much like the U.S. refineries along the East Coast continued to
rely on imports of light sweet crude oil (mainly from Nigeria, Angola and Algeria, but also from
Europe). East Coast refiners in some cases even reduced their capacity in anticipation of a
8
shortage of light sweet crude.
When shale oil was shipped in ever increasing quantities to the U.S. oil market hub in
Cushing, OK, after 2010, the refiners most naturally suited to taking advantage of this
opportunity were the refiners along the East Coast. Because traditionally these refiners supplied
the interior of the country with refined product produced from imported light sweet crudes,
however, there was no pipeline infrastructure in place to transport the shale oil to those
refineries. Alternative means of transporting crude oil such as barges and rail cars simply were
not up to the challenge of moving large quantities of shale oil to the East Coast, given the
increased demand for oil transports in other parts of the country as well.
Likewise, it proved difficult to sell the shale oil to Texas refineries. Not only were many
of those refineries not well-equipped to process light sweet crude oil on a large scale, given their
investment in technologies for processing heavier crudes, but there were no oil pipelines running
from Cushing to Texas as of 2010. Traditionally, the system of oil pipelines in that region was
designed for transporting imported oil from the Gulf Coast ports to the interior, not from the
interior to the refineries along the Gulf Coast. Because reversing and extending existing oil
pipelines or building new pipelines is expensive and time consuming, and rail and barge
transport could not cope with the required volume of shipments, a glut of light sweet crude oil
developed in Cushing.
The glut was not limited to light sweet crude oil. The rise of shale oil coincided with the
rise of imports of heavy Western Canadian crudes extracted from oil sands in Alberta and
Saskatchewan. These oil imports from Canada are priced differently from conventional light
sweet crude oil much like alternative heavier crudes imported from Venezuela or Saudi Arabia.
As the production of shale oil was stimulated by high global oil prices, so was the production of
9
heavy crudes from Canadian oil sands. Like most shale oil, Canadian crude oil was shipped by
pipeline, rail, or barge toward the hub of U.S. oil trade in Cushing, OK, where it failed to find
enough buyers. One reason was that most East Coast refiners would not have been able to
process heavy crudes, even if there had been a way of shipping the Canadian oil there. The other
reason was that, at the same time, there was not enough transportation capacity from Cushing to
the Texas refineries which actually would have been interested in purchasing heavy crudes.
The continued build-up of the supply of both light and heavy crude in Cushing resulted in
a mismatch between the types of crude oil supplied to this market and the types of crude oil
preferred by refiners buying in this market. Local refineries in the Midwest were simply not set
up to process large quantities of unconventional types of crude oil. To the extent that refineries
have the flexibility to modify their feedstock to process greater volumes of lighter crudes, for
example, doing so often reduces their profitability. More generally, reconfiguring an entire
refinery to allow it to process different grades of crude oil tends to be an expensive and time-
consuming process.
The local excess supply of light sweet crude oil, in particular, put downward pressure on
the U.S. price of oil, as measured by the WTI price of oil, relative to the Brent price benchmark,
whereas the discounts on the price of heavy crude went unrecorded by conventionally used
measures of the U.S. price of oil such as the WTI price. It is important to stress that this
downward pressure on the U.S. price of oil arose not because unconventional crude oil helped
satisfy the world’s demand for gasoline, but because of a lack of demand for the oil available in
Cushing from refineries operating in this market. The oil glut that first arose in the Midwest in
2011 coexisted with high demand for imported light sweet crude oil along the coast. In other
words, the U.S. oil market had become fragmented regionally as well as distinct from the global
10
oil market. It is useful to review the origins of this development in more detail. Specifically, the
decline in the U.S. price of oil relative to international benchmarks can be traced to three
constraints: the inability to export this crude oil, on the one hand, and capacity constraints in the
transportation infrastructure and in the refining infrastructure, on the other.
3.1. The Role of Oil Exports
Under normal circumstances one would have expected the excess supply of unconventional
crude oil to be resolved by oil exports from Canada and from the United States to the rest of the
world. This did not happen for several reasons. It is useful to start with the case of the heavy
Canadian crudes. The reason that Canada has to export its heavy crudes in the first place is that
Canada lacks the refining infrastructure required to process heavy crudes locally. As discussed
earlier, processing heavy crudes requires more advanced and costly technologies that even in the
United States are only available along the Gulf Coast. In addition, Canada lacks the pipeline and
port infrastructure that would be required for large-scale exports of refined products either to
Asia or Europe.
The reason that Canadian heavy crudes are being exported to the central United States as
opposed to Asia is that Canada lacks sufficient pipeline capacity to transport its crude oil
production to ports on the Pacific Coast. Efforts to build additional pipelines are bogged down
over disputes with the First Nations peoples owning the land in question. Nor does the rail
infrastructure support large scale shipments of crude oil to the Pacific coast. In practice,
Canada’s only option for now is to use existing pipelines in the center of the country to move
most of its crude oil production to refiners in Texas. It may seem that there should be a market
for this crude oil in Europe. European refiners, however, like East Coast refiners in the United
States, are used to processing light sweet crude oil and hence have no use for heavy Canadian
11
crudes. There is no indication of European countries being willing or able to adapt their refining
industry to be able to handle heavier crudes such as the Canadian oil.
One alternative would be to ship Canadian crudes from the Gulf coast to Asia, but this
would require shipping the oil around the Cape of Good Hope or around Cape Horn. The added
cost of shipping would put these exports to Asia at a competitive disadvantage compared with
Asia’s traditional oil suppliers in the Middle East (see Figure 6). Moreover, shipping oil over
such long distances would be most cost-effective in large oil tankers known as very large crude
carriers (VLCCs) that are designed for long-haul voyages.9 Servicing such large tankers would
require investments along the Gulf Coast in additional off-shore loading facilities and pipelines.
The same problem would arise if a pipeline were built to the Canadian Atlantic Coast.10 In any
case, there appears to be no political support in the United States for re-exports of Canadian oil.
For these reasons, it is unlikely that Canadian oil will ever be exported or re-exported on a large
scale. At an even more fundamental level, the problem is not only one of transportation, but of
finding buyers for these heavy crudes abroad.11
Given these constraints it would seem natural for the United States to export its excess
supply of light sweet crude oil for which there is a market abroad. One reason that no such
exports have taken place is a U.S. law prohibiting the export of domestically produced crude oil
(with some exemptions at the discretion of the Commerce Department). There has been some
9 Currently, more than half of the crude tanker order book (measured in deadweight tons) consists of VLCCs and ultra large crude carriers (ULCCs). Among these are only a handful of ULCCs. 10 One way of shortening this route would be to ship the oil through the Panama Canal. Historically, the Panama Canal has been of little relevance for long-distance oil trade. Although the Panama Canal Authority has embarked on a program to widen the Canal, which is scheduled to be completed in 2015, even after this expansion the canal will not be able to accommodate VLCCs, suggesting that the Canal will remain of limited importance for oil shipping to Asia (see U.S. Energy Information Administration 2014). 11 A recent study by Hackett et al. (2013) concludes that without Canada demonstrating its ability to provide a continuously high volume of heavy crude, Asian countries will not invest in the additional refining infrastructure required to process heavy Canadian crudes, while the construction of suitable pipelines relies on there being evidence of sufficient demand and refining capacity for heavy crudes in Asia. For a somewhat different view see Platts (2013).
12
recent discussion of rescinding this export ban, which was put in place in 1975, following the
experience of the 1973/74 oil crisis, in an attempt to insulate the United States from foreign oil
price shocks. Leaving aside the question of whether this ban ever achieved its objective, the case
can be made that even if the ban were lifted today, few exports would take place in the short run.
The main obstacle is that the United States lacks the transportation capacity for large-scale oil
exports from the Gulf of Mexico at this point, although shale oil is already being shipped from
the port at Corpus Christi up the Gulf Coast and even to the East Coast, following the conversion
of some refineries there which used to process imported light sweet crude (see Platts 2013).12
Because light sweet crude oil could be shipped to Europe, and the European market is much
closer than the East Asian market, the added transportation cost is less of a concern than with
Canadian crude oil. In the long run, one would expect these bottlenecks to be resolved, if the
political decision is made to allow U.S. crude oil exports.
3.2. Implications for the Price of Oil
One creative response of the U.S. oil industry to the glut of light sweet crude oil has been to
blend heavy crudes and shale oil in the right proportion to mimic mid-grade crude oil of the type
traditionally imported and refined along the Gulf Coast. Refineries along the Gulf Coast are
among the most sophisticated refineries when it comes to blending crudes. Refiners use linear
programming techniques to determine the optimal mix of crude oil purchases based on the
relative cost of different crudes and the yields of different products. Refining blends of crude oil
is not without drawbacks, however. It requires more sophisticated equipment than processing
conventional crudes, raising the cost of refining. This is why blending has not played an 12 The oil tankers used for this purpose are U.S. flagged Panamax vessels (i.e., vessels small enough to fit through the Panama Canal rather than the VLCCs or ULCCs used for long-distance shipping). Platts (2013) notes that additional docks and tankers may be needed to relieve the bottleneck in shipping that is already developing at Corpus Christi. One constraint is the Jones Act that necessitates the use of U.S.-flagged vessels for transporting goods between U.S. ports, restricting the number of vessels available and inflating oil tanker rates on these routes.
13
important role in U.S. refining traditionally. The incentives for blending changed with the
availability of low-priced heavy crude from Canada and low-priced domestic light sweet crude.
The low prices of these crudes made the blending process economically viable.
The practice of blending crude oil has allowed refiners along the Gulf Coast to process
more of the rising supply of shale oil, alleviating price pressures on the WTI price relative to
Brent. Such blends, however, can only be processed to the extent that the oil in question can be
transported to Texas refineries by rail or by pipeline. The challenge for the refining industry has
been that with the increased production and imports of unconventional oil, many existing
pipelines were in the wrong location or were running the wrong way, sustaining local oil
shortages in some locations, while creating gluts in others. Initially, the glut was concentrated in
Cushing, OK, the hub of U.S. oil pipelines. Cushing had effectively become landlocked, with
more and more oil flowing in from the Bakken and other shale oil plays as well as Canada. This
oil had to be sold at a discount or stored in inventories in the absence of a buyer.
One indication of this bottleneck in the transportation infrastructure is the fall in the WTI
price of crude oil below the global price of crude oil, as measured the Brent price, starting in
2011 (see Figure 7). This price difference reflected the excess supply of light sweet crude in
Cushing, Oklahoma, where the WTI price is measured. The problem was not a lack of final
demand for refined products, but rather a lack of effective demand from refineries. Another
indication is the unprecedented spread between the price of Louisiana Light Sweet (LLS) and
WTI crude oil beginning in 2011. LLS is produced on the Gulf Coast close to where many U.S.
refineries are located. Because there was a shortage of light sweet crude oil along the coast, LLS
traded at a premium reflecting the price of oil imports in the Gulf region. As a result, the price of
LLS closely tracked that of Brent crude oil with the comparatively high price of Brent reflecting
14
the tightness of global oil markets, as Asia came to rely on Brent oil imports. The price discount
on WTI crude oil after 2011, in contrast, reflected the fact that this oil was in the wrong location
and hence traded at a discount.
The oil glut in Cushing was finally alleviated starting in mid-2013, when some existing
pipelines originally running from Texas to Cushing were reversed, new pipelines to Texas
refineries opened, and rail transport increased (see Platts 2013). Just as the spreads between
WTI, Brent and LLS prices were shrinking in late 2013, however, the situation changed again. A
sellers’ market from the point of view of oil producers along the Gulf coast turned into a buyers’
market from the point of view of refiners. As new pipelines from Cushing to the Gulf Coast
allowed oil to flow more freely to the Texas refineries, oil inventories in Cushing declined. At
the same time shale oil production at Eagle Ford accelerated and began competing with LLS
along the Gulf Coast. With the increased availability of both light sweet and heavy crude oil
from the interior of the country, refineries chose to pay less for this oil rather than match high
prices for oil imports. Because domestic and Canadian oil producers were unable to export their
oil production on a large scale, they had little choice but to acquiesce. The continued influx of
shale oil resulted in domestic light sweet crude, including both WTI and LLS benchmarks,
trading at a discount compared with the Brent price. In contrast, high-priced imports of crude oil
declined, freeing up this crude for markets abroad, and reducing U.S. net oil imports.
The overall glut in the central part of the United States was compounded by the opening
of an important segment of the Keystone XL pipeline in January of 2014. The Keystone XL
pipeline consists of several distinct parts (see Figure 8). One is a pipeline connecting the oil
sands in Alberta with Cushing, OK. It is unclear at this point whether this pipeline will ever
receive approval by the U.S. government, but this has not prevented Canadian oil from being
15
transported along the less direct route from Alberta via Saskatchewan and Manitoba. Another
(and arguably more important) part of the Keystone XL project is a pipeline connecting Cushing,
OK, with the oil refineries in Texas. This part of the pipeline started operating in early 2014,
with an additional extension to Houston scheduled to be completed in 2015. The additional
transport capacity amplified the flow of crude from Cushing to the Texas Gulf Coast, sustaining
the price wedge between the global and the U.S. price of light sweet crude.
As of early 2014, there was growing concern in the market about the prospect of capacity
shortages in refining light sweet crude oil, given the sustained glut of light sweet crude oil on the
Gulf Coast, but there also were signs of the refining market adapting. Some refiners found ways
of processing more shale oil, and there continue to be improvements in the oil transportation
infrastructure that allow some of this oil to reach refiners along the East Coast. If this process
continues, one would expect the price spreads to erode over time with WTI and LLS ultimately
reaching Brent levels, unless U.S. shale oil production grows faster than the ability to transport
and process this crude oil. This convergence will be strengthened to the extent that lower U.S.
demand for imports of crude oil (or equivalently higher U.S. exports of refined products to
Europe and Latin America) will, all else equal, permit more oil to be shipped to Asia, allowing
the Brent price to decline.13
In addition, a shift in the U.S. policy toward oil exports could help restore arbitrage
between WTI, LLS, and Brent prices. There already has been some movement in the U.S.
position on crude oil exports as of late. For example, in June 2014 the Obama administration
approved exports of lightly processed condensates, which as refined products technically are not
covered by the oil export ban. More importantly, in December 2014, the Obama administration
13 Exports of refined products made from domestically produced oil is a substitute for exports of crude oil because it reduces foreign demand for oil traditionally satisfied by foreign oil producers, as though the U.S. crude oil had been exported.
16
cleared the way for exports of as much as a million barrels a day of ultra-light crude oil to the
rest of the world. In practice, substantial increases in U.S. oil exports are expected by the end of
2015.
In contrast with the market for light sweet crude oil, effective demand for heavy crudes
has been strong, once sufficient pipeline capacity to the Gulf Coast had become available. One
reason is, of course, that this oil has been less expensive than imported heavy crudes and that
many refineries in Texas are eager to recoup their earlier investments in heavy crude refining
technology. In addition, some refineries in the Midwest have begun to increase their processing
capacity for heavy crude by retrofitting refineries. Thus this oil no longer has to be shipped to
Cushing, reducing the cost of transportation. Heavy crude traditionally has traded at a discount
of between 20% and 50% relative to the WTI price. Increased demand for heavy crudes over
time is likely to reduce the discount applied to heavy crudes without eliminating it, given the
higher cost of producing gasoline from heavy crude.
From the Canadian point of view this development alleviates concerns about not being
able to export (or re-export) Canadian crudes. In fact, it is not clear who else in the world would
buy such crudes, given the unique capabilities and expertise of Texas oil refineries in processing
heavy crudes. Although Canadian crude sells at a discount in the United States, this would likely
be the case as well if it were exported elsewhere, not to mention the additional discounts for
transportation costs, if Canadian oil had to be shipped around the globe.
3.3. The Role of the Refining and Transportation Infrastructure
Restoring arbitrage between domestic and global oil markets will require the development of a
suitable transportation infrastructure for crude oil. It will also require relaxing regional capacity
constraints in refining specific grades of crude oil. Developing this infrastructure is a slow and
17
costly process. All indications are that future changes in the transportation infrastructure will be
incremental only.
In recent years, there has been considerable investment in expanding, reversing and
converting existing pipelines to increase the flow of crude oil to the refineries along the Gulf
Coast, yet – with the exception of several new pipelines connecting to Texas refineries
(including the lower segment of the Keystone XL pipeline) – there has been remarkably little
new construction of oil pipelines in the United States. A review of ongoing and proposed
pipeline projects can be found in Platts (2013). How many of these projects will be approved and
how many will remain economically viable at the current much lower price of oil remains to be
seen. It is also worth noting, that none of these projects address the concern that there is no
pipeline network capable of transporting crude oil from Cushing to the East Coast, which would
seem the single most important investment to alleviate the excess supply of light sweet crude in
the central part of the country short of promoting U.S. oil exports. The reasons are manifold.
Building a crude pipeline to the refiners in the Philadelphia area, for example, is a challenge due
to terrain, legal permits and distance from crude production.
Instead, many refineries, in particular along the East Coast and Pacific Coast, have
favored leasing rail cars for moving shale oil to refineries. In 2013 nearly twice as many carloads
of crude oil were transported by rail than in 2012 and more than 40 times as many as in 2008
(see Esser 2014). Although only 10% of U.S. crude oil production moves by rail, the shipping of
shale oil relies heavily on rail (and to a much lesser extent on trucks). As Esser (2014) points
out, nearly 70% of crude oil produced in North Dakota, for example, is moved by rail. One
reason is the greater flexibility of rail transport. Although transporting oil by rail is more costly
than by pipeline, it is easier to obtain regulatory approval and to adjust the volume of shipping up
18
or down, as needed. Another reason is likely to be the uncertainty about the future prospects of
shale oil. Pipeline construction requires a commitment from producers and financiers for many
years. A particular concern in building new pipelines to connect shale oil plays to existing crude
oil pipelines in the center of the country has been that production in shale oil plays declines at a
faster rate than in conventional oil fields and may cease before the capital costs of a new pipeline
will have been recouped. The use of rail transport is not without drawbacks, however. For
example, the ability to use rail cars is limited by the current rail infrastructure, including the
condition of the tracks and the rolling stock as well as the availability of sidings to speed up
traffic. It is also limited by the lack of competition on some routes.
There also has been a surge in the use of barges for shipping oil both on rivers and in
coastal waters. With rail and barge shipping expanding over time, more and more light sweet
crude oil that was landlocked in the center of the country has been reaching refiners along the
Gulf Coast and even along the East Coast by a combination or rail and barge transport,
alleviating some of the glut in the Midwest and in Texas, which – in conjunction with the gradual
weakening of the oil export ban in 2014 – helps explain the tightening of the spread between
WTI and LLS prices on the one hand and the Brent price on the other in 2014 and 2015 (see
Figure 7).
An alternative and complementary strategy has been to build new refineries (or expand
existing refineries) where the oil is produced or stored. Although the opening of new pipelines
helped relieve the local glut of oil in Cushing by 2014, a more accurate description of events
would be to say that it helped spread the glut to include the Gulf Coast region. Texas oil refiners
absorbed some of the excess light sweet crude, but their ability to process large quantities of light
sweet crude oil has been limited. One reaction to the glut of shale oil has been to build new
19
refineries in close proximity to shale oil plays, right where the shale oil is being produced. These
refineries supply high-end products such as diesel (which is used both by locomotives, trucks
and drilling rigs) to the local economy with the residual being sold as feedstock to other
refineries. In addition to old plants having been reopened, there are three new refineries under
construction in Texas, North Dakota and Utah. These refineries, however, are small in size. They
process under 50,000 barrels/day, and their product is transported mainly by truck and rail to the
end-user or, alternatively, to the closest refiner or to connecting point with oil pipelines or with
barges on rivers and coastal waterways (see Fowler 2014).
One difficulty in scaling up these operations has been the lack of a suitable pipeline
infrastructure; another has been the fact that environmental regulations become more stringent,
the larger the refinery. Moreover, concerns that the export ban on oil may be lifted or that shale
oil production in a given location may diminish for one reason or another, has prevented larger-
scale investments in the refining infrastructure from taking place. The lack of infrastructure has
been less a concern for shale oil plays such as Eagle Ford in Texas, for example, than for the
Bakken or other more remote shale oil plays.
In the end, these developments are no substitute for additional refining capacity closer to
the population centers where the refined product is needed. Building this infrastructure will not
only require investments in refineries capable of processing lighter crude oils, but also additional
investment in the transport infrastructure for crude oil and refined products. The only alternative
to expanding refining capacity for lighter crudes would be a lifting of the oil export ban, but even
that strategy would require additional investments in transportation infrastructure.
4. Implications of the Brent-WTI Spread for the Price of Gasoline
For the time being, U.S. crude oil is likely to trade at a discount relative to global oil prices, as
20
measured, for example, by the Brent price of crude oil. At first sight, lower U.S. oil prices might
seem welcome from the point of view of consumers of gasoline. The decline in WTI and LLS
prices below the global oil price level, however, does not mean that U.S. gasoline prices will fall.
A recent study by Borenstein and Kellogg (2014) explains that to the extent that the marginal
gallon of gasoline in the Midwest is still imported from the East Coast, gasoline produced in the
Midwest from low-cost domestic crude oil will cost the same as gasoline produced from high-
cost imported crude oil. This argument can be taken a step further. Although there is an export
ban on crude oil, this ban does not extend to refined products. In fact, there has been a surge in
exports of diesel fuel and gasoline from the United States. The pipeline network for refined
products is distinct from that for crude oil and refineries have not had any difficulty in exporting
their products. This point is important because, to the extent that the fuel produced in the
Midwest may be exported, refiners will charge the same fuel price that they can sell at in world
markets, adjusted for transportation costs. Thus, all rents from lower crude prices in the Midwest
accrue to refiners, and the U.S. consumer does not get a reprieve at the gas pump. The key
difference is that gasoline and diesel markets have remained integrated with the global economy,
even as the global market for crude oil has fragmented. This observation has far-reaching
implications for the U.S. economy.
5. Was Shale Oil Responsible for the Decline in the Price of Oil Since June 2014?
Although the most visible effect of the shale oil revolution until June 2014 was the widening
spread between the Brent and the WTI price of crude oil, there can be little doubt that the
expansion of shale oil production also put downward pressure on the global price of oil by
reducing U.S. oil imports and by reducing foreign demand for oil in response to rising U.S.
exports of refined products. Indeed, the sharp decline in the Brent price of crude oil after June
21
2014 (and the resulting decline in U.S. gasoline prices) has been attributed in part to the shale oil
revolution.
Baumeister and Kilian (2015) provide a detailed quantitative analysis of this episode and
show that of the cumulative decline in the Brent price by $49 between June and December 2014
possibly as much as $16 may be explained based on the cumulative effects of positive surprises
about the supply side of the oil market, including the effects of shifts in expectations about future
oil production as well as actual oil supply shocks. Of course, these supply shifts are global and
reflect the actions of many crude oil producers including Russia which greatly increased its oil
production leading up to June 2014 much like the United States. There also is evidence of a shift
in oil price expectations in July 2014, which may have reflected developments on the supply side
as well as the demand side of the oil market, and accounts for another $9 decline in the Brent
price. The remaining $24 of the cumulative decline is unambiguously explained by a weakening
of the global economy resulting in lower demand for crude oil.
It is difficult therefore to pin down the precise effect of the shale oil revolution on the
Brent price. The best we can say is that the cumulative effect of expected and unexpected shale
oil production increases on the Brent price in the second half of 2014 must lie somewhere
between $0 and $25. Given related empirical evidence that the effects of oil supply shocks on the
price of oil tend to be only modest, the actual cumulative effect of the shale oil revolution is
likely to be closer to the lower end than to the upper end of this range (see Kilian 2014). The
U.S. share in global oil production increased from 7% in 2008 to 11% in 2014 (see Figure 1). We
know that the outbreak of the Iran-Iraq War in 1980, which was followed by an oil supply
disruption of roughly the same magnitude as the supply increase associated with shale oil, when
expressed as a share of world oil production, was followed by an increase in the U.S. price of
22
imported crude oil of less than $4. Thus, the effects of U.S. oil production increases on the global
price of oil are likely to have been modest.
There are alternative views, of course, that assign a greater importance to shale oil. One
popular argument attributes the recent decline in all oil price benchmarks to Saudi Arabia’s
reaction to the global glut of crude oil caused by higher U.S. shale oil production. Proponents of
this view point to the fact that Saudi Arabia in 2014 refused to reduce its level of oil production
in response to higher U.S. oil production, allowing the Brent price of oil to fall. According to this
view, the current U.S. share in global oil production is less relevant than Saudi Arabia’s desire to
limit the future development of U.S. shale oil. Whether this charge is true, is by no means self-
evident. Not only is there no direct evidence in support of this view, but there are several reasons
to be skeptical. First, the price of oil that would have been required to accomplish the task of
reigning in future shale oil production would have had to be so low, as to put a severe strain on
the Saudis’ financial reserves. It would be surprising if the Saudis had not understood this point.
A more plausible interpretation is that the Saudis simply were waiting to see at what price the oil
market would stabilize. Second, Baumeister and Kilian (2014) showed that recent Saudi oil
production decisions were not systematically different from earlier episodes of oil price declines,
so there should not have been any surprise about the Saudis’ decision not to lower oil production.
Third, the Saudis arguably did not have a choice. Their failure to prevent the price of oil from
falling in the early 1980s under similar circumstances suggests that they would not have had the
power to prevent a decline in the price of oil, even if they had wanted to. If they did not have this
power, then lowering oil production would simply have lowered Saudi oil revenues even further
at a time when Saudi Arabia was already financially constrained due to falling oil prices. In fact,
Saudi production choices in 2014 have been broadly consistent with economic theory. As
23
Anderson, Kellogg and Salant (2014) emphasize, one would not expect oil producers to adjust
their production from existing wells in response to falling oil prices, but rather to reduce their
investments in future oil production. In short, we do not need to appeal to strategic motives to
understand the evidence.
Regardless of the determinants of the 2014/15 oil price decline, an obvious concern is
how future shale oil production will be affected by much lower oil prices. It has become evident
that large productivity gains in 2014 and early 2015 have lowered the operating costs of most
U.S. shale oil producers sufficiently to weather oil prices as low as $48 – at least temporarily.
This view is consistent not only with anecdotal evidence, but with the evolution of actual shale
oil production, which continued to grow even in early 2015. Although there has been a sharp fall
in the U.S. oil rig count since September 2014 and many support companies have reduced their
workforce, consistent with a reduction in investment in the industry, following the recovery of
the Brent price to near $60 in May 2015, there can be no doubt that the U.S. shale oil industry
has survived the 2014/15 decline in the price of oil largely intact.
6. Implications for the Transmission of Oil Price Shocks
Unexpected global oil price increases matter for U.S. real GDP mainly because domestic wealth
is being transferred abroad, when the price of imported crude oil (and hence the price of
domestic fuel) increases (see Kilian 2014). In other words, higher fuel costs act as a tax on the
U.S. economy. Some of that tax may be rebated, as foreign oil producers import goods from the
United States, but there remains a loss of welfare. Given that net imports of crude oil have
declined with increased shale oil production, this tax and its recessionary effect would be
expected to diminish. Moreover, increased U.S. exports of refined products have further
improved the terms of trade compared with the past. There still will be a redistribution of wealth

24
within the U.S. economy, of course, but these distributional effects are far less clear-cut than the
effects of a reduction in domestic aggregate demand associated with higher costs of oil imports.
Thus, the shale oil revolution is good news from the point of view of policymakers concerned
with positive global oil price shocks.
Figure 9 illustrates the degree to which the U.S. economy has become less vulnerable to
such shocks. The figure shows the evolution of U.S. net petroleum imports (defined to include
both crude oil and refined products) since 1973. Not too long ago, net petroleum imports were
rising steadily. After 2005, however, a dramatic decline set in. This decline reflects in part
reduced U.S. consumption of oil products in response to higher prices. It also reflects in part the
recessionary effects of the U.S. and global financial crisis in 2007-09, just as the Volcker
Recession of the early 1980s reduced net petroleum imports. The main driving force, however,
appears to be the increase in U.S. shale oil production, which has alleviated the need for imports
of light sweet crude oil in recent years, and the surge in exports of refined products such as
gasoline and diesel to Latin America and Europe that serves as a substitute for U.S. crude oil
exports, especially after 2010. Unlike recessions and unlike attitudes toward driving, the latter
phenomenon is likely to continue. There can be no doubt that the trajectory for net petroleum
imports has changed in ways that were inconceivable just a few years ago.
Figure 9 also highlights that the U.S. oil and refining industry has effectively managed to
bypass the ban on exports of crude oil by instead exporting refined products. Rather than
shipping crude oil to Asia or to Europe, the United States is refining the excess oil locally, taking
advantage of access to low-cost crude oil and selling the refined product at a competitive price
abroad. The primary export destination for distillate, diesel, and gasoline products is Western
Europe, with Latin America and the Asia-Pacific region a likely growth market. One would
25
expect this trend to gather momentum, as domestic rail and barge transportation capacities for
crude oil as well as international tanker capacity for refined products increase in the coming
years.
The increased reliance on petroleum exports is not without a downside, however, because
the U.S. economy now has become more exposed to unexpected declines in the price of crude
oil. Whatever the stimulating effect of shale oil production on the economy is, this effect is at
risk of being reversed if the price of crude oil drops enough to make shale oil production
unprofitable. This point is important because it suggests that energy independence is an illusory
concept in an integrated global economy, no matter how much oil the U.S. economy produces.
7. Implications for the U.S. Economy
In discussing the implications of the shale oil revolution for the U.S. economy it is useful to
distinguish the effects arising from the widening spread between the global price of oil and the
domestic price of oil, as discussed in sections 3 and 4, from the effects of the shale oil revolution
on the global price of oil, as discussed in section 5, beginning with the former question.
One of the hopes has been that shale oil would revive the manufacturing sector in the
United States. Much of this manufacturing sector has moved to emerging economies in recent
decades to take advantage of lower labor costs abroad. The hope of an industrial revival is based
on the premise that manufacturing relies on energy and that shale oil provides a source of
inexpensive energy that will give the United States a competitive edge compared with emerging
economies. Proponents of this view are hoping for a return of blue collar jobs to the United
States, as firms reevaluate the costs and benefits of outsourcing. The flaw in this argument is that
it is based on the premise of lower fuel costs in the United States than abroad, but, as has been
shown already, there is no reason for the U.S. prices of gasoline or diesel to mirror the decline in
26
the price of domestic crude oil relative to international benchmarks. Thus, there is little reason
for the shale oil revolution to stimulate oil-intensive industrial activities in the United States on a
large scale.
This conclusion stands in marked contrast to the natural gas sector. Although the shale
oil revolution at first sight is closely related to the shale gas revolution, there is one important
difference. Unlike in the gasoline and diesel market, there has been a noticeable decline in the
U.S. wellhead price of natural gas since 2008 compared with natural gas prices abroad
(notwithstanding a partial reversal in recent years). Access to inexpensive natural gas benefits in
particular the petrochemical industry. One reason for low U.S. natural gas prices is that the
natural gas market has never been a global market. Natural gas is transported by pipeline.
Although natural gas may be cooled down and liquefied, allowing it to be shipped as liquefied
natural gas (LNG) to any port in the world, the cost of LNG shipping is high and the
infrastructure required to load and unload LNG is expensive. This fact has prevented the
integration of regional natural gas markets and the emergence of a global price so far.14 As a
result, the price of U.S. natural gas for the time being has been determined by domestic demand
rather that global demand, allowing for a greater price response to increased domestic supply.
Thus, the main beneficiary of the U.S. shale oil revolution has been not gasoline
consumers or oil producers, but the U.S. refining industry, which enjoys a competitive advantage
compared to diesel and gasoline producers abroad because of its access to low-cost crude oil. In
fact, refiners have every incentive to preserve the status quo and to prevent a lifting of the U.S.
ban on exports of domestically produced crude oil. There is an obvious conflict between the
14 This situation may change as early as 2015 with the construction of new loading terminals in the United States that will allow U.S. shale gas to be exported. There is no ban on natural gas exports, so the ability to export U.S. natural gas in the long run will only be limited by the availability of unloading facilities for LNG tankers abroad and by how competitively this natural gas can be priced.
27
interests of U.S. refiners and of U.S. crude oil producers. An additional beneficiary of the shale
oil revolution has been the transportation sector, notably the railroad industry, and the industries
directly serving the oil sector.
Although these effects are concentrated in very few sectors of the economy, this does not
mean that there are no macroeconomic effects from additional shale oil production. Clearly, the
oil producing sector directly contributes to the value added of the U.S. economy.15 It is important
to keep in mind, however, the comparatively small magnitude of this contribution to U.S. real
GDP. There is no data on real value added in shale oil extraction, but even the contribution to
real GDP of all mining activities in the U.S. economy (which includes in addition conventional
oil, conventional and unconventional natural gas, coal, metals and minerals) is negligible with a
share of 2.7%. Moreover, there has been no noticeable increase in this contribution since shale
oil production took off, so one would not expect large aggregate effects of shale oil production
on the U.S. economy, even taking account of potential multiplier effects on other sectors.16
This is not to deny that there are important effects on the economy at the local and state
level in areas where shale oil plays are located (see, e.g., Hunt and Keniston 2014). Of particular
interest has been the effect of increased shale oil production on employment. These local
employment gains sometimes are not as large as public debate would suggest. In one example,
industry and government estimates of new jobs created by shale drilling differed by a factor of
12. A detailed review of common errors in measuring the employment effects of shale drilling
can be found in Mauro et al. (2013). Apart from the effect on employment, states containing
15 An industry’s value added is equal to its gross output (which consists of sales or receipts and other operating income, commodity taxes, and inventory change) minus its intermediate inputs (which consist of energy, raw materials, semi-finished goods, and services that are purchased from domestic industries or from foreign sources). 16 A number of macroeconomic studies including International Monetary Fund (2013) and Manescu and Nuño (2015) have examined the quantitative effects of the shale oil revolution on economic growth in the United States and elsewhere. These studies rely on stylized general equilibrium models of the global economy that make no allowance for differences in the quality of crude oil from different sources or for the transportation and refining bottlenecks highlighted in this article. Hence, their results are at best illustrative.
28
shale oil plays also benefit from substantial increases in tax revenues.
There also are more subtle spillovers. One way for someone living outside of Texas,
Oklahoma, New Mexico, Colorado, North Dakota or Montana to profit from shale oil would be
to own stocks of the refining companies that are able to buy crude oil at discounted prices, yet
sell gasoline at undiscounted prices. Another way would be through private ownership of mineral
rights. Fitzgerald and Rucker (2014) estimate gross royalties to private owners from oil and
natural gas production combined at $22 billion per year, as of 2012. These royalties are paid to
U.S. citizens residing in every state of the Union. It has been suggested that perhaps 3% of the
population are recipients of such royalties, although the distribution is unclear.
Notwithstanding these qualifications, it is clear that the aggregate effects of a drop in the
WTI price relative to the Brent price are negligible. What then about the decline in the Brent
price due to the shale oil revolution? One might expect this decline to stimulate consumer’
discretionary spending to the point of causing a strong expansion of U.S. economic activity. A
quick back-of-the-envelope calculation suggests that this outcome is implausible. Crude oil
accounts for about half the cost of gasoline (see Hamilton 2009). If we attribute a cumulative
drop in the Brent price by $10 to the shale oil revolution – which is equivalent to a cumulative
decline in the Brent price by 9% – we would expect a reduction in the U.S. gasoline price of
4.5%. Given a 3.5% share of fuel expenditures, this 4.5% reduction yields a 0.116% increase in
discretionary spending by U.S. consumers, which, in turn, has to be weighted by the share of
consumption on GDP, yielding a one-time increase in U.S. real GDP of only about 0.1%. Thus, it
is fair to say, that U.S. shale oil will not be a game changer for the U.S. economy. 17
17 To the extent that the decline in the Brent price also represents a change in the relative price of oil it may in addition trigger a costly reallocation of capital and labor resources in the U.S. economy and frictional unemployment, as emphasized by Hamilton (1988). There is an ongoing debate about the quantitative importance of this explanation (see, e.g., Kilian and Vigfusson 2011). From the point of view of the shale oil debate, the
29
8. What Are the Prospects for Shale Oil Production outside the United States?
As reported by the U.S. Energy Information Administration in 2014, there are many countries
with substantial technically recoverable shale oil resources. The United States in fact ranks only
second in the world after Russia, but ahead of China, Argentina, Libya and Australia. No other
European country is included in the top 10 (see EIA 2014b). At the same time, as of 2014,
commercial shale oil production takes place in only two countries other than the United States:
Argentina with a volume of 0.02 mbd and Canada with a volume of 0.4 mbd, which is puny
compared with the close to 4 mbd of commercial production in the United States (see EIA
2015b). There are many reasons why shale oil production has been primarily a U.S.
phenomenon so far. One reason is that shale oil production is politically easier to defend in
regions of low population density such as North Dakota or parts of Texas than in central Europe,
given the risk of increased seismic activity and the risk of contaminating ground water due to
improper handling. Other key differences are the availability of drilling rigs and support services
in the United States, the fact that mineral rights may be easily acquired, and the fact that U.S.
firms have easy access to credit markets to finance capital-intensive shale oil projects.
Shale oil production in China, in contrast, is hampered by geological and topological
challenges, by China’s comparative lack of experience in producing shale oil, and even by water
shortages. The recent failure of U.S. oil companies to exploit the Monterrey shale oil deposits
provides a useful reminder that there can be a long road from geological evidence for shale oil to
the commercial viability of shale oil production. Although one would expect China to be able to
overcome these technological and practical challenges, it may take many years for shale oil
existence of this channel would further reduce any stimulating effects of lower global oil prices caused by increased shale oil production.
30
production in China to become commercially viable. Similarly, Russia faces technological
challenges in developing its shale oil resources. The sanctions imposed after the invasion of the
Ukraine have all but eliminated Russia’s access to foreign expertise and to global capital
markets, making it unlikely that these resources will be developed anytime soon. In short, there
is good reason not to expect the shale oil revolution to catch on in other countries for the time
being.
9. Concluding Remarks
U.S. shale production was made possible by the 2003-08 surge in the global price of oil. Recent
efficiency gains in shale oil production mean that U.S. shale oil producers remain competitive
even at the current much lower price of oil. Although the increase in U.S. shale oil production
since 2003 has been impressive, there remains much uncertainty about the persistence and scope
of the shale oil boom. Even under optimistic scenarios, shale oil is likely to be more of a
temporary reprieve for another decade than a permanent solution. Moreover, visions of the
United States becoming independent of oil imports, of a rebirth of U.S. manufacturing, and of
net oil exports improving the U.S. current account seem far-fetched, when compared to the
reality of the U.S. oil market today.
Although the U.S. petroleum trade balance has improved substantially since 2010, owing
to a reduction of crude oil imports and to increased exports of refined products, to date even the
U.S. petroleum balance remains in deficit, not to mention the overall trade balance. It is also
important to keep in mind that the United States becoming less dependent on oil imports from
the Middle East, while having obvious political implications, does not mean that the U.S.
economy has become independent of global oil price fluctuations. More generally, there is no
reason to expect shale oil to be a game changer for the U.S. economy. Although there has been a

31
widely noted decline in U.S. domestic oil prices relative to international benchmarks such as
Brent, this price decline is not being passed on to the consumer, ruling out a rebirth of U.S.
manufacturing and a reversal of outsourcing policies on the basis of low-cost gasoline and diesel
fuel. The discrepancy between domestic and global oil prices has resulted from a breakdown of
arbitrage reflecting the long-standing U.S. ban on exporting crude oil and an inadequate
transportation infrastructure that prevented the oil from being shipped to refineries able to
process it.
The mismatch between the supplies of crude oil and the available refining and
transportation capacity arose because the shale oil boom caught the refining industry by surprise.
The U.S. shale oil boom was preceded by a growing shortage of light sweet crude oil in world
markets. U.S. refiners responded to this trend by expanding their capacity to handle heavy crudes
that remained in abundant supply, becoming the world leader in this field. They were therefore
taken by surprise, when the U.S. market after 2010 was inundated with light sweet crude
recovered from shale oil plays. Not only was much of the refining structure ill-equipped to
process this oil, but parts of the pipeline infrastructure developed over the preceding forty years
became obsolete. As a result the U.S. oil market fragmented into regional markets, and became
distinct from the global market for crude oil.
There are signs that the U.S. refining industry is gradually responding to the price
differentials between domestic and imported crude oil. Reconfiguring the U.S. refining and
transportation infrastructure, however, is a costly and slow process. Moreover, long-term
investments in infrastructure are likely to be held back by uncertainty about the future of U.S.
shale oil production, especially in light of recent declines in the price of crude oil. For the time
being, therefore, the evolution of the U.S. price of oil is inextricably tied to the development of
32
the U.S. refining, pipeline, barge, and rail infrastructure. Modelling these connections will
become increasingly important for understanding and forecasting the evolution of the domestic
price of oil in the United States. It seems less important for analyzing U.S. retail fuel prices,
however, which remain firmly integrated with the world economy and are effectively priced
relative to international benchmarks.
Some observers have suggested that shale oil may have become a victim of its own
success, attributing the overall decline in the global price of oil since June 2014 to increases in
shale oil production. Lower crude oil imports and higher exports of refined products from the
United States to Latin America and Europe have helped circumvent the ban on U.S. crude oil
exports to some extent. To the extent that shale oil production has substituted for U.S. and
foreign crude oil imports, it has undoubtedly contributed to the 2014/15 decline in the Brent
price. The magnitude of this effect on the Brent price is difficult to pin down in the data, but
plausible estimates are likely to be closer to $5 than to $10 with the remainder accounted for by
reductions in the global demand for oil as well oil supply shifts in other countries. As the Brent
price fell, so did the price of WTI (and hence the price of gasoline). This decline, however,
benefitted all consumers of oil in the world rather than benefitting the U.S. economy in
particular. It therefore will not be associated with a return of U.S. manufacturing jobs from
abroad. At the same time, its aggregate effect on the U.S. economy was quite modest. Postulating
a $10 cumulative decline in the Brent price caused by expected and unexpected U.S. shale oil
production, one would expect a one-time increase in U.S. real GDP of only about 0.1%.
By far the most visible effect of shale oil production for the longest time has been the
decline in the WTI price relative to Brent. The persistent divergence between these oil prices
increasingly calls into question the use of the WTI price as a benchmark in pricing crude oil. The
33
price of LLS, which during 2011-13 was considered a plausible alternative benchmark, since
2014 has closely tracked the WTI price, indicating that the U.S. market for light sweet crude oil
is no longer fully integrated with the world market.
It may seem that Brent crude oil prices would be an obvious alternative benchmark,
except for the fact that Brent suffers from its own drawbacks. One requirement of a global
benchmark is sufficient liquidity. As Brent oil production has been declining over time, the
definition of the Brent benchmark already had to be broadened repeatedly, including
successively lower grades of crude oil within the benchmark. It is unclear whether there remains
enough oil in the North Sea to sustain a Brent benchmark in the long run. An interesting
question is how global financial markets will deal with this situation. One possible solution
would be a return to regional markets, ending a history of forty years of global market
integration. Such a development would indeed be striking given the prevailing trend toward
globalization in recent decades. Another potential solution would be for the U.S. to remove its
export ban on crude oil, which in the long run would be expected to reestablish arbitrage
between alternative prices for light sweet crude oil. A third option would be a merger of the
Dubai and Brent benchmarks.
References
Allcott, H., and D. Keniston (2014), “Dutch Disease or Agglomeration? The Local Economic
Effects of Natural Resource Booms in Modern America,” NBER Working Paper No.
20508.
Alquist, R., and J-.D. Guénette (2014), “A Blessing in Disguise: The Implications of High
Global Oil Prices for the North American Market,” Energy Policy, 64, 49-57.
Anderson, Anderson, S.T., Kellogg, R., and S.W. Salant (2014), “Hotelling under Pressure,”
34
NBER Working Paper No. 20280.
Baker Hughes (2013), “Overcoming Shale Oil Processing Challenges,” White Paper.
Baumeister, C., and L. Kilian (2015), ““Understanding the Decline in the Price of Oil since
June 2014,” manuscript, University of Michigan.
Benoit, B., and J. Zurlo (2014), ”Overcoming the Challenges of Tight/Shale Oil Refining,” GE
Water & Process Technologies.
Borenstein, S., and R. Kellogg (2014), “The Incidence of an Oil Glut: Who Benefits from
Cheap Crude Oil in the Midwest?” Energy Journal, 35, 15-33.
Covert, T.R. (2014), “Experiential and Social Learning in Firms: The Case of Hydraulic
Fracturing in the Bakken Shale,” manuscript, University of Chicago.
Crooks, E., and A. Raval (2014), “U.S. Poised to Become World’s Leading Liquid Petroleum
Producer,” Financial Times, September 29.
Esser, C. (2014), “Rail vs. Pipelines: How to Move Oil,” IEA Energy, 6, 11.
Fitzgerald, T. and R.R. Rucker (2014), “U.S. Private Oil and Natural Gas Royalties: Estimates
and Policy Considerations,” manuscript, Montana State University.
Fowler, T. (2014), “Oil Boom Increases Barge Operators’ Fortunes,” Wall Street Journal,
February 2.
Hackett, D., Noda, L., Grissom, S., Moore, M.C., and J. Winter (2013), “Pacific Basin Heavy
Oil Refining Capacity,” School of Public Policy Research Papers 6(8), University of
Calgary.
Hamilton, J.D. (1988), “A Neoclassical Model of Unemployment and the Business Cycle,”
Journal of Political Economy, 96, 593-617
Hamilton, J.D. (2009), “Causes and Consequences of the Oil Shock of 2007–08,” Brookings
35
Papers on Economic Activity, 1, 215-261.
International Energy Agency (2012), World Energy Outlook 2012, OECD/IEA, Paris.
International Monetary Fund (2013), “United States. Selected Issues,” IMF Country Report
No. 13/237, Western Hemisphere Department.
Kilian, L. (2014), “Oil Price Shocks: Causes and Consequences,” Annual Review of Resource
Economics, 6, 133-154.
Kilian, L., and R.J. Vigfusson (2011), “Are the Responses of the U.S. Economy Asymmetric
in Energy Price Increases and Decreases?” Quantitative Economics, 2, 419-453.
Mauro, F., Wood, M., Mattingly, M., Price, M., Herzenberg, S., and S. Ward (2013),
“Exaggerating the Employment Impacts of Shale Drilling: How and Why?” Multi-
State Shale Research Collaborative.
Manescu, C.B., and G. Nuño (2015), “Quantitative Effects of the Shale Oil Revolution,”
forthcoming: Energy Policy.
Platts (2013), Special Report: New Crudes, New Markets, Price Group/Oil Division, March.
Sieminski, A. (2014), “Implications of the U.S. Shale Revolution,” presentation at the U.S.-
Canada Energy Summit, October 17, 2014, U.S. Energy Information Administration.
U.S. Energy Information Administration (2014), “Shale Oil and Shale Gas Resources Are
Globally Abundant,” January 2, 2014.
U.S. Energy Information Administration (2015a), “U.S. Crude Oil Production to 2025:
Updated Projection of Crude Types”, May 28, 2015.
U.S. Energy Information Administration (2015b), “Shale Gas and Tight Oil Are Commercially
Produced in Just Four Countries,” February 13, 2015.
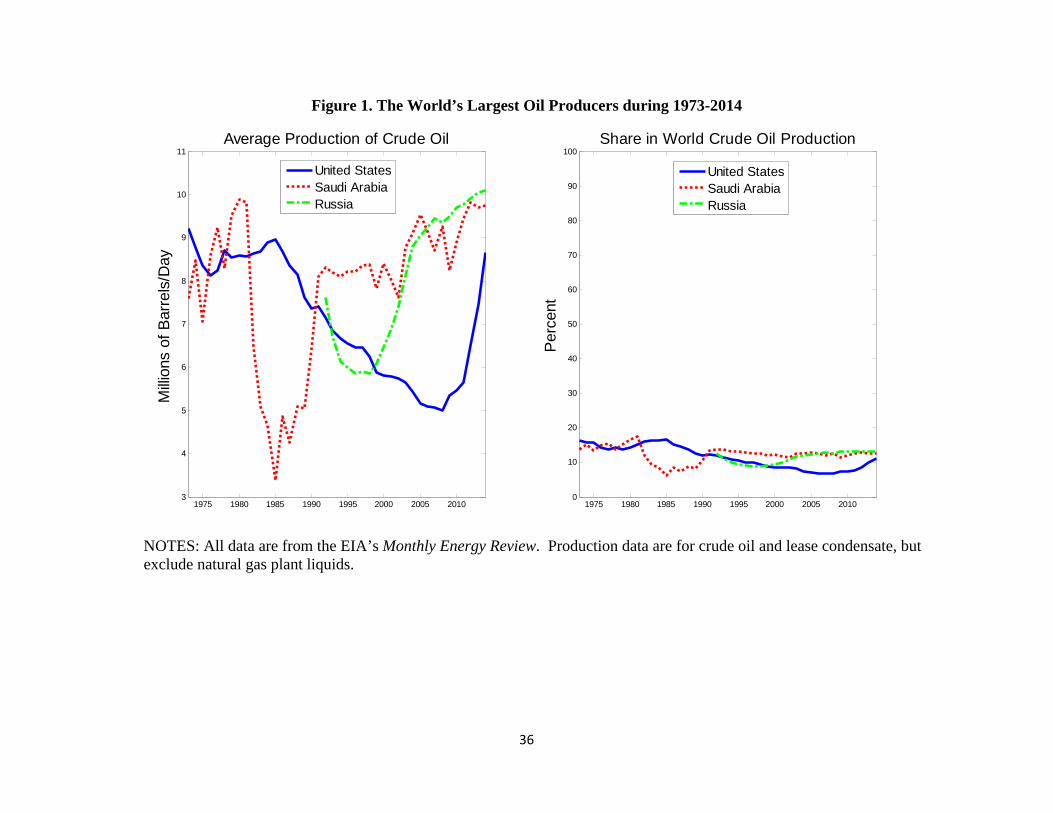
36
1975 1980 1985 1990 1995 2000 2005 20103
4
5
6
7
8
9
10
11
Milli
ons
of B
arre
ls/D
ayAverage Production of Crude Oil
United StatesSaudi ArabiaRussia
1975 1980 1985 1990 1995 2000 2005 20100
10
20
30
40
50
60
70
80
90
100
Perc
ent
Share in World Crude Oil Production
United StatesSaudi ArabiaRussia
Figure 1. The World’s Largest Oil Producers during 1973-2014
NOTES: All data are from the EIA’s Monthly Energy Review. Production data are for crude oil and lease condensate, but exclude natural gas plant liquids.
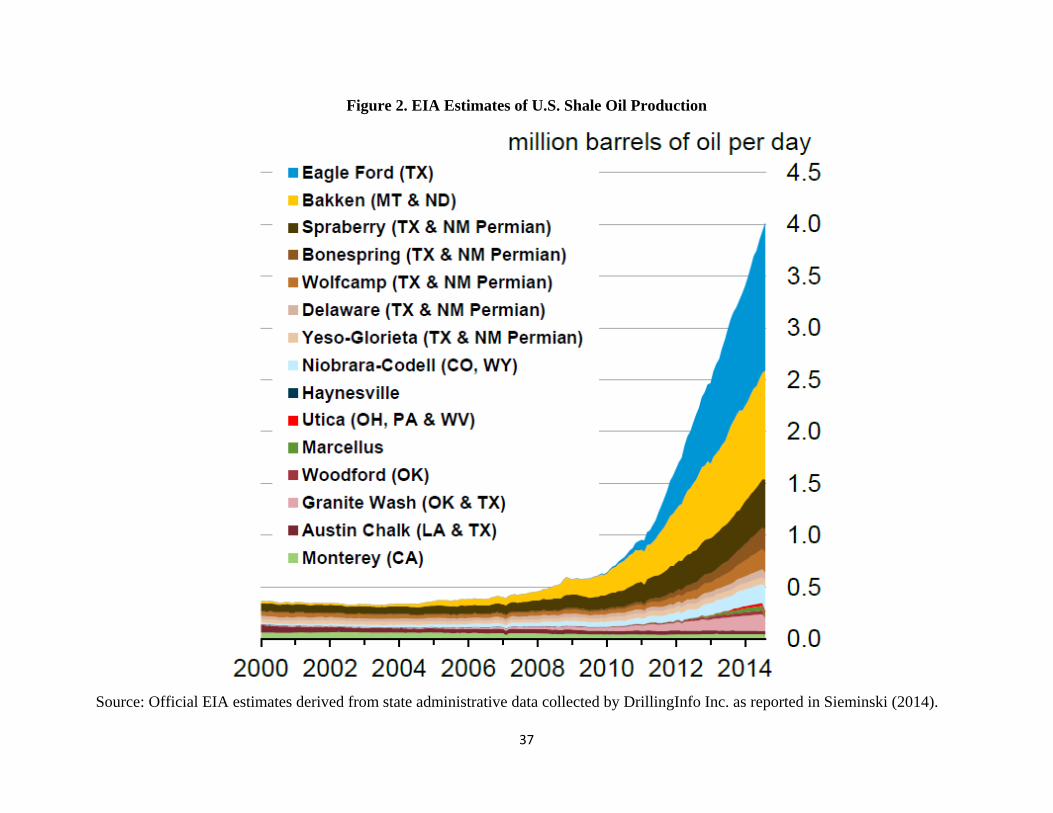
37
Figure 2. EIA Estimates of U.S. Shale Oil Production
Source: Official EIA estimates derived from state administrative data collected by DrillingInfo Inc. as reported in Sieminski (2014).
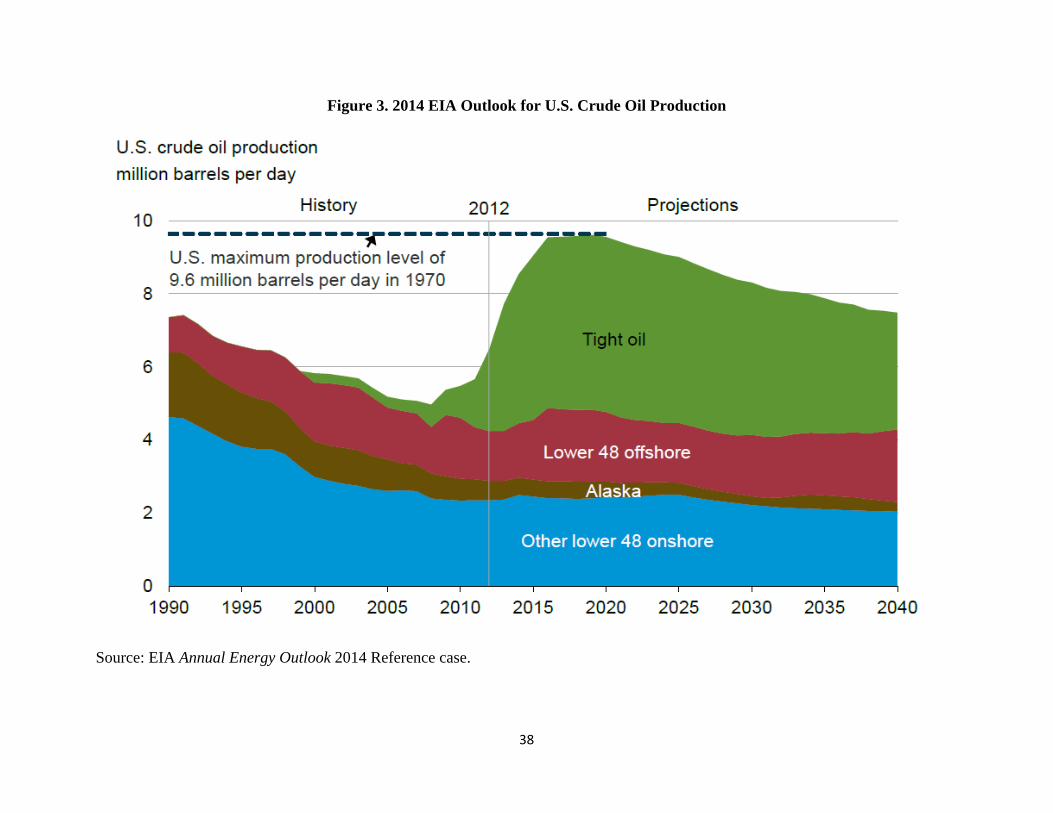
38
Figure 3. 2014 EIA Outlook for U.S. Crude Oil Production
Source: EIA Annual Energy Outlook 2014 Reference case.
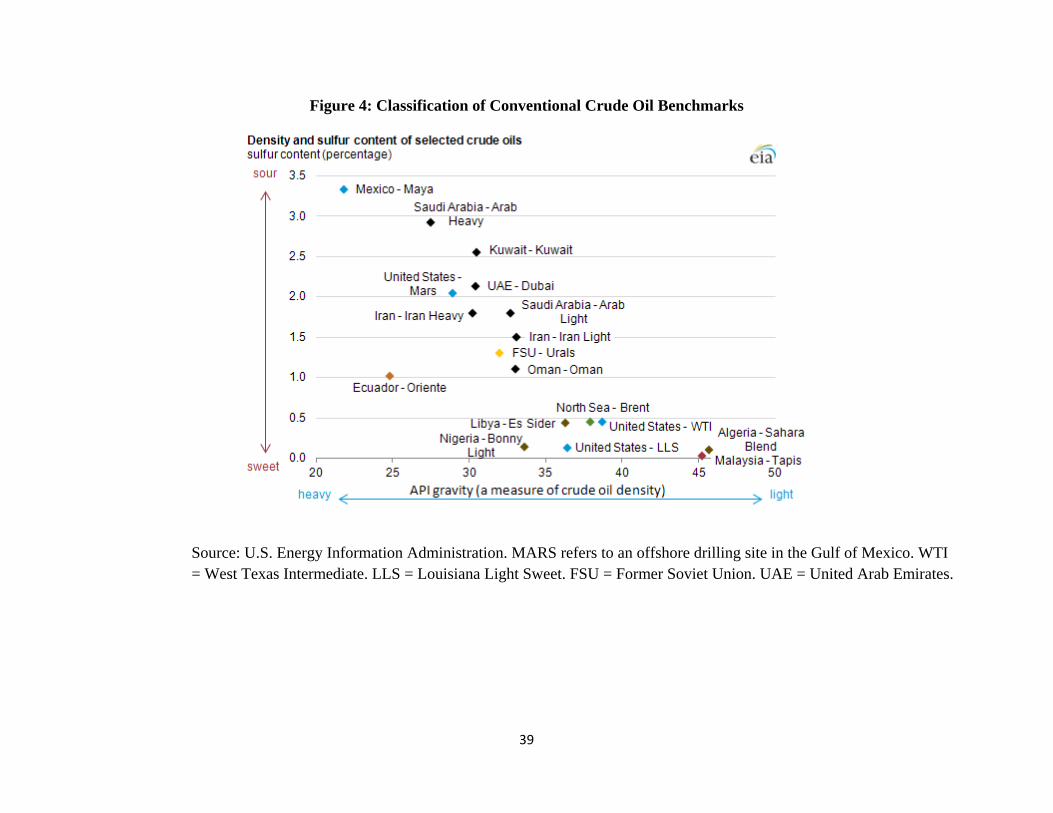
39
Figure 4: Classification of Conventional Crude Oil Benchmarks
Source: U.S. Energy Information Administration. MARS refers to an offshore drilling site in the Gulf of Mexico. WTI = West Texas Intermediate. LLS = Louisiana Light Sweet. FSU = Former Soviet Union. UAE = United Arab Emirates.
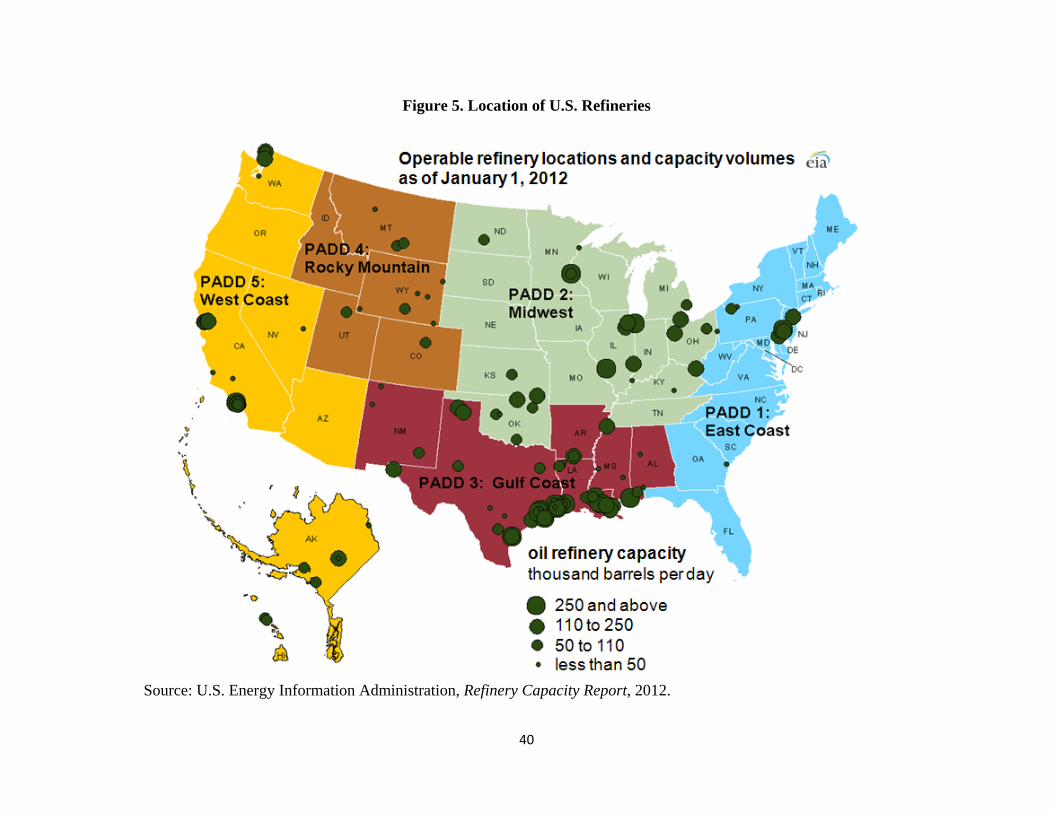
40
Figure 5. Location of U.S. Refineries
Source: U.S. Energy Information Administration, Refinery Capacity Report, 2012.
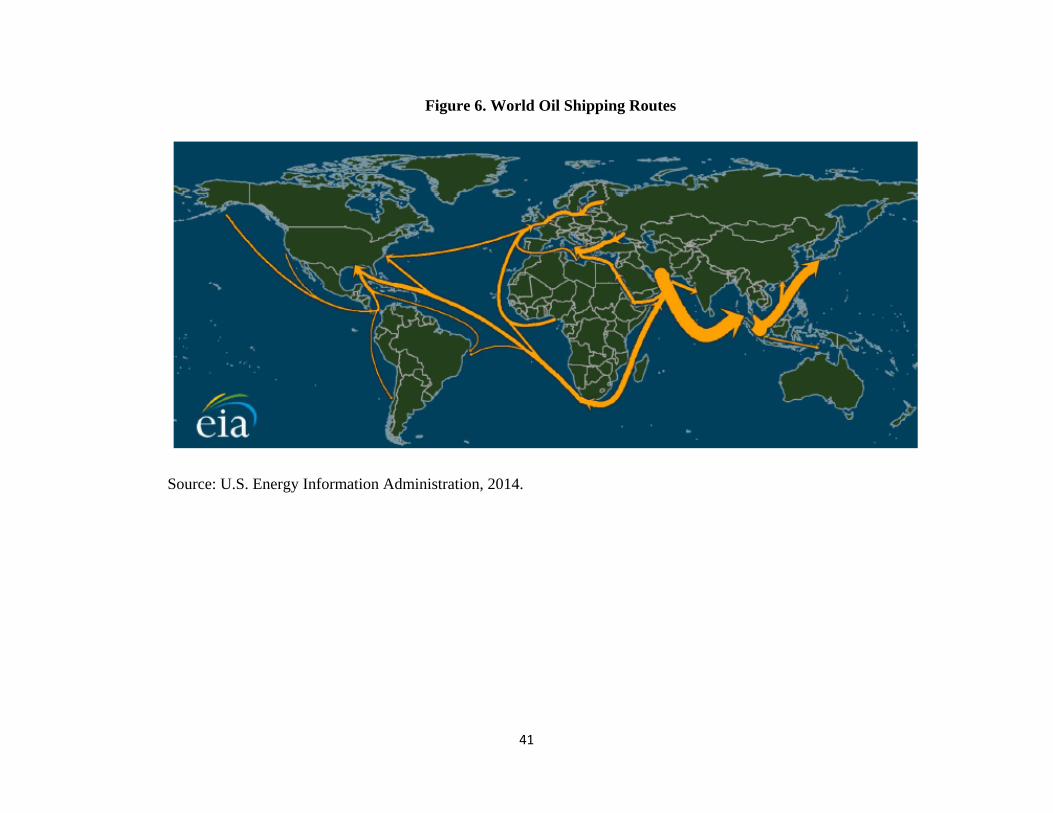
41
Figure 6. World Oil Shipping Routes
Source: U.S. Energy Information Administration, 2014.
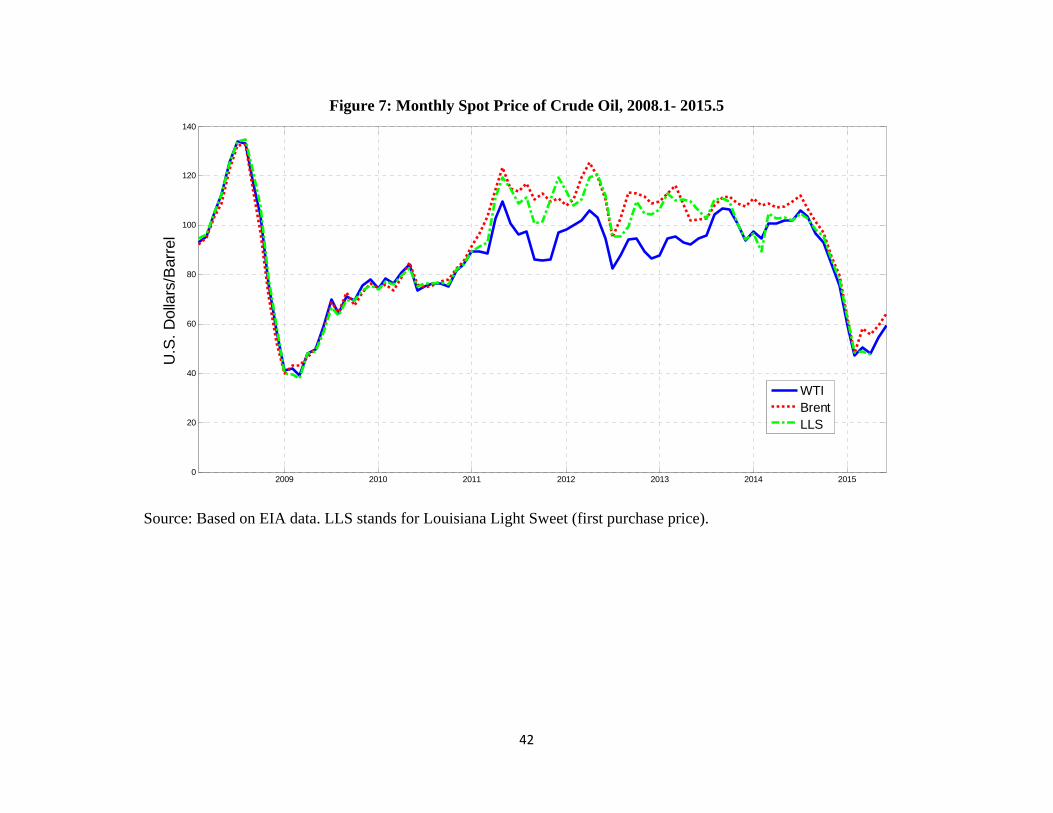
42
2009 2010 2011 2012 2013 2014 20150
20
40
60
80
100
120
140
U.S
. Dol
lars
/Bar
rel
WTIBrentLLS
Figure 7: Monthly Spot Price of Crude Oil, 2008.1- 2015.5
Source: Based on EIA data. LLS stands for Louisiana Light Sweet (first purchase price).
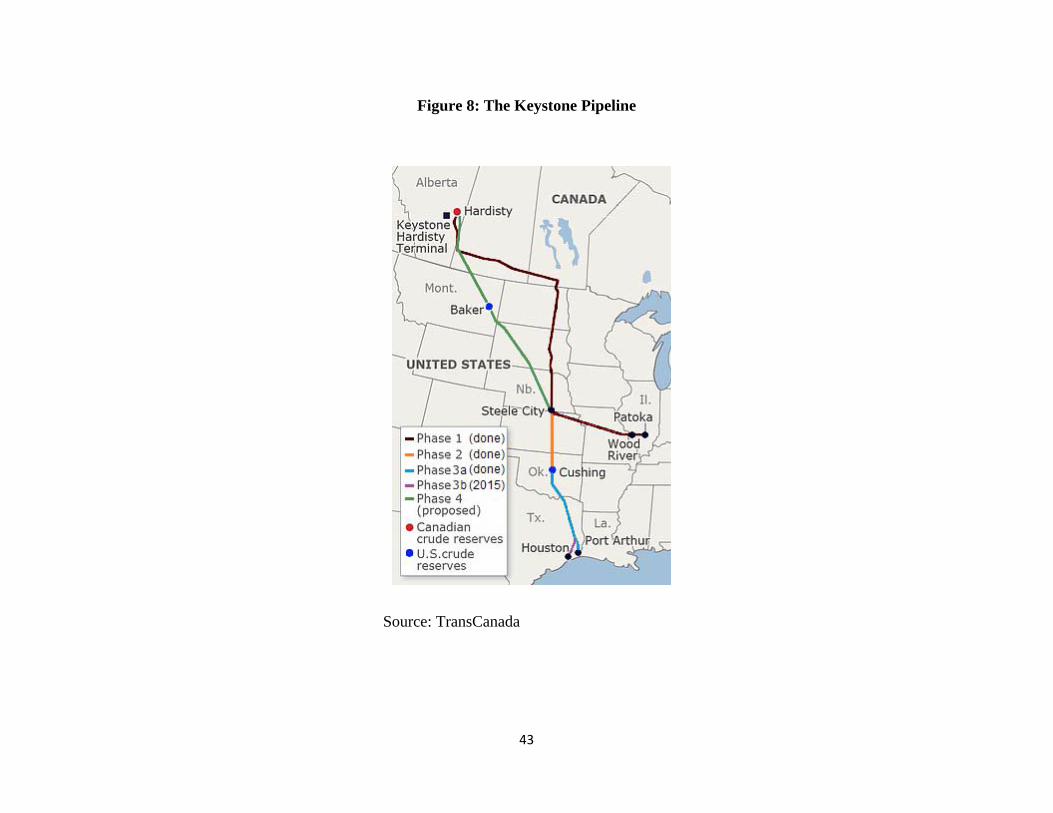
43
Figure 8: The Keystone Pipeline
Source: TransCanada
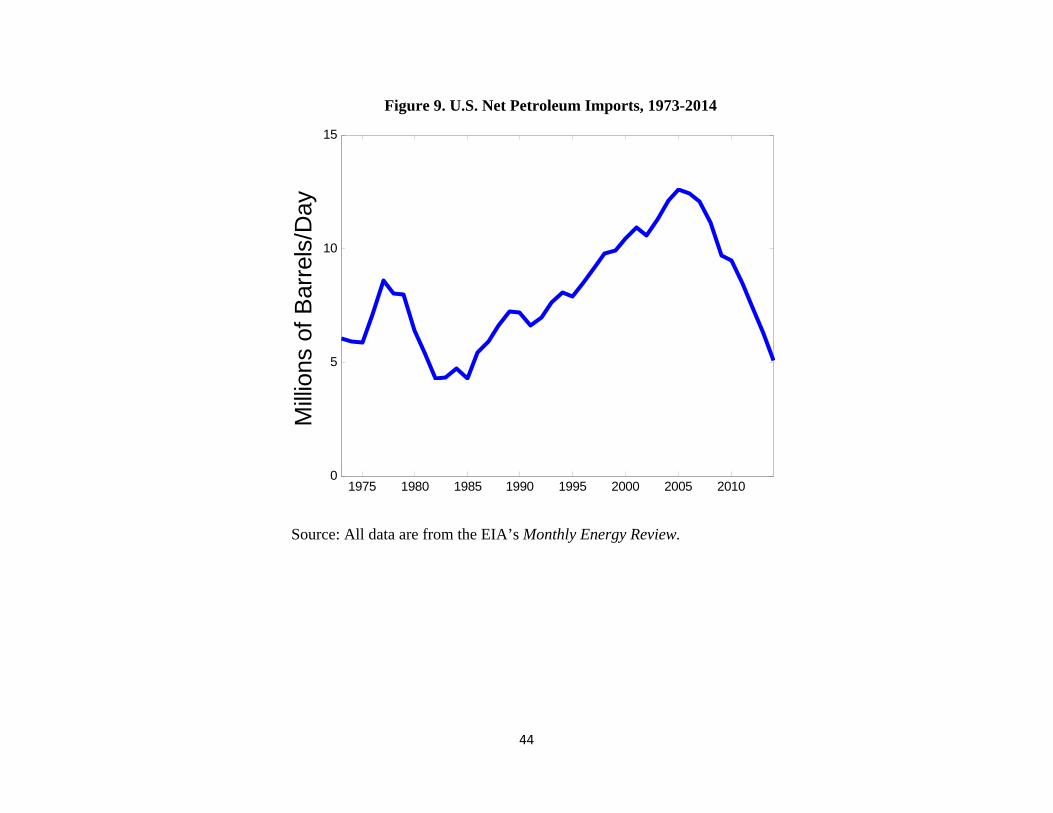
44
1975 1980 1985 1990 1995 2000 2005 20100
5
10
15
Milli
ons
of B
arre
ls/D
ay
Figure 9. U.S. Net Petroleum Imports, 1973-2014
Source: All data are from the EIA’s Monthly Energy Review.