Embed Size (px)
Citation preview
Graduate Theses, Dissertations, and Problem Reports
2020
The Impact of the Global Financial Crisis on Visitation to the The Impact of the Global Financial Crisis on Visitation to the
Monongahela National Forest: An Activity-based Segmentation Monongahela National Forest: An Activity-based Segmentation
Approach Approach
Connor Braxton Akers West Virginia University, [email protected]
Follow this and additional works at: https://researchrepository.wvu.edu/etd
Recommended Citation Recommended Citation Akers, Connor Braxton, "The Impact of the Global Financial Crisis on Visitation to the Monongahela National Forest: An Activity-based Segmentation Approach" (2020). Graduate Theses, Dissertations, and Problem Reports. 7857. https://researchrepository.wvu.edu/etd/7857
This Thesis is protected by copyright and/or related rights. It has been brought to you by the The Research Repository @ WVU with permission from the rights-holder(s). You are free to use this Thesis in any way that is permitted by the copyright and related rights legislation that applies to your use. For other uses you must obtain permission from the rights-holder(s) directly, unless additional rights are indicated by a Creative Commons license in the record and/ or on the work itself. This Thesis has been accepted for inclusion in WVU Graduate Theses, Dissertations, and Problem Reports collection by an authorized administrator of The Research Repository @ WVU. For more information, please contact [email protected].
The Impact of the Global Financial Crisis on
Visitation to the Monongahela National Forest: An
Activity-based Segmentation Approach
Connor Akers
Thesis Submitted to the Davis College of Agriculture,
Natural Resources, and Design at West Virginia
University in partial fulfillment of the requirements for
the degree of
Master of Science in Recreation, Parks and Tourism
Resources Management
Chad D. Pierskalla, Ph.D.,
Jinyang Deng, Ph.D.,
David Smaldone, Ph.D.
Division of Forestry and
Natural Resources
Recreation, Parks & Tourism
Resources
Morgantown, West
Virginia 2020
Keywords: Financial Crisis; Market Segmentation; Activity Based Segmentation;
Monongahela National Forest
Copyright 2020: Connor Akers
Abstract
The Impact of the Global Financial Crisis on Visitation to the Monongahela
National Forest: An Activity-based Segmentation Approach
Connor Akers
Research on recreational use market segments and trends are essential for determining how
tourism businesses can better meet the needs of their customers and find new target markets
especially during challenging times. The purpose of this study is to determine how recreation
participation has changed over five years on the Monongahela National Forest following the
world financial crisis in 2008. Data used for this research were collected with the National
Visitor Use Monitoring (NVUM) surveys in fiscal years 2009 and 2014. NVUM surveys are
onsite interviews conducted at the end of a visit. The surveys produce descriptive information
about visitors. NVUM uses a stratified random sampling methodology to collect data for each
use level (e.g., low, medium, high, or very high) and site type (e.g., Day Use Developed Sites,
Overnight Use Developed Sites, General Forest Areas, and Wilderness Sites). Data were
collected during a 12-month period and a total of 1,851 interviews were completed. Two step
cluster analysis of 18 activity participation variables (binary data) was conducted with 5 clusters
specified. The clusters include Relaxing in Nature Package, Backpacking and Hiking Package,
Viewing Nature Package, Picnicking Package, and Purely Fishing. Changes in demographics,
overall satisfaction, and trip spending were examined for each market segment. Market winners
and losers were identified helping tourism providers develop more efficient strategies both
locally and regionally.

iii
All rights reserved
INFORMATION TO ALL USERS The quality of this reproduction is dependent
on the quality of the copy submitted.
In the unlikely event that the author did not send a complete manuscript and there are
missing pages, these will be noted. Also, if material had to be removed, a note will
indicate the deletion.
All rights reserved. This edition of the work is protected
against unauthorized copying under Title 17, United States
Code.
UMI Number: 1504874

iv
Dedication
To my family, friends, and colleagues for their outstanding support.

v
Acknowledgement
The authors would like to thank Don English, Program Manager for the National Visitor Use
Monitoring Program, for providing the data used in this study.
vi
Table of Contents
Chapter
1. Introduction……………………………………………………………………….…………..1
Research Questions…………………………………………………………………………...5
Definition of Terms…………………………………………………………………………...5
Limitations of the Study………………………………………………………………………7
2. Literature Review……………………………………………………………………………..8
Market Segmentation…………………………………………………………………….……8
Activity-Based Segmentation…………………………………………………………………8
Trend Studies……………………………………………………………………………..….19
Satisfaction…………………………………………………………………………………..19
3. Method………………………………………………………………………………………22
Survey Instrument……………………………………………………………………...……23
Sampling……………………………………………………...……….………………….…24
Data Analysis……………………………………………………………….……………….25
4. Results…………………………………………………………………….…………………27
Segmentation Procedure………………………………………………….………………….27
Relaxing in Nature Package…………………………………………………………………27
Backpacking and Hiking Package …………………………………….…………………….28
Viewing Nature and Hunting Package………………………………………………………28
Picnicking Package……………………………………………………….…………………28
Purely Fishing…………………………………………………………….…………………28
Fiscal Year Differences in Cluster Membership………………………………………….…31
Fiscal Year differences in Demographics…………………………………………..……….31
Respondent Location by Fiscal Year and Cluster…………………………………..……….35
Fiscal Year and Cluster Membership Differences in Travel Distance………………...…….42
Fiscal Year and Cluster Membership Differences in Trip Spending…………………..……43
Fiscal Year and Cluster Membership Differences in Nights Spent Away From Home.……44
Fiscal Year and Cluster Membership Differences in Overall Satisfaction…………….……45
5. Discussion………………………………………………………………………………...…47
Research Questions…………………………………………………………………….…....47
Conclusion………………………………………………………………………………......54
Future Research………………………………………………………………………….......56
References………………………………………………………………………………...…....58
Appendix…………………………………………………………………………………...…..63
vii
List of Figures
Figure 1: Distribution of survey sites....................................................................................24
Figure 2: Distribution of home zip codes for FY 2009, Cluster 1 Visitors...........................37
Figure 3: Distribution of home zip codes for FY 2014, Cluster 1 Visitors...........................37
Figure 4: Distribution of home zip codes for FY 2009, Cluster 2 Visitors...........................38
Figure 5: Distribution of home zip codes for FY 2014, Cluster 2 Visitors...........................38
Figure 6: Distribution of home zip codes for FY 2009, Cluster 3 Visitors...........................39
Figure 7: Distribution of home zip codes for FY 2014, Cluster 3 Visitors...........................39
Figure 8: Distribution of home zip codes for FY 2009, Cluster 4 Visitors...........................40
Figure 9: Distribution of home zip codes for FY 2014, Cluster 4 Visitors...........................40
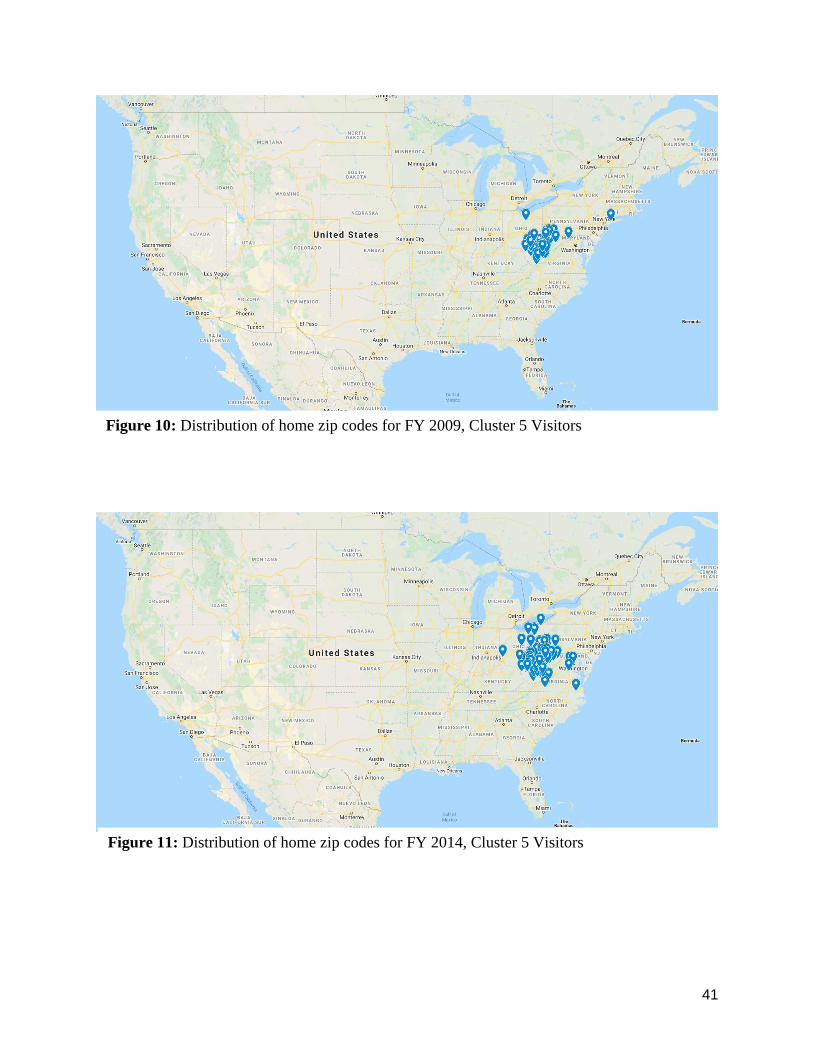
Figure 10: Distribution of home zip codes for FY 2009, Cluster 5 Visitors.........................41
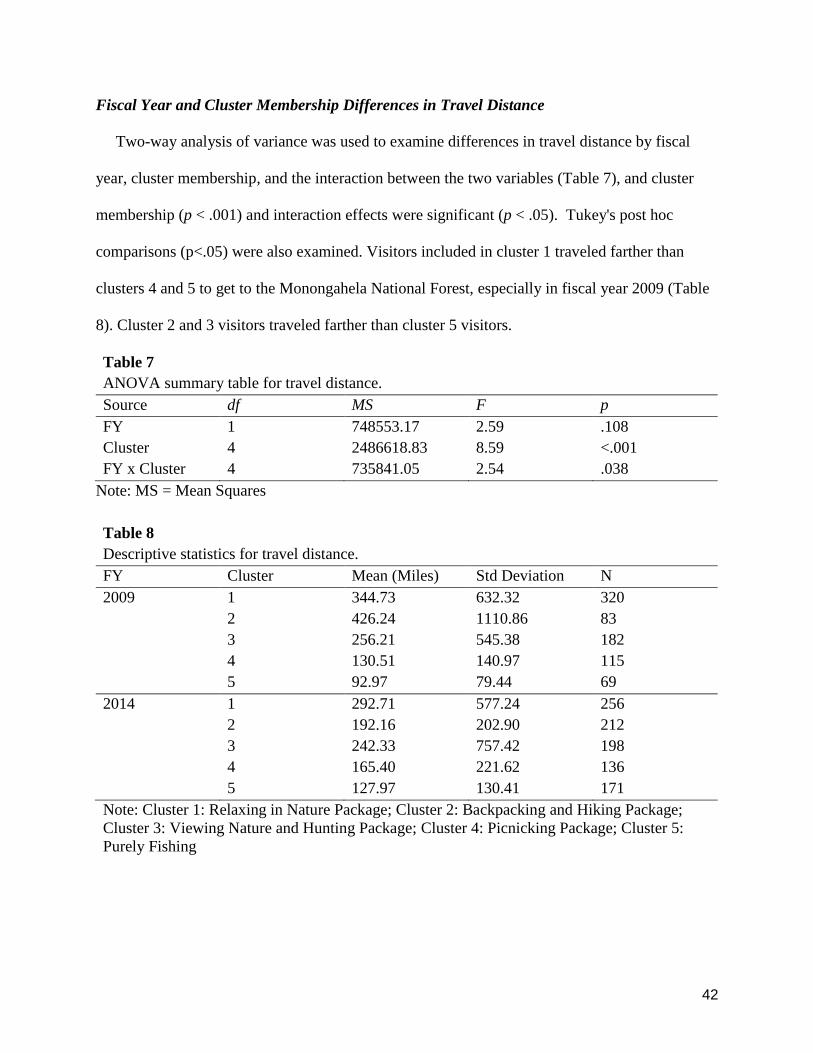
Figure 11: Distribution of home zip codes for FY 2014, Cluster 5 Visitors.........................41
viii
List of Tables
Table 1: Activity segmentation literature updated from Schneider, Vogt, and Smith (2006).....13
Table 2: Description of NVUM Survey Forms...........................................................................23
Table 3: Activity participation by cluster membership...............................................................29
Table 4: Primary activity participation by cluster membership..................................................30
Table 5: Cluster membership by fiscal year (FY).......................................................................31
Table 6: Visitor demographics by fiscal year (FY).....................................................................33
Table 7: ANOVA summary table for travel distance..................................................................42
Table 8: Descriptive statistics for travel distance........................................................................42
Table 9: ANOVA summary table for trip spending....................................................................43
Table 10: Descriptive statistics for trip spending........................................................................44
Table 11: ANOVA summary table for nights away from home.................................................45
Table 12: Descriptive statistics for nights away from home.......................................................45
Table 13: ANOVA summary table for overall satisfaction.........................................................46
Table 14: Descriptive statistics for overall satisfaction...............................................................46
1
1. Introduction
Participation in recreational activities have widely varied throughout the years across America
(Attarian, 2001). Over time, recreation trends have changed and new activities have emerged in
outdoor recreation. The Monongahela National Forest in West Virginia is no exception to the
change in activities. Due to the wide variety of uses for the Monongahela National Forest,
understanding different levels of use is beneficial in future planning and management of the
forest. Knowing the change in levels of use in recreational activities is beneficial for managers to
update the management plans for different areas of the forest. Because of the variability in the
usage of the forest, research on recreation participation is important to determine the proper
management of the forest. Recreational participation stems from the activities that are shared by
visitors throughout the forest areas (Askew, Bowker, English, Zarnoch, & Green, 2017). In the
Monongahela National Forest, visitors participate in a diverse number of recreational activities.
Common interests in usage of the forest areas for recreation include, but are not limited to
hiking, camping, biking, hunting, fishing, viewing nature, etc. (Askew, Bowker, English,
Zarnoch, & Green, 2017).
The recent outbreak of Coronavirus (COVID-19) and its impact on the global economy is a
reminder that tourism and crisis is a never-ending and ever-changing story, and when new events
and impacts occur, we should learn from them. Previous to that outbreak, travel and tourism was
hit hard by the 2008-2009 financial crisis which was the deepest recession since the Great
Depression (Meng, Siriwardana, Dollery, & Mounter, 2010; WTTC, 2010). The crisis was
caused by the credit and housing market collapses (Coles, 2013). Visser and Ferreira (2013)
argue that the impacts of economic downturns, such as the one in fiscal year 2009, illustrate the
integration of the world’s economies, transport systems, media and communication networks.
2
The deep economic crisis severely affected employees' work and personal lives. Hochwarter
(2009) showed that 70 percent of both men and women in his study confirmed that the recession
increased stress levels. More than 70 percent also admitted making spending changes, including
limiting or eliminating the purchase of non-essential items. Mucci, Giorgi, Roncaioli, Perez, and
Arcangeli (2016) implemented a systematic review of the principal studies that examined the
impact of the crisis on the health of workers. A total of 19 articles were reviewed. All of the
studies showed that the crisis was a stressor that impacted workers' mental health. There were
increases in mood disorders, dysthymia, anxiety disorders, somatoform disorders, panic attacks,
and abuse of alcohol.
The impact of the macro-economic event on tourism was also felt all around the world
because the purchasing power of people significantly influences their decisions to travel
(Mihalič, Kester, & Dwyer, 2013). Global GDP generated by travel and tourism declined by
4.8% in 2009 with estimated job losses of almost 5 million in this industry (WTTC, 2010). In
Singapore, tourism declined by 13.5% in the first half of 2009 (Meng, Siriwardana, Dollery, &
Mounter, 2010). In Asia, arrivals significantly declined (Song & Lin, 2010). In the United
Kingdom, the greatest declines were from European countries (e.g., Germany, Ireland, and
Spain) and the US (Visser & Ferreira, 2013). Within Europe, a contraction of travel in time and
space was reported. That is, “the average German’s current approach…can be described in the
following way: closer, shorter, cheaper” (Reinhardt, 2011, p. 27). In Canada, spending by total
tourism demand had the first decline since being hit by SARS (Ritchie, Molinar, & Frechtling,
2010). In Mexico, arrival of international tourists grew by 5% in the first half of 2008 and
plunged to -1% by the end of the year (Richie et al., 2010). And in the US, by the end of the first
3
quarter in 2009, real travel demand had fallen 6% over six quarters (Richie, Molinar, &
Frechtling, 2010).
The 2008 financial crisis played a role in tourists' motivation to travel. Rittichainuwat,
Chakraborty, and Rattanaphinanchai (2014) found that novelty, culture, and safe and short-
distance destinations would motivate tourists to travel during financial crises. During a time of
financial hardship, tourists may be more prudent with their spending. Rittichainuwat, et al.
(2014) found that during a financial crisis a safe and short-distance destination becomes a
popular travel alternative because it saves time, effort, and travel costs. Because of the crisis,
many tourism bureaus launched marketing campaigns to encourage tourists to travel to their
destinations in an attempt to generate tourism income and help heal the economic crisis. During
the crisis, the largest ever decline in passenger air transportation and a decrease of travel demand
in the United States occurred (Rittichainuwat et al., 2014). The study conducted by
Rittichainuwat, et al. (2014) found that recreational activities such as spa treatments, shopping,
and golfing may have been perceived as wasteful during the time of the crisis and people felt as
if their money was better spent elsewhere. Their study also showed that during that time the
demand for shopping and similar activities also decreased along with a decrease in secondary
vacations and short trips.
The housing market was severely affected by the 2008 crisis but the same cannot be said for
the stock market, at least not early into the crisis. According to Birru and Figlewski (2011), U.S.
stock prices hit their all-time high in October 2007, when the S&P 500 Index reached 1,576.09.
Over the course of a few months the S&P fell over 500 points and was being traded below 800
by the end of 2008. During this time, expectations for the U.S. market were full of uncertainty
and investors were experiencing significant financial losses. The combination of financial losses
4
and market uncertainty greatly reduced the willingness of investors to take risk. The S&P 500
reached its lowest point in March of 2009 when it was being traded for under 700 and then began
to increase over time (Birru & Figlewski, 2011).
Impacts from the global economic downturn imply that the effects have been ubiquitous and
the same negative patterns were experienced universally. In fact, the popular media was well
supplied with stories about the challenges faced by the travel and tourism industry during the
financial crisis (Coles, 2013), but little research has been published at smaller scales. For
example, there is a lack of literature specifically on crisis-impacted market segments. There
have been winners and losers within tourism (Coles, 2013), and perhaps they can be more easily
identified within smaller markets or at smaller scales like a National Forest. When market
segments are better understood, more efficient strategies can be developed to meet the needs of
target markets, attract new markets, promote product development, better allocate marketing
resources, manage visitor conflict, or increase customer volume in off-peak periods (Choi &
Tsang, 2008; Mumuni & Mansour, 2014).
Research on the global financial crisis and how it affected recreational use trends are also
essential for determining how tourism businesses can better meet the needs of their customers
and find new target markets (Siniscalchi, Pierskalla, Selin, & Palmer, 2006). It is also important
to discover how participation has changed over five years on the forest. The research purpose of
this study is to examine visitor use surveys and recreation activity participation throughout those
five years, especially following the world financial crisis of 2008-2009. Data collection started
on October 1, 2008 just two weeks after Lehman Brothers filed for bankruptcy, which was near
the beginning of the crisis.
5
Research Questions
● How has recreation participation changed over five years on the Monongahela National
Forest following the world financial crisis in fiscal year 2009?
● What are the activity-based market segments?
● For each market segment, is there a difference in visitor demographics for fiscal years
2009 and 2014?
● What are the main and interaction effects of fiscal year and cluster membership on travel
distance, trip expenditures, nights away from home, and overall satisfaction?
● Was the “global economic downturn” ubiquitous across all market segments?
● Are the 5 activity packages proposed by Hendee, Gale, and Cotton (1971) represented on
the Monongahela National Forest?
● How much activity variety exists within each activity package on the Monongahela
National Forest?
Definition of Terms-
1. Financial Crisis - According to Edey (2009), a financial crisis can cause a severe
economic shock to a country. For example, the 2008 financial crisis was one of the most
significant economic shocks in the United States. When a financial crisis occurs there is a
chance for global economic fallout. Edey (2009) further suggests that during a crisis, it is
ordinary to see a large swing in the appetite of world financial markets for risk, and in
6
their capacity to accept risk. This can also be accompanied by a loss in consumer
confidence, causing impacts to the global economy.
2. Market Segmentation - According to Choi, Murray, and Kwan, (2011), segmentation
defines subgroups of consumers so that there can be a better understanding of the
subgroups' needs and wants. In market segmentation, subgroups can be divided into a
variety of groups such as age groups, income brackets, or hobbies (Choi et al., 2011).
Furthermore, they state that the main benefits of market segmentation are efficient use of
limited resources, better communication with target customers, increased customer
satisfaction, strengthened competitive position, and maximized sales and profits.
3. Activity Based Segmentation - Activity based segmentation defines forest visitors based
on their choice of recreational activities and overall behavior during their visits (Pesonen
& Tuohino, 2015). It is used to better understand the past and for predicting behavior
(Choi et al., 2011). Understanding activity segments provides the opportunity to improve
profitability, attract new target markets, and increase traveler volume.
7
Limitations of the Study
1. There is lack of causation that can be proven in a trend study and there may have been
other factors that contributed to our results. However, the financial crisis was the
dominant news event during fiscal year 2009 and our data collection was well timed
during that period.
2. There is a lack of literature on trend studies. There is an example of another trend study
that examined the potential impacts of an event on visitation. Riley, Pierskalla, Burns,
Maubme, Graefe, Smaldone, & Williams, (2015) conducted a trend study to examine the
displacement of OHV users 3 years after a restrictive management policy was
implemented at Oregon Dunes National Recreation Area and Sand Lake. However, not
all events are planned. NVUM can provide valuable trend data when major events
suddenly occur in society or at a recreation area and may provide our best option for
examining those impacts on visitation.
3. The source of the data came from a previous study (National Visitor Use Monitoring). A
limitation of pre-existing data is that it can rarely be independently verified. In the 2009
and 2014 study years, teams of surveyors conducted surveys, thus there is potential for
errors in the survey interviews.
8
2. Literature Review
To better understand recreation activity participation and the role of the 2008-2009 financial
crisis played on the Monongahela National Forest, this section focuses on previous studies and
literature related to this study. This section will discuss market segmentation, activity-based
segmentation, trend studies, and satisfaction.
Market Segmentation
Market segmentation is at the heart of modern marketing (Schneider, Vogt, & Smith, 2006),
and is one of the most important management tools of the recreation and tourism planner
(Schroeder, 1987). Market segmentation in the tourism industry involves grouping tourists into
homogenous categories based on the similarity with one or more variables including travel
motivation, benefits sought, travel mode, expenditure amounts and patterns, and preferences for
tourism activities, among others (Mumuni & Mansour, 2014). Statistical techniques such as
factor and/or cluster analysis are used to identify the distinct segments when using a posteriori
approach (versus identifying clusters a priori). The resulting segments are then profiled based on
similarity with other variables such as sociodemographics.
Activity-based Segmentation
When the crisis of 2008 began (e.g., when the housing market declined), not only was the real
economy affected, the financial system was affected too (Okte, 2012). According to Okte (2012),
people were making poor decisions in the real estate market for years that affected the global
economic conditions. The World Financial Crisis of 2008 affected many people financially and
potentially changed their recreation trends. For this research on the Monongahela National
Forest, activity-based segmentation was the primary focus of the study. According to Pesonen
9
and Tuohino (2015), activity-based segmentation defines forest visitors based on their choice of
recreational activities and overall behavior during their visits. It helps determine the different
preferences of forest visitors. These different preferences can help determine the proper target
market. Understanding recreation trends and research on this topic has been an important aspect
of forest policy development worldwide. In 2006, researchers analyzed social change on the
Monongahela National Forest (Siniscalchi, Pierskalla, Selin, & Palmer, 2006). In their study,
they discussed the importance of studying trends and social change: “Many communities in and
around national forests are experiencing social change. It is important for public land managers
to keep abreast of this change to provide appropriate forest uses while considering resource
impacts, conflict management, and potential partnerships with local communities” (Siniscalchi,
et at., 2006, p. 71). According to Siniscalchi, et al. (2006), forest managers were able to make
important changes to the management plan for the Seneca Rocks/Spruce Knob Recreation Area
because of the research done in their study. Predating the study on social change, the
management plan had not been revised since 1960. In this study, on the Monongahela National
Forest, major world events, activity-based segmentation, and recreation trends are all examined
to better understand the Monongahela National Forest and the trends that have occurred from
2009 to 2014 (Siniscalchi, et al., 2006).
Activities are an effective segmentation base (Pesonen & Tuohino, 2017) and are the key
product in adventure travel (Schneider et al., 2006). Unlike motivations, an advantage of
activity-based segmentation is that it is stable across different national and cultural contexts
(Mumuni & Mansour, 2014). Activities also serve as a link between travel motivation and
destination choice (Cooper et al., 2005). Beritelli and Boksberger (2005) link tourist activities
and motivations further supporting the important role activities play in destination marketing. In
10
addition, grouping activities into packages through segmentation can provide more convenience
for travelers and can increase the desire for specialized activities (Hsieh, O'Leary, & Morrison,
1992).
Because science is based on the groupings of unique events or objects into similarity classes,
"Classification of leisure activities has been and currently remains an essential part of leisure
research" (Williams, 1988, p. 153). McCool (1978) defined an activity package as a set of
activities that a visiting group engages in at a recreation area. One of the first and best examples
of a study on activity type, especially as it relates to forest recreation packages, was conducted
by Hendee, Gale, and Catton (1971). Respondents in their study were asked to identify their six
most preferred activities from a list of twenty-six conceivable recreation activities. They
proposed five conceptually linked activity packages based on "perceived similarities in the
underlying meanings of the activities to the participant" (McCool, 1978, p. 166). The typology is
unique because it is based on the study of recreationists visiting both car campgrounds and
wilderness in national parks and national forests, therefore it is most suitable for our study of
National Forest visitors. In addition, the study was among three studies that Manning (2011)
selected to illustrate the genre of research on activity type. McCool (1978) added additional
examples of activities to the five activity packages which are summarized below (somewhat
abbreviated):
Appreciative-Symbolic: Activities directed toward appreciation of features of the natural
environment. The recreationist's focus is on appreciation of material items in the
environment rather than on their extraction in the form of "trophies." Examples of
activities include seeing natural scenery on foot or horseback, hiking, and photography.
11
Extractive-Symbolic: Activities characterized by the quest for trophies extracted from the
natural environment. Examples of activities include fishing and hunting.
Passive-Free Play: Activities requiring little effort and not confined to the forest
environment. Examples of activities include relaxing, driving for pleasure, quiet boating
or canoeing, and picnicking.
Sociable-Learning: Social and learning activities such as nature study, hearing nature
talks, visiting exhibits, visiting historic sites, and visiting with other people.
Active-Expressive: Activities not requiring use of a forest setting and which, in fact,
sometimes interfere with other activities at the same site. Examples of activities include
swimming, jogging, bicycling, golf, and organized games such as playing softball,
football, and horseshoes.
The travel industry is constantly changing and the internet has become an indispensable
channel for travelers to seek travel information (Beldona, Morrison, & O’Leary, 2005). This
provides a cost effective, easily accessible marketplace for travel agencies and travelers. Ryu,
Choi, and Cho (2018) conducted a study investigating how different types of travelers use peer-
to-peer online travel marketplaces in distinctive ways. The peer-to-peer online travel marketplace
serves as a connector between tourists and local suppliers for things like accommodations (e.g.
Airbnb) and tours (e.g. Triip) (Ryu, et al., 2018). They assessed different traveler behaviors and
measured them using six factors from twenty items. A total of 2,467 survey respondents were
combined with real transaction data. The respondents were put into six groups based on several
aspects, such as demographic characteristics (Ryu, et al., 2018). This study found that the
travelers’ online usage was very different and provided insights on the importance of
understanding the interests of different travelers, especially for marketplace operators and
12
tourism businesses. Placing respondents into specific clusters provided information that shows
tourism businesses should not only chase potential visitors but also choose the advertisements
most suitable to their characteristics. Understanding visitor characteristics is important for
satisfying different visitor types (Ryu, et al., 2018).
Our study used market segmentation, particularly activity-based segmentation, to create
activity packages that can be compared with Hendee, Gale, and Catton's (1971) typology.
Researchers examining activity participation have been aware of the activity package concept,
but studies tend to primarily use empirical methodologies rather than the development of
conceptual frameworks (McCool, 1978). Few, if any, recent studies have directly compared their
activity groupings with an activity-based segmentation framework. This is a gap in the literature
that is addressed by this thesis.
Activity-based segmentation has proved useful for many different types of tourists and has a
wide array of support. Schneider et al. (2006) cited a range of studies that use activity-based
segmentation including segmentation for culture tourists (McKercher, Ho, du Cros, & So-Ming,
2002), nature tourists (Lang & O'Leary, 1997), ecotourists (Wight, 1996), adventure tourists
(Sung, Morrison & O'Leary, 1997), and visiting friends and relatives tourist market (Moscardo,
Pearce, Morrison, Green, & O'Leary, 2000). Support for activity-based segmentation can also be
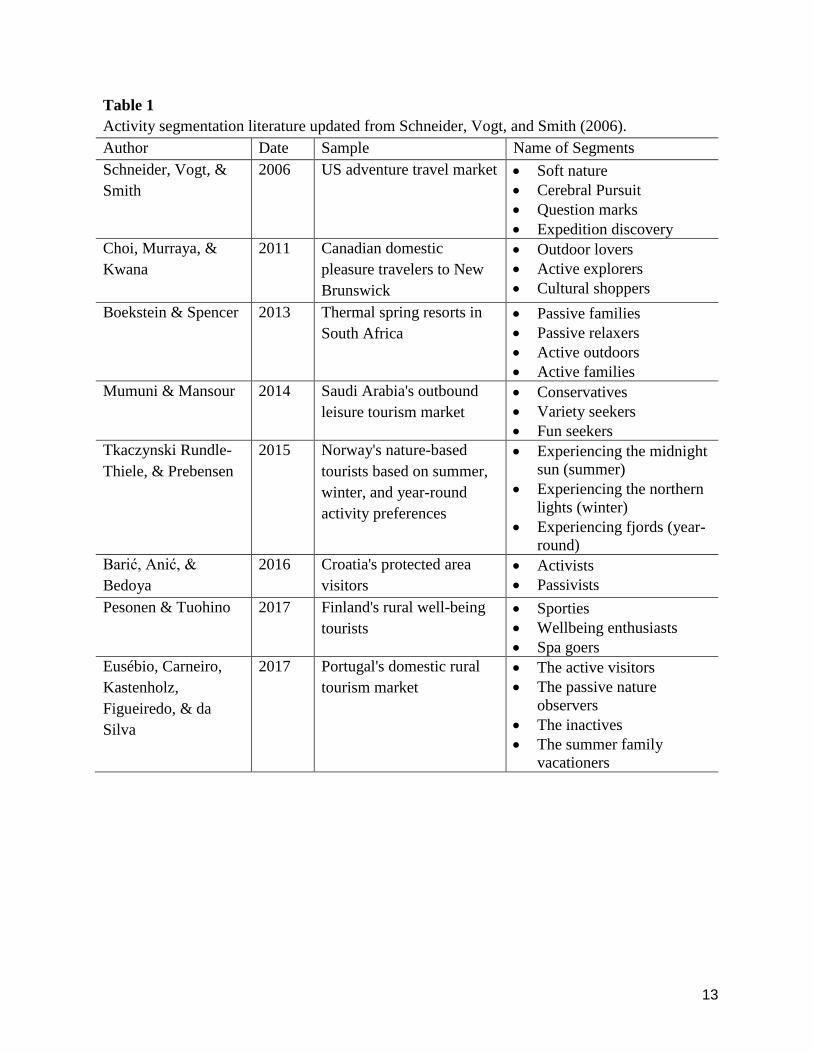
found throughout the world. We compiled studies that have been published since 2006 (Table 1).
13
Table 1
Activity segmentation literature updated from Schneider, Vogt, and Smith (2006).
Author Date Sample Name of Segments
Schneider, Vogt, &
Smith
2006 US adventure travel market Soft nature
Cerebral Pursuit
Question marks
Expedition discovery
Choi, Murraya, &
Kwana
2011 Canadian domestic
pleasure travelers to New
Brunswick
Outdoor lovers
Active explorers
Cultural shoppers
Boekstein & Spencer 2013 Thermal spring resorts in
South Africa
Passive families
Passive relaxers
Active outdoors
Active families
Mumuni & Mansour 2014 Saudi Arabia's outbound
leisure tourism market
Conservatives
Variety seekers
Fun seekers
Tkaczynski Rundle-
Thiele, & Prebensen
2015 Norway's nature-based
tourists based on summer,
winter, and year-round
activity preferences
Experiencing the midnight
sun (summer)
Experiencing the northern
lights (winter)
Experiencing fjords (year-
round)
Barić, Anić, &
Bedoya
2016 Croatia's protected area
visitors
Activists
Passivists
Pesonen & Tuohino 2017 Finland's rural well-being
tourists
Sporties
Wellbeing enthusiasts
Spa goers
Eusébio, Carneiro,
Kastenholz,
Figueiredo, & da
Silva
2017 Portugal's domestic rural
tourism market
The active visitors
The passive nature
observers
The inactives
The summer family
vacationers
14
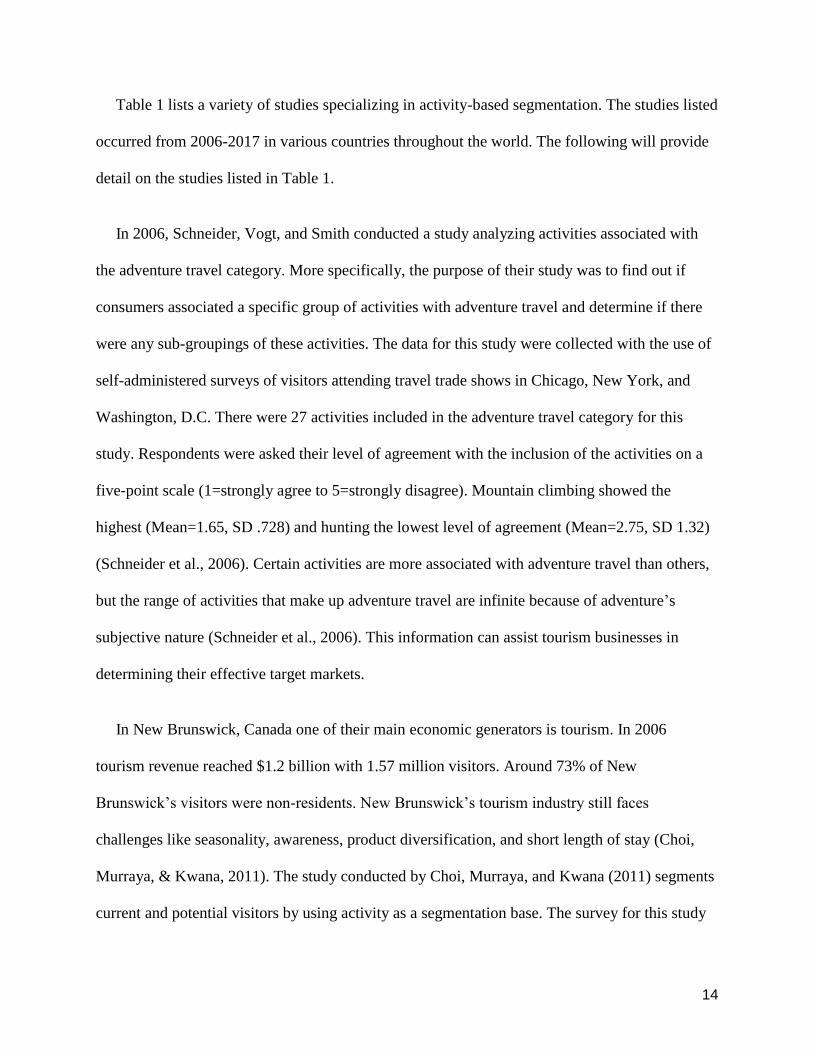
Table 1 lists a variety of studies specializing in activity-based segmentation. The studies listed
occurred from 2006-2017 in various countries throughout the world. The following will provide
detail on the studies listed in Table 1.
In 2006, Schneider, Vogt, and Smith conducted a study analyzing activities associated with
the adventure travel category. More specifically, the purpose of their study was to find out if
consumers associated a specific group of activities with adventure travel and determine if there
were any sub-groupings of these activities. The data for this study were collected with the use of
self-administered surveys of visitors attending travel trade shows in Chicago, New York, and
Washington, D.C. There were 27 activities included in the adventure travel category for this
study. Respondents were asked their level of agreement with the inclusion of the activities on a
five-point scale (1=strongly agree to 5=strongly disagree). Mountain climbing showed the
highest (Mean=1.65, SD .728) and hunting the lowest level of agreement (Mean=2.75, SD 1.32)
(Schneider et al., 2006). Certain activities are more associated with adventure travel than others,
but the range of activities that make up adventure travel are infinite because of adventure’s
subjective nature (Schneider et al., 2006). This information can assist tourism businesses in
determining their effective target markets.
In New Brunswick, Canada one of their main economic generators is tourism. In 2006
tourism revenue reached $1.2 billion with 1.57 million visitors. Around 73% of New
Brunswick’s visitors were non-residents. New Brunswick’s tourism industry still faces
challenges like seasonality, awareness, product diversification, and short length of stay (Choi,
Murraya, & Kwana, 2011). The study conducted by Choi, Murraya, and Kwana (2011) segments
current and potential visitors by using activity as a segmentation base. The survey for this study
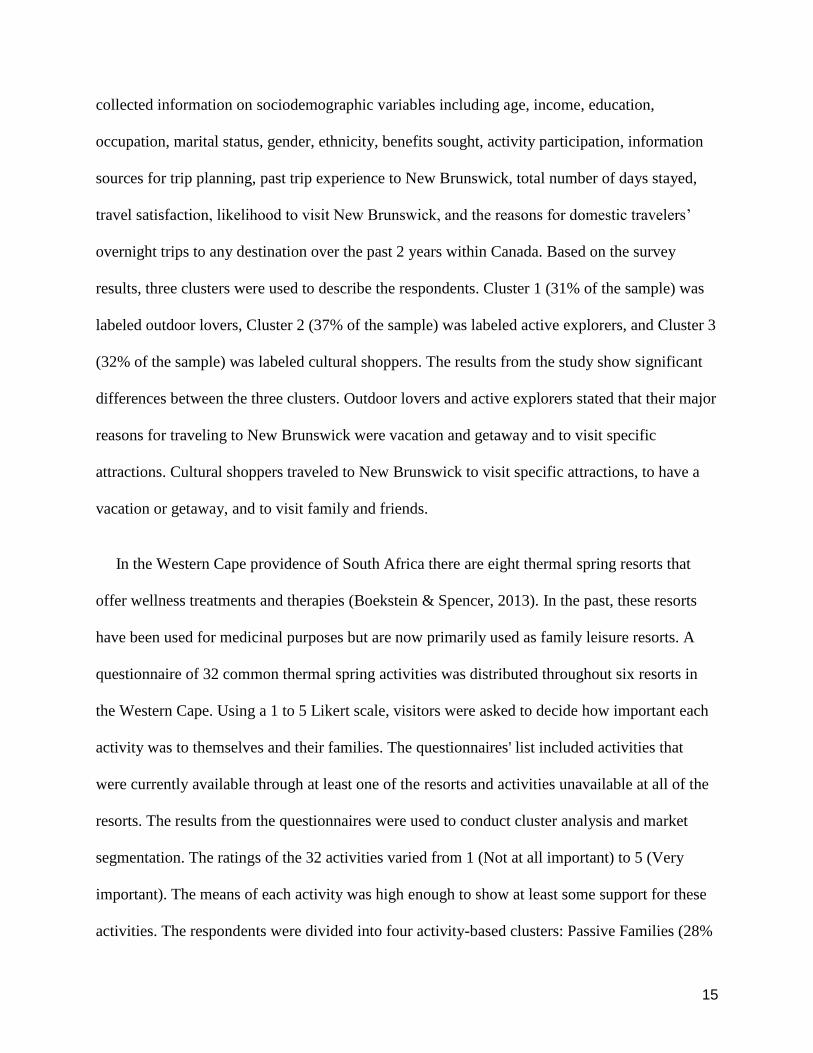
15
collected information on sociodemographic variables including age, income, education,
occupation, marital status, gender, ethnicity, benefits sought, activity participation, information
sources for trip planning, past trip experience to New Brunswick, total number of days stayed,
travel satisfaction, likelihood to visit New Brunswick, and the reasons for domestic travelers’
overnight trips to any destination over the past 2 years within Canada. Based on the survey
results, three clusters were used to describe the respondents. Cluster 1 (31% of the sample) was
labeled outdoor lovers, Cluster 2 (37% of the sample) was labeled active explorers, and Cluster 3
(32% of the sample) was labeled cultural shoppers. The results from the study show significant
differences between the three clusters. Outdoor lovers and active explorers stated that their major
reasons for traveling to New Brunswick were vacation and getaway and to visit specific
attractions. Cultural shoppers traveled to New Brunswick to visit specific attractions, to have a
vacation or getaway, and to visit family and friends.
In the Western Cape providence of South Africa there are eight thermal spring resorts that
offer wellness treatments and therapies (Boekstein & Spencer, 2013). In the past, these resorts
have been used for medicinal purposes but are now primarily used as family leisure resorts. A
questionnaire of 32 common thermal spring activities was distributed throughout six resorts in
the Western Cape. Using a 1 to 5 Likert scale, visitors were asked to decide how important each
activity was to themselves and their families. The questionnaires' list included activities that
were currently available through at least one of the resorts and activities unavailable at all of the
resorts. The results from the questionnaires were used to conduct cluster analysis and market
segmentation. The ratings of the 32 activities varied from 1 (Not at all important) to 5 (Very
important). The means of each activity was high enough to show at least some support for these
activities. The respondents were divided into four activity-based clusters: Passive Families (28%
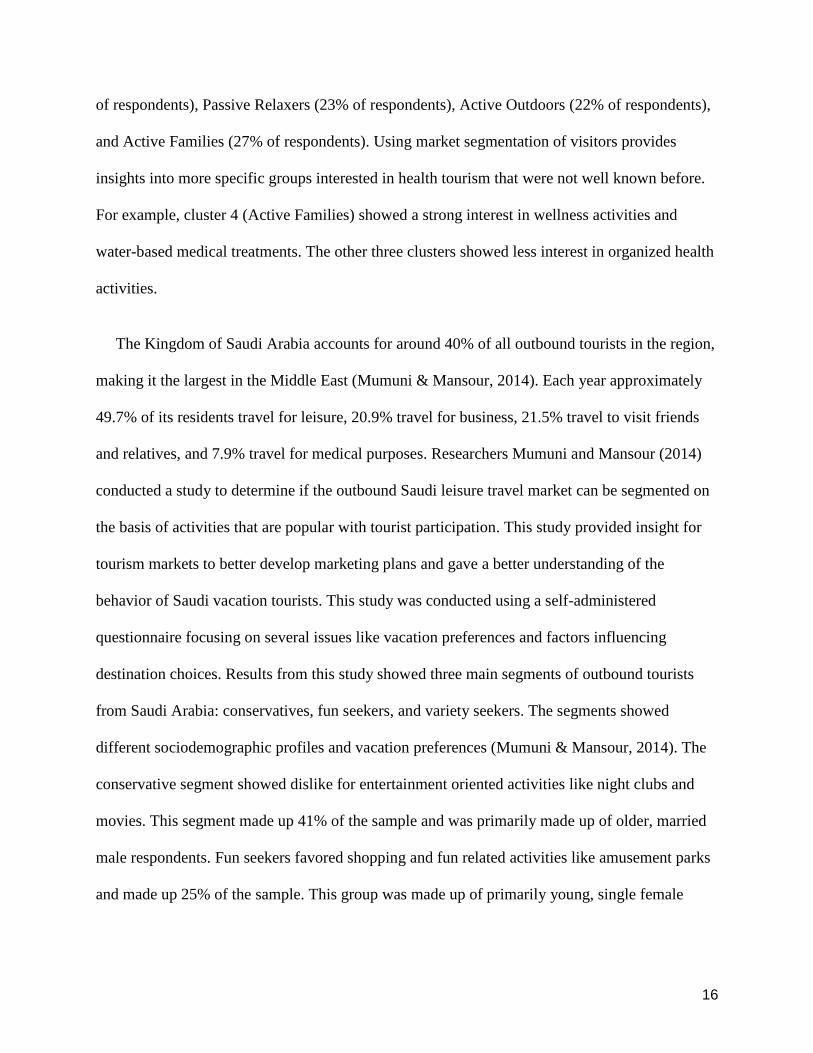
16
of respondents), Passive Relaxers (23% of respondents), Active Outdoors (22% of respondents),
and Active Families (27% of respondents). Using market segmentation of visitors provides
insights into more specific groups interested in health tourism that were not well known before.
For example, cluster 4 (Active Families) showed a strong interest in wellness activities and
water-based medical treatments. The other three clusters showed less interest in organized health
activities.
The Kingdom of Saudi Arabia accounts for around 40% of all outbound tourists in the region,
making it the largest in the Middle East (Mumuni & Mansour, 2014). Each year approximately
49.7% of its residents travel for leisure, 20.9% travel for business, 21.5% travel to visit friends
and relatives, and 7.9% travel for medical purposes. Researchers Mumuni and Mansour (2014)
conducted a study to determine if the outbound Saudi leisure travel market can be segmented on
the basis of activities that are popular with tourist participation. This study provided insight for
tourism markets to better develop marketing plans and gave a better understanding of the
behavior of Saudi vacation tourists. This study was conducted using a self-administered
questionnaire focusing on several issues like vacation preferences and factors influencing
destination choices. Results from this study showed three main segments of outbound tourists
from Saudi Arabia: conservatives, fun seekers, and variety seekers. The segments showed
different sociodemographic profiles and vacation preferences (Mumuni & Mansour, 2014). The
conservative segment showed dislike for entertainment oriented activities like night clubs and
movies. This segment made up 41% of the sample and was primarily made up of older, married
male respondents. Fun seekers favored shopping and fun related activities like amusement parks
and made up 25% of the sample. This group was made up of primarily young, single female
17
respondents. Variety seekers made up 34% of the sample and showed interest in all of the
included vacation activities.
Another study using activity-based segmentation was conducted by researchers in Norway,
“Despite significant research into seasonality and nature-based activity preferences, academic
researchers are not profiling activity-oriented tourists into segments based on temporal factors
such as seasons” (Tkaczynski, Rundle-Thiele, & Prebensen, 2015, p. 251). Tkaczynski, et al.
(2015) classified 8,962 nature-based tourists activities collected from a Norwegian questionnaire.
Respondents were segmented based on their summer, winter, and year-round activities. For this
study, four clusters were identified after the respondent’s seasonality was taken into account. In
this case, activity-based segmentation allowed researchers to discover that “preferred activities
represent a driver of tourism to many seasonal destinations” (Tkaczynski, et al., 2015, p. 260).
Results showed that the preferred activities for the seasons all pertained to sight-seeing:
“experiencing the midnight sun (summer),” “experiencing the northern lights (winter),” and
“experiencing fjords (year-round)”. Understanding the preferred activities based on seasonal
preferences allows tourism businesses to better meet the needs of their target market.
A study focusing on activity-based segmentation of specific visitor subgroups was conducted
in Paklenica National Park, Croatia. The purpose of this study was to demonstrate the utility and
practical application of activity-based visitor segmentation in protected areas. For this study,
visitors were administered a face-to-face questionnaire. The questionnaire was made up of three
main parts focusing on importance of activities, importance of benefits, and travel behavior.
After a cluster analysis was conducted two clusters were deemed appropriate. The first cluster
(Activists) made up 60.8% of the sample and was compromised of visitors exclusively there for
18
rock climbing and showed little to no interest in other recreational activities. The second cluster
(Passivists) participated in more, but less challenging, activities. The results from this study
showed that visitors to wilderness and protected natural areas are not a homogenous group
(Barić, Anić, & Bedoya, 2016). These results may assist park managers to develop strategies to
improve physical, social, and managerial setting characteristics. Doing so would increase
opportunities for targeted groups to attain desired benefits (Barić et al., 2016).
Wellness tourism is becoming increasingly popular in the travel and tourism industry. A study
conducted by Pesonen and Tuohino (2017) focuses on segmenting wellbeing tourists based on
their wellbeing activity preferences to assist tourism businesses, more specifically Finnish
companies specializing in rural tourism. For this study, an online questionnaire was placed on the
largest Finnish website for rural tourism as well as two smaller websites. To increase the
response rate a 500€ gift certificate was given to one respondent as a prize (Pesonen & Tuohino,
2017). The questionnaire focused on information channels and socio-demographic factors. The
results from this study found that three clusters best described the respondents. The three clusters
were labeled Sporties, Wellbeing Enthusiasts and Spa Goers. Wellbeing Enthusiasts regarded
travel motivations as being more important than the other clusters, while Sporties found the
opportunity to be physically active more important. There was not much difference between the
segments regarding information channels. All participants stated the internet was the most
important information channel. The results from this study show that Wellbeing Enthusiasts can
be reached using travel magazines and travel agencies easier than the other two segments. This
study provided insight on the most efficient ways to target various activity segments by
examining how people use various electronic information channels.
19
Trend Studies
The preferred outdoor activities of visitors are different now from what they were in the past.
Activities that were thought to be popular years ago like hunting and fishing are being replaced
with activities like bird watching and photography (Ordell, 2012). Throughout history, the Forest
Service and Department of Agriculture have conducted trend studies on public lands in America.
The purpose of these studies is to gain a better understanding of current outdoor recreation
participation patterns as well as to compare patterns across different regions (Ordell, 2012). With
the use of trend studies, researchers are able to discover present past trends in outdoor recreation,
current outdoor recreation participation patterns and trends, recreation participation patterns
across regional and demographic strata, recreation activity participation on public and private
lands, projections of outdoor recreation participation in the future, and highlight departures from
past patterns to indicate potential public and private sector implications (Ordell, 2012). Several
approaches can be employed to conduct trend studies such as the examination of previous and
current data as well as reviewing past studies conducted by research experts in the field of
outdoor recreation.
Satisfaction
Nature based tourism is a significant sector of the tourism industry (Naidoo, Ramseook-
Munhurrun, & Seegoolam, 2011). Because of this significance, research on visitor satisfaction is
important for both visitors and tourism businesses. Analysis on visitor satisfaction gives tourism
providers the opportunity to assess the strong and weak attributes of the destination which in turn
helps to improve the overall quality of the destination (Naidoo, et al., 2011). There have been
several studies on visitor satisfaction in the nature-based tourism industry. Naidoo, et al. (2011)
20
conducted a quantitative study on the island of Mauritius that assessed the satisfaction of 600
visitors. The questionnaire for this study was divided into four sections: questions regarding
satisfaction, overall satisfaction and customer loyalty, open and close-ended questions, and
questions collecting demographic information of the visitors. Having the four different sections
allowed researchers to evaluate visitor experiences, allow respondents to express their general
attitudes that assist in interpreting the general questions, and gain an overall better understanding
of the destination’s visitors (Naidoo, et al., 2011). The results from this study showed multiple
key findings. It was found that visitors felt that staff was not well informed to react to consumers
requests (Naidoo, et al., 2011). The study also discovered that there is a relationship between
nature based tourism attractions, overall satisfaction, and visitors’ loyalty intentions (Naidoo, et
al., 2011). This shows that several factors such as price, assurance, empathy, and natural
resources have a significant role in visitor satisfaction (Naidoo, et al., 2011).
There have also been studies that have identified factors determining the satisfaction of
outdoor recreation participants (Nowacki, 2012). Determining these factors assists in the
development of the outdoor recreation satisfaction model (Nowacki, 2012). The model for
satisfaction in outdoor recreation has been divided into two groups of factors: situational and
subjective evaluation (Nowacki, 2012). Situational satisfaction includes resource and
environment conditions, social settings and management settings. Subjective evaluation consists
of socioeconomic characteristics, attitudes and preferences, cultural characteristics, subjective
norms, experience, crowding and risk perception. When considering the two groups of factors in
the satisfaction model, there are other variables out of the control of recreation managers that
should also be considered such as weather or the mood of a visitor triggered by other factors. The
large number of uncontrollable variables determining the satisfaction of outdoor recreation tend

21
to play a role in overall satisfaction levels and outdoor recreation participants satisfaction often
remains high (Nowacki, 2012). When measuring satisfaction, it is beneficial to focus on the
satisfaction of individual service components and specific scenarios or experiences.
Market segmentation, activity-based segmentation, trend studies, and satisfaction all play an
important role in understanding recreation activity participation and the role of the 2008-2009
financial crisis on the Monongahela National Forest. When considered together, these topics
provide valuable insight to this study. Previous literature was used to assess recreational activity
in the past as well as to develop a framework for this study.
22
3. Method
The purpose of this study is to take results from visitor use surveys and analyze recreation
activity participation over five years, especially following the world financial crisis of 2008-
2009. This section will focus on the study instrument, sampling method, and data analysis.
In order to obtain the data for this research, National Visitor Use Monitoring (NVUM)
surveys from 2009 and 2014 were examined. The study was conducted on the Monongahela
National Forest which is located in the Allegheny Mountains of eastern West Virginia. The
Forest consists of over 921,000 acres of federally owned land. Tourism is an increasingly
important part of the West Virginia economy given the volatility of the coal mining industry.
We used data that we helped collect for the National Visitor Use Monitoring (NVUM)
program of the US Forest Service. The objective of the NVUM program is to estimate the
volume of recreation visitation to all National Forests and Grasslands in the US and to analyze
visitation with respect to activity participation, demographics, trip spending, travel distance, etc.
The revised method was first applied in 2000. The 12-month studies are conducted on a 5-year
sampling cycle in each National Forest in the U.S.
23
Study Instrument
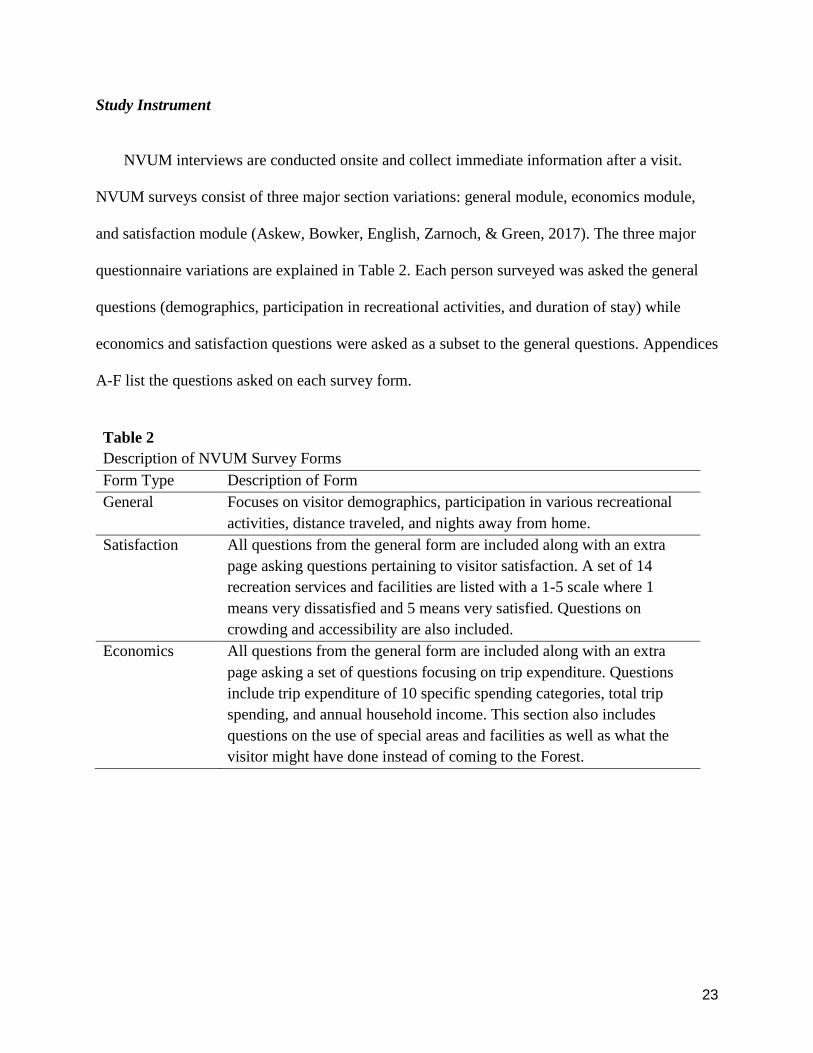
NVUM interviews are conducted onsite and collect immediate information after a visit.
NVUM surveys consist of three major section variations: general module, economics module,
and satisfaction module (Askew, Bowker, English, Zarnoch, & Green, 2017). The three major
questionnaire variations are explained in Table 2. Each person surveyed was asked the general
questions (demographics, participation in recreational activities, and duration of stay) while
economics and satisfaction questions were asked as a subset to the general questions. Appendices
A-F list the questions asked on each survey form.
Table 2
Description of NVUM Survey Forms
Form Type Description of Form
General Focuses on visitor demographics, participation in various recreational
activities, distance traveled, and nights away from home.
Satisfaction All questions from the general form are included along with an extra
page asking questions pertaining to visitor satisfaction. A set of 14
recreation services and facilities are listed with a 1-5 scale where 1
means very dissatisfied and 5 means very satisfied. Questions on
crowding and accessibility are also included.
Economics All questions from the general form are included along with an extra
page asking a set of questions focusing on trip expenditure. Questions
include trip expenditure of 10 specific spending categories, total trip
spending, and annual household income. This section also includes
questions on the use of special areas and facilities as well as what the
visitor might have done instead of coming to the Forest.
24
Sampling
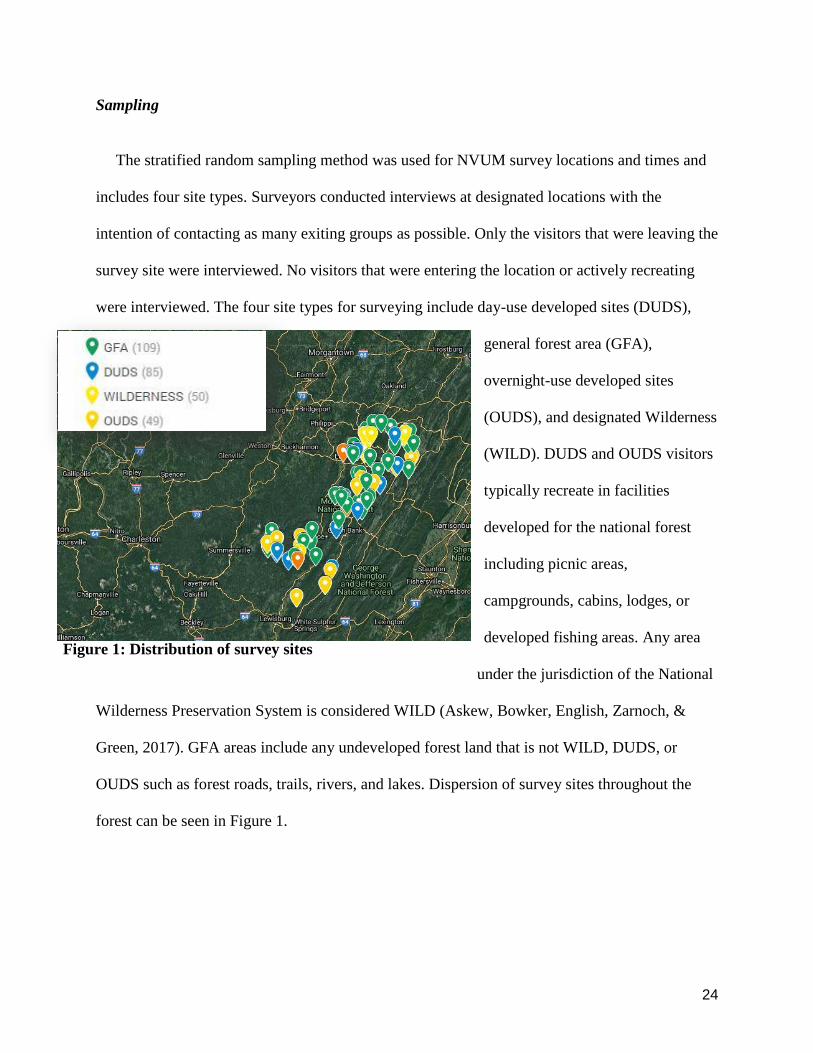
The stratified random sampling method was used for NVUM survey locations and times and
includes four site types. Surveyors conducted interviews at designated locations with the
intention of contacting as many exiting groups as possible. Only the visitors that were leaving the
survey site were interviewed. No visitors that were entering the location or actively recreating
were interviewed. The four site types for surveying include day-use developed sites (DUDS),
general forest area (GFA),
overnight-use developed sites
(OUDS), and designated Wilderness
(WILD). DUDS and OUDS visitors
typically recreate in facilities
developed for the national forest
including picnic areas,
campgrounds, cabins, lodges, or
developed fishing areas. Any area
under the jurisdiction of the National
Wilderness Preservation System is considered WILD (Askew, Bowker, English, Zarnoch, &
Green, 2017). GFA areas include any undeveloped forest land that is not WILD, DUDS, or
OUDS such as forest roads, trails, rivers, and lakes. Dispersion of survey sites throughout the
forest can be seen in Figure 1.
Figure 1: Distribution of survey sites
25
Data Analysis
This thesis includes seven research questions that were used to examine visitor use surveys and
recreation activity participation throughout those five years, especially following the world
financial crisis of 2008-2009. The seven research questions are:
● How has recreation participation changed over five years on the Monongahela National
Forest following the world financial crisis in fiscal year 2009?
● What are the activity-based market segments?
● For each market segment, is there a difference in visitor demographics for fiscal years
2009 and 2014?
● What are the main and interaction effects of fiscal year and cluster membership on travel
distance, trip expenditures, nights away from home, and overall satisfaction?
● Was the “global economic downturn” ubiquitous across all market segments?
● Are the 5 activity packages proposed by Hendee, Gale, and Cotton (1971) represented on
the Monongahela National Forest?
● How much activity variety exists within each activity package on the Monongahela
National Forest?
To answer these questions data were analyzed using IBM SPSS Statistics Version 25. Two-
step cluster analysis of 18 activity participation variables (binary "yes" or "no" data) were
conducted with 3 to 5 clusters examined to find the most logical solution for the entire data set.
Two-way analysis of variance (ANOVA) was used to examine two categorical independent

26
variables (i.e., fiscal year of study and cluster membership) and one continuous dependent
variable (i.e., travel distance, trip spending, nights away from home, and overall satisfaction).
We compared the association between activity participation, primary activity, cluster
membership, and demographics with fiscal year using Chi-square tests.
27
4. Results
Segmentation Procedure
The sample size was 823 visitors in fiscal year 2009 and 1,028 in fiscal year 2014. A two-step
cluster analysis was used to segment visitors to the Monongahela National Forest using all of the
data collected during both years. That is, visitors who participated in similar activities were
grouped together. Based on criteria provided by Weinstein (1987), a five-cluster solution was
selected. The criteria include homogeneity within the segment, heterogeneity between segments,
sizable population, and meaningful segment data (e.g., segment data that is most practical and
usable). Each cluster was given a name based on the package of activities and the primary
activities reflected in the cluster. The five clusters found were: 1) Relaxing in Nature Package, 2)
Backpacking and Hiking Package, 3) Viewing Nature and Hunting Package, 4) Picnicking
Package, and 5) Purely Fishing.
Relaxing in Nature Package
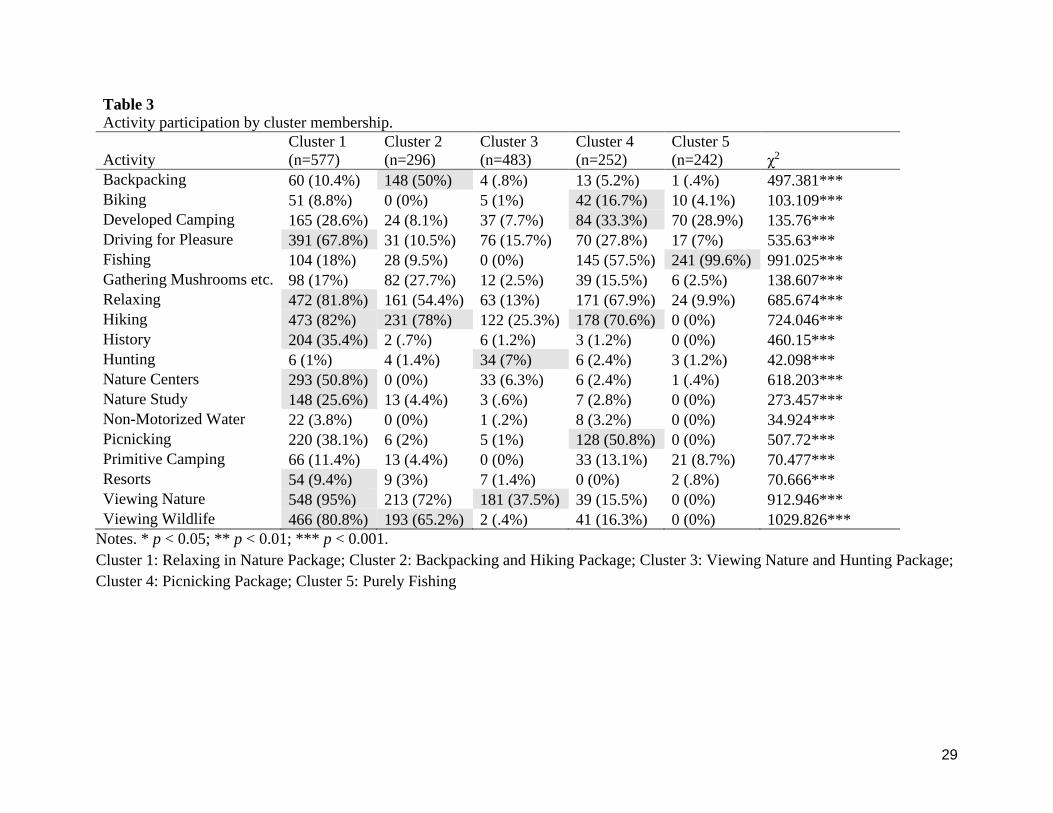
Cluster 1 (n = 577) represented 31.2 percent of the total sample in this study and was labeled
Relaxing in Nature Package (Table 3). The activity of viewing nature had the highest percentage
of visitors (95%) within the cluster. The percentages associated with activity participation that
were among the highest across clusters include hiking (82%), relaxing (81.8%), viewing wildlife
(80.8%), driving for pleasure (67.8%), nature centers (50.8%), history (35.4%), nature study
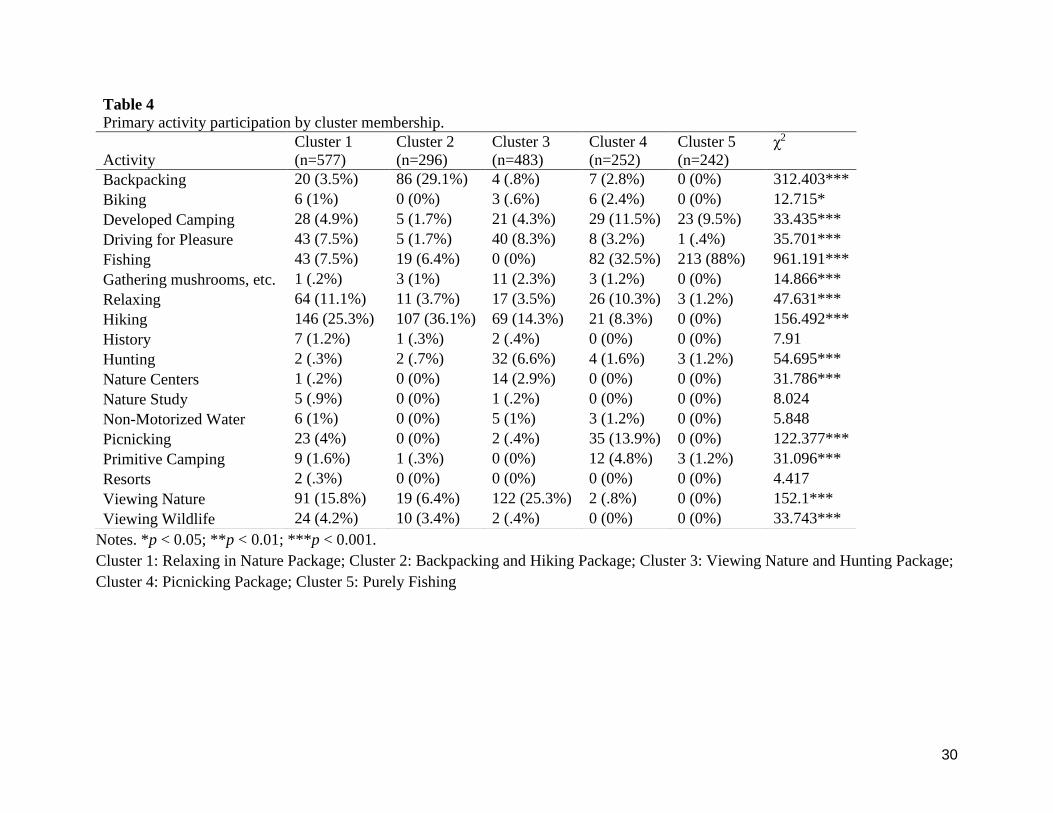
(25.6%), and resorts (9.4%). Visitors were also asked to select their one primary activity among
the list of activities. The most common primary activities complement activity participation
(Table 4).
28
Backpacking and Hiking Package
Cluster 2 (n=296) consisted of 16 percent of the total sample and was labeled Backpacking
and Hiking Package (Table 3). Most respondents participated in hiking (78%). Other activities
include viewing wildlife (65.2%) and backpacking (50%), and both reflect the highest
percentages across clusters. The selection of a primary activity complements these findings
(Table 4).
Viewing Nature and Hunting Package
Cluster 3 (n = 483) represented 26.1 percent of the sample and was labeled Viewing Nature
and Hunting Package. Compared to other clusters, hunting participation (7%) was highest for
this cluster (Table 3). Viewing nature was also selected as the primary activity (25.3%) more
often than the other four clusters (Table 4).
Picnicking Package
Cluster 4 (n = 252) represented 13.6 percent of the sample and was labeled Picnicking
Package. Participation in picnicking (50.8%) along with picnicking as a primary activity (13.9%)
was highest for this cluster (Tables 3 and 4). Hiking participation (70.6%), developed camping
(33.3%), and biking (16.7%) were also among the highest percentages across clusters.
Purely Fishing
Cluster 5 (n = 242) represented 13.1 percent of the sample and was labeled Purely Fishing.
This cluster represents visitors who exclusively participate in fishing (99.6%) and selected
fishing as the primary activity (88%) (Tables 3 and 4).
29
Table 3
Activity participation by cluster membership.
Activity
Cluster 1
(n=577)
Cluster 2
(n=296)
Cluster 3
(n=483)
Cluster 4
(n=252)
Cluster 5
(n=242) χ2
Backpacking 60 (10.4%) 148 (50%) 4 (.8%) 13 (5.2%) 1 (.4%) 497.381***
Biking 51 (8.8%) 0 (0%) 5 (1%) 42 (16.7%) 10 (4.1%) 103.109***
Developed Camping 165 (28.6%) 24 (8.1%) 37 (7.7%) 84 (33.3%) 70 (28.9%) 135.76***
Driving for Pleasure 391 (67.8%) 31 (10.5%) 76 (15.7%) 70 (27.8%) 17 (7%) 535.63***
Fishing 104 (18%) 28 (9.5%) 0 (0%) 145 (57.5%) 241 (99.6%) 991.025***
Gathering Mushrooms etc. 98 (17%) 82 (27.7%) 12 (2.5%) 39 (15.5%) 6 (2.5%) 138.607***
Relaxing 472 (81.8%) 161 (54.4%) 63 (13%) 171 (67.9%) 24 (9.9%) 685.674***
Hiking 473 (82%) 231 (78%) 122 (25.3%) 178 (70.6%) 0 (0%) 724.046***
History 204 (35.4%) 2 (.7%) 6 (1.2%) 3 (1.2%) 0 (0%) 460.15***
Hunting 6 (1%) 4 (1.4%) 34 (7%) 6 (2.4%) 3 (1.2%) 42.098***
Nature Centers 293 (50.8%) 0 (0%) 33 (6.3%) 6 (2.4%) 1 (.4%) 618.203***
Nature Study 148 (25.6%) 13 (4.4%) 3 (.6%) 7 (2.8%) 0 (0%) 273.457***
Non-Motorized Water 22 (3.8%) 0 (0%) 1 (.2%) 8 (3.2%) 0 (0%) 34.924***
Picnicking 220 (38.1%) 6 (2%) 5 (1%) 128 (50.8%) 0 (0%) 507.72***
Primitive Camping 66 (11.4%) 13 (4.4%) 0 (0%) 33 (13.1%) 21 (8.7%) 70.477***
Resorts 54 (9.4%) 9 (3%) 7 (1.4%) 0 (0%) 2 (.8%) 70.666***
Viewing Nature 548 (95%) 213 (72%) 181 (37.5%) 39 (15.5%) 0 (0%) 912.946***
Viewing Wildlife 466 (80.8%) 193 (65.2%) 2 (.4%) 41 (16.3%) 0 (0%) 1029.826***
Notes. * p < 0.05; ** p < 0.01; *** p < 0.001.
Cluster 1: Relaxing in Nature Package; Cluster 2: Backpacking and Hiking Package; Cluster 3: Viewing Nature and Hunting Package;
Cluster 4: Picnicking Package; Cluster 5: Purely Fishing
30
Notes. *p < 0.05; **p < 0.01; ***p < 0.001.
Cluster 1: Relaxing in Nature Package; Cluster 2: Backpacking and Hiking Package; Cluster 3: Viewing Nature and Hunting Package;
Cluster 4: Picnicking Package; Cluster 5: Purely Fishing
Table 4
Primary activity participation by cluster membership.
Activity
Cluster 1
(n=577)
Cluster 2
(n=296)
Cluster 3
(n=483)
Cluster 4
(n=252)
Cluster 5
(n=242)
χ2
Backpacking 20 (3.5%) 86 (29.1%) 4 (.8%) 7 (2.8%) 0 (0%) 312.403***
Biking 6 (1%) 0 (0%) 3 (.6%) 6 (2.4%) 0 (0%) 12.715*
Developed Camping 28 (4.9%) 5 (1.7%) 21 (4.3%) 29 (11.5%) 23 (9.5%) 33.435***
Driving for Pleasure 43 (7.5%) 5 (1.7%) 40 (8.3%) 8 (3.2%) 1 (.4%) 35.701***
Fishing 43 (7.5%) 19 (6.4%) 0 (0%) 82 (32.5%) 213 (88%) 961.191***
Gathering mushrooms, etc. 1 (.2%) 3 (1%) 11 (2.3%) 3 (1.2%) 0 (0%) 14.866***
Relaxing 64 (11.1%) 11 (3.7%) 17 (3.5%) 26 (10.3%) 3 (1.2%) 47.631***
Hiking 146 (25.3%) 107 (36.1%) 69 (14.3%) 21 (8.3%) 0 (0%) 156.492***
History 7 (1.2%) 1 (.3%) 2 (.4%) 0 (0%) 0 (0%) 7.91
Hunting 2 (.3%) 2 (.7%) 32 (6.6%) 4 (1.6%) 3 (1.2%) 54.695***
Nature Centers 1 (.2%) 0 (0%) 14 (2.9%) 0 (0%) 0 (0%) 31.786***
Nature Study 5 (.9%) 0 (0%) 1 (.2%) 0 (0%) 0 (0%) 8.024
Non-Motorized Water 6 (1%) 0 (0%) 5 (1%) 3 (1.2%) 0 (0%) 5.848
Picnicking 23 (4%) 0 (0%) 2 (.4%) 35 (13.9%) 0 (0%) 122.377***
Primitive Camping 9 (1.6%) 1 (.3%) 0 (0%) 12 (4.8%) 3 (1.2%) 31.096***
Resorts 2 (.3%) 0 (0%) 0 (0%) 0 (0%) 0 (0%) 4.417
Viewing Nature 91 (15.8%) 19 (6.4%) 122 (25.3%) 2 (.8%) 0 (0%) 152.1***
Viewing Wildlife 24 (4.2%) 10 (3.4%) 2 (.4%) 0 (0%) 0 (0%) 33.743***
31
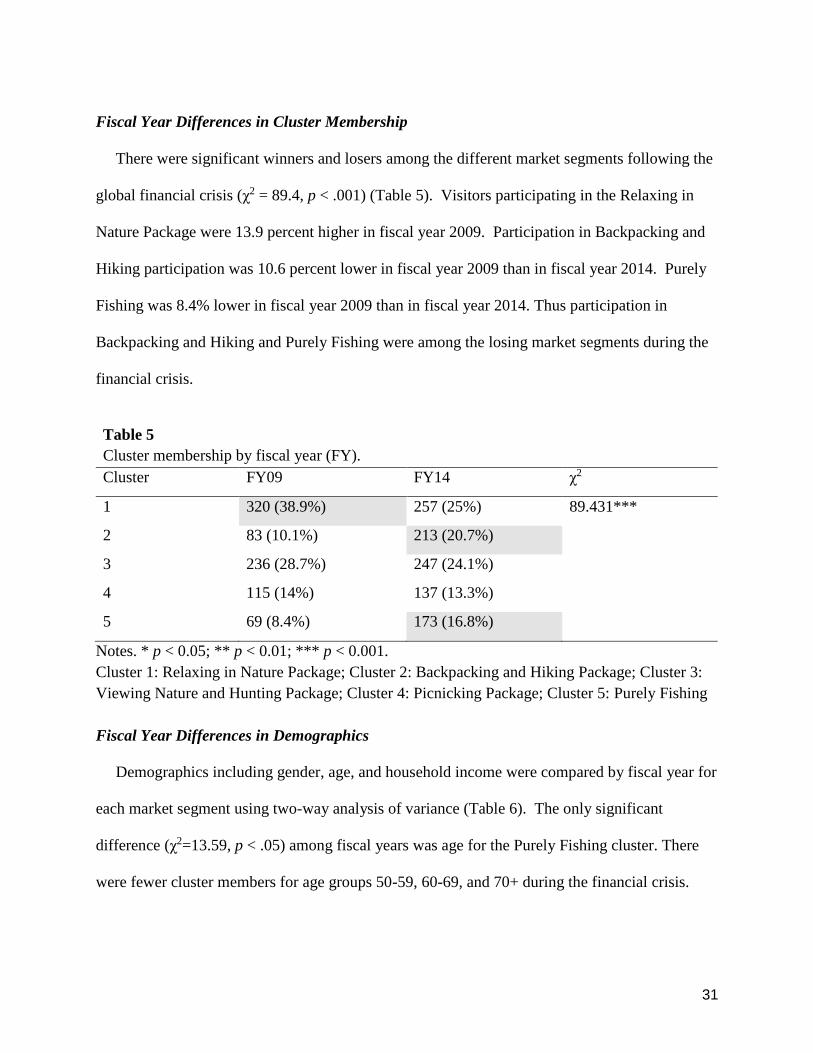
Fiscal Year Differences in Cluster Membership
There were significant winners and losers among the different market segments following the
global financial crisis (χ2 = 89.4, p < .001) (Table 5). Visitors participating in the Relaxing in
Nature Package were 13.9 percent higher in fiscal year 2009. Participation in Backpacking and
Hiking participation was 10.6 percent lower in fiscal year 2009 than in fiscal year 2014. Purely
Fishing was 8.4% lower in fiscal year 2009 than in fiscal year 2014. Thus participation in
Backpacking and Hiking and Purely Fishing were among the losing market segments during the
financial crisis.
Table 5
Cluster membership by fiscal year (FY).
Cluster FY09 FY14 χ2
1 320 (38.9%) 257 (25%) 89.431***
2 83 (10.1%) 213 (20.7%)
3 236 (28.7%) 247 (24.1%)
4 115 (14%) 137 (13.3%)
5 69 (8.4%) 173 (16.8%)
Notes. * p < 0.05; ** p < 0.01; *** p < 0.001.
Cluster 1: Relaxing in Nature Package; Cluster 2: Backpacking and Hiking Package; Cluster 3:
Viewing Nature and Hunting Package; Cluster 4: Picnicking Package; Cluster 5: Purely Fishing
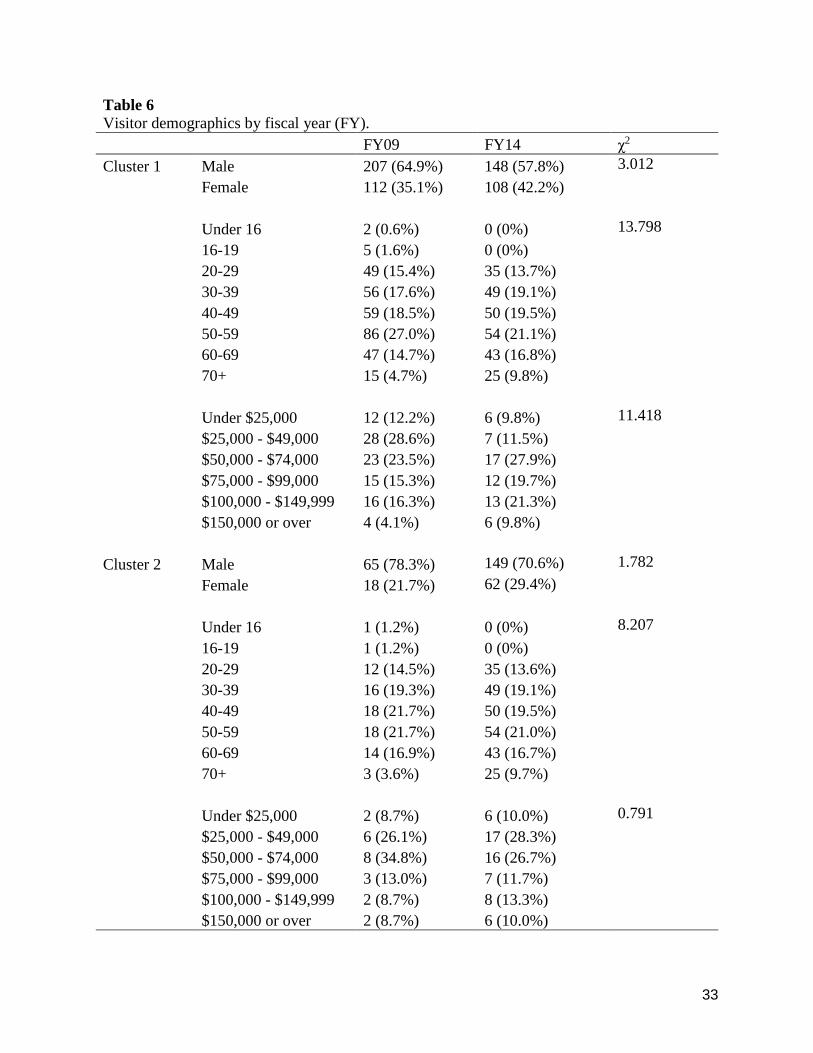
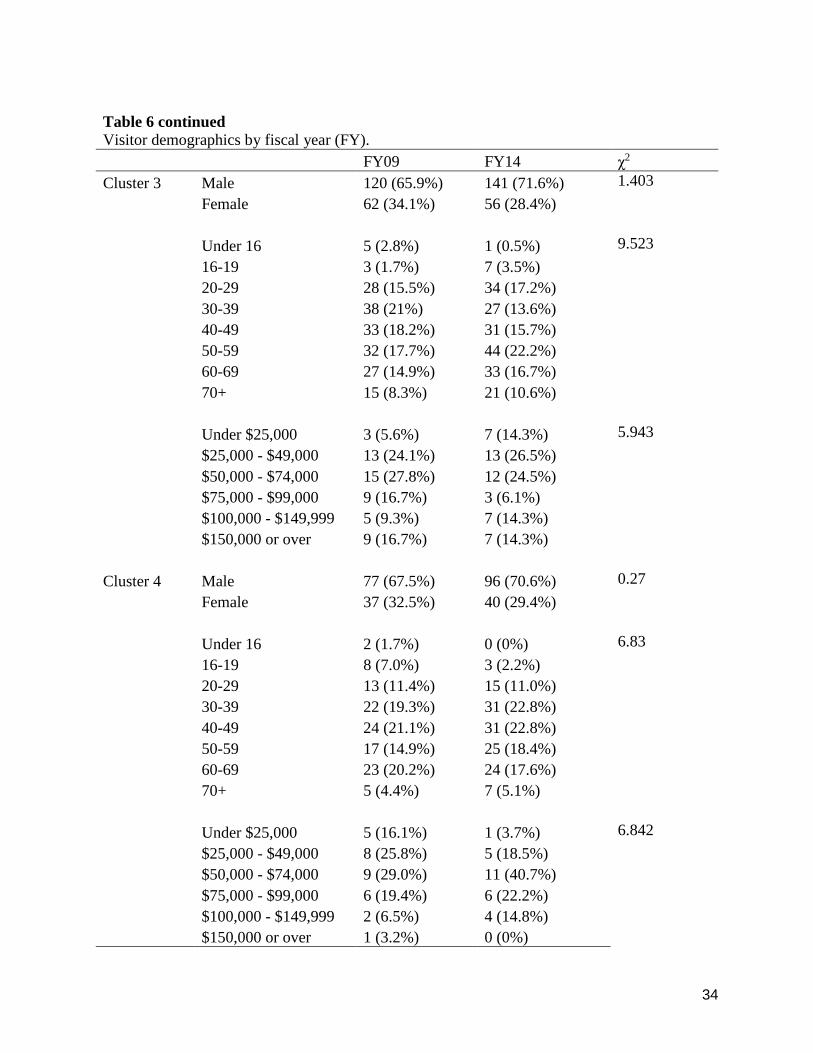
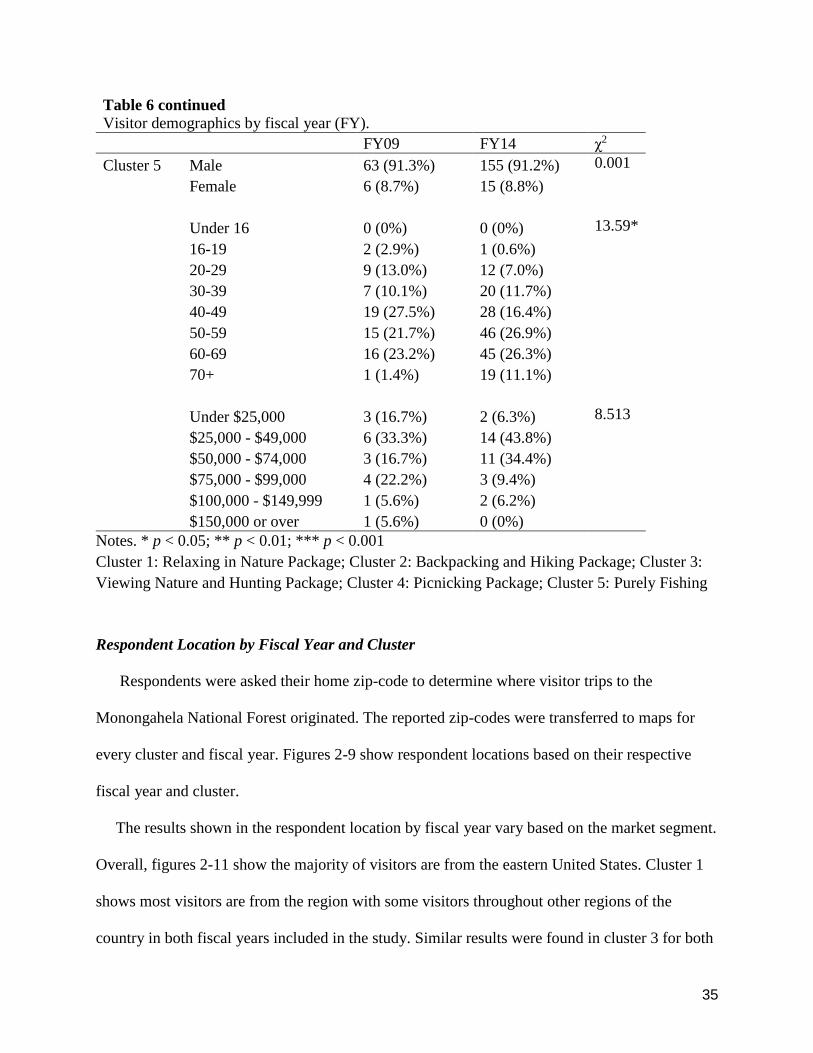
Fiscal Year Differences in Demographics
Demographics including gender, age, and household income were compared by fiscal year for
each market segment using two-way analysis of variance (Table 6). The only significant
difference (χ2=13.59, p < .05) among fiscal years was age for the Purely Fishing cluster. There
were fewer cluster members for age groups 50-59, 60-69, and 70+ during the financial crisis.

32
That is, older anglers may have been unable to participate during fiscal year 2009 due to
financial constraints. See Appendix D for demographic questions.
33
Table 6
Visitor demographics by fiscal year (FY).
FY09 FY14 χ2
Cluster 1 Male 207 (64.9%) 148 (57.8%) 3.012
Female 112 (35.1%) 108 (42.2%)
Under 16 2 (0.6%) 0 (0%) 13.798
16-19 5 (1.6%) 0 (0%)
20-29 49 (15.4%) 35 (13.7%)
30-39 56 (17.6%) 49 (19.1%)
40-49 59 (18.5%) 50 (19.5%)
50-59 86 (27.0%) 54 (21.1%)
60-69 47 (14.7%) 43 (16.8%)
70+ 15 (4.7%) 25 (9.8%)
Under $25,000 12 (12.2%) 6 (9.8%) 11.418
$25,000 - $49,000 28 (28.6%) 7 (11.5%)
$50,000 - $74,000 23 (23.5%) 17 (27.9%)
$75,000 - $99,000 15 (15.3%) 12 (19.7%)
$100,000 - $149,999 16 (16.3%) 13 (21.3%)
$150,000 or over 4 (4.1%) 6 (9.8%)
Cluster 2 Male 65 (78.3%) 149 (70.6%) 1.782
Female 18 (21.7%) 62 (29.4%)
Under 16 1 (1.2%) 0 (0%) 8.207
16-19 1 (1.2%) 0 (0%)
20-29 12 (14.5%) 35 (13.6%)
30-39 16 (19.3%) 49 (19.1%)
40-49 18 (21.7%) 50 (19.5%)
50-59 18 (21.7%) 54 (21.0%)
60-69 14 (16.9%) 43 (16.7%)
70+ 3 (3.6%) 25 (9.7%)
Under $25,000 2 (8.7%) 6 (10.0%) 0.791
$25,000 - $49,000 6 (26.1%) 17 (28.3%)
$50,000 - $74,000 8 (34.8%) 16 (26.7%)
$75,000 - $99,000 3 (13.0%) 7 (11.7%)
$100,000 - $149,999 2 (8.7%) 8 (13.3%)
$150,000 or over 2 (8.7%) 6 (10.0%)
34
Table 6 continued
Visitor demographics by fiscal year (FY).
FY09 FY14 χ2
Cluster 3 Male 120 (65.9%) 141 (71.6%) 1.403
Female 62 (34.1%) 56 (28.4%)
Under 16 5 (2.8%) 1 (0.5%) 9.523
16-19 3 (1.7%) 7 (3.5%)
20-29 28 (15.5%) 34 (17.2%)
30-39 38 (21%) 27 (13.6%)
40-49 33 (18.2%) 31 (15.7%)
50-59 32 (17.7%) 44 (22.2%)
60-69 27 (14.9%) 33 (16.7%)
70+ 15 (8.3%) 21 (10.6%)
Under $25,000 3 (5.6%) 7 (14.3%) 5.943
$25,000 - $49,000 13 (24.1%) 13 (26.5%)
$50,000 - $74,000 15 (27.8%) 12 (24.5%)
$75,000 - $99,000 9 (16.7%) 3 (6.1%)
$100,000 - $149,999 5 (9.3%) 7 (14.3%)
$150,000 or over 9 (16.7%) 7 (14.3%)
Cluster 4 Male 77 (67.5%) 96 (70.6%) 0.27
Female 37 (32.5%) 40 (29.4%)
Under 16 2 (1.7%) 0 (0%) 6.83
16-19 8 (7.0%) 3 (2.2%)
20-29 13 (11.4%) 15 (11.0%)
30-39 22 (19.3%) 31 (22.8%)
40-49 24 (21.1%) 31 (22.8%)
50-59 17 (14.9%) 25 (18.4%)
60-69 23 (20.2%) 24 (17.6%)
70+ 5 (4.4%) 7 (5.1%)
Under $25,000 5 (16.1%) 1 (3.7%) 6.842
$25,000 - $49,000 8 (25.8%) 5 (18.5%)
$50,000 - $74,000 9 (29.0%) 11 (40.7%)
$75,000 - $99,000 6 (19.4%) 6 (22.2%)
$100,000 - $149,999 2 (6.5%) 4 (14.8%)
$150,000 or over 1 (3.2%) 0 (0%)
35
Table 6 continued
Visitor demographics by fiscal year (FY).
FY09 FY14 χ2
Cluster 5 Male 63 (91.3%) 155 (91.2%) 0.001
Female 6 (8.7%) 15 (8.8%)
Under 16 0 (0%) 0 (0%) 13.59*
16-19 2 (2.9%) 1 (0.6%)
20-29 9 (13.0%) 12 (7.0%)
30-39 7 (10.1%) 20 (11.7%)
40-49 19 (27.5%) 28 (16.4%)
50-59 15 (21.7%) 46 (26.9%)
60-69 16 (23.2%) 45 (26.3%)
70+ 1 (1.4%) 19 (11.1%)
Under $25,000 3 (16.7%) 2 (6.3%) 8.513
$25,000 - $49,000 6 (33.3%) 14 (43.8%)
$50,000 - $74,000 3 (16.7%) 11 (34.4%)
$75,000 - $99,000 4 (22.2%) 3 (9.4%)
$100,000 - $149,999 1 (5.6%) 2 (6.2%)
$150,000 or over 1 (5.6%) 0 (0%)
Notes. * p < 0.05; ** p < 0.01; *** p < 0.001
Cluster 1: Relaxing in Nature Package; Cluster 2: Backpacking and Hiking Package; Cluster 3:
Viewing Nature and Hunting Package; Cluster 4: Picnicking Package; Cluster 5: Purely Fishing
Respondent Location by Fiscal Year and Cluster
Respondents were asked their home zip-code to determine where visitor trips to the
Monongahela National Forest originated. The reported zip-codes were transferred to maps for
every cluster and fiscal year. Figures 2-9 show respondent locations based on their respective
fiscal year and cluster.
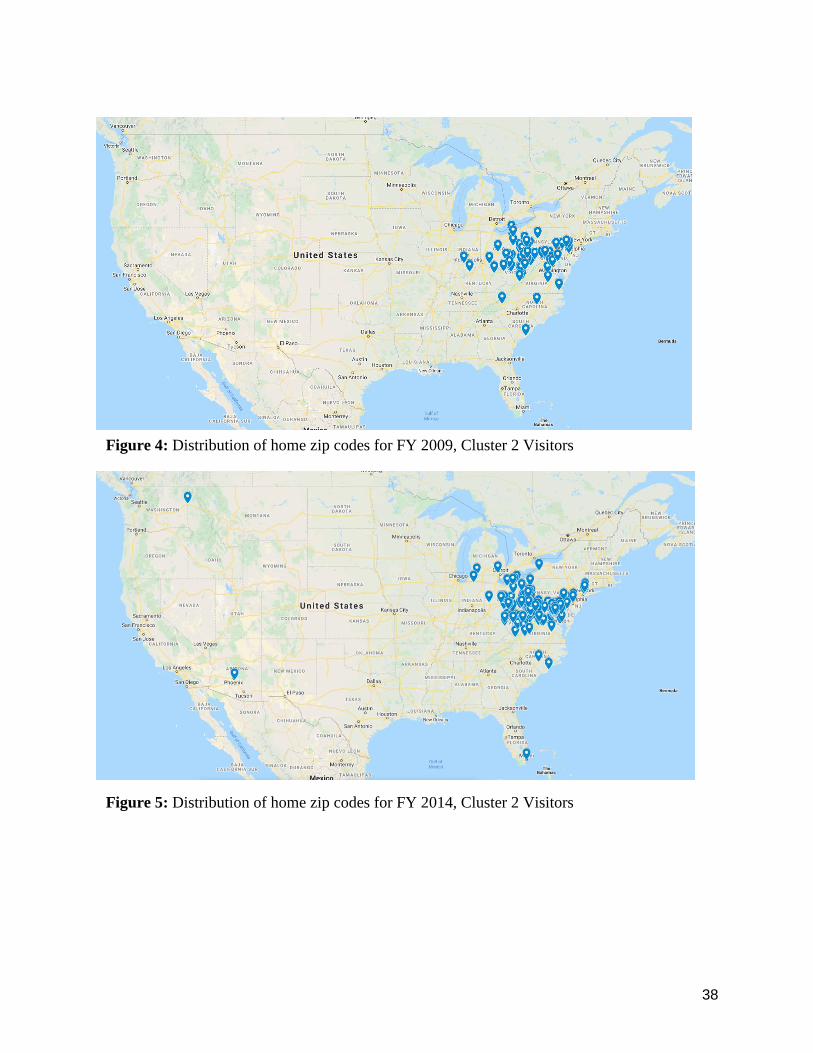
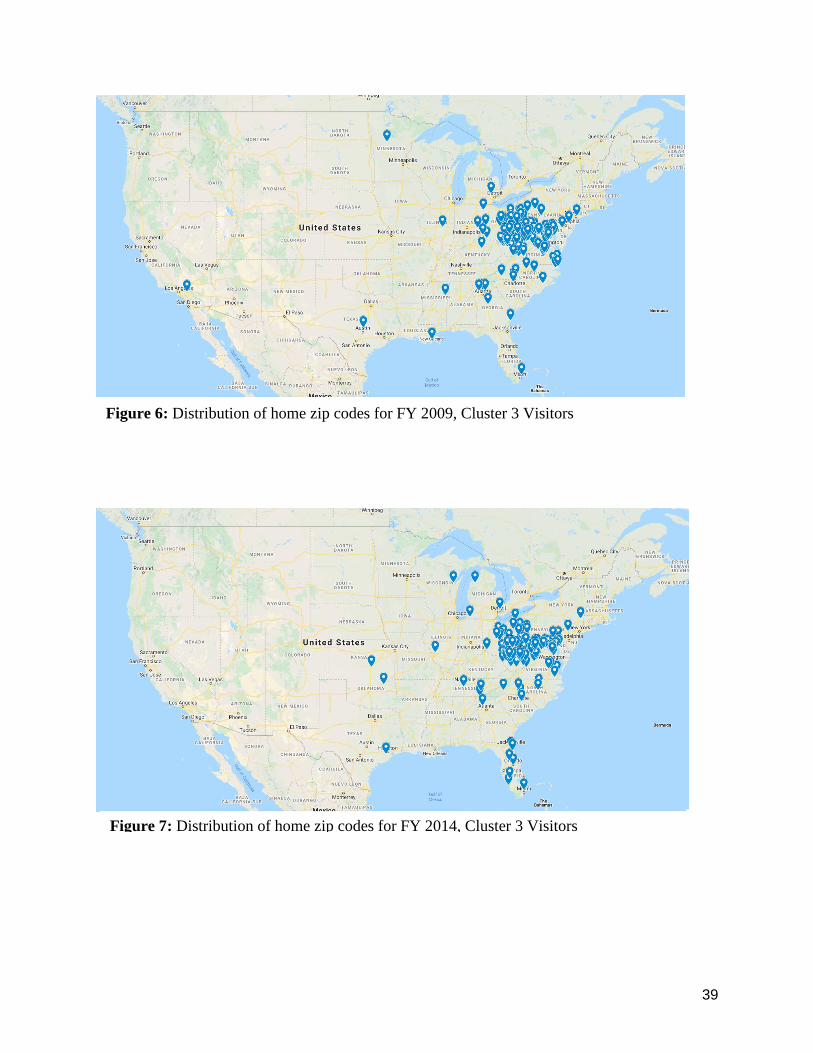
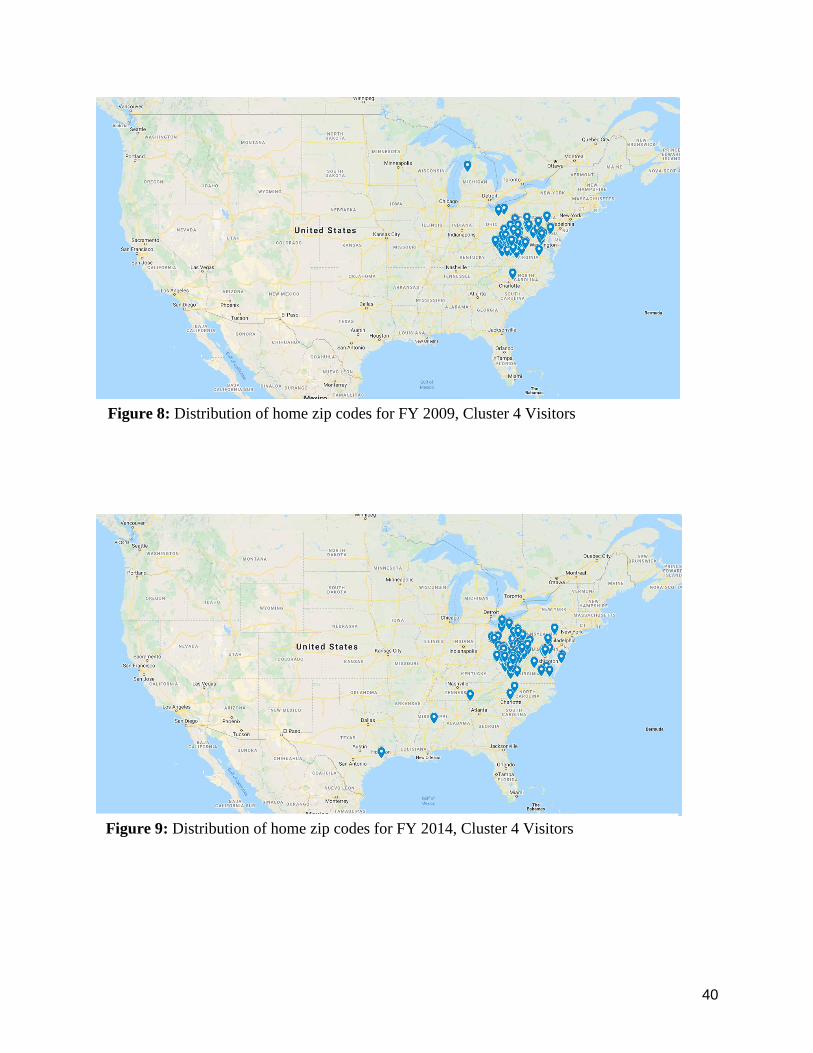
The results shown in the respondent location by fiscal year vary based on the market segment.
Overall, figures 2-11 show the majority of visitors are from the eastern United States. Cluster 1
shows most visitors are from the region with some visitors throughout other regions of the
country in both fiscal years included in the study. Similar results were found in cluster 3 for both

36
fiscal years. Cluster 3 also had a majority of visitors in the region surrounding the forest with
some visitors spread throughout the country. Clusters 2, 4, and 5 were found to have tighter
groupings in visitor zip-codes. Overall, most visitors were shown to be from the general region
around the forest with some outliers in cluster 2, fiscal year 2014.
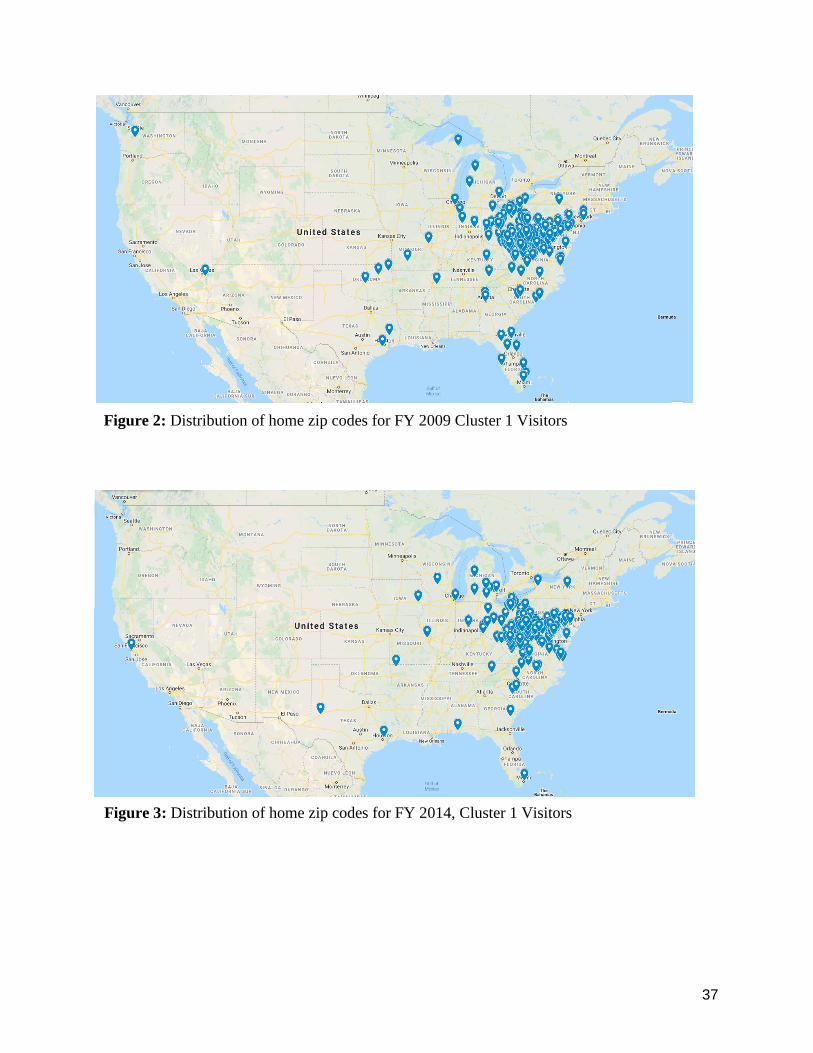
37
Figure 2: Distribution of home zip codes for FY 2009 Cluster 1 Visitors
Figure 3: Distribution of home zip codes for FY 2014, Cluster 1 Visitors
38
Figure 4: Distribution of home zip codes for FY 2009, Cluster 2 Visitors
Figure 5: Distribution of home zip codes for FY 2014, Cluster 2 Visitors
39
Figure 6: Distribution of home zip codes for FY 2009, Cluster 3 Visitors
Figure 7: Distribution of home zip codes for FY 2014, Cluster 3 Visitors
40
Figure 8: Distribution of home zip codes for FY 2009, Cluster 4 Visitors
Figure 9: Distribution of home zip codes for FY 2014, Cluster 4 Visitors
41
Figure 10: Distribution of home zip codes for FY 2009, Cluster 5 Visitors
Figure 11: Distribution of home zip codes for FY 2014, Cluster 5 Visitors
42
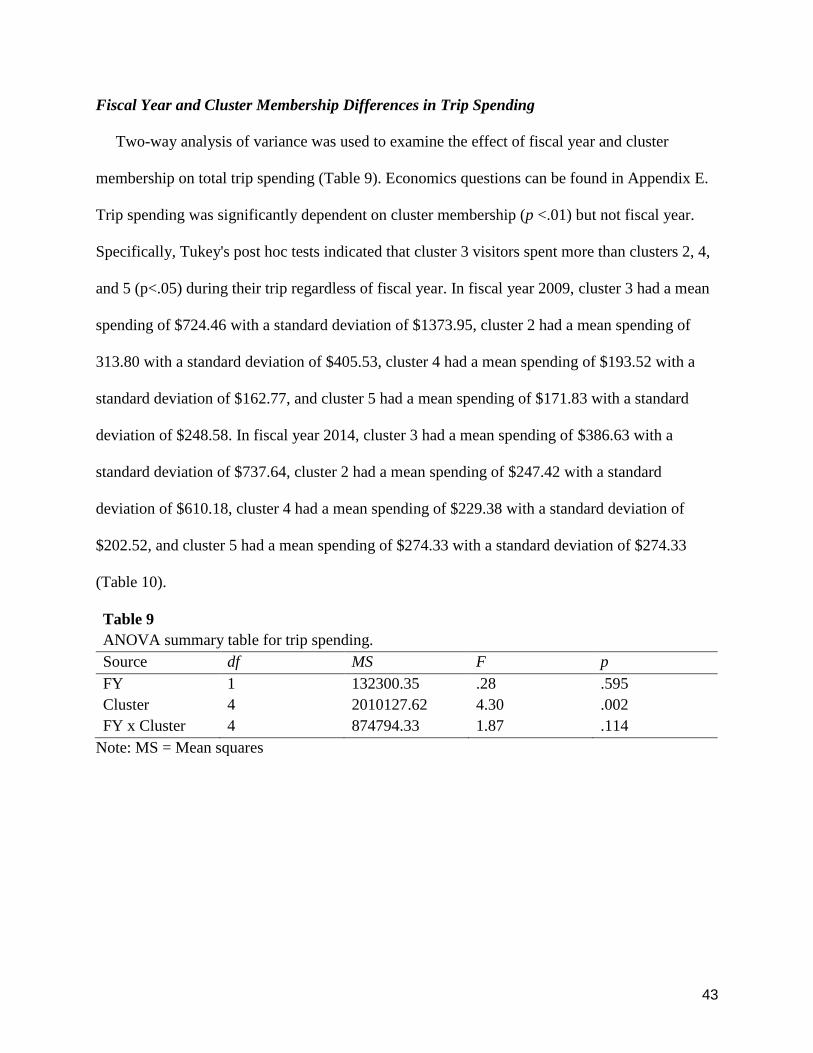
Fiscal Year and Cluster Membership Differences in Travel Distance
Two-way analysis of variance was used to examine differences in travel distance by fiscal
year, cluster membership, and the interaction between the two variables (Table 7), and cluster
membership (p < .001) and interaction effects were significant (p < .05). Tukey's post hoc
comparisons (p<.05) were also examined. Visitors included in cluster 1 traveled farther than
clusters 4 and 5 to get to the Monongahela National Forest, especially in fiscal year 2009 (Table
8). Cluster 2 and 3 visitors traveled farther than cluster 5 visitors.
Table 7
ANOVA summary table for travel distance.
Source df MS F p
FY 1 748553.17 2.59 .108
Cluster 4 2486618.83 8.59 <.001
FY x Cluster 4 735841.05 2.54 .038
Note: MS = Mean Squares
Table 8
Descriptive statistics for travel distance.
FY Cluster Mean (Miles) Std Deviation N
2009 1 344.73 632.32 320
2 426.24 1110.86 83
3 256.21 545.38 182
4 130.51 140.97 115
5 92.97 79.44 69
2014 1 292.71 577.24 256
2 192.16 202.90 212
3 242.33 757.42 198
4 165.40 221.62 136
5 127.97 130.41 171
Note: Cluster 1: Relaxing in Nature Package; Cluster 2: Backpacking and Hiking Package;
Cluster 3: Viewing Nature and Hunting Package; Cluster 4: Picnicking Package; Cluster 5:
Purely Fishing
43
Fiscal Year and Cluster Membership Differences in Trip Spending
Two-way analysis of variance was used to examine the effect of fiscal year and cluster
membership on total trip spending (Table 9). Economics questions can be found in Appendix E.
Trip spending was significantly dependent on cluster membership (p <.01) but not fiscal year.
Specifically, Tukey's post hoc tests indicated that cluster 3 visitors spent more than clusters 2, 4,
and 5 (p<.05) during their trip regardless of fiscal year. In fiscal year 2009, cluster 3 had a mean
spending of $724.46 with a standard deviation of $1373.95, cluster 2 had a mean spending of
313.80 with a standard deviation of $405.53, cluster 4 had a mean spending of $193.52 with a
standard deviation of $162.77, and cluster 5 had a mean spending of $171.83 with a standard
deviation of $248.58. In fiscal year 2014, cluster 3 had a mean spending of $386.63 with a
standard deviation of $737.64, cluster 2 had a mean spending of $247.42 with a standard
deviation of $610.18, cluster 4 had a mean spending of $229.38 with a standard deviation of
$202.52, and cluster 5 had a mean spending of $274.33 with a standard deviation of $274.33
(Table 10).
Table 9
ANOVA summary table for trip spending.
Source df MS F p
FY 1 132300.35 .28 .595
Cluster 4 2010127.62 4.30 .002
FY x Cluster 4 874794.33 1.87 .114
Note: MS = Mean squares
44
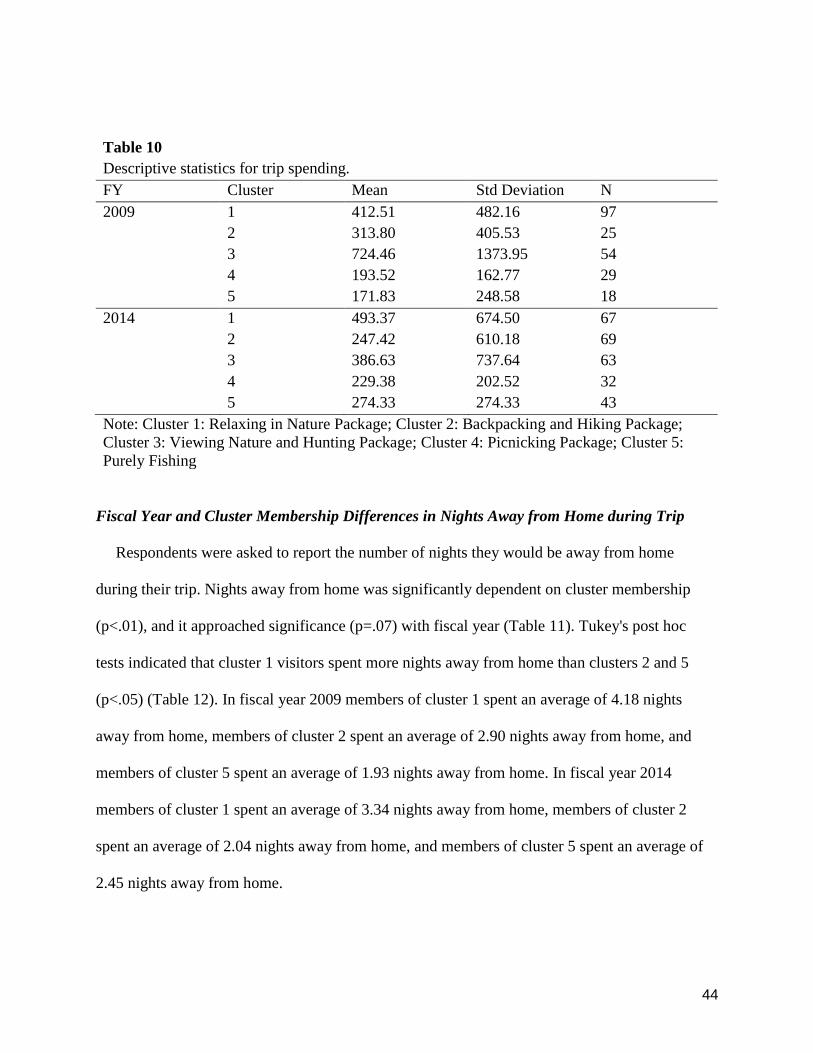
Table 10
Descriptive statistics for trip spending.
FY Cluster Mean Std Deviation N
2009 1 412.51 482.16 97
2 313.80 405.53 25
3 724.46 1373.95 54
4 193.52 162.77 29
5 171.83 248.58 18
2014 1 493.37 674.50 67
2 247.42 610.18 69
3 386.63 737.64 63
4 229.38 202.52 32
5 274.33 274.33 43
Note: Cluster 1: Relaxing in Nature Package; Cluster 2: Backpacking and Hiking Package;
Cluster 3: Viewing Nature and Hunting Package; Cluster 4: Picnicking Package; Cluster 5:
Purely Fishing
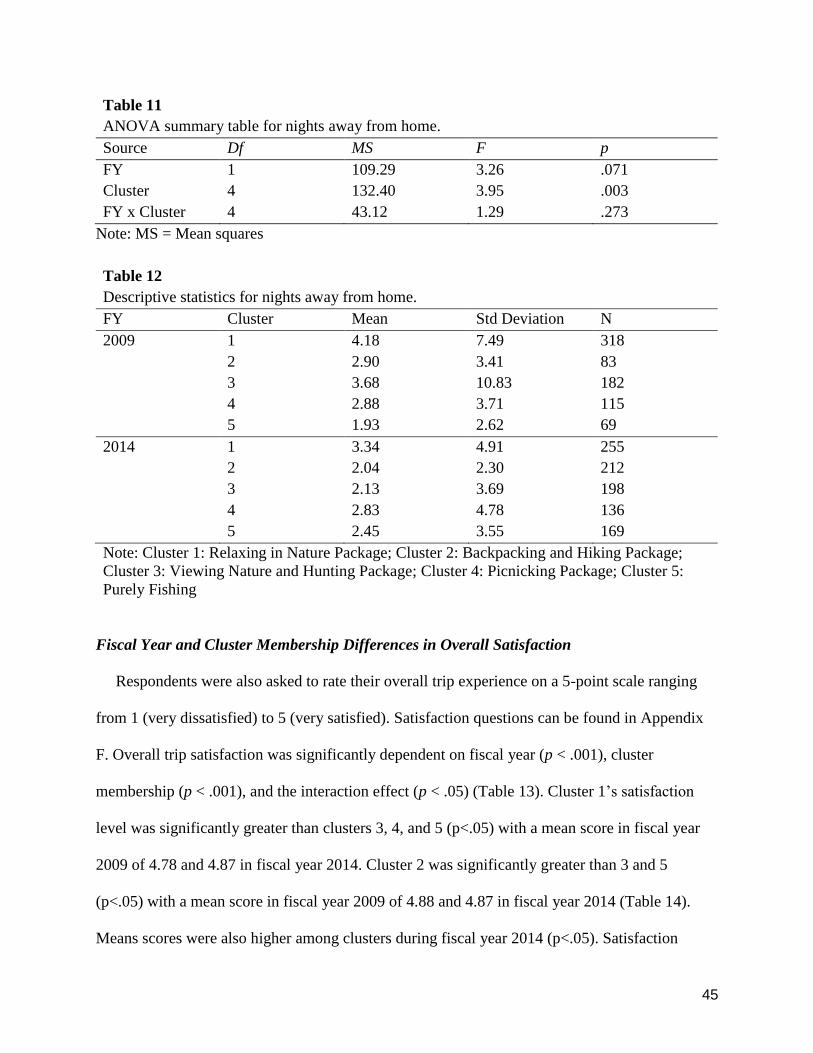
Fiscal Year and Cluster Membership Differences in Nights Away from Home during Trip
Respondents were asked to report the number of nights they would be away from home
during their trip. Nights away from home was significantly dependent on cluster membership
(p<.01), and it approached significance (p=.07) with fiscal year (Table 11). Tukey's post hoc
tests indicated that cluster 1 visitors spent more nights away from home than clusters 2 and 5
(p<.05) (Table 12). In fiscal year 2009 members of cluster 1 spent an average of 4.18 nights
away from home, members of cluster 2 spent an average of 2.90 nights away from home, and
members of cluster 5 spent an average of 1.93 nights away from home. In fiscal year 2014
members of cluster 1 spent an average of 3.34 nights away from home, members of cluster 2
spent an average of 2.04 nights away from home, and members of cluster 5 spent an average of
2.45 nights away from home.
45
Table 11
ANOVA summary table for nights away from home.
Source Df MS F p
FY 1 109.29 3.26 .071
Cluster 4 132.40 3.95 .003
FY x Cluster 4 43.12 1.29 .273
Note: MS = Mean squares
Table 12
Descriptive statistics for nights away from home.
FY Cluster Mean Std Deviation N
2009 1 4.18 7.49 318
2 2.90 3.41 83
3 3.68 10.83 182
4 2.88 3.71 115
5 1.93 2.62 69
2014 1 3.34 4.91 255
2 2.04 2.30 212
3 2.13 3.69 198
4 2.83 4.78 136
5 2.45 3.55 169
Note: Cluster 1: Relaxing in Nature Package; Cluster 2: Backpacking and Hiking Package;
Cluster 3: Viewing Nature and Hunting Package; Cluster 4: Picnicking Package; Cluster 5:
Purely Fishing
Fiscal Year and Cluster Membership Differences in Overall Satisfaction
Respondents were also asked to rate their overall trip experience on a 5-point scale ranging
from 1 (very dissatisfied) to 5 (very satisfied). Satisfaction questions can be found in Appendix
F. Overall trip satisfaction was significantly dependent on fiscal year (p < .001), cluster
membership (p < .001), and the interaction effect (p < .05) (Table 13). Cluster 1’s satisfaction
level was significantly greater than clusters 3, 4, and 5 (p<.05) with a mean score in fiscal year
2009 of 4.78 and 4.87 in fiscal year 2014. Cluster 2 was significantly greater than 3 and 5
(p<.05) with a mean score in fiscal year 2009 of 4.88 and 4.87 in fiscal year 2014 (Table 14).
Means scores were also higher among clusters during fiscal year 2014 (p<.05). Satisfaction
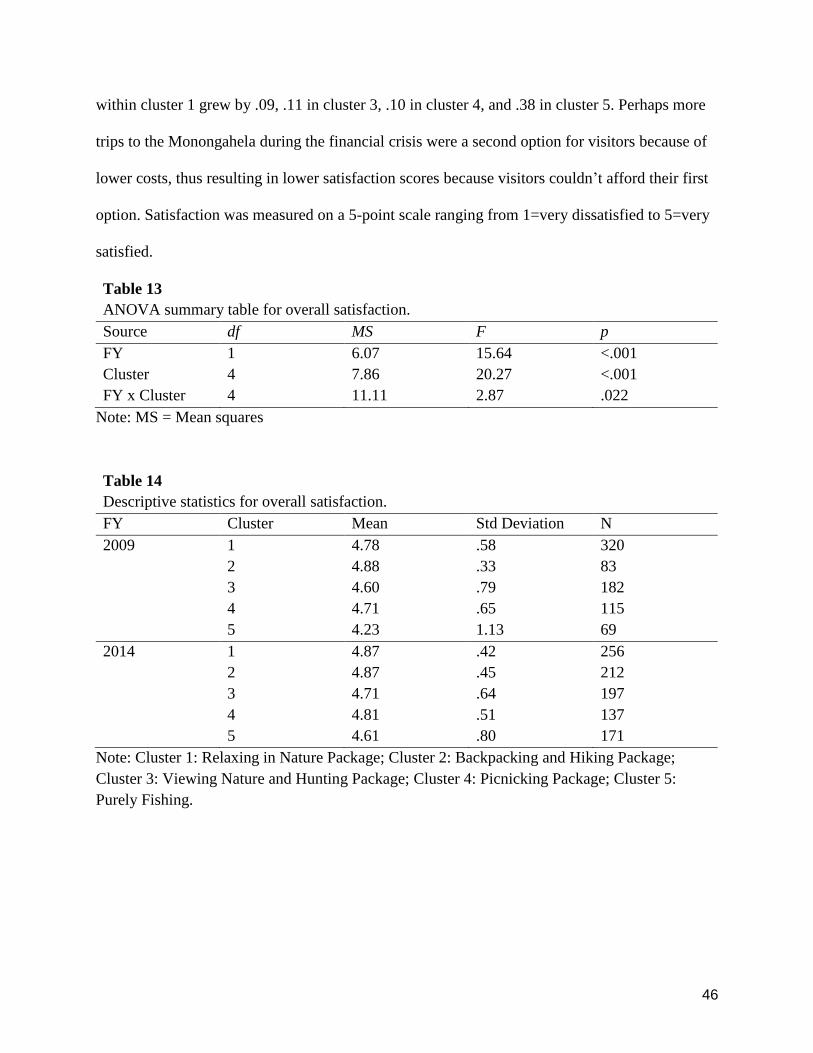
46
within cluster 1 grew by .09, .11 in cluster 3, .10 in cluster 4, and .38 in cluster 5. Perhaps more
trips to the Monongahela during the financial crisis were a second option for visitors because of
lower costs, thus resulting in lower satisfaction scores because visitors couldn’t afford their first
option. Satisfaction was measured on a 5-point scale ranging from 1=very dissatisfied to 5=very
satisfied.
Table 13
ANOVA summary table for overall satisfaction.
Source df MS F p
FY 1 6.07 15.64 <.001
Cluster 4 7.86 20.27 <.001
FY x Cluster 4 11.11 2.87 .022
Note: MS = Mean squares
Table 14
Descriptive statistics for overall satisfaction.
FY Cluster Mean Std Deviation N
2009 1 4.78 .58 320
2 4.88 .33 83
3 4.60 .79 182
4 4.71 .65 115
5 4.23 1.13 69
2014 1 4.87 .42 256
2 4.87 .45 212
3 4.71 .64 197
4 4.81 .51 137
5 4.61 .80 171
Note: Cluster 1: Relaxing in Nature Package; Cluster 2: Backpacking and Hiking Package;
Cluster 3: Viewing Nature and Hunting Package; Cluster 4: Picnicking Package; Cluster 5:
Purely Fishing.
47
5. Discussion
The purpose of this study was to use activity-based segmentation to more closely examine the
impact (both positive and negative) of the 2008-2009 financial crisis on the tourism market of
the Monongahela National Forest. Five market segments were identified based on visitor
participation in 18 outdoor recreation activities. The effect of the global economic downturn was
not ubiquitous across market segments. Within the five market segments identified, some were
winners and some were losers. When assessing winning and losing market segments during the
financial crisis several factors were considered. Factors such as participation, satisfaction, travel
distance, and nights away from home are all considered. This study shows that certain market
segments had higher use levels than others during the 2008-2009 financial crisis than others.
This study included seven research questions. Together, the answers to these research questions
provide important information to the visitor trends on the Monongahela National Forest. A
discussion of each of the five research questions follow below.
Research Question #1
How has recreation participation changed over five years on the Monongahela National
Forest following the world financial crisis in fiscal year 2009?
Over the course of five years, recreation participation has changed in some way in most of the
market segments listed in this study while only a few segments showed little change. Beginning
with cluster 1 (Relaxing in Nature), recreation participation was found to be higher in 2009 than
in 2014 suggesting that the activities associated with the Relaxing in Nature Package were more
preferred during bad economic times. Cluster 2 (Backpacking and Hiking) had significantly
higher participation in fiscal year 2014 than in fiscal year 2009. These results show that
48
recreation activities associated with cluster 2 were more favorable during good economic times.
Recreation participation did not change much in clusters 3 and 4 (Viewing Nature and Hunting,
Picnicking). This means that visitor participation in outdoor recreation activities associated with
both clusters showed little to no effect from good or bad economic times. Cluster 5 (Purely
Fishing) was another cluster that showed significant change over the five-year period. The
participation in the recreational activity of fishing was much higher in fiscal year 2014 than it
was in fiscal year 2009 suggesting that it is a more favorable activity during good economic
times.
Research Question #2
What are the activity-based market segments?
Two-step cluster analysis of 18 activity participation variables (binary "yes" or "no" data)
were conducted with 3 to 5 clusters examined to find the most logical solution for the entire data
set. Based on criteria provided by Weinstein (1987), a five-cluster solution was selected showing
that five activity-based market segments were found to best describe the visitor activity on the
Monongahela National Forest in fiscal years 2009 and 2014. These five clusters are: 1) Relaxing
in Nature Package, 2) Backpacking and Hiking Package, 3) Viewing Nature and Hunting
Package, 4) Picnicking Package, and 5) Purely Fishing.
Research Question #3
For each market segment, was there a difference in visitor demographics between fiscal years
2009 and 2014?
49
Visitor demographics were compared within each market segment to determine if there were
differences within each segment depending on the fiscal year. The specific demographics
compared by fiscal year for each market segment were gender, age, and household income. The
only significant change in demographics involved the Purely Fishing market segment. In the
Purely Fishing Segment, there were fewer cluster members for age groups 50-59, 60-69, and 70+
during the financial crisis. That is, older anglers may have been unable to participate during
fiscal year 2009 due to financial constraints. In fiscal year 2014 participation in Purely Fishing
by visitors aged 70+ grew from 1.4% to 11.1% potentially due to the better economy.
Research Question #4
What are the main and interaction effects of fiscal year and cluster membership on travel
distance, trip expenditures, nights away from home, and overall satisfaction?
Based on the two-way analysis of variance that was used to examine differences in travel
distance by fiscal year, cluster membership, and the interaction between the two variables, the
interaction effects were found to be significant. It was found that visitors of cluster 1 traveled
further than visitors of clusters 4 and 5 to participate in recreation on the Monongahela National
Forest. This was found to be especially true for fiscal year 2009. Clusters 2 and 3 visitors also
traveled further than visitors in cluster 5.
Trip spending was found to be significantly dependent on cluster membership. Cluster 3
visitors spent more than visitors included in clusters 2, 4, and 5 regardless of fiscal year. These
results indicate that good or bad economic times do not play a significant role in the amount of
spending of visitors within each market segment.
50
The amount of nights visitors spent away from home was significantly dependent upon cluster
membership and was approaching significance with fiscal year. This indicates that the amount of
nights visitors spent away from home was dependent upon their market segment with the
possibility of it being effected by the economy.
Overall visitor satisfaction was significantly dependent upon fiscal year, cluster membership,
and the interaction effect. This shows that several factors play a role in the overall satisfaction of
visitors. Visitor satisfaction may be effected by the economy, the market segment, and a
combination of the two.
Research Question #5
Was the “global economic downturn” ubiquitous across all market segments?
This study shows that the effect of the global economic downturn was not ubiquitous across
market segments. Within the five market segments identified, some were winners and some were
losers. The following will provide insight on which market segments were found to be winners
and which market segments were found to be losers.
Market Winner
There are several actions that tourism providers on the Monongahela National Forest can take
during mega events like an economic downturn. The greatest growth potential involves
promoting and attracting visitors that participate in cluster 1 activities: Relaxing in Nature
Package. (The package was 13.9 percent larger in cluster membership during fiscal year 2009).
This market segment made up the largest percent of the tourist population in this study, traveled
farther, spent more nights away from home, and were more satisfied when compared to some
other segments that were examined. What makes this cluster unique are activities such as
viewing nature, hiking, relaxing, viewing wildlife, driving for pleasure, nature centers, history,
51
nature study and staying in resorts, cabins, or other accommodations. Many visitors do not have
the time to participate in a combination of preferred activities on their own (Hsieh, O'Leary, &
Morrison, 1992). Tourism providers can make it more convenient for visitors by offering activity
packages for this target market, especially during an economic downturn. There is a lot of room
for creativity when developing travel packages because this activity set has the largest number of
activities among the clusters that were examined. Nature centers can serve as a hub for these
activity packages given more than half of cluster 1 members visit them during their stay.
Providing overnight accommodation such as resorts and cabins as part of the package may also
be a valid option, especially considering the lengthier trips that are taken.
It is not surprising that Relaxing in Nature Package was more popular during the financial
crisis. As mentioned earlier, the recession was an extremely stressful time for most employees
(Hochwarter, 2009). Perhaps more visitors were seeking the stress reducing benefits of nature
(e.g., relaxing and viewing nature) during their visit to the forest. Although the authors are not
aware of any studies that have documented this increase in nature-seeking activities during a
crisis, this finding does complement the plethora of literature on the mental health benefits of
nature and provides face validity for these results. National Forests may play a critical role in
easing stress during a crisis through relaxing in nature. It is also important to note the low cost of
most activities within the Relaxing in Nature package. Activities such as viewing nature, hiking,
relaxing, and viewing wildlife are typically free of charge. While the economic downturn was
mentally stressful for most people, it was also a very stressful time financially. It is possible that
visitors chose activities related to the Relaxing in Nature package due to the low cost of most
activities because they were struggling financially during the financial crisis. As mentioned
52
before, tourism providers would benefit from the development of activity packages and advertise
the low cost of specific activities to their target market.
Market Losers Cluster 2 visitors (Backpacking and Hiking Package) may have been displaced
during the financial crisis, but they were more satisfied than clusters 3 and 5. This segment
includes a package of activities including hiking, viewing wildlife, and backpacking. The
average visitor in this market traveled much farther during fiscal year 2009, especially when
compared to cluster 5. Visitors in cluster 2 also spent less money than most clusters, especially
clusters 1 and 3. Cluster 2 visitors spent less nights away from home. During the financial crisis,
visitors in this cluster were traveling longer distances to possibly participate in shorter weekend
getaways instead of longer more expensive vacations. Regional marketing may work better for
this segment during a financial crisis that focuses on short inexpensive trips to the Forest.
Cluster 5 visitors (Purely Fishing) also were less likely to visit the forest during the financial
crisis. Nearly all visitors of this cluster participated in fishing. Older anglers were displaced
during fiscal year 2009 perhaps due to financial constraints. The visitors in this cluster were less
satisfied, especially during the financial crisis and they spent less money. Visitors also drove
shorter distances during the crisis. Because visitors are more likely to travel to the forest to
participate in fishing during a strong economy, regional marketing may be a more effective tactic
during strong economic times.
Research Question #6
Are the 5 activity packages proposed by Hendee, Gale, and Cotton (1971) represented on the
Monongahela National Forest?
53
Activity Package Typology
The five clusters identified in this study represent four of the five classes of activity packages
proposed by Hendee, Gale, and Catton (1971) and builds support for their framework. Cluster 1
visitors participated in viewing nature and hiking which would fall under the Appreciative-
Symbolic class. Cluster 1 also demonstrates Passive-Free Play through activities such as relaxing
and driving for pleasure and Sociable-Learning through nature study. Cluster 2 is purely
Appreciative-Symbolic and includes hiking, backpacking, and viewing wildlife. Clusters 3 and 5
are more Extractive-Symbolic and include fishing and hunting activities. Cluster 4, which
includes picnicking, most closely fits within the Passive Free-Play class. The only class that is
not represented in this study is Active-Expressive because no clusters meet the definition of this
class.
Research Question #7
How much activity variety exists within each activity package on the Monongahela National
Forest?
Variety within an Activity Package
Sievänen, Neuronen, and Pouta (2018) examined if involvement in one outdoor activity
reduced participation in other activities, and their starting point was the study of fishers. Their
results suggest that people who are active in one outdoor recreation activity can also be active in
others. In fact, this seems to be true even during a single recreation outing. This study's results
suggest that most recreation on the forest took place as a package, with the exception of anglers.
This finding deserves additional research.
54
Questions about variety within an activity package emerged from this study. The concept of
variety is somewhat different than the concept of behavioral involvement which was defined by
Kim, Scott, and Compton (1997) as "the time and intensity of effort expended in a particular
activity” (Sievänen, Neuronen, & Pouta, 2018, p. 1). Sievänen, Neuronen, & Pouta (2018) define
activity variety as the number of activities represented in an activity package, especially the
number of activities from different package classes. Cluster 1 clearly has the most variety of
activities. In fact, it is the only cluster that falls under three different activity package classes.
Cluster 3 and 5 tend to be more Extractive-Symbolic and have the least activity variety within
the package. It is interesting to note that clusters 3 and 5 also had the lowest overall satisfaction
scores during both fiscal years 2009 and 2014. It is possible that "activities in the same cluster
provide similar satisfactions. Thus, for many people, some of those activities may be
substitutable with little loss of satisfaction (Hendee & Burdge, 1974, p. 106). Clusters 3 and 5
may offer little substitutability making it difficult to deal with the potential effects of crowding
and displacement (Manning, 2011). Future research is needed to better understand the possible
challenges when participating in those pure activity packages.
Conclusion
Five activity clusters describe the range of market segments on the Monongahela National
Forest. That is, all 18 activities were significantly associated with cluster membership (p < .001)
and generally represent the activity package typology. The most significant finding of this study
was identifying the Relaxing in Nature Package (cluster 1) which was more popular during the
financial crisis. Little, if any, research had documented positive impacts of the global economic
downturn on tourism at the local level. However, by examining specific market segments at a
55
smaller scale, the authors were able to identify opportunities for tourism providers during
challenging times. Relaxing in Nature Package may provide the greatest opportunity for growth
given this is the most popular activity package and it includes visitors that tend to spend more
nights than some other clusters of visitors. The Backpacking and Hiking Package (cluster 2) and
the Fishing Package (cluster 5) were both identified as market segments with low opportunity
during bad economic times but some potential during good economic times. Cluster 2 shows
potential during good economic times because of their growth in participation during fiscal year
2014 as well as their higher satisfaction in 2014. Cluster 5 shows potential during good economic
times based on their higher participation in fiscal year 2014.
Many visitors also traveled farther to get to the forest and stayed longer during fiscal year
2009 making regional marketing more important during a financial crisis. This is somewhat
different than what happened in parts of Europe (e.g., Germany) where tourists traveled closer,
shorter, and cheaper (Reinhardt, 2011). This also contradicts Rittichainuwat et al. (2014)
conclusions that tourist seek short-distance destinations during a financial crisis (at least in terms
of driving distance). Although many visitors to the Monongahela National Forest traveled farther
and stayed longer, their trips may have been cheaper than other options such as air
transportation. It is possible that the visitors to the Monongahela National Forest chose a trip to
the forest as their vacation over a more expensive trip to save money during the financial crisis.
This decision would explain the longer stays and further travel distance than what was seen in
other studies such as Reinhardt (2011) and Rittichainuwat et al. (2014).
At the time of this study, we are experiencing a historic event: COVID-19. Even though a
pandemic and a financial crisis are different in many ways, there are similarities. Many people
have either lost their jobs or were out of work for a period of time. This has effected a large
56
majority of people financially. This study has the potential to be used by tourism providers to
better target specific market segments. In 2009 during the financial crisis, specific segments saw
higher participation than others. Future research is needed to fully understand the similarities and
differences between the two events, but the results found in this study provide potential insight
for tourism providers on possible visitor behavior that may occur due to the current pandemic.
Future Research
Future research that utilizes NVUM data or data collected from forests or parks to segment
visitors based on their activity participation could benefit from knowing if five clusters were
adequate when describing the range of markets in this study. This is generally consistent with the
recent literature on activity-based market segmentation where four segments were the average.
Comparing this study's findings with future research as it relates to forest recreation and tourism
is needed and will fill a gap in the literature.
No studies have been published that used fiscal year 2009 NVUM data to examine the impact
of the financial crisis on visitation. Future research should take advantage of this data to see if
the same market winners and losers are identified across the country. This research could also be
compared with US Forest Service data that is scheduled to be collected around the time of the
Coronavirus epidemic. COVID-19 is likely to be different than the 2008-2009 financial crisis
because it also includes a medical crisis wherein demand is influenced by laws that are based on
the emergency state and not just economic reasons. Researchers across the country are currently
exploring the effects of COVID-19 on outdoor recreation. The Leave No Trace Center for
Outdoor Ethics and Pennsylvania State University surveyed over 1000 outdoor recreationalists to
assess the change in recreation. The findings from this study show that recreationalists are going
57
out alone more often, they are staying closer to home, they are changing activities, and
guidelines are directing recreation behaviors (Center for Outdoor Ethics, 2020). These
similarities and differences should be explored, and activity-based segmentation may prove
useful when making those comparisons. Tourism and crises are a never-ending story. This study
will hopefully help both public and private industry tourism providers on the Monongahela
National Forest deal with current and future financial crises.
58
References
Askew, A. E., Bowker, J. M., English, D. B. K., Zarnoch, S. J., & Green, G. T. (2017). A
temporal importance-performance analysis of recreation attributes on National Forests. General
Technical Report SRS-223.
Barić, D., Anić, P., & Bedoya, A. M. (2016). Segmenting protected area visitors by activities: A
case study in Paklenica National Park, Croatia. European Journal of Tourism Research,
13, 103-121.
Beritelli, P., & Boksberger, P. (2005). Activity-based market segmentation: A behavioural
approach. Tourism, 53(3), 259-266.
Boekstein, M. S., & Spencer, J. P. (2013). Activity-based market segmentation of visitors to
thermal spring resorts in the Western Cape Province, South Africa: Assessing the
potential for health tourism development. African Journal for Physical, Health
Education, Recreation and Dance, 19(4:2), 1100-1110.
Center for Outdoor Ethics. (2020) Leave no trace COVID-19 research. Retrieved from
https://lnt.org/research-resources/leave-no-trace-covid-19-research/
Choi, H. S. C., Murraya, I., & Kwana, K. (2011). Activity based segmentation of Canadian
domestic pleasure travelers to New Brunswick. International Journal of Hospitality and
Tourism Administration, 12(3), 202-224. https://doi.org/10.1080/15256480.2011.590736
Choi, W. M., & Tsang, C. K. L. (2000). Activity based segmentation on pleasure travel market
of Hong Kong private housing residents. Journal of Travel & Tourism Marketing,
8(2), 75-97. https://doi.org/10.1300/J073v08n02_06
Coles, T. (2013). Much ado about nothing? Tourism and the financial crisis. In G. Visser and S.
Ferreira (Eds.), Tourism in crisis (pp. 35-52). New York, NY: Routledge.
59
Cooper, C., Fletcher, J., Fyall, A., Gilbert, D., & Wanhill, S. (2005). Tourism principles and
practice (3rd ed). Harlow: Pearson Education.
Eusébio, C., Carneiro, M. J., Kastenholz, E., Figueiredo, E., & da Silva, D. S. (2017). Who is
consuming the country side? An activity-based segmentation analysis of the domestic
rural tourism market in Portugal. Journal of Hospitality and Tourism Management, 31,
197-210. https://doi.org/10.1016/j.jhtm.2016.12.006
Hendee, J., and Burdge, R. (1974). The substitutability concept: Implications for recreation
management and research. Journal of Leisure Research, 6, 157-162.
https://doi.org/10.1080/00222216.1974.11970178
Hendee, J. C., Gale, R. P., & Catton, W. R., Jr. (1971). A typology of outdoor recreation activity
preferences. The Journal of Environmental Education, 3(1), 28-34.
https://doi.org/10.1080/00958964.1971.10801604
Hochwarter, W. (2009, March 12). Families are feeling stress of economic crisis. Science Daily.
Retrieved from www.sciencedaily.com/releases/2009/03/090312115049.htm
Hsieh, S., O'Leary, J. T., & Morrison, A. M. (1992). Segmenting the international travel market
by activity. Tourism Management, 13(2), 209-223.
https://doi.org/10.1016/0261-5177(92)90062-C
Lang, C. T., & O'Leary, J. T. (1997). Motivation, participation, and preference: A multi-
segmentation approach of the Australian nature travel market. Journal of Travel and
Tourism Marketing, 6(3/4), 159-180. https://doi.org/10.1300/J073v06n03_10
Manning, R. E. (2011). Studies in outdoor recreation: Search and research for satisfaction (3rd).
Corvallis, OR: Oregon State University.
60
McCool, S. F. (1978). Recreation activity packages at water-based resources. Leisure Sciences,
1(2), 163-173. https://doi.org/10.1080/01490407809512879
McKercher, B., Ho, P. S. Y., du Cros, H., & So-Ming, B. C. (2002). Activities-based
segmentation of cultural tourism market. Journal of Travel and Tourism Marketing,
12(1), 23-45. https://doi.org/10.1300/J073v12n01_02
Meng, X., Siriwardana, M., Dollery, B., & Mounter, S. (2010). The impact of the 2008 world
financial crisis on tourism and the Singapore economy and policy responses: A CGE
analysis. International Journal of Trade, Economics and Finance, 1(1), 46-53.
Mihalič, T., Kester, J., & Dwyer, L. (2013). Impacts of the global financial crisis on African
tourism: A tourism confidence index analysis. In G. Visser & S. Ferreira (Eds.), Tourism
in crisis (pp. 94-112). New York, NY: Routledge.
Moscardo, G., Pearce, P., Morrison, A., Green, D., & O'Leary, J. T. (2000). Developing a
typology for understanding visiting friends and relatives markets. Journal of Travel
Research, 38(3), 251-259. https://doi.org/10.1177/004728750003800307
Mucci, N., Giorgi, G., Roncaioli, M., Perez, J. F., & Arcangeli, G. (2016). The correlation
between stress and economic crisis: a systematic review. Neuropsychiatric Disease and
Treatment, 12, 983-993.
Mumuni, A. G., & Mansour, M. (2014). Activity-based segmentation of the outbound leisure
tourism market of Saudi Arabia, Journal of Vacation Marketing, 1-14.
https://doi.org/10.1177/1356766714522258
Ordell, K. (2012). Outdoor recreation trends and futures.
61
Pesonen, J. A., & Tuohino, A. (2017). Activity-based market segmentation of rural well-being
tourists: Comparing online information search. Journal of Vacation Marketing, 23(2),
145-158. https://doi.org/10.1177/1356766715610163
Reinhardt, U. (2011). Closer, shorter, cheaper: how sustainable is this trend? In R. Conrady & M.
Buck (Eds.), Trends and issues in global tourism 2011 (pp. 27-36). Berlin/Heidelberg:
Springer.
Riley, C. J., Pierskalla, C. D., Burns, R. C., Maubme, K. C., Graefe, A. R., Smaldone, D. A., &
Williams, S. (2015). Examining OHV user displacement at the Oregon Dunes National
Recreation Area and Sand Lake: A 10-year trend study. Journal of Outdoor Recreation
and Tourism, 9, 44-52. https://doi.org/10.1016/j.jort.2015.04.002
Ritchie, J. R. B., Molinar, C. M. A., & Frechtling, D. C. (2010). Impacts of the world recession
and economic crisis on tourism: North America. Journal of Travel Research, 49, 5-15.
https://doi.org/10.1177/0047287509353193
Rittchainuwat, B. N., Chakraborty, G., & Rattanaphinanchai, S. (2014). Tourists' motivations to
travel during financial crisis. Journal of Quality Assurance in Hospitality & Tourism,
15(1), 100-113. https://doi.org/10.1080/1528008X.2014.855541
Schneider, P. P., Vogt, C., & Smith, S. W. (2006). Segmenting the adventure travel market by
activities: An extension of Sung, Morrison, and O'Leary. 37. Dublin: TTRA (Travel and
Tourism Research Association).
Schroeder, T. D. (1987). Market segmentation for recreation, parks and tourism administration.
Public Administration Series (pp. 1-4), US: Northern Arizona University.
62
Sievänen, J., Neuronen, M., & Pouta, E. (2018). Does involvement in one outdoor activity
reduce participation in other activities: Are enthusiastic fishers only fishers? Journal of
Outdoor Recreation and Tourism, 21, 1-9. https://doi.org/10.1016/j.jort.2017.11.003
Song, H., & Lin, S. (2010). Impacts of the financial and economic crisis on tourism in Asia.
Journal of Travel Research, 49(1), 16-30. https://doi.org/10.1177/0047287509353190
Sung, H. Y., Morrison, A. M., & O'Leary, J. T. (1997). Segmenting the adventure travel market:
From the North American industry providers' perspective. Journal of Travel and Tourism
Marketing, 9(4), 1-20. https://doi.org/10.1300/J073v09n04_01
Tkaczynski, A., Rundle-Thiele, S. R., & Prebensen, N. K. (2015). Segmenting potential nature-
based tourists based on temporal factors: The case of Norway. Journal of Travel
Research, 54(2), 251-265. https://doi.org/10.1177/0047287513514296
Visser, G. & Ferreira, S. (Eds.). (2013). Tourism and Crisis. New York, NY: Routledge.
Weinstein, A. (1987). Market segmentation: Using demographics, psychographics and other
segmentations techniques to uncover and exploit new markets. Chicago: Probes.
https://doi.org/10.1002/dir.4000010410
Wight, P. A. (1996). North American ecotourists: Market profile and trip characteristics. Journal
of Travel Research, 34(2), 2-10. https://doi.org/10.1177/004728759603400401
Williams, D. R. (1988). Measuring perceived similarity among outdoor recreation activities: A
comparison of visual and verbal stimulus presentations. Leisure Sciences, 10(3), 153-
166. https://doi.org/10.1080/01490408809512186
World Travel and Tourism Council (WTTC). (2010). Progress and priorities, 2009-2010.
London: WTTC.

63
Appendices
Appendix A - Section 1: Screening Questions.................................................64
Appendix B - Section 2: National Forest Visit Questions................................65
Appendix C – Section 3: This Trip Away From Home....................................66
Appendix D – Section 4: Demographics..........................................................67
Appendix E – Economics Questions................................................................68
Appendix F – Satisfaction Questions...............................................................69

64
Section 1: Screening Questions
Q1: Would you be willing to take a few minutes to participate in this interview?
Q2. What is your home zip code?
Q3. What is the primary purpose of your visit to ________ (say site name)?
Q4. When do you plan to leave (say site name) for the last time on this visit?
Q5. When did you first arrive at (say site name) on this visit?
Q3a: What is the primary purpose of your visit to this (say NF name) National Forest?
Q3b. What is the major reason you chose this route?
Q4. Today we are interested in interviewing people who have recreated in the undeveloped areas
of this National Forest. This includes things like hiking trails (not in designated Wilderness),
exploring forest roads, fishing and camping in undeveloped areas. Have you recreated in the
undeveloped areas of this Forest sometime during your visit?
Q5. Are you leaving the undeveloped portion of this National Forest for the last time on this
visit?
Q6. In TOTAL, during this visit, how much time will you have spent in the undeveloped areas of
this National Forest?

65
Section 2: National Forest Visit Questions
Q7. Did you spend last night in the (say forest name) National Forest?
Q8. When did you first arrive at this National Forest on this recreation visit?
Q9. When do you plan to finish your visit to this National Forest?
Q10. On this visit to this National Forest, did you go or do you plan to go to any places for
recreation other than this one?
Q10a. Did you enter or do you plan to enter a designated Wilderness at any time during this
National Forest visit?
Q10b. Did you enter any undeveloped areas such as trails, forest roads, lakes/streams, or other
natural areas during this National Forest visit?
Q10c. How many different lodging facilities, such as campgrounds, cabins, hotels or lodges,
have you used or do you plan to use during this National Forest visit?
Q10d. How many different day use sites such as picnic areas, visitor centers, interpretive sites,
swimming areas, or ski areas have you used or plan to use during this National Forest visit?
Q11. In which of the following activities have you participated or will you participate during this
National Forest visit?
Q12. Which ONE of those is your primary activity for this recreation visit on this NF?
Q13. Including this visit, about how many times have you come to this National Forest for
recreation in the past 12 months?
Q14. How many of those visits were to participate in the main activity you identified a moment
ago?
Q15. About how many hours did you spend doing your main activity during this visit?
Q16. Overall, how satisfied or dissatisfied are you with your recreation experience on this
National Forest during this visit, using a scale of 1 to 5, where 1 means very dissatisfied and 5
means very satisfied?

66
Section 3: This Trip Away From Home
Q17. About how far from your home did you travel to get here?
Q18. Which of the following choices best describe the purpose of your trip?
Q19. Are you staying overnight away from home on this trip?
Q20. How many total nights will you be away from home?
Q21. Of these, how many are within 50 miles of here?
Q22. What types of lodging are you using within 50 miles of here?

67
Section 4: Demographics
Q23. How many people (including you) traveled here in the same vehicle as you?
Q24. How many of those people are less than 16 years old?
Q25. Now I would like to collect age and gender information on everyone in your group.
Q26. Are you?
Hispanic or Latino
Not Hispanic or Latino
Refused
Q27. With which racial group(s) do you most closely identify? Select all that apply.
American Indian/Alaska Native
Asian
Black/African American
Native Hawaiian or other Pacific Islander
White
Refused

68
Economics Questions
Q28a. If for some reason you had been unable to go to this National Forest for this visit, would
you have?
Gone somewhere else for the same activity
Gone somewhere else for a different activity
Come back another time
Stayed home
Gone to work at their regular job
None of these
Q28b. About how far away from home is the place you would have gone instead of here?
Q29. Trip Expenditure - Please estimate how much you (and other members of your party) will
spend for your entire trip within 50 miles of here. Please round off to the nearest dollar.
Q30. In total how much did you and other people in your vehicle spend on this entire trip, from
the time you left home until you return home?
Q31. What is your annual household income?

69
Satisfaction Questions
Q28a. The Forest Service wants to make sure they provide recreation opportunities for everyone
including those with disabilities. Does anyone in your group have a disability?
Q28b. Were the facilities or areas you visited accessible?
Q29. We are also interested in what you thought about the number of people who were using this
area for recreation today. Please rate your perception on a scale of 1 to 10, where 1 means there
was hardly anyone else there, and 10 means that you thought the area was very over crowded.
Q30. I would like you to rate your satisfaction with each item on this list, with one meaning very
dissatisfied and five meaning very satisfied. And then rate how important that item is on this
visit, with 1 as very unimportant and 5 as very important.
Q30a. Adequacy of signage on this forest as a whole
Q30b. Signage Importance
Q31a. Condition of roads on this forest as a whole
Q31b. Road condition importance
Q32a. Scenery at this site/area
Q32b. Importance of Scenery
Q33a. Condition of the natural environment
Q33b. Importance of the natural environment condition
Q34a. Available Parking
Q34b. Importance of available parking
Q35a. Parking lot condition
Q35b. Importance of the parking lot condition
Q36a. Cleanliness of restrooms
Q36b. Importance of restroom cleanliness

70
Q37a. Condition of developed recreation facilities
Q37b. Importance of the condition of developed recreation facilities
Q38a. Condition of forest roads
Q38b. Importance of forest road condition
Q39a. Condition of forest trails
Q39b. Importance of forest trail conditions
Q40a. Feeling of safety
Q40b. Importance of feeling safe
Q41a. Helpfulness of employees (not interviewer)
Q41b. Importance of employee helpfulness
Q42a. Availability of interpretive/educational displays, signs and exhibits
Q42b. Importance of interpretive/educational displays, signs and exhibits
Q43a. Value for fee paid (for fee sites only, this question only populates for certain proxy sites)
Q43b. Importance of fee paid value (for fee sites only)
Q44b. Importance of site information availability
Q45a. Adequacy of signage to this site
Q45b. Importance of signage adequacy