Embed Size (px)
Citation preview

THE IMPACT OF THE FINANCIAL CRISIS ON BANK LENDING TO SMES
Econometric Analysis from the UK Survey of SME Finances
JULY 2012
Report Prepared for BIS/ Breedon Review by:
Dr Stuart Fraser
Warwick Business School

The Impact of the Financial Crisis on Bank Lending to SMEs
Acknowledgements I am grateful to Daniel van der Schans (BIS) for comments on an earlier draft of this report which have led to substantial improvements in the final report.
However, the views expressed in this report are those of the author and do not necessarily reflect those of the Breedon Review, BIS or the Government.
UKSMEFs 2008 and 2009 were supported by ESRC grant numbers RES-177-25-0007 and RES: 189-25-0135 respectively.
2

The Impact of the Financial Crisis on Bank Lending to SMEs
Contents Contents............................................................................................................................................ 3
1 Introduction .................................................................................................................................... 4
Background................................................................................................................................... 4
Hypotheses ................................................................................................................................... 5
2 Data and summary analysis........................................................................................................... 7
Data............................................................................................................................................... 7
Summary analysis......................................................................................................................... 8
3 Econometric analysis ................................................................................................................... 32
Background................................................................................................................................. 32
Econometric models.................................................................................................................... 32
Econometric results..................................................................................................................... 33
Rejection rates ........................................................................................................................ 33
Margins ................................................................................................................................... 39
Arrangement fees.................................................................................................................... 45
Collateral requirements ........................................................................................................... 51
Summary..................................................................................................................................... 61
4 Conclusions ................................................................................................................................. 64
3

The Impact of the Financial Crisis on Bank Lending to SMEs
1 Introduction Background
The purpose of this report is to provide empirical evidence on the effects of the recent financial crisis on bank lending to Small and Medium-Sized Enterprises (SMEs) on behalf of the Breedon Review of business finance. The first two years of the financial crisis were characterised by two phases: a liquidity crisis; followed by a more severe insolvency crisis1. Banks were beginning to experience liquidity problems as early as 2007 as they became increasingly unwilling to lend to each other due to rising default rates on sub-prime loans and uncertainty about each other’s exposure to these bad debts. Indeed, the announcement by French bank BNP Paribas on August 9th 2007 that investors could not take money from two of its funds due to a ‘complete evaporation of liquidity’ is often seen as marking the beginning of the financial crisis. A pivotal moment in the first phase of the crisis in the UK was the bail out of Northern Rock by the Bank of England in September 2007 following the biggest run on a UK bank for over a century. Northern Rock had no longer been able to access the markets for the funding it required to finance its loan book.
However, in the next phase of the financial crisis, the liquidity problem became a more severe issue of insolvency as house prices began to fall and the extent of losses on sub-prime loans emerged. The signal event in this phase of the crisis was when Lehman Brothers filed for Chapter 11 Bankruptcy protection on September 15th 2008 after it announced losses of $3.9bn for the second quarter of that year. In the aftermath of Lehman’s collapse money market interest rates rose sharply and there was a virtual freeze in inter-bank lending due to fears that more banks would be allowed to fail2. As a consequence, a principal source of funding for loans to businesses and individuals was no longer available. This led to unprecedented government intervention worldwide to increase liquidity and prevent further collapses of vulnerable banks.
Small businesses, which traditionally rely on bank debt (overdrafts and term loans) for their external financing needs, were particularly at risk from a collapse in bank lending. Indeed, the available evidence from autumn 2008, suggested small businesses were: finding it increasingly difficult to obtain finance; seeing the withdrawal of promised finance; experiencing sharp increases in loan interest rates; and were having facility fees imposed. The reports suggested that even firms with good credit histories were not immune to these problems (see FSB, 20083). Due to falling house prices, and as banks became more risk averse, small business owners also reported finding it harder to obtain loans due to their having insufficient collateral. Countering some of these claims, the British Bankers’ Association (BBA) reported that bank lending to small businesses actually increased in 2008.
4
1 Analysis of the third phase of the financial crisis, i.e., the sovereign debt crisis which began with Dubai in late 2009 and spread to Greece and other Euro-zone countries in 2010, is out-with the scope of this report. 2 3 month LIBOR rates reached a high of 6.3075% on 1st October 2008, over 130 basis points above the Bank of England base rate (source: www.bba.org.uk). 3 FSB (2008), Number Crunching the Credit Crunch, www.fsb.org.uk (23rd October 2008)

The Impact of the Financial Crisis on Bank Lending to SMEs
Survey evidence following the financial crisis from the UK Survey of SME Finance (UKSMEF) seemed to confirm the view that loan rejection rates and the cost of loans, relative to the Bank of England base rate, had increased. In addition, UKSMEF also indicated a higher likelihood of loan rejection due to a lack of collateral. At the same time UKSMEF showed that businesses’ credit ratings were poorer on average following the financial crisis. In other words, banks faced a higher level of credit risk.
In this context, the general aim of this report is to provide further quantitative evidence regarding the impact of the financial crisis on the availability and cost of bank debt to SMEs and collateral requirements on bank debt. This is achieved by conducting econometric analysis of bank debt rejection rates, margins, arrangement fees and collateral requirements using panel data from UKSMEF relating to periods before, during and after the financial crisis. This analysis allows us to examine changes in lending conditions before and after the financial crisis holding the credit risk of businesses constant. In this manner the effects of tighter conditions in the supply of bank debt can be isolated from changes in credit risk. This provides a rigorous empirical context for the Breedon Review’s investigation into alternatives to traditional bank lending for SMEs and mid-sized businesses.
Hypotheses
The specific objective of the analysis is to test whether the periods following the financial crisis in 2007-2009 represent a time of abnormally tight credit supply compared to more normal economic conditions. In this report credit supply relates specifically to bank debt i.e., the supply of overdraft facilities and term loans since these are the principal sources of debt used by small businesses. Following from the previous discussion, it would be anticipated that the effects of the financial crisis on bank lending were more severe in 2008-2009 (phase 2: insolvency crisis) compared to 2007-2008 (phase 1: liquidity crisis). In contrast the period leading up to the start of the crisis i.e., 2005-2007 arguably represents a period of abnormally loose credit supply. During this period the boom in lending and house prices reached their respective peaks.4,5 2001-2004 is used as the reference point for this analysis as it is a period in the data before the credit market peaked.6 In this context, the econometric analysis tests the following hypotheses:
Rejection rates
1. Firms which applied for bank debt in 2007-2008 and 2008-2009, were more likely to be rejected than firms with the same level of risk who applied for bank debt in 2001-2004.
5
4 In fact, small business lending statistics indicate that bank lending continued to rise in 2007-2008 (www.bba.org.uk). However, analysis in Fraser (2009), whilst concurring with this finding, indicated that the beneficiaries of increased lending were mainly low risk businesses. This suggests that banks were already tightening their lending criteria by 2007-2008. Another indication of this tightening on the supply side is the withdrawal from the market in 2008 of 100% plus LTV mortgage products. These products were readily available before the financial crisis. 5The house price boom peaked in early 2006 in the US and in October 2007 in the UK. 6 Although the credit boom was already underway in 2001-2004, this period is more ‘normal’ than 2005-2007 in the sense that the credit market was further away from its peak.

The Impact of the Financial Crisis on Bank Lending to SMEs
2. Firms which applied for bank debt in 2005-2007, were less likely to be rejected than firms with the same level of risk who applied for bank debt in 2001-2004, potentially suggesting a boom in the availability of credit compared to more normal times.
Margins
3. Firms which used bank debt in 2007-2008 and 2008-2009, paid higher margins than firms with the same level of risk who used bank debt in 2001-2004.
4. Firms which used bank debt in 2005-2007, paid lower margins than firms with the same level of risk who applied for bank debt in 2001-2004.
Arrangement fees
5. Firms which used bank debt in 2007-2008 and 2008-2009, paid higher arrangement fees than firms with the same level of risk who used bank debt in 2001-2004.
6. Firms which used bank debt in 2005-2007, paid lower arrangement fees than firms with the same level of risk who applied for bank debt in 2001-2004,
Collateral
7. Firms which applied for bank debt in 2007-2008 and 2008-2009, were more likely to be required to provide collateral than firms with the same level of risk who applied for bank debt in 2001-2004.
8. Firms which applied for bank debt in 2005-2007, were less likely to be required to provide collateral than firms with the same level of risk who applied for bank debt in 2001-2004.
Collateral ratio (collateral offered as a proportion of loan amount)
9. Firms which applied for bank loans in 2007-2008 and 2008-2009, provided more collateral as a proportion of the loan amount than firms with the same level of risk who applied for bank loans in 2001-2004.
10. Firms which applied for bank loans in 2005-2007, provided less collateral as a proportion of the loan amount than firms with the same level of risk who applied for bank loans in 2001-2004.
The remainder of this report is structured as follows. A discussion of the data and summary analysis is contained in chapter 2. A brief description of the methodology and the results of the econometric analysis are reported in chapter 3. Chapter 4 concludes by reviewing the evidence for and against the above hypotheses.
6
The Impact of the Financial Crisis on Bank Lending to SMEs
2 Data and summary analysis
Data
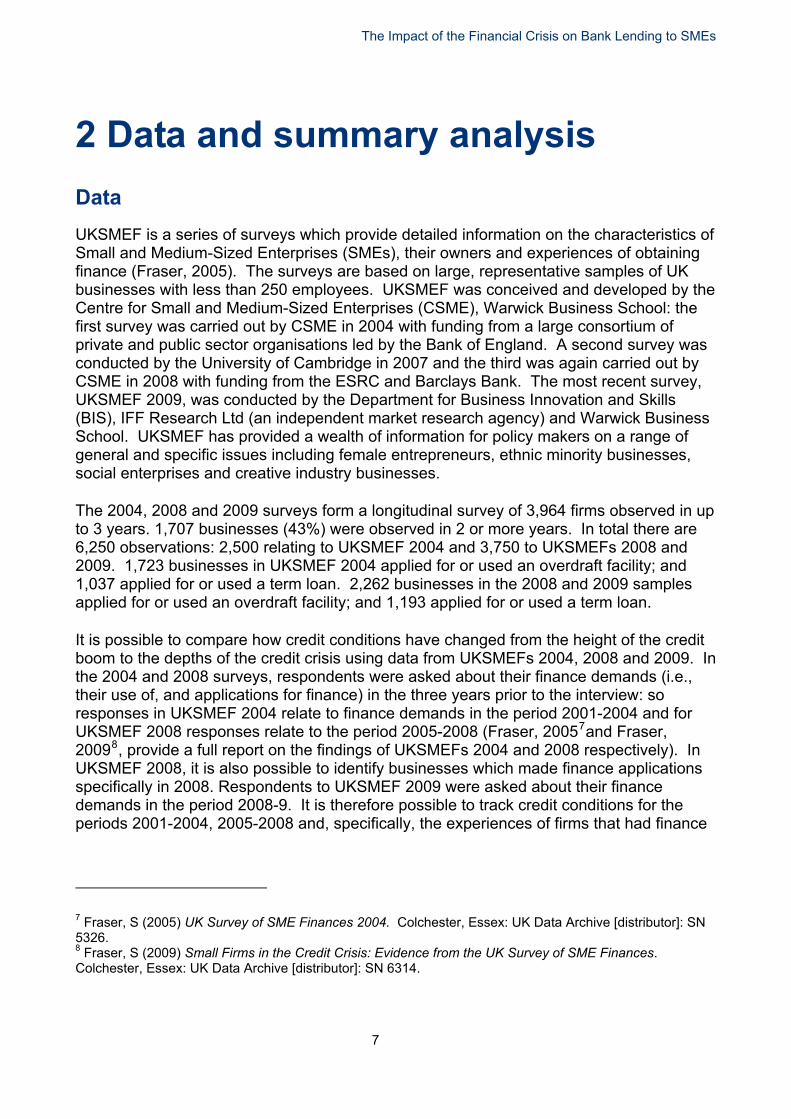
UKSMEF is a series of surveys which provide detailed information on the characteristics of Small and Medium-Sized Enterprises (SMEs), their owners and experiences of obtaining finance (Fraser, 2005). The surveys are based on large, representative samples of UK businesses with less than 250 employees. UKSMEF was conceived and developed by the Centre for Small and Medium-Sized Enterprises (CSME), Warwick Business School: the first survey was carried out by CSME in 2004 with funding from a large consortium of private and public sector organisations led by the Bank of England. A second survey was conducted by the University of Cambridge in 2007 and the third was again carried out by CSME in 2008 with funding from the ESRC and Barclays Bank. The most recent survey, UKSMEF 2009, was conducted by the Department for Business Innovation and Skills (BIS), IFF Research Ltd (an independent market research agency) and Warwick Business School. UKSMEF has provided a wealth of information for policy makers on a range of general and specific issues including female entrepreneurs, ethnic minority businesses, social enterprises and creative industry businesses.
The 2004, 2008 and 2009 surveys form a longitudinal survey of 3,964 firms observed in up to 3 years. 1,707 businesses (43%) were observed in 2 or more years. In total there are 6,250 observations: 2,500 relating to UKSMEF 2004 and 3,750 to UKSMEFs 2008 and 2009. 1,723 businesses in UKSMEF 2004 applied for or used an overdraft facility; and 1,037 applied for or used a term loan. 2,262 businesses in the 2008 and 2009 samples applied for or used an overdraft facility; and 1,193 applied for or used a term loan.
7
ly). In
It is possible to compare how credit conditions have changed from the height of the credit boom to the depths of the credit crisis using data from UKSMEFs 2004, 2008 and 2009. In the 2004 and 2008 surveys, respondents were asked about their finance demands (i.e., their use of, and applications for finance) in the three years prior to the interview: so responses in UKSMEF 2004 relate to finance demands in the period 2001-2004 and for UKSMEF 2008 responses relate to the period 2005-2008 (Fraser, 20057and Fraser, 20098, provide a full report on the findings of UKSMEFs 2004 and 2008 respectiveUKSMEF 2008, it is also possible to identify businesses which made finance applications specifically in 2008. Respondents to UKSMEF 2009 were asked about their finance demands in the period 2008-9. It is therefore possible to track credit conditions for the periods 2001-2004, 2005-2008 and, specifically, the experiences of firms that had finance
7 Fraser, S (2005) UK Survey of SME Finances 2004. Colchester, Essex: UK Data Archive [distributor]: SN 5326. 8 Fraser, S (2009) Small Firms in the Credit Crisis: Evidence from the UK Survey of SME Finances. Colchester, Essex: UK Data Archive [distributor]: SN 6314.

The Impact of the Financial Crisis on Bank Lending to SMEs
demands in 2008 and 20099. Analysis of differences in credit conditions for the 2008 and 2009 applicants compared with earlier periods, holding business risk constant, provides a measure of the effects of the financial crisis on the supply of credit.
Summary analysis
Before proceeding to the econometric analysis it is informative to look at some broad trends in the data. The charts presented below report proportions/means, relating to bank debt demands, credit ratings, bank debt rejection rates and terms (margins, arrangement fees and collateral requirements) in different periods before and after the financial crisis. The principal sub-periods analysed are: 2001-4 (the period before the peak of the credit boom); 2005-7 (the period in which the credit boom peaked); 2007-8 (phase 1 of the financial crisis) and 2008-9 (phase 2 of the financial crisis).
For term loans, additional analysis of loan terms by the year the loan was originated is also possible. Specifically, differences in loan margins, arrangement fees and collateral requirements for loans originated in each year during the period 2004-9, relative to loans obtained before 2004, are reported. Formal statistical tests of differences in means/proportions in the different sub-periods analysed are presented in tables accompanying the charts.
The summary and econometric analyses report p-values which show the exact level of statistical significance of the reported statistics. Small p-values provide evidence against the null hypotheses (that the difference in means/proportions is zero). Based on conventional significance levels, statistics with p-values of 5% or below (p-value0.05) indicate the statistic is statistically significant (i.e., the null hypothesis is rejected – the statistic is different from zero). Some of the reported statistics are significant at the 10% level but not the 5% level (0.05<p-value≤0.10). These statistics provide weaker evidence against the null hypotheses (there is a bigger chance that the null hypothesis is true). All statistics with p-values bigger than 10% are reported as being statistically insignificant.
It is important also to note that the summary analysis relates only to raw differences in lending conditions before and after the financial crisis. There is no claim here that these differences are due exclusively to tighter credit supply conditions. The econometric analysis presented in the next chapter will introduce extensive controls for business risk which will give a truer indication of the impact of tighter credit supply on bank lending.
8
9Those businesses that had finance demands in 2005-8, but which did not make finance applications specifically in 2008, are identified as having finance demands in the period 2005-7.

The Impact of the Financial Crisis on Bank Lending to SMEs
Bank debt demands
Chart 1: Bank debt demands by sub-period (annualised %)
23.0%
20.7%
17.4%
27.4%
18.3%
13.8%
11.4%10.9%
13.8%
10.8%
0.0%
5.0%
10.0%
15.0%
20.0%
25.0%
30.0%
2001‐4 2005‐8 2005‐7 2007‐8 2008‐9
Overdrafts Term loans
Source: UKSMEF 2004, 2008, 2009
Base: All businesses
9

The Impact of the Financial Crisis on Bank Lending to SMEs
Table 1: Difference in proportions of businesses with bank debt demands (annualised) by sub-period (relative to 2001-4)
% points/100
Sub-period Difference in proportions
p-value
Overdrafts
2005-8
-0.023
0.049
2005-7
-0.056
0.000
2007-8
0.044
0.000
2008-9
-0.047
0.001
Term loans
2005-8
-0.024
0.011
2005-7
-0.029
0.002
2007-8
0
1.000
2008-9
-0.030
0.010
Source: UKSMEF 2004, 2008, 2009
The percentage of businesses with demands for overdraft facilities in 2005-8 fell by 2.3% points relative to businesses with overdraft demands in 2001-4.
Also, the demand for overdraft facilities was 5.6% points lower in 2005-7 compared to 2001-4.
However, the percentage of businesses with overdraft demands in 2007-8 increased by 4.4% points relative to businesses with overdraft demands in 2001-4.
In 2008-9, the demand for overdraft facilities fell again by 4.7% points relative to 2001-4.
The percentage of businesses with term loan demands in 2005-8 fell by 2.4% points relative to businesses with term loan demands in 2001-4.
Also, the demand for term loans was 2.9% points lower in 2005-7 compared to 2001-4.
There was no difference in term loan demands in 2007-8 compared to 2001-4. However, term loan demands fell again by 3% points in 2008-9 relative to 2001-4. Overall, this suggests that loan demands have fallen since 2005-7, although these
demands increased briefly in 2007-8.
10

The Impact of the Financial Crisis on Bank Lending to SMEs
Dun and Bradstreet credit ratings
Chart 2: Dun and Bradstreet credit ratings by year
16.4%
42.1%
31.7%
8.8%
1.0%
9.0%
26.2%
37.3%
11.0%
16.5%
19.1%
27.4%28.4%
11.9%
13.2%
0.0%
5.0%
10.0%
15.0%
20.0%
25.0%
30.0%
35.0%
40.0%
45.0%
Minimal risk Low risk Average risk High risk No risk rating
2004 2008 2009
Source: UKSMEF 2004, 2008, 2009
Base: All businesses
11

The Impact of the Financial Crisis on Bank Lending to SMEs
Table 2: Difference in credit rating proportions by year (relative to 2004)
% points/100
Variable Difference in credit rating proportions
p-value
Risk Rating
Minimal risk
2008
-0.075
0.000
2009
0.024
0.039
Low risk
2008
-0.154
0.000
2009
-0.136
0.000
Average risk
2008
0.056
0.000
2009
-0.034
0.039
High risk
2008
0.023
0.009
2009
0.033
0.003
Source: UKSMEF 2004, 2008, 2009
The percentage of businesses rated as minimal risk decreased by 7.5% points in 2008 compared to 2004 but increased by 2.4% points in 2009 relative to 2004.
There was a decrease of 15.4% points in the percentage of businesses rated as low risk in 2008 relative to 2004; the corresponding decrease in 2009 was 13.6% points.
The percentage of average risk businesses increased by 5.6% points in 2008 but decreased by 3.4% points in 2009.
Finally, there was an increase in the percentage of businesses rated as high risk in both 2008 and 2009 compared to 2004: these increases are 2.3% points and 3.3% points respectively.
Overall this suggests there has been a decrease in the proportion of low risk businesses since 2004 with a corresponding increase in the proportion of high risk businesses.
12

The Impact of the Financial Crisis on Bank Lending to SMEs
Rejection rates
Chart 3: Bank debt rejection rates by sub-period
10.9%
7.6%
15.3%
16.1%
5.4%5.7%
9.0%
1 4.1%
0.0%
2.0%
4.0%
6.0%
8.0%
10.0%
12.0%
14.0%
16.0%
18.0%
Ba nk debt demands in 2 001‐4 Bank debt demands in 2 005‐7 Bank debt demands in 2 007‐8 Bank deb t demands in 2008‐9
Overdrafts T erm loans
Source: UKSMEF 2004, 2008, 2009
Base: Businesses with bank debt
13

The Impact of the Financial Crisis on Bank Lending to SMEs
Table 3: Difference in bank debt rejection rates by sub-period (relative to businesses bank debt demands in 2001-4)
% points/100
Sub-period Difference in bank debt rejection rates
p-value
Overdraft rejection
Overdraft demands in 2005-7 -0.033 0.008
Overdraft demands in 2007-8 0.045 0.002
Overdraft demands in 2008-9 0.053 0.002
Term loan rejection
Loan demands in 2005-7
0.003
0.811
Loan demands in 2007-8
0.036
0.018
Loan demands in 2008-9
0.087
0.000
Source: UKSMEF 2004, 2008, 2009
Overdraft rejection rates decreased by 3.3% points among businesses with overdraft demands in 2005-7 compared to those with overdraft demands in 2001-4.
Compared to 2001-4, overdraft rejection rates were 4.5% points higher among businesses with overdraft demands in 2007-8.
There is a corresponding increase of 5.3% points in the likelihood of rejection among businesses with overdraft demands in 2008-9.
There is no difference in term loan rejection rates among businesses with loan demands in 2005-7 compared to those with loan demands in 2001-4.
However, businesses with loan demands in 2007-8 were 3.6% points more likely to be denied a term loan than those with loan demands in 2001-4.
Also, businesses with loan demands in 2008-9 were 8.7% points more likely to be denied a term loan than those with loan demands in 2001-4.
Overall this analysis indicates that loan rejection rates have increased significantly beginning in 2007-8. These increases seem to be higher in 2008-9 (phase 2 of the financial crisis) than in 2007-8 (phase 1 of the financial crisis).
14

The Impact of the Financial Crisis on Bank Lending to SMEs
Margins
Chart 4: Bank debt margins (% points over base)
1.9
0.60.7
3.6
2.3
1.8
2.0
4.0
0.0
0.5
1.0
1.5
2.0
2.5
3.0
3.5
4.0
4.5
Bank debt demands in 200 1‐4 Bank debt dema nds in 2005‐7 Bank debt demand s in 2007‐8 Bank debt demands in 2008‐9
Overdrafts Term loans
Source: UKSMEF 2004, 2008, 2009
Base: Businesses with bank debt
15

The Impact of the Financial Crisis on Bank Lending to SMEs
Chart 5: Term loan margins (% points over base) by year of loan origination
2.3
2.0 2.0
2.3
2.5
2.7
4.4
0.0
0.5
1.0
1.5
2.0
2.5
3.0
3.5
4.0
4.5
5.0
Before 2004 2004 2005 2006 2007 2008 2009
Loan originated in:
Term loan margins
Source: UKSMEF 2004, 2008, 2009
Base: Businesses with loans
Table 4: Difference in bank debt margins: by sub-period (relative to businesses with bank debt demands in 2001-4); and (term loans only) by year of loan origination (relative to loans originated before 2004).
% points/100
Sub-period Difference in bank debt margins
p-value
Overdraft margin
Overdraft demands in 2005-7 -1.306 0.000
Overdraft demands in 2007-8 -1.238 0.000
Overdraft demands in 2008-9 1.651 0.000
Term loan margin
Loan demands in 2005-7 -0.529 0.000
Loan demands in
-0.298 0.060
16

The Impact of the Financial Crisis on Bank Lending to SMEs
17
% points/100
Sub-period Difference in bank debt margins
p-value
Overdraft margin
2007-8
Loan demands in 2008-9
Loan originated in 2004
Loan originated in 2005
Loan originated in 2006
Loan originated in 2007
Loan originated in 2008
Loan originated in 2009
1.718
-0.230
-0.264
0.008
0.213
0.455
2.117
0.000
0.159
0.207
0.967
0.285
0.029
0.000
Source: UKSMEF 2004, 2008, 2009
Looking at overdraft margins there was a significant decrease of over 130 basis points among businesses with overdraft demands in 2005-7 compared to the margins paid by businesses with overdraft demands in 2001-4.
Similarly, the difference in margins among businesses with overdraft demands in 2007-8, compared to 2001-4, corresponds to a reduction of almost 124 basis points.
However overdraft margins paid by businesses with overdraft demands in 2008-9 were over 165 basis points higher than the margins paid by businesses with overdraft demands in 2001-4.
Looking at term loan margins there was a significant decrease of almost 53 basis points among businesses with loan demands in 2005-7 compared to the margins paid by businesses with loan demands in 2001-4.
There is a smaller decrease of almost 30 basis points among businesses with loan demands in 2007-8 (significant at the 10% level).
However, businesses with loan demands in 2008-9 paid almost 172 basis points more for term loans compared to the margins paid by businesses with loan demands in 2001-4.

The Impact of the Financial Crisis on Bank Lending to SMEs
Analysis of term loans by year of origination indicate that margins on term loans originated in 2008 and 2009 are almost 46 and 212 basis points respectively higher than loans originated before 2004.
Overall, this analysis suggests that loan margins fell in 2005-8 compared to 2001-4 but increased significantly in 2008-9.
Arrangement fees
Chart 6: Arrangement fees (£) (2006 prices) by bank debt demands in sub-periods
665 639
1,285
985
2,161
3,417
3,939 3,945
0
500
1,000
1,500
2,000
2,500
3,000
3,500
4,000
4,500
Bank debt demands in 2001‐4 Bank debt demands in 2005‐7 Bank debt demands in 2007‐8 Bank debt demands in 2008‐9
Overdrafts Term loans
Source: UKSMEF 2004, 2008, 2009
Base: Businesses with bank debt
18

The Impact of the Financial Crisis on Bank Lending to SMEs
Chart 7: Term loan arrangement fees (£) (2006 prices) by year of loan origination
2,789
1,946
4,414
7,280
5,218
8,640
3,868
0
1,000
2,000
3,000
4,000
5,000
6,000
7,000
8,000
9,000
10,000
Before 2004 2004 2005 2006 2007 2008 2009 Loan originated in:
Term loan fees
Source: UKSMEF 2004, 2008, 2009
Base: Businesses with term loans
Table 5: Difference in average bank debt arrangement fees (in 2006 prices): by sub-period (relative to 2001-4); and (term loans only) by year of loan origination (relative to loans originated before 2004).
£
Sub-period Difference in average arrangement fees
p-value
Overdraft fees
Overdraft demands in 2005-7 -26 0.840
Overdraft demands in 2007-8 620 0.000
Overdraft demands in 2008-9 320 0.032
Term loan fees
Loan demands in 2005-7 1,256 0.105
19

The Impact of the Financial Crisis on Bank Lending to SMEs
20
£
Sub-period Difference in average arrangement fees
p-value
Overdraft fees
Loan demands in 2007-8
Loan demands in 2008-9
Loan originated in 2004
Loan originated in 2005
Loan originated in 2006
Loan originated in 2007
Loan originated in 2008
Loan originated in 2009
1,778
1,784
-844
1,624
4,491
2,428
5,851
1,079
0.029
0.155
0.404
0.277
0.033
0.055
0.019
0.551
Source: UKSMEF 2004, 2008, 2009
There is no significant difference in the average overdraft arrangement fee paid by businesses with overdraft demands in 2005-7 compared to 2001-4. However, the average overdraft arrangement fee paid by businesses with overdraft
demands in 2007-8 is £620 greater than the average for 2001-4. The corresponding difference for businesses with overdraft demands in 2008-9 is
£320. The average term loan arrangement fee paid by businesses with loan demands in
2007-8 is £1,778 higher compared to the average fee in 2001-4. Differences in average term loan arrangement fees paid in the other sub-periods,
before and after the start of the financial crisis, are statistically insignificant. Looking at term loan fees by year of loan origination, average fees on loans taken
out in 2007 and 2008 are significantly higher (by approximately £2,400 and £5,900 respectively) than loans originated before 2004.
Overall, there is evidence of an increase in average overdraft arrangement fees in 2007-9. Also average fees on term loans increased in 2007-8.

The Impact of the Financial Crisis on Bank Lending to SMEs
Chart 8: Arrangement fees as a percentage of size by bank debt demands in sub-periods
1.1%
1.3%
1.8%
1.4%
0.9%
1.5%
1.1%
1.7%
0.0%
0.2%
0.4%
0.6%
0.8%
1.0%
1.2%
1.4%
1.6%
1.8%
2.0%
Bank debt demand s in 2001‐4 Bank debt demands in 2005‐7 Bank debt demands in 200 7‐8 Bank debt demands in 2008 ‐9
Overdrafts Term loans
Source: UKSMEF 2004, 2008, 2009
Base: Businesses with bank debt
21

The Impact of the Financial Crisis on Bank Lending to SMEs
Chart 9: Term loan arrangement fees as a percentage of loan size by year of loan origination
0.9%
1.1%
0.8%
1 .8%
1.4%
1.8%
2.0%
0.0%
0.5%
1.0%
1.5%
2.0%
2.5%
Before 2004 2004 2005 2006 2007 2008 2009
Term loan fees
Base: Businesses with term loans
Source: UKSMEF 2004, 2008, 2009
22

The Impact of the Financial Crisis on Bank Lending to SMEs
Table 6: Difference in arrangement fees as a proportion of size: by bank debt demands in sub-periods (relative to 2001-4); and (term loans only) by year of loan origination (relative to loans originated before 2004).
% points/100
Sub-period Difference in relative arrangement fees
p-value
Overdraft fees
Overdrafts demands in 2005-7 0.002 0.099
Overdrafts demands in 2007-8 0.007 0.000
Overdrafts demands in 2008-9 0.003 0.089
Term loan fees
Loan demands in 2005-7 0.006 0.016
Loan demands in 2007-8
0.002
0.361
Loan demands in 2008-9
0.008
0.015
Loan originated in 2004
0.001
0.612
Loan originated in 2005
-0.001
0.843
Loan originated in 2006
0.009
0.020
Loan originated in 2007
0.005
0.172
Loan originated in 2008
0.009
0.005
Loan originated in 2009
0.011
0.033
Source: UKSMEF 2004, 2008, 2009
23

The Impact of the Financial Crisis on Bank Lending to SMEs
Relative to the size of overdraft sought, overdraft arrangement fees are 0.2% points higher among businesses with overdraft demands in 2005-7 compared to fees in 2001-4 (significant at the 10% level).
The corresponding increase in relative overdraft arrangement fees is 0.7% points, among businesses with demands in 2007-8, and 0.3% points among businesses with overdraft demands in 2008-9.
Relative to loan size, term loan arrangement fees are 0.6% points higher among businesses with loan demands in 2005-7 compared to fees in 2001-4.
Also term loan arrangement fees are 0.8% points higher among businesses with loan demands in 2008-9 compared to fees in 2001-4.
Looking at term loan fees relative to loan size by year of loan origination, fees on loans taken out in 2006 are 0.9% points higher compared to loans originated before 2004.
Also, fees on loans originated in 2008 and 2009 are approximately 1% point higher compared to loans originated before 2004.
Overall, there is evidence of an increase in overdraft arrangement fees relative to overdraft facility size since 2005-7. Fees on term loans relative to loan size display more variation over time but appear to have increased since 2008.
24

The Impact of the Financial Crisis on Bank Lending to SMEs
Collateral requirements
Chart 10: Bank debt involving collateral (%)
40.9%
31.9%
40.9%
3 2.7%
4 2.2%
39 .8%40.8%
42.2%
0.0%
5.0%
10.0%
15.0%
20.0%
25.0%
30.0%
35.0%
40.0%
45.0%
Loan demands in 2001‐4 Loan demands in 2005 ‐7 Loan demands in 2007‐8 Loan demands in 2 008‐9
Overdrafts Term loans
Base: Businesses with bank debt
Source: UKSMEF 2004, 2008, 2009
25

The Impact of the Financial Crisis on Bank Lending to SMEs
Chart 11: Term loans involving collateral by year of loan origination (%)
5 4.0%
46.8%
5 0.3%
53.1%
4 9.0%
50.0%
46.3%
42.0%
44.0%
46.0%
48.0%
50.0%
52.0%
54.0%
56.0%
Befo re 2004 2004 20 05 2006 20 07 2008 20 09
Loan origina ted in:
Term lo an collateral
Base: Businesses with loans
Source: UKSMEF 2004, 2008, 2009
26

The Impact of the Financial Crisis on Bank Lending to SMEs
Chart 12: Term loan collateral ratio (value of security/value of term loan)
3.4
2.4
3.2
2.4
0.0
0.5
1.0
1.5
2.0
2.5
3.0
3.5
4.0
Loan demands in 2001‐4 Loan demands in 2005‐7 Loan demands in 2007‐8 Loan demands in 2008‐9
Term loan
Source: UKSMEF 2004, 2008, 2009
Base: Businesses with loans
27

The Impact of the Financial Crisis on Bank Lending to SMEs
Chart 13: Term loan collateral ratio (value of security/value of term loan) by year of loan origination
3.1
2.5
2.2
2.8
3.0
3.1
2.9
0.0
0.5
1.0
1.5
2.0
2.5
3.0
3.5
Befo re 2004 2004 2005 2006 2007 2008 2009
Loan origin ated in:
Term lo an collateral
Base: Businesses with loans
Source: UKSMEF 2004, 2008, 2009
Table 7: Difference in proportions of bank debt involving collateral: by sub-period (relative to 2001-4); and (term loans only) by year of loan origination (relative to loans originated before 2004).
% points/100
Sub-period Difference in proportions of bank debt involving collateral
p-value
Overdraft collateralisation
Overdraft demands in 2005-7 -0.090 0.000
Overdraft demands in 2007-8 0.000 0.993
Overdraft demands in 2008-9 -0.082 0.001
28

The Impact of the Financial Crisis on Bank Lending to SMEs
29
% points/100
Sub-period Difference in p-value proportions of bank debt involving collateral
Term loan collateralisation
Loan demands in 2005-7 -0.024 0.352
Loan demands in 2007-8 -0.015 0.628
Loan demands in 2008-9 0.000 0.997
Loan originated in 2004 -0.072 0.039
Loan originated in 2005 -0.037 0.387
Loan originated in 2006 -0.009 0.840
Loan originated in 2007 -0.050 0.248
Loan originated in 2008 -0.040 0.356
Loan originated in 2009 -0.077 0.218
Source: UKSMEF 2004, 2008, 2009
The percentage of overdrafts which involved collateral decreased by 9% points among businesses with overdraft demands in 2005-7 compared to 2001-4.
Among businesses with overdraft demands in 2007-8, there is no difference in the percentage of overdrafts involving collateral compared to 2001-4.
However, the percentage of overdrafts which involved collateral decreased by 8.2% points among businesses with overdraft demands in 2008-9 compared to 2001-4.
Looking at term loans, there are no differences in the percentage of loans involving collateral in any of the sub-periods relative to 2001-4.
Also, looking at term loans involving collateral by year of origination, there is no evidence that loans originated in 2004-9 are more likely to involve collateral than loans originated before 2004.

The Impact of the Financial Crisis on Bank Lending to SMEs
Indeed, term loans originated in 2004 are 7.2% points less likely to involve collateral than loans originated before 2004.
Overall, there is some evidence that collateral requirements on overdrafts have decreased on average since 2001-4 although there appears to be no change in collateral requirements on term loans.
Table 8: Difference in collateral ratios (term loans only): by sub-period (relative to 2001-4); and by year of loan origination (relative to loans originated before 2004).
% points/100
Sub-period Difference in collateral ratios
p-value
Loan demands in 2005-7 -0.948 0.080
Loan demands in 2007-8 -0.166 0.815
Loan demands in 2008-9 -0.922 0.351
Loan originated in 2004 -0.590 0.407
Loan originated in 2005 -0.893 0.289
Loan originated in 2006 -0.352 0.667
Loan originated in 2007 -0.156 0.860
Loan originated in 2008 0.008 0.993
Loan originated in 2009 -0.201 0.872
Source: UKSMEF 2004, 2008, 2009
There is weak evidence that the average collateral ratio on a term loan fell, by about 95% points, in 2005-7 compared to 2001-4 (significant at the 10% level).
However, there is no evidence of differences in collateral ratios in the other sub-periods.
30
The Impact of the Financial Crisis on Bank Lending to SMEs
Also, looking at term loans by year of origination, there is no evidence that collateral ratios on these loans have changed compared to loans taken out before 2004.
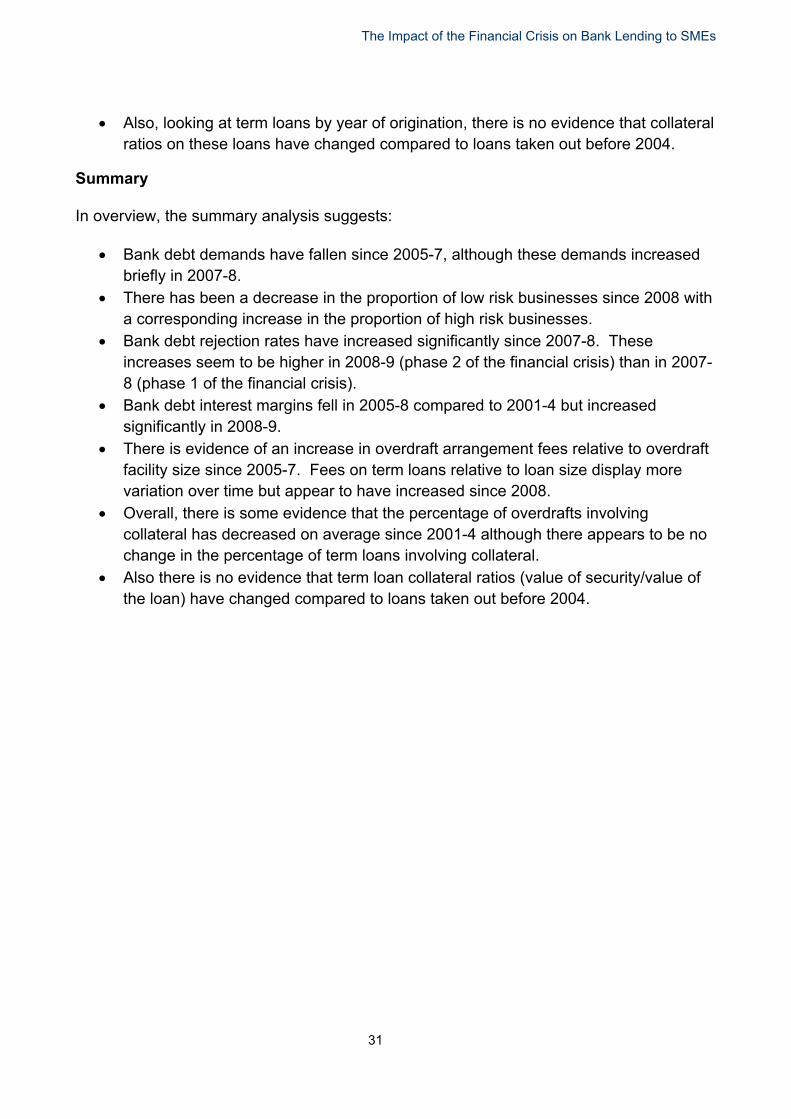
Summary
In overview, the summary analysis suggests:
Bank debt demands have fallen since 2005-7, although these demands increased briefly in 2007-8.
There has been a decrease in the proportion of low risk businesses since 2008 with a corresponding increase in the proportion of high risk businesses.
Bank debt rejection rates have increased significantly since 2007-8. These increases seem to be higher in 2008-9 (phase 2 of the financial crisis) than in 2007-8 (phase 1 of the financial crisis).
Bank debt interest margins fell in 2005-8 compared to 2001-4 but increased significantly in 2008-9.
There is evidence of an increase in overdraft arrangement fees relative to overdraft facility size since 2005-7. Fees on term loans relative to loan size display more variation over time but appear to have increased since 2008.
Overall, there is some evidence that the percentage of overdrafts involving collateral has decreased on average since 2001-4 although there appears to be no change in the percentage of term loans involving collateral.
Also there is no evidence that term loan collateral ratios (value of security/value of the loan) have changed compared to loans taken out before 2004.
31

The Impact of the Financial Crisis on Bank Lending to SMEs
3 Econometric analysis
Background
The purpose of the analysis in this chapter is to test the hypotheses set out in the introduction relating to the effects of the financial crisis on the availability and terms of bank lending. The key estimates in this chapter therefore relate to whether there has been a tightening in bank lending conditions following the financial crisis holding business risk constant. In particular, the analysis compares changes in bank lending conditions in 2007-8 (phase 1 of the financial crisis) and changes in 2008-9 (phase 2 of the financial crisis), both periods relative to lending conditions in 2001-4, with the view to testing whether the tightening in credit conditions was more severe in 2008-9.
In the context of SME lending, banks assessments of risk, and hence decisions whether to lend and on what terms, are made principally on the basis of: the availability of collateral (asset based lending); predictions of the probability of default made using information about the business/owner and/or the management of a business/personal current account (credit and behavioural scoring respectively); and/or ‘soft’ information about the character/ability of the business owner gathered during a relationship between the bank and business(relationship lending).
The risk controls used in the following analysis therefore include: business assets (reflecting the availability of collateral); business and owner characteristics (which are used in credit scoring); financial ratios (again, used in credit scoring); financial delinquency (missed loan repayments, associated with a poor credit score, and unauthorised overdraft borrowing, associated with a poor behavioural score); Dun and Bradstreet risk ratings; and financial relationship variables (length of relationship and number of finance providers). The loan margin, arrangement fee and collateral equations include additional controls for the characteristics of the loan.
Econometric models
The UKSMEF data tracks individual businesses over time: it is a longitudinal/panel data-set. This is useful because it allows us to take into account unobserved firm specific effects (‘entrepreneurial talent’ generally or, specifically in this context, `entrepreneurial risk’) when estimating the models. However, this feature of the models also presents econometric challenges since it means that the assumption of an independent error term, which underlies standard econometric models, is invalid. In particular, these unobserved (random) effects give rise to correlation between the observations for a given business. So, for example, a business may have consistently better access to loans, or consistently benefit from better lending terms, than other businesses with the same observed risk profile due to the lower (unobserved) risk of its owner.
32

The Impact of the Financial Crisis on Bank Lending to SMEs
The models are therefore estimated using suitable panel data estimators which allow for random effects. The specific model used depends on the nature of the dependent variable i.e., whether it is discrete, continuous or censored. In this regard bank finance rejections and incidences of collateralisation are binary variables so it is appropriate to use a random effects probit model; bank finance interest margins are unconstrained continuous variables10 so random effects instrumental variable regressions are used for these equations11; and arrangement fees (as a proportion of loan size) and collateral ratios are non-negative continuous variables with a significant proportion of zeroes in the data implying a random effects tobit model is appropriate in this instance.
Econometric results
The results of the econometric analysis are presented for bank debt rejection rates, margins, arrangement fees and collateral requirements in the following tables. Rejection rates
Table 9: Determinants of the probability of bank debt rejection (marginal effects at sample means)
Explanatory variable Overdrafts (marginal effect and p-value)
Term loans (marginal effect and p-value)
Bank debt demands
Demands in 2005-7
-0.0291 0.036
0.0024 0.874
Demands in 2007-8
0.0283 0.030
0.0454 0.002
Demands in 2008-9
0.0551 0.000
0.0878 0.000
Assets(a)
£10,000 - £49,999
0.0172 0.383
0.0020 0.946
£50,000 - £99,999
0.0012 0.959
-0.0178 0.611
£100,000 - £249,999
-0.0135 0.575
0.0040 0.902
£250,000 - £499,999
-0.0135 0.597
0.0297 0.367
£500,000 - £999,999
-0.0269 0.305
0.0239 0.474
10The loan margins in the sample may take negative values indicating that the borrower is paying less than the base rate.
33
11An instrumental variable regression is used because one of the key explanatory variables, loan size, is endogenous.
The Impact of the Financial Crisis on Bank Lending to SMEs
34
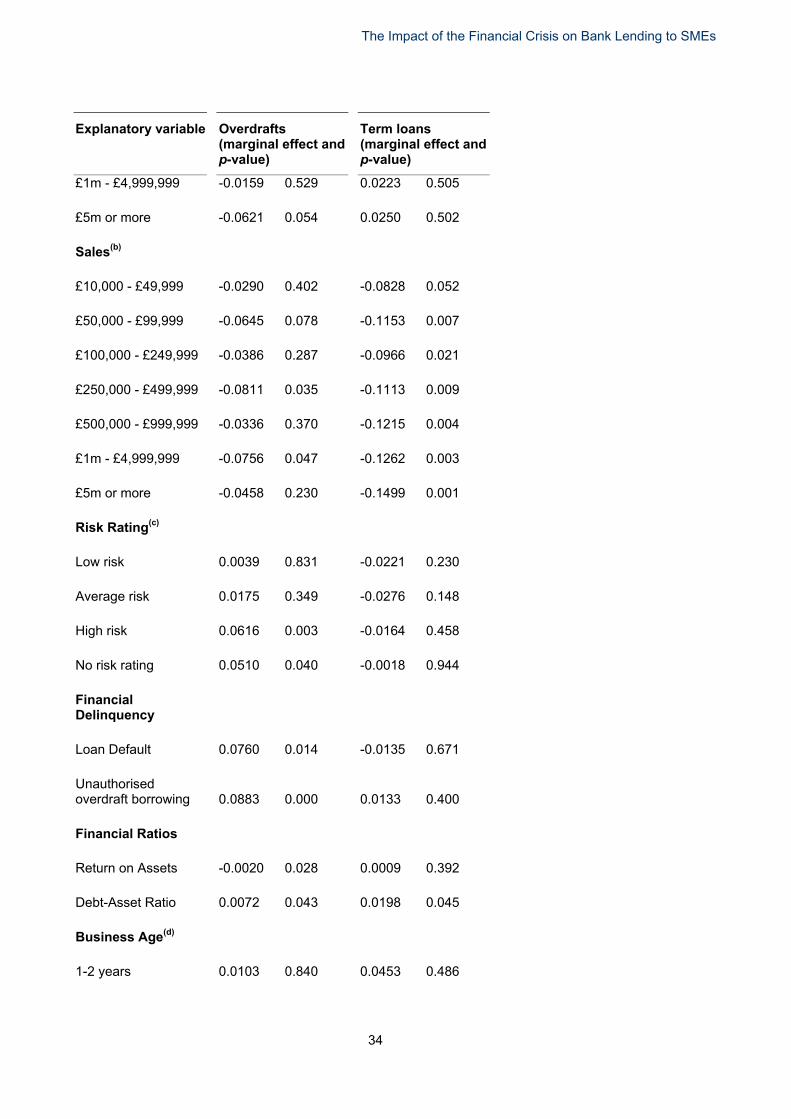
Explanatory variable Overdrafts Term loans (marginal effect and (marginal effect and p-value) p-value)
£1m - £4,999,999 -0.0159 0.529 0.0223 0.505
£5m or more -0.0621 0.054 0.0250 0.502
Sales(b)
£10,000 - £49,999 -0.0290 0.402 -0.0828 0.052
£50,000 - £99,999 -0.0645 0.078 -0.1153 0.007
£100,000 - £249,999 -0.0386 0.287 -0.0966 0.021
£250,000 - £499,999 -0.0811 0.035 -0.1113 0.009
£500,000 - £999,999 -0.0336 0.370 -0.1215 0.004
£1m - £4,999,999 -0.0756 0.047 -0.1262 0.003
£5m or more -0.0458 0.230 -0.1499 0.001
Risk Rating(c)
Low risk 0.0039 0.831 -0.0221 0.230
Average risk 0.0175 0.349 -0.0276 0.148
High risk 0.0616 0.003 -0.0164 0.458
No risk rating 0.0510 0.040 -0.0018 0.944
Financial Delinquency
Loan Default 0.0760 0.014 -0.0135 0.671
Unauthorised overdraft borrowing 0.0883 0.000 0.0133 0.400
Financial Ratios
Return on Assets -0.0020 0.028 0.0009 0.392
Debt-Asset Ratio 0.0072 0.043 0.0198 0.045
(d) Business Age
1-2 years 0.0103 0.840 0.0453 0.486

The Impact of the Financial Crisis on Bank Lending to SMEs
35
Explanatory variable Overdrafts Term loans (marginal effect and (marginal effect and p-value) p-value)
2-3 years -0.0520 0.297 -0.0069 0.915
4-6 years -0.0412 0.402 -0.0047 0.941
7-9 years -0.0406 0.408 -0.0145 0.820
10-15 years -0.0568 0.241 -0.0178 0.778
More than 15 years -0.0660 0.165 -0.0474 0.447
Other business characteristics
Ltd Co 0.0225 0.138 -0.0078 0.622
Partnership 0.0129 0.455 -0.0294 0.122
Limited Liability Partnership 0.0607 0.031 0.0123 0.687
VAT Registered -0.0209 0.242 0.0055 0.788
Number of finance providers
More than one 0.0375 0.001 0.0304 0.012
Length of relationship with
main finance provider(e)
1-3 years 0.0008 0.977 -0.0183 0.450
4-6 years -0.0203 0.496 -0.0465 0.070
7-9 years -0.0318 0.305 -0.0904 0.003
10-15 years -0.0250 0.384 -0.0508 0.040
More than 15 years -0.0667 0.021 -0.0581 0.019
Highest Qualification
Undergraduate degree 0.0026 0.872 -0.0116 0.532
Postgraduate degree -0.0162 0.412 -0.0168 0.443

The Impact of the Financial Crisis on Bank Lending to SMEs
36
Explanatory variable Overdrafts Term loans (marginal effect and (marginal effect and p-value) p-value)
Gender
Female -0.0121 0.397 -0.0125 0.446
(f) Ethnicity
Black African 0.1190 0.002 0.1435 0.001
Black Caribbean 0.0111 0.797 0.0067 0.891
Indian -0.0356 0.298 0.0107 0.715
Pakistani -0.0420 0.333 -0.0257 0.609
Bangladeshi 0.0499 0.266
NT 3,293 1,882
0.000 0.000
Source: UKSMEF 2004, 2008, 2009
(a) Effects are measured relative to businesses with less than £10,000 in assets.
(b) Effects are measured relative to businesses with less than £10,000 in sales.
(c) Effects are measured relative to minimal risk rated businesses
(d) Effects are measured relative to businesses aged less than 1 year.
(e) Effects are measured relative to businesses with financial relationships of less than 1 year.
(f) Effects are measured relative to businesses with a White principal owner.
Additional controls for business sector were included (not reported)
The main effects in Table 9 relate to changes in bank finance rejection rates before and after the financial crisis. These effects show:
Overdrafts
Businesses with overdraft demands in 2005-7 were 2.9% points less likely to experience rejection relative to businesses with overdraft demands in 2001-4.
Businesses with overdraft demands in 2007-8 were 2.8% points more likely to experience rejection relative to businesses with overdraft demands in 2001-4.
Businesses with overdraft demands in 2008-9 were 5.5% points more likely to experience rejection relative to businesses with overdraft demands in 2001-4.
Term loans
There is no statistically significant difference in rejection rates between businesses with loan demands in 2005-7 and those with loan demands in 2001-4.

The Impact of the Financial Crisis on Bank Lending to SMEs
However, businesses with loan demands in 2007-8 were 4.5% points more likely to experience rejection relative to businesses with loan demands in 2001-4.
Also, businesses with loan demands in 2008-9 were 8.8% points more likely to experience rejection relative to businesses with loan demands in 2001-4.
The other determinants of the probability of bank finance rejection are:
Sales
Overdrafts
Businesses which made sales of between £250,000-499,999 were 8.1% points less likely to experience rejection than businesses with sales of less than £10,000.
Businesses which made sales of between £1m-4,999,999 were 7.6% points less likely to experience rejection than businesses with sales of less than £10,000.
Term loans
Businesses which made sales of between £10,000-49,999 were 8.3% points less likely to experience rejection than businesses with sales of less than £10,000.
Businesses which made sales of between £50,000-99,999 were 11.5% points less likely to experience rejection than businesses with sales of less than £10,000.
Businesses which made sales of between £100,000-249,999 were 9.7% points less likely to experience rejection than businesses with sales of less than £10,000.
Businesses which made sales of between £250,000-499,999 were11.1% points less likely to experience rejection than businesses with sales of less than £10,000.
Businesses which made sales of between £500,000-999,999 were 12.2% points less likely to experience rejection than businesses with sales of less than £10,000.
Businesses which made sales of between £1m-4,999,999 were 12.6% points less likely to experience rejection than businesses with sales of less than £10,000.
Businesses which made sales of £5m or more were 15.0% points less likely to experience rejection than businesses with sales of less than £10,000.
Credit ratings
Overdrafts
High risk businesses are 6.2% points more likely to experience rejection than minimal risk businesses.
Businesses with no risk rating are 5.1% points more likely to experience rejection than minimal risk businesses.
Term loans
37
There are no statistically significant effects of risk ratings on the probability of rejection.

The Impact of the Financial Crisis on Bank Lending to SMEs
Financial delinquency
Overdrafts
Businesses which missed 3 or more loan repayments (loan default) are 7.6% points more likely to experience rejection than businesses with no missed loan repayments.
Businesses which exceeded their overdraft limit without authorisation are 8.8% points more likely to experience rejection than businesses with no unauthorised overdraft borrowing.
Term loans
There are no statistically significant effects of financial delinquency on the probability of rejection.
Financial ratios12
Overdrafts
A 10% point increase in the return on assets is associated with a 2% point decrease in the probability of rejection.
A 10% point increase in the debt-asset ratio is associated with a 7% point increase in the probability of rejection.
Term loans
A 10% point increase in the debt-asset ratio is associated with a 19.8% point increase in the probability of rejection.
Number of finance providers
Overdrafts
Businesses with more than one finance provider are 3.8% points more likely to experience rejection than those with only one finance provider.
Term loans
Businesses with more than one finance provider are 3.0% points more likely to experience rejection than those with only one finance provider.
Length of relationship with main finance provider
38
12 The use of financial ratios has a long history in credit analysis. The specific ratios used here relate to the business’s ability to repay its debts (debt-asset ratio) and its profitability (return on assets).

The Impact of the Financial Crisis on Bank Lending to SMEs
Overdrafts
Businesses with relationships of more than 15 years are 6.7% points less likely to experience rejection than businesses with relationships of less than one year.
Term loans
Businesses with relationships of between 7-9 years are 9.0% points less likely to experience rejection than businesses with relationships of less than one year.
Businesses with relationships of between 10-15 years are 5.1% points less likely to experience rejection than businesses with relationships of less than one year.
Businesses with relationships of more than 15 years are 5.8% points less likely to experience rejection than businesses with relationships of less than one year.
Ethnicity
Overdrafts
Businesses with a Black African principal owner are 11.9% points more likely to experience rejection than businesses with a white principal owner.
Term loans
Businesses with a Black African principal owner are 14.4% points more likely to experience rejection than businesses with a white principal owner.
Margins
Table 10: Determinants of bank debt margins (marginal effects)
Explanatory variable Overdrafts (marginal effect and p-value)
Term loans (marginal effect and p-value)
Bank debt demands
Demands in 2005-7
-1.275 0.000
-0.556 0.002
Demands in 2007-8
-1.194 0.000
-0.276 0.178
Demands in 2008-9
1.634 0.000
1.861 0.000
Assets(a)
£10,000 - £49,999
-0.131 0.590
-0.758 0.025
£50,000 - £99,999
-0.599 0.036
-1.012 0.005
39

The Impact of the Financial Crisis on Bank Lending to SMEs
40
Explanatory variable
£100,000 - £249,999
Overdrafts (marginal effect and p-value)
-0.139 0.612
Term loans (marginal effect and p-value)
-1.228 0.000
£250,000 - £499,999
-0.087 0.769
-0.917 0.009
£500,000 - £999,999
-0.132 0.664
-1.075 0.003
£1m - £4,999,999
-0.155 0.656
-0.801 0.080
£5m or more -0.111 0.811 -0.414 0.539
Risk Rating(b)
Low risk 0.009 0.961 0.108 0.601
Average risk
0.055 0.779
0.260 0.240
High risk
0.160 0.498
0.364 0.160
No risk rating
-0.238 0.433
0.842 0.006
Financial Delinquency
Loan Default 1.441 0.004 0.403 0.317
Unauthorised overdraft borrowing 0.529 0.004 0.278 0.153
(c) Business Age
1-2 years
1.447 0.122
1.014 0.225
2-3 years
1.591 0.073
0.982 0.221
4-6 years
0.729 0.401
0.724 0.354
7-9 years
0.924 0.288
0.590 0.445
10-15 years
1.088 0.205
0.512 0.503
More than 15 years
1.176 0.166
0.687 0.361
Other business characteristics
Ltd Co 0.292 0.154 0.207 0.375
Partnership
0.267 0.201
0.183 0.400

The Impact of the Financial Crisis on Bank Lending to SMEs
41
Explanatory variable Overdrafts Term loans (marginal effect and (marginal effect and p-value) p-value)
Limited Liability Partnership 0.163 0.654 -0.041 0.915
VAT Registered -0.183 0.477 -0.505 0.033
Number of finance providers
More than one -0.123 0.316 0.186 0.155
Length of relationship with
main finance provider(d)
1-3 years -0.203 0.639 -0.044 0.911
4-6 years 0.525 0.228 0.326 0.414
7-9 years -0.240 0.592 0.286 0.496
10-15 years 0.188 0.657 0.047 0.903
More than 15 years 0.030 0.943 0.299 0.440
Highest Qualification
Undergraduate degree -0.115 0.543 -0.206 0.302
Postgraduate degree -0.027 0.903 -0.183 0.419
Gender
Female -0.087 0.633 0.026 0.891
(e) Ethnicity
Black African 2.118 0.003 0.968 0.265
Black Caribbean -1.043 0.123 1.345 0.076
Indian 0.006 0.987 -0.777 0.035
Pakistani 0.117 0.822 -1.441 0.023
Bangladeshi -1.230 0.104 0.173 0.803

The Impact of the Financial Crisis on Bank Lending to SMEs
42
Explanatory variable Overdrafts Term loans (marginal effect and (marginal effect and p-value) p-value)
Loan contract terms
Log size of loan -0.368 0.007 -0.397 0.076
Collateral 0.077 0.572 0.311 0.108
Variable interest rate 0.166 0.198
Fixed interest rate -0.322 0.033
NT 2,333 1,351
0.000 0.000
Source: UKSMEF 2004, 2008, 2009
(a) Effects are measured relative to businesses with less than £10,000 in assets.
(b) Effects are measured relative to minimal risk rated businesses
(c) Effects are measured relative to businesses aged less than 1 year.
(d) Effects are measured relative to businesses with financial relationships of less than 1 year.
(e) Effects are measured relative to businesses with a White principal owner.
Additional controls for business sector were included (not reported)
The main effects in Table 10 relating to changes in loan margins before and after the financial crisis show:
Overdrafts
Businesses with overdraft demands in 2005-7 paid margins which were 1.28% points (128 basis points) lower compared to margins paid by businesses with overdraft demands in 2001-4.
Businesses with overdraft demands in 2007-8 paid margins which were 1.19% points lower compared to margins paid by businesses with overdraft demands in 2001-4.
However, businesses with overdraft demands in 2008-9 paid margins which were 1.63% points higher compared to margins paid by businesses with overdraft demands in 2001-4.
Term loans
Businesses with loan demands in 2005-7 paid margins which were 0.56% points (56 basis points) lower compared to margins paid by businesses with loan demands in 2001-4.

The Impact of the Financial Crisis on Bank Lending to SMEs
There is no statistically significant difference in the loan margins paid by businesses with loan demands in 2007-8 compared to margins paid by businesses with loan demands in 2001-4.
However, businesses with loan demands in 2008-9 paid margins which were 1.86% points higher compared to margins paid by businesses with loan demands in 2001-4.
The other determinants of bank debt margins indicate:
Assets
Overdrafts
Businesses with assets of between £50,000-99,999 paid margins which were 0.6% points lower relative to margins paid by businesses with assets of less than £10,000.
Term loans
Businesses with assets of between £10,000-49,999 paid margins which were 0.76% points lower relative to margins paid by businesses with assets of less than £10,000.
Businesses with assets of between £50,000-99,999 paid margins which were 1.01% points lower relative to margins paid by businesses with assets of less than £10,000.
Businesses with assets of between £100,000-249,999 paid margins which were 1.23% points lower relative to margins paid by businesses with assets of less than £10,000.
Businesses with assets of between £250,000-499,999 paid margins which were 0.92% points lower relative to margins paid by businesses with assets of less than £10,000.
Businesses with assets of between £500,000-999,999 paid margins which were 1.08% points lower relative to margins paid by businesses with assets of less than £10,000.
Credit ratings
Overdrafts
There are no statistically significant effects of risk ratings on loan margins.
Term loans
Businesses with no risk rating paid margins which were 0.84% points higher than margins paid by minimal risk businesses.
43

The Impact of the Financial Crisis on Bank Lending to SMEs
Financial delinquency
Overdrafts
Business which missed 3 or more loan repayments (loan default) paid margins which were 1.44% points higher than margins paid by businesses with no missed loan repayments.
Businesses which exceeded their overdraft limit without authorisation paid margins which were 0.53% points higher than margins paid by businesses with no unauthorised overdraft borrowing.
Term loans
There are no statistically significant effects of financial delinquency on loan margins.
Ethnicity
Overdrafts
Businesses with a Black African principal owner paid margins which were 2.12% points higher than margins paid by businesses with a white principal owner.
Term loans
Businesses with an Indian principal owner paid margins which were 0.78% points lower than margins paid by businesses with a white principal owner.
Businesses with a Pakistani principal owner paid margins which were 1.44% points lower than margins paid by businesses with a white principal owner.
Table 11: Differences in term loan margins by year of loan origination (relative to loans originated before 2004) controlling for business/0wner risk profile
Explanatory variable Marginal effect p-value
Loan originated in 2004 -0.157 0.423
Loan originated in 2005 -0.357 0.209
Loan originated in 2006 0.072 0.786
Loan originated in 2007 0.207 0.432
44
The Impact of the Financial Crisis on Bank Lending to SMEs
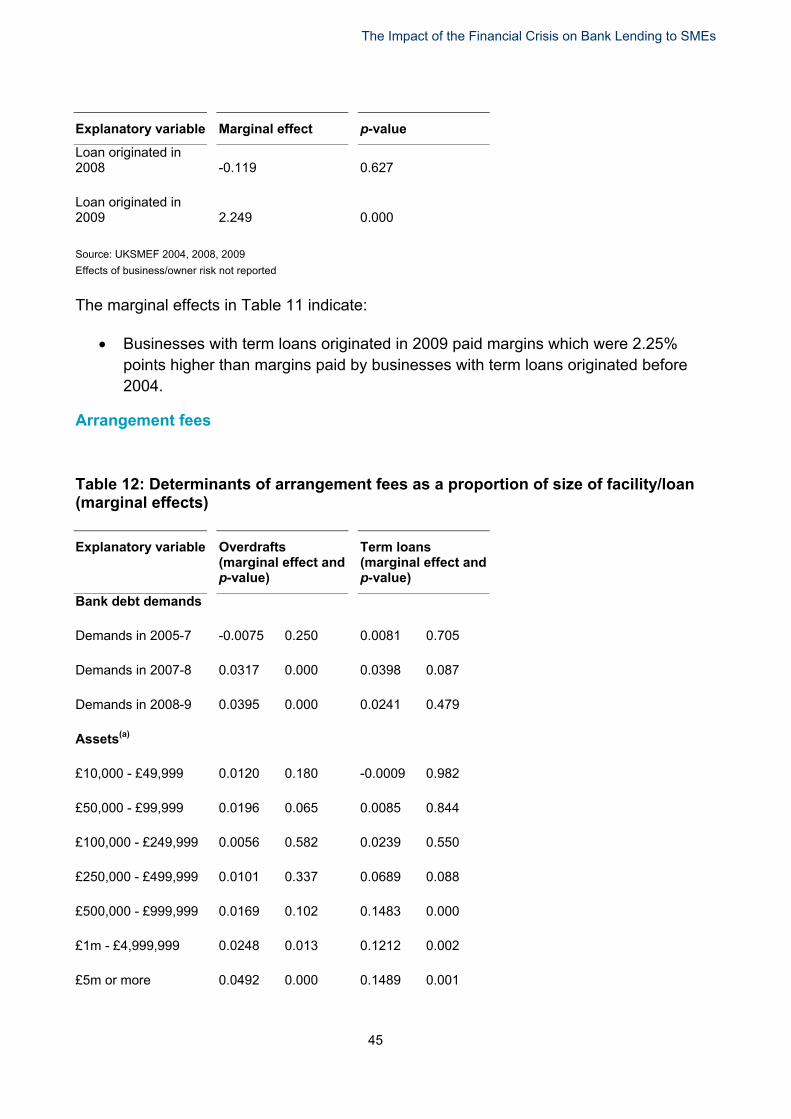
45
Explanatory variable Marginal effect p-value
Loan originated in 2008 -0.119 0.627
Loan originated in 2009 2.249 0.000
Source: UKSMEF 2004, 2008, 2009
Effects of business/owner risk not reported
The marginal effects in Table 11 indicate:
Businesses with term loans originated in 2009 paid margins which were 2.25% points higher than margins paid by businesses with term loans originated before 2004.
Arrangement fees
Table 12: Determinants of arrangement fees as a proportion of size of facility/loan (marginal effects)
Explanatory variable Overdrafts (marginal effect and p-value)
Term loans (marginal effect and p-value)
Bank debt demands
Demands in 2005-7
-0.0075 0.250
0.0081 0.705
Demands in 2007-8
0.0317 0.000
0.0398 0.087
Demands in 2008-9
0.0395 0.000
0.0241 0.479
Assets(a)
£10,000 - £49,999
0.0120 0.180
-0.0009 0.982
£50,000 - £99,999
0.0196 0.065
0.0085 0.844
£100,000 - £249,999
0.0056 0.582
0.0239 0.550
£250,000 - £499,999
0.0101 0.337
0.0689 0.088
£500,000 - £999,999
0.0169 0.102
0.1483 0.000
£1m - £4,999,999
0.0248 0.013
0.1212 0.002
£5m or more
0.0492 0.000
0.1489 0.001

The Impact of the Financial Crisis on Bank Lending to SMEs
46
Explanatory variable Overdrafts (marginal effect and p-value)
Term loans (marginal effect anp-value)
Risk Rating(b)
Low risk 0.0045 0.562 0.0158 0.554
Average risk 0.0136
0.100 0.0344
0.221
High risk 0.0059
0.555 0.0061
0.853
No risk rating 0.0163
0.170 0.0908
0.021
Financial Delinquency
Loan Default 0.0023 0.907 0.0489 0.315
Unauthorised overdraft borrowing -0.0012 0.868 -0.0122 0.628
(c) Business Age
1-2 years -0.0023
0.953 -0.0361
0.716
2-3 years -0.0155
0.667 -0.0325
0.733
4-6 years 0.0018
0.959 0.0507
0.587
7-9 years -0.0033
0.926 -0.0159
0.865
10-15 years 0.0056
0.873 -0.0233
0.800
More than 15 years 0.0049
0.888 0.0076
0.933
Other business characteristics
Ltd Co 0.0237 0.000 0.0510 0.029
Partnership 0.0076
0.330 0.0222
0.399
Limited Liability Partnership 0.0601 0.000 0.0037 0.941
VAT Registered 0.0349
0.000 -0.0227
0.422
Number of finance providers
More than one 0.0021 0.675 0.0092 0.579
d

The Impact of the Financial Crisis on Bank Lending to SMEs
47
Explanatory variable Overdrafts Term loans (marginal effect and (marginal effect and p-value) p-value)
Length of relationship with
main finance provider(d)
1-3 years 0.0329 0.072 0.0534 0.273
4-6 years 0.0270 0.142 -0.0039 0.938
7-9 years 0.0423 0.025 0.0133 0.799
10-15 years 0.0371 0.038 0.0186 0.700
More than 15 years 0.0355 0.045 -0.0296 0.538
Highest Qualification
Undergraduate degree -0.0068 0.371 0.0155 0.539
Postgraduate degree -0.0064 0.486 -0.0389 0.180
Gender
Female 0.0186 0.005 -0.0125 0.597
(e) Ethnicity
Black African -0.0096 0.712 -0.0009 0.994
Black Caribbean -0.0226 0.352 -0.0645 0.511
Indian 0.0028 0.848 -0.0115 0.797
Pakistani 0.0051 0.798 -0.0703 0.358
Bangladeshi -0.0019 0.943 -0.0298 0.692
Loan contract terms
Log size of loan -0.0176 0.000 -0.0531 0.000
Collateral 0.0287 0.000 0.0683 0.000
Variable interest rate 0.0086 0.101
Fixed interest rate -0.0393 0.015

The Impact of the Financial Crisis on Bank Lending to SMEs
48
Explanatory variable Overdrafts Term loans (marginal effect and (marginal effect and p-value) p-value)
NT 2,980 1,363
0.000 0.000
Source: UKSMEF 2004, 2008, 2009
(a) Effects are measured relative to businesses with less than £10,000 in assets.
(b) Effects are measured relative to minimal risk rated businesses
(c) Effects are measured relative to businesses aged less than 1 year.
(d) Effects are measured relative to businesses with financial relationships of less than 1 year.
(e) Effects are measured relative to businesses with a White principal owner.
Additional controls for business sector were included (not reported)
The main effects in Table 12 relating to changes in arrangement fees as a proportion of loan size before and after the financial crisis show:
Overdrafts
Businesses with overdraft demands in 2007-8 paid arrangement fees which were 3.2% points higher compared to arrangement fees paid by businesses with overdraft demands in 2001-4.
Businesses with overdraft demands in 2008-9 paid arrangement fees which were 4.0% points higher compared to arrangement fees paid by businesses with overdraft demands in 2001-4.
Term loans
Businesses with loan demands in 2007-8 paid arrangement fees which were 4.0% points higher compared to arrangement fees paid by businesses with loan demands in 2001-4 (significant at the 10% level).
There are no statistically significant differences in arrangement fees paid by businesses with loan demands in other sub-periods before and after the financial crisis.
The other main determinants of arrangement fees are as follows:
Assets
Overdrafts
Businesses with assets of between £1m-4,999,999 paid arrangement fees which were 2.5% points higher relative to arrangement fees paid by businesses with assets of less than £10,000.

The Impact of the Financial Crisis on Bank Lending to SMEs
Businesses with assets of £5m or more paid arrangement fees which were 4.9% points higher relative to arrangement fees paid by businesses with assets of less than £10,000.
Term loans
Businesses with assets of between £500,000-999,999 paid arrangement fees which were 14.8% points higher relative to arrangement fees paid by businesses with assets of less than £10,000.
Businesses with assets of between £1m-4,999,999 paid arrangement fees which were 12.1% points higher relative to arrangement fees paid by businesses with assets of less than £10,000.
Businesses with assets of £5m or more paid arrangement fees which were 14.9% points higher relative to arrangement fees paid by businesses with assets of less than £10,000.
Credit ratings
Overdrafts
There are no statistically significant effects of risk ratings on arrangement fees.
Term loans
Businesses with no risk rating paid arrangement fees which were 9.1% points higher than arrangement fees paid by minimal risk businesses.
Length of relationship with main finance provider
Overdrafts
Businesses with relationships of between 7-9 years paid arrangement fees which were 4.2% points higher relative to arrangement fees paid by businesses with relationships of less than one year.
Businesses with relationships of between 10-15 years paid arrangement fees which were 3.7% points higher relative to arrangement fees paid by businesses with relationships of less than one year.
Businesses with relationships of more than 15 years paid arrangement fees which were 3.6% points higher relative to arrangement fees paid by businesses with relationships of less than one year.
Term loans
There are no statistically significant differences in arrangement fees paid by businesses with different financial relationship lengths.
49

The Impact of the Financial Crisis on Bank Lending to SMEs
Gender
Overdrafts
Businesses with a female principal owner paid arrangement fees which were 1.9% points higher than arrangement fees paid by businesses with a male principal owner.
Term loans
There are no statistically significant differences in arrangement fees paid by gender.
Table 13: Differences in arrangement fees (divided by loan size) by year of loan origination (relative to loans originated before 2004) controlling for business/0wner risk profile
Explanatory variable Marginal effect p-value
Loan originated in 2004 0.0074 0.765
Loan originated in 2005 0.0109 0.773
Loan originated in 2006 0.0594 0.096
Loan originated in 2007 0.0722 0.033
Loan originated in 2008 0.0024 0.935
Loan originated in 2009 -0.0021 0.961
Source: UKSMEF 2004, 2008, 2009
Effects of business/owner risk not reported
The marginal effects in Table 13 indicate:
Businesses with term loans originated in 2007 paid arrangement fees which were 7.2% points higher than arrangement fees paid by businesses with term loans originated before 2004.
50

The Impact of the Financial Crisis on Bank Lending to SMEs
Collateral requirements
Table 14: Determinants of incidences of collateralisation (marginal effects)
Explanatory variable Overdrafts (marginal effect and p-value)
Term loans (marginal effect and p-value)
Bank debt demands
Demands in 2005-7
-0.0876 0.000
0.0277 0.440
Demands in 2007-8
-0.0219 0.391
-0.0252 0.538
Demands in 2008-9
-0.1136 0.000
-0.0174 0.770
Assets(a)
£10,000 - £49,999
0.0111 0.775
0.1350 0.060
£50,000 - £99,999
0.0480 0.281
0.1926 0.014
£100,000 - £249,999
0.0908 0.029
0.1855 0.010
£250,000 - £499,999
0.0814 0.058
0.1851 0.009
£500,000 - £999,999
0.0741 0.079
0.1090 0.122
£1m - £4,999,999
0.0205 0.614
0.0695 0.309
£5m or more
-0.1036 0.037
0.0383 0.632
Risk Rating(b)
Low risk
0.0798 0.006
0.0221 0.632
Average risk
0.1318 0.000
0.0019 0.970
High risk
0.1892 0.000
0.0401 0.495
No risk rating
0.1444 0.003
0.0043 0.951
Financial Delinquency
Loan Default
0.0155 0.844
-0.0547 0.519
Unauthorised overdraft borrowing 0.0739 0.011 0.0378 0.381
Business Age(c)
1-2 years
0.1064 0.478
-0.2029 0.257
51

The Impact of the Financial Crisis on Bank Lending to SMEs
52
Explanatory variable Overdrafts Term loans (marginal effect and (marginal effect and p-value) p-value)
2-3 years 0.0365 0.800 -0.2585 0.137
4-6 years -0.0052 0.971 -0.2722 0.108
7-9 years -0.0213 0.881 -0.3450 0.042
10-15 years 0.0356 0.799 -0.2784 0.096
More than 15 years 0.0750 0.588 -0.2486 0.132
Other business characteristics
Ltd Co 0.1521 0.000 0.0435 0.309
Partnership -0.0071 0.835 0.0298 0.537
Limited Liability Partnership 0.1202 0.043 -0.0607 0.486
VAT Registered 0.0815 0.031 -0.0223 0.675
Number of finance providers
More than one -0.0052 0.795 -0.0494 0.094
Length of relationship with
main finance provider(d)
1-3 years 0.0269 0.705 -0.0377 0.668
4-6 years 0.1050 0.141 -0.0463 0.609
7-9 years 0.0221 0.765 0.0010 0.991
10-15 years 0.0851 0.219 -0.0177 0.841
More than 15 years 0.0800 0.246 -0.0255 0.770
Highest Qualification
Undergraduate degree -0.0200 0.514 0.0113 0.805
Postgraduate degree -0.0256 0.488 0.0283 0.594

The Impact of the Financial Crisis on Bank Lending to SMEs
53
Explanatory variable Overdrafts Term loans (marginal effect and (marginal effect and p-value) p-value)
Gender
Female -0.0033 0.905 0.905 0 .905 -0.0124 0.770
Ethnicity(e)
Black African -0.2248 0.095 -0.1400 0.514
Black Caribbean 0.0675 0.525 -0.0203 0.912
Indian 0.0134 0.834 0.0298 0.726
Pakistani 0.0270 0.754 0.2005 0.184
Bangladeshi -0.0899 0.418 0.1012 0.521
Loan contract terms
Log size of loan 0.0841 0.000 0.1183 0.000
Variable interest rate 0.0627 0.002
Fixed interest rate -0.0735 0.010
NT 3,387 1,659
0.000 0.000
Source: UKSMEF 2004, 2008, 2009
(a) Effects are measured relative to businesses with less than £10,000 in assets.
(b) Effects are measured relative to minimal risk rated businesses
(c) Effects are measured relative to businesses aged less than 1 year.
(d) Effects are measured relative to businesses with financial relationships of less than 1 year.
(e) Effects are measured relative to businesses with a White principal owner.
Additional controls for business sector were included (not reported)
The main effects in Table 14 relate to changes in incidences of collateralisation before and after the financial crisis. These effects show:
Overdrafts
Businesses with overdraft demands in 2005-7 were 8.8% points less likely to post collateral on overdraft relative to businesses with loan demands in 2001-4.
Businesses with overdraft demands in 2007-8 were no more or less likely to post collateral on overdraft relative to businesses with loan demands in 2001-4.
Businesses with overdraft demands in 2008-9 were 11.4% points less likely to post collateral on overdraft relative to businesses with loan demands in 2001-4.

The Impact of the Financial Crisis on Bank Lending to SMEs
Term loans
There are no statistically significant differences in incidences of loan collateralisation among businesses with loan demands in different sub-periods before and after the financial crisis.
The other main determinants of incidences of collateralisation are as follows:
Assets
Overdrafts
Businesses with assets of between £100,000-249,999 were 9.1% points more likely to post collateral on loans relative to businesses with assets of less than £10,000.
Businesses with assets of £5m or more were 10.4% points less likely to post collateral on loans relative to businesses with assets of less than £10,000.
Term loans
Businesses with assets of between £50,000-99,999 were 19.3% points more likely to post collateral on loans relative to businesses with assets of less than £10,000.
Businesses with assets of between £100,000-249,999 were 18.6% points more likely to post collateral on loans relative to businesses with assets of less than £10,000.
Businesses with assets of between £250,000-499,999 were 18.5% points more likely to post collateral on loans relative to businesses with assets of less than £10,000.
Credit ratings
Overdrafts
Low risk businesses were 8.0% points more likely to post collateral on loans than minimal risk businesses.
Average risk businesses were 13.2% points more likely to post collateral on loans than minimal risk businesses.
High risk businesses were 18.9% points more likely to post collateral on loans than minimal risk businesses.
Businesses with no risk rating were 14.4% points more likely to post collateral on loans than minimal risk businesses.
Term loans
There are no statistically significant effects of risk ratings on the probability of loan collateralisation.
54

The Impact of the Financial Crisis on Bank Lending to SMEs
Financial delinquency
Overdrafts
Businesses which exceeded their overdraft limit without authorisation are 7.4% points more likely to post collateral on loans than businesses with no unauthorised overdraft borrowing.
Term loans
There are no statistically significant effects of financial delinquency on the probability of loan collateralisation.
Table 15: Determinants of term loan collateral ratios (marginal effects)
Explanatory variable Marginal effect p-value
Loan Demands
Loan demands in 2005-7 -0.2216 0.529
Loan demands in 2007-8 0.2013 0.628
Loan demands in 2008-9 -0.1532 0.794
Assets(a)
£10,000 - £49,999
0.4580
0.610
£50,000 - £99,999
-0.5921
0.510
£100,000 - £249,999
-0.1445
0.862
£250,000 - £499,999
1.2293
0.129
£500,000 - £999,999
0.1394
0.863
£1m - £4,999,999
0.9588
0.216
£5m or more
2.2711
0.007
Risk Rating(b)
Low risk
0.0106
0.980
Average risk
-0.0495
0.913
High risk
0.3339
0.544
55

The Impact of the Financial Crisis on Bank Lending to SMEs
56
Explanatory variable Marginal effect p-value
No risk rating
Financial Delinquency
Loan Default
Unauthorised overdraft borrowing
(c) Business Age
1-2 years
2-3 years
4-6 years
7-9 years
10-15 years
More than 15 years
Other business characteristics
Ltd Co
Partnership
Limited Liability Partnership
VAT Registered
Number of finance providers
More than one
Length of relationship with main finance provider(d)
1-3 years
4-6 years
7-9 years
0.1100
-0.0483
-0.3768
-5.6144
-6.0238
-5.2018
-5.3383
-4.3433
-4.9668
0.1823
1.1718
-0.7466
-0.4590
0.0226
1.0460
0.7233
1.5624
0.869
0.954
0.363
0.000
0.000
0.000
0.000
0.002
0.000
0.659
0.012
0.436
0.381
0.938
0.211
0.396
0.076

The Impact of the Financial Crisis on Bank Lending to SMEs
57
Explanatory variable Marginal effect p-value
10-15 years
More than 15 years
Highest Qualification
Undergraduate degree
Postgraduate degree
Gender
Female
(e) Ethnicity
Black African
Black Caribbean
Indian
Pakistani
Bangladeshi
Loan contract terms
Log size of loan
Fixed interest rate
NT
1.3198
0.9211
-0.0377
-0.1900
0.2068
-0.1012
-0.7608
-0.4427
-1.2142
0.3007
-0.8856
0.0634
833
0.000
0.108
0.257
0.930
0.695
0.616
0.970
0.692
0.549
0.338
0.816
0.000
0.821
Source: UKSMEF 2004, 2008, 2009
(a) Effects are measured relative to businesses with less than £10,000 in assets.
(b) Effects are measured relative to minimal risk rated businesses
(c) Effects are measured relative to businesses aged less than 1 year.
(d) Effects are measured relative to businesses with financial relationships of less than 1 year.
(e) Effects are measured relative to businesses with a White principal owner.
Additional controls for business sector were included (not reported)
The estimates in Table 15 indicate that the main determinants of term loan collateral ratios are business age and the size of the loan. There are no statistically significant differences in term loan collateral ratios by businesses with loan demands in different sub-periods before and after the financial crisis.
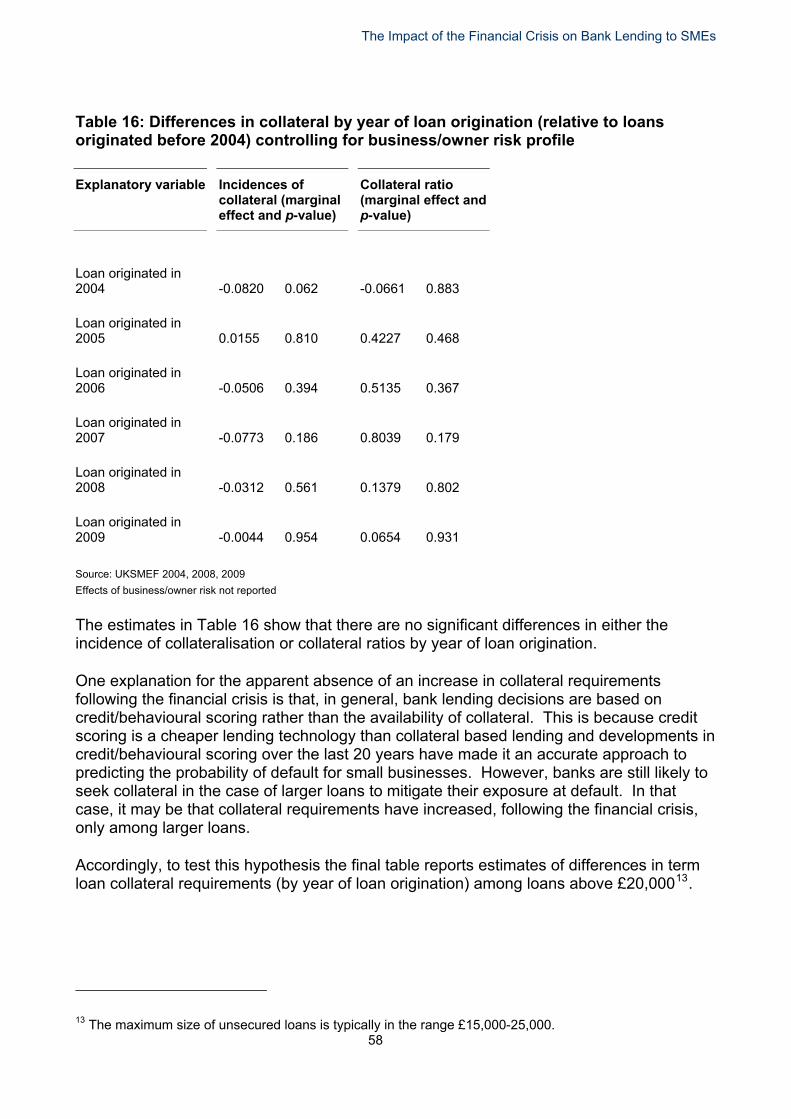
The Impact of the Financial Crisis on Bank Lending to SMEs
Table 16: Differences in collateral by year of loan origination (relative to loans originated before 2004) controlling for business/owner risk profile
Explanatory variable Incidences of collateral (marginal effect and p-value)
Collateral ratio (marginal effect and p-value)
Loan originated in 2004 -0.0820 0.062 -0.0661 0.883
Loan originated in 2005 0.0155 0.810 0.4227 0.468
Loan originated in 2006 -0.0506 0.394 0.5135 0.367
Loan originated in 2007 -0.0773 0.186 0.8039 0.179
Loan originated in 2008 -0.0312 0.561 0.1379 0.802
Loan originated in 2009 -0.0044 0.954 0.0654 0.931
Source: UKSMEF 2004, 2008, 2009
Effects of business/owner risk not reported
The estimates in Table 16 show that there are no significant differences in either the incidence of collateralisation or collateral ratios by year of loan origination.
One explanation for the apparent absence of an increase in collateral requirements following the financial crisis is that, in general, bank lending decisions are based on credit/behavioural scoring rather than the availability of collateral. This is because credit scoring is a cheaper lending technology than collateral based lending and developments in credit/behavioural scoring over the last 20 years have made it an accurate approach to predicting the probability of default for small businesses. However, banks are still likely to seek collateral in the case of larger loans to mitigate their exposure at default. In that case, it may be that collateral requirements have increased, following the financial crisis, only among larger loans.
Accordingly, to test this hypothesis the final table reports estimates of differences in term loan collateral requirements (by year of loan origination) among loans above £20,00013.
58
13 The maximum size of unsecured loans is typically in the range £15,000-25,000.

The Impact of the Financial Crisis on Bank Lending to SMEs
Table 17: Difference in collateral ratios (term loans > £20,000) controlling for business/owner risk profile: by sub-period (relative to 2001-4); and by year of loan origination (relative to loans originated before 2004).
% points/100
Sub-period Difference in collateral ratios
p-value
Loan demands in 2005-7 -0.095 0.728
Loan demands in 2007-8 0.769 0.018
Loan demands in 2008-9 0.412 0.366
Loan originated in 2004 0.176 0.623
Loan originated in 2005 0.528 0.246
Loan originated in 2006 0.666 0.139
Loan originated in 2007 1.130 0.017
Loan originated in 2008 0.877 0.048
Loan originated in 2009 0.925 0.130
Source: UKSMEF 2004, 2008, 2009
The above estimates indicate that among businesses with term loans bigger than £20,000:
Those with loan demands in 2007-8 experienced collateral ratios which were almost 77% points higher compared to otherwise similar businesses in 2001-4.
Similarly, the collateral ratios on loans originated in 2007 were 113% points higher than those on loans obtained by otherwise similar businesses before 2004.
Also, the collateral ratios on loans originated in 2008 were almost 88% points higher than those on loans obtained by otherwise similar businesses before 2004.
The point estimate of a 92.5% point higher collateral ratio in 2009 is suggestive of on-going higher collateral ratios following the financial crisis, but this estimate falls
59

The Impact of the Financial Crisis on Bank Lending to SMEs
just below conventional significance levels (which may be due to the relatively small sample of observations on collateral ratios in this period).
The analysis of incidences of collateralisation was also repeated for larger facilities/loans but the results were broadly similar to those reported in Table 1414. The implication is that the trend away from collateral based lending towards cheaper credit/behavioural scoring techniques outweighed any tendency for banks to increase the frequency of collateralisation following the financial crisis. However, the analysis of collateral ratios among larger loans offers some support for the view that, following the financial crisis, banks asked for more collateral relative to loan size in instances where they would have asked for collateral anyway.
60
14 These results are available from the author on request.

The Impact of the Financial Crisis on Bank Lending to SMEs
Summary
The main findings from the econometric analysis are as follows:
Rejection rates
Overdrafts
Businesses with overdraft demands in 2005-7 were 2.9% points less likely to experience rejection relative to businesses with overdraft demands in 2001-4.
Businesses with overdraft demands in 2007-8 were 2.8% points more likely to experience rejection relative to businesses with overdraft demands in 2001-4.
Businesses with overdraft demands in 2008-9 were 5.5% points more likely to experience rejection relative to businesses with overdraft demands in 2001-4.
Term loans
There is no statistically significant difference in rejection rates between businesses with loan demands in 2005-7 and those with loan demands in 2001-4.
However, businesses with loan demands in 2007-8 were 4.5% points more likely to experience rejection relative to businesses with loan demands in 2001-4.
Also, businesses with loan demands in 2008-9 were 8.8% points more likely to experience rejection relative to businesses with loan demands in 2001-4.
Margins
Overdrafts
Businesses with overdraft demands in 2005-7 paid margins which were 1.28% points lower compared to margins paid by businesses with overdraft demands in 2001-4.
Businesses with overdraft demands in 2007-8 paid margins which were 1.19% points lower compared to margins paid by businesses with overdraft demands in 2001-4.
However, businesses with overdraft demands in 2008-9 paid margins which were 1.63% points higher compared to margins paid by businesses with loan demands in 2001-4.
Term loans
Businesses with loan demands in 2005-7 paid margins which were 0.56% points lower compared to margins paid by businesses with loan demands in 2001-4.
There is no statistically significant difference in the loan margins paid by businesses with loan demands in 2007-8 compared to margins paid by businesses with loan demands in 2001-4.
61
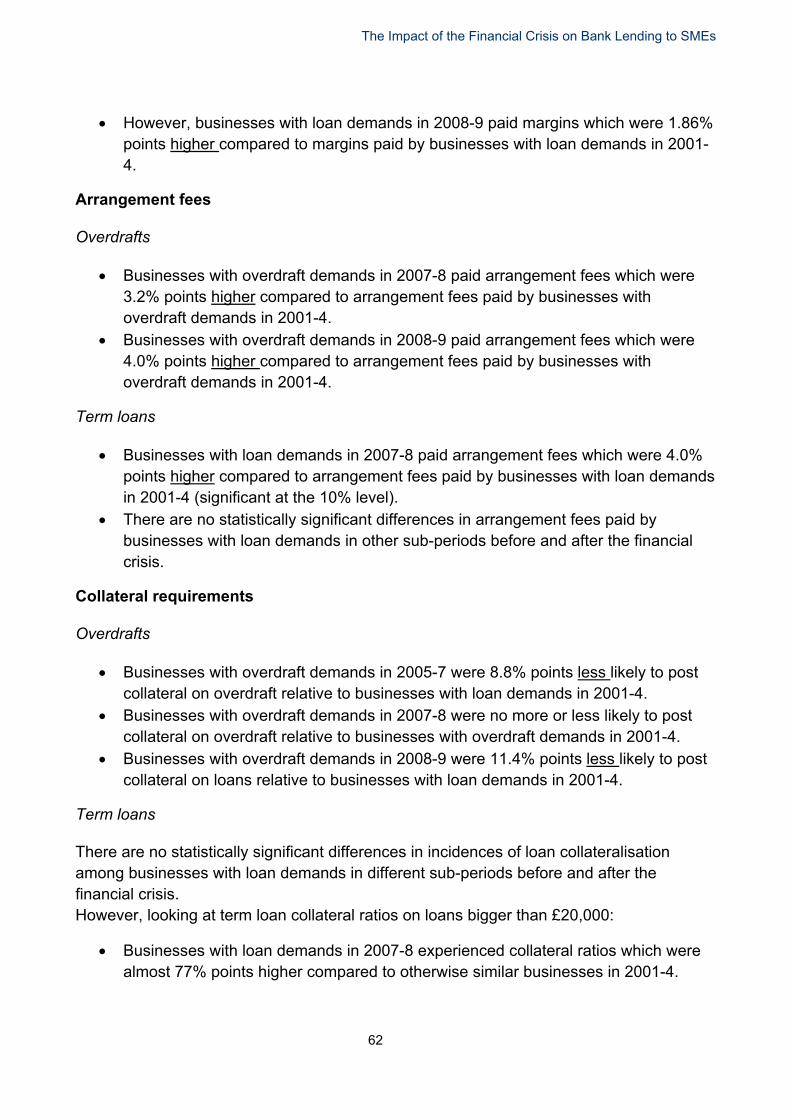
The Impact of the Financial Crisis on Bank Lending to SMEs
However, businesses with loan demands in 2008-9 paid margins which were 1.86% points higher compared to margins paid by businesses with loan demands in 2001-4.
Arrangement fees
Overdrafts
Businesses with overdraft demands in 2007-8 paid arrangement fees which were 3.2% points higher compared to arrangement fees paid by businesses with overdraft demands in 2001-4.
Businesses with overdraft demands in 2008-9 paid arrangement fees which were 4.0% points higher compared to arrangement fees paid by businesses with overdraft demands in 2001-4.
Term loans
Businesses with loan demands in 2007-8 paid arrangement fees which were 4.0% points higher compared to arrangement fees paid by businesses with loan demands in 2001-4 (significant at the 10% level).
There are no statistically significant differences in arrangement fees paid by businesses with loan demands in other sub-periods before and after the financial crisis.
Collateral requirements
Overdrafts
Businesses with overdraft demands in 2005-7 were 8.8% points less likely to post collateral on overdraft relative to businesses with loan demands in 2001-4.
Businesses with overdraft demands in 2007-8 were no more or less likely to post collateral on overdraft relative to businesses with overdraft demands in 2001-4.
Businesses with overdraft demands in 2008-9 were 11.4% points less likely to post collateral on loans relative to businesses with loan demands in 2001-4.
Term loans
There are no statistically significant differences in incidences of loan collateralisation among businesses with loan demands in different sub-periods before and after the financial crisis. However, looking at term loan collateral ratios on loans bigger than £20,000:
Businesses with loan demands in 2007-8 experienced collateral ratios which were almost 77% points higher compared to otherwise similar businesses in 2001-4.
62

The Impact of the Financial Crisis on Bank Lending to SMEs
Similarly, the collateral ratios on loans originated in 2007 were 113% points higher than those on loans obtained by otherwise similar businesses before 2004.
Also, the collateral ratios on loans originated in 2008 were almost 88% points higher than those on loans obtained by otherwise similar businesses before 2004.
63

The Impact of the Financial Crisis on Bank Lending to SMEs
4 Conclusions The report began with 10 hypotheses relating to the impact of the financial crisis on bank lending conditions. The report therefore concludes by reviewing the evidence for and against these hypotheses based on the econometric analysis contained in this report.
Rejection rates
1. Firms which applied for bank debt in 2007-2008 and 2008-2009, were more likely to be rejected than firms with the same level of risk who applied for finance in 2001-2004.
The report finds evidence to support this hypothesis regarding both overdrafts and term loans. There has therefore, been a tightening in the availability of credit to SMEs holding the risk profile of the business/owner and their financial relationships constant.
The relative impact of the financial crisis on bank debt rejection rates is large. In 2001-2004 the overdraft rejection rate was 10.9% and it increased by 5.5% points in 2008-2009 holding business risk constant. This represents an increase in the overdraft rejection rate of over 50% in 2008-2009 relative to 2001-2004. The relative increase in term loan rejection rates is even larger: starting from a rejection rate of 5.4% in 2001-2004, it increased by 8.8% points in2008- 2009 which represents a rise of 163%.
2. Firms which applied for bank debt in 2005-2007, were less likely to be rejected than firms with the same level of risk who applied for bank debt in 2001-2004, potentially suggesting a boom in the availability of credit compared to more normal times.
The report finds evidence to support this hypothesis regarding overdrafts only. There does not appear to be a significant relaxation in the availability of loans to SMEs during 2005-2007. This may be because term lending was already overheating in the reference period 2001-2004.
Margins
3. Firms which used bank debt in 2007-2008 and 2008-2009, paid higher margins than firms with the same level of risk who used bank debt in 2001-2004.
The report finds no evidence to support this hypothesis regarding 2007-2008. However, there is evidence of significantly higher margins being paid on both overdrafts and term loans in 2008-2009. This reflects: the sharp increase in bank funding costs following the collapse of Lehman Brothers in September 200815; and attempts by banks to recover profitability in order to repair the damage caused to their balance sheets by the financial crisis.
64
15 This includes the rise in the cost of inter-bank borrowing (LIBOR) and the cost of raising additional capital from shareholders.

The Impact of the Financial Crisis on Bank Lending to SMEs
Again the relative impact of the financial crisis on margins is large. In 2001-2004 the average overdraft margin was 1.9% points over base and it increased by 1.6% points in 2008-2009holding business risk constant. This represents a rise of almost 84%. Similarly the average term loan margin was 2.3% points over base in 2001-2004, and it increased by 1.9% points in 2008-9, representing a rise of almost 83%.
4. Firms which used bank debt in 2005-2007, paid lower margins than firms with the same level of risk who applied for bank debt in 2001-2004.
The report finds evidence to support this hypothesis regarding both overdrafts and term loans. This may reflect lower bank funding costs and greater competition from domestic and foreign banks during this period.
Arrangement fees
5. Firms which used bank debt in 2007-2008 and 2008-2009, paid higher arrangement fees than firms with the same level of risk who used bank debt in 2001-2004.
The report finds evidence to support this hypothesis regarding overdrafts only. This is consistent with anecdotal evidence about the imposition of facility fees following the financial crisis (see FSB, 200816).
6. Firms which used bank debt in 2005-2007, paid lower arrangement fees than firms with the same level of risk who applied for bank debt in 2001-2004.
The report finds no evidence to support this hypothesis.
Collateral
7. Firms which applied for bank debt in 2007-2008 and 2008-2009, were more likely to be required to provide collateral than firms with the same level of risk who applied for bank finance in 2001-2004.
The report finds no evidence to support this hypothesis in general or even for larger loans (which are more likely to involve collateral). This may be because the underlying trend away from collateral based lending towards cheaper credit/behavioural scoring techniques outweighed any tendency for banks to increase the frequency of collateralisation following the financial crisis.
8. Firms which applied for bank finance in 2005-2007, were less likely to be required to provide collateral than firms with the same level of risk who applied for bank finance in 2001-2004.
The report finds evidence to support this hypothesis regarding overdrafts only.
65

The Impact of the Financial Crisis on Bank Lending to SMEs
Collateral ratio (collateral offered as a proportion of loan amount)
9. Firms which applied for bank loans in 2007-2008 and 2008-2009, provided more collateral as a proportion of loan amount than firms with the same level of risk who applied for bank loans in 2001-2004.
The report finds no evidence to support this hypothesis in general. However, looking specifically at term loans larger than £20,000, there is evidence of increased collateral ratios in 2007-2008. This offers some support for the view that, following the financial crisis, banks asked for more collateral relative to loan size in instances where they would have asked for collateral anyway.
10. Firms which applied for bank loans in 2005-2007, provided less collateral as a proportion of loan amount than firms with the same level of risk who applied for bank loans in 2001-2004.
The report finds no evidence to support this hypothesis.
Overall conclusion
The analysis therefore indicates that the principal effect of the financial crisis has been to reduce the availability of bank debt and increase their cost as measured by overdraft facility and term loan margins. There is also evidence that arrangement fees for overdraft facilities have increased in proportion to the size of the facility. These seem to be genuine supply-side effects since the econometric models included extensive controls relating to the risk profile of the business/owner and their financial relationships. The analysis also broadly supports the argument that there were two initial phases in the financial crisis: a liquidity crisis (2007-8); followed by a more severe insolvency crisis (2008-9). This is reflected in the more severe tightening of bank lending conditions for businesses with bank debt demands in 2008-9.
It has been out-with the scope of this report to analyse the effects of tighter lending conditions on the real economy. However related research by the author has found evidence of a higher likelihood of business failure and lower sales growth due to a lack of working capital in 2007-8 and 2008-917. Indeed this financial constraint on firm performance was at its most severe in 2008-9 which resonates with the findings in this report. There is no current evidence that a lack of term lending is having a similar adverse effect on business performance. This apparent absence of financial constraints with respect to term lending may be due to the low demand for term loans following the financial crisis. In other words, business owners have been delaying implementing new capital projects due to the uncertainty caused by the financial crisis. In this light, financial
66
16 Op.cit. 17Fraser (2012), Are Entrepreneurs Financially Constrained? A New Test Based on Finance Gaps, CSME Working Paper.

The Impact of the Financial Crisis on Bank Lending to SMEs
67
constraints, due to a lack of term lending, may yet emerge when confidence returns and demand for these loans begins to increase.

© Crown copyright 2012
You may re-use this information (not including logos) free of charge in any format or medium, under the terms of the Open Government Licence. Visit www.nationalarchives.gov.uk/doc/open-government-licence, write to the Information Policy Team, The National Archives, Kew, London TW9 4DU, or email: [email protected].
This publication is also available on our website at www.bis.gov.uk
Any enquiries regarding this publication should be sent to:
Department for Business, Innovation and Skills 1 Victoria Street London SW1H 0ET Tel: 020 7215 5000 If you require this publication in an alternative format, email [email protected], or call 020 7215 5000. URN 12/949