Embed Size (px)
Citation preview

The impact of the European Union on the UK
labour market
Report for Harvey Nash
August 2013

2
Contents 1. Executive Summary ............................................................................................................................. 3
2. Introduction ........................................................................................................................................ 4
3. Setting the scene – the UK’s growing reliance on EU workers ........................................................... 5
3.1. Net migration and the number of EU workers in the UK............................................................. 5
3.2. Employment rates for EU migrants .............................................................................................. 9
3.3. Where do EU migrants work and how skilled are they? ............................................................ 10
4. Does immigration have a negative impact on UK workers? ............................................................. 14
5. Immigration, economic growth and an EU exit ................................................................................ 16
6. Conclusions ....................................................................................................................................... 21
Disclaimer.............................................................................................................................................. 22

3
1. Executive Summary
This report presents Cebr’s analysis of the links between the European Union (EU) and the UK labour
market. The report examines the possible consequences of tighter immigration controls that could
be imposed if the UK were to leave the European Union.
The key findings of the report are as follows:
- EU migrants account for a growing proportion of total employment in the UK - Non-UK EU-
born citizens accounted for 2.7% of employment in Q2 2003, but by Q2 2013, ten years later,
this had more than doubled to 5.5%.
- Between Q2 2003 and Q2 2013, the number of Non-UK EU-born citizens in employment in the
UK more than doubled from 762,000 to 1,647,000. The accession A81 countries, plus Romania
and Bulgaria, accounted for 87.0% (770,340) of this increase. Employment among those born in
the EU142 rose from 657,000 to 797,000 over the same time period – an increase of 21.3%.
- Census data for 2011 show that non-UK-born EU citizens are less likely to be unemployed or
economically inactive than their UK-born counterparts - 63.3% of non-UK EU-born citizens
(aged 16 and over) were in employment, notably higher than the 56.2% seen for UK-born
citizens. Meanwhile, 69.8% of non-UK EU-born citizens were economically active, compared to
only 63.0% of UK-born citizens.
- EU migrants appear to be addressing skills shortages in both professional and more
elementary occupations - While 27.7% of UK-born citizens in employment were managers,
directors, senior officials or in profession occupations in 2011, this share is almost ten
percentage points higher for those born in EU14 countries – 37.4%. Those from accession
countries are more likely to be in elementary occupations than UK-born or EU-14-born citizens.
- Non-UK EU-born citizens are estimated to account for 6.4% of total UK employment in
financial and business services according to ONS Census data - In 2011, 294,000 non-UK EU-
born citizens were employed in financial and business services, 160,000 of which were from the
EU14 group of nations.
- We estimate that non-UK EU-born workers earned £39 billion in total in 2012. £21 billion of
this was from EU14-born workers, while the remaining £18 billion was from those born in
accession nations. In 2012, the average EU14 born worker is estimated to have earned £28,699,
7.6% (£2,035) more than that earned among all UK workers on average.
- Economic growth is higher under scenarios with more net migration than scenarios with
lower net migration - compared with our central population scenario, an EU-exit scenario with
tighter migration controls would lead to real GDP being 2.0% lower in 2050-51. This is a GDP
loss of £60 billion in real terms (2012-13 prices).
- The sustainability of the public finances in the long-term is contingent on net migration –
without migrant workers from the EU, rising numbers of dependents relative to working age
individuals will place the public finances on a more unsustainable footing. Under our EU exit
scenario, borrowing as a share of GDP stands at 7.0% in 2050. This compares with 6.5% under
our central scenario.
1 Czech Republic, Estonia, Hungary, Latvia, Lithuania, Poland, the Slovak Republic and Slovenia
2 Austria, Belgium, Denmark, Finland, France, Germany, Greece, Ireland, Italy, Luxembourg, Netherlands,
Portugal, Spain and Sweden.

4
2. Introduction
This report presents Cebr’s analysis of the links between the European Union (EU) and the UK labour
markets. The report examines the possible consequences of tighter immigration controls that could
be imposed if the UK were to leave the European Union
In recent years, individuals born outside the UK have accounted for a growing share of total UK
employment – a significant number of which consists of individuals born in the European Union. As
the analysis in this report shows, a significant proportion of non-UK born employment growth in
recent years is a result of inflows of workers from the A8 “accession” member states that joined the
EU in 2004 - the Czech Republic, Estonia, Hungary, Latvia, Lithuania, Poland, the Slovak Republic and
Slovenia. The number of workers in the UK from established European Union member countries has
also grown.
The link between the EU labour supply and UK labour supply has become much stronger over the
past decade as a result of these inflows of migrant workers. This report analyses recent trends in EU
migrant employment in the UK, examining the facts behind a subject matter in which the public
discourse is often dominated by biased rhetoric and misleading remarks. Immigration is a heated
issue and, as such, there is a strong case for more fact-based analysis of its impacts on the UK
economy – and society more broadly.
If a referendum on UK membership of the EU were held after the next election and this led to the UK
leaving the EU, the exit would likely trigger changes to government policy on migration. In all
likelihood, a government operating in a post-EU exit environment would probably act to further
restrict migration to the UK. The current Home Secretary, Theresa May, has stated that cutting net
migration to “tens of thousands” per year is a key aspect of the Conservative election platform,
while the Labour Party has recently attempted to take a tougher stance on immigration in the UK.
This is despite empirical research and economic forecasts showing the benefits of immigration, as
well as little evidence that immigrants are “welfare” tourists exploiting the UK benefits system.
Indeed, the analysis in this report shows that EU migrants are more likely to be employed than UK-
born citizens. Going forward, migration will support the size of the working age population at a time
when the native population is aging. This report examines how different scenarios for net migration,
such as those that may occur after an EU exit, would impact on the UK economy.
The structure of this report is as follows:
Section 3 examines ONS Labour Force Survey, migration and Census data, providing an
overview and quantification of migration trends in the UK, including labour market trends.
Section 4 of the report considers the benefits and costs of immigration to UK-born citizens,
examining recent academic literature on the impacts of immigration on labour market
outcomes.
Section 5 of the report models economic growth, public borrowing and the size of the
working age population under different scenarios for net migration. This Section of the
report considers how a possible EU exit with tighter labour controls may impact the UK
economy.
Section 6 of the report draws conclusions from the preceding analysis.

5
3. Setting the scene – the UK’s growing reliance on EU workers
Migrant workers have accounted for a growing share of total employment in the UK over the past
decade. Migrants from established EU member countries are more likely to be employed in higher
skilled work, while those from the accession “A8” nations that joined the EU in 2004, Romania and
Bulgaria are more likely to be employed in lower skilled work.
3.1. Net migration and the number of EU workers in the UK Migrant workers are making an increasingly important contribution to the UK’s workforce. Over the
past 10 years the total number of non-UK-born individuals employed in the UK has increased from
2.6 million in Q2 2003 to 4.4 million in Q2 2013. At the same time non-UK-born employment as a
share of total employment has increased from 9.2% to 14.8%
Figure 1 below illustrates the regional drivers behind this trend, showing employment in the UK by
region of birth. Non-UK EU-born (EU26 born) citizens accounted for 2.7% of employment in Q2 2003
but by Q2 2013, ten years later, this had more than doubled to 5.5%. Non-EU-born citizens also saw
their share of UK employment rise too, from 6.4% to 9.3% over the same time period.
Figure 1: employment as a share of total UK employment, by region of birth
Source: ONS Labour Force Survey, Cebr analysis
In 2004, ten countries joined the EU as new member states. These included the Czech Republic,
Estonia, Hungary, Latvia, Lithuania, Poland, the Slovak Republic and Slovenia (known as the A8
countries)3. Unlike most of the nations already in the EU (the EU15), the UK did not impose labour
market restrictions on the migration of A8 nationals to the UK. When Romania and Bulgaria joined
the EU in 2007, Bulgarians and Romanians gained the right to visa-free travel to the UK. However,
3 Cyprus and Malta also joined at this time.
0%
1%
2%
3%
4%
5%
6%
7%
8%
9%
10%
Q2
19
97
Q2
19
98
Q2
19
99
Q2
20
00
Q2
20
01
Q2
20
02
Q2
20
03
Q2
20
04
Q2
20
05
Q2
20
06
Q2
20
07
Q2
20
08
Q2
20
09
Q2
20
10
Q2
20
11
Q2
20
12
Q2
20
13
Total EU (EU26) EU14 EUA8, Romania and Bulgaria Totalnon-EU

6
temporary restrictions were put in place to limit the nature of the jobs which Bulgarian and
Romanian nationals could take. Employers were required to apply for work permits and migrants for
an "accession worker card". Low-skilled workers were restricted to existing quota schemes in the
agricultural and food processing sectors. These restrictions will be dropped on 1 January 2014,
granting individuals from these countries the same rights to work in the UK as other EU citizens.
The expanding size of the EU has clearly impacted the UK labour market, as shown in Figure 1.
Almost all of the growth in the non-UK EU-born share of total employment was due to inflows of
workers from the accession “A8” countries as well as Romania and Bulgaria. While in Q2 2003,
individuals from these countries accounted for 0.2% of total UK employment, by Q2 2013 this had
risen to 2.8%. Over the same period the share of employment accounted for by the “established”
EU144 members rose only slightly, from 2.3% to 2.7%.
Figure 2 illustrates this trend even more distinctly. Between Q2 2003 and Q2 2013, the number of
Non-UK EU-born citizens in employment in the UK more than doubled from 762,000 to 1,647,000.
The accession A8 countries, plus Romania and Bulgaria, accounted for 87.0% (770,340) of this
increase. Employment among those born in the EU14 rose from 657,000 to 797,000 over the same
time period – an increase of 21.3%.
Figure 2: Number of non-UK-born EU citizens employed in the UK, thousands
Source: ONS Labour Force Survey, Cebr analysis
Looking at the net5 flow of migrants into the UK, annual EU migration peaked in 2007 at just under
130,000, as Figure 3 below shows. The latest data show a slight pick-up in the net flow of EU
migrants over the year ending December 2012, although the level remains some 35% below the
4 Austria, Belgium, Denmark, Finland, France, Germany, Greece, Ireland, Italy, Luxembourg, Netherlands,
Portugal, Spain and Sweden. 5 That is, the inflow of migrants minus the outflow of migrants from the UK.
0
200
400
600
800
1,000
1,200
1,400
1,600
1,800
Q2
19
97
Q2
19
98
Q2
19
99
Q2
20
00
Q2
20
01
Q2
20
02
Q2
20
03
Q2
20
04
Q2
20
05
Q2
20
06
Q2
20
07
Q2
20
08
Q2
20
09
Q2
20
10
Q2
20
11
Q2
20
12
Q2
20
13
EU14 EUA8, Romania and Bulgaria

7
peak flow in 2007. Net migration fell as the UK entered recession in 2008 and 2009 and, despite a
subsequent pick up, migration levels remain subdued compared with the period 2004-2007
preceding the financial crisis. Net non-EU migration has been on a downward trend since 2011,
which is likely to reflect the effect of Government policies designed to curb immigration through an
annual limit on non-EU workers.
Figure 3: Flow of individuals into and out of the UK, net migration (inflow minus outflow), by
citizenship (thousands)
Source: ONS, Home Office, Cebr analysis
Figure 4 below illustrates the inflow and outflow of non-UK EU citizens, and shows that there was an
increase in the outflow of citizens from the UK as the economy entered recession in 2008, suggesting
more migrants tend to leave when economic conditions worsen. Although the outflow of non-UK EU
citizens has lessened since 2009, as Figure 4 shows, the level of outflow remains higher than before
the financial crisis.
Figure 4: Inflow and outflow of non-UK EU citizens in the UK (thousands)
0
+ 50
+ 100
+ 150
+ 200
+ 250
+ 300
+ 350
+ 400
YE D
ec
02
YE J
un
03
YE D
ec
03
YE J
un
04
YE D
ec
04
YE J
un
05
YE D
ec
05
YE J
un
06
YE D
ec
06
YE J
un
07
YE D
ec
07
YE J
un
08
YE D
ec
08
YE J
un
09
YE D
ec
09
YE J
un
10
YE D
ec
10
YE J
un
11
YE D
ec
11
YE J
un
12
YE D
ec
12
EU (excluding UK) Non-EU
- 200
- 150
- 100
- 50
0
+ 50
+ 100
+ 150
+ 200
+ 250
YE D
ec
02
YE J
un
03
YE D
ec
03
YE J
un
04
YE D
ec
04
YE J
un
05
YE D
ec
05
YE J
un
06
YE D
ec
06
YE J
un
07
YE D
ec
07
YE J
un
08
YE D
ec
08
YE J
un
09
YE D
ec
09
YE J
un
10
YE D
ec
10
YE J
un
11
YE D
ec
11
YE J
un
12
Inflow Outflow

8
Source: ONS, Home Office, Cebr analysis

9
3.2. Employment rates for EU migrants
Migrant workers into the UK from the EU are not just making an increasing contribution to overall
employment in the UK, they are also increasing the employment rate in UK. Data from the 2011
Census show that EU citizens born outside the UK, but living in the UK, are more likely to be
employed than UK-born citizens, while they are also more likely to be economically active – that is,
either employed or actively seeking work6.
As Figure 5 below shows, an estimated 63.3% of non-UK EU-born citizens (aged 16 and over) were in
employment in 2011, notably higher than the 56.2% seen for UK-born citizens. Meanwhile 69.8% of
non-UK EU-born citizens are economically active, compared to only 63.0% of UK-born citizens.
Figure 5: Labour market status by country of birth (2011)
Source: ONS Census, Cebr analysis
A great deal of these differences reflect the fact that non-UK EU-born citizens (aged 16 and over) are
much less likely to be retired – 15.7% were retired in 2011, compared with 22.9% of UK-born
citizens. The flow of migrant workers in recent years has placed upward pressure on the size of the
working age population, partially offsetting the negative pressures created by aging and retirement
among UK-born citizens.
6 The dataset used in this section of the report covers England & Wales. However, as England & Wales
accounts for 89% of the UK population and 89% of UK employment, we believe that the trends highlighted in this section of the report are broadly in line with those seen for the UK as a whole.
0%
10%
20%
30%
40%
50%
60%
70%
80%
Employment rate Economic activity rate
UK-born EU (excluding the UK)

10
Among the economically active population relatively fewer non-UK EU-born citizens are unemployed
- just 5.0% were in 2011, compared with 6.1% for the UK-born population7. Notably, the
unemployment rate was lower among those born in EU accession countries (4.6%) than among
those from established EU member countries (5.4%).
Among the economically inactive population, relatively fewer non-UK EU-born citizens were inactive
because of long-term sickness or disability, at just 7.2% compared with 11.0% for UK-born citizens.
Overall, the data do not suggest that “welfare tourism” or exploitation of the benefits system is a
significant problem among EU migrants. On the contrary, employment rates are relatively higher for
non-UK EU-born citizens, and Cebr estimates that this group of workers currently account for 4.3%
of UK employee income taxes8.
3.3. Where do EU migrants work and how skilled are they?
Non-UK EU-born citizens are employed across all broad industry sectors of the UK economy.
However, they are more likely to be found in certain sectors than the average UK-born worker,
according to Census data. As Figure 6 below shows, those from other EU countries are more likely to
work in distribution, hotels & restaurants, manufacturing and financial, real estate, professional &
administrative activities.
Figure 6: Industry of employment as a share of total employment, by region of birth (2011)
Source: ONS Census 2011, Cebr analysis
7 According to Census data. This dataset implies a lower unemployment rate for the UK as a whole than the
Labour Force Survey, which showed an unemployment rate of 8.1% in 2011. 8 Income Tax plus National Insurance Contributions.
0% 10% 20% 30% 40%
Construction
Transport and communication
Manufacturing
Financial, Real Estate, Professional andAdministrative activities
Distribution, hotels and restaurants
Public administration, education and health
Non-EU EU (excluding the UK) UK-born

11
A breakdown of EU migrant employment is revealing and shows that those from the more
established member countries are much more likely to be found in business services professions.
Almost one quarter (23.1%) of working EU14 born individuals were employed in the financial, real
estate, professional & administrative sector in 2011 according to Census data. This is much higher
than the 16.8% seen for UK-born workers and the 17.6% seen for the accession countries that joined
the EU between April 2001 and March 2011.
For the distribution, hotels & restaurants sector, over a quarter (26.6%) of those born in accession
countries and employed in the UK worked in the sector. This falls to 20.5% for those born in the
EU14 group of nations, which is marginally lower than the 21.0% seen for those born in the UK. This
is shown in Figure 7 below.
Those born in accession nations have a relatively heavy presence in the manufacturing and
construction sectors; these sectors account for 15.1% and 10.2% of employment for this group
respectively. This compares with 9.1% and 8.1% respectively for UK-born workers.
Figure 7: Industry of employment as a share of total employment, by region of birth (2011)
Source: ONS Census 2011, Cebr analysis
In summary, there are significant differences in EU migrant worker employment split by group.
Those in employment and born in the “established” EU14 group of nations are more likely to be
employed in business services, finance and public administration, while those from the more recent
accession nations are more likely to be employed in the retail & hospitality sectors, manufacturing
and construction. In 2011, 294,000 non-UK EU-born citizens were employed in financial and
business services, 160,000 of which were from the EU14 group of nations. Non-UK EU-born citizens
0% 10% 20% 30% 40%
Construction
Manufacturing
Transport and communication
Distribution, hotels and restaurants
Financial, Real Estate, Professional andAdministrative activities
Public administration, education and health
UK
EU countries: Accession countries April 2001 to March 2011
EU countries: Member countries in March 2001 (excluding the UK)
12
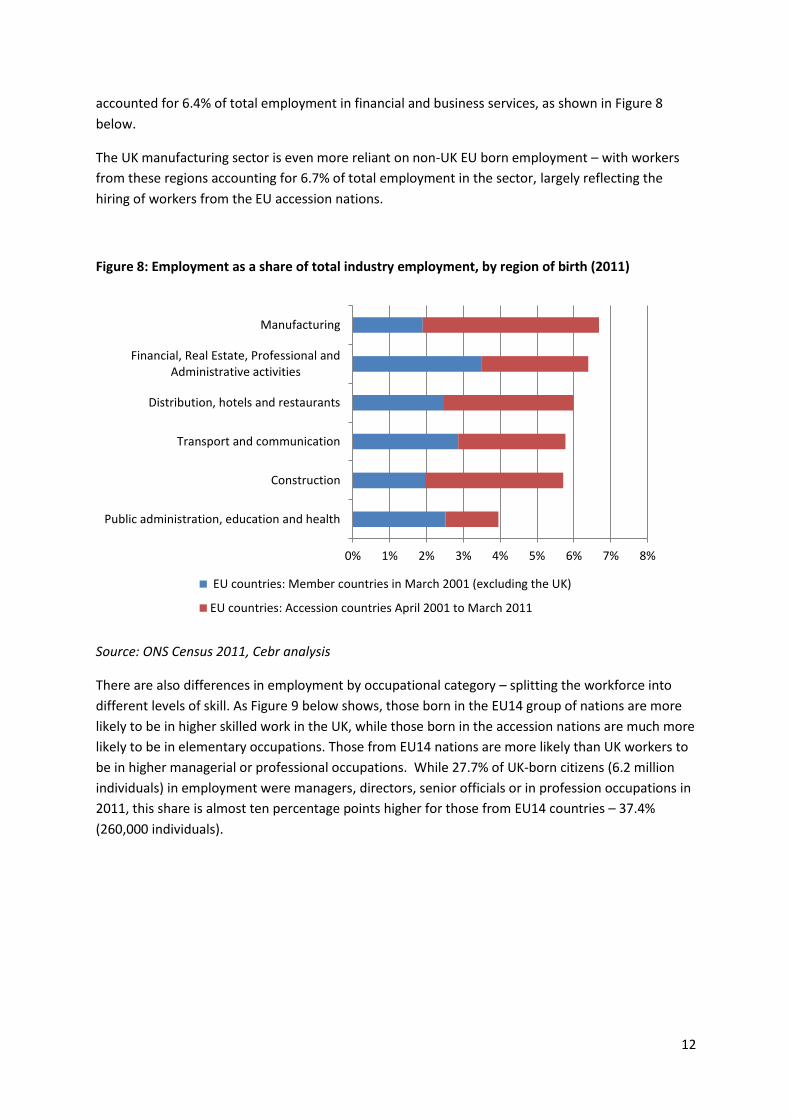
accounted for 6.4% of total employment in financial and business services, as shown in Figure 8
below.
The UK manufacturing sector is even more reliant on non-UK EU born employment – with workers
from these regions accounting for 6.7% of total employment in the sector, largely reflecting the
hiring of workers from the EU accession nations.
Figure 8: Employment as a share of total industry employment, by region of birth (2011)
Source: ONS Census 2011, Cebr analysis
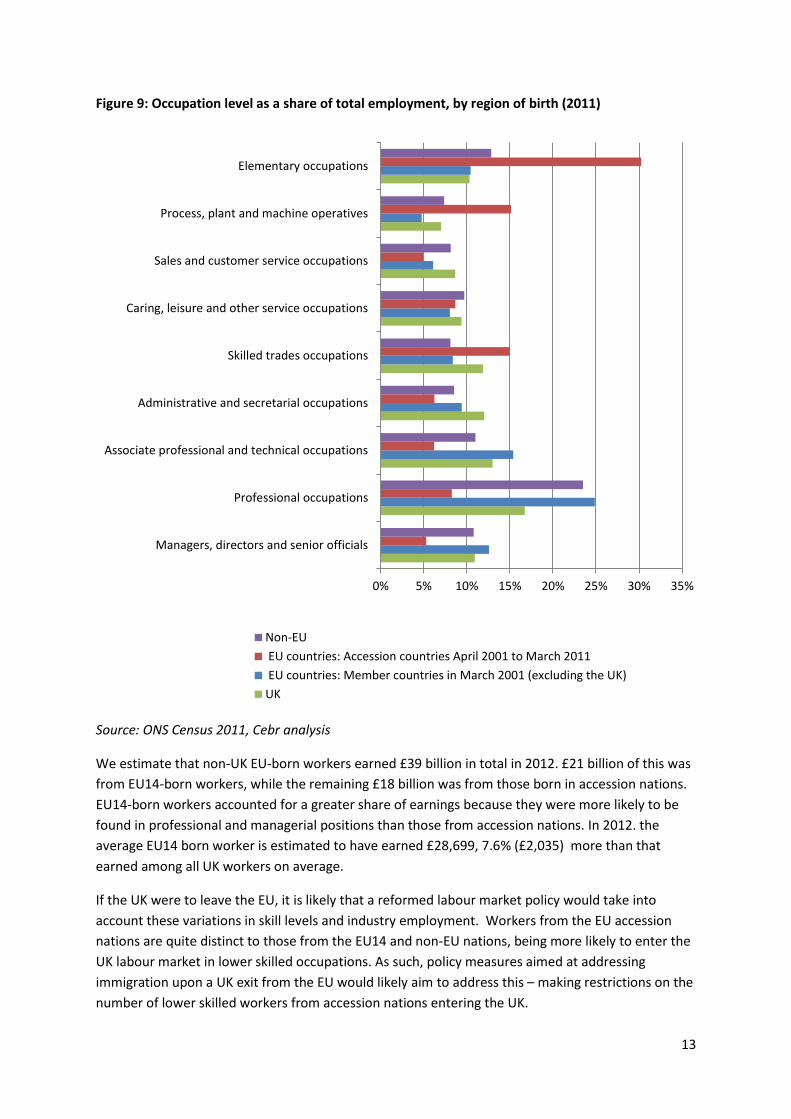
There are also differences in employment by occupational category – splitting the workforce into
different levels of skill. As Figure 9 below shows, those born in the EU14 group of nations are more
likely to be in higher skilled work in the UK, while those born in the accession nations are much more
likely to be in elementary occupations. Those from EU14 nations are more likely than UK workers to
be in higher managerial or professional occupations. While 27.7% of UK-born citizens (6.2 million
individuals) in employment were managers, directors, senior officials or in profession occupations in
2011, this share is almost ten percentage points higher for those from EU14 countries – 37.4%
(260,000 individuals).
0% 1% 2% 3% 4% 5% 6% 7% 8%
Public administration, education and health
Construction
Transport and communication
Distribution, hotels and restaurants
Financial, Real Estate, Professional andAdministrative activities
Manufacturing
EU countries: Member countries in March 2001 (excluding the UK)
EU countries: Accession countries April 2001 to March 2011
13
Figure 9: Occupation level as a share of total employment, by region of birth (2011)
Source: ONS Census 2011, Cebr analysis
We estimate that non-UK EU-born workers earned £39 billion in total in 2012. £21 billion of this was
from EU14-born workers, while the remaining £18 billion was from those born in accession nations.
EU14-born workers accounted for a greater share of earnings because they were more likely to be
found in professional and managerial positions than those from accession nations. In 2012. the
average EU14 born worker is estimated to have earned £28,699, 7.6% (£2,035) more than that
earned among all UK workers on average.
If the UK were to leave the EU, it is likely that a reformed labour market policy would take into
account these variations in skill levels and industry employment. Workers from the EU accession
nations are quite distinct to those from the EU14 and non-EU nations, being more likely to enter the
UK labour market in lower skilled occupations. As such, policy measures aimed at addressing
immigration upon a UK exit from the EU would likely aim to address this – making restrictions on the
number of lower skilled workers from accession nations entering the UK.
0% 5% 10% 15% 20% 25% 30% 35%
Managers, directors and senior officials
Professional occupations
Associate professional and technical occupations
Administrative and secretarial occupations
Skilled trades occupations
Caring, leisure and other service occupations
Sales and customer service occupations
Process, plant and machine operatives
Elementary occupations
Non-EU
EU countries: Accession countries April 2001 to March 2011
EU countries: Member countries in March 2001 (excluding the UK)
UK

14
4. Does immigration have a negative impact on UK workers?
Most empirical research shows little evidence that immigrants have a major negative impact on
wages and unemployment in a country.
If the UK were to leave the EU, it is highly likely that the incumbent government would look to
reform labour market mobility between the UK and the rest of Europe. Both the Labour Party and
the Conservative Party have, in recent months, expressed rhetoric in favour of reduced or more
restricted immigration.
Anti-immigration rhetoric comes despite a wide range of academic literature from across the globe
suggesting that there is little evidence that immigrants have a major negative impact on wages or
unemployment among the native population of a country.
A report by the European Commission (2006)9 concluded that “mobility flows between [established
and accession EU member countries] are very limited and are simply not large enough to affect the
EU labour market in general.” The Commission concluded that migrants actually play an important
role in the EU labour markets by alleviating skills shortages in certain countries. Ultimately, this is
beneficial to economic growth in the EU. A paper by Heinz and Ward-Warmedinger (2006)10 drew
similar conclusions, arguing that “migration of workers from the new EU10 did not crowd out
national workers and had a positive impact on the old EU15 by alleviating labour market shortages in
certain areas and supporting increased employment”.
Longhi et al (2005)11 performed a meta-analysis of 348 estimates of how the wages of native
workers are affected by immigration. Studies were examined from the US, Germany, the
Netherlands, France, Norway, Austria, Israel and Australia. The authors concluded that the overall
impact was very small - “a one percentage point increase in the proportion of immigrants in the
labour force lowers wages across the investigated studies by only 0.119%”.
Gilpin et al (2006)12 conducted an econometric analysis of the impact of new EU A8 migrants on the
UK labour market. In particular they focussed on their impact on the claimant count, as this is not a
sample. They found that “despite anecdotal evidence, there is no discernible statistical evidence
which supports the view that the inflow of A8 migrants [was] contributing to a rise in claimant
unemployment in the UK”.
The implications of EU immigration for UK-born workers can be established by examining events in
other countries. These include the Mariel boatlift into the US from Cuba in 1980 as well as from
Algeria to France in 1962 after independence; Jews to Israel from the former Soviet Union between
1990 and 1994; to Portugal from Mozambique and Angola in the mid-1970s; to several European
9 European Commission (2006), Report on the Functioning of the Transitional Arrangements set out in the
2003 Accession Treaty (period 1 May 2004–30 April 2006), Brussels, 8.2.2006, COM(2006) 48 final. 10
Heinz, F.F. and M. Ward-Warmedinger (2006), ‘Cross-border labour mobility within an enlarged EU’, October, European Central Bank Occasional Paper No. 52. 11
Longhi, S., P. Nijkamp, and J. Poot (2005), 'A meta-analytic assessment of the effect of immigration on wages', Journal of Economic Surveys, 19(3), pp. 451–77. 12
Gilpin, N., M. Henty, S. Lemos, J. Portes and C. Bullen (2006), 'The impact of free movement of workers from Central and Eastern Europe on the UK labour market' Department of Work and Pensions, Working paper #29.

15
countries as a result of the Balkan Wars in the late 1980s and early 1990s; into Austria especially
from the former Yugoslavia, and finally to Germany between 1985 and 1989, particularly from
Turkey. The evidence from these studies is consistent – these immigrant flows have had little or no
significant/substantive impact on any native outcomes13.
13
Source: Blanchflower (2007), ‘The Impact of the Recent Migration from Eastern Europe on the UK Economy’, Bank of England.
16
5. Immigration, economic growth and an EU exit
In higher migration scenarios, economic growth is higher and the budget deficit is lower as a share
of GDP. By creating an inflow of working age individuals, migration going forward will help ensure
more sustainable public finances. If policymakers in the UK were to tighten EU migration,
therefore, this could hinder efforts to control public borrowing over the long-term.
The ONS publishes long-run population projections for a range of different demographic scenarios in
the UK – including scenarios with different levels of net migration.
Using the projections, we have considered the dynamics of working age population, economic
growth and public finances under a range of migration scenarios in the UK:
Central scenario – where long-term net migration averages 140,000 per annum.
A zero net migration scenario
A high migration scenario – where long-term net migration averages 260,000 per annum.
A hypothetical EU exit scenario – where long-term net migration averages 100,000 per
annum from 2018. We have chosen this as the long-term average in this scenario for two
main reasons. Firstly, it is the upper end of the Conservative Party’s aspiration to keep net
migration in the “tens of thousands” per year rather than the “hundreds of thousands”.
Secondly, it reflects what net migration would be close to in our central population scenario,
if net migration from the EU accession A8 countries were reduced to close to zero14.
Without net migration, the working age population15 in the UK will decline, according to ONS
projections, as shown in Figure 8. Under a scenario with zero net migration, the working age
population would decline by 9.1% between 2012 and 2050. Under the “EU exit scenario”, the
working age population would decline by 1.9% over the same time period. In contrast, under the
central population scenario, the working age population would rise by 7.9% and in a scenario where
net migration is higher still, the working age population would rise by 19.1%. This is shown in Figure
10below.
14
In the event of an EU exit, policymakers would likely target migration from these countries to reflect the distinct nature of these migrants, as shown in Section 3 of the report. 15
Here defined as those aged 15-69 across all countries for the sake of comparability.

17
Figure 10: Annual % change in population aged 15-69, 2012-2050
Source: United Nations medium fertility variant (for non-UK countries), ONS population projections,
Cebr analysis
The analysis – based on ONS population projections – is clear. In scenarios with higher migration, the
working age population of the UK makes up a greater share of the total population. This is because
migrants are more likely to be of working age, as shown in Section 3 of this report. Across the range
of countries shown in Figure 11 below, the dependency ratio16 is forecast to rise in all countries
apart from India and Indonesia. In the UK, a scenario with zero net migration would lead to a
dependency ratio of 62.5% in 2050, or 625 dependents for every 1,000 people of working age – this
compares with 51.7% under a high migration scenario.
Under our central population scenario, the dependency ratio would stand at 56.3% in that year. The
EU exit scenario would lead to a higher dependency ratio, of 59.5%, in 2050.
16
Defined as the dependent population as a proportion of the working age population. For the purposes of this cross country comparison the dependent population has been defined here as those aged under 15 and over 70 years of age.
-40% -30% -20% -10% 0% 10% 20% 30% 40% 50% 60%
Japan
Germany
China
UK - zero net migration scenario
UK - EU exit scenario
France
UK - central migration scenario
Brazil
USA
UK - high migration scenario
India
Indonesia

18
Figure 11: Dependency ratio, by country
Source: United Nations medium fertility variant (for non-UK countries), ONS population projections,
Cebr analysis
The scenarios for the working age population have clear implications for UK economic growth; the
higher the working age population, the greater the number of people able to engage in productive
economic activity. As Figure 12 below shows, scenarios with lower migration lead to lower real GDP
growth in the long-term. Compared with the central scenario, the EU-exit scenario would lead to real
GDP being 2.0% lower in 2050-51. This is a GDP loss of £60 billion in real terms (2012-13 prices). The
scenario with zero net migration would lead to a 6.7% (£204 billion) loss of real GDP.
0% 10% 20% 30% 40% 50% 60% 70% 80%
Indonesia
India
Brazil
China
UK - high migration scenario
USA
UK - central migration scenario
France
UK - EU exit scenario
UK - zero net migration scenario
Germany
Japan
2050 2012

19
Figure 12: Annual real GDP growth, long-term projections
Source: Cebr analysis
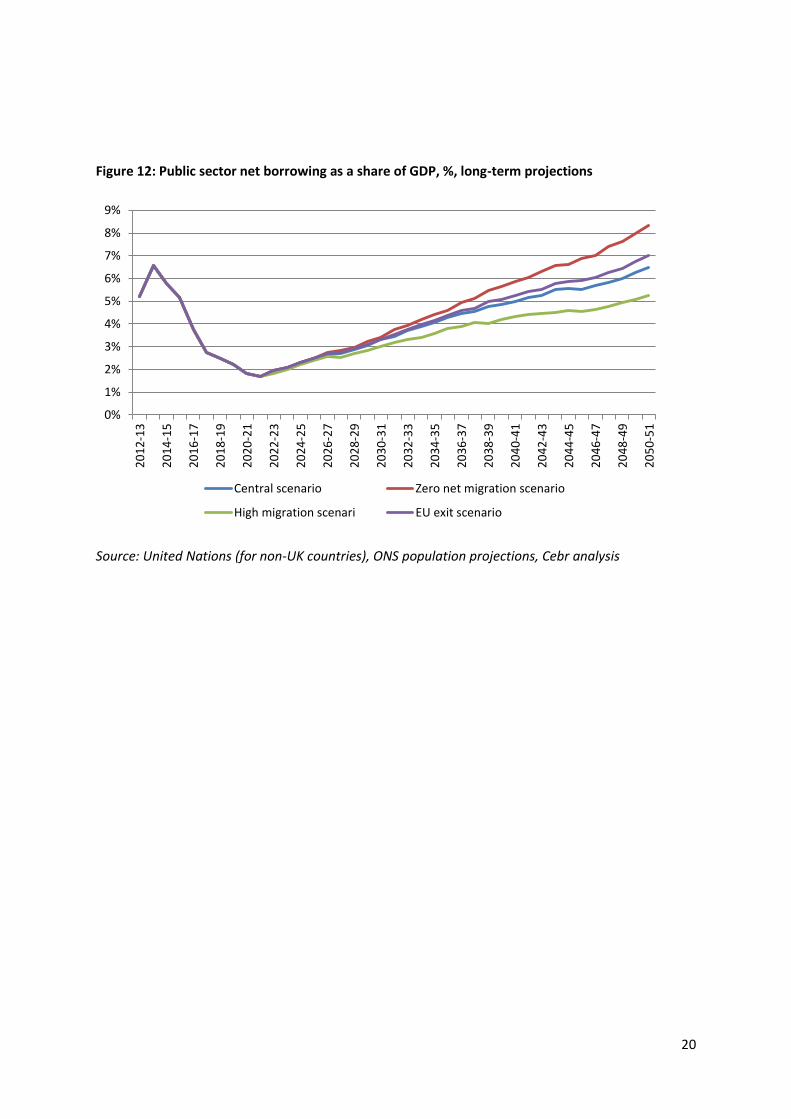
Ultimately, these differences in economic growth rates have implications for the state of the public
finances. With zero net migration, public sector borrowing as a share of GDP is higher compared
with our central and high migration scenarios. This reflects higher numbers of dependents relative to
the size of the working age population in this scenario. Ultimately, without migration to support the
size of the working age population going forward, the public finances would become less
sustainable. This is made clear in Figure 12 below, which presents our modelled estimates of public
sector net borrowing as a share of GDP.
Under the zero net migration and EU exit scenarios, borrowing as a share of GDP stands at 8.3% and
7.0% respectively in 2050. This compares with 6.5% under our central scenario and 5.2% under the
high migration scenario.
0.0%
0.5%
1.0%
1.5%
2.0%
2.5%
20
12
-13
20
14
-15
20
16
-17
20
18
-19
20
20
-21
20
22
-23
20
24
-25
20
26
-27
20
28
-29
20
30
-31
20
32
-33
20
34
-35
20
36
-37
20
38
-39
20
40
-41
20
42
-43
20
44
-45
20
46
-47
20
48
-49
20
50
-51
Central scenario Zero net migration scenario
High migration scenario EU exit scenario
20
Figure 12: Public sector net borrowing as a share of GDP, %, long-term projections
Source: United Nations (for non-UK countries), ONS population projections, Cebr analysis
0%
1%
2%
3%
4%
5%
6%
7%
8%
9%
20
12
-13
20
14
-15
20
16
-17
20
18
-19
20
20
-21
20
22
-23
20
24
-25
20
26
-27
20
28
-29
20
30
-31
20
32
-33
20
34
-35
20
36
-37
20
38
-39
20
40
-41
20
42
-43
20
44
-45
20
46
-47
20
48
-49
20
50
-51
Central scenario Zero net migration scenario
High migration scenari EU exit scenario

21
6. Conclusions
This report suggests that EU migrants play an important role in supporting the UK labour market,
addressing skills shortages in both the professions and in more elementary occupations. Analysis of
Census data suggests little evidence of welfare tourism among EU migrants – they are less likely than
those born in the UK to be unemployed, long-term sick or disabled. This holds true for both
migrants from established EU member countries and those from accession countries that have more
recently joined the EU. Indeed, those from accession countries are even less likely to be
unemployed than those from established EU member nations.
Most empirical research, from both the UK and a wide range of other countries such as the US,
shows that immigration has little to no significantly negative impacts on labour market outcomes for
the natively-born. As such, there appears to be a disconnect between much of the rhetoric on
immigration and what data show, suggesting a significant amount of false perception on the issue.
If the UK were to leave the EU, the incumbent Government may be tempted to tighten immigration
controls in the UK. Ultimately, by curbing the size of the working age population, this is likely to curb
long-term economic growth and result in higher public borrowing as a share of GDP. While leaving
the EU could bring benefits to the UK labour market, for example by paving the way for the removal
of red tape and regulation in the market, these benefits would likely be offset if significant EU
migration controls were imposed.
Non-UK EU-born workers earned £39 billion in total in 2012, bringing a wealth of skills to the UK and
adding value to the economy. The departure of such workers from the UK, or new measures to
prevent EU migration, could hold back economic growth and worsen the position of the public
finances.

22
Disclaimer
Whilst every effort has been made to ensure the accuracy of the material in this document, neither
Centre for Economics and Business Research Ltd (Cebr) nor the report’s authors will be liable for any
loss or damages incurred through the use of the report.
Authorship and acknowledgements
This report has been produced by Cebr, an independent economics and business research
consultancy established in 1993, providing forecasts and advice to City institutions, Government
departments, local authorities and numerous blue chip companies throughout Europe. The main
authors of the report are Charles Davis, Head of Macroeconomics, Scott Corfe, Senior Economist and
Colin Edwards, Economist.
London, August 2013