Embed Size (px)
Citation preview
The Impact of the
Bottle Bill Update
on Jobs in the Economy
An Analysis of Employment in the Recycling Sector
July 2012 Prepared by the Massachusetts Sierra Club and MASSPIRG
Introduction
he Massachusetts Bottle Bill, the nickel deposit on beverage containers, is the state’s most successful recycling and litter prevention program. Since the Bottle Bill's passage, over 35 billion containers have been redeemed, contributing to a healthier environment, cleaner and
safer communities, and a stronger economy. The original Bottle Bill, which was passed in 1982 by the State Legislature, covered only carbonated beverages (soda and beer). Beverages like bottled water, sports drinks, and flavored teas were non-existent when the bill was passed. This year, Massachusetts plummeted from 15th to 21st in CNBC’s annual ranking of the health of each state’s economy, further demonstration that more must be done to stimulate job growth in Massachusetts. One sector with untapped job growth is Massachusetts’ recycling industry, which already employs close to 14,000 people, has a half-billion dollar payroll, and collects $3.2 billion in revenue every year. If the pending Bottle Bill Update is passed (H.890/S.1650), a net increase of 1500 jobs is expected in the state of Massachusetts. In addition to being better for the environment, the recycling industry is a far more effective job creator than the container producing and trash disposal industries. According to research conducted by the E.P.A, “for every 100 jobs created by recycling [in North Carolina] only an estimated 13 were lost in solid waste collection and disposal and virgin material extraction within the state.” Unlike trash disposal programs, recycling programs require workers to both collect recycled materials and refurbish them to be used again. If we were to shift from discarding bottles in landfills and incinerators to recycling and reusing these containers, we could add hundreds of much-needed jobs to the recycling industry in Massachusetts. In particular, when measuring the amount of jobs different recycling programs create, the bottle-deposit system is the clear winner. According to the Container Recycling Institute (CRI), an organization that studies the effects of recycling programs around the country, “deposit-return systems recover approximately three times more beverage container material than curbside recycling.” For every 1000 tons of this material collected, furthermore, approximately 8-12 jobs are added in the recycling sector. Massachusetts’ bottle redemption centers, recycling corporations, and municipal governments expect a net increase of 1500 jobs if the Bottle Bill Update is passed. In the current economic climate, we need every job we can get.
T
Executive Summary The recycling industry has long been a job-creator in Massachusetts. By increasing the amount of recyclable material available in Massachusetts, the Updated Bottle Bill would lead to job growth in the state’s redemption centers and recycling corporations, and those companies that utilize recycled materials. The passage of the Updated Bottle Bill would preserve and add an estimated 1500 jobs to the recycling sector. Corporate Expansion
• Recycling is an important component of Massachusetts’ economy. Massachusetts has two large recycling facilities: Verallia (the world’s second largest manufacturer of glass bottles) in Milford and Strategic Materials (sorts, separates, and prepares glass) in Franklin. Furthermore Owens-Illinois, America’s largest glass bottle manufacturer, which maintains a plant in a neighboring state, is highly dependent on material from the existing Massachusetts bottle bill.
• Verallia and Strategic Materials have both expressed their desire to expand Massachusetts operations. Verallia currently employs approximately 250 people in Massachusetts, Strategic Materials employs 75. The net employment increase of these two companies alone would be 250.
Job Preservation
• Over the past twenty years, approximately half of the state’s 200 redemption centers have been forced to close their doors, and the remaining 100 centers are losing money.
• As proposed in the pending Bottle Bill Update, to keep even with the consumer-price-index, the handling fee paid to state redemption centers should be increased from 2.25¢ to 3.25¢. This is paid for by the bottling industry, not the State, and is separate from the 5¢ deposit.
• As low handling fees continue to bankrupt redemption centers, approximately 500 jobs are in jeopardy.
Additional Employment Increases in the Recycling Sector
• According to the Container Recycling Institute, which has studied the net effects of updating bottle bills in California, New York, Connecticut, Michigan, Oregon, and Maine, Massachusetts can expect to add 500 jobs in addition to the ones mentioned above.
State and Municipal Savings
• The Massachusetts DEP has estimated that with the passage of the Updated Bottle Bill, municipalities can save about $7 million annually in trash disposal and litter pick up costs. .
• The projected increase in government revenue from abandoned deposits is $18,750,000 for the state government.
Net Employment Gain and Revenue Projections
• Using the data supplied above, the net employment gain under an expansion of the Bottle Bill would be 1500+.
Contents Section 1 Returning to Work (Resource Recycling, Dec 2011) Overview of the report by the Container Recycling Institute. Workers are needed in landfilling, curbside recycling and container deposit return, but which sector brings the most much-needed jobs to the struggling U.S. economy? The authors provide a detailed analysis of the positive impact beverage container deposit programs can have on job creation. Section 2 Recycling Means Business (Report by the Institute for Local Self-Reliance) Recycling is an economic development tool as well as an environmental tool. Reuse, recycling, and waste reduction offer direct development opportunities for communities. When collected with skill and care, and upgraded with quality in mind, discarded materials are a local resource that can contribute to local revenue, job creation, business expansion, and the local economic base. Section 3 The Massachusetts Recycling Economy (Mass DEP, Nov., 2010) Some of the economic benefits of recycling and recycling’s contribution to the Commonwealth’s economy. By converting raw materials into products, recycling (including recycling-reliant industries such as paper mills, and reuse and remanufacturing) creates jobs, builds more competitive manufacturing industries and adds significantly to the Massachusetts economy. Section 4 Recycling and Jobs in Massachusetts (Mass Recycle and Mass DEP, March 2012) A study of current and future workforce needs. Recycling is an important part of Massachusetts’ green economy. Massachusetts is home to over 2000 recycling businesses that employ close to 14,000 people with a payroll approaching $500 million annually. Section 5 Other Fiscal Considerations (Data Sources: Mass DOR, Mass DEP) Unclaimed deposits currently provide $33 million annually in state funding. Under the expansion, $19 -20 million in additional unclaimed deposit revenue could be generated, for a total of $50 million in revenue. The addition of these items would be handled under the existing infrastructure for bottle deposits. Section 6 Employment Fact Sheet (Mass Sierra Club, January 2012) A brief overview of the positive employment and business benefits of implementing an update to the Bottle Bill Section 7 Massachusetts Redemption Centers (from DEP data, July 2012) The state’s redemption centers, which process approximately one-third of the State’s deposit redemptions, are in danger of collapse. Section 8 Additional Information Sources for additional information and data.
RR | December 2011 17
W ith less than a year to go before the U.S. election, Democrats and Republicans seem more divided than ever on the issues facing the nation. But
the one thing that does seems to unite all Americans, left or right, is the shared goal of getting people to return to work. The domestic jobs increases associated with waste diversion instead of disposal have been examined in a number of recent studies by a variety of sources, including the Institute for Local Self-Reliance; Pricewaterhouse Coopers in Germany; Eunomia in England; and the Institute of Scrap Industries, Inc. Last month, the Tellus Institute prepared a report, which was re-leased to much fanfare (see page 52 of this magazine for more) that found a 75-percent diversion rate would produce 1.5 mil-lion jobs and provide a tremendous boost to the U.S. economy.
They all report a significant increase in jobs from greater levels of recycling. From wood waste recycling, to tire crumbing, or turn-ing broken glass into new glass bottles, recycling is both good busi-ness and creates jobs. Resource Recycling’s lead story from this past summer (Recycling = Jobs, July 2011) revealed convincing statistics from the U.S. Department of Labor that show robust growth for the recyclable materials industry. Since 2005, the number of people employed in this sector rose by eight percent and during the 10-year period ending 2007, sales rose by nearly 50 percent.
Effectively, the business of resource extraction (mining and oil drilling) and material conversion is transferred “above ground” to where recyclables are collected, transported, processed and convert-ed (secondary process). Equipment and energy costs for resource extraction are replaced by the labor costs associated with resource recovery.
Measuring domestic jobs impacts from recyclingUnderstanding what these jobs impacts are, at each and every stage of extraction or recovery, is what guided new research just released by the Container Recycling Institute (CRI). “Returning to Work: Under-standing the Jobs Impacts From Different Methods of Recycling Bever-age Containers” reports the net gains in full-time-equivalent (FTE) domestic jobs when beverage containers are recovered through various waste management schemes.
The findings include a new excel-based jobs model, Measuring the Impact from Recycling on Jobs Calculator or “MIRJCalc,” which was created by Jeffrey Morris, Sound Resource Management Group with research and analysis from Clarissa Morawski, CM Consulting.
The team set out to quantify, in terms of net impact on domes-tic jobs, the number of FTE jobs associated with every 1,000 tons of
Workers are needed in landfilling, curbside recycling and container deposit return, but Which sector brings the most much-needed jobs to the struggling u.s. economy? our authors provide a detailed analysis of the positive impact beverage container deposit programs can have on job creation. by clarissa moraWski and jeff morris
Reprinted from
18 RR | December 2011
beverage container material recovered and recycled. Materi-als included in the study were beverage containers sold in the U.S., made from aluminum, glass and PET. Collectively, these represent over 220 billion units available for recycling each year, weighing over 1.5 million tons of aluminum, 9.6 million tons of glass, and 2.7 million tons of PET.
Three different materials management schemes were analyzed: container deposit return (CDR); residential curb-side recycling; and disposal. For each option, the research team figuratively “traveled” along the same path that all three materials will travel and identified how many jobs are directly associated with the tonnage throughput along the way.
For example, in the case of glass recovery, there are jobs associated with collection, transportation, processing in a material recovery facility (MRF), more transportation and glass beneficiation (secondary processing or “conversion”). Jobs were counted along the way until the material gets shipped to a product manufacturer. Jobs in manufacturing were excluded because it is confirmed that in most cases ir-respective of whether the raw material is virgin or recovered (secondary), the impact on manufacturing jobs is neutral. In addition, if material like PET is exported overseas, counting jobs stops. Lastly, if any material is lost along the way as “residual” during processing, the counting shifts to the number of jobs associated with disposal of the material.
The research also attempts to quantify job losses that may occur upstream during virgin material extraction when recovered material substitutes for virgin. Extracting raw materials for use in glass bottles, fiberglass and aggregates for example, includes mining for silica, soda ash, aplite, limestone and borates. The raw material “recipes” per ton of manufactured product were provided by manufacturers.
Beverage container throughput (in tons) is based on av-erage recovery rates for state-based CDR systems; residential curbside recycling and enhanced curbside, which includes recycling of containers generated away-from-home, as well as recycling of contain ers generated by multi-family residents and single-family households without access to curbside (households required to self-haul to a recycling depot).
User inputsUsers of MIRJCalc input name of the state, and several pri-mary variables which have a measurable impact on amount of beverage container recovered (e.g., the amount of tonnage to run through the model). The model incorporates state-specific data, such as population; single-family versus multi-family share of households; and beverage sales by type.
For example, in the CDR scenario, the user identifies the de-posit level (a 5-, 10- or 15-cent deposit) which specifies the average performance rate of 75 percent, 85 percent and 95 percent collec-tion, respectively. Users may also enter another recovery rate if they choose to. For the non-CDR scenario, users are asked to provide the percent of eligible households with curbside collection service.
For other important variables, defaults are provided which rep-resent average rates in the U.S. For example, for non-CDR recov-ery, default capture rates are provided for glass, PET and aluminum containers from single- and multi-residential generators with collec-tion services, away-from-home and self-haul recycling. In addition, the proportion of manual versus automated curbside collection is
also assumed at 23 percent and 77 percent, respectively. Users may change the default to better reflect the situation in their state.
Defaults also exist for both CDR and non-CDR options, relat-ing to the export rate for PET, as well as yield loss rates for glass, PET and aluminum. These loss rates are based on reports from the secondary processing industry and represent actual experience with both curbside and CDR streams of material.
The final resultsThe analysis provides a compelling case for increasing recovery rates and maintaining high-quality glass, PET and aluminum recovered
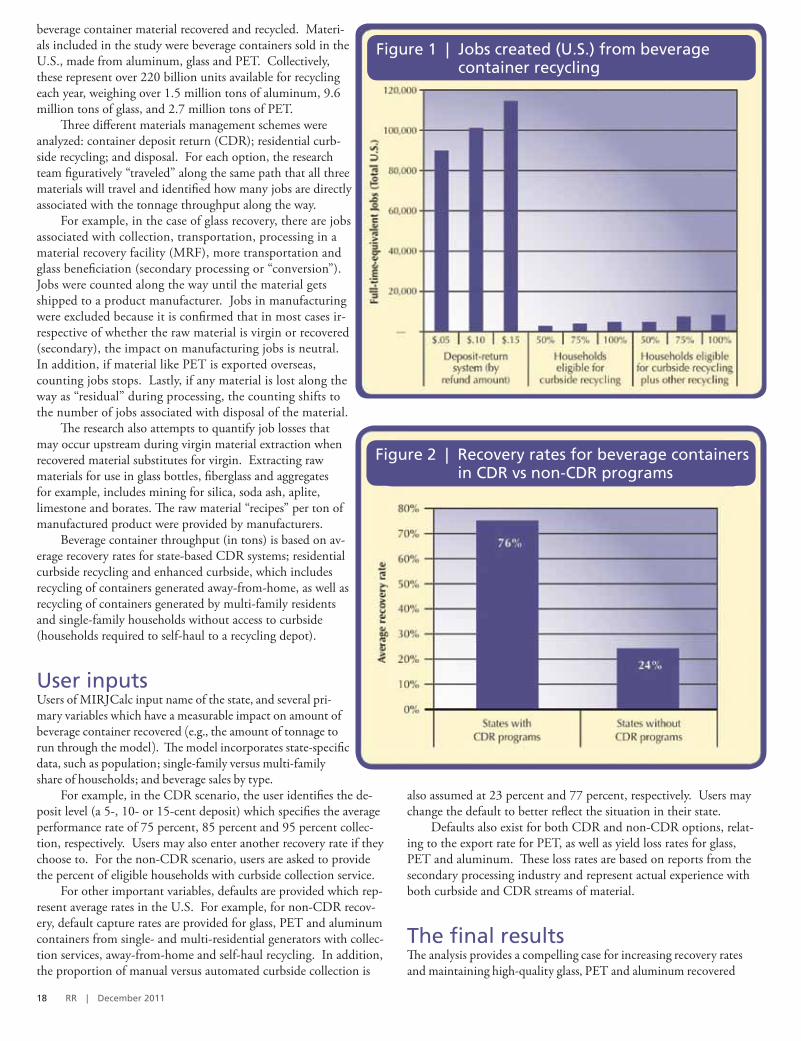
Figure 1 | Jobs created (U.S.) from beverage container recycling
Figure 2 | Recovery rates for beverage containers in CDR vs non-CDR programs
RR | December 2011 19
materials. Maximizing recovery rates ensures the greatest volume of containers moves through each recovery stage and gains the associ-ated domestic jobs. In addition, maintaining high-quality material results in the least amount of yield loss (contamination) to disposal, where there are fewer jobs, ton for ton.
The following provides a summary of findings based on a set of default inputs which are reflective of status quo rates in the U.S. today. While the model is designed for a state-by-state analysis, the results below are for the entire country.
Using deposit return as a means of collecting beverage con-tainers instead of a curbside recycling program creates more jobs. Using primary system parameters as the base scenario (5-, 10-, or 15-cent refund value in a CDR system, and 50-, 75- or 100-per-
cent curbside eligibility for a non-CDR system), deposit-return systems create significantly more jobs. (See Figure 1).
The primary driver of direct jobs from recovery operations is the amount of material (“throughput”) entering and leaving the system. Deposit-return systems recover approximately three times more beverage container material than the closest competitor, curbside recycling. Specifically, in the U.S., deposit-return sys tems recover approximately 76 percent of all beverage containers covered by deposit laws, compared to approxi mately 24 percent of beverage containers collected through curbside programs and other methods (see Figure 2).
The secondary driver of direct jobs in container recycling systems relates to the number of workers needed to collect and sort the containers and transport them to the MRF or second-ary processor. Deposit-return systems require 1.5 to 4.0 times as many employees for these tasks as do curbside systems. Specifically, approximately 7.34 FTEs are required per 1,000 tons of material collected in a deposit-return system, compared to 4.46 FTEs in a manual curbside system and 1.66 FTEs in an automated curbside system.
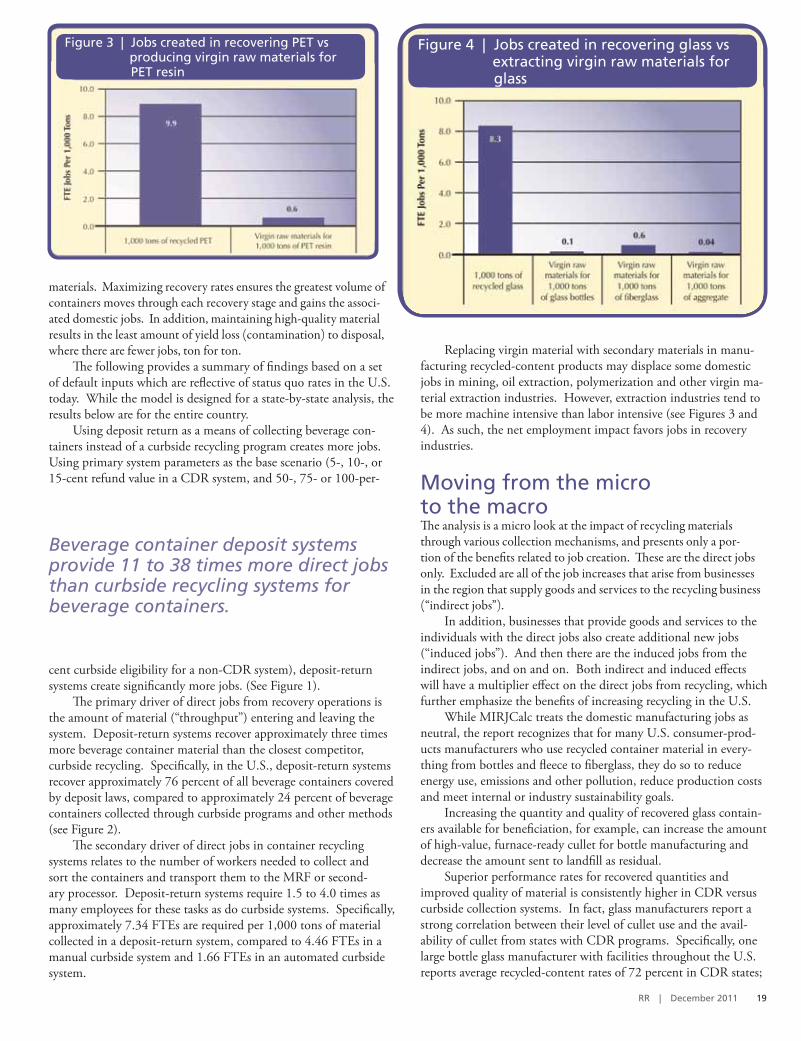
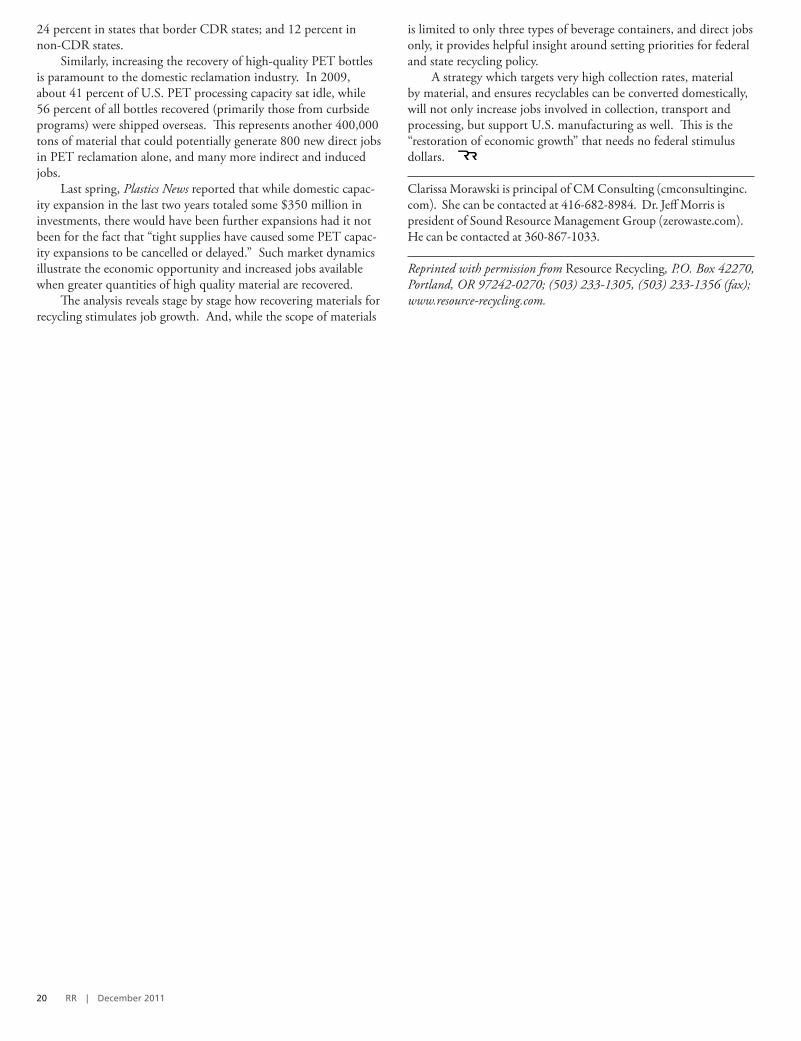
Replacing virgin material with secondary materials in manu-facturing recycled-content products may displace some domestic jobs in mining, oil extraction, polymerization and other virgin ma-terial extraction industries. However, extraction industries tend to be more machine intensive than labor intensive (see Figures 3 and 4). As such, the net employment impact favors jobs in recovery industries.
Moving from the micro to the macroThe analysis is a micro look at the impact of recycling materials through various collection mechanisms, and presents only a por-tion of the benefits related to job creation. These are the direct jobs only. Excluded are all of the job increases that arise from businesses in the region that supply goods and services to the recycling business (“indirect jobs”).
In addition, businesses that provide goods and services to the individuals with the direct jobs also create additional new jobs (“induced jobs”). And then there are the induced jobs from the indirect jobs, and on and on. Both indirect and induced effects will have a multiplier effect on the direct jobs from recycling, which further emphasize the benefits of increasing recycling in the U.S.
While MIRJCalc treats the domestic manufacturing jobs as neutral, the report recognizes that for many U.S. consumer-prod-ucts manufacturers who use recycled container material in every-thing from bottles and fleece to fiberglass, they do so to reduce energy use, emissions and other pollution, reduce production costs and meet internal or industry sustainability goals.
Increasing the quantity and quality of recovered glass contain-ers available for beneficiation, for example, can increase the amount of high-value, furnace-ready cullet for bottle manufacturing and decrease the amount sent to landfill as residual.
Superior performance rates for recovered quantities and improved quality of material is consistently higher in CDR versus curbside collection systems. In fact, glass manufacturers report a strong correlation between their level of cullet use and the avail-ability of cullet from states with CDR programs. Specifically, one large bottle glass manufacturer with facilities throughout the U.S. reports average recycled-content rates of 72 percent in CDR states;
Figure 4 | Jobs created in recovering glass vs extracting virgin raw materials for glass
Figure 3 | Jobs created in recovering PET vs producing virgin raw materials for PET resin
Beverage container deposit systems provide 11 to 38 times more direct jobs than curbside recycling systems for beverage containers.
20 RR | December 2011
24 percent in states that border CDR states; and 12 percent in non-CDR states.
Similarly, increasing the recovery of high-quality PET bottles is paramount to the domestic reclamation industry. In 2009, about 41 percent of U.S. PET processing capacity sat idle, while 56 percent of all bottles recovered (primarily those from curbside programs) were shipped overseas. This represents another 400,000 tons of material that could potentially generate 800 new direct jobs in PET reclamation alone, and many more indirect and induced jobs.
Last spring, Plastics News reported that while domestic capac-ity expansion in the last two years totaled some $350 million in investments, there would have been further expansions had it not been for the fact that “tight supplies have caused some PET capac-ity expansions to be cancelled or delayed.” Such market dynamics illustrate the economic opportunity and increased jobs available when greater quantities of high quality material are recovered.
The analysis reveals stage by stage how recovering materials for recycling stimulates job growth. And, while the scope of materials
is limited to only three types of beverage containers, and direct jobs only, it provides helpful insight around setting priorities for federal and state recycling policy.
A strategy which targets very high collection rates, material by material, and ensures recyclables can be converted domestically, will not only increase jobs involved in collection, transport and processing, but support U.S. manufacturing as well. This is the “restoration of economic growth” that needs no federal stimulus dollars.
Clarissa Morawski is principal of CM Consulting (cmconsultinginc.com). She can be contacted at 416-682-8984. Dr. Jeff Morris is president of Sound Resource Management Group (zerowaste.com). He can be contacted at 360-867-1033.
Reprinted with permission from Resource Recycling, P.O. Box 42270, Portland, OR 97242-0270; (503) 233-1305, (503) 233-1356 (fax); www.resource-recycling.com.
Section 2
Recycling Means Business
(Report by the Institute for Local Self-Reliance)
Strengthening communities for more than
Recycling Means BusinessA report by the Institute for Local Self
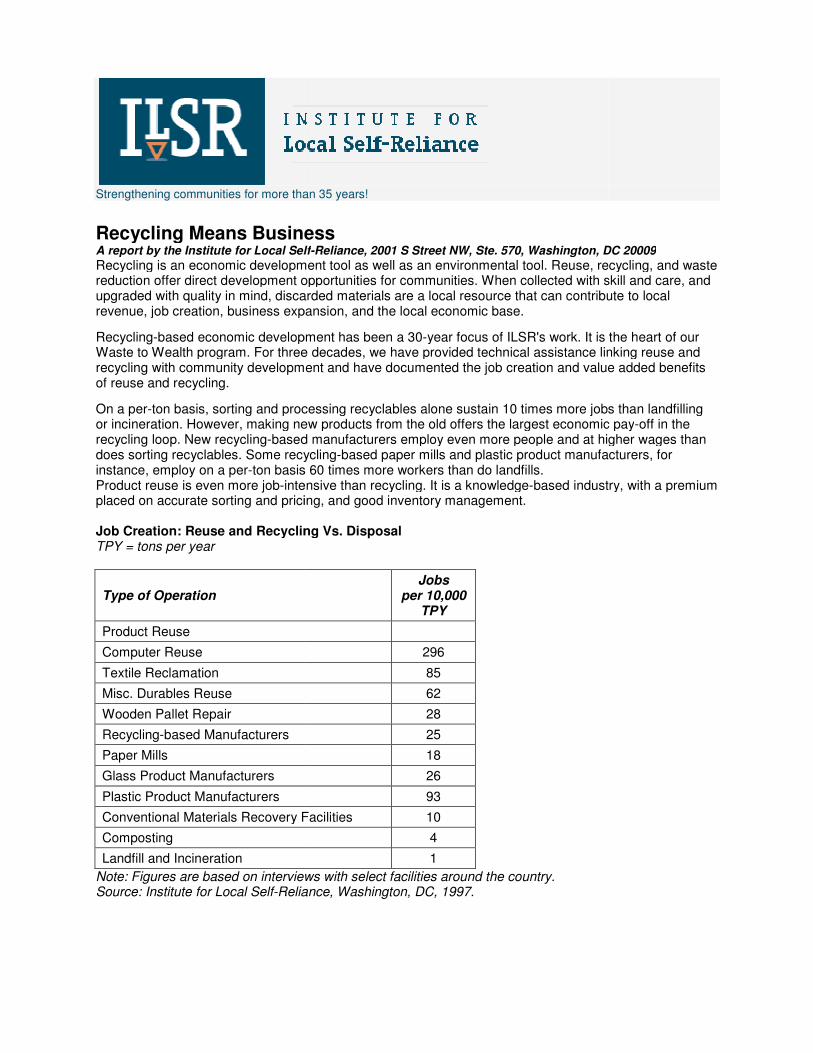
Recycling is an economic development tool as well as an environmental tool. Reuse, recycling, and waste reduction offer direct development opportunities for communities. When collected with skill and care, and upgraded with quality in mind, discarded materials are a local resource that can contribute to local revenue, job creation, business expansion, and the local economic base.
Recycling-based economic development has been a 30Waste to Wealth program. For three decades, we have provided technical assistance linking reuse and recycling with community development and have documentof reuse and recycling.
On a per-ton basis, sorting and processing recyclables alone sustain 10 times more jobs than landfilling or incineration. However, making new products from the old offers the largest ecorecycling loop. New recycling-based manufacturers employ even more people and at higher wages than does sorting recyclables. Some recyclinginstance, employ on a per-ton basis 60Product reuse is even more job-intensive than recycling. It is a knowledgeplaced on accurate sorting and pricing, and good inventory management. Job Creation: Reuse and Recycling Vs. TPY = tons per year
Type of Operation
Product Reuse
Computer Reuse
Textile Reclamation
Misc. Durables Reuse
Wooden Pallet Repair
Recycling-based Manufacturers
Paper Mills
Glass Product Manufacturers
Plastic Product Manufacturers
Conventional Materials Recovery Facilities
Composting
Landfill and Incineration
Note: Figures are based on interviews with select facilities around the country.Source: Institute for Local Self-Reliance, Washington, DC, 1997.
than 35 years!
Recycling Means Business A report by the Institute for Local Self-Reliance, 2001 S Street NW, Ste. 570, Washington, DC 20009
Recycling is an economic development tool as well as an environmental tool. Reuse, recycling, and waste development opportunities for communities. When collected with skill and care, and
upgraded with quality in mind, discarded materials are a local resource that can contribute to local revenue, job creation, business expansion, and the local economic base.
based economic development has been a 30-year focus of ILSR's work. It is the heart of our Waste to Wealth program. For three decades, we have provided technical assistance linking reuse and recycling with community development and have documented the job creation and value added benefits
ton basis, sorting and processing recyclables alone sustain 10 times more jobs than landfilling or incineration. However, making new products from the old offers the largest economic pay
based manufacturers employ even more people and at higher wages than does sorting recyclables. Some recycling-based paper mills and plastic product manufacturers, for
ton basis 60 times more workers than do landfills. intensive than recycling. It is a knowledge-based industry, with a premium
placed on accurate sorting and pricing, and good inventory management.
Job Creation: Reuse and Recycling Vs. Disposal
Jobs per 10,000
TPY
296
85
62
28
25
18
26
93
Conventional Materials Recovery Facilities 10
4
1
Note: Figures are based on interviews with select facilities around the country. Reliance, Washington, DC, 1997.
2001 S Street NW, Ste. 570, Washington, DC 20009
Recycling is an economic development tool as well as an environmental tool. Reuse, recycling, and waste development opportunities for communities. When collected with skill and care, and
upgraded with quality in mind, discarded materials are a local resource that can contribute to local
year focus of ILSR's work. It is the heart of our Waste to Wealth program. For three decades, we have provided technical assistance linking reuse and
ed the job creation and value added benefits
ton basis, sorting and processing recyclables alone sustain 10 times more jobs than landfilling nomic pay-off in the
based manufacturers employ even more people and at higher wages than based paper mills and plastic product manufacturers, for
based industry, with a premium
Value is added to discarded materials as a result of cleaning, sorting, and baling. Manufacturing with locally collected discards adds even more value by producing finished goods. For example, old newspapers may sell for $30 per ton, but new newsprint sells for $600 per ton. Each recycling step a community takes locally means more jobs, more business expenditures on supplies and services, and more money circulating in the local economy through spending and tax payments.
1
Recycling has had a major impact on job creation in local and state economies: • In North Carolina, recycling industries employ over 8,700 people. The job gains in recycling in this
state far outnumber the jobs lost in other industries. For every 100 recycling jobs created, just 10 jobs were lost in the waste hauling and disposal industry, and 3 jobs were lost in the timber harvesting industry.
• A survey of ten northeastern states found that they employ 103,413 people in recycling.2
• A 1992 survey in Washington found that this state had created 2,050 recycling-based jobs since 1989.
3
• Massachusetts employs more than 9,000 people in more than 200 recycling enterprises. About half of these jobs are in the recycling-based manufacturing sector. These businesses represent more than half a billion dollars in value added to the state's economy.
4
• In California, meeting the state's 50% recycling goal is expected to create about 45,000 recycling jobs, over 20,000 of which are slated to be in the manufacturing sector.
5
• In Iowa, a 2001 study found that recycling-related end-use manufacturing operations sustain over 23,000 jobs and generate nearly $3.33 billion in total industrial output. The direct manufacturing jobs in Iowa's recycling industry typically support high wages, on average $47,700 per job.
6
Regional studies of employment and the remanufacturing industry indicate that recycling activities employ more than 2.5% of manufacturing workers. Extrapolating these findings to the entire nation, recycling and remanufacturing activities could account for approximately 1 million manufacturing jobs and more than $100 billion in revenue
.7 Indeed, according to a recent study of recycling's national economic impact, the
U.S. Recycling Economic Information Study, in the year 2000, the recycling and reuse industry sustained approximately 56,000 operations that employed over 1.1 million people, generated an annual payroll of nearly $37 billion, and grossed over $236 billion in annual revenues. The study also documented the "indirect" impact of recycling on support industries, such as accounting firms and office supply companies. It found that the reuse and recycling industry indirectly supports 1.4 million jobs that have a payroll of $52 billion and produce $173 billion in receipts.
8
While employment in the U.S. grew only 2.1% annually between 1967 and 2000, the recycling industry saw 8.3% increase in employment, and 12.7% growth in annual sales. In 1967, the recycling industry consisted of approximately 8,000 companies, employing 79,000 people, with $4.6 billion in sales.
Endnotes
1. Michael Shore, The Impact of Recycling on Jobs in North Carolina, for the NC Recycling Business Assistance Center (Raleigh, North Carolina: July 1995) p. 1.
2. Roy F. Weston, Value Added to Recyclable Materials in the Northeast, C-096-94 (Brattleboro, Vermont: The Northeast Recycling Council, May 1994).
3. Deirdre Grace, "Recycling is Working," The ReMarketable News (Seattle: Clean Washington Center, November 1992), p. 1; and Deirdre Grace (Clean Washington Center, Seattle, Washington), personal communication, December 1, 1992.
4. Robin F. Ingenthron, Value Added by Recycling Industries in Massachusetts (Boston: Department of Environmental Protection, July 1992).
5. California Recycling Means Business California Jobs: A Library of Facts (Sacramento, California: Californians Against Waste Foundation, October 1994); and A Market Development Plan for California (Sacramento, California: the California Integrated Waste Management Board, 1993).
6. "Economic Impacts Study," press release, Recycle Iowa Office, Iowa Department of Economic Development, October 8, 2001. Available on the Web at:http://testing.recycleiowa.org/impact.html
7. Recycling... for the future: Consider the benefits, prepared by the White House Task Force on Recycling (Washington, DC: Office of the Environmental Executive, 1998).
8. U.S. Recycling Economic Information Study, prepared by RW Beck for the National Recycling Coalition, July 2001, available on the Web at:http://www.epa.gov/waste/conserve/rrr/rmd/rei-rw/index.htm
9. "Recycling Sector Has a 30-Year Record of Impressive Growth," press release, Institute for Local Self-Reliance, Washington, DC, January 11, 2002. Available on the Web at: http://www.ilsr.org/recycling/recyclingma.htm.
Section 3
The Massachusetts Recycling Economy
(Mass DEP, Nov., 2010)
Fact sheet benefits of recycling
Economic Benefits of Recycling – Page 1 of 2
f a c t s h e e t
What is the Massachusetts Recycling Economy? Recycling Includes: Collection A diverse network of public programs and private companies collect raw materials generated by residents and businesses. Processing Companies process and convert materials into raw materials and feedstock. Manufacturing Industries manufacture recycled-content products. Reuse & Remanufacturing Includes: Collection Businesses and organizations collect and purchase discarded products and parts. Processing & Resale These entities sort, repair and remanufacture these items and sell them to businesses and consumers.
The Massachusetts Recycling Economy
This fact sheet highlights some of the economic benefits of recycling and recycling’s contribution to the Commonwealth’s economy. It is written for public officials and private financiers who make funding and investment decisions.
What are the economic benefits of the recycling economy? By converting raw materials into products, recycling (including recycling-reliant industries such as paper mills, and reuse and remanufacturing) creates jobs, builds more competitive manufacturing industries and adds significantly to the Massachusetts economy. Direct Impacts:
• 2,018 recycling business establishments
• 13,905 recycling jobs
• $498 million annual payroll
• $3.2 billion receipts Indirect impacts: Recycling businesses also provide important indirect benefits by purchasing goods and services that support other businesses. Recycling businesses also generate an estimated $95 million in state tax revenues. (Source: Recycling Economic Information Study Update, DSM Environmental Services Inc. and Mid-Atlantic Solid Waste Consultants for Northeast Recycling Council, February 2009) How significant are recycling jobs? Job creation from recycling far outweighs disposal on a per ton basis. Jobs and wages increase the more recyclable materials move from collection to processing to manufacturing. Sorting and processing recyclables provides ten times as many jobs than if the same materials were thrown away.
Manufacturers that use recyclable materials to make new products employ even more people, and at higher wages, than sorting and processing companies. For instance, some recycling-based paper mills and plastic product manufacturers employ between 25 and 60 times as many workers as landfills do on a per-ton basis. (Source: Institute for Local Self Reliance, http://www.ilsr.org/recycling/recyclingmeansbusiness.html)
Economic Benefits of Recycling – Page 2 of 2
Massachusetts Department of
Environmental Protection
One Winter Street
Boston, MA 02108-4746
Commonwealth of
Massachusetts
Deval L. Patrick, Governor
Executive Office of Energy
& Environmental Affairs
Ian A. Bowles, Secretary
Department of
Environmental Protection
Laurie Burt, Commissioner
Produced by the
Bureau of Waste Prevention,
November 2010
Printed on recycled paper
This information is available in
alternate format by calling our
ADA Coordinator at
(617) 574-6872.
What are examples of Massachusetts recycling businesses? Massachusetts has a long and proud history of businesses and non-profit organizations that recycle raw materials that would otherwise be thrown away: • Reuse. The Building Materials Resource Center of Roxbury collects and sells used
building materials such as kitchen cabinets, windows, and appliances. Everyone benefits, as contractors save on disposal costs, building owners get a tax deduction, and low-income customers purchase products at discount prices.
• Remanufacturing. LaserTone Corporation of Littleton collects and remanufactures computer printer toner cartridges from businesses, diverting 200 tons of metal and plastic from disposal each year.
• Collection. E.L. Harvey & Sons of Westborough provides collection services for municipalities and businesses that generate recyclable paper and cardboard, bottles and cans and construction and demolition debris. E.L. Harvey sorts materials and sells them to manufacturers who use the raw materials to make recycled-content products.
• Processing. Warehouse Plastics of Millbury recycles scrap plastics by regrinding and selling them to manufacturers that use the plastics in their products.
• Manufacturing. The Newark Group of Fitchburg collects, processes and manufactures recycled paper products. Newark’s mill uses recycled newspaper, magazines and office paper collected from cities and towns to make recycled-content book board for notebooks, hardcover books and game boards.
Interested in other Massachusetts recycling businesses? Massachusetts Recycling Collection and Processing Companies: http://www.earth911.com Massachusetts Recycled Products Manufacturers: http://www.chelseacenter.org New England Reuse: http://www.epa.gov/ne/assistance/reuse/index.html Recycling Economic Information Study Update http://www.nerc.org/documents/recycling_economic_information_study_update_2009.pdf Where do I find additional resources? U.S. Environmental Protection Agency’s Recycling Market Development Program http://www.epa.gov/waste/conserve/rrr/rmd/index.htm
Section 4
Recycling and Jobs in Massachusetts
(Mass Recycle and Mass DEP, March 2012)
Note: Only the Executive Summary is included in this report. The full document can be downloaded from
www.skill-works.org/documents/SW_RecyclingReport3-2012_online.pdf
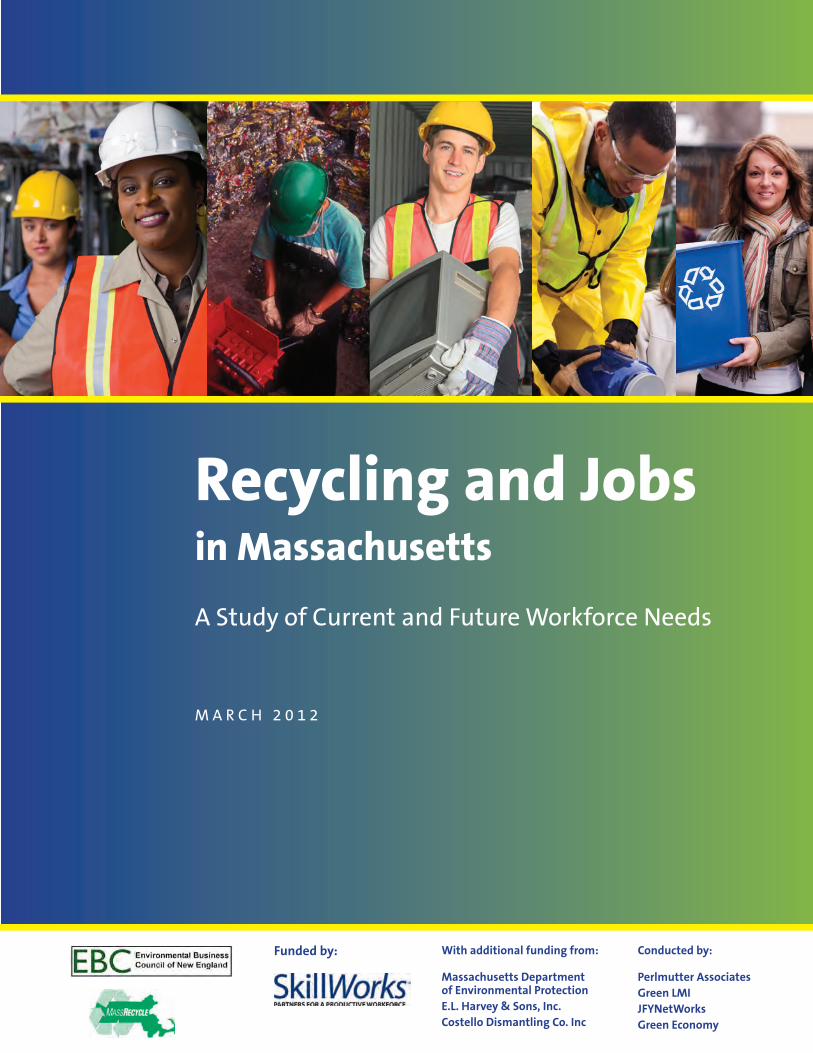
A Study of Current and Future Workforce Needs
Conducted by:
Perlmutter Associates
Green LMI
JFYNetWorks
Green Economy
With additional funding from:
Massachusetts Department of Environmental Protection
E.L. Harvey & Sons, Inc.
Costello Dismantling Co. Inc
Funded by:
M A R C H 2 0 1 2
Recycling and Jobs in Massachusetts
1
I. Executive Summary
The promise of a “green economy” is very real, and recycling jobs are and will
continue to play an important role. Recycling creates environmental benefits
throughout the product chain from reduced pressure to mine new resources through
avoided disposal of discarded products. The recycling industry is a promising job
creator in Massachusetts, with activities in collection, processing, remanufacturing,
manufacturing, organics management, reuse, and deconstruction. The Northeast
Recycling Council’s (NERC) 2009 study1, The Economic Impacts of the Recycling
Industry, found that, in Massachusetts, this sector comprises over 2,000
establishments employing close to 14,000 people, with a payroll approaching
$500 million annually.
The Environmental Business Council (EBC) and MassRecycle joined together to
conduct a study of the existing and anticipated workforce needs of the recycling
industry in Massachusetts. The study employed a three part methodology:
1) a survey of private and public sector recycling organizations to identify where
growth or contraction is expected and the issues employers face in finding qualified
employees; 2) interviews with private sector employers in industries representative
of growth sectors to gain an understanding of their organizational structure and
issues finding qualified workers; and 3) interviews with employees of representative
industries to learn more about their job experience.
There is no one ‘recycling’ industry. Rather, recycling is a series of activities that cut
across industries. NERC identified 26 separate activities falling into three categories:
1) Recycling Industries (public or private sector collection and processing of
recyclables); 2) Recycling Reliant Industries (turning recyclables into new products);
and 3) Reuse or Remanufacturing. Many of these employers, however, perform
activities that fit into more than one category. For the purposes of this report, an
additional activity was included- government recycling coordination.
The survey found that, despite the slow economy and the decrease in recyclable
materials recovered in recent years, there is optimism about the growth of the
recycling industry over the next two years. Almost one-third of the private sector
employers and twelve percent of the public sector employers are expecting to hire new,
permanent recycling employees. These are defined as full-time or part-time permanent
workers that spend at least half of their time on work related to recycling or recycled
materials.
In the private sector, a 15% growth in recycling jobs over the next two years is
expected. This translates into 1,200 new positions. In the public sector, a 5% growth
is expected. The highest rate of growth is expected in the Reuse and Remanufacturing
sector, followed by Recycling Industries.
1 http://nerc.org/projects/completed_projects.html#reiupdate
Survey respondents were
asked what two biggest
general skills deficiencies
they found in recent entry
or mid-level hires. Both
public and private sector
respondents reported
technical competence
by far as being the
biggest deficiency.
4
In a roundtable discussion with employees of recycling companies, most employees
reported that they were not necessarily attracted to their jobs because they were in
the environmental field. However, being in these jobs has made them more aware and
active recyclers. They found their jobs in varying ways, including word of mouth and
craigslist. Workers also reported that their job training has been on-the-job, and that
they would like additional training in management and leadership and other skills for
the job. It was clear that environmental health and safety would also be important
training topics.
This study discusses several findings that can help workforce development programs
in the state support recycling companies:
A. Recycling industry employer engagement with the workforce development
community needs improvement—creating lasting partnerships will take time,
but will pay off.
B. The recycling industry needs a regional approach—recycling industries are not
uniform across the Commonwealth.
C. The recycling industry in Massachusetts needs an economic development
strategy at least as much as a workforce strategy—the workforce development
community should develop a relationship with the Massachusetts DEP and
MassRecycle.
D. Incumbent workers in the Massachusetts recycling industry want and need
high quality training—including workforce readiness, supervisor and leadership
education, and health and safety.
E. Promoting recycling jobs as “green” may not be effective as a recruitment tool
in some job categories, but greater eco-awareness comes from working in the
recycling field.

Section 5
Other Fiscal Considerations
(Data sources: Mass DOR, Mass DEP)
Other Fiscal Considerations
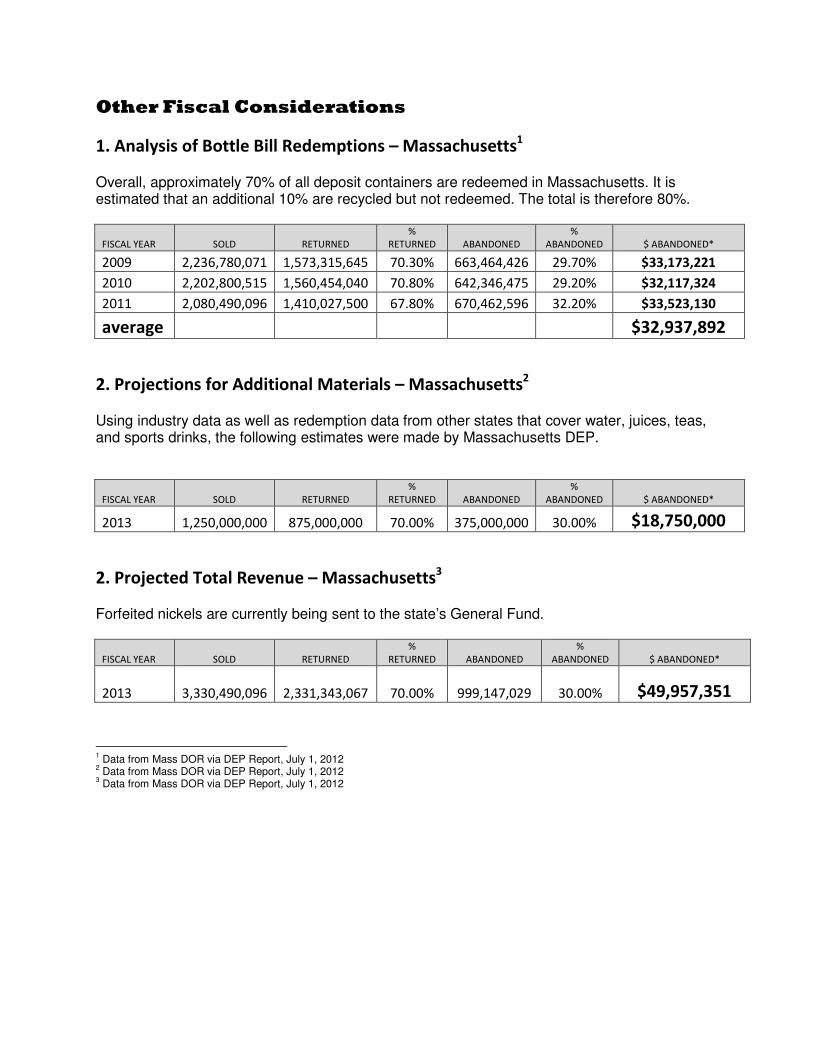
1. Analysis of Bottle Bill Redemptions – Massachusetts1
Overall, approximately 70% of all deposit containers are redeemed in Massachusetts. It is estimated that an additional 10% are recycled but not redeemed. The total is therefore 80%.
FISCAL YEAR SOLD RETURNED
%
RETURNED ABANDONED
%
ABANDONED $ ABANDONED*
2009 2,236,780,071 1,573,315,645 70.30% 663,464,426 29.70% $33,173,221
2010 2,202,800,515 1,560,454,040 70.80% 642,346,475 29.20% $32,117,324
2011 2,080,490,096 1,410,027,500 67.80% 670,462,596 32.20% $33,523,130
average $32,937,892
2. Projections for Additional Materials – Massachusetts2
Using industry data as well as redemption data from other states that cover water, juices, teas, and sports drinks, the following estimates were made by Massachusetts DEP.
FISCAL YEAR SOLD RETURNED
%
RETURNED ABANDONED
%
ABANDONED $ ABANDONED*
2013 1,250,000,000 875,000,000 70.00% 375,000,000 30.00% $18,750,000
2. Projected Total Revenue – Massachusetts3
Forfeited nickels are currently being sent to the state’s General Fund.
FISCAL YEAR SOLD RETURNED
%
RETURNED ABANDONED
%
ABANDONED $ ABANDONED*
2013 3,330,490,096 2,331,343,067 70.00%
999,147,029 30.00% $49,957,351 1 Data from Mass DOR via DEP Report, July 1, 2012 2 Data from Mass DOR via DEP Report, July 1, 2012 3 Data from Mass DOR via DEP Report, July 1, 2012
Section 6
Employment Fact Sheet
(Mass Sierra Club, January 2012)
Bottle Bill Fact Sheet: Jobs An expansion of the bottle bill will add jobs to the economy. A report by the Container Recycling Institute, which monitors beverage container use, disposal, and recycling, shows that Michigan, California, Maine, and New York, all of which have recently updated their bottle bills, have all showed significant net job gains. Studies have shown that in every state that has a bottle bill there has been a significant increase in jobs related to the bottle bill. The existing Bottle Bill employs personnel in redemption centers, retail outlets, transportation companies, recycling material processors, and in the textile industry. Many of the firms that benefit from the current 2.2 BILLION recycled containers
1 are small and family-held companies.
The majority of the redemption centers are also small businesses, which employ youth and others who depend on part-time jobs.
2
Recycling creates 8-25 times more jobs than disposal Recycling has made a vital contribution to job creation and economic development. Recycling creates or expands businesses that collect, process, and broker recovered materials as well as companies that manufacture and distribute products made with recovered materials. Numerous studies have documented the billions of dollars invested and the thousands of jobs created by recycling. One such study documented that recycling activities support more than 8,800 jobs in the state of North Carolina, most of which are in the private sector
3. The study also found that
recycling was a net job creator - for every 100 jobs created by recycling only an estimated 13 were lost in solid waste collection and disposal and virgin material extraction within the state.
4 A
2010 study, conducted in the UK, showed similar job gains5.
Needed Materials The vast majority of the containers that would be covered under the updated Bottle Bill are made of polyethylene terephthalate (PET). PET is easily recyclable; recycled PET plastic is primarily used for carpeting, curtains, food packaging, upholstery, and clothing, especially Polartec-type fleece products – which are made right here in Lawrence, Lowell, Canton, Cummington, Waltham, North Attleboro, Ware, Somerville, West Springfield, and Westport Mass. There is a severe national shortage of recycled PET, since nationally only 20% of all PET bottles are recycled. At the same time, the nation’s disposal of PET bottles is skyrocketing. In 2003, an estimated 2.8 BILLION pounds of PET beverage bottles were sent to our landfills. The glass generated from the state’s bottle bill is used to make new bottles. Both Verallia and Owens-Illinois, America’s two largest bottle manufacturers, have noted an insufficient supply of recycled glass feedstock. Curbside-collected glass cannot be used for manufacturing bottles; it’s typically used in landfills as a type of gravel.
1 MA Bottle Bill Return Rate Information FY1990-present (DEP Report From DOR) 2 Massachusetts Container Deposit Law Analysis, Bentley College, Bentley Service Learning Center 3 The Impact of Recycling on Jobs in North Carolina, NC Office of Waste Reduction, Department of Environment, Health, and Natural Resources, Report July 1995. 4 U.S. Environmental Protection, Puzzled About Recycling's Value? Look Beyond the Bin, US EPA Agency Office of Solid Waste And Emergency Response, January 1998 5 Increased recycling could create 50,000 jobs, report finds. The Guardian (UK), Sept 14, 2010.
Section 7
Massachusetts Redemption Centers
from DEP data, July 2012
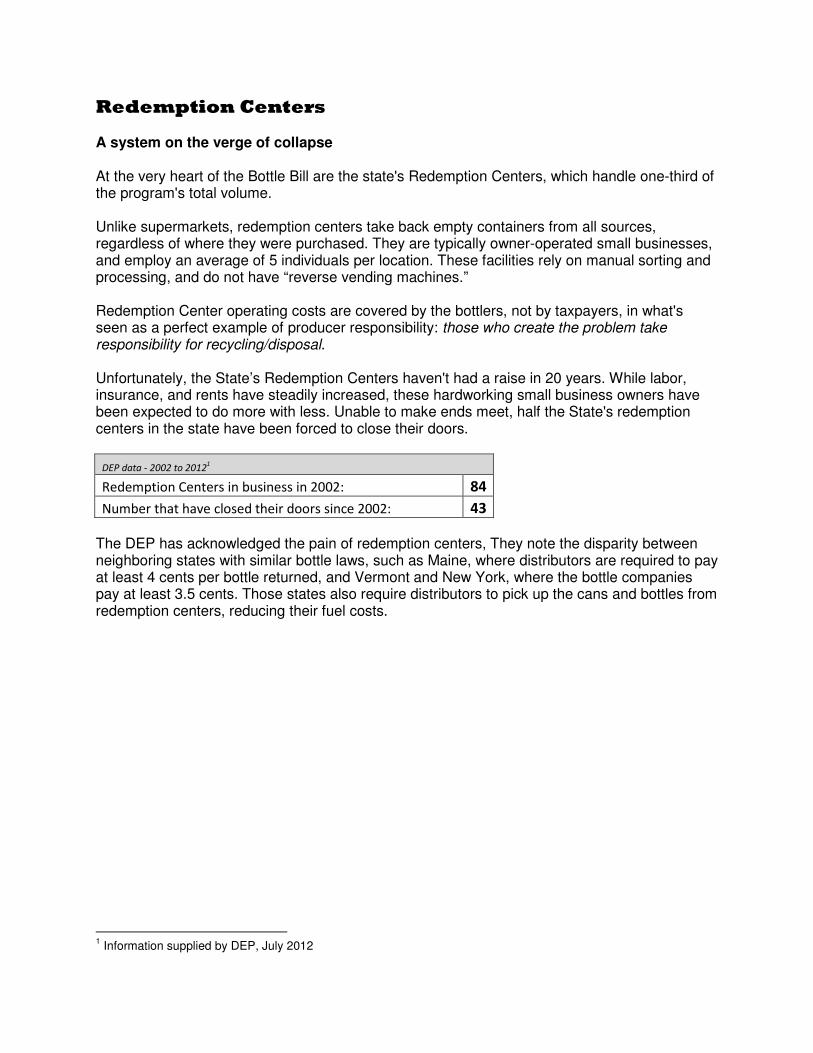
Redemption Centers
A system on the verge of collapse At the very heart of the Bottle Bill are the state's Redemption Centers, which handle one-third of the program's total volume. Unlike supermarkets, redemption centers take back empty containers from all sources, regardless of where they were purchased. They are typically owner-operated small businesses, and employ an average of 5 individuals per location. These facilities rely on manual sorting and processing, and do not have “reverse vending machines.” Redemption Center operating costs are covered by the bottlers, not by taxpayers, in what's seen as a perfect example of producer responsibility: those who create the problem take responsibility for recycling/disposal. Unfortunately, the State’s Redemption Centers haven't had a raise in 20 years. While labor, insurance, and rents have steadily increased, these hardworking small business owners have been expected to do more with less. Unable to make ends meet, half the State's redemption centers in the state have been forced to close their doors.
DEP data - 2002 to 20121
Redemption Centers in business in 2002: 84
Number that have closed their doors since 2002: 43
The DEP has acknowledged the pain of redemption centers, They note the disparity between neighboring states with similar bottle laws, such as Maine, where distributors are required to pay at least 4 cents per bottle returned, and Vermont and New York, where the bottle companies pay at least 3.5 cents. Those states also require distributors to pick up the cans and bottles from redemption centers, reducing their fuel costs. 1 Information supplied by DEP, July 2012

Section 8
Additional Information
Additional Information
Massachusetts Sierra Club 10 Milk Street, Suite 632 Boston MA 02108 James McCaffrey, [email protected], 617-423-5775 Phil Sego, [email protected], 617-807-0311 MASSPIRG 44 Winter Street, 4th Fl. Boston MA 02108 Janet Domenitz, [email protected] Mass Recycle Edward Hsieh 617-338-0244, [email protected] League of Women Voters, Massachusetts Lynn Wolbarst, LWVMA Environmental Specialist [email protected], 781-223-3985 (cell) Container Recycling Institute 4361 Keystone Ave. Culver City, CA 90232 Susan V. Collins, (310) 559-7451, [email protected] Massachusetts Department of Environmental Protection One Winter Street Boston MA 02108 Sean Sylver, 617-292-5747, [email protected] Bottle Bill’s Redemption Center 11 Claflin St Framingham, MA 01702 Tom Casey, (508) 879-2511, cell 774-279-0604