Embed Size (px)
Citation preview

University of Arkansas, Fayetteville University of Arkansas, Fayetteville
ScholarWorks@UARK ScholarWorks@UARK
Theses and Dissertations
5-2020
The Impact of the Arkansas Scholarship Lottery on College The Impact of the Arkansas Scholarship Lottery on College
Choice and Completion of Adult Students Choice and Completion of Adult Students
Collin Callaway University of Arkansas, Fayetteville
Follow this and additional works at: https://scholarworks.uark.edu/etd
Part of the Accessibility Commons, Adult and Continuing Education Commons, Education Economics
Commons, and the Higher Education Commons
Citation Citation Callaway, C. (2020). The Impact of the Arkansas Scholarship Lottery on College Choice and Completion of Adult Students. Theses and Dissertations Retrieved from https://scholarworks.uark.edu/etd/3599
This Dissertation is brought to you for free and open access by ScholarWorks@UARK. It has been accepted for inclusion in Theses and Dissertations by an authorized administrator of ScholarWorks@UARK. For more information, please contact [email protected].

The Impact of the Arkansas Scholarship Lottery on
College Choice and Completion of Adult Students
A dissertation submitted in partial fulfillment
of the requirements for the degree of
Doctor of Education in Adult and Lifelong Learning
by
Collin Callaway
University of Central Arkansas
Bachelor of Science in Psychology, 1997
University of Arkansas Little Rock
Master of Social Work, 2000
May 2020
University of Arkansas
This dissertation is approved for recommendation to the Graduate Council.
Kit Kacirek, Ed.D.
Dissertation Director
Michael T. Miller, Ed.D. M. Wade Derden, Ph.D.
Committee Member Committee Member
Abstract
In 2008, Arkansas citizens overwhelmingly supported a referendum to legalize a state-run
lottery to support college scholarships. The Arkansas General Assembly passed a law in 2009
that detailed administration and procedures of the lottery, and students first received scholarships
(branded as the Academic Challenge Scholarship) in fall 2010. The program was largely
modeled after other state-run scholarships with two major exceptions: policy makers
intentionally established lower eligibility requirements and included adult students. This study
measured the impact of the state lottery funded Academic Challenge Scholarship on adult
college choice and completion. Findings included significant demographic and college choice
differences between recent high school graduates and adults. For adult students specifically,
findings indicated significant differences in college choice and completion by demographic
variables of gender, race or ethnicity, and socioeconomic status. These findings contribute to the
scarce literature on the impact of state scholarship lotteries on adults, and they have significant
implications for policy and future research.

Table of Contents
Chapter One: Introduction 1
Chapter Two: Literature Review 10
Chapter Three: Methodology 42
Chapter Four: Results and Findings 49
Chapter Five: Conclusions and Recommendations 73
References 86
IRB Protocol 93
Data Sharing Agreement 94

List of Tables
Table 1: Rate of Population with at Least an Associate Degree 3
Table 2: Additional Requirements for Nontraditional Students 22
Table 3: Annual Award Amounts 23
Table 4: Annual Recipient Frequency by Award Category 52
Table 5: Gender Frequency by Award Category 52
Table 6: Race or Ethnicity Frequency by Award Category 53
Table 7: Pell Eligibility Frequency by Award Category 53
Table 8: Concurrent Credit Frequency by Award Category 53
Table 9: High School Type Frequency by Award Category 54
Table 10: Remediation Frequency by Award Category 54
Table 11: Award Category Cross Tabulation by Gender 55
Table 12: Award Category Cross Tabulation by Race or Ethnicity 55
Table 13: Award Category Cross Tabulation by Pell Eligibility 56
Table 14: Award Category Cross Tabulation by Concurrent Credit 56
Table 15: Award Category Cross Tabulation by High School Type 57
Table 16: Award Category Cross Tabulation by Remediation 57
Table 17: Significance of Award Category Cross Tabulation by Demographic 58
Table 18: Award Category Cross Tabulation by Institution Type 59
Table 19: Gender Cross Tabulation by Institution Type 60
Table 20: Gender Cross Tabulation by Enrollment Status 60
Table 21: Race or Ethnicity Cross Tabulation by Institution Type 61
Table 22: Race or Ethnicity Cross Tabulation by Enrollment Status 61

Table 23: Pell Eligibility Cross Tabulation by Institution Type 62
Table 24: Pell Eligibility Cross Tabulation by Enrollment Status 62
Table 25: Significance of College Choice Cross Tabulation by Demographic 63
Table 26: Award Cohort Cross Tabulation by Institution Type 64
Table 27: Award Cohort Cross Tabulation by Enrollment Status 64
Table 28: Significance of Award Cohort Cross Tabulation by College Choice 65
Table 29: Gender Cross Tabulation by Completion 66
Table 30: Gender Cross Tabulation by Highest Degree 66
Table 31: Race or Ethnicity Cross Tabulation by Completion 67
Table 32: Race or Ethnicity Cross Tabulation by Highest Degree 68
Table 33: Pell Eligibility Cross Tabulation by Completion 68
Table 34: Pell Eligibility Cross Tabulation by Highest Degree 69
Table 35: Significance of Completion and Highest Degree Cross Tabulation by
Demographic 69

1
Chapter 1
Introduction
In 2008, Arkansas citizens overwhelmingly supported a referendum to legalize a state-run
lottery to support college scholarships. The Arkansas General Assembly passed a law in 2009
that detailed administration and procedures of the lottery, and students first received scholarships
(branded as the Academic Challenge Scholarship) in fall 2010. The program was largely
modeled after other state-run scholarship lotteries in Georgia, Tennessee, and Florida with two
major exceptions: policy makers intentionally established lower eligibility requirements and
included adult students in order to maximize access. In fact, Arkansas was the first state to
launch its scholarship lottery with adult students included, with Tennessee amending its program
to include adult students in 2008.
To date, revenue from the Arkansas Scholarship Lottery has provided $803 million in
Academic Challenge Scholarship awards to 542,307 Arkansas college students (Arkansas
Scholarship Lottery, 2019). This investment in higher education makes the Academic Challenge
Scholarship a significant policy lever with great potential to promote higher education for adult
students, particularly those who are historically underrepresented.
Problem
The impact of scholarship lotteries on college choice and completion is well documented
for states with more established programs. Since most states did not originally include adult
students in eligibility requirements, research on the impact of such programs is scarce. With nine
years of data now available since the launch of the Academic Challenge Scholarship, review of
its impact on college choice and completion for adults is now possible, which would add to

2
existing literature and inform policy makers of potential changes that could positively impact
adult students.
Additionally, existing research on other state scholarship lotteries indicate differing
impacts on college choice and completion for varying demographics of gender, race or ethnicity,
and socioeconomic status. There is some evidence to support similar findings in Arkansas, but it
is limited to students who recently graduated from high school. There is no analyses on the
Academic Challenge Scholarship to determine whether these differing demographic patterns are
applicable to adult students. Disaggregated data is imperative in designing policies that promote
equitable access and attainment for adult students.
Context of the Problem
An educated population has many benefits. For the individual, a college degree means a
stronger likelihood of being employed, earning more money, and owning a home (Navient,
2017), and median earnings increase significantly with each level of postsecondary attainment
(Carnevale & Cheah, 2018). For the state and the nation, an educated and skilled population
means a stronger economy.
The Georgetown University Center on Education and the Workforce (Carnevale & Smith,
2012) projected that nationally, 65% of jobs would require some form of postsecondary
education and training by 2020. That same prediction for the South was only 59% (the same as
the national average nearly a decade ago) and even lower for Arkansas at 51%. Meanwhile, the
rate of Arkansans with any credential beyond high school, including short term and industry
recognized certificates, is only 41.5%, which is lower than the national rate of 47.6% (Lumina,
2019). Arkansas’ inability to meet employment demands and keep up with the nation,
particularly neighboring states, significantly limits economic growth.

3
To increase attainment and to better meet employment demands, Arkansas must look to
adults, especially given the projected decline in the traditional age college-going population. Due
to falling birth rates, Arkansas will have 4,000 fewer students in Kindergarten than in 10th grade
in 2022 (Gates, 2019), leading to future reductions in the annual number of high school
graduates. Knocking at the College Door (2019) projects that Arkansas will graduate 32,600 high
school seniors in 2025 and drop to 29,500 by 2031. Arkansas cannot focus on recent high school
graduates alone; state policy must prioritize adult student college access and attainment.
While Arkansas lags the nation in credentials beyond high school, racially or ethnically
diverse populations are even further behind. Lumina (2019) disaggregated attainment rates for
Arkansans with at least an associate degree, and results indicate that most non-White populations
have much wider gaps. Results are detailed in Table 1.
Table 1: Rate of Population with at Least an Associate Degree
Race/Ethnicity National Arkansas
All Populations 42.4% 32.5%
Asian American and Pacific Islander 62.7 50.5
White 47.1 32.5
American Indian 24.5 25.8
Hispanic 23.7 13.9
Demographic factors are also known to impact college choice. African American and
Hispanic students are more likely to enroll in community colleges and are not proportionately
represented in selective colleges (Carnevale, Van Der Werf, Quinn, Strohl, & Repnikov, 2018).
Low-income populations, who are more likely to be African American or Hispanic, are less
likely to attend college; but when they do enroll, they are more likely to work and select sub-
baccalaureate degree programs (Carnevale & Smith, 2018). Location also matters. Students in

4
rural communities are more likely to graduate from high school, but they are less likely to enroll
in college compared to those in urban and suburban communities (Lumina Foundation Focus,
2019).
Racial and ethnic inequities in college access and attainment are of increasing concern
given projected national demographic changes. Brookings Institute projects that the nation will
become minority White (49.7%) by 2045, with Hispanics comprising 24.6%, African Americans
13.1%, and Asians 7.9% (Frey, 2018). If these inequities persist, the nation will see a decline in
the overall rate of citizens with degrees, leaving jobs unfilled and exacerbating income
inequities. The impact on the economy would be devastating. According to the National Equity
Atlas (2019):
America’s demography is changing—and the nation’s economic fate will hinge on how
we respond to these changes. As the population grows more diverse and people of color
become the majority, equity—just and fair inclusion—has become an urgent economic
imperative. Reversing the trends of rising inequality and stagnant wages and ensuring
that everyone can participate and prosper are critical to build a strong, competitive
economy in the decades to come.
Purpose
The purpose of this study was to measure the impact of the Academic Challenge
Scholarship (ACS) on college choice and completion for adult students, and to determine the
policy implications of that impact. Demographics and college choices of students in the
traditional award category (ACST) were compared to students ages 24 and older in the
nontraditional award category (ACSNT 24+). For the ACSNT 24+ award category only, college
choice and completion were disaggregated by gender, race or ethnicity, and Pell eligibility, and
the impact of reductions in award amounts on college choice were measured. Award categories
are defined in chapter two.

5
Research Questions
1. Do demographics differ between Academic Challenge Scholarship recipients in the
ACST and ACSNT 24+ award categories?
2. Do college choices differ between Academic Challenge Scholarship recipients in the
ACST and ACSNT 24+ award categories?
3. Do college choices differ between Academic Challenge Scholarship recipients in the
ACSNT 24+ award category when disaggregated by demographics?
4. Do reductions in award amounts impact the college choices of Academic Challenge
Scholarship recipients in the ACSNT 24+ award category?
5. Does degree completion differ between Academic Challenge Scholarship recipients in the
ACSNT 24+ award category when disaggregated by demographics?
Limitations
Several environmental factors that could impact college choice and completion for adult
students were not considered in this study.
1. The price of tuition and other costs of attendance have increased while Academic
Challenge Scholarship award amounts have decreased, widening the affordability gap.
Affordability disproportionately affects low-income students who lack resources to make
up the difference. This potentially impacted college choice and completion for Academic
Challenge Scholarship recipients.
2. Changes in the economy impacting employment opportunities are known to impact
college choice and completion. The Academic Challenge Scholarship launched at the tail
end of the Great Recession, during which record numbers of adults enrolled in college in
order to obtain skills needed for employment. These economic conditions potentially

6
impacted college choice and completion for Academic Challenge Scholarship recipients.
Since then, unemployment has dropped to record lows.
3. Arkansas has undertaken a significant statewide effort over the last 10 years to initiate
student success programs that improve college access and completion, including
developmental education redesign and multiple measures for gateway course placement.
These efforts potentially impacted college completion for Academic Challenge
Scholarship recipients.
Definitions
1. Academic Challenge Scholarship: The scholarship funded by revenue from the Arkansas
Scholarship Lottery.
2. Adult Student: A student who is 24 years of age or older, thereby considered financially
independent by the U.S. Department of Education for purposes of federal financial aid
eligibility.
3. Low-income Student: A student who is eligible for a federal Pell grant at any level.
4. Nontraditional Student Award Category: The award category for the Academic Challenge
Scholarship for any recipient who does not meet the eligibility requirements of the
traditional student award category. Award categories are defined in chapter two.
5. Racially or Ethnically Diverse Student: A student who indicates a race or ethnicity other
than White or Caucasian.
6. Traditional Student: A first-time, full-time student enrolled in college in or before the fall
semester immediately following high school graduation.
7. Traditional Student Award Category: The award category for the Academic Challenge
Scholarship for any recipient who enrolls as a first-time, full-time student in or before the

7
fall semester immediately following high school graduation. Award categories are
defined in chapter two.
Conceptual Framework
The state lottery funded Academic Challenge Scholarship was intended to provide access
to college by reducing cost and to increase the number of citizens with college degrees. The goal
of this study was to measure the impact of the scholarship on college choice and completion for
adult students with a focus on demographics of gender, race or ethnicity, and socioeconomic
status. Therefore, the conceptual framework for this study was the role of financial aid in college
choice, and how financial aid influences college choice differently for varying demographic
groups. The framework was complimented by the concept of equity mindedness in completion.
Adult students face additional barriers to college access due to lack of financial aid
opportunities and competing responsibilities such as employment and childcare (Pingel & Holly,
2017; Duke-Benfield, Garcia, Walizer, & Welton, 2018; Pingel, 2019). Low-income students are
more likely to base college choice on price and financial aid availability (Paulson & St. John,
2002). Students also respond differently to financial aid based on race or ethnicity (Heller, 1999;
Paulson & St. John, 2002; Kim, DesJardins, & McCall, 2009). Combined, research suggests that
the influence of financial aid on college choice varies based on demographics.
This conceptual framework was complimented by principles of equity mindedness, which
is an intentional focus on maximizing equitable access and outcomes for diverse populations.
National higher education advocates are calling on states and institutions of higher education to
evaluate policies and practices for their impact on equity for historically underrepresented
populations (Bensimon, Robert, Dowd, & Harris, 2007; Bensimon & Malcolm, 2012; American
Association of Colleges and Universities, 2015; Lumina Foundation, 2015; Center for Urban
8
Education, 2017; Malcolm-Piqueux & Bensimon, 2017; Achieving the Dream, 2019; Jones &
Berger, 2019). Being equity-minded is essential to analyzing the outcomes of this study and
recommending policies that have a positive impact on equity for adult students.
Significance
Given the projected growth of racial and ethnic diversity and shrinking population of
high school graduates, it is an economic development imperative that Arkansas utilize any
available resources to strategically serve adults in order to move the state forward in national
rankings of higher education completion and attainment. The annual multi-million-dollar
investment of state lottery revenue into higher education makes the Academic Challenge
Scholarship a valuable policy lever, but it must first be reviewed for its impact on adults,
particularly those who are historically underserved. Additionally, given the increase in lottery
revenue in recent years, now is an opportune time to strategically plan investment of scholarship
dollars in populations with the most need.
Arkansas is at a critical time for higher education planning. The Arkansas Division of
Higher Education (ADHE) is the state agency directed with implementing legislation impacting
higher education, as well as coordinating all activities and reporting of institutions of higher
education in the state. The ADHE is currently reviewing and revising its Master Plan for Higher
Education, with the timeline of formally recommending a plan to its board in fall of 2020. The
plan will outline goals and strategies for the next five years and will be influenced by higher
education leaders, policy makers, and other stakeholders during the planning period. This
research has the potential to add to that conversation and influence recommended changes to the
Academic Challenge Scholarship that positively impact adult college access and completion,
particularly for historically underserved populations.

9
Summary
The Academic Challenge Scholarship has nine years of data available to measure its
impact on college choice and completion for adult students, with a focus on demographics of
gender, race or ethnicity, and socioeconomic status. National data indicate the positive economic
impact of higher education both to individuals and states. However, Arkansas lags in its rate of
citizens with postsecondary credentials and has significant higher education race or ethnicity
completion gaps for citizens with at least an associate degree. Additionally, given the projected
decline in the number of high school students due to falling birth rates, adults are imperative to
increasing the number of Arkansans with college certificates and degrees.
Building on the conceptual framework of the impact of financial aid on college choice
and equity mindedness in college completion, this study measured the demographic differences
between ACST and ACSNT 24+ students, and the differences in college choices between these
student groups. For ACSNT 24+ only, this study measured college choice and completion
disaggregated by demographics, as well as measured the impact of award amount reductions on
college choice. The study’s conceptual framework was complimented by principles of equity
mindedness, which inform policy recommendations that promote equitable access and outcomes
for diverse populations. This study adds to the scarce literature on the impact of state scholarship
lotteries on adult students.
The remainder of this paper is organized as follows. Chapter two details the conceptual
framework on which the study is based, the history and structure of the Arkansas Scholarship
Lottery, and existing research on state scholarship lotteries. Chapter three outlines the
methodology, and chapter four outlines the results. Chapter five concludes the study with a
discussion of the results and subsequent policy implications.

10
Chapter 2
Literature Review
The Arkansas Scholarship Lottery was established in 2009 and has since provided more
than 542,000 Arkansans with a total of $889 million in Academic Challenge Scholarship awards
(Arkansas Scholarship Lottery, 2019). Many of these students were in the nontraditional award
category, defined broadly as any student who was not a recent high school graduate at the time of
application, including adults ages 24 and older. While Arkansas was forward thinking in its
inclusion of adult students, no analysis has been done to measure the impact on this population to
date.
Given the data on the value of higher education and projected demographic changes
discussed in chapter one, it is imperative to understand how this scholarship impacts adult
students. This research measured the impact of the Academic Challenge Scholarship on college
choice and completion for adult students age 24 and older, disaggregated by demographic data of
gender, race or ethnicity, and socioeconomic status, as well as determined the policy implications
of the results.
This literature review is organized as follows. Section one includes background and
research on the study’s conceptual framework, which is the role of financial aid on college
choice, and how that role varies by demographic group. The conceptual framework is
complimented by the role of equity mindedness in developing policies that promote equitable
access and completion across varying demographics. Section two includes an in-depth
background of the Academic Challenge Scholarship, an overview of its eligibility and award
structure, significant changes since creation, and existing research on its impact. Section three
includes research on the impact of other state lotteries, specifically on college choice and

11
completion by demographics. Finally, the chapter concludes with a discussion of major themes
discovered in the existing research.
Conceptual Framework
Many college choice studies are framed within the economic theory of human capital,
which assumes college choice decisions are rationally made by weighing the benefit of the return
on investment (Tan, 2014). This theory does not account for influences of complex external
factors such as lack of finances and lack of information or misinformation about options (Avery
& Hoxby, 2004). Additionally, it does not account for differences in college choice among
different socioeconomic and racial or ethnic groups (Perna, 2006) and is insufficient for
understanding the influence of financial aid in college choice (Kim, 2012; Perna, 2011). In other
words, if a student cannot afford the cost, choice is limited regardless of the potential benefit,
and perception of affordability varies by demographic. Therefore, the conceptual framework for
this study was the role of financial aid in college choice, and how financial aid influences college
choice differently for varying demographic groups.
This study measured the college choices of Academic Challenge Scholarship recipients
age 24 and older, specifically institution type and enrollment status, and whether those choices
varied by demographic characteristics of gender, race or ethnicity, and socioeconomic status.
This research was also informed by the concept of equity mindedness in shaping policies that
promote equitable college completion for all populations. The conceptual framework is
represented in Figure 1.

12
Figure 1: Conceptual Framework
The Role of Financial Aid in College Choice for Differing Demographic Groups
Affordability is a primary factor in college choice, but affordability can vary widely
among students from different socioeconomic backgrounds, according to a report from the
Institute for Higher Education Policy (Poutre, Rorison, & Voight, 2017). Authors concluded that
students from the highest income categories could afford 90% of colleges, while students in the
low- and moderate-income categories could only afford 1 to 5% of colleges (Poutre et al., 2017,
p. 1). Today, more than one-third of college students are considered low-income (Lumina, 2018),
and national higher education advocates are calling on states to design financial aid policies that
provide resources directly to the neediest of students in order to promote equitable college access
and completion.

13
Adult students, who make up approximately 40% of today’s college students (Lumina,
2018), face additional barriers in accessing state financial aid to make college more affordable.
In many of the largest state financial aid programs, a student becomes ineligible if too much time
has passed since high school graduation, and eligibility requirements look back at past high
school performance and/or require full-time enrollment (Pingel, 2019). Pingel and Holly (2017)
noted that adult students make college choices in concert with other financial and time decisions
related to work and childcare, and they recommended inclusion of adults in state financial aid
policy such as providing need-based aid, allowing part-time enrollment, awarding students
regardless of high school graduation date, and allowing enrollment in shorter term degree
programs.
Duke-Benfield, Garcia, Walizer, and Welton (2018) conducted qualitative research to
identify policy opportunities to address the needs of low-income, working students. A central
theme was that financial aid programs were generally not designed for working adults, and they
did not take into consideration needs beyond tuition such as childcare and transportation. Low-
income students need additional resources such as Supplemental Nutrition Assistance Program,
subsidized childcare, and health insurance, but access to these resources is often blocked by
policies such as work requirements and restrictions on participating in education programs to
qualify. Financial aid policy recommendations included prioritizing students who are low-
income and racially or ethnically diverse and establishing emergency aid to assist students with
unexpected barriers.
Researchers have also considered the effect of affordability on college choice for racially
and ethnically diverse groups. Heller (1999) evaluated the effects of price sensitivity on college
choice for different racial groups using public college enrollment, tuition prices, state financial

14
aid expenditures, and unemployment data. He found that for all races, enrollment in community
colleges was related to all three variables. A $1,000 increase in tuition price was associated with
a 2.08% enrollment decrease, an increase in state grant spending of $100 per 18-24 year old
student was associated with a 1.26% enrollment increase, and a 1% increase in unemployment
was associated with a .19% enrollment increase. Asian Americans had the highest negative
reaction to increased community college tuition prices, but they had a positive reaction to
increased four-year university tuition prices. Heller found that overall, his model indicated that
price sensitivity was much higher in community colleges than in four-year universities,
indicating that community college students were more sensitive to the variables of price, state
aid, and unemployment. He concluded that state policy should link tuition and financial aid by
increasing prices for those who can afford it while providing aid to those who cannot.
Paulson and St. John (2002) evaluated college choice decisions for different socio-
economic classes using data from the National Postsecondary Student Aid Survey, which was
particularly appropriate because it included a sample of all students, not just recent high school
graduates. They found that low-income students were more likely to be racially and ethnically
diverse, female, attend college part-time, and base college choice on low tuition and/or student
aid availability. More than half of low-income students considered work and/or living costs as
very important in their college choice. Low-income students were more likely to receive A’s
than their middle- and upper-income peers, but they were also more likely to aspire to
completion of a vocational certificate or some college, rather than a baccalaureate or advanced
degree.
Among the low-income group, Paulson and St. John (2002) found that African American
students were more likely to persist than White students, which they concluded was potentially

15
due to receiving higher financial aid packages. Low-income Asian Americans were less likely to
persist than any other low-income race, low-income women were less likely to persist than low-
income men, and low-income recent high school graduates were less likely to persist than their
low-income older peers. Authors concluded that college choice and persistence varied greatly
among socioeconomic classes, and that “standards of equity would require that adequate
amounts of need-based grants to offset tuition increases be targeted for, and made available to,
student with demonstrated need” (Paulson & St. John, 2002, p. 236).
Kim, DesJardins, and McCall (2009) evaluated the impact of student expectations about
financial aid with a focus on income and race or ethnicity, finding that differences in expected
and actual financial aid significantly impacted choices. For each racial or ethnic group, high
income students were more likely to apply to college than low income students. However,
responses to financial aid varied by race or ethnicity. African American and Hispanic student
enrollment response was lower than White and Asian students when aid was more than expected.
For African American students, enrollment response was lower than White students even with
high financial aid awards. The authors concluded that these differences could be due to differing
expectations about financial aid and perceptions of cost, lack of information about other
financing options, and lack of information about the benefits of college. Because of the
significant difference in enrollment response by race or ethnicity, the authors suggest that
institutions customize financial aid packages for students based on race or ethnicity.
Equity Mindedness in Shaping Policy
For decades, the focus of higher education was on improving access and increasing
completion rates. While progress has been made, these improvements are not equitable for
historically underrepresented populations including students who are racially or ethnically

16
diverse, low-income, and adults. As a result, national higher education advocates and private
foundations are turning their focus to equity, calling for states to disaggregate data, evaluate
policies and practices, and develop specific goals and strategies that promote equitable higher
education access and completion for all populations. The national focus on equity is relevant to
this study because it reinforces the need to disaggregate demographic data and evaluate potential
policy changes within the Academic Challenge Scholarship that could positively impact college
access and attainment for diverse populations of adult students.
The Center for Urban Education (2017) defines an equity focused policy as one that
“recognizes the need to eliminate the disparities in education outcomes of students from
underserved and underrepresented populations” (Center for Urban Education, 2017, p. 2). The
Center identified strategies for embedding equity in higher education completion goals, including
identifying existing assets that can promote equity. The Center defined equity assets as “existing
policies or programs that are currently serving – or could be improved to serve – as tools to
advance equity” (Center for Urban Education, 2017, p.14). With approximately $12 million
dollars in lottery revenue currently awarded to students in the nontraditional award category
annually, the Academic Challenge Scholarship is certainly an equity asset with potential to
contribute to equitable outcomes.
The Center for Urban Education’s work on evaluating higher education data and policy
focuses on equity for racially or ethnically diverse students (Bensimon, Robert, Dowd & Harris,
2007; Bensimon & Malcom, 2012; Center for Urban Education, 2017). The Education Trust
(Jones & Berger, 2019) also focuses on higher education completion gaps for racial and ethnic
minorities in its equity advocacy efforts, stating that these gaps exist even when controlling for
income. Other national higher education advocates are using a broader definition of equity.

17
Achieving the Dream (2019) includes adults in its definition of historically underrepresented
students. The Association of American Colleges and Universities (Association of American
Colleges and Universities, 2015; Malcolm-Piqueux & Bensimon, 2017) includes low-income
students in its equity priorities, although they caution against using income as a proxy for race
(Malcolm-Piqueux & Bensimon, 2017). The Lumina Foundation (2015) advocates including
specifically low-income adults in state higher education equity completion goals.
The equity framework is utilized nationally in developing state higher education policy
and is an appropriate supplement to the role of financial aid in college choice framework for this
study. Being equity-minded will highlight the importance of equitable outcomes for all
demographics and will inform policy recommendations to strategically invest these funds in
ways that promote equitable higher education access and completion. For the purposes of this
research, equity will be defined broadly and include college choice and completion for students
based on age, gender, race or ethnicity, and socioeconomic status.
Arkansas Scholarship Lottery
Copeland (2013) conducted a qualitative case study of the Arkansas Scholarship Lottery
policy design process through interviews and a review of historical documents. His work resulted
in extensive documentation of events leading up to the scholarship launch. Beginning in 2007,
Arkansas Lieutenant Governor Bill Halter spearheaded the effort to change the state’s
constitution to permit a lottery that directly benefitted college scholarships. Following a failed
attempt to work with the state legislature to refer a ballot initiative to the public for a vote, as
required to change the state’s constitution, Lt. Governor Halter circumvented the legislature and
initiated a campaign for public support to get the initiative on the ballot. The campaign was
successful, and a vast majority of Arkansans voted in favor of the scholarship lottery in

18
November of 2008, resulting in Amendment 87 to the Arkansas Constitution and legalizing the
operation of a state-run lottery.
Copeland (2013) further reported that following the overwhelming public support and
resulting constitutional amendment, Arkansas legislators were tasked with passing a law that
established rules for both operating the state lottery and administering the scholarships during the
2009 legislative session. Act 606 of 2009 (The Arkansas Scholarship Lottery Act) revamped the
existing Arkansas Academic Challenge Scholarship to serve as the Arkansas Scholarship
Lottery. The act also established eligibility criteria and specified that up to $8 million could be
spent on scholarships specifically for students in the nontraditional award category (award
category definitions, eligibility criteria, and award amounts are detailed in the next section).
Lottery tickets were available at retail outlets by the fall of 2009.
The Arkansas Division of Higher Education (ADHE) was tasked with implementing the
scholarship and began accepting applications in summer of 2010 for the 2010-2011 academic
year. Determining eligibility for students in the nontraditional award category with prior college
credits was particularly complicated due to the manual process of reviewing transcripts to
evaluate eligibility, which delayed award notices (Wallis, 2010). According to meeting minutes
of the Arkansas Higher Education Coordinating Board (2010), “ADHE has redirected existing
staff, hired temporary workers, and drawn on resources of other state agencies to deal with a
monumental amount of applications for financial aid… So far, 36,697 current
achiever/nontraditional applicants have been submitted, and it is believed that applicants will be
notified of their status by August 10.” ADHE’s application processes have since been
streamlined.
19
The next year, lottery revenue fell more than $10 million short of projections, resulting in
a reduction in award amounts (Brantley, 2011). Continuing revenue declines resulted in further
award reductions effective for academic years 2014 and 2017 (award amounts are detailed in the
next section). Revenue stabilized under the leadership of a new director, and proceeds for
scholarships reached $92 million for academic year 2019, the third highest amount since the
lottery was created (Hibblen, 2018).
Eligibility and Award Structure
Arkansas policy makers were mindful of the opportunity to provide access to students
who may not have otherwise considered college, and they intentionally designed a scholarship
program that reached beyond recent high school graduates. Copeland and Mamiseishvili (2017)
noted that at the time of design, Arkansas was the only state to designate all lottery revenue for
higher education scholarships, and they found that policy makers established lower than typical
eligibility criteria in order to promote access. An interviewee described as “a former legislator”
said the following (Copeland & Mamiseishvili, 2017, p. 120):
Finally, at the end of the day, I think we all decided we were going to be stuck with that
2.5 and that 19 on the ACT even though research showed that was an absolute recipe for
failure, but we did it. It was trying to reach that student that had never been reached
before. We went down to that level and I say down because it was less of an academic
rigor than we ever had on any scholarship.
Copeland and Mamiseishvili (2017) also concluded that a particularly unique policy
decision was the inclusion of adult students, including those with prior college credits and
enrolled part-time. An interviewee described as “a higher education interest group participant”
said the following (Copeland & Mamiseishvili, 2017, p. 121):
We especially thought nontraditional students were important. If we were going to
change the state of Arkansas, the way we are going to change it in the next ten years is
with nontraditonals, the re-training of adults. To leave out the nontraditional would delay
the impact that this was going to have in terms of changing the economy of Arkansas.

20
At the time the Arkansas Scholarship Lottery was established, the state had an existing
program called the Arkansas Academic Challenge Scholarship that was funded by $20 million in
state general revenue. This scholarship was available to recent high school graduates based both
on academic merit and financial need. As mentioned earlier, Act 606 of 2009 revamped this
program to include the Arkansas Scholarship Lottery, adding specific language that the
scholarship “supplement and shall not supplant nonlottery state educational resources” (Arkansas
State Legislature, 2009, p. 95). To date, the original $20 million from state general revenue is
still utilized along with lottery revenue to support the Academic Challenge Scholarship.
The need-based component of the Arkansas Academic Challenge Scholarship was phased
out for new applicants after the lottery was implemented. The new program was split into two
parts, with one designated for traditional students who were recent high school graduates
enrolled for the first-time, full-time in college, and a second designated for nontraditional
students. Act 606 of 2009 broadly defined “nontraditional student” as “a student who is not a
traditional student” (Arkansas State Legislature, 2009, p. 84), meaning any student who is not a
recent high school graduate enrolled for the first-time, full-time in college. For both groups,
compared to other states with scholarship lotteries, the program established lower eligibility and
continuing eligibility requirements to promote access.
Basic eligibility requirements for both traditional and nontraditional student award
categories have not changed since original implementation and are outlined below.
US citizen or lawful permanent resident
Arkansas resident

21
Accepted for admission and enrolled either full-time (15 credit hours) or part-time
(minimum of 6 credit hours for nontraditional award category only) at an approved
institution of higher education
Enrolled in a program of study which leads to or is creditable to a baccalaureate degree
including baccalaureate degree programs, associate degree programs, qualified certificate
programs, and nursing diplomas.
Not owe a refund on federal or state student financial aid, not be in default, and not have
borrowed in excess of annual loan limits
Not be incarcerated at the time of application or during the time the applicant receives a
scholarship
Certify drug-free status and pledge to refrain from the use of or abuse of illegal
substances, including alcohol if the applicant is less than 21
A male applicant under the age of 26 must file a Statement of Selective Service Status
with the institution at which he is enrolled
Complete the Free Application for Federal Student Aid (FAFSA)
Act 606 of 2009 outlined additional eligibility requirements specifically for the
nontraditional award category. These requirements have been revised over the years. Both
original and revised additional eligibility requirements are detailed in Table 2.

22
Table 2: Additional Requirements for Nontraditional Students
Category Rule per Act 606 of 2009 Revision
If graduated from Arkansas
public high school and NOT
completed 12 college credit hours
Achieve a 2.5 high school GPA OR
minimum 19 ACT composite score
**AY2017: 2.5 high school
GPA option removed
***AY 2020: Achieve a
minimum 19 ACT super score
If completed 12 or more college
credit hours
Achieve a 2.5 postsecondary GPA No change
If graduated from a private high
school, out-of-state high school,
home school, or earned a GED
Achieve a minimum 19 ACT
composite score
***AY 2020: Achieve a
minimum 19 ACT super score
Ineligible if Earn a baccalaureate degree or
equivalent hours OR earn an
associate degree or equivalent hours
if at a two-year institution
No change
Continuously eligible if ALL of the following: 1) 2.5
cumulative postsecondary GPA 2)
Successfully complete at least 15
hours if enrolled full-time and least 6
hours if enrolled part-time 3)
Continuously enrolled unless ADHE
grants an absence 4) Meet
Satisfactory Academic Progress 5)
Successfully complete all remedial
courses within first 30 semester hours
attempted 6) Enroll in courses that
lead toward a baccalaureate degree
program after completing an
associate degree or equivalent hours
No change
Renewable for one academic year
annually until
ONE of the following: 1) Earn a
baccalaureate degree 2) attempts total
of 130 hours in 8 semesters if full-
time unless degree requires additional
hours 3) attempts 130 hours in 16
semesters if part-time unless degree
requires additional hours
No change
May regain eligibility one time in
an academic year if
Complete required number of hours
AND achieve a 2.5 cumulative GPA
during the summer term at the
recipient's own expense
*AY 2014: If recipient does
not successfully complete any
credit hours then she
immediately forfeits the
remainder of the scholarship
for that academic year
AY: Academic Year
*Act 1106 of 2013 (Arkansas State Legislature, 2013b)
**Act 1105 of 2015 (Arkansas State Legislature, 2015)
***Act 549 of 2019 (Arkansas State Legislature, 2019b)
23
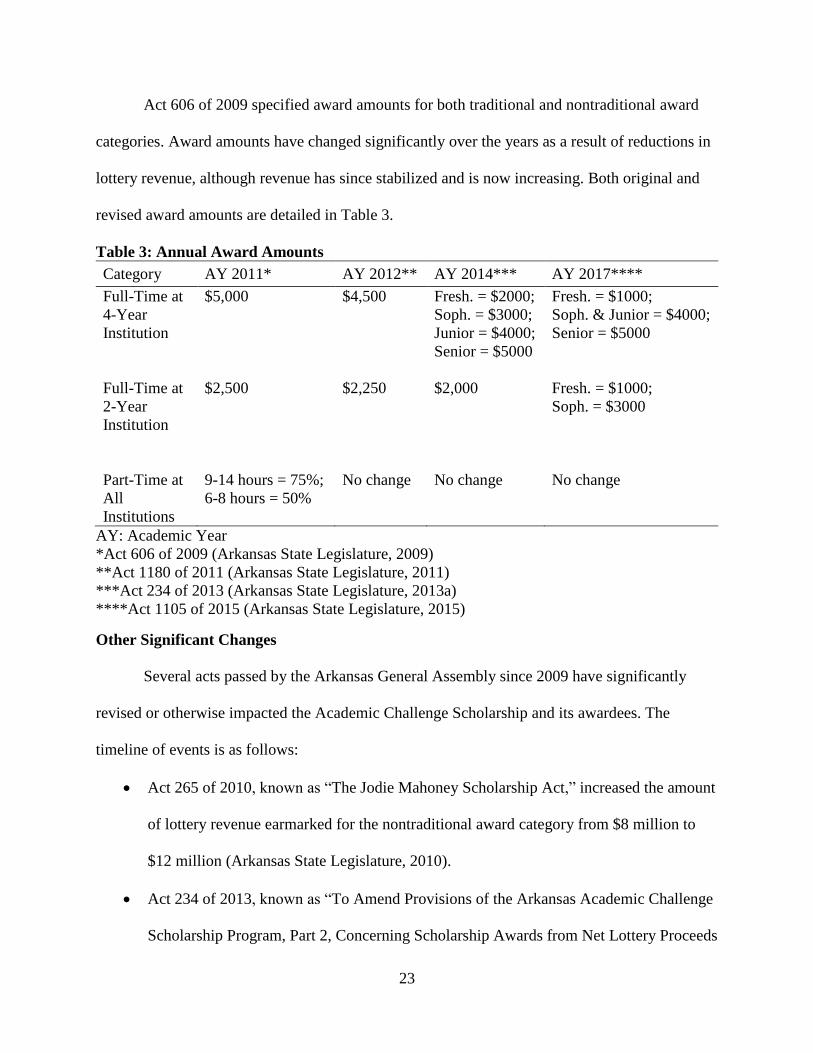
Act 606 of 2009 specified award amounts for both traditional and nontraditional award
categories. Award amounts have changed significantly over the years as a result of reductions in
lottery revenue, although revenue has since stabilized and is now increasing. Both original and
revised award amounts are detailed in Table 3.
Table 3: Annual Award Amounts
Category AY 2011* AY 2012** AY 2014*** AY 2017****
Full-Time at
4-Year
Institution
$5,000 $4,500 Fresh. = $2000;
Soph. = $3000;
Junior = $4000;
Senior = $5000
Fresh. = $1000;
Soph. & Junior = $4000;
Senior = $5000
Full-Time at
2-Year
Institution
$2,500 $2,250 $2,000 Fresh. = $1000;
Soph. = $3000
Part-Time at
All
Institutions
9-14 hours = 75%;
6-8 hours = 50%
No change No change No change
AY: Academic Year
*Act 606 of 2009 (Arkansas State Legislature, 2009)
**Act 1180 of 2011 (Arkansas State Legislature, 2011)
***Act 234 of 2013 (Arkansas State Legislature, 2013a)
****Act 1105 of 2015 (Arkansas State Legislature, 2015)
Other Significant Changes
Several acts passed by the Arkansas General Assembly since 2009 have significantly
revised or otherwise impacted the Academic Challenge Scholarship and its awardees. The
timeline of events is as follows:
Act 265 of 2010, known as “The Jodie Mahoney Scholarship Act,” increased the amount
of lottery revenue earmarked for the nontraditional award category from $8 million to
$12 million (Arkansas State Legislature, 2010).
Act 234 of 2013, known as “To Amend Provisions of the Arkansas Academic Challenge
Scholarship Program, Part 2, Concerning Scholarship Awards from Net Lottery Proceeds

24
of the Lottery,” increased the amount of lottery revenue earmarked for students in the
nontraditional award category from $12 million to $16 million (Arkansas State
Legislature, 2013a).
Act 316 of 2017, known as “To Create the Arkansas Future Grant Program,” established
a new last dollar scholarship program for students enrolled in STEM or regionally high-
demand workforce training programs, with no merit- or need-based eligibility
requirements program (Arkansas State Legislature, 2017a). The program was funded by
state general revenue available through the repeal of two existing need-based grant
programs, the Workforce Improvement Grant and the Higher Education Opportunities
Grant. With the elimination of these two programs, Arkansas no longer had a need-based
financial aid.
Act 613 of 2017, known as “To Create the Arkansas Workforce Challenge Scholarship,”
reduced the amount of lottery revenue earmarked for students in the nontraditional award
category from $16 million to $12 million (Arkansas State Legislature, 2017b). Act 613
also utilized excess lottery revenue to establish scholarships for students enrolled in
certificate and associate degree programs in high-demand workforce occupations. At the
time of act’s passing, these programs were defined as industry, health care, and
information technology.
Act 456 of 2019, known as “To Create the Arkansas Concurrent Challenge Scholarship,”
utilized excess lottery revenue to establish scholarships for high school students taking
concurrent college credit courses (Arkansas State Legislature, 2019a).

25
Results
As mentioned previously, the existing Arkansas Academic Challenge Scholarship
Program was revised in 2009 to include the Arkansas Scholarship Lottery. Dyanarski (2008)
detailed the impact of the Arkansas Academic Challenge scholarship prior to lottery
implementation, as originally established in 1991. At the time of the study, the scholarship was
funded solely through state general revenue, included a need-based component based on annual
family income caps, and included only traditional students who were recent high school
graduates. Dyanarski evaluated the impact of the scholarship along with the state of Georgia and
concluded that both states saw increases in college attendance. However, those increases were
flat after accounting for population growth. The scholarships had the greatest positive impact on
white women.
Pittman (2014) evaluated post-implementation Academic Challenge Scholarship data to
determine whether there was a relationship between lottery tickets purchased and lottery
scholarships awarded. He concluded that while there was an overall increase in college
participation in the state, there was not a significant change in college participation by Arkansans
from counties with higher rates of poverty. Pittman further concluded that the program had a
regressive effect. Arkansans who purchased lottery tickets at higher rates came from counties
with higher rates of poverty, and Arkansans who received lottery scholarship awards came from
counties with less poverty.
Bradberry (2018) conducted a quasi-experimental analysis of existing data from the
Arkansas Division of Higher Education and a survey of Arkansas residents enrolled in public
four-year universities as traditional students to determine the impact of the Academic Challenge
Scholarship. She found that seven of the top ten counties with the most scholarship recipients

26
came from counties with the largest expenditures on lottery tickets, potentially due to the higher
populations of those counties. Recipients who were from high-income counties, female, White,
and had an ACT score of 19 or higher were more likely to graduate in comparison to recipients
who were from low-income counties, male, non-White, and had an ACT score of 18 or below. A
significant finding was that only 12.3% of recipients who lost the lottery scholarship in their first
year went on to complete a bachelor’s degree in six years or less. Bradberry concluded that
Academic Challenge Scholarship recipients were more likely to graduate than non-lottery
recipients, but that recipients from low-income counties graduated at lower rates (47.1%)
compared to their high-income county peers (51.1%). Additionally, survey results indicated that
receipt of the lottery scholarship had the largest positive impact on college choice for participants
with a family income below $51,000 per year.
According to a report from the Arkansas Legislative Council Lottery Oversight
Committee (2019), there are currently 32,486 students receiving Academic Challenge
Scholarship awards at a total of $92,601,611. Of those, 3,944 are in the nontraditional award
category, and they receive a total of $12,109,640. The report disaggregated data by academic
performance, gender, race, and family income for both traditional and nontraditional student
award categories. However, it does not specify age, which is important to this study given the
broad program definition for the nontraditional award category. To date, there has been no
research on the impact of the Academic Challenge Scholarship on college choice or completion
of adult students age 24 and older, specifically.
State Scholarship Lotteries
State supported lotteries were common in the United States by 1985, but none were
established in the South until the 1990s (Nelson & Mason, 2003), beginning with Georgia in

27
1993. Southern states continued to establish lotteries through the 2000s, several specifically to
establish college scholarships, with Arkansas being among the last in 2009. Despite well-
intentioned policy makers and ambitious goals of increasing college enrollment and completion,
results on the impact of scholarship lotteries are mixed at best, particularly for students who are
low-income and racially or ethnically diverse. Results specific to adult students are scarce since
most scholarship lotteries focus primarily on traditional age college students who are recent high
school graduates.
Lottery researchers Stanley and French (2005) evaluated data from Southern states and
found no significant relationship between state scholarship lotteries and college enrollment.
However, they did conclude that a state’s population and unemployment rate significantly
impacted enrollment, meaning states with higher populations and/or higher unemployment rates
had higher college enrollment. A limitation of this study was that all southern states were
evaluated collectively, skewing potential individual differences in eligibility and award
structures that may impact enrollment. Researchers concluded that individual state analyses may
produce more specific results.
Stanley and French (2009) further evaluated data from all 50 states to determine whether
state funded merit-based scholarships impacted college enrollment, including state scholarship
lotteries. They excluded states without a merit-based aid program, as well as all need-based aid
programs. Results indicated that states with merit-based aid programs reported 19% fewer
freshmen in college than non-merit-based aid states, which researchers admitted could be skewed
by the states reporting lower populations and fewer high school graduates. However, as in their
2005 study, they concluded that state population was a significant predictor of enrollment.

28
Sjoquist and Winters (2015) evaluated merit-based scholarships from 25 states, including
state scholarship lotteries, and found consistent evidence that these programs had no significant
impact on college enrollment or completion. Researchers further suggested that merit-based
scholarships tended to be awarded to higher-achieving students more likely to persist and
graduate. Therefore, they were unlikely to make a difference in overall persistence and
completion rates because they were not specifically targeted at success for marginally eligible
students.
A growing body of literature focuses on disaggregated demographic data to examine the
impact of merit-based aid, including state scholarship lotteries, on college enrollment and
completion of historically underrepresented populations, particularly students who are low-
income and racially or ethnically diverse. Bowden and Elrod (2004) reviewed literature on the
subject and concluded that state scholarship lotteries were regressive in nature, in that lottery
revenue was collected disproportionately from low-income families and redistributed as
scholarships to more affluent families. They also concluded that access to college for students
who were racially or ethnically diverse is not proportionate to population growth.
Heller and Marin (2004) examined racial inequities in state merit-based scholarships,
including state scholarship lotteries in Florida, Georgia, Kentucky, and New Mexico. They found
that non-need, merit-based aid primarily benefitted students who would attend college regardless
of these scholarships, and that White students (independent of socioeconomic status) had greater
access to non-need, merit-based aid. The authors recommended the inclusion of need-based aid
as a tool for enhancing equitable college access and completion.
Lebioda (2014) reviewed the eligibility and award structures of eight state lottery-funded
scholarships (Arkansas, Florida, Georgia, Kentucky, New Mexico, South Carolina, Tennessee,

29
and West Virginia) and evaluated their impact on equitable college access and completion. She
noted the regressive nature of scholarship lotteries, the trend of moving from need-based aid to
merit-based aid, and the trend of tightening eligibility requirements and reducing award amounts
to accommodate reduced lottery revenue and increased demand for scholarships. She concluded
that these policies disproportionately impacted students who were low-income and racially or
ethnically diverse. Lebioda concluded by recommending a shift back to need-based aid and
adding additional academic and supportive services for historically underrepresented and
nontraditional students.
Research on the impact of specific state scholarship lotteries on college choice and
completion by student gender, race or ethnicity, and socioeconomic status is detailed below. As
previously stated, research specific to adults is limited.
Results in Specific States
Georgia.
Georgia was the first state to enact a scholarship lottery in 1993. The resulting Georgia
Helping Outstanding Pupils Educationally (HOPE) scholarship is the most extensively
researched, and it is the model for subsequently developed state scholarship lotteries. Dee and
Jackson (1999) evaluated data from one freshman cohort of students attending Georgia Tech to
determine whether there was a pattern in students who lost the HOPE scholarship. Researchers
concluded that there was no significant difference in race or ethnicity of students, but there was a
significant difference in the course of study students selected. Students in the sciences,
engineering, and computing were 21 to 51% more likely to lose their scholarship than students in
other fields, due to not maintaining the required 3.0 GPA for continuing eligibility. This research
may not be generalizable because it is limited to one cohort attending one selective university.

30
Dyanarski (2000) estimated the impact of the HOPE scholarship on college attendance,
finding that the program significantly increased the attendance rate of middle- and high-income
students, and particularly White students. She concluded that the scholarship widened the gap
between low-income and high-income students in attendance, although the results may have
been biased due to the non-random sample selection of students for whom family income data
were available. Dyanarski also concluded that HOPE widened the racial gap in attendance
relative to other Southern states, finding no significant impact on enrollment of African
American students. She did conclude that there was a significant impact of the HOPE
scholarship on college choice, finding that Georgia students were more likely to remain in-state
for college.
Rubenstein and Scafidi (2002) conducted a survey from a stratified sample of adults in
Georgia (weighted to match state demographic data) to evaluate the relationship between lottery
expenditures and benefits received via the HOPE scholarship. They concluded, consistent with
other studies, that the HOPE scholarship was regressive in nature. More educated, higher income
families received a disproportionate amount of scholarship funding compared to less educated,
lower- income families. However, the 2001 changes allowing students to receive both Pell grants
and HOPE awards may help to reduce the regressive nature by providing more funding to lower-
income students.
Chen (2004) reviewed literature related to the Georgia HOPE Scholarship. He concluded
that more students enrolled in Georgia colleges, and that achievement in both high school and
college increased. However, this could have been a result of other demographic factors such as
overall population increases in the state or the shift from high-achieving students choosing in-
state colleges over out-of-state colleges. He further concluded that the critical impact of the

31
scholarship is on low-income students due to the regressive nature of lottery scholarships. Like
Rubenstein and Scafidi (2002), Chen (2004) concluded that the 2001 decision to allow students
to receive both a Pell grant and a lottery scholarship, rather than reducing the lottery scholarship
relative to the Pell grant amount, could alleviate this inequity.
Cornwell, Mustard, and Sridhar (2006) evaluated Integrated Postsecondary Education
Data System (IPEDS) data to determine the impact of the HOPE scholarship on college
enrollment, concluding that HOPE resulted in a 9% enrollment increase in four-year public
institutions and at 13% enrollment increase in four-year private schools. There was no significant
evidence of a positive impact on enrollment at two-year colleges. Researchers found significant
enrollment increases for African American students, which they attributed primarily to large
enrollment into the state’s Historically Black Colleges and Universities as well as in technical
colleges. There was not a significant increase for White students in technical colleges. The
program also reduced the outmigration of high-achieving students by an average of 560 per year,
and it increased the average SAT score by 40 points. The researchers conclude that “programs
like HOPE, which primarily affect the choice of where, rather than whether, to attend college call
into question the social benefits of state-sponsored merit aid” (Cornwell et al., 2006, p. 784).
Shell (2016) evaluated whether 2011 reductions to HOPE award amounts had an impact
on enrollment trends. He concluded that the award reductions resulted in students selecting
technical and community colleges over more costly and prestigious four-year universities.
However, this trend was not even across demographics. Students from lower income counties
outside of the Atlanta area were much more likely to see enrollment decreases in four-year
universities.

32
Florida.
The Florida Bright Futures scholarship lottery was established in 1997 and modeled after
the Georgia HOPE scholarship. Stranahan and Borg (2004) conducted a survey of 1,260 Florida
households in order to estimate the relationship between money spent on the lottery and money
received from Bright Futures. They concluded that race, income, and parental education levels
were significant predictors of receiving a scholarship. Children who were White, had higher
family income, and had a parent with at least some college experience were significantly more
likely to receive Bright Futures. On income specifically, researchers found that “high
socioeconomic status households receive a net program benefit gain of more than $2,200, but
low socioeconomic status households have a net program loss of more than $700” (Stranahan &
Borg, 2004, p. 123) due to low-income households spending more on lottery purchases than they
received in return in lottery scholarships.
Harkreader, Hughes, Tozzi, and Vanlandingham (2008) examined Florida high school
graduates to determine the impact of Bright Futures on high school course selection and college
enrollment. They compared students who earned a high school diploma in the 1997 academic
year (eligible to apply for Bright Futures but no time to select college preparatory courses) and in
the 2001 academic year (eligible to apply with adequate time to select college preparatory
courses). Results indicated that the overall percentage of students taking college preparatory
courses increased from 54 to 67%. Similarly, the rate at which high school graduates attended
college in Florida increased from 44 to 55%. Students who were African American, Hispanic,
limited English proficiency, and low-income were less likely to be eligible for Bright Futures or
take college preparatory courses, but there were overall increases for these students in Bright
Futures eligibility, taking college preparatory courses, and college enrollment. Despite these

33
increases, these student groups continued to be disproportionately underrepresented among
graduates prepared for college.
Mckinney (2009) examined unintended consequences of Bright Futures. He identified
specific policy problems including the fiscal health of the lottery due to decreasing revenue from
sales and increasing student demand for scholarships and difficulty in implementing structural
award amounts due to its public popularity. The author noted public policy concerns with
utilizing limited scholarship funds for affluent students who would have attended college
regardless of whether they received a lottery scholarship, as well as the inequitably low
distribution of scholarships awarded to students who were low-income and racially or ethnically
diverse compared to higher-income and White students. Mckinney (2009) concluded that flat-
rate awards rather than full tuition awards would address fiscal instability, and that adding a
need-based component to the merit-based component would address demographic distribution
inequities.
Zhang, Hu, and Sensenig (2013) examined the impact of Bright Futures on college
enrollment and completion in Florida, finding a significant overall increase in college enrollment
for both two- and four-year public institutions. Researchers concluded this increase was due in
part to the reduction of out migration of college students, which was 23% prior to
implementation of Bright Futures and reduced to 19.9% after implementation. Results further
indicated similar enrollment increases when disaggregated by gender and race or ethnicity for
four-year public institutions. Two-year public institutions also saw no differences in enrollment
increases by gender, but enrollment increases for part-time non-White students was larger than
part-time White students. While the overall impact on degree completion was lower than on
enrollment, degree completion for non-White students (8%) was larger than for White students

34
(.4%). Researchers noted limitations of the study, including the increasingly rigorous eligibility
criteria enacted over time and other college choice factors, such as academic performance,
sensitivity to price change, and transfer.
Tennessee.
The Tennessee Education Lottery Scholarship (TELS) was enacted in 2003 for recent
high school graduates. It was the first program to allow eligibility based on either a standardized
test score or high school GPA (Pallais, 2009). While Tennessee added a provision for
nontraditional students ages 25 and older in 2008, most (if not all) research is limited to
traditional students who were recent high school graduates.
Bone (2008), completed prior to the inclusion of adult students, evaluated the impact on
TELS on higher education enrollment in Tennessee and found significantly increased
enrollments when compared to its neighboring states and SREB states, potentially due to having
a higher overall population. However, no significant enrollment difference was found within the
state of Tennessee since the implementation of TELS. The researcher did find a significant
difference in overall enrollment increases between four-year institutions (6.4%) and two-year
institutions (1.6%). No significant difference was found in the specific demographic groups of
first-time freshmen students, Hispanic students, or African American students. While average
standardized test scores increased, that increase was not significant. The researcher concluded
that since a disproportionate percentage of students receiving the lottery scholarship had family
incomes of $96,000 or above, including a need-based component in eligibility should be
considered.
Ness and Tucker (2008) surveyed Tennessee high school seniors, both college and
noncollege bound, prior to graduation to evaluate whether TELS had an impact on college

35
choice. Results indicated that the scholarship influenced African American seniors to attend
college at a rate of 1.73 times greater than White seniors. Additionally, the results indicated that
seniors with an annual family income of less than $36,000 were 1.5 times more likely to report
that the scholarship influenced their decision to enroll in college compared to seniors with a
higher annual family income, and seniors whose parents had lower levels of education were
more likely to report that the scholarship influenced their college going decision. Furthermore,
seniors with lower class rank and academic aspirations were more likely to report that
scholarship eligibility would make a difference in their post-high school choices. Researchers
noted the following (Ness & Tucker, 2008, p. 581):
Therefore, merit aid programs seem to follow this trend of addressing college
affordability through blanketed discounts, rather than through targeted policies such as
financial aid directed to students least able to afford college costs. Ultimately, it seems
the inefficient financial aid policies are most sustainable due to their broad political
appeal. If we are to accept this premise, then the most important issue becomes how these
policies treat traditionally under-represented students.
Pallais (2009) evaluated data for students who took the ACT and planned to graduate
from high school in 1996, 1998, 2000, and 2004 to determine whether the TELS had an impact
on ACT scores and college choice. She concluded that the program did not achieve its stated
goal of more students staying in the state for college, and it had no significant impact on whether
students selected two-year or four-year institutions. She also concluded that the lottery
scholarship did increase ACT scores, but not for all segments of the population. African
Americans were significantly less likely to increase their ACT scores to the minimum eligibility
threshold of 19. In fact, they were five times less likely than Asian students and seven times less
likely than White students to increase their scores to 19 or higher.
Menifield (2012) evaluated TELS’ impact on the retention of fall 2007 recipients (prior
to the inclusion of nontraditional students) by demographic, economic, and education variables.

36
Results indicated that retention was particularly weak for African American recipients, weaker
than any other racial group. Women were more likely than men to retain their scholarships, as
were students majoring in science, technology, engineering, and math fields. Students with
higher ACT scores, higher high school GPAs, and higher family incomes were also more likely
to retain their scholarships. In fact, students who received Pell grants were twice as likely to lose
their scholarships during the first two years of enrollment compared to students who were not
Pell eligible. Menifield (2012) concluded that colleges and universities concerned about the
retention of all students should target racially or ethnically diverse students and others likely to
lose their scholarships with additional academic and supportive services.
Bruce and Caruthers (2014) determined that TELS did not increase overall college
enrollment for students who graduated from high school between 2006 and 2009, but it did
impact college choice. Students who scored at least a 20.5 on the ACT were more likely to select
four-year institutions over two-year institutions, relative to students who met the minimum
eligibility requirement of 19 but did not exceed 20.5. Additionally, the tendency to select a four-
year institution was most prominent among students with family income that did not exceed
$60,000 and students who qualified for Pell grants.
Welch (2014) evaluated the impact of TELS specifically on community college
enrollment of marginally eligible students who were entering freshmen in academic years 2005
to 2009. She concluded that although the scholarship reduced the cost, it had no significant
impact on persistence, academic performance, transfer to a four-year institution, completing an
associate degree within three years, or completing a bachelor’s degree within five years. She
further evaluated earnings and found no significant changes in wages either during or post-

37
college enrollment. Welch did, however, find a small but significant increase on cumulative
credit hours after two years of enrollment.
Other States.
Kash and Lasley (2010) evaluated the relationship between the demographics of
Kentucky high schools and the number and dollar amount of lottery funded Kentucky
Educational Excellence Scholarships (KEES) awarded. They concluded that KEES was
regressive in nature, with more awards and higher dollar amounts going to students from high
schools with more White students, more female students, and fewer free or reduced-lunch
eligible students. Further analysis indicated that “granting awards based on GPA mitigates some
of the regressivity across schools when compared with the awards based on standardized test
results, and it is likely that variations in grading standards could be a factor” (Kash & Lasley,
2010, p. 34-35). Kash and Lasley (2010) recommended eliminating the graduated award
structure (which included bonus funding based on ACT scores) and adding a need-based
component to the merit-based eligibility criteria to reduce the regressivity.
Scott-Clayton (2011) evaluated first-time, full-time West Virginia freshmen to determine
college completion results for the first two cohorts of college students after the implementation
of the lottery funded West Virginia PROMISE scholarship. She limited the study to those who
had a high school GPA of at least 3.0 and who were just below or just above the ACT eligibility
threshold of 21, including students who were not eligible for the scholarship. She concluded that
there was no statistical difference between students who received the scholarship and those who
did not in terms of persistence. However, scholarship recipients had significantly higher
cumulative GPAs and on-time degree completions. Scholarship recipients were 9 percentage
points more likely to have a 3.0 cumulative GPA and 9.5 percentage points more likely to have

38
earned 120 hours in four years. Additionally, Scott-Clayton (2011) found no significant
differences in outcomes for students based on income.
Erwin and Binder (2018) evaluated college completion rates of students who received the
New Mexico Lottery Scholarship, which had relatively low eligibility criteria compared to other
state lottery scholarships and paid 100% of tuition at the time of the study. They found positive
completion effects for academically well-prepared students and negative effects for less-prepared
students. Because the scholarship paid 100% of tuition, making the difference between tuition
costs zero, researchers concluded that less academically prepared students were persuaded to
attend more prestigious four-year institutions.
Arbogast, Thornton, and Szweda (2016) utilized county-level data to evaluate whether
there was a relationship between South Carolina Education Lottery (SCEL) purchases and
scholarship distributions. Findings indicated that counties with higher non-White populations
spent more per capita on lottery purchases and, conversely, received significantly fewer SCEL
scholarship dollars. Researchers noted the limitation of using county-level data due to potential
skewing by small populations in some counties.
Discussion
The Academic Challenge Scholarship has undergone significant changes over the years.
While the original inclusion of adult and part-time students is still in place, the eligibility criteria
have changed slightly. A significant change was the elimination of the ability to qualify based on
high school GPA (effective for academic year 2017) which immediately showed a negative
impact on the number of overall applications (-16.5%), and an even higher negative impact on
the number of African American applications (-40.5%) (Brantley, 2016). The ability to qualify
based on an ACT superscore rather than a composite score has the potential to make scholarships

39
available to more students, but as a recent development effective for academic year 2020, its
impact cannot be included in this study.
The changes in award structure are of most interest to this study. Freshman awards were
originally valued at $5,000 at four-year institutions and $2,500 at two-year institutions, and they
were cut to $1,000 regardless of institution choice. Awards increase incrementally as students
progress. However, given the price sensitivity of low-income and racially or ethnically diverse
students discussed in section one, a low award amount at the freshman level could significantly
impact college choice, or even whether to enroll at all.
The creation of new state financial aid programs is also of interest to this study. The
original Arkansas Academic Challenge Scholarship program, on which the Arkansas Scholarship
Lottery was based, had a need-based component with a cap on annual family income. That
component was not included after the lottery was implemented. With the repeal of the Workforce
Innovation Grant and the Higher Education Opportunities Grant to create the Arkansas Future
Grant, a last-dollar scholarship program for students enrolled in STEM and high-demand
workforce programs, Arkansas no longer has a need-based scholarship program. Additionally,
the creation of new financial aid programs funded by excess lottery revenue could indicate an
opportunity to revisit restrictive eligibility and award amounts.
Outcomes on the impact of state scholarship lotteries are somewhat mixed. Most
researchers note the regressive nature of scholarship lotteries (Bowden & Elrod, 2004; Chen,
2004; Lebioda, 2014; Kash & Lasley, 2010; Pittman, 2014; Rubenstein & Scafidi, 2002), and
that ultimately they have limited impact on overall enrollment when controlled for population
growth (Bone, 2008; Bruce & Caruthers, 2014; Dyanarski, 2008, Sjoquist & Winters, 2015;
Stanley & French, 2005 and 2009).

40
Most research concludes that state scholarship lotteries disproportionately benefit
students who are White and higher-income (Bradberry, 2018; Dyanarski, 2000; Harkreader et al.,
2008; Heller & Marin, 2004; Lebioda, 2014; McKinney, 2009; Menifield, 2012; Stranahan &
Borg, 2004), as well as students who are higher-achieving (Erwin & Binder, 2018; Menifield,
2012; Sjoquist & Winters, 2015). For community college students specifically, Welch (2014)
found no impact on enrollment, performance, transfer, or degree completion for students who
were marginally eligible and received TELS.
Most research indicates a significant impact of scholarship lotteries on college choice.
Ness and Tucker (2008) found that African American, low-income, and less academically
prepared high school seniors in Tennessee were more positively influenced by the availability of
TELS in deciding whether to enroll in college. Similarly, scholarship lotteries have had an
overall positive influence on students deciding to remain in-state for college (Cornwell et al.,
2006; Dyanarski, 2000; Zhang et al. 2013).
In some states, scholarship lotteries have significantly impacted student preference for
four-year institutions over two-year institutions (Bone, 2008; Cornwell et al., 2006), particularly
for higher achieving students (Bruce & Caruthers, 2014). However, award amount reductions in
Georgia had the opposite effect, particularly for students from lower-income, rural counties
(Shell, 2016). Georgia saw an increase of African American student enrollment in Historically
Black Colleges and Universities and technical colleges (Cornwell et al., 2006), and Florida saw
and increase of non-White students enrolled part-time (Zhang et al., 2013). In New Mexico, less
academically prepared students were more likely to select more prestigious four-year institutions
as a result of the scholarship lottery (Erwin & Binder, 2018).

41
It is important to note a limitation of this literature review. As in Arkansas, scholarship
lotteries in other states have evolved over time, and changes in eligibility criteria and award
amounts have potentially impacted college choice and completion. These changes over time are
not addressed in this review, but they may have impacted the research results discussed here.
The majority of state scholarship lotteries limit eligibility to recent high school graduates
enrolled in college for the first-time, full-time. It will be interesting to see whether these same
patterns of college choice and completion are evident for adult scholarship recipients in
Arkansas. Based on the conceptual framework of the role of financial aid in college choice and
how that role varies by demographic, complimented by equity mindedness in developing
financial aid policy that promotes equitable access and completion, this research will measure the
college choice and completion for adult students, disaggregated by gender, race or ethnicity, and
socioeconomic status. The findings will have implications for state leaders seeking policy levers,
such as the Academic Challenge Scholarship, to promote equitable higher education access and
completion.
The remainder of this paper is organized as follows. Chapter three details the
methodology used to conduct this research, and chapter four outlines the results of this research.
Chapter five provides an in-depth analysis and interpretation of results, as well as policy
recommendations for improving the impact of the Academic Challenge Scholarship on adult
students, with particular attention to equity for low-income and racially or ethnically diverse
students.

42
Chapter Three
Methodology
This study utilized a quantitative research design to measure the impact of the Academic
Challenge Scholarship (ACS) on college choice and completion of adult students ages 24 and
older. Demographic and college choice differences between students in the traditional award
category (ACST) and students in the nontraditional award category ages 24 and older (ACSNT
24+) were measured. For the ACSNT 24+ students, differences in college choices by
demographics and award cohort were measured. For Award Cohort One of ACSNT 24+
students, differences in degree completion by demographics were measured. Research questions,
variables, data collection, and research design are discussed below.
Research Questions
1. Do demographics differ between Academic Challenge Scholarship recipients in the
ACST and ACSNT 24+ award categories?
a. Hₒ - There are no differences in demographics between recipients in the ACST
and ACSNT 24+ award categories.
b. Hₐ - There are differences in demographics between recipients in the ACST and
ACSNT 24+ award categories.
2. Do college choices differ between Academic Challenge Scholarship recipients in the
ACST and ACSNT 24+ award categories?
a. Hₒ - There are no differences in college choices between recipients in the ACST
and ACSNT 24+ award categories.
b. Hₐ - There are differences in college choices between recipients in the ACST and
ACSNT 24+ award categories.

43
3. Do college choices differ between Academic Challenge Scholarship recipients in the
ACSNT 24+ award category when disaggregated by demographics?
a. Hₒ - There are no differences in college choices between recipients in the ACSNT
24+ award category when disaggregated by demographics.
b. Hₐ - There are differences in college choices between recipients in the ACSNT
24+ award category when disaggregated by demographics.
4. Do changes in award amounts impact the college choices of Academic Challenge
Scholarship recipients in the ACSNT 24+ award category?
a. Hₒ - Changes in award amounts do not impact the college choices of recipients in
the ACSNT 24+ award category.
b. Hₐ - Changes in award amounts do impact the college choices of recipients in the
ACSNT 24+ award category.
5. Does degree completion differ for Academic Challenge Scholarship recipients in the
ACSNT 24+ award category when disaggregated by demographics?
a. Hₒ - Degree completion does not differ for Academic Challenge Scholarship
recipients in the ACSNT 24+ award category when disaggregated by
demographics.
b. Hₐ - Degree completion does differ for Academic Challenge Scholarship
recipients in the ACSNT 24+ award category when disaggregated by
demographics.
Variables
Independent variables included ACS award category, gender, race or ethnicity, Pell
eligibility, award cohort, whether concurrent credit was earned, high school type, and whether a

44
remedial course was taken. Dependent variables included institution type, enrollment status,
whether a student completed a degree of any type, and highest degree completed. Variables are
defined below.
Independent Variables.
This study utilized ACS award categories to distinguish between traditional and adult
students. The traditional award category (ACST) requires recipients to be recent high
school graduates enrolled in college full-time, and all other students are considered in the
nontraditional award category (ACSNT). This study defined adults as students in the
ACSNT award category ages 24 and older, which aligns with the U.S. Department of
Education age distinction for a financially independent student. Students in the ACSNT
award category under the age of 24 were excluded.
Gender was defined as male, female, or not reported.
Race or ethnicity was defined as White, African American, Hispanic, two or more races,
or not reported.
Socioeconomic status was defined as either Pell eligible or non-Pell eligible based on
results from the FAFSA, which calculates income and assets in relation to debt and
family size for a standardized evaluation of ability to pay for college.
Award amount was defined by academic year of initial award and is categorized into
three cohorts based on significant award amount changes.
o Award Cohort One: Academic years 2011 to 2013
o Award Cohort Two: Academic years 2014 to 2016
o Award Cohort Three: Academic years 2017 to 2019

45
Concurrent credit was defined as whether college credit was earned (yes or no) by a
student while still enrolled in high school.
High school type was defined as either high school diploma, home school, GED, or not
reported.
Remediation was defined as whether at least one remedial course was taken (yes or no) at
time of first award.
Dependent Variables.
Institution type was defined as the institution of choice at the time of initial award.
o Public two-year college
o Public four-year university
o Private college or university
o Nursing Diploma School
Enrollment status was defined as either full-time or part-time enrollment at time of first
award. ACST students are required to enroll full-time; Part-time enrollment is only an
option for ACSNT students.
Completion was defined as whether a degree of any level was completed (yes or no) and
the highest level of degree awarded within six years of initial award. This variable was
limited to cohort one – award years 2011 to 2013 – in order to allow completion of a
baccalaureate degree within six years of initial award.
o Certificate of Proficiency
o Technical Certificate
o Associate Degree
o Baccalaureate Degree

46
Data Collection
The Arkansas Division of Higher Education (ADHE) is the state agency charged with
collecting and processing applications for state financial aid to determine eligibility. ADHE also
collects data regarding completion for all Arkansas higher education participants. Data for this
study were collected from the ADHE upon approval by the University of Arkansas Internal
Review Board. Data were requested for the entire population of Academic Challenge
Scholarship recipients in the academic years of 2011 through 2019. Recipients with missing data
relevant to this study were excluded, as were recipients in the ACSNT award category ages 23
and under.
Data collected for each research question were as follows.
1. Do demographics differ between Academic Challenge Scholarship recipients in the
ACST and ACSNT 24+ award categories?
a. Award category
b. Gender
c. Race or ethnicity
d. Pell eligibility
e. Concurrent credit
f. High school type
g. Remediation
2. Do college choices differ between Academic Challenge Scholarship recipients in the
ACST and ACSNT 24+ award categories?
a. Award category
b. Institution type

47
3. Do college choices differ between Academic Challenge Scholarship recipients in the
ACSNT 24+ award category when disaggregated by demographics?
a. Gender
b. Race or ethnicity
c. Pell eligibility
d. Institution type
e. Enrollment status
4. Do changes in award amounts impact the college choices of Academic Challenge
Scholarship recipients in the ACSNT 24+ award category?
a. Award cohort
b. Institution type
c. Enrollment status
5. Does degree completion differ for adult recipients of the Academic Challenge
Scholarship when disaggregated by race/ethnicity, gender, and socioeconomic status?
a. Award cohort (one only)
b. Gender
c. Race or ethnicity
d. Pell eligibility
e. Degree completed (yes or no)
f. Highest degree completed
Research Design
This study utilized a quantitative research design to measure the impact of the Academic
Challenge Scholarship on college choice and completion of adult students. First, data were

48
analyzed using descriptive statistics to summarize and describe trends for students in both the
ACST and ACSNT 24+ award categories.
Second, the study utilized SPSS to conduct Chi-Square Tests for Independence to
determine whether observed results were as expected per the null hypothesis for each research
question. According to Glass and Hopkins (1996, p. 330), “The Chi-Square test statistic can be
used to find whether the observed proportions in two or more categories differ significantly from
a priori or theoretically expected proportions.” According to Creswell (2014, p. 191) Chi-Square
is an appropriate test to compare categories within groups when both independent and dependent
variables are categorical. Bradberry (2018) utilized Chi-Square to determine whether receiving
the Academic Challenge Scholarship was significant to the categorical dependent variables of
persistence and completion. Since this study also examined categorical variables, Chi-Square
was an appropriate test.
Finally, the study analyzed the results, drew conclusions based on findings, and
determined whether there were policy implications for the Academic Challenge Scholarship that
could positively impact college choice and completion of adult students, with a focus on
demographics of gender, race or ethnicity, and socioeconomic status.
Summary
This study utilized a quantitative research design to measure the impact of the Academic
Challenge Scholarship (ACS) on college choice and completion of adult students ages 24 and
older. Data for this study were collected from the ADHE upon approval by the University of
Arkansas Internal Review Board. Descriptive statistics were used to summarize data, and Chi-
Square Tests for Independence were conducted to determine whether observed results were as
expected per the null hypothesis for each research question.

49
Chapter Four
Results and Findings
The purpose of this study was to measure the impact of the state lottery funded Academic
Challenge Scholarship (ACS) on college choice and completion of adult students, age 24 and
over. This study was significant because existing research on the impact of state scholarship
lotteries is focused on traditional age students who are recent high school graduates and enrolled
in college full-time. The conceptual framework that guided this study was college choice
differentiation between varying demographics (i.e. age, gender, race or ethnicity, and
socioeconomic status), complimented by the principles of equity-mindedness. The results of this
study inform state and campus level policy decisions that positively impact equitable college
access and completion for adult students.
Overview of Research Questions
Research Question One measured the overall demographic differences between ACS
recipients in the traditional award category (ACST) and recipients in the nontraditional award
category ages 24 and older (ACSNT 24+). ACS recipients under the age of 24 who did not meet
the eligibility requirements to qualify in the traditional award category were excluded from this
study. These recipients may have narrowly missed the window to qualify as a recent high school
graduate or may have been a recent high school graduate enrolled less than full-time. Due to the
high variance in circumstances among these students, they were excluded in order to have a clear
delineation between a recent high school graduate and an adult student.
Research Question Two measured differences in choice of institution type (i.e. four-year
university, two-year college, nursing diploma school, or private college or university) between
ACST and ACSNT 24+ recipients. As stated earlier, ACS recipients under the age of 24 who did

50
not meet the eligibility requirements to qualify in the traditional award category were excluded
from this study. Since ACS recipients in the traditional award category are required to enroll full-
time, differences in enrollment status (i.e. full-time or part-time) were not included in this
research question.
Research Question Three measured college choice differences of ACSNT 24+ recipients
in institutional type (i.e. four-year university, two-year college, nursing diploma school, or
private college or university) and enrollment status (i.e. full-time or part-time) at the time of
initial award. Differences in these choices were disaggregated by gender, race or ethnicity, and
socioeconomic status. Socioeconomic status was defined in two categories as either Pell eligible
or not Pell eligible.
Research Question Four also measured college choice differences in institutional type
(i.e. four-year university, two-year college, nursing diploma school, or private college or
university) and enrollment status (i.e. full-time or part-time) of ACSNT 24+ recipients at the
time of initial award. For this question, differences in these choices were measured based on
decreases in maximum award amount. Maximum award amounts were assigned in one of three
cohorts based on significant decreases in order to determine the impact of the decreases. Award
cohorts were academic years 2011 to 2013, 2014 to 2016, and 2017 to 2019.
Finally, Research Question Five measured differences in degree completion of ACSNT
24+ recipients within six years of initial award. This research question was limited to ACSNT
24+ recipients in Award Cohort One only. First, recipients were disaggregated by gender, race or
ethnicity, and Pell eligibility and measured based on whether they completed any degree (i.e. yes
or no). For ACSNT 24+ recipients who did complete a degree, differences in highest degree (i.e.

51
certificate, nursing diploma, associate degree, or bachelor’s degree) were disaggregated by
gender, race or ethnicity, and Pell eligibility.
Overview of Data Collection and Analyses
De-identified student level data were collected from the Arkansas Division of Higher
Education for ACST and ACSNT 24+ recipients. Variables for all recipients in this study were
(at the time of initial award) gender, race or ethnicity, Pell eligibility, whether concurrent credit
was earned, high school type, whether a remedial course was taken, and institution type. For
ACSNT 24+ only, enrollment status was collected. For ACSNT 24+ Award Cohort One only,
highest degree completed was collected in order to allow for six-year completion window. As
stated previously, ACS recipients under the age of 24 who did not meet the eligibility
requirements to qualify in the traditional award category were excluded from this study.
A total of 121,895 student records were collected, with 110,136 recipients in the ACST
award category and 11,759 recipients ACSNT 24+ award category. For all research questions,
data were analyzed using Chi-Square Tests of Independence in SPSS to determine whether
differences were significant at the .05 level. Data and analyses for each research question are
outlined in the next section.
Results
Research Question One
Do demographics differ between Academic Challenge Scholarship recipients in the ACST and
ACSNT 24+ award categories?
To answer this question, frequencies and percentages of demographic variables for
recipients in each award category were determined. Independent variables included academic
year of first award, gender, race or ethnicity, Pell eligibility, concurrent credit earned, high

52
school type, and remedial course taken. The dependent variable was the Academic Challenge
Scholarship (ACS) award category, which was either traditional (ACST) or nontraditional, age
24 and older (ACSNT 24+).
Table 4 includes the number and percentage of newly awarded recipients by academic
year per ACS award category.
Table 4: Annual Recipient Frequency by Award Category
Academic Year ACST Percent ACSNT24+ Percent Total
2011 11,792 68.4% 5,440 31.6% 17,232
2012 12,640 99.5 67 0.5 12,707
2013 13,341 91.7 1,205 8.3 14,546
2014 13,152 92.3 1,098 7.7 14,250
2015 12,983 93.2 942 6.8 13,925
2016 12,647 94.6 717 5.4 13,364
2017 11,139 93.1 826 6.9 11,965
2018 11,531 93.8 765 6.2 12,296
2019 10,911 94.0 699 6.0 11,610
Total 110,136 90.4 11,759 9.6 121,895
Table 5 includes the number and percentage of newly awarded recipients by gender per
ACS award category.
Table 5: Gender Frequency by Award Category
Gender ACST Percent ACSNT24+ Percent
Female 63,773 57.9% 8,423 71.6%
Male 46,352 42.1 3,335 28.4
Not Reported 11 0.0 1 0.0
Total 110,136 100.0 11,759 100.0

53
Table 6 includes the number and percentage of newly awarded recipients by race or
ethnicity per ACS award category.
Table 6: Race or Ethnicity Frequency by Award Category
Race or Ethnicity ACST Percent ACSNT24+ Percent
African American 13,180 12.0% 2,175 18.5%
Hispanic 6,277 5.7 433 3.7
Not Reported 3,750 3.4 375 3.2
Other 1,887 1.7 200 1.7
Two or More Races 3,574 3.2 267 2.3
White 81,468 74.0 8,309 70.7
Total 110,136 100.0 11,759 100.0
Table 7 includes the number and percentage of newly awarded recipients by Pell
eligibility per ACS award category.
Table 7: Pell Eligible Frequency by Award Category
Pell Eligible ACST Percent ACSNT24+ Percent
No 57,087 51.8% 2,502 21.3%
Yes 53,049 48.2 9,257 78.7
Total 110,136 100.0 11,759 100.0
Table 8 includes the number and percentage of newly awarded recipients by concurrent
credit earned per ACS award category.
Table 8: Concurrent Credit Frequency by Award Category
Conc. Cred. ACST Percent ACSNT24+ Percent
No 99,026 89.9% 11,742 99.9%
Yes 11,110 10.1 17 0.1
Total 110,136 100.0 11,759 100.0

54
Table 9 includes the number and percentage of newly awarded recipients by high school
type per ACS award category. Since the ACSNT 24+ award category included students whose
eligibility was based on college GPA rather than high school GPA, the number of high school
type “not reported” was unusually high.
Table 9: High School Type Frequency by Award Category
HS Type ACST Percent ACSNT 24+ Percent
GED 155 0.1% 1,490 12.7%
Home School 730 0.7 31 0.3
HS Diploma 94,391 85.7 7,124 60.6
Not Reported 14,860 13.5 3,114 26.5
Total 110,136 100.0 11,759 100.0
Table 10 includes the number and percentage of newly awarded recipients by remedial
course taken per ACS award category.
Table 10: Remediation Frequency by Award Category
Remediation ACST Percent ACSNT 24+ Percent
No 109,542 99.5% 7,359 62.6%
Yes 594 0.5 4,400 37.4
Total 110,136 100.0 11,759 100.0
Utilizing SPSS, expected counts were calculated for each demographic variable per
award category, and Chi-Square Tests of Independence were conducted to determine whether the
observed counts and expected counts were significantly different. Student records with
unreported data were excluded from analyses. Independent variables were gender, race or
ethnicity, Pell eligibility, concurrent credit earned, high school type, and remedial course taken.
The dependent variable was the Academic Challenge Scholarship (ACS) award category, which
was either traditional (ACST) or nontraditional, age 24 and older (ACSNT 24+). Cross

55
tabulations include both the count (actual frequency) and the expected count (projected
frequency if the null hypothesis was true) used to conduct the Chi-Square Test of Independence.
Table 11 includes a cross tabulation of newly awarded recipients by award category per
gender.
Table 11: Award Category Cross Tabulation by Gender
Award Category Count/Expected Count Female Male Total
ACSNT 24+ Count 8,423 3,335 11,758
Expected Count 6,965 4,793 11,758
ACST Count 63,773 46,352 110,125
Expected Count 65,231 44,894 110,125
Total Count 72,196 49,687 121,883
Expected Count 72,196 49,687 121,883
Table 12 includes a cross tabulation of newly awarded recipients by award category per
race or ethnicity.
Table 12: Award Category Cross Tabulation by Race or Ethnicity
Award
Category
Count/Expected
Count African
American Hispanic Other
Two or
More
Races White Total
ACSNT 24+ Count 2,175 433 200 267 8,309 11,384
Expected Count 1,484 649 202 371 8,678 11,384
ACST Count 13,180 6,277 1,887 3,574 81,468 106,386
Expected Count 13,871 6,061 1,885 3,470 81,099 106,386
Total Count 15,355 6,710 2,087 3,841 89,777 117,770
Expected Count 15,355 6,710 2,087 3,841 89,777 117,770

56
Table 13 includes a cross tabulation of newly awarded recipients by award category per
Pell eligibility.
Table 13: Award Category Cross Tabulation by Pell Eligibility
Award Category Count/Expected Count No Yes Total
ACSNT 24+ Count 2,502 9,257 11,759
Expected Count 5,748 6,011 11,759
ACST Count 57,087 53,049 110,136
Expected Count 53,841 56,295 110,136
Total Count 59,589 62,306 121,895
Expected Count 59,589 62,306 121,895
Table 14 includes a cross tabulation of newly awarded recipients by award category per
concurrent credit earned.
Table 14: Award Category Cross Tabulation by Concurrent Credit Earned
Award Category Count/Expected Count No Yes Total
ACSNT 24+ Count 11,742 17 11,759
Expected Count 10,686 1,073 11,759
ACST Count 99,026 11,110 110,136
Expected Count 100,082 10,054 110,136
Total Count 110,768 11,127 121,895
Expected Count 110,768 11,127 121,895

57
Table 15 includes a cross tabulation of newly awarded recipients by award category per
high school type.
Table 15: Award Category Cross Tabulation by High School Type
Award Category Count/Expected Count GED
Home
School
HS
Diploma Total
ACSNT 24+ Count 1,490 31 7,124 8,645
Expected Count 137 63 8,445 8,645
ACST Count 155 730 94,391 95,276
Expected Count 1,508 698 93,070 95,276
Total Count 1,645 761 101,515 103,921
Expected Count 1,645 761 101,515 103,921
Table 16 includes a cross tabulation of newly awarded recipients by award category per
remedial course taken.
Table 16: Award Category Cross Tabulation by Remedial Course Taken
Award Category Count/Expected Count No Yes Total
ACSNT 24+ Count 7,359 4,400 11,759
Expected Count 11,277 482 11,759
ACST Count 109,542 594 110,136
Expected Count 105,624 4,512 110,136
Total Count 116,901 4,994 121,895
Expected Count 116,901 4,994 121,895
Utilizing SPSS, Chi-Square Tests of Independence were conducted to determine whether
differences between counts and expected counts were statistically significant. Results indicated
that differences for all demographic variables were statistically significant, with all p values
below .05. Therefore, the null hypothesis was rejected. Table 17 includes the Chi-Square value,
degrees of freedom, and p value for each demographic variable.

58
Table 17: Significance of Category Cross Tabulation by Demographic Variable
Demographic Variable Chi-Square Value df
Asymptotic Significance
(2-Sided)
Gender 828.968 1 0.000
Race/Ethnicity 485.014 4 0.000
Pell Eligibility 3969.894 1 0.000
Concurrent Credit 1266.264 1 0.000
High School Type 14837.765 2 0.000
Remedial Course Taken 36776.697 1 0.000
Research Question Two
Do college choices differ between Academic Challenge Scholarship recipients in the ACST
and ACSNT 24+ award categories?
Utilizing SPSS, expected counts were calculated for institution type per award category,
and Chi-Square Tests of Independence were conducted to determine whether the observed counts
and expected counts were significantly different. The independent variable was the Academic
Challenge Scholarship (ACS) award category, which was either traditional (ACST) or
nontraditional, age 24 and older (ACSNT 24+). The dependent variable was institution type (i.e.
four-year university, two-year college, nursing diploma school, and private college or
university). Table 18 includes a cross tabulation of newly awarded recipients by award category
per institution type, and it includes both the count (actual frequency) and the expected count
(projected frequency if the null hypothesis was true) used to conduct the Chi-Square Test of
Independence.

59
Table 18: Category Cross Tabulation by Institution Type
Award
Category
Count/Expected
Count
Four-Year
University
Two-Year
College
Nursing
Diploma
School
Private
College or
University Total
ACSNT 24+ Count 5,629 5,388 115 627 11,759
Expected Count 7,702 3,037 18 1,001 11,759
ACST Count 74,209 26,098 76 9,753 110,136
Expected Count 72,136 28,449 173 9,379 110,136
Total Count 79,838 31,486 191 10,380 121,895
Expected Count 79,838 31,486 191 10,380 121,895
Utilizing SPSS, a Chi-Square Test of Independence was conducted to determine whether
differences between counts and expected counts were statistically significant. Results indicated
statistically significant differences between award category and institution type (Chi-Square
value = 3345.864, degrees of freedom = 3, and p value = 0.000). Therefore, the null hypothesis
was rejected.
Research Question Three
Do college choices differ for Academic Challenge Scholarship recipients in the ACSNT 24+
award category when disaggregated by demographics?
Utilizing SPSS, expected counts were calculated for demographic variables per college
choice, and Chi-Square Tests of Independence were conducted to determine whether the
observed counts and expected counts were significantly different. The independent variables
were gender, race or ethnicity, and Pell eligibility. The dependent variables were institution type
(i.e. four-year university, two-year college, nursing diploma school, and private college or
university) and enrollment status (i.e. full-time or part-time). Cross tabulations include both the
count (actual frequency) and the expected count (projected frequency if the null hypothesis was
true) used to conduct the Chi-Square Test of Independence.
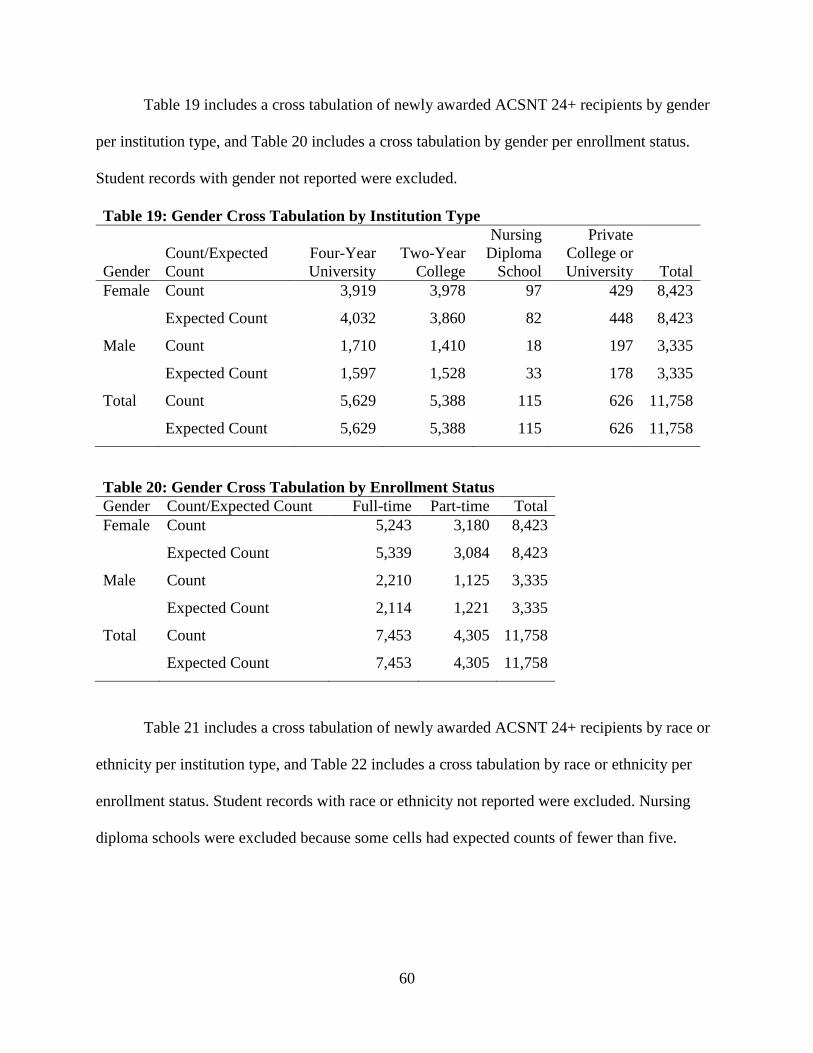
60
Table 19 includes a cross tabulation of newly awarded ACSNT 24+ recipients by gender
per institution type, and Table 20 includes a cross tabulation by gender per enrollment status.
Student records with gender not reported were excluded.
Table 19: Gender Cross Tabulation by Institution Type
Gender
Count/Expected
Count
Four-Year
University
Two-Year
College
Nursing
Diploma
School
Private
College or
University Total
Female Count 3,919 3,978 97 429 8,423
Expected Count 4,032 3,860 82 448 8,423
Male Count 1,710 1,410 18 197 3,335
Expected Count 1,597 1,528 33 178 3,335
Total Count 5,629 5,388 115 626 11,758
Expected Count 5,629 5,388 115 626 11,758
Table 20: Gender Cross Tabulation by Enrollment Status
Gender Count/Expected Count Full-time Part-time Total
Female Count 5,243 3,180 8,423
Expected Count 5,339 3,084 8,423
Male Count 2,210 1,125 3,335
Expected Count 2,114 1,221 3,335
Total Count 7,453 4,305 11,758
Expected Count 7,453 4,305 11,758
Table 21 includes a cross tabulation of newly awarded ACSNT 24+ recipients by race or
ethnicity per institution type, and Table 22 includes a cross tabulation by race or ethnicity per
enrollment status. Student records with race or ethnicity not reported were excluded. Nursing
diploma schools were excluded because some cells had expected counts of fewer than five.

61
Table 21: Race or Ethnicity Cross Tabulation by Institution Type
Race/Ethnicity
Count/Expected
Count
Four-Year
University
Two-Year
College
Private College
or University Total
African American Count 890 1,099 170 2,159
Expected Count 1,041 1,003 115 2,159
Hispanic Count 247 160 23 430
Expected Count 207 200 23 430
Other Count 121 73 6 200
Expected Count 97 93 11 200
Two or More Races Count 159 94 13 266
Expected Count 128 124 14 266
White Count 4,019 3,811 387 8,217
Expected Count 3,963 3,818 437 8,217
Total Count 5,436 5,237 599 11,272
Expected Count 5,436 5,237 599 11,272
Table 22: Race or Ethnicity Cross Tabulation by Enrollment Status
Race/Ethnicity Count/Expected Count Full-time Part-time Total
African American Count 1,308 851 2,159
Expected Count 1,366 793 2,159
Hispanic Count 259 171 430
Expected Count 272 158 430
Other Count 137 63 200
Expected Count 127 73 200
% within Attend 1.9% 1.5% 1.8%
Two or More Races Count 171 95 266
Expected Count 168 98 266
White Count 5,259 2,958 8,217
Expected Count 5,201 3,017 8,217
Total Count 7,134 4,138 11,272
Expected Count 7,134 4,138 11,272

62
Table 23 includes a cross tabulation of newly awarded ACSNT 24+ recipients by Pell
eligibility per institution type, and Table 24 includes a cross tabulation by Pell eligibility per
enrollment status.
Table 23: Pell Eligibility Cross Tabulation by Institution Type
Pell
Eligible
Count/
Expected Count
Four-Year
University
Two-Year
College
Nursing
Diploma
School
Private
College or
University Total
No Count 1,258 931 53 260 2,502
Expected Count 1,198 1,146 25 133 2,502
Yes Count 4,371 4,457 62 367 9,257
Expected Count 4,431 4,242 91 494 9,257
Total Count 5,629 5,388 115 627 11,759
Expected Count 5,629 5,388 115 627 11,759
Table 24: Pell Eligibility Cross Tabulation by Enrollment Status
Pell Eligible Count/Expected Count Full-time Part-time Total
No Count 1,278 1,224 2,502
Expected Count 1,586 916 2,502
Yes Count 6,175 3,082 9,257
Expected Count 5,867 3,390 9,257
Total Count 7,453 4,306 11,759
Expected Count 7,453 4,306 11,759
Utilizing SPSS, Chi-Square Tests of Independence were conducted to determine whether
differences between counts and expected counts were statistically significant. Results indicated
statistically significant differences between all demographic variables and choice of institution
type and enrollment status. Therefore, the null hypothesis was rejected. Table 25 includes the
Chi-Square value, degrees of freedom, and p value for each variable.

63
Table 25: Significance of College Choice Cross Tabulation by Demographic Variable
Demographic
Variable College Choice
Chi-Square
Value df
Asymptotic Significance
(2-Sided)
Gender Institution Type 36.132 3 0.000
Enrollment Status 16.641 1 0.000
Race/Ethnicity Institution Type 106.77 8 0.000
Enrollment Status 12.777 4 0.012
Pell Eligibility Institution Type 250.125 3 0.000
Enrollment Status 207.244 1 0.000
Research Question Four
Do changes in award amounts impact the college choices of Academic Challenge Scholarship
recipients in the ACSNT 24+ award category?
Utilizing SPSS, expected counts were calculated for award cohorts per college choice,
and Chi-Square Tests of Independence were conducted to determine whether the observed counts
and expected counts were significantly different. The independent variable was the award cohort
(1 = Academic years 2011 to 2013, 2 = Academic years 2014 to 2016, 3 = Academic years 2017
to 2019). The dependent variables were institution type (i.e. four-year university, two-year
college, nursing diploma school, and private college or university) and enrollment status (i.e.
full-time or part-time). Cross tabulations include both the count (actual frequency) and the
expected count (projected frequency if the null hypothesis was true) used to conduct the Chi-
Square Test of Independence.
Table 26 includes a cross tabulation of newly awarded ACSNT 24+ recipients by award
cohort per institution type, and Table 27 includes a cross tabulation by award cohort per
enrollment status.

64
Table 26: Award Cohort Cross Tabulation by Institution Type
Cohort
Count/Expected
Count
Four-Year
University
Two-Year
College
Nursing
Diploma
School
Private
College or
University Total
1 Count 2,866 3,470 70 306 6,712
Expected Count 3,213 3,076 66 358 6,712
2 Count 1,484 1,077 24 172 2,757
Expected Count 1,320 1,263 27 147 2,757
3 Count 1,279 841 21 149 2,290
Expected Count 1,096 1,049 22 122 2,290
Total Count 5,629 5,388 115 627 11,759
Expected Count 5,629 5,388 115 627 11,759
Table 27: Award Cohort Cross Tabulation by Enrollment Status
Cohort Count/Expected Count Full-time Part-time Total
1 Count 4,236 2,476 6,712
Expected Count 4,254 2,458 6,712
2 Count 1,784 973 2,757
Expected Count 1,747 1,010 2,757
3 Count 1,433 857 2,290
Expected Count 1,451 839 2,290
Total Count 7,453 4,306 11,759
Expected Count 7,453 4,306 11,759
Utilizing SPSS, Chi-Square Tests of Independence were conducted to determine whether
differences between counts and expected counts were statistically significant. Results indicated
statistically significant differences between ACSNT 24+ award cohorts in choice of institution
type. Therefore, the null hypothesis was rejected. However, differences between award cohorts
in enrollment status was not significantly different. Table 28 includes the Chi-Square value,
degrees of freedom, and p value for each variable.

65
Table 28: Significance of Award Cohort Cross Tabulation by College Choice
College Choice Chi-Square Value df
Asymptotic Significance
(2-Sided)
Institution Type 226.216 6 0.000
Enrollment Status 2.492 2 0.230
Research Question Five
Does degree completion differ for Academic Challenge Scholarship recipients in the ACSNT
24+ award category when disaggregated by demographics?
Utilizing SPSS, expected counts were calculated for each demographic variable per
degree completion, and Chi-Square Tests of Independence were conducted to determine whether
the observed counts and expected counts were significantly different. The independent variables
were gender, race or ethnicity, and Pell eligibility. The dependent variables were degree
completion (i.e. yes or no) and highest level of degree completed (i.e. certificate, associate
degree, or bachelor’s degree). Student records with gender or race or ethnicity not reported were
excluded. Nursing diplomas were excluded from highest degree completed due to some cells
having fewer than five expected counts. Cross tabulations include both the count (actual
frequency) and the expected count (projected frequency if the null hypothesis was true) used to
conduct the Chi-Square Test of Independence.

66
Table 29 includes a cross tabulation of ACSNT 24+ award category recipients by gender
per any degree completed within six years of initial award.
Table 29: Gender Cross Tabulation by Degree Completion
Gender Count/Expected Count No Yes Total
Female Count 1,272 3,594 4,866
Expected Count 1,324 3,542 4,866
Male Count 554 1,291 1,845
Expected Count 502 1,343 1,845
Total Count 1,826 4,885 6,711
Expected Count 1,826 4,885 6,711
Table 30 includes a cross tabulation of ACSNT 24+ award category recipients by gender
per highest degree completed within six years of initial award. Recipients who did not complete
any degree within six years of initial award were excluded. Nursing diplomas were excluded
because some cells had expected counts of fewer than five. Certificates of proficiency and
technical certificates were combined into one certificate category for the same reason.
Table 30: Gender Cross Tabulation by Highest Degree
Gender Count/Expected Count Certificate Associate Bachelor's Total
Female Count 356 1,585 1,653 3,594
Expected Count 346 1,510 1,739 3,594
Male Count 114 467 710 1,291
Expected Count 124 542 625 1,291
Total Count 470 2,052 2,363 4,885
Expected Count 470 2,052 2,363 4,885

67
Table 31 includes a cross tabulation of ACSNT 24+ award category recipients by race or
ethnicity per any degree completed (i.e. yes or no) within six years of initial award.
Table 31: Race or Ethnicity Cross Tabulation by Degree Completion
Race/Ethnicity Count/Expected Count No Yes Total
African American Count 435 882 1,317
Expected Count 359 958 1,317
Hispanic Count 35 131 166
Expected Count 45 121 166
Other Count 27 83 110
Expected Count 30 80 110
Two or More Races Count 24 71 95
Expected Count 26 69 95
White Count 1,298 3,690 4,988
Expected Count 1,359 3,629 4,988
Total Count 1,819 4,857 6,676
Expected Count 1,819 4,857 6,676
Table 32 includes a cross tabulation of ACSNT 24+ award category recipients by race or
ethnicity per highest degree completed within six years of initial award. Recipients who did not
complete any degree within six years of initial award were excluded. Nursing diplomas were
excluded because some cells had expected counts of fewer than five. Certificates of proficiency
and technical certificates were combined into one certificate category for the same reason.

68
Table 32: Race or Ethnicity Cross Tabulation by Highest Degree
Race/Ethnicity Count/Expected Count Certificate Associate Bachelor's Total
African American Count 108 402 372 882
Expected Count 85 372 426 882
Hispanic Count 9 51 71 131
Expected Count 13 55 63 131
Other Count 6 28 49 83
Expected Count 8 35 40 83
Two or More
Races Count 5 25 41 71
Expected Count 7 30 34 71
White Count 338 1,540 1,812 3,690
Expected Count 354 1,554 1,782 3,690
Total Count 466 2,046 2,345 4,857
Expected Count 466 2,046 2,345 4,857
Table 33 includes a cross tabulation of ACSNT 24+ award category recipients by Pell
eligibility per any degree completed (i.e. yes or no) within six years of initial award.
Table 33: Pell Eligibility Cross Tabulation by Degree Completion
Pell Eligible Count/Expected Count No Yes Total
No Count 364 1,069 1,433
Expected Count 390 1,043 1,433
Yes Count 1,463 3,816 5,279
Expected Count 1,437 3,842 5,279
Total Count 1,827 4,885 6,712
Expected Count 1,827 4,885 6,712
Table 34 includes a cross tabulation of ACSNT 24+ award category recipients by Pell
eligibility per highest degree completed within six years of initial award. Recipients who did not
complete any degree within six years of initial award were excluded. Nursing diplomas were

69
excluded because some cells had expected counts of fewer than five. Certificates of proficiency
and technical certificates were combined into one certificate category for the same reason.
Table 34: Pell Eligibility Cross Tabulation by Highest Degree
Pell Eligible Count/ Expected Count Certificate Associate Bachelor's Total
No Count 67 361 641 1,069
Expected Count 103 449 517 1,069
Yes Count 403 1,691 1,722 3,816
Expected Count 367 1,603 1,846 3,816
Total Count 470 2,052 2,363 4,885
Expected Count 470 2,052 2,363 4,885
Utilizing SPSS, Chi-Square Tests of Independence were conducted to determine whether
differences between counts and expected counts were statistically significant. Results indicated
statistically significant differences between ACSNT 24+ recipients for gender and race or
ethnicity per degree completion. Therefore, the null hypothesis was rejected. However,
differences between Pell eligibility and degree completion were not significantly different. For
ACSNT 24+ recipients who did complete a degree, differences between all demographic
variables and highest degree completed were significant. Table 35 includes the Chi-Square value,
degrees of freedom, and p value for each variable.
Table 35: Significance of Degree Completion and Highest Degree Cross Tabulation by
Demographic Variable
Demographic
Variable
Degree Completion/
Highest Degree
Chi-Square
Value df
Asymptotic Significance
(2-Sided)
Gender Degree Completion 10.203 1 0.001
Highest Degree 31.267 2 0.000
Race/Ethnicity Degree Completion 29.763 4 0.000
Highest Degree 25.887 8 0.001
Pell Eligibility Degree Completion 3.042 1 0.081
Highest Degree 76.099 2 0.000

70
Summary
Research Question One indicated demographic differences between recipients in the
ACST and ACSNT 24+ award categories. ACSNT 24+ recipients were 71.6% female (compared
to 57.9% of ACST recipients), 70.7% White (compared to 74% of ACST recipients), and 78.7%
Pell eligible (compared to 48.2% of ACST recipients). Additionally, fewer ACSNT 24+
recipients earned concurrent credit (.1% compared to 10.1% of ACST recipients) or earned a
traditional high school diploma (60.6% compared to 85.7% of ACST recipients). However, more
ACSNT 24+ recipients took a remedial course in college (37.4% compared to .5% of ACST
recipients). Counts for ACSNT 24+ were higher than expected for females, African American,
Pell eligible, and remedial course taken. Counts for ACSNT 24+ were lower than expected for
concurrent credit and traditional high school diploma earned. Chi-Square Tests of Independence
indicated that differences in all demographic variables between ACST and ACSNT 24+
recipients were significant. Therefore, the null hypothesis was rejected.
Research Question Two indicated college choice differences between recipients in the
ACST and ACSNT 24+ award categories. 67.4% of ACST recipients attended a four-year
university, compared to 47.9% of ACSNT 24+ recipients. Counts for ACSNT 24+ were higher
than expected for two-year college and nursing diploma school attendance, and lower than
expected for four-year university and private college or university attendance. The Chi-Square
Tests of Independence indicated that differences in institution type between ACST and ACSNT
24+ recipients were significant. Therefore, the null hypothesis was rejected.
Research Question Three indicated differences among ACSNT 24+ recipients in college
choice when disaggregated by demographic variables. More males (51.3%) than females (46.5%)
attended a four-year university, and more males (66.3%) than females (62.2%) attended full-

71
time. Counts for females were higher than expected for part-time attendance and two-year
college and nursing diploma school attendance. 41.2% of African American recipients attended a
four-year university, compared to 57.4% of Hispanic recipients and 48.9% of White recipients.
64% of White recipients attended full-time, compared to 60.6% of African American recipients
and 60.2% of Hispanic recipients. Counts for White and Hispanic recipients were higher than
expected for four-year university attendance, while counts for African American recipients were
higher than expected for two-year college and private college or university attendance. Counts
for African American and Hispanic recipients were higher than expected for part-time
attendance, while the count for White recipients was higher than expected for full-time
attendance. Fewer Pell eligible recipients (47.2%) than non-Pell eligible recipients (50.3%)
attended a four-year university, but more Pell eligible recipients (66.7%) than non-Pell eligible
recipients (51.1%) attended full-time. Counts for Pell eligible recipients were higher than
expected for full-time and two-year college attendance. Chi-Square Tests of Independence
indicated that differences in college choices between demographic variables for ACSNT 24+
recipients were significant. Therefore, the null hypothesis was rejected.
Research Question Four indicated differences in college choices between ACSNT 24+
award cohorts. More recipients in Award Cohort One selected a two-year college (51.7%) than
Award Cohort Two (39%) and Award Cohort Three (36.7%). Counts for Award Cohort One
were higher than expected for two-year college and nursing diploma school attendance, while
counts for Award Cohort Two and Three were higher than expected for four-year university and
private college or university attendance. While Chi-Square Tests of Independence did not
indicate significant differences in enrollment status (i.e. full-time or part-time) between ACSNT

72
24+ award cohorts, differences in institution type were significant. Therefore, the null hypothesis
was rejected.
Research Question Five indicated differences among ACSNT 24+ recipients in college
completion when disaggregated by demographic variables. More females (73.9%) than males
(70%) completed a degree at any level, but more males (55%) than females (46%) completed a
bachelor’s degree at the highest level. Counts for females were higher than expected for both
certificate and associate degree completion at the highest level. 67% of African American
recipients completed a degree at any level, compared to 78.9% of Hispanic recipients and 74% of
White recipients. Similarly, 42.2% of African American recipients completed a bachelor’s
degree at the highest level, compared to 54.2% of Hispanic recipients and 49.1% of White
recipients. Counts for African American recipients were higher than expected for both certificate
and associate degree completion at the highest level. While there were no differences between
Pell eligibility in degree completion at any level, 60% of non-Pell eligible recipients completed a
bachelor’s degree at the highest level, compared to 45.1% of Pell eligible recipients. Chi-Square
Tests of Independence indicated significant differences in both degree completion at any level
and highest degree completed between gender and race or ethnicity demographics for ACSNT
24+ recipients. Tests did not indicate significant differences in degree completion at any level
based on Pell eligibility, but tests did indicate significant differences between Pell eligibility and
highest degree completed. Therefore, the null hypothesis was rejected.
Findings are further discussed in the next chapter.

73
Chapter Five
Conclusions and Recommendations
This study reviewed nine years of student data to measure the impact of the state lottery
funded Academic Challenge Scholarship (ACS) on college choice and completion of adult
students. Using existing data from the Arkansas Division of Higher Education, the study
measured the overall demographics of ACS recipients in the traditional award category (ACST)
and adults age 24 and older in the nontraditional award category (ACSNT 24+) from academic
years 2011 to 2019. Students under the age of 24 in the nontraditional award category were
excluded. Using Chi-Square Tests of Independence, the data were examined to determine
whether college choice differed significantly between these groups, and for ACSNT 24+
students, whether college choice and completion differed significantly based on demographics
and award amount.
In 2009, Arkansas policymakers took an unusual position when developing rules for ACS
by including adult students and establishing lower than typical eligibility requirements, making
ACS the most widely accessible state lottery scholarship at the time of implementation. Other
states have since included adult students, following Arkansas’ lead. Since 2009, award amounts
have been reduced due to revenue shortages. However, revenue has since stabilized, making this
an ideal time to review the impact of the program and recommend changes to maximize access
and success for adult recipients.
To date, research on the impact of lottery scholarships on college choice and completion
is overwhelmingly limited to students who are recent high school graduates attending college for
the first-time, full-time. This study is significant because it contributes to literature on college
choice and completion for adult students, specifically disaggregated by demographic variables of
74
gender, race or ethnicity, and socioeconomic status. Given the projected national demographic
changes discussed in chapter one (an increasingly older and non-White population) it is
important for higher education advocates to pursue policies that positively impact college access
and success for adult and diverse populations. The state lottery funded Academic Challenge
Scholarship is a multi-million-dollar asset that should be maximized to support these
populations.
Results of the study were presented in chapter four. This chapter focuses on interpreting
the findings, identifying policy implications, and recommending areas for future research.
Conclusions
Research Question One
Do demographics differ between Academic Challenge Scholarship recipients in the ACST and
ACSNT 24+ award categories?
Recipients in the ACSNT 24+ category were significantly more likely to be female, to be
African American, to be Pell eligible, to have earned no earned concurrent credit, earned a GED
rather than a high school diploma, and to have taken at least one remedial course in their first
year of ACS award. These findings are consistent with many traits that Rowan-Kenyon (2007)
identified as predictors of delayed college enrollment. She determined that larger percentages of
students who were African American, low socioeconomic status, less academically prepared, and
had less family and peer support were more likely to not enroll or delay enrollment. It is not
surprising that the characteristics of students who are likely to delay college enrollment are more
prevalent in ACS recipients who are adults age 24 and older.
Given the stark demographic differences between ACST and ACSNT 24+ recipients, the
financial and other supports necessary to be successful in college are different. Since ACSNT

75
24+ recipients are more likely to be Pell eligible, they would benefit from additional needs-based
financial assistance for tuition and living expenses, and since they are more likely to be female,
they would benefit from additional financial support for childcare. ACSNT 24+ recipients are
older, farther removed from high school, and less academically prepared than their ACST
counterparts. Therefore, they would benefit from additional advising, tutoring, and career
services support. Finally, culturally relevant student services, such as mentorships and cohort
support groups, would benefit ACSNT 24+ recipients.
It is important to note the changes in annual recipient frequency by award category. As
discussed in chapter two, the initial academic year (2011) of ACS saw tremendous interest from
Arkansas’ adult population that has not since been repeated. In 2011, 5,440 total recipients were
awarded in the ACSNT 24+ category. The next highest academic year was 2013 with 1,205
recipients, with declining recipient numbers most years since. These decreases are potentially
related to economic conditions of the time. College enrollment peaked nationwide during the
Great Recession, and adults specifically sought short-term education and training opportunities
directly related to employment. Similarly, the number of ACST recipients peaked in 2013 at
13,341 and has declined most years since.
Research Question Two
Do college choices differ between Academic Challenge Scholarship recipients in the ACST
and ACSNT 24+ award categories?
Recipients in the ACSNT 24+ category were more likely to select a two-year college or
nursing diploma school. Given that 71.6% of ACSNT 24+ recipients were female, it is not
surprising that this population would pursue a female dominated occupation like health care and
select nursing diploma schools. Additionally, as this population is older and more likely to

76
receive Pell, they are less likely to move away from existing family and work responsibilities to
attend a four-year university. Therefore, it makes sense that they would select a local, more
affordable option like a two-year college.
Research Question Three
Do college choices differ for Academic Challenge Scholarship recipients in the ACSNT 24+
award category when disaggregated by demographics?
In the analysis of the ACSNT 24+ only population, female recipients were more likely to
select a two-year college or nursing diploma school and to attend part-time. Males were more
likely to attend a four-year university or a private college or university and to attend full-time. As
discussed earlier, it is not surprising that females would be more likely than males to pursue a
nursing diploma. The increased likelihood of females selecting a two-year college and attending
part-time is potentially due to time limitations of parenting responsibilities and needing to stay
close to home. The decreased likelihood of completing a bachelor’s degree at the highest level is
likely due to enrolling part-time.
African American recipients were more likely to select a two-year college or private
college or university, while all other races or ethnicities were more likely to select a four-year
university. The increased likelihood for African American recipients to select a private college or
university is potentially due to the availability of private Historically Black Colleges and
Universities in Arkansas. Both African American and Hispanic recipients were more likely to
attend part-time, while all other races or ethnicities were more likely to attend full-time, which is
potentially related to financial constraints.
Pell eligible recipients were more likely than non-Pell eligible recipients to attend a two-
year college and to attend full-time. Because these recipients are ages 24 and older, they are

77
considered financially independent of their parents for the purposes of calculating federal
financial aid. Without family support, and potentially responsible for supporting families of their
own, Pell eligible recipients are likely to seek affordable and nearby options for higher
education. Because Pell grants increase incrementally with the number of hours enrolled, Pell
eligible recipients benefit most when they enroll full-time.
Research Question Four
Do changes in award amounts impact the college choices of Academic Challenge Scholarship
recipients in the ACSNT 24+ award category?
Results indicated differences between ACSNT 24+ award cohorts in choice of institution
type. Award Cohort One (academic years 2011 to 2013) was more likely to select a two-year
college or nursing diploma school. Despite reductions in maximum award amounts, Award
Cohorts Two (academic years 2014 to 2016) and Three (academic years 2017 to 2019) were
more likely to select a four-year university or a private college or university. These findings may
be explained by the increased number of adults seeking short-term education and training
opportunities at two-year colleges due to the Great Recession, which would have impacted
Award Cohort One. Differences between award cohorts in enrollment status (i.e. full-time or
part-time) were not significant.
Research Question Five
Does degree completion differ for Academic Challenge Scholarship recipients in the ACSNT
24+ award category when disaggregated by demographics?
Results indicated differences between ACSNT 24+ recipients for degree completion by
gender. Females were more likely than males to complete a degree of any kind. However, of the
ACSNT 24+ degree completers, females were more likely to have completed a certificate or
associate degree at the highest level, and males were more likely to complete a bachelor’s degree

78
at the highest level. This may be a result of females seeking nursing and other health care
certificates and degrees, which generally require less than a bachelor’s degree. As previously
reported, females were more likely to attend part-time, which could also impact their highest
degree completed within six years.
Results were also significantly different between ACSNT 24+ recipients for degree
completion by race or ethnicity. African American recipients were less likely than all other races
or ethnicities to complete a degree of any kind. Of the ACSNT 24+ recipients that did complete a
degree, African American recipients were more likely to complete a certificate or associate
degree at the highest level. These findings are potentially because African American recipients
were more likely to attend part-time, which would impact their highest degree completed within
six years. For all other races or ethnicities, a bachelor’s degree was more likely the highest level.
Differences in degree completion between ACSNT 24+ recipients who were Pell eligible
and those who were not Pell eligible were not significantly different. However, for those who did
complete a degree, Pell eligible recipients were more likely to complete a certificate or associate
degree at the highest level, and those who were not Pell eligible were more likely to have
completed a bachelor’s degree at the highest level. As determined by Research Question Three,
Pell eligible recipients were more likely to stay close to home and attend a two-year college.
Because these recipients were adults with financial obligations in addition to college, they were
more likely to seek short-term education and training opportunities leading directly to
employment, which often does not require a bachelor’s degree.
Discussion
The differences in demographics between the ACST and ACSNT 24+ student
populations are clear. While there is insufficient research on adult recipients of other state

79
scholarship lotteries, the literature does indicate disproportionately fewer state scholarship lottery
awards to traditional students who are low-income (Dyanarski, 2000; Rubenstein & Scafaldi,
2002; Stranahan & Borg, 2004; McKinney, 2009; Kash & Lasley, 2010; Lebioda, 2014) and
racially or ethnically diverse (Dyanarski, 2000; Bowden & Elrod, 2004; Stranahan & Borg,
2004; Heller & Marin, 2004; McKinney, 2009; Kash & Lasley, 2010; Lebioda, 2014; Arbogast,
Thornton, & Swezda, 2016). The disproportionately fewer state scholarship lottery awards to
low-income and non-White traditional age students, as described in the literature, could explain
the increased propensity for these demographics to appear in adult recipients of the Academic
Challenge Scholarship.
ACSNT 24+ recipients were more likely than ACST recipients to attend a two-year
college or nursing diploma school. Of the ACSNT 24+ population, female, African American,
and Pell eligible recipients were more likely to attend a two-year college. Female and African
American recipients were more likely to attend part-time. Similar demographic discrepancies
were also evident in degree completion in the ACSNT 24+ population. Female, African
American, and Pell eligible recipients were more likely to complete a certificate or associate
degree at the highest level.
The Academic Challenge Scholarship is a significant benefit. However, alone it is
insufficient for promoting college access and attainment for underserved populations. Greater
levels of need-based financial aid and student support services are necessary to promote
equitable college access and attainment among adult, female, African American, and Pell eligible
students. Stacking a need-based aid component on top of the ACS academic requirements would
benefit low-income students. This is consistent with recommendations in the literature to add
need-based components to other state scholarship lotteries (Rubenstein & Scafaldi, 2002; Heller
80
& Marin, 2004; McKinney, 2009; Bone 2008; Kash & Lasley, 2010; Lebioda, 2014). Expanding
programs like the nationally recognized Arkansas Career Pathways Initiative, which utilizes
Transitional Aid to Needy Families (TANF) funds to provide mentoring and supportive services
such as childcare assistance to low-income parents, would benefit females. Expanding culturally
relevant programs such as mentoring and cohort support groups would benefit African American
and Hispanic students.
The study’s findings are consistent with the conceptual framework of the role of financial
aid in college choice by different demographics, with a focus on equity mindedness, as discussed
in chapter two (Heller, 1999; Paulson & St. John, 2002; Kim, DesJardins, & McCall, 2009;
Pingel & Holly, 2017; Duke-Benfield, Garcia, Walizer, & Welton, 2018). Consistent with the
framework, adults in this study made different college choices despite receiving the same
scholarship amounts as recent high school graduates. Within the adult population, college choice
and completion varied by demographic variables of gender, race or ethnicity, and Pell eligibility.
Because of these demographic differences in college choice and completion, higher education
leaders and advocates must prioritize policies that positively impact equitable college access and
success for adult and diverse populations.
Limitations
Limitations to interpreting and generalizing the findings of this study are as follows.
1. The timing of the ACS launch coincided with the Great Recession, which saw increased
numbers of adults enrolling in short-term education and training programs nationally.
Such programs are more directly tied to employment opportunities and are generally
offered by two-year colleges. Arkansas college choice trends for adults during this
timeframe may be more a result of the economy rather than the availability of ACS.

81
2. The findings on the impact of Pell eligibility on adult college choice and completion are
limited because the study only considered whether a recipient was Pell eligible. An
analysis of the impact of Pell award amounts would provide further detail on whether the
level of Pell eligibility impacted adult college choice and completion. For example, a
student receiving $500 in Pell may be different from a student receiving $5,000 in Pell.
3. This study clearly indicated difference between ACST and ACSNT 24+ recipients, and it
clearly indicated significant difference in college choices and completion for ACSNT
24+ by demographics. However, there is not enough detail in this study to determine
reasons for many of those differences.
Recommendations for Policy
Recommendations for policy are as follows:
1. The Arkansas Department of Education should promote ACS specifically to middle and
high school students who are statistically less likely to enroll in college immediately
following graduation. This includes students who are racially or ethnically diverse and/or
are socioeconomically disadvantaged. This should begin as early as possible so that
students can prioritize college preparation. Expansion of the existing Arkansas College
and Career Coach Program to all areas of the state would be beneficial in reaching this
population.
2. Higher education institutions should develop new or improve existing college campus
financial and student support programs for demographic populations less likely to
complete a college degree, and for those less likely to persist to a bachelor’s degree. This
could include offering need-based institutional scholarships, providing emergency aid for
unexpected expenses, and developing mentoring and cohort support programs such as the
82
Arkansas Career Pathways Initiative. These types of support programs should be
prioritized in the Arkansas Division of Higher Education’s Master Plan.
3. The Arkansas State Legislature should take action to include a need-based aid component
in ACS to support low-income students. Additionally, the State Legislature should direct
state funding to develop new or improve existing financial and student support programs
for demographic populations less likely to complete a college degree, such as the
Arkansas Career Pathways Initiative and the Arkansas College and Career Coach
Program.
4. The Arkansas Division of Higher Education should collect more student data to inform
what financial and student supports are necessary to assist populations less likely to
complete a college degree. This could include whether students are the first in their
family to attend college, are foster youth, or are parents. Such data would help determine
which populations need targeted support.
Recommendations for Future Research
Recommendations for future research are as follows.
1. Future research should measure the impact of Pell award amounts on college choice and
completion for ACSNT 24+ recipients. Differences in award amounts were not
considered in this study, but such detail could be beneficial in determining how need-
based financial aid should be structured to achieve a maximum benefit for students.
2. Future research should measure the ACS impact on ACSNT 24+ recipients by
combinations of demographic data. For example, since female, African American, and
Pell eligible recipients competed significantly lower degree levels, details on how a
combination of these demographic variables impact college choice and completion could

83
further inform how to structure financial aid and supportive services to achieve a
maximum benefit for students.
3. Future research should focus on the reasons that college choice and completion differed
for adult students and for different demographic groups. This could be accomplished
through qualitative interviews of ACS recipients.
4. Future research should focus on degree completion for Award Cohorts Two and Three
once enough time has passed to measure a six-year graduation rate.
5. Future research should focus on the impact of ACS on college choice and completion of
recipients excluded from this study, which were ACSNT recipients under the age of 24.
These recipients were excluded in order to clearly delineate between recent high school
graduates and independent, adult college students. However, they are a significant portion
of ACS recipients and should be studied.
Summary
This study measured the impact of the state lottery funded Academic Challenge
Scholarship on adult college choice and completion. Findings included significant demographic
differences between recent high school graduates in the traditional (ACST) award category and
independent adults age 24 and older in the nontraditional award category (ACSNT 24+). ACSNT
24+ recipients were significantly more likely to be female, to be African American, to be Pell
eligible, to have earned no concurrent credit, to not have graduated from a traditional high
school, and to have required a remedial course in college. ACSNT 24+ recipients were more
likely to enroll in a two-year college or nursing diploma school, whereas ACST recipients were
more likely to select a four-year university or private college or university.
Results also indicated significant differences among the ACSNT 24+ recipients when
disaggregated by demographics. Females were more likely to attend a two-year college or

84
nursing diploma school and more likely to attend part-time. Females were more likely than males
to complete a college degree of any level, but they were more likely to earn a certificate or
associate degree at the highest level. Male recipients were more likely to enroll in a four-year
university and enroll full-time, and they were more likely to complete a bachelor’s degree at the
highest level.
Differences by race or ethnicity were also significant. African American recipients were
more likely to select a two-year college or private college or university, while all other races or
ethnicities were more likely to select a four-year university. Both African American and
Hispanic recipients were more likely to enroll part-time than all other races or ethnicities.
African American recipients were less likely than all other races or ethnicities to complete a
degree of any level. Of ACSNT 24+ recipients who did complete a degree, African American
recipients were more likely to complete a certificate or associate degree at the highest level,
while all other races or ethnicities were more likely to complete a bachelor’s degree at the
highest level.
Pell eligible recipients were more likely to select a two-year college and enroll full-time
than non-Pell eligible recipients. Results did not indicate a significant difference between Pell
eligible and non-Pell eligible recipients in completion of any college degree. However, of
ACSNT 24+ recipients that did complete a degree, Pell eligible recipients were more likely to
complete a certificate or associate degree at the highest level, while non-Pell eligible recipients
were more likely to complete a bachelor’s degree at the highest level.
Finally, results indicated that ACSNT 24+ recipients in Award Cohort One (academic
years 2011 to 2013) were more likely than Award Cohorts Two and Three to select a two-year
college or nursing diploma school, while Award Cohorts Two and Three were more likely to

85
select a four-year university or private college or university. There was no significant difference
between the cohorts in whether they enrolled full- or part-time. The award years for Award
Cohort One overlap with the Great Recession, which saw record numbers of adults enrolling in
short-term education and training programs in order to find employment. It is unlikely that the
college choice differences between these cohorts were due solely to the availability of ACS.
These findings have significant implications for policy and future research. In terms of
policy, advocates should improve promotion of ACS among middle and high school students less
likely to enroll in college immediately following graduation, provide additional financial and
student services support specific to disadvantaged populations, include a need-based component
to ACS, and collect more detailed data on ACS recipients. Future researchers interested in the
impact of ACS on adult college choice and completion should evaluate the impact of differing
levels of Pell award amounts, the impact for recipients who have two or more of the
demographic characteristics discussed in this study, the reasons for college choice and
completion differences, college completion for Award Cohorts Two and Three, and the impact of
ACS on recipients in the nontraditional award category under the age of 24.

86
References
Achieving the Dream. (2019). Equity Statement. Retrieved from
https://www.achievingthedream.org/focus-areas/equity
Arbogast, G. W., Thornton, B., & Szweda, D. (2016). The impacts of wealth distribution as a
result of state funded lotteries. Journal of Management & Engineering Integration, 9(1),
82-92.
Arkansas Higher Education Coordinating Board. (2010, July 30). Agenda item no. 2. agency
updates. Meeting Minutes, Retrieved from https://static.ark.org/eeuploads/adhe/01_-_6-
30-10_Minutes.pdf
Arkansas Legislative Council Lottery Oversight Committee. (2019). Exhibit F: Academic
challenge student status report. Retrieved from
http://www.arkleg.state.ar.us/assembly/Meeting%20Attachments/041/2962/Exhibit%20F
%20-%20Academic%20Challenge%20Student%20Status%20Report.pdf
Arkansas Scholarship Lottery. 92019). About us. Retrieved from
https://www.myarkansaslottery.com/about/arkansas-lottery
Arkansas State Legislature. (2009). Act 606: The Arkansas scholarship lottery act. Retrieved
from http://www.arkleg.state.ar.us/assembly/2009/R/Acts/Act606.pdf
Arkansas State Legislature. (2010). Act 265: The Jodie Mahoney scholarship act. Retrieved from
http://www.arkleg.state.ar.us/assembly/2009/2010F/Acts/Act265.pdf
Arkansas State Legislature. (2011). Act 1180: To amend provisions of the Arkansas scholarship
lottery act concerning lottery proceeds, scholarship award amounts, and management of
certain capital assets of the Arkansas lottery commission. Retrieved from
http://www.arkleg.state.ar.us/assembly/2011/2011R/Acts/Act1180.pdf
Arkansas State Legislature. (2013a). Act 234: To amend provisions of the Arkansas academic
challenge scholarship program, part 2, concerning scholarship awards from net
proceeds of the lottery. Retrieved from
http://www.arkleg.state.ar.us/assembly/2013/2013R/Acts/Act234.pdf
Arkansas State Legislature. (2013b). Act 1106: To amend the Arkansas academic challenge
scholarship program, part 2, to require forfeiture of a scholarship award by a recipient
who does not make academic progress in a semester. Retrieved from
http://www.arkleg.state.ar.us/assembly/2013/2013R/Acts/Act1106.pdf
Arkansas State Legislature. (2015). Act 1105: To modify the eligibility requirements for the
academic challenge scholarship- part 2; and to clarify funding amounts and provisions.
Retrieved from http://www.arkleg.state.ar.us/assembly/2015/2015R/Acts/Act1105.pdf

87
Arkansas State Legislature. (2017a). Act 316: To create the Arkansas future grant program.
Retrieved from http://www.arkleg.state.ar.us/assembly/2017/2017R/Acts/Act316.pdf
Arkansas State Legislature. (2017b). Act 613: To create the Arkansas workforce challenge
scholarship. Retrieved from
http://www.arkleg.state.ar.us/assembly/2017/2017R/Acts/Act613.pdf
Arkansas State Legislature. (2019a). Act 456: To create the Arkansas concurrent challenge
scholarship. Retrieved from
http://www.arkleg.state.ar.us/assembly/2019/2019R/Acts/Act456.pdf
Arkansas State Legislature. (2019b). Act 549: To amend eligibility requirements regarding an
applicant for the Arkansas academic challenge scholarship to include the applicant’s
superscore on the ACT. Retrieved from
http://www.arkleg.state.ar.us/assembly/2019/2019R/Acts/Act549.pdf
Association of American Colleges and Universities. (2015). Step up and lead for equity: What
higher education can do to reverse our deepening divides. Retrieved from
https://www.aacu.org/publications/step-up-and-lead
Avery, C., & Hoxby, C. M. (2004). Do and should financial aid packages affect students’ college
choices? C. M. Hoxby (Ed.), College choices: The economics of where to go, when to go,
and how to pay for it (pp. 239-302). Chicago: University of Chicago Press.
Bensimon, E. M., Robert, R., Dowd, A., & Harris, F. (2007). Accountability, equity, and
practitioner learning and change. Metropolitan Universities, 18(3), p. 28-45.
Bensimon, E. M., & Malcolm, L. (2012). Confronting equity issues on campus: Implementing
the equity scorecard in theory and practice. Stylus Publishing, LLC.
Bone, M. A. (2008). The Tennessee education lottery scholarships' impact on Tennessee's public
higher education institutions (Order No. 3333195). Available from ProQuest Central;
ProQuest Dissertations & Theses Global. (304435062). Retrieved from http://0-
search.proquest.com.library.uark.edu/docview/304435062?accountid=8361
Bowden, R. G., & Elrod, H. E. (2004). State Lotteries: Their Effect on Equal Access to Higher
Education. Journal of Hispanic Higher Education, 3(1), 73–85.
doi.10.1177/1538192703259339
Bradberry, S. E. (2018). Analyzing the college persistence and graduation rates of first-time,
full-time recipients of the Arkansas academic challenge scholarship who attended a four-
year Arkansas public institution (Order No. 10809553). Available from ProQuest
Dissertations & Theses Global. (2048273977). Retrieved from http://0-
search.proquest.com.library.uark.edu/docview/2048273977?accountid=8361

88
Brantley, M. (2011, July 12). Lottery falls shorter still of forecast. Arkansas Times, Retrieved
from https://arktimes.com/arkansas-blog/2011/07/12/lottery-falls-shorter-still-of-forecast
Brantley, M. (2016). New lottery scholarship rules hit African American students the hardest.
Arkansas Times, Retrieved from https://arktimes.com/arkansas-blog/2016/11/23/new-
lottery- scholarship-rules-hit-African American-students-hardest
Bruce, D. J., & Carruthers, C. K. (2014). Jackpot? The impact of lottery scholarships on
enrollment in Tennessee. Journal of Urban Economics, 81, 30-44.
doi:10.1016/j.jue.2014.01.006
Carnevale, A. P., & Smith, N. (2012). A decade behind: Breaking out of the low-skill trap in the
southern economy. Georgetown University Center on Education and the Workforce.
Retrieved from https://cew.georgetown.edu/cew-reports/a-decade-behind/
Carnevale, A. P., & Cheah, B. (2018). Five rules of the college and career game. Georgetown
University Center on Education and the Workforce. Retrieved from
https://cew.georgetown.edu/cew-reports/5rules/
Carnevale, A. P., Van Der Werf, M., Quinn, M., Strohl, J., & Repnikov, D. (2018). Our
separate and unequal public colleges. Georgetown University Center on Education and
the Workforce. Retrieved from https://cew.georgetown.edu/cew-reports/sustates/
Carnevale, A. P., & Smith, N. (2018). Balancing work and learning: Implications for low-
income students. Georgetown University Center on Education and the Workforce.
Retrieved from https://cew.georgetown.edu/cew-reports/learnandearn/
Center for Urban Education. (2017). Improving attainment: Making equity part of your state’s
postsecondary planning. CA: University of Southern California. Retrieved from
https://cue.usc.edu/files/2017/02/Making-Equity-Part-of-Your-State%E2%80%99s-
Postsecondary-Planning_Final_Web.pdf
Chen, V. (2004). The Georgia HOPE scholarship. Policy Perspectives, 11(1), 9.
doi:10.4079/pp.v11i1.4118
Copeland, K. D., (2013). There were high hopes and high projections: Examining the social
construction of target populations in the policy design of the Arkansas lottery legislation.
Theses and Dissertations (932). Retrieved from https://scholarworks.uark.edu/etd/932
Copeland, K. D., & Mamiseishvili, K. (2017). The Arkansas Lottery Scholarship Act: An
Examination of the Policy Design Process. Educational Policy, 31(1), 108–
136. https://doi.org/10.1177/0895904815586854
Cornwell, C., Mustard, D. B., & Sridhar, D. J. (2006). The enrollment effects of merit-based
financial aid: Evidence from Georgia's HOPE program. Journal of Labor
Economics, 24(4), 761-786. doi:10.1086/506485

89
Creswell, J. W. (2012). Educational research: Planning, conducting, and evaluating quantitative
and qualitative research. Upper Saddle River, New Jersey: Pearson Education Inc.
Dee, T. S., & Jackson, L. A. (1999). Who loses HOPE? Attrition from Georgia's college
scholarship program. Southern Economic Journal, 66(2), 379-390. doi:10.2307/1061149
Duke-Benfield, A. E., Garcia, R., Walizer, L., & Welton, C. (2018). Developing state policy
that supports low-income, working students. Center for Law and Social Policy. Retrieved
from https://www.clasp.org/publications/report/brief/developing-state-policy-supports-
low-income-working-students
Dynarski, S. (2000). Hope for whom? Financial aid for the middle class and its impact on college
attendance. National Tax Journal, 53(3), 629-661. doi:10.17310/ntj.2000.3S.02
Dynarski, S. (2008). Building the stock of college-educated labor. Journal of Human
Resources, 43(3), 576-610. doi:10.3368/jhr.43.3.576
Erwin, C. P., & Binder, M. (2018). Does broad-based merit aid improve college completion?
Evidence from New Mexico's lottery scholarship. Education Finance and Policy, 1-77.
doi:10.1162/edfp_a_00270
Frey, W. H., (2018). The US will become ‘minority White’ on 2045, census projects. The
Brookings Institute. Retrieved from https://www.brookings.edu/blog/the-
avenue/2018/03/14/the-us-will-become-minority-white-in-2045-census-projects/
Gates, J. (2019, August 22). Data points: The case of the missing kindergarteners. Talk Business
and Politics. Retrieved from https://talkbusiness.net/2019/08/data-points-the-case-of-the-
missing-kindergarteners/
Glass, G. V., & Hopkins, K. D. (1970). Statistical methods in education and psychology.
Needham Heights, Massachusetts: Allyn & Bacon.
Harkreader, S., Hughes, J., Tozzi, M. H., &Vanlandingham, G. (2008). The impact of Florida's
bright futures scholarship program on high school performance and college enrollment.
Journal of Student Financial Aid, 38(1), 5-16.
Heller, D.E. (1999). The Effects of Tuition and State Financial Aid on Public College
Enrollment. The Review of Higher Education, 23(1), 65-89. doi:10.1353/rhe.1999.0023.
Heller, D. E., & Marin, P. (Eds.). (2004). State merit scholarship programs and racial inequality.
Cambridge, MA: The Civil Rights Project at Harvard University.
Hibblen, M. (2018, July 10). Arkansas scholarship lottery collects a record $500 million in
revenue. KUAR, Retrieved from https://www.ualrpublicradio.org/post/arkansas-
scholarship-lottery-collects-record-500-million-revenue

90
Jones, T., & Berger, K. (2019). Aiming for equity: A guide to statewide attainment goals for
racial equity advocates. The Education Trust. Retrieved from
https://edtrust.org/resource/aiming-for-equity/
Kash, J. P., & Lasley, S. (2010). Defining merit: The impact of award structure on the
distribution of merit aid. Journal of Student Financial Aid, 39(1), 30-40.
Kim, J., DesJardins, S. L., & McCall, B. P. (2009). Exploring the effects of student expectations
about financial aid and postsecondary choice: A focus on income and racial/ethnic
differences. Research in Higher Education, 50(8), 741-774.
Kim, J. (2012). Exploring the relationship between state financial aid policy and postsecondary
enrollment choices: A focus on income and race differences. Research in Higher
Education, 53(2), 123-151. doi:10.1007/s11162-011-9244-1
Knocking at the College Door. (2019). Dashboards. Western Interstate Commission for Higher
Education. Retrieved from https://knocking.wiche.edu/state-profiles
Lebioda, K. (2014). A gamble with consequences: State lottery-funded scholarship programs as
a strategy for boosting college affordability. Retrieved from American Association of
State Colleges and Universities website:
https://www.aascu.org/policy/publications/policy- matters/StateLotteryScholarships.pdf
Lumina Foundation. (2015). Strategy labs state policy academy: Addressing equity gaps in state
goals for postsecondary education attainment. Retrieved from
https://www.achievingthedream.org/org/371/lumina-foundation
Lumina Foundation. (2018). Beyond financial aid: How colleges can strengthen the financial
stability of low-income students and improve student outcomes. Retrieved from
https://www.luminafoundation.org/beyond-financial-aid
Lumina Foundation. (2019). A stronger nation: learning beyond high school builds American
talent. Retrieved from http://strongernation.luminafoundation.org/report/2019/#nation
Lumina Foundation Focus. (2019). In rural America, too few roads lead to college success.
Retrieved from https://focus.luminafoundation.org/in-rural-america-too-few-roads-lead-
to-college-success/
Malcom-Piqueux, L., & Bensimon, E. M. (2017) Taking equity-minded action to close equity
gaps. Association of American Colleges and Universities. Retrieved from
https://www.aacu.org/peerreview/2017/Spring/Malcom-Piqueux
Mckinney, L. (2009). An analysis of policy solutions to improve the efficiency and equity of
Florida’s bright futures scholarship program. Florida Journal of Educational
Administration & Policy, 2(2), 85-101.

91
Menifield, C. E. (2012). Lottery funded scholarships in Tennessee: Increased access but weak
retention for minority students. Journal of Education Finance, 38(1), 3-17.
National Equity Atlas. (2019). Data Summaries. Retrieved from
https://nationalequityatlas.org/data-summaries
Navient. (2017). Money under 35: Navient’s 2017 national study of financial health of young
adults between the ages of 22 and 35. Retrieved from
https://navient.com/assets/about/who-we-are/Money-Under-35-report-2017.pdf
Nelson, M., & Mason, J. L. (2003). The politics of gambling in the south. Political Science
Quarterly, 118(4), 645-669. doi:10.1002/j.1538-165X.2003.tb00409
Ness, E. C., & Tucker, R. (2008). Eligibility effects on college access: Under-represented student
perceptions of Tennessee's merit aid program. Research in Higher Education, 49(7), 569-
588. doi:10.1007/s11162-008-9096-5
Pallais, A. (2009). Taking a chance on college: Is the Tennessee education lottery scholarship
program a winner? Journal of Human Resources, 44(1), 199-222.
doi:10.1353/jhr.2009.0035
Paulsen, M. B., & St. John, E. P. (2002). Social class and college costs: Examining the financial
nexus between college choice and persistence. The Journal of Higher Education, 73(2),
189-236. doi:10.1353/jhe.2002.0023
Perna, L. (2006). Studying college access and choice: A proposed conceptual model. 10.1007/1-
4020-4512-3_3.
Perna, L., & Steele, P. (2011). The Role of Context in Understanding the Contributions of
Financial Aid to College Opportunity. Teachers College Record. 113. 895-933.
Pingel, S. (2019). Underfunded independence: How state aid programs are failing America’s
largest student population. The Evolllution. Retrieved from
https://evolllution.com/attracting-students/accessibility/underfunded-independence-how-
state-aid-programs-are-failing-americas-largest-student-population/
Pingel, S., and Holly, N. (2017). Seeking support: State financial aid programs and adult
learners. Education Commission of the States. Retrieved from
https://www.ecs.org/seeking-support-state-financial-aid-programs-and-adult-students/
Pittman, N. A. (2014), Evaluating the effects of the Arkansas scholarship lottery on college
participation (2194). Theses and Dissertations. Retrieved from
https://scholarworks.uark.edu/etd/2194
Poutre, A., Rorison, J., & Voight, M. (2017). Limited means, limited options: College remains
unaffordable for many Americans. Institute for Higher Education Policy.
92
Rowan-Kenton, H. T. (2007). Predictors of delayed college enrollment and the impact of
socioeconomic status. The Journal of Higher Education, 78(2), 188-214.
Rubenstein, R., & Scafidi, B. (2002) Who pays and who benefits? Examining the distributional
consequences of the Georgia lottery for education. National Tax Journal, 55(2), 223-238.
doi:10.17310/ntj.2002.2.02
Scott-Clayton, J. (2011). On money and motivation: A quasi-experimental analysis of financial
incentives for college achievement. Journal of Human Resources, 46(3), 614-646.
doi:10.3368/jhr.46.3.614
Shell, R. A. (2016). HOPE scholarship enrollment trends across the state of Georgia. (Order No.
10105776). Available from ProQuest Central; ProQuest Dissertations & Theses Global.
(1790623113). Retrieved from http://0-
search.proquest.com.library.uark.edu/docview/1790623113?accountid=8361
Sjoquist, D. L., & Winters, J. V. (2015). State merit-based financial aid programs and college
attainment. Journal of Regional Science, 55(3), 364-390. doi:10.1111/jors.12161
Stanley, R. E., & French, P. E. (2005). Enrollment levels in institutions of higher education: Are
state lotteries making a difference in Dixie? Journal of College Admission, 188(188), 21.
Stanley, R. E., & French, P. E. (2009). Evaluating increased enrollment levels in institutions of
higher education: A look at merit-based scholarship programs. Public Administration
Quarterly, 33(1), 4-36.
Stranahan, H. A., & Borg, M. O. (2004). Some futures are brighter than others: The net benefits
received by Florida bright futures scholarship recipients. Public Finance Review, 32(1),
105-126. doi:10.1177/1091142103258229
Tan, E. (2014). Human Capital Theory: A Holistic Criticism. Review of Educational
Research, 84(3), 411-445. Retrieved from http://0-
www.jstor.org.library.uark.edu/stable/24434243
Wallis, F. (2010, Aug 11). Lottery scholarships: ASUMH staff plans for enrollment
increase. Baxter Bulletin Retrieved from http://0-
search.proquest.com.library.uark.edu/docview/741505172?accountid=8361
Welch, J. G. (2014). HOPE for community college students: The impact of merit aid on
persistence, graduation, and earnings. Economics of Education Review, 43, 1-20.
doi:10.1016/j.econedurev.2014.08.001
Zhang, L., Hu, S., & Sensenig, V. (2013). The effect of Florida's bright futures program on
college enrollment and degree production: An aggregated-level analysis. Research in
Higher Education, 54(7), 746-764. doi:10.1007/s11162-013- 9293-8

93
IRB Protocol

94
Data Sharing Memorandum of Understanding

95

96

97

98

99

100