Embed Size (px)
Citation preview
The Impact of the 2008 German Corporate TaxReform: A dynamic CGE Analysis�
Doina Radulescu Michael StimmelmayrCenter for Economic Studies, Center for Economic Studies,
University of Munich and CESifoy University of Munich and CESifoz
This version: January 2009
Abstract
In this paper we develop the dynamic CGE model, ifoMod, which is designedto analyse the impact of fundamental tax reforms and in particular capital in-come tax reforms for Germany. The model is in line with neoclassical growththeory and features all important behavioural interactions between the fourmajor building blocks of an economy including the �rm and household sec-tor, the government and the rest of the world. We consider �rms of di¤erentlegal forms which all face an inter-temporal investment problem, a �nancingproblem w.r.t. the optimal choice of debt and equity �nancing as well as thefactor input problem when deciding on the optimal amount of di¤erent skilltypes of labour employed. We show the impact of di¤erent types of taxes onthe behavioral margins of �rms and households and the conducted simula-tion shows the impact of the latest German corporate tax reform of 2008 onthe German macroeconomic variables such as investments, GDP, consumptionand household�s welfare.
Keywords: Capital income taxation, computable general equilibrium mod-eling, welfare analysis.
JEL-Classi�cation: C68, D58, D92, E62, H25
�The authors would like to thank Christian Keuschnigg for his valuable support. His comments andcontinuous motivation were especially helpful during the research stays at the University of St.Gallen
yCES, University of Munich, Schackstr. 4, 80539 Munich, Germany, [email protected], University of Munich, Schackstr. 4, 80539 Munich, Germany, [email protected]
1 Introduction
The e¤ects of a comprehensive tax reform are manifold. Beside the more obvious �rst
order e¤ects economy-wide repercussions and second-order e¤ects have to be considered,
too, such that it has become a di¢ cult task to evaluate and quantify the impact of
comprehensive tax reforms. In this regard, Computable General Equilibrium (CGE)
models have proved to be a straightforward instrument to asses the quantitative impact
and relative e¢ ciency of alternative tax instruments as well as the distributional, �scal
and allocative e¤ects of various tax reform proposals.
Computable General Equilibrium (CGE) models are these days widely applied in
various �elds of economics and policy advice. The theoretical underpinning of CGE
modelling has its seed in the Walrasian equilibrium (Walras 1877) theory as well as the
modern conception of the general equilibrium theory à la Arrow and Debreu (1954).
The �rst numerical approaches in solving Arrow-Debreu general equilibrium system were
pioneered by Scarf (1967) and his scholars Shoven and Whalley (1972, 1973) in
the 1970�s. The more recent CGE models have, however, advanced remarkably since
then. Nowadays CGE models are marked by a high degree of complexity with regard
to both the speci�cation of the behavioural features of economic agents as well as sector
and factor market linkages. These complex systems of quantitative linkages enable us
to analyse not just the qualitative but also quantitative implications of comprehensive
policy reforms. In detail, CGE models are built to shed light on the short and long
term repercussions of issues such as international trade agreements, like the Doha Trade
Round, environmental issues such as climatic changes and the impact of pollution permits,
scenarios of imperfect competition or public �nance issues, i.e. pension funding in ageing
societies or comprehensive tax reforms with dynamic features.1
In this paper we develop the dynamic CGEmodel, ifoMod, which is designed to analyse
the impact of fundamental tax reforms and in particular capital income tax reforms for
Germany. Our model is in line with neoclassical growth theory and features all important
1One drawback of CGE models refer to their strict dependence on the functional forms con-sidered and parameter values applied. These kind of critique, however, applies to other forms ofeconomic tools, as well and in particular to econometric models (Fossati and Wiegard, 2002).
1
behavioural interactions between the four major building blocks of an economy including
the �rm and household sector, the government and the rest of the world. In detail, we
consider �rms of two di¤erent legal forms, e.g. corporate an non-corporate �rms which
di¤er with regard to their tax treatment. Both types of �rms face an inter-temporal
investment problem, a �nancing decision problem w.r.t. the optimal choice of debt and
equity �nancing as well as the factor input problem when deciding on the optimal amount
of di¤erent skill types of labour employed. The marginal investment is assumed to be
partly debt and partly equity �nanced via new share issues and retained earnings, such
that our model combines the �Old View� and �New View� of dividend taxation - even
though the model is strongly biased towards the �New View�.2 This is the case, since the
lion�s share of investment funds stems from retained earnings.
On the household side, we apply the traditional Ramsey model (Ramsey 1928) which,
due to its dynastic linkage between generations, enables us to conduct a coherent welfare
analysis for any kind of reform.3 Our representative agent is endowed with three di¤erent
skill types of labour and maximizes her life-time utility by choosing the optimal inter-
temporal pattern of consumption and optimal labour supply of each skill type. In addition,
the agent has to solve a portfolio choice problem, since ifoMod features four di¤erent types
of assets, encompassing �rm equity, �rm bonds as well as domestic and foreign government
bonds.
The government introduces various distortions on the behavioural margins of agents
through taxation. In total, we consider seven di¤erent types of taxes, including a corporate
tax, a tax on pro�ts of non-corporate �rms (which is identical to the personal income tax
of the �rm proprietor), a tax on labour income as well as personal taxes on capital income
such as interest income, dividends and capital gains (thereby the taxation of the �nancial
assets follows the residence principle of taxation). Finally, we also consider a value added
2A focal issue in the literature is whether investments are �nanced by new equity issues orretrained earnings at the margin. The former is referred to as the Old View of dividend taxation,while the latter is referred to as the New View of dividend taxation. The New View was �rstpublished by King (1974, 1977), Auerbach (1979) and Bradford (1981). See e.g. Sinn(1991a) for an illustration of the two views.
3Contrary to that, in an overlapping generations (OLG) framework which is also frequentlyapplied in CGE modelling, new generations virtually �drop from heaven�and it is unclear howto account for their welfare gain or loss resulting from policy reforms.
2
tax (VAT). The governments�s actions are restricted by the European Stability and Growth
Pact which limits the government�s budget de�cit to three percent of GDP and the level
of government debt to 60 percent of GDP. Last but not least, the Rest of the World
(RoW) is modelled as a foreign economy which is about ten times larger than the home
economy. Therefore, our framework can be regarded as a two country setting with little
in�uential power of the home country. The foreign economy is, however, only roughly
modeled and serves merely to complete the general equilibrium framework.
Altogether, the model mimics every important behavioural margin at the �rm and
household level that is strongly sensitive to the e¤ects of capital income taxation. Fur-
thermore, the model does not only compute the economy�s new steady state solution
under the new tax rules as it is the case in any static analysis. Since our model is a
fully dynamic, micro based macro model it additionally accounts for the behavioural re-
actions of agents and features the whole path of equilibria from the initial to the �nal
steady state equilibrium. This is in particular important for the savings and investment
decisions which are by nature forward looking and thus are marked by important tax cap-
italization e¤ects. For example, each single change in any capital income tax triggers an
adjustment in the �rm�s �nancial behavior, like a reshu e of the �rm�s source of �nance
and use of funds, which in turn in�uences the resulting cost of capital and therewith the
�rm�s investment decision and its accumulation of capital. The capital intensities of each
representative �rm a¤ect the demand for the di¤erent skill types of labour and thus have
a major repercussion on the household income and consumption pro�le. In addition, our
model o¤ers information on the marginal excess burden of each particular tax considered
and the conducted welfare analysis is based on the equivalent variation in consumption.4
ifoMod was appreciated by the German Council of Economic Advisors (GCEA, 2005)
as being a state-of-the-art model and one of the most developed and advanced CGEmodels
of the type which can be used to simulate capital income tax reforms for Germany. It
was also applied to quantify the complex e¤ects of introducing a Dual Income Tax in
Germany for the GCEA (2006). It has a sound theoretical foundation such that one can
also draw on the underlying core economic model to explain the simulation results.
4A detailed discussion of the model is found in Readulescu (2007) or Stimmelmayr (2007).
3
Among comparable CGE models which are predominantly dedicated to tax analyses
in European economies we can count the model by Fehr (1999), Keuschnigg (2004)
and Dietz and Keuschnigg (2003, 2004 and 2007) and Sørensen (2001) for example.
The model by Fehr (1999) uses a dynamic simulation model of the Auerbach-
Kotlikoff (1987) type featuring intragenerational heterogeneity. The focus of this
model is on distributional and e¢ ciency aspects of di¤erent �cal reform packages in-
cluding proposals to reform the German pension system.
The IFF Tax Model is another important CGE model developed by Keuschnigg
(2004) and Dietz and Kesuchnigg (2003, 2004, and 2007). This model is also a fully
dynamic model and was built to evaluate fundamental tax reforms for the Swiss economy.
It encompasses features like �rms of di¤erent legal status, an endogenous dividend and
debt policy as well as in- and outward FDI by multinationals. On the OLG household
side endogenous labour supply and international portfolio investments with home bias are
considered.
Finally, OECDTAX, developed by Sørensen (2001), is intended to describe the in-
ternational cross-border e¤ects resulting from national tax policies via the world capital
market as well as international tax coordination within the OECD countries. Therefore,
the model considers a detailed private portfolio composition, foreign direct and foreign
portfolio investments, a housing market, endogenous corporate �nancial policies as well as
a labour market with structural unemployment. This richness of details, implies however,
that one has to cut back somewhere else on the modelling side, such that OECDTAX is
static describing only a stationary long-run equilibrium.
The present paper is structured as follows: the �rst part introduces the model with a
detailed description of its four building blocks. Within this section, special attention is
paid to the �nancing and investment decision of the di¤erent �rm types. The second part
presents the simulation analysis conducted which focuses on the latest German corporate
tax reform which became e¤ective as of the 1st of January 2008.
4
2 The Model
2.1 Production & Investments
The most important building block of our model is the intertemporal investment model
with convex adjustment costs in the spirit of Tobin�s (1969) Q-Theory of investments.
Both the corporate and the non-corporate sector draw on a basic neoclassical, linearly
homogenous Constant Elasticity of Substitution (CES) production technology, F (�) toproduce a uniform, tradeable output good, Y . The price of the output good is normalized
to one and the �rms in each sector are distinguished by the superscript f 2 fC;Ng.
Y f = F (Lf; Kf ; Ef ) = Af
hdfL
f;� 1��� + (1� df )Kf;�
1��� + Ef;
� 1���
i ��1��
with F (0) = 0; F 0 > 0; F 00 < 0:
(1)
Labour, L, capital, K, and a sector speci�c �xed factor, E, serve as input factors.5 The
elasticity of substitution between input factors is denoted by � while d denotes a preference
parameter.
The variable, L, resembles a labour composite in the form of a CES preference function
consisting of low-, Ll, medium-, Lm, and high-skilled labour, Lh. The optimal composition
of the di¤erent labour skill types, i.e. the unit labour demands, li, i 2 fl; m; hg, followsfrom the cost minimization problem
wf = minlfi ; i2fl; m; hg
P3iwi � l
fi ;
s:t: lf=
8<:P 3i
��fi
� 11+� h
lfi
i �1+�
9=;1+��
= 1:
(2)
The solution to eq. (2) yields optimal unit labour demands
lfi =�fi
w1+�i
hP3i�
fi � w
��i
i 1+��
; (3)
5The �xed factor can be interpreted as a sector speci�c rent which assures the existence ofsome �rms in the corporate and non-corporate sector even if the tax system heavily discriminatesagainst one of these two legal forms.
5
with �fLi, i 2 fl; m; hg denoting the preference parameters for each skill type of labour6
and � denoting the substitution elasticity between the di¤erent labour skill types. The
overall labour demand for each skill type is �nally computed by Lfi = Lf � lfi .
Capital expands over time whenever gross investments, I, exceed depreciation, �K.
The equation of motion for capital is thus determined by the amount of net investments,
IN .7
GKft+1 = I
ft + (1� �)Kf
t , GKft+1 �K
ft = I
ft � �Kf
t = INft : (4)
The variableG which enters each di¤erential equation denotes the exogenous trend growth
in labour productivity, G = 1 + g. Accordingly, in the balanced growth equilibrium all
variables grow at the rate g.
Investments additionally incur adjustment costs of J(I;K) for each unit of capital
installed. The adjustment costs re�ect positive but diminishing marginal returns to capital
formation and can be interpreted as the costs arising due to a �rm�s internal reorganization
if the �rm expands.
Jf = J(If ; Kf ) = If � JfI +Kf � JfK ;with JI > 0; JII > 0; JII < 0:
(5)
The adjustment cost function is linearly homogenous in investment and capital and convex
in investments. The steady state adjustment costs are zero and do not in�uence the steady
state solution.
2.2 Financial Identities & Arbitrage
Corporate �rms have access to three di¤erent sources of funds encompassing new debt,
BN , new share issues, V N , and retained earnings, (� �D) when �nancing their net in-vestment outlays, INC . Retained earnings are de�ned as pro�ts, �, less dividend payouts,
6The empirical evidence on the wage rates and the employment of the di¤erent labour skilltypes across sectors allows us to calibrate the preference parameters �i, i 2 fl; m; hg, accordingto �fi = l
fi � wi1+�=
hP3i lfi � wi
i1+�:
7Gross investments, I, are de�ned by net investment, IN , plus replacement investments, �K.
6
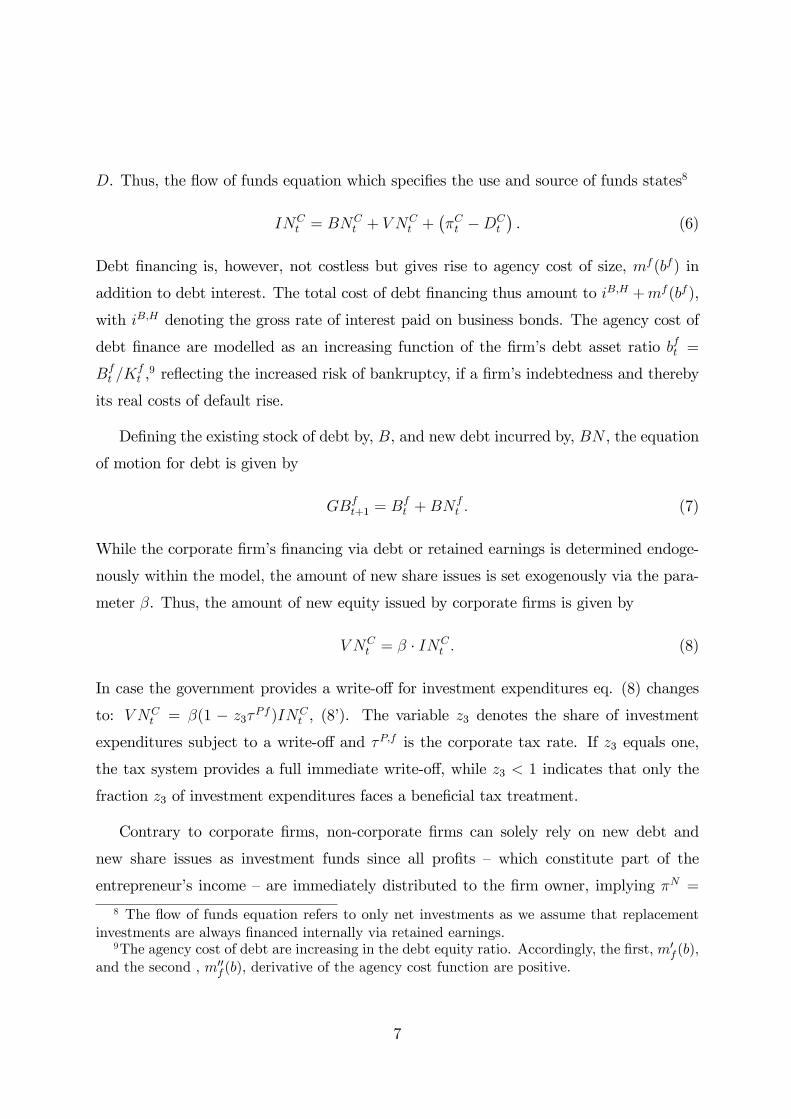
D. Thus, the �ow of funds equation which speci�es the use and source of funds states8
INCt = BN
Ct + V N
Ct +
��Ct �DC
t
�. (6)
Debt �nancing is, however, not costless but gives rise to agency cost of size, mf (bf ) in
addition to debt interest. The total cost of debt �nancing thus amount to iB;H +mf (bf ),
with iB;H denoting the gross rate of interest paid on business bonds. The agency cost of
debt �nance are modelled as an increasing function of the �rm�s debt asset ratio bft =
Bft =Kft ,9 re�ecting the increased risk of bankruptcy, if a �rm�s indebtedness and thereby
its real costs of default rise.
De�ning the existing stock of debt by, B, and new debt incurred by, BN , the equation
of motion for debt is given by
GBft+1 = Bft +BN
ft : (7)
While the corporate �rm�s �nancing via debt or retained earnings is determined endoge-
nously within the model, the amount of new share issues is set exogenously via the para-
meter �. Thus, the amount of new equity issued by corporate �rms is given by
V NCt = � � INC
t : (8)
In case the government provides a write-o¤ for investment expenditures eq. (8) changes
to: V NCt = �(1 � z3�Pf )INC
t , (8�). The variable z3 denotes the share of investment
expenditures subject to a write-o¤ and �P;f is the corporate tax rate. If z3 equals one,
the tax system provides a full immediate write-o¤, while z3 < 1 indicates that only the
fraction z3 of investment expenditures faces a bene�cial tax treatment.
Contrary to corporate �rms, non-corporate �rms can solely rely on new debt and
new share issues as investment funds since all pro�ts � which constitute part of the
entrepreneur�s income �are immediately distributed to the �rm owner, implying �N =
8 The �ow of funds equation refers to only net investments as we assume that replacementinvestments are always �nanced internally via retained earnings.
9The agency cost of debt are increasing in the debt equity ratio. Accordingly, the �rst, m0f (b),
and the second , m00f (b), derivative of the agency cost function are positive.
7
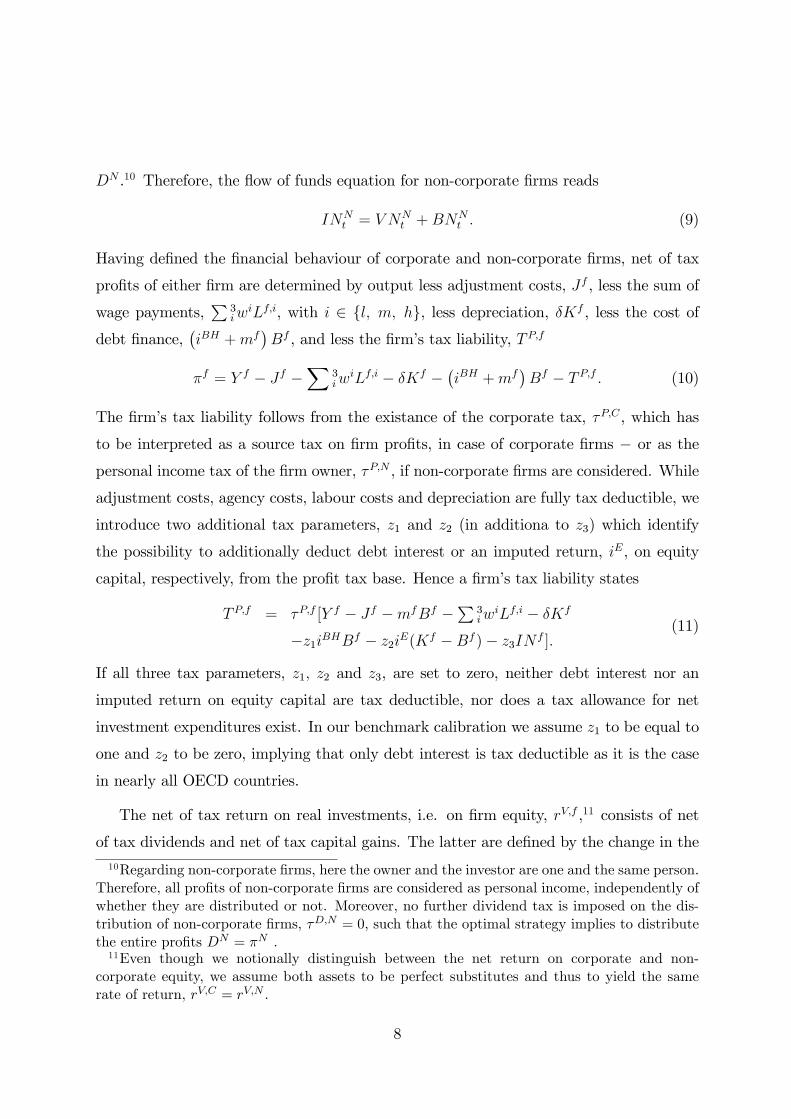
DN .10 Therefore, the �ow of funds equation for non-corporate �rms reads
INNt = V N
Nt +BN
Nt : (9)
Having de�ned the �nancial behaviour of corporate and non-corporate �rms, net of tax
pro�ts of either �rm are determined by output less adjustment costs, Jf , less the sum of
wage payments,P
3iw
iLf;i, with i 2 fl; m; hg, less depreciation, �Kf , less the cost of
debt �nance,�iBH +mf
�Bf , and less the �rm�s tax liability, T P;f
�f = Y f � Jf �X
3iw
iLf;i � �Kf ��iBH +mf
�Bf � T P;f : (10)
The �rm�s tax liability follows from the existance of the corporate tax, �P;C , which has
to be interpreted as a source tax on �rm pro�ts, in case of corporate �rms � or as the
personal income tax of the �rm owner, �P;N , if non-corporate �rms are considered. While
adjustment costs, agency costs, labour costs and depreciation are fully tax deductible, we
introduce two additional tax parameters, z1 and z2 (in additiona to z3) which identify
the possibility to additionally deduct debt interest or an imputed return, iE, on equity
capital, respectively, from the pro�t tax base. Hence a �rm�s tax liability states
T P;f = �P;f [Y f � Jf �mfBf �P
3iw
iLf;i � �Kf
�z1iBHBf � z2iE(Kf �Bf )� z3IN f ]:(11)
If all three tax parameters, z1; z2 and z3, are set to zero, neither debt interest nor an
imputed return on equity capital are tax deductible, nor does a tax allowance for net
investment expenditures exist. In our benchmark calibration we assume z1 to be equal to
one and z2 to be zero, implying that only debt interest is tax deductible as it is the case
in nearly all OECD countries.
The net of tax return on real investments, i.e. on �rm equity, rV;f ,11 consists of net
of tax dividends and net of tax capital gains. The latter are de�ned by the change in the10Regarding non-corporate �rms, here the owner and the investor are one and the same person.
Therefore, all pro�ts of non-corporate �rms are considered as personal income, independently ofwhether they are distributed or not. Moreover, no further dividend tax is imposed on the dis-tribution of non-corporate �rms, �D;N = 0; such that the optimal strategy implies to distributethe entire pro�ts DN = �N .11Even though we notionally distinguish between the net return on corporate and non-
corporate equity, we assume both assets to be perfect substitutes and thus to yield the samerate of return, rV;C = rV;N .
8
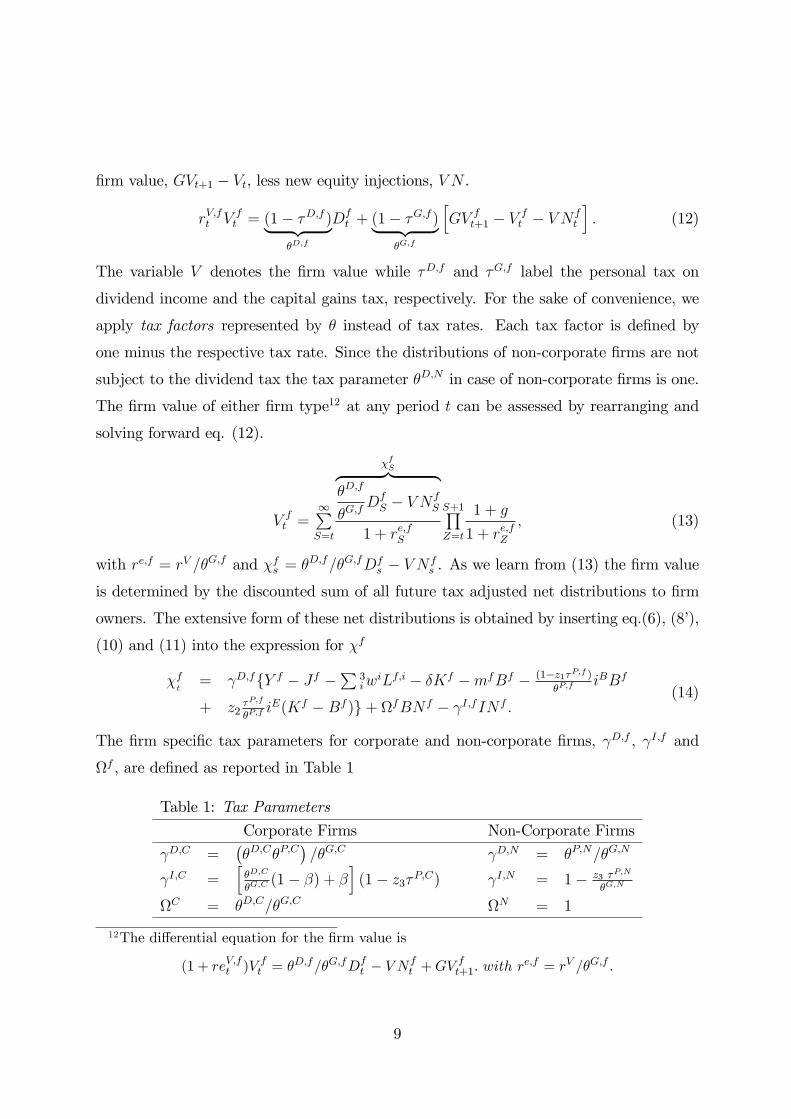
�rm value, GVt+1 � Vt, less new equity injections, V N .
rV;ft V ft = (1� �D;f )| {z }�D;f
Dft + (1� �G;f )| {z }
�G;f
hGV ft+1 � V
ft � V N f
t
i: (12)
The variable V denotes the �rm value while �D;f and �G;f label the personal tax on
dividend income and the capital gains tax, respectively. For the sake of convenience, we
apply tax factors represented by � instead of tax rates. Each tax factor is de�ned by
one minus the respective tax rate. Since the distributions of non-corporate �rms are not
subject to the dividend tax the tax parameter �D;N in case of non-corporate �rms is one.
The �rm value of either �rm type12 at any period t can be assessed by rearranging and
solving forward eq. (12).
V ft =1PS=t
�fSz }| {�D;f
�G;fDfS � V N
fS
1 + re;fS
S+1QZ=t
1 + g
1 + re;fZ; (13)
with re;f = rV =�G;f and �fs = �D;f=�G;fDf
s � V N fs . As we learn from (13) the �rm value
is determined by the discounted sum of all future tax adjusted net distributions to �rm
owners. The extensive form of these net distributions is obtained by inserting eq.(6), (8�),
(10) and (11) into the expression for �f
�ft= D;ffY f � Jf �
P3iw
iLf;i � �Kf �mfBf � (1�z1�P;f )�P;f
iBBf
+ z2�P;f
�P;fiE(Kf �Bf )g+ fBN f � I;fIN f :
(14)
The �rm speci�c tax parameters for corporate and non-corporate �rms, D;f , I;f and
f , are de�ned as reported in Table 1
Table 1: Tax Parameters
Corporate Firms Non-Corporate Firms
D;C =��D;C�P;C
�=�G;C D;N = �P;N=�G;N
I;C =h�D;C
�G;C(1� �) + �
i(1� z3�P;C) I;N = 1� z3 �P;N
�G;N
C = �D;C=�G;C N = 1
12The di¤erential equation for the �rm value is
(1 + reV;ft )V ft = �D;f=�G;fDft � V N
ft +GV
ft+1: with r
e;f = rV =�G;f :
9
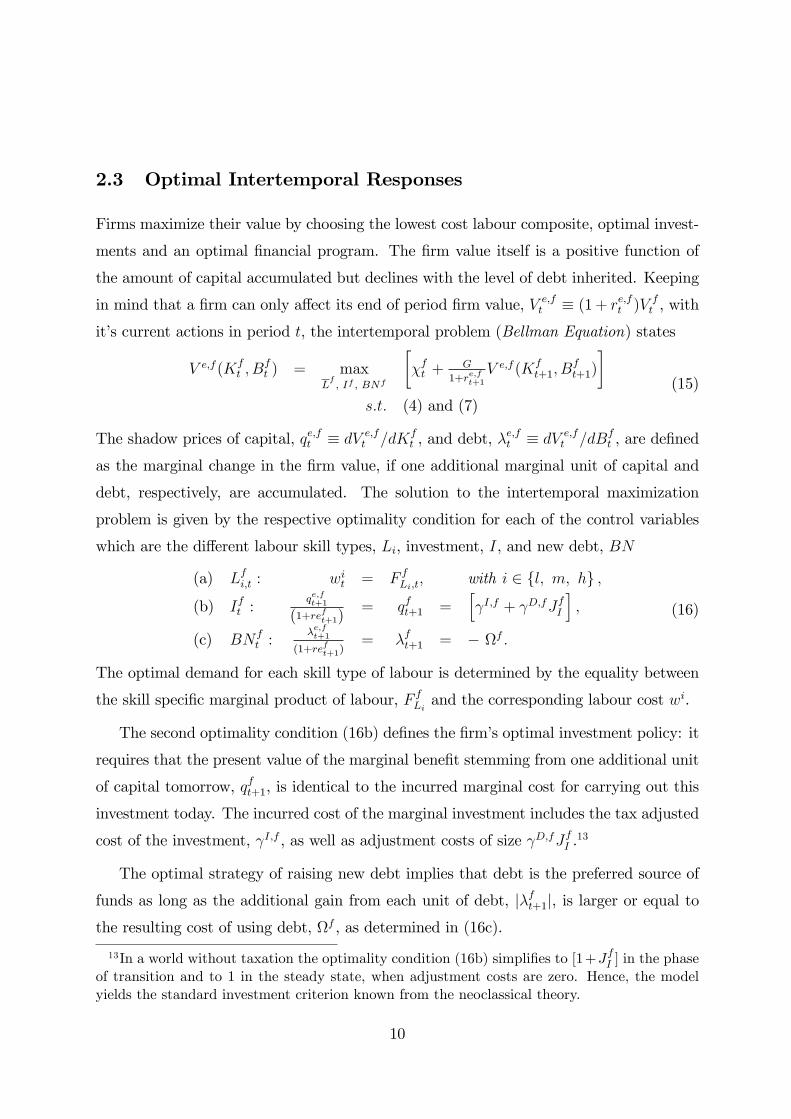
2.3 Optimal Intertemporal Responses
Firms maximize their value by choosing the lowest cost labour composite, optimal invest-
ments and an optimal �nancial program. The �rm value itself is a positive function of
the amount of capital accumulated but declines with the level of debt inherited. Keeping
in mind that a �rm can only a¤ect its end of period �rm value, V e;ft � (1 + re;ft )V ft , withit�s current actions in period t, the intertemporal problem (Bellman Equation) states
V e;f (Kft ; B
ft ) = max
Lf; If ; BNf
��ft +
G
1+re;ft+1V e;f (Kf
t+1; Bft+1)
�s:t: (4) and (7)
(15)
The shadow prices of capital, qe;ft � dV e;ft =dKft , and debt, �
e;ft � dV e;ft =dBft , are de�ned
as the marginal change in the �rm value, if one additional marginal unit of capital and
debt, respectively, are accumulated. The solution to the intertemporal maximization
problem is given by the respective optimality condition for each of the control variables
which are the di¤erent labour skill types, Li, investment, I, and new debt, BN
(a) Lfi;t : wit = F fLi;t; with i 2 fl; m; hg ;
(b) Ift :qe;ft+1
(1+reft+1)= qft+1 =
h I;f + D;fJfI
i;
(c) BN ft :
�e;ft+1
(1+reft+1)= �ft+1 = � f :
(16)
The optimal demand for each skill type of labour is determined by the equality between
the skill speci�c marginal product of labour, F fLi and the corresponding labour cost wi.
The second optimality condition (16b) de�nes the �rm�s optimal investment policy: it
requires that the present value of the marginal bene�t stemming from one additional unit
of capital tomorrow, qft+1, is identical to the incurred marginal cost for carrying out this
investment today. The incurred cost of the marginal investment includes the tax adjusted
cost of the investment, I;f , as well as adjustment costs of size D;fJfI .13
The optimal strategy of raising new debt implies that debt is the preferred source of
funds as long as the additional gain from each unit of debt, j�ft+1j, is larger or equal tothe resulting cost of using debt, f , as determined in (16c).
13In a world without taxation the optimality condition (16b) simpli�es to [1+JfI ] in the phaseof transition and to 1 in the steady state, when adjustment costs are zero. Hence, the modelyields the standard investment criterion known from the neoclassical theory.
10
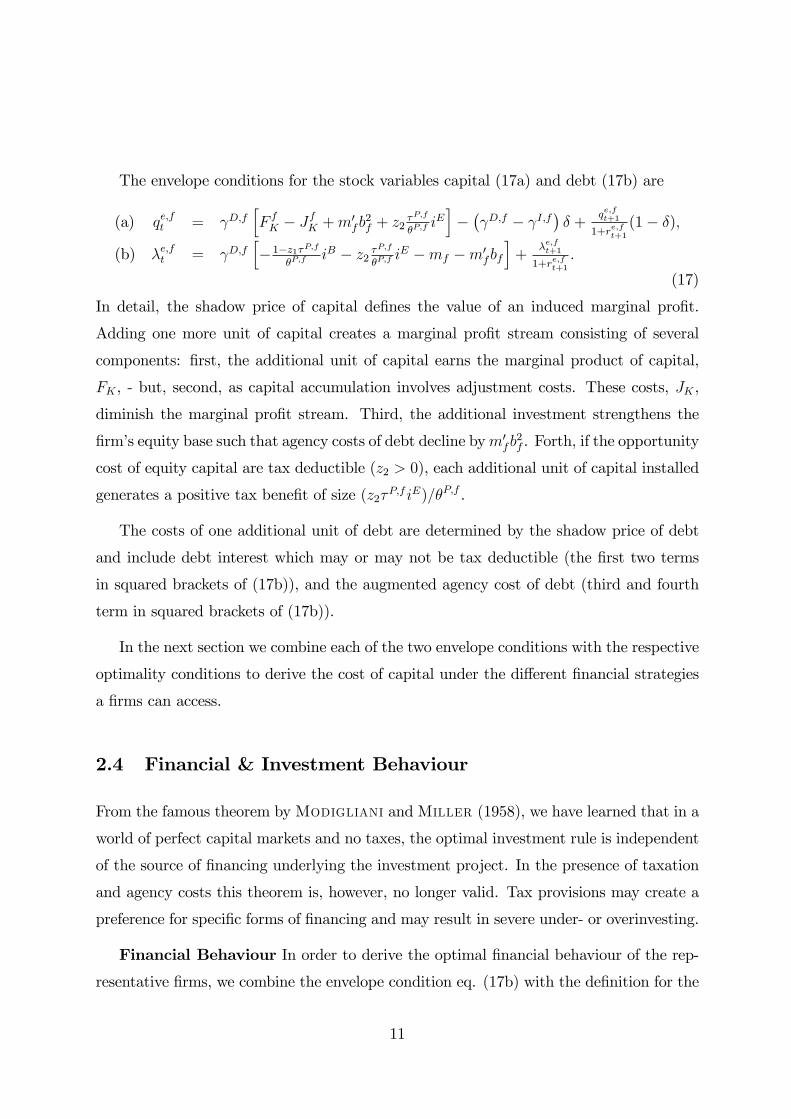
The envelope conditions for the stock variables capital (17a) and debt (17b) are
(a) qe;ft = D;fhF fK � J
fK +m
0fb2f + z2
�P;f
�P;fiEi�� D;f � I;f
�� +
qe;ft+1
1+re;ft+1(1� �);
(b) �e;ft = D;fh�1�z1�P;f
�P;fiB � z2 �
P;f
�P;fiE �mf �m0
fbf
i+
�e;ft+1
1+re;ft+1:
(17)
In detail, the shadow price of capital de�nes the value of an induced marginal pro�t.
Adding one more unit of capital creates a marginal pro�t stream consisting of several
components: �rst, the additional unit of capital earns the marginal product of capital,
FK , - but, second, as capital accumulation involves adjustment costs. These costs, JK ,
diminish the marginal pro�t stream. Third, the additional investment strengthens the
�rm�s equity base such that agency costs of debt decline bym0fb2f . Forth, if the opportunity
cost of equity capital are tax deductible (z2 > 0), each additional unit of capital installed
generates a positive tax bene�t of size (z2�P;f iE)=�P;f .
The costs of one additional unit of debt are determined by the shadow price of debt
and include debt interest which may or may not be tax deductible (the �rst two terms
in squared brackets of (17b)), and the augmented agency cost of debt (third and fourth
term in squared brackets of (17b)).
In the next section we combine each of the two envelope conditions with the respective
optimality conditions to derive the cost of capital under the di¤erent �nancial strategies
a �rms can access.
2.4 Financial & Investment Behaviour
From the famous theorem byModigliani andMiller (1958), we have learned that in a
world of perfect capital markets and no taxes, the optimal investment rule is independent
of the source of �nancing underlying the investment project. In the presence of taxation
and agency costs this theorem is, however, no longer valid. Tax provisions may create a
preference for speci�c forms of �nancing and may result in severe under- or overinvesting.
Financial Behaviour In order to derive the optimal �nancial behaviour of the rep-
resentative �rms, we combine the envelope condition eq. (17b) with the de�nition for the
11
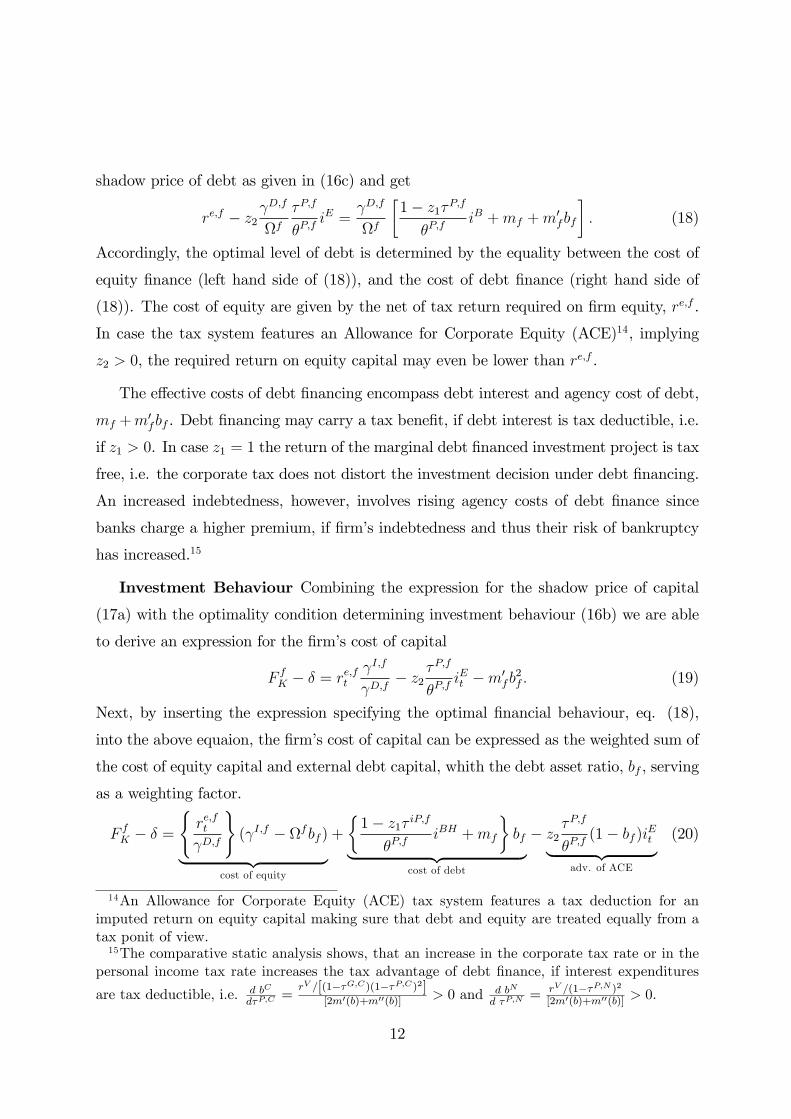
shadow price of debt as given in (16c) and get
re;f � z2 D;f
f�P;f
�P;fiE =
D;f
f
�1� z1�P;f
�P;fiB +mf +m
0fbf
�: (18)
Accordingly, the optimal level of debt is determined by the equality between the cost of
equity �nance (left hand side of (18)), and the cost of debt �nance (right hand side of
(18)). The cost of equity are given by the net of tax return required on �rm equity, re;f .
In case the tax system features an Allowance for Corporate Equity (ACE)14, implying
z2 > 0, the required return on equity capital may even be lower than re;f .
The e¤ective costs of debt �nancing encompass debt interest and agency cost of debt,
mf +m0fbf . Debt �nancing may carry a tax bene�t, if debt interest is tax deductible, i.e.
if z1 > 0. In case z1 = 1 the return of the marginal debt �nanced investment project is tax
free, i.e. the corporate tax does not distort the investment decision under debt �nancing.
An increased indebtedness, however, involves rising agency costs of debt �nance since
banks charge a higher premium, if �rm�s indebtedness and thus their risk of bankruptcy
has increased.15
Investment Behaviour Combining the expression for the shadow price of capital
(17a) with the optimality condition determining investment behaviour (16b) we are able
to derive an expression for the �rm�s cost of capital
F fK � � = re;ft
I;f
D;f� z2
�P;f
�P;fiEt �m0
fb2f : (19)
Next, by inserting the expression specifying the optimal �nancial behaviour, eq. (18),
into the above equaion, the �rm�s cost of capital can be expressed as the weighted sum of
the cost of equity capital and external debt capital, whith the debt asset ratio, bf , serving
as a weighting factor.
F fK � � =(re;ft D;f
)( I;f � fbf )| {z }
cost of equity
+
�1� z1� iP;f
�P;fiBH +mf
�bf| {z }
cost of debt
� z2�P;f
�P;f(1� bf )iEt| {z }
adv. of ACE
(20)
14An Allowance for Corporate Equity (ACE) tax system features a tax deduction for animputed return on equity capital making sure that debt and equity are treated equally from atax ponit of view.15The comparative static analysis shows, that an increase in the corporate tax rate or in the
personal income tax rate increases the tax advantage of debt �nance, if interest expenditures
are tax deductible, i.e. d bC
d�P;C=
rV =[(1��G;C)(1��P;C)2][2m0(b)+m00(b)] > 0 and d bN
d �P;N= rV =(1��P;N )2
[2m0(b)+m00(b)] > 0.
12
In the absence of taxation, an investment in �rm equity must o¤er a rate of return at
least equal to its opportunity cost, namely the rate of interest. With taxation, the cost
of capital turns out to be, however, much more complex as shown in (20). The �rst
term on the right hand side determines the cost of equity �nance. The second term,
the cost of debt �nance, consists of interest payments plus the agency cost. The last
term indicates the advantage of an ACE, in case z2 > 0. The propensity to undertake
additional investments depends on the tax allowance for investments z3 which is captured
in I;f . This term encompasses both depreciation for tax purposes and direct investment
premia.
The distinct and more concise formulae which clearly depict the di¤erence between
the cost of capital for corporate and non-corporate �rms, respectively are given by eq.(21)
and eq.(23).
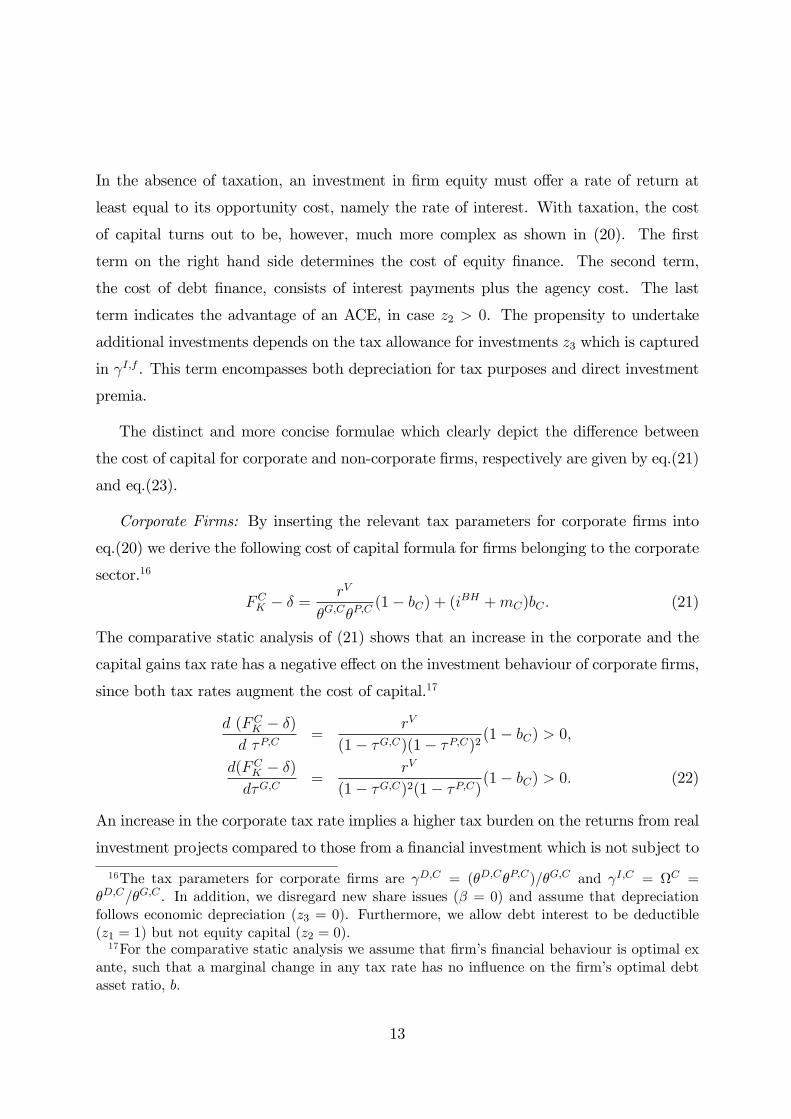
Corporate Firms: By inserting the relevant tax parameters for corporate �rms into
eq.(20) we derive the following cost of capital formula for �rms belonging to the corporate
sector.16
FCK � � =rV
�G;C�P;C(1� bC) + (iBH +mC)bC : (21)
The comparative static analysis of (21) shows that an increase in the corporate and the
capital gains tax rate has a negative e¤ect on the investment behaviour of corporate �rms,
since both tax rates augment the cost of capital.17
d (FCK � �)d �P;C
=rV
(1� �G;C)(1� �P;C)2 (1� bC) > 0;
d(FCK � �)d�G;C
=rV
(1� �G;C)2(1� �P;C)(1� bC) > 0: (22)
An increase in the corporate tax rate implies a higher tax burden on the returns from real
investment projects compared to those from a �nancial investment which is not subject to
16The tax parameters for corporate �rms are D;C = (�D;C�P;C)=�G;C and I;C = C =�D;C=�G;C . In addition, we disregard new share issues (� = 0) and assume that depreciationfollows economic depreciation (z3 = 0). Furthermore, we allow debt interest to be deductible(z1 = 1) but not equity capital (z2 = 0).17For the comparative static analysis we assume that �rm�s �nancial behaviour is optimal ex
ante, such that a marginal change in any tax rate has no in�uence on the �rm�s optimal debtasset ratio, b.
13
the corporate tax but to the personal tax on interest income. Therefore, investors have an
incentive to put their money in �nancial instead of real investment projects. This negative
e¤ect resulting form an increase in the corporate tax is larger for those �rms endowed
with much equity capital but smaller for highly indebted �rms (since debt interest is tax
deductible).
In case the capital gains tax is increased, pro�t retentions are less favored compared
to debt �nanced investments. Thus, the cost of capital increases to the extent pro�t
retentions are used as a marginal source of �nance.18
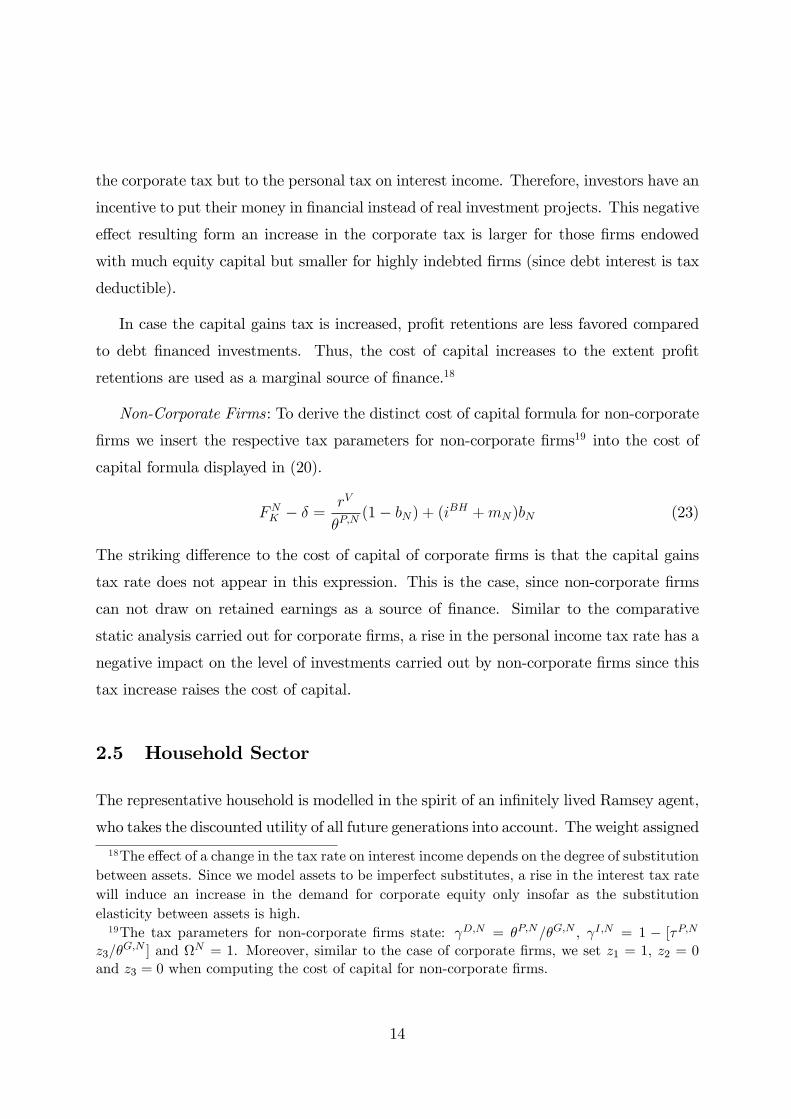
Non-Corporate Firms: To derive the distinct cost of capital formula for non-corporate
�rms we insert the respective tax parameters for non-corporate �rms19 into the cost of
capital formula displayed in (20).
FNK � � =rV
�P;N(1� bN) + (iBH +mN)bN (23)
The striking di¤erence to the cost of capital of corporate �rms is that the capital gains
tax rate does not appear in this expression. This is the case, since non-corporate �rms
can not draw on retained earnings as a source of �nance. Similar to the comparative
static analysis carried out for corporate �rms, a rise in the personal income tax rate has a
negative impact on the level of investments carried out by non-corporate �rms since this
tax increase raises the cost of capital.
2.5 Household Sector
The representative household is modelled in the spirit of an in�nitely lived Ramsey agent,
who takes the discounted utility of all future generations into account. The weight assigned
18The e¤ect of a change in the tax rate on interest income depends on the degree of substitutionbetween assets. Since we model assets to be imperfect substitutes, a rise in the interest tax ratewill induce an increase in the demand for corporate equity only insofar as the substitutionelasticity between assets is high.19The tax parameters for non-corporate �rms state: D;N = �P;N=�G;N , I;N = 1 � [�P;N
z3=�G;N ] and N = 1. Moreover, similar to the case of corporate �rms, we set z1 = 1, z2 = 0
and z3 = 0 when computing the cost of capital for non-corporate �rms.
14
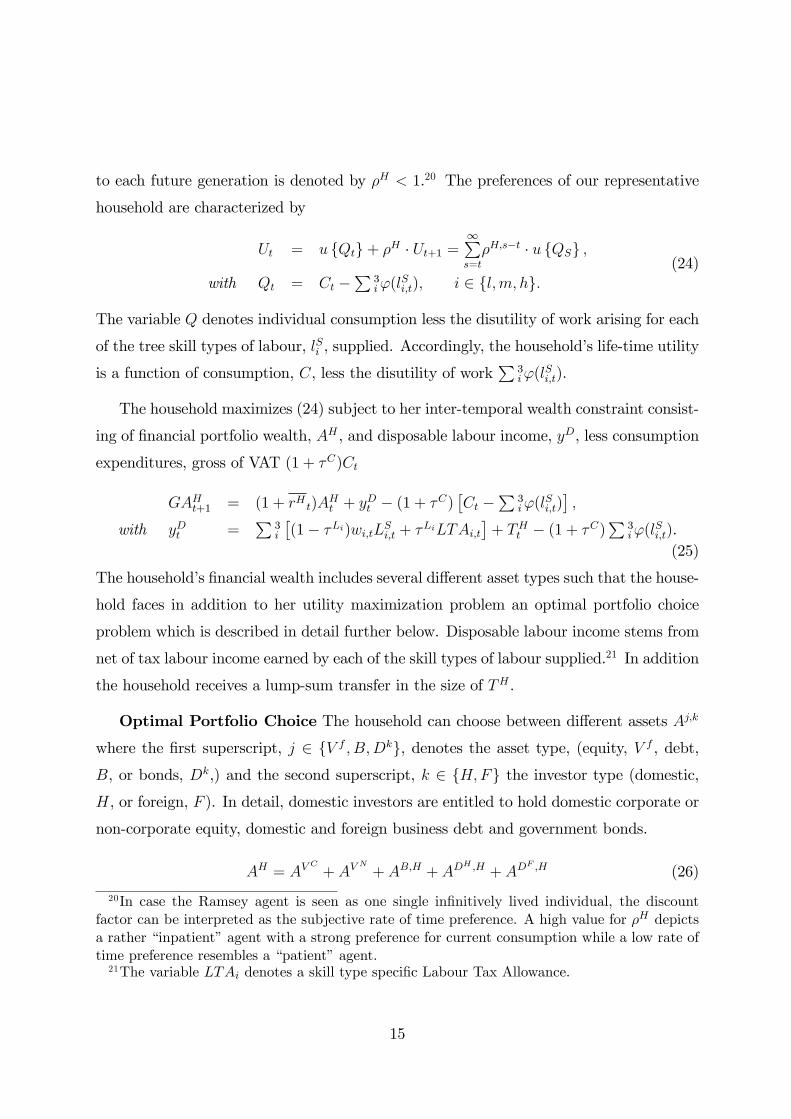
to each future generation is denoted by �H < 1.20 The preferences of our representative
household are characterized by
Ut = u fQtg+ �H � Ut+1 =1Ps=t
�H;s�t � u fQSg ;
with Qt = Ct �P
3i'(l
Si;t); i 2 fl;m; hg:
(24)
The variable Q denotes individual consumption less the disutility of work arising for each
of the tree skill types of labour, lSi , supplied. Accordingly, the household�s life-time utility
is a function of consumption, C, less the disutility of workP
3i'(l
Si;t).
The household maximizes (24) subject to her inter-temporal wealth constraint consist-
ing of �nancial portfolio wealth, AH , and disposable labour income, yD, less consumption
expenditures, gross of VAT (1 + �C)Ct
GAHt+1 = (1 + rHt)AHt + y
Dt � (1 + �C)
�Ct �
P3i'(l
Si;t)�;
with yDt =P
3i
�(1� �Li)wi;tLSi;t + �LiLTAi;t
�+ THt � (1 + �C)
P3i'(l
Si;t).(25)
The household�s �nancial wealth includes several di¤erent asset types such that the house-
hold faces in addition to her utility maximization problem an optimal portfolio choice
problem which is described in detail further below. Disposable labour income stems from
net of tax labour income earned by each of the skill types of labour supplied.21 In addition
the household receives a lump-sum transfer in the size of TH .
Optimal Portfolio Choice The household can choose between di¤erent assets Aj;k
where the �rst superscript, j 2 fV f ; B;Dkg, denotes the asset type, (equity, V f , debt,B, or bonds, Dk,) and the second superscript, k 2 fH;Fg the investor type (domestic,H, or foreign, F ). In detail, domestic investors are entitled to hold domestic corporate or
non-corporate equity, domestic and foreign business debt and government bonds.
AH = AVC
+ AVN
+ AB;H + ADH ;H + AD
F ;H (26)
20In case the Ramsey agent is seen as one single in�nitively lived individual, the discountfactor can be interpreted as the subjective rate of time preference. A high value for �H depictsa rather �inpatient�agent with a strong preference for current consumption while a low rate oftime preference resembles a �patient�agent.21The variable LTAi denotes a skill type speci�c Labour Tax Allowance.
15
Foreign investors, however, just have access to domestic and foreign business debt and
government bonds, since domestic �rm equity is non-tradeable per assumption.22
Following the residence principle of taxation, all kinds of returns are taxed in the
investor�s country of residence. Thus, gross domestic and foreign interest rates are equal-
ized, iH = iF , while net of tax rates of return di¤er between the domestic and the foreign
economy. Since we additionally assume that the di¤erent types of assets are imperfect
substitutes, the net rates of return on domestically owned assets do not equalize due to
imperfect �nancial arbitrage. Given the relative rates of return of the di¤erent asset types,
each household adjusts her portfolio holdings so as to maximize the average, net of tax
portfolio return, �rH .
�rH =rV (AV
C+ AV
N) + rBHAB;H + rHAD
H ;H + rFADF ;H
AH(27)
In detail, domestic corporate and non-corporate �rm equity, AVCand AV
N, - which are
perfect substitutes - yield a rate of return of rV . Domestic �rm debt yields a gross rate
of return of iBH which transforms into a net of tax rate of return of rBH = (1 � � i)iBH
with � i denoting the domestic tax on interest income. Domestic and foreign gross interest
rates on government bonds are given by iH and iF , and the respective net of tax rates
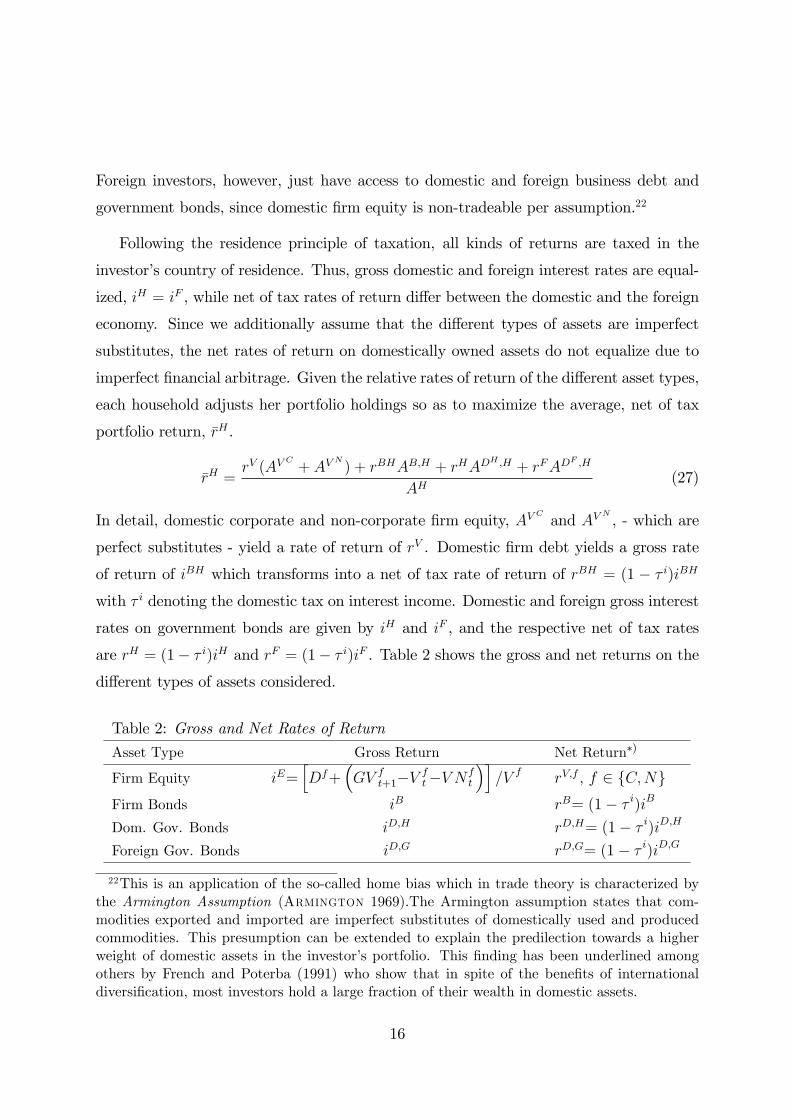
are rH = (1� � i)iH and rF = (1� � i)iF . Table 2 shows the gross and net returns on thedi¤erent types of assets considered.
Table 2: Gross and Net Rates of Return
Asset Type Gross Return Net Return�)
Firm Equity iE=hDf+
�GV ft+1�V
ft�V N f
t
�i=V f rV;f , f 2 fC;Ng
Firm Bonds iB rB= (1� � i)iB
Dom. Gov. Bonds iD;H rD;H= (1� � i)iD;H
Foreign Gov. Bonds iD;G rD;G= (1� � i)iD;G
22This is an application of the so-called home bias which in trade theory is characterized bythe Armington Assumption (Armington 1969).The Armington assumption states that com-modities exported and imported are imperfect substitutes of domestically used and producedcommodities. This presumption can be extended to explain the predilection towards a higherweight of domestic assets in the investor�s portfolio. This �nding has been underlined amongothers by French and Poterba (1991) who show that in spite of the bene�ts of internationaldiversi�cation, most investors hold a large fraction of their wealth in domestic assets.
16
In the long run, the net of tax average portfolio return has to equal the time preference
for the home country, �H , as required by the long-run stationary solution to the household
maximization problem in the Ramsey model. A more detailed analysis of the portfolio
choice problem and the capital market equilibrium can be found in Appendix A.
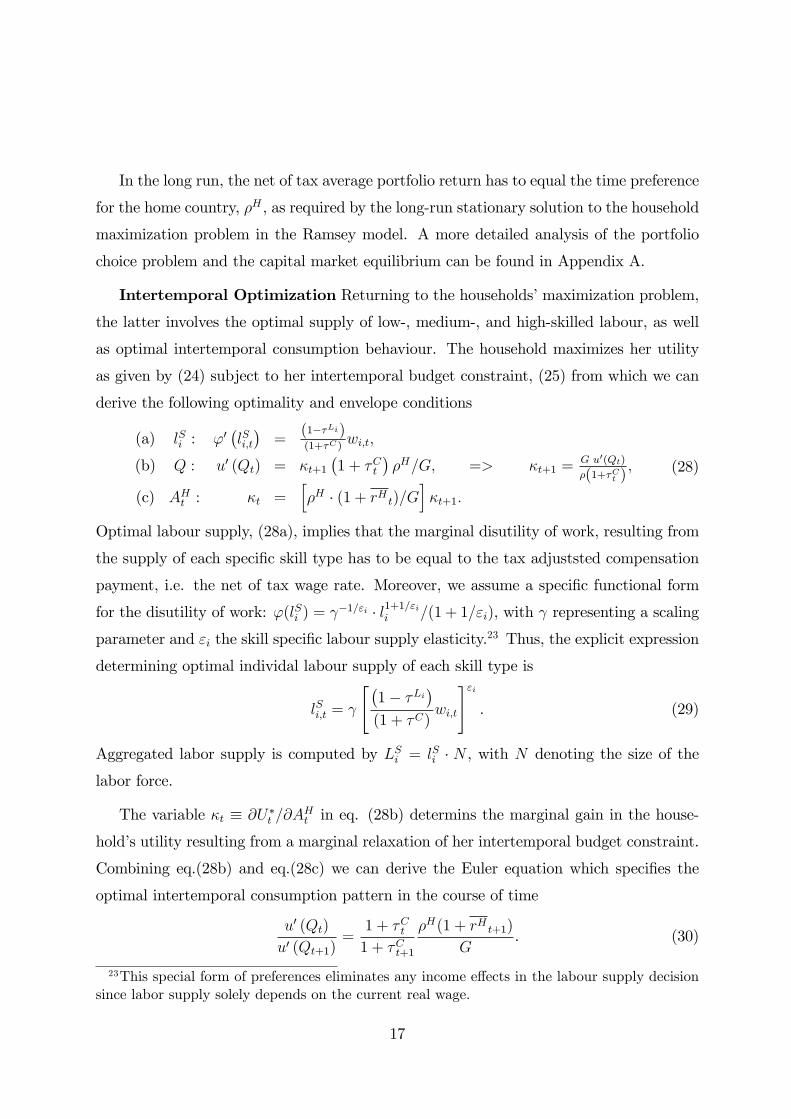
Intertemporal Optimization Returning to the households�maximization problem,
the latter involves the optimal supply of low-, medium-, and high-skilled labour, as well
as optimal intertemporal consumption behaviour. The household maximizes her utility
as given by (24) subject to her intertemporal budget constraint, (25) from which we can
derive the following optimality and envelope conditions
(a) lSi : '0�lSi;t�=
(1��Li)(1+�C)
wi;t;
(b) Q : u0 (Qt) = �t+1�1 + �Ct
��H=G; => �t+1 =
G u0(Qt)
�(1+�Ct );
(c) AHt : �t =h�H � (1 + rHt)=G
i�t+1:
(28)
Optimal labour supply, (28a), implies that the marginal disutility of work, resulting from
the supply of each speci�c skill type has to be equal to the tax adjuststed compensation
payment, i.e. the net of tax wage rate. Moreover, we assume a speci�c functional form
for the disutility of work: '(lSi ) = �1="i � l1+1="ii =(1 + 1="i), with representing a scaling
parameter and "i the skill speci�c labour supply elasticity.23 Thus, the explicit expression
determining optimal individal labour supply of each skill type is
lSi;t =
"�1� �Li
�(1 + �C)
wi;t
#"i. (29)
Aggregated labor supply is computed by LSi = lSi � N , with N denoting the size of the
labor force.
The variable �t � @U�t =@AHt in eq. (28b) determins the marginal gain in the house-hold�s utility resulting from a marginal relaxation of her intertemporal budget constraint.
Combining eq.(28b) and eq.(28c) we can derive the Euler equation which speci�es the
optimal intertemporal consumption pattern in the course of time
u0 (Qt)
u0 (Qt+1)=1 + �Ct1 + �Ct+1
�H(1 + rHt+1)
G. (30)
23This special form of preferences eliminates any income e¤ects in the labour supply decisionsince labor supply solely depends on the current real wage.
17
In order to derive an explicit expression for consumption expenditures (net of the disutility
of work) we apply a CES utility function stating u(Qt) = Q1�1=�t =(1 � 1=�), with � de-
noting the intertemporal elasticity of substitution and constrain the optimal consumption
pro�le (30) by the intertemporal budget constraint (25) such that
�1 + �Ct
�Qt = mpct � TWt (31)
with mpct and TWt denoting the marginal propensity to consume and total wealth, re-
spectively.24
Welfare Analysis As a measure for welfare, we apply the equivalent variation which
speci�es the di¤erences in expenditures with respect to the before and after tax reform
life-time utility levels U0 and U1, using the pre reform price structure p0
EV = TW (U0; p0)� TW (U1; p0) . (32)
2.6 General Macroeconomic Equilibrium
Public Accounts: The government�s total tax revenue, TTR, consists of tax receipts
collected from the tax levied on corporate and personal income of corporate and non-
corporate �rms, T P;f , labour income taxation, TLi, of the three di¤erent skill types of
labour,25 interest income taxation, T i, the taxation of dividend income, TD, and capital
gains, TG, as well as the VAT revenue, TC .
TTR =P
2fT
P;f +P
3iT
Li + T i ++TD + TG + TC : (33)
Government expenditures include interest spending on public debt (1 + iH)DG, govern-
ment consumption, CG, and lump-sum transfers to households, TH . Government debt
accumulates whenever expenditures exceed tax revenues collected.
GDGt+1 = (1 + i
H)DGt + C
Gt + T
Ht � TTRt . (34)
24See further details on the marginal propensity to consume and the composition of totalwealth in Appendix B.25As mentioned above, the labour tax is levied on labour income less a labour tax allowance,
LTA. Total tax revenue collected from labour income thus equalsP
3i �Li(witL
Si;t � LTAi).
18
To rule out Ponzi-games we restrict expenditure increases to �nance a budget de�cit and
restrict new debt to a maximum of three percent of GDP and government debt to GDP
ratio to 60 percent.26 Hence, �nancial imbalances following a tax relief have to be o¤set
by a future compensating action, i.e. a reduction in lump-sum transfers to households or
an increase in any other tax rate.
Current Account In ifoMod we allow for two-way capital �ows since domestic in-
dividuals can hold foreign government bonds ADF ;H and foreign individuals can own
domestic �rm AB;F and government bonds ADH ;F .27 Thus, the gross national product,
GNP , is given by GDP plus net interest income from abroad.
GNP = GDP + iFADF ;H � iH(AB;F + ADH ;F )| {z }NCEt= net capital export
, (35)
Since we apply the residence principle of taxation, foreigners will earn the domestic gross
return iH on their domestic assets and domestic investors the foreign gross return iF on
their owned foreign government bonds. The cross ownership of assets is mirrored by the
net foreign asset position which is de�ned for the home country as NFA = ADF;H �(AB;F + ADH;F ) which evolves over time according to
GNFAt+1 �NFAt = NCEt + TBt , (36)
where TB denotes the trade balance. The r.h.s. of eq.(36) determines the current account
surplus de�ned as the excess of GNP over domestic absorption. The current account thus
determines the accumulation of foreign wealth. By de�nition the trade de�cit of one
country has to equal the trade surplus of the other in a two country setting.
TB = GDP �P
2f=C; N I
f � C � CG: (37)
2.7 Calibration & Macroeconomic Data
The computational procedure of any numeric CGE model requires the speci�cation of
functional forms and the choice of appropriate behavioural parameters and elasticities26These numbers depict the convergence criteria as laid down in the European Stability and
Growth Pact (Articles 99[1] and 104[2] of the European Community Treaty).27We assume here that foreign �rms do not issue any bonds.
19
from the empirical literature. In this context, the calibration implies that the initial
steady-state of the model replicates the stationary long-run macroeconomic equilibrium
of the considered economy. All behavioural parameters employed in ifoMod are standard
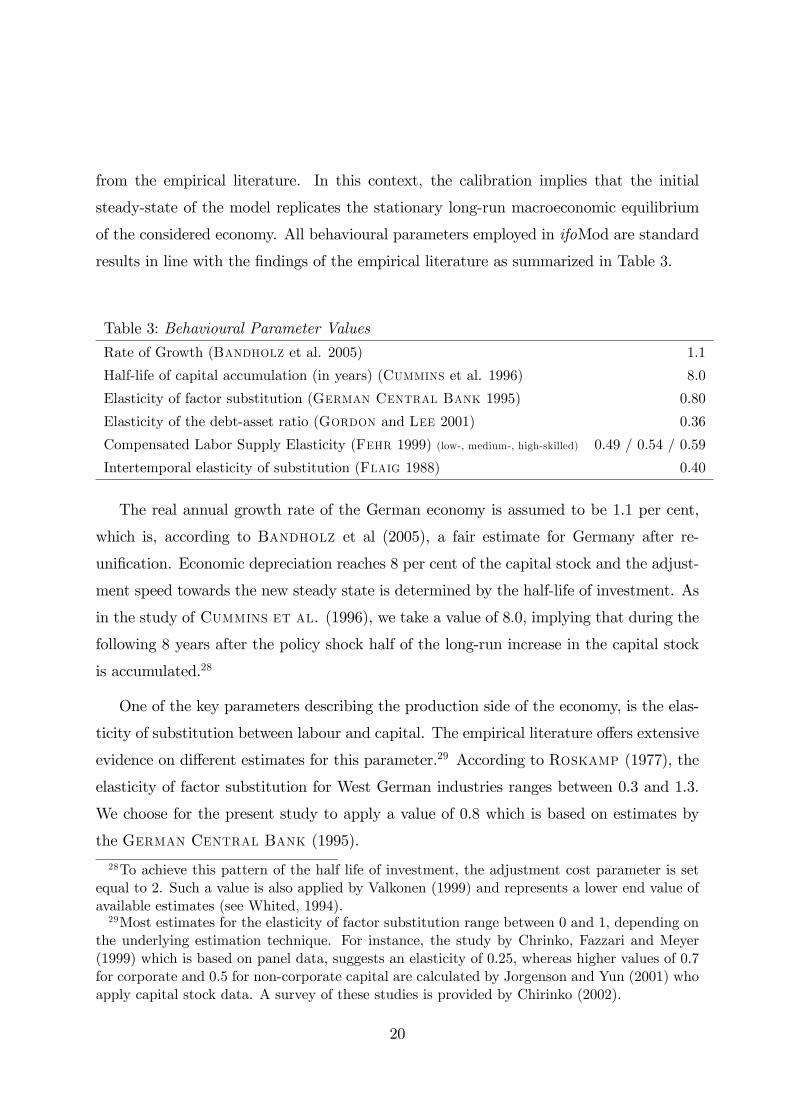
results in line with the �ndings of the empirical literature as summarized in Table 3.
Table 3: Behavioural Parameter Values
Rate of Growth (Bandholz et al. 2005) 1.1
Half-life of capital accumulation (in years) (Cummins et al. 1996) 8.0
Elasticity of factor substitution (German Central Bank 1995) 0.80
Elasticity of the debt-asset ratio (Gordon and Lee 2001) 0.36
Compensated Labor Supply Elasticity (Fehr 1999) (low-, medium-, high-skilled) 0.49 / 0.54 / 0.59
Intertemporal elasticity of substitution (Flaig 1988) 0.40
The real annual growth rate of the German economy is assumed to be 1.1 per cent,
which is, according to Bandholz et al (2005), a fair estimate for Germany after re-
uni�cation. Economic depreciation reaches 8 per cent of the capital stock and the adjust-
ment speed towards the new steady state is determined by the half-life of investment. As
in the study of Cummins et al. (1996), we take a value of 8.0, implying that during the
following 8 years after the policy shock half of the long-run increase in the capital stock
is accumulated.28
One of the key parameters describing the production side of the economy, is the elas-
ticity of substitution between labour and capital. The empirical literature o¤ers extensive
evidence on di¤erent estimates for this parameter.29 According to Roskamp (1977), the
elasticity of factor substitution for West German industries ranges between 0.3 and 1.3.
We choose for the present study to apply a value of 0.8 which is based on estimates by
the German Central Bank (1995).
28To achieve this pattern of the half life of investment, the adjustment cost parameter is setequal to 2. Such a value is also applied by Valkonen (1999) and represents a lower end value ofavailable estimates (see Whited, 1994).29Most estimates for the elasticity of factor substitution range between 0 and 1, depending on
the underlying estimation technique. For instance, the study by Chrinko, Fazzari and Meyer(1999) which is based on panel data, suggests an elasticity of 0.25, whereas higher values of 0.7for corporate and 0.5 for non-corporate capital are calculated by Jorgenson and Yun (2001) whoapply capital stock data. A survey of these studies is provided by Chirinko (2002).
20
For the value of the elasticity of the debt-asset ratio, we follow Gordon and Lee
(2001), who estimate that a 10 percentage point decrease in the corporate tax rate leads
to a reduction in the debt-asset ratio by about three to four per cent.
Even though the empirical literature on labour supply elasticities is manifold, the
empirical evidence on the labour supply elasticities of di¤erent labour skill types is rather
scarce. Therefore, we follow Fehr (1999), who computes compensated labour supply
elasticities for the lowest, the third and the top quintile of earnings in Germany. Fehr�s
proposed data on the long-run labour supply elasticities for low-, medium-, and high-
skilled labour are "L = 0:49, "M = 0:55 and "H = 0:59. Surprisingly, these �gures
are only slightly above the value of 0.51 which is proposed by Feldstein (2005) as an
applicable estimate for the average compensated labour supply elasticity in macro models.
Given the fact that the macroeconomic e¤ects of capital income taxation are very
sensitive to the choice of the intertemporal elasticity of substitution in consumption (see
King and Rebelo (1990) or Summers (1981)), this parameter has to be set with great
care. Our value of 0.4 is based on Flaig�s (1988) empirical research for Germany, and
is just slightly lower than the values applied for instance by Keuschnigg and Dietz
(2004, 2007) or Valkonen (1999). Contrary to that, Auerbach andKotlikoff (1987)
applied a value of just 0.25.
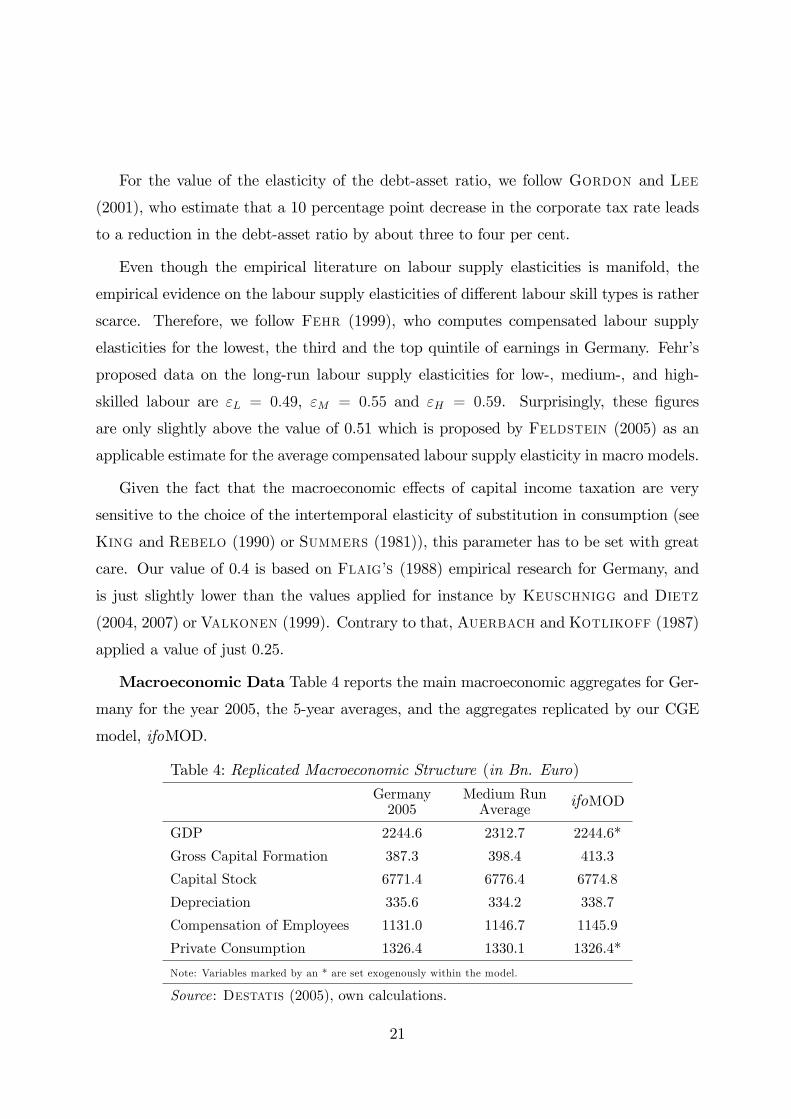
Macroeconomic Data Table 4 reports the main macroeconomic aggregates for Ger-
many for the year 2005, the 5-year averages, and the aggregates replicated by our CGE
model, ifoMOD.
Table 4: Replicated Macroeconomic Structure (in Bn. Euro)
Germany2005
Medium RunAverage
ifoMOD
GDP 2244.6 2312.7 2244.6*
Gross Capital Formation 387.3 398.4 413.3
Capital Stock 6771.4 6776.4 6774.8
Depreciation 335.6 334.2 338.7
Compensation of Employees 1131.0 1146.7 1145.9
Private Consumption 1326.4 1330.1 1326.4*
Note: Variables marked by an * are set exogenously within the model.
Source: Destatis (2005), own calculations.
21
The size of the labour force, N; of 42.3 million people is computed as the product
of the employment share 0.51 and the total German population of 82.5 million people.30
This number also matches the o¢ cial German labour force data (Destatis 2005). To
identify the relative sizes of the corporate and non-corporate sector within the economy,
we use data from the IAB31 and compute a labour share of 65 per cent for the corporate
sector. The remaining fraction of 35 per cent of the labour force is thus employed in the
non-corporate sector.
3 German Corporate Tax Reform of 2008
In the following, we apply ifoMod to exemplify how it can be used to analyse the e¤ects
of a comprehensive tax reform. To this purpose, we consider a very recent rax reform,
namely the latest German corporate tax reform which has been in place since the 1st
of January 2008. In its basic features, this tax reform is aimed at both ensuring the
international competitiveness of the German economy �by reducing the corporate tax
burden �and at securing the German tax base by expanding the basis of assessment and
limiting tax avoidance strategies. Thus the 2008 tax reform is not new in terms of being
a tax-cut-cum base-broadening measure, but it rather mimics the US 1986 Tax Reform
Act (Joint Committee on Taxation 1986).32
The German Corporate Tax Reform of 200833 The core element of the 2008 tax
reform is a cutback of the corporate tax rate by 10 percentage points and a reduction of
the uniform trade tax measure from 5 to 3.5 percent such that the corporate �rms�tax
burden on retained earnings is reduced from initially 38.6 to 29.8 percent. Non-corporate
�rms, however, su¤er from a slight tax increase. With the introduction of the so-called tax
30We assume there is full employment in the economy.31The Institut für Arbeitsmarkt und Berufsbildung (IAB) is a German research institute deal-
ing with issues such as the German labour market and occupational training.32Similar kinds of tax-cut-cum base-broadening reforms have also been introduced in numerous
European states during the last few years. For example, Denmark adapted its tax system in2001 and Italy in 1998 (Carone and SalomÄki 2001).33A detailed survey on the German Corporate Tax Reform of 2008 is provided by the German
Ministry of Finance (2007a, b).
22
on the rich, the top personal income tax rate is increased by three percentage points from
initially 42 to 45 percent. To provide for a tax relief for non-corporate �rms, a reduced
tax rate of just below 30 percent is levied on retained earnings of non-corporate �rms.34
The second major aim of the reform �beside improving Germany�s standing as an in-
vestment location �is to counteract the tax shifting activities by multinational enterprises
via intra-company loans. Therefore, the base-broadening measures of the 2008 tax reform
encompass the introduction of an interest stripping rule and the abolition of accelerated
depreciation for �xed assets. In detail, the interest stripping rule limits the deduction of
net-interest expenses for tax purposes to 30 percent of the EBIT. In order not to obstruct
debt �nancing of small and medium sized �rms, this rule applies only to those companies
with more than Euro one million of net-interest expenses. 35 ;36
Finally, from 2009 onwards, any income from capital such as interest, dividends and
capital gains is subject to a �nal withholding tax of 25 percent (plus solidarity surcharge
and church tax).
Table 5 provides an overview of pre- and post reform statutory tax rates we apply
in our simulation analysis. The column Status Quo depicts the preexisting German tax
system while the column Reform 2008 depicts the actual statutory tax rates prevailing
after the enaction of the German corporate tax reform of 2008. The third column, labeled
Reform Alternative, presents a slight variation of the 2008 tax reform by excluding capital
gains from the �nal withholding tax.
34Any withdrawals from these retentions are, however, subject to additional taxation andhence the e¤ective tax burden on distributions of non-corporate �rms amounts to about 48percent, i.e. to the top personal income tax rate plus the solidarity surcharge. These special taxprovisions for non-corproate �rms aim at equalizing the e¤ective tax burden of �rms of di¤erentlegal form.35As a counterdraw to these provisions, the former thin-capitalization rules which restricted
tax deductibility of interest on related-party loans are to be repealed.36Regarding the local trade tax, before the reform, half of the interest paid on permanent
debt was added to the computation of taxable trade earnings. From now on, 25 percent of allinterest paid (including short-term debts but no cash discounts and bonuses) and 25 percentof the notional �interest shares� for rent, leasing, licenses and leasing rates are added to thecomputation of taxable income.
23
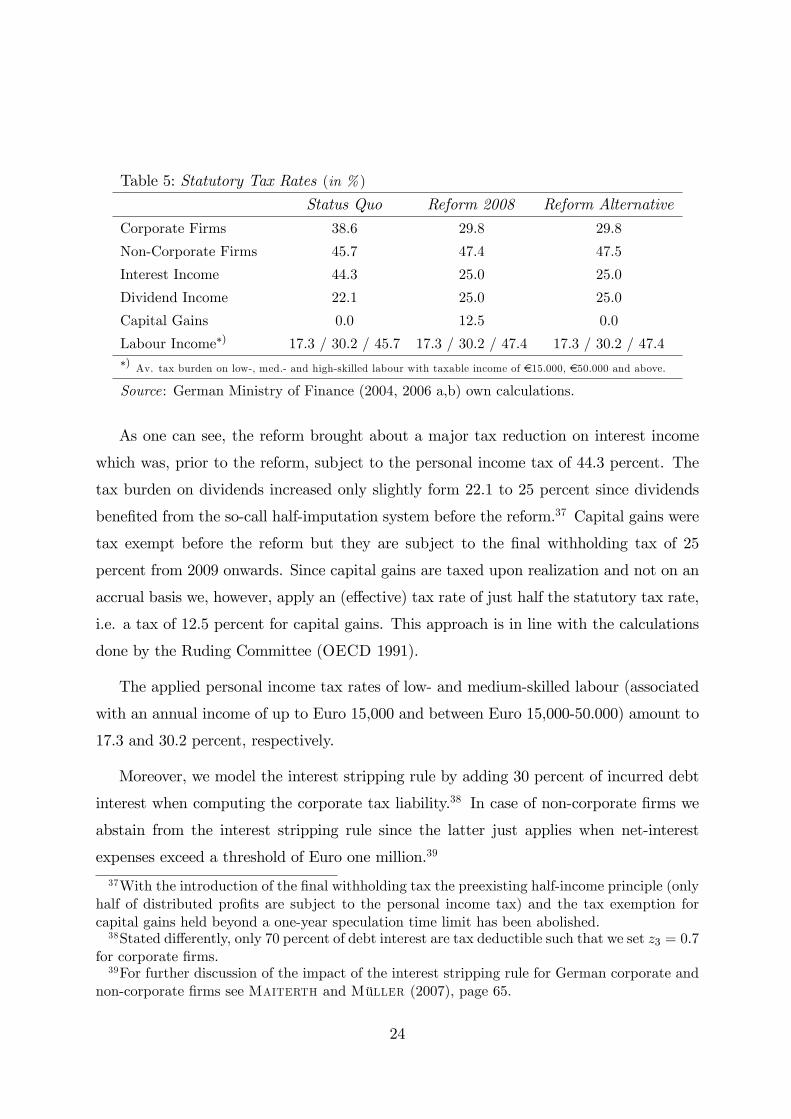
Table 5: Statutory Tax Rates (in % )
Status Quo Reform 2008 Reform Alternative
Corporate Firms 38.6 29.8 29.8
Non-Corporate Firms 45.7 47.4 47.5
Interest Income 44.3 25.0 25.0
Dividend Income 22.1 25.0 25.0
Capital Gains 0.0 12.5 0.0
Labour Income�) 17.3 / 30.2 / 45.7 17.3 / 30.2 / 47.4 17.3 / 30.2 / 47.4�) Av. tax burden on low-, med.- and high-skilled labour with taxable income of e15.000, e50.000 and above.
Source: German Ministry of Finance (2004, 2006 a,b) own calculations.
As one can see, the reform brought about a major tax reduction on interest income
which was, prior to the reform, subject to the personal income tax of 44.3 percent. The
tax burden on dividends increased only slightly form 22.1 to 25 percent since dividends
bene�ted from the so-call half-imputation system before the reform.37 Capital gains were
tax exempt before the reform but they are subject to the �nal withholding tax of 25
percent from 2009 onwards. Since capital gains are taxed upon realization and not on an
accrual basis we, however, apply an (e¤ective) tax rate of just half the statutory tax rate,
i.e. a tax of 12.5 percent for capital gains. This approach is in line with the calculations
done by the Ruding Committee (OECD 1991).
The applied personal income tax rates of low- and medium-skilled labour (associated
with an annual income of up to Euro 15,000 and between Euro 15,000-50.000) amount to
17.3 and 30.2 percent, respectively.
Moreover, we model the interest stripping rule by adding 30 percent of incurred debt
interest when computing the corporate tax liability.38 In case of non-corporate �rms we
abstain from the interest stripping rule since the latter just applies when net-interest
expenses exceed a threshold of Euro one million.39
37With the introduction of the �nal withholding tax the preexisting half-income principle (onlyhalf of distributed pro�ts are subject to the personal income tax) and the tax exemption forcapital gains held beyond a one-year speculation time limit has been abolished.38Stated di¤erently, only 70 percent of debt interest are tax deductible such that we set z3 = 0:7
for corporate �rms.39For further discussion of the impact of the interest stripping rule for German corporate and
non-corporate �rms see Maiterth and Müller (2007), page 65.
24
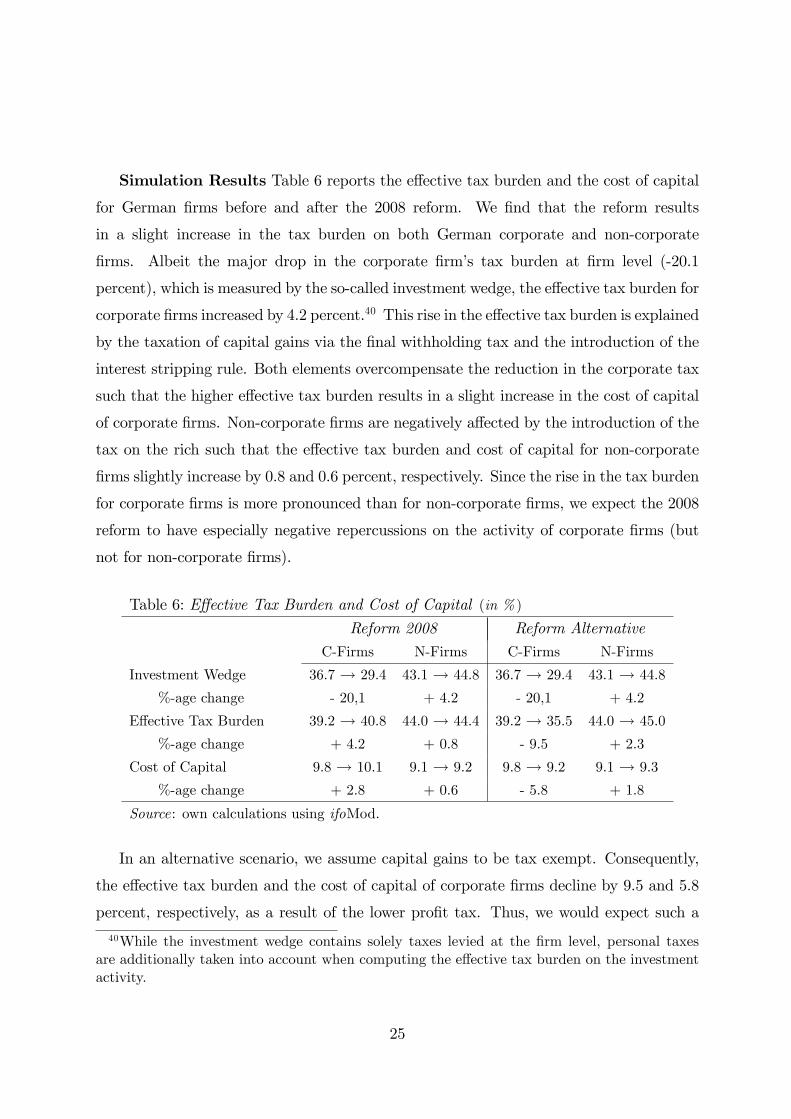
Simulation Results Table 6 reports the e¤ective tax burden and the cost of capital
for German �rms before and after the 2008 reform. We �nd that the reform results
in a slight increase in the tax burden on both German corporate and non-corporate
�rms. Albeit the major drop in the corporate �rm�s tax burden at �rm level (-20.1
percent), which is measured by the so-called investment wedge, the e¤ective tax burden for
corporate �rms increased by 4.2 percent.40 This rise in the e¤ective tax burden is explained
by the taxation of capital gains via the �nal withholding tax and the introduction of the
interest stripping rule. Both elements overcompensate the reduction in the corporate tax
such that the higher e¤ective tax burden results in a slight increase in the cost of capital
of corporate �rms. Non-corporate �rms are negatively a¤ected by the introduction of the
tax on the rich such that the e¤ective tax burden and cost of capital for non-corporate
�rms slightly increase by 0.8 and 0.6 percent, respectively. Since the rise in the tax burden
for corporate �rms is more pronounced than for non-corporate �rms, we expect the 2008
reform to have especially negative repercussions on the activity of corporate �rms (but
not for non-corporate �rms).
Table 6: E¤ective Tax Burden and Cost of Capital (in % )
Reform 2008 Reform Alternative
C-Firms N-Firms C-Firms N-Firms
Investment Wedge 36.7 ! 29.4 43.1 ! 44.8 36.7 ! 29.4 43.1 ! 44.8
%-age change - 20,1 + 4.2 - 20,1 + 4.2
E¤ective Tax Burden 39.2 ! 40.8 44.0 ! 44.4 39.2 ! 35.5 44.0 ! 45.0
%-age change + 4.2 + 0.8 - 9.5 + 2.3
Cost of Capital 9.8 ! 10.1 9.1 ! 9.2 9.8 ! 9.2 9.1 ! 9.3
%-age change + 2.8 + 0.6 - 5.8 + 1.8
Source: own calculations using ifoMod.
In an alternative scenario, we assume capital gains to be tax exempt. Consequently,
the e¤ective tax burden and the cost of capital of corporate �rms decline by 9.5 and 5.8
percent, respectively, as a result of the lower pro�t tax. Thus, we would expect such a
40While the investment wedge contains solely taxes levied at the �rm level, personal taxesare additionally taken into account when computing the e¤ective tax burden on the investmentactivity.
25
reform alternative to have a stimulating impact on the corporate �rms�activity and, given
the general equilibrium framework, negative e¤ects for non-corporate �rms.
The short- and long-run economic impact of the reform is presented in Table 7. Here,
an additional advantage of a dynamic CGE model becomes clear. By means of such a
model, we can distinguish between short- and long-run e¤ects, which, as can be seen in
the following, can di¤er to a great extent, and which can not be shown by means of a
static model.
As expected, the 2008 reform harms corporate �rms�activity, i.e. corporate invest-
ments and labour demand decline by more than 10 percent each in the long-run and hence
corporate �rms�output drops by 8.8 percent. Since non-corporate �rms tax treatment is
almost una¤ected by the reform, general equilibrium e¤ects push production factors into
the non-corporate sector. Investments and labour demand of non-corporate �rms increase
by more than 11 and almost 12 percent, respectively, and non-corporate output grows by
almost 11 percent in the long-run.
The increased activity in the non-corporate sector, however, cannot absorb the decline
in economic activity in the corporate sector. The overall investment activity declines by
3.2 percent, labour demand falls short by 1 percent and total output shrinks by almost
two percent. Moreover, the shrinking of the corporate sector leads to a lower demand of
workers, in particular high-skilled labour, which is not �contrary to low- and medium-
skilled labour �fully absorbed by the non-corporate sector.
The welfare loss accompanying the 2008 tax reform amounts to around one percent of
GDPwhich corresponds to about two percent of the household�s wealth. Stated di¤erently,
German households loose 1.9 percent of their wealth due to the implementation of the
German corporate tax reform of 2008. The loss in welfare is explained by the enormous
�nancial costs associated with the reform. In the short-run, more than Euro 35.6 billion
are necessary to �nance the reform. In order to balance the government budget, the
�nancial need translates into a cut in transfers to households and therewith household�s
consumption declines by �ve percent in the short-run. In the long-run when economic
activity has recovered, the �nancial costs of the reform amount to only Euro 1.4 billion.
26
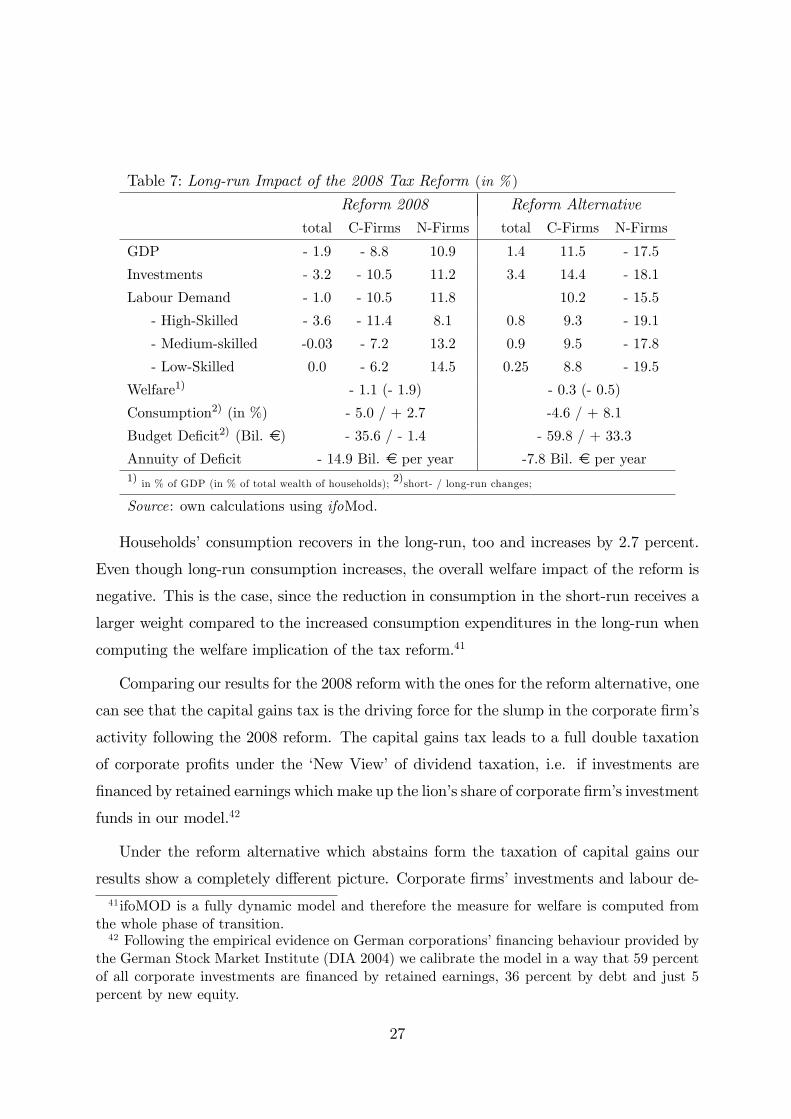
Table 7: Long-run Impact of the 2008 Tax Reform (in % )
Reform 2008 Reform Alternative
total C-Firms N-Firms total C-Firms N-Firms
GDP - 1.9 - 8.8 10.9 1.4 11.5 - 17.5
Investments - 3.2 - 10.5 11.2 3.4 14.4 - 18.1
Labour Demand - 1.0 - 10.5 11.8 10.2 - 15.5
- High-Skilled - 3.6 - 11.4 8.1 0.8 9.3 - 19.1
- Medium-skilled -0.03 - 7.2 13.2 0.9 9.5 - 17.8
- Low-Skilled 0.0 - 6.2 14.5 0.25 8.8 - 19.5
Welfare1) - 1.1 (- 1.9) - 0.3 (- 0.5)
Consumption2) (in %) - 5.0 / + 2.7 -4.6 / + 8.1
Budget De�cit2) (Bil. e) - 35.6 / - 1.4 - 59.8 / + 33.3
Annuity of De�cit - 14.9 Bil. e per year -7.8 Bil. e per year1) in % of GDP (in % of total wealth of households); 2)short- / long-run changes;
Source: own calculations using ifoMod.
Households�consumption recovers in the long-run, too and increases by 2.7 percent.
Even though long-run consumption increases, the overall welfare impact of the reform is
negative. This is the case, since the reduction in consumption in the short-run receives a
larger weight compared to the increased consumption expenditures in the long-run when
computing the welfare implication of the tax reform.41
Comparing our results for the 2008 reform with the ones for the reform alternative, one
can see that the capital gains tax is the driving force for the slump in the corporate �rm�s
activity following the 2008 reform. The capital gains tax leads to a full double taxation
of corporate pro�ts under the �New View�of dividend taxation, i.e. if investments are
�nanced by retained earnings which make up the lion�s share of corporate �rm�s investment
funds in our model.42
Under the reform alternative which abstains form the taxation of capital gains our
results show a completely di¤erent picture. Corporate �rms�investments and labour de-41 ifoMOD is a fully dynamic model and therefore the measure for welfare is computed from
the whole phase of transition.42 Following the empirical evidence on German corporations��nancing behaviour provided by
the German Stock Market Institute (DIA 2004) we calibrate the model in a way that 59 percentof all corporate investments are �nanced by retained earnings, 36 percent by debt and just 5percent by new equity.
27
mand increase by 14.4 and 10.2 percent respectively and the output produced by corporate
�rms grows by 11.5 percent in the long-run. This huge demand for production factors
deteriorates the activity of non-corporate �rms. Non-corporate �rms investments and
labour demand drop by 18.1 and 15.5 percent, respectively. Even though non-corporate
�rms�output declines by 17.5 percent, total output in the economy rises by 1.4 percent.
Despite the growth in overall output, the reform alternative implies a welfare loss
as well �even if the decline in welfare is less pronounced under the reform alternative
compared to the 2008 reform. Welfare in terms of GDP drops by just 0.3 percent (or
by 0.5 percent in terms of household�s welfare), while long-run consumption increases by
more than eight percent. The negative welfare results are the result of the major reduction
in short-run consumption by almost �ve percent.
Furthermore, �nancing the reform alternative is more costly in the short-run compared
to the 2008 tax reform since there are no tax revenues collected from capital gains taxation.
In the short-run, the government budget records a shortfall of about Euro 60 billion -
compared to just Euro 36 billion under the 2008 tax reform. In the long-run, the increased
economic activity leads to higher tax receipts resulting in a budget surplus of about Euro
33 billion. The annuity stream is, however, still negative.
Sensitivity Analysis A comprehensive sensitivity analysis is another major advan-
tage associated with numerical CGE models. So, a numerical CGE model is not only
able to determine the quantitatively dominating e¤ect of any reform package per se, but
a comprehensive sensitivity analysis provides additional insights into the quantitative im-
pact of each respective policy measure under consideration. In our example of the German
corporate tax reform of 2008, the core elements encompass a major reduction of the cor-
porate tax burden, the imposition of a withholding tax on capital gains, and a lowering
of preexisting interest stripping possibilities, i.e. the tightening of debt interest deduction
rules. In order to isolate the economic impact of each of these three elements, we conduct
three separate sensitivity analyses which are presented in Table 8.
28
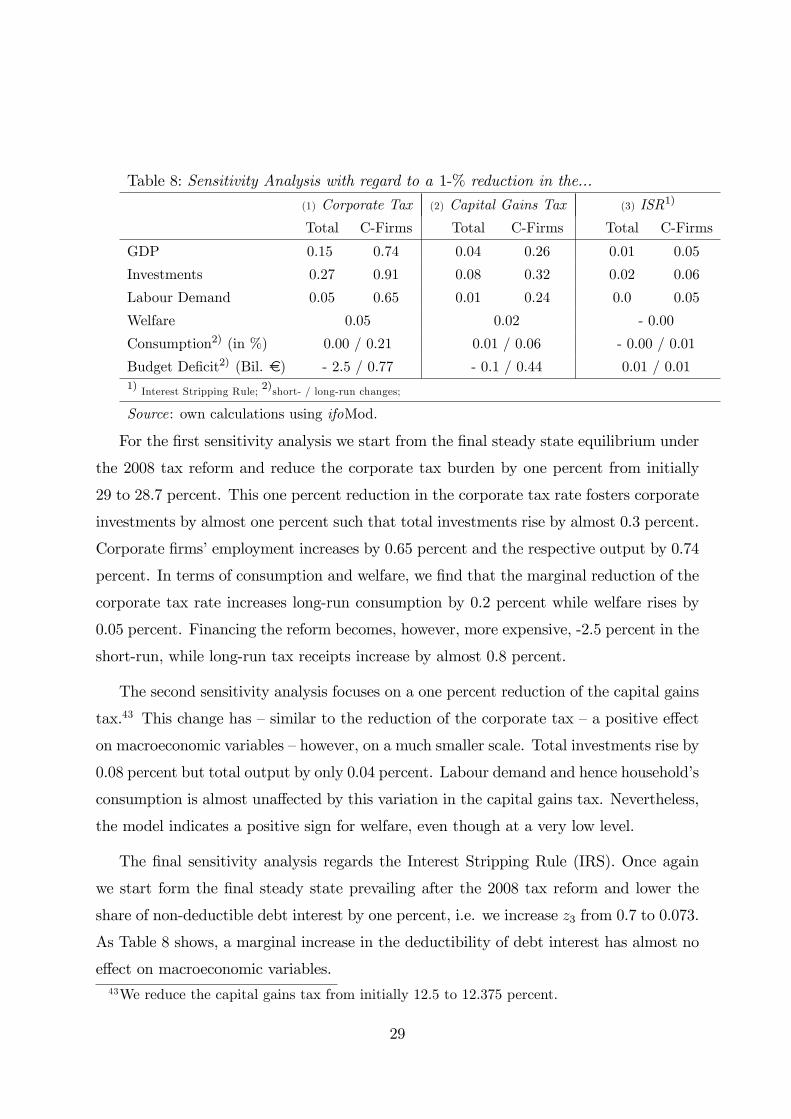
Table 8: Sensitivity Analysis with regard to a 1-% reduction in the...
(1) Corporate Tax (2) Capital Gains Tax (3) ISR1)
Total C-Firms Total C-Firms Total C-Firms
GDP 0.15 0.74 0.04 0.26 0.01 0.05
Investments 0.27 0.91 0.08 0.32 0.02 0.06
Labour Demand 0.05 0.65 0.01 0.24 0.0 0.05
Welfare 0.05 0.02 - 0.00
Consumption2) (in %) 0.00 / 0.21 0.01 / 0.06 - 0.00 / 0.01
Budget De�cit2) (Bil. e) - 2.5 / 0.77 - 0.1 / 0.44 0.01 / 0.011) Interest Stripping Rule; 2)short- / long-run changes;
Source: own calculations using ifoMod.
For the �rst sensitivity analysis we start from the �nal steady state equilibrium under
the 2008 tax reform and reduce the corporate tax burden by one percent from initially
29 to 28.7 percent. This one percent reduction in the corporate tax rate fosters corporate
investments by almost one percent such that total investments rise by almost 0.3 percent.
Corporate �rms�employment increases by 0.65 percent and the respective output by 0.74
percent. In terms of consumption and welfare, we �nd that the marginal reduction of the
corporate tax rate increases long-run consumption by 0.2 percent while welfare rises by
0.05 percent. Financing the reform becomes, however, more expensive, -2.5 percent in the
short-run, while long-run tax receipts increase by almost 0.8 percent.
The second sensitivity analysis focuses on a one percent reduction of the capital gains
tax.43 This change has �similar to the reduction of the corporate tax �a positive e¤ect
on macroeconomic variables �however, on a much smaller scale. Total investments rise by
0.08 percent but total output by only 0.04 percent. Labour demand and hence household�s
consumption is almost una¤ected by this variation in the capital gains tax. Nevertheless,
the model indicates a positive sign for welfare, even though at a very low level.
The �nal sensitivity analysis regards the Interest Stripping Rule (IRS). Once again
we start form the �nal steady state prevailing after the 2008 tax reform and lower the
share of non-deductible debt interest by one percent, i.e. we increase z3 from 0.7 to 0.073.
As Table 8 shows, a marginal increase in the deductibility of debt interest has almost no
e¤ect on macroeconomic variables.43We reduce the capital gains tax from initially 12.5 to 12.375 percent.
29
4 Conclusion
The use of computable general equilibrium (CGE) models to evaluate policy reforms
o¤ers several unique advantages in policy advising. First, a CGE model relies upon
pure economic theory and therefore, it delivers the same comparative static result as the
underlying theoretical model. In addition, a CGE model quanti�es the qualitative e¤ects
underlying the theoretical model and thus provides clear-cut predictions of the dominating
e¤ect resulting from the policy reform under consideration.44 A CGE model, however,
not only determines the dominating e¤ect arising from a fundamental reform package
but also quanti�es all economy-wide repercussions as well as all �rst and second order
e¤ects. Furthermore, dynamic CGE models are a useful instrument to distinguish ex post
between short- and long-run e¤ects arising from a policy proposal. These results can then
be checked by ways of a sensitivity analysis with regard to their robustness, o¤ering thus
a sound foundation for the policy analysis.
This paper introduces the detailed characteristics of ifoMod, a dynamic computable
general equilibrium (CGE) model developed to analyse the short- and long-run impact
of comprehensive tax reform packages. Besides the model�s four building blocks encom-
passing the �rm and household sector, the government and the rest of the world, we
additionally explain the main transmission channels at work and analyse the e¤ect of
taxes on the behavioural margins of �rms and households. The special features of the
model are the detailed modelling of the �rm sector including corporate and non-corporate
�rms, an endogenous investment and �nancial behaviour w.r.t. debt and equity �nancing,
the demand for di¤erent skill-types of labour and international portfolio investments. In
addition, given the fact that we are also able to simulate not only the �nal steady state but
also the transition path to the new equilibrium, the model can provide additional insights
into possible short- and long-run e¤ects of reforms, which might di¤er to a great extend
44This feature is especially important when comprehensive reform packages are evaluated. Forinstance, in analyzing the impact of a fundamental tax reform which implies a simultaneouschange in several tax rates, the theoretical analysis is just able to qualify the impact arisingfrom each single tax rate, separately. A CGE model, however, can determine the dominatinge¤ect resulting from the overall reform package and thus o¤ers additional insights which justthe theoretical analysis can not provide for .
30
and which can not be represented by means of a static model. Thus, ifoMod represents a
dynamic state-of-the-art CGE model which was appreciated by the GCEA (2005) to be
the most advanced CGE model available for policy advise in the �eld of capital income
tax reforms.
In addition, the paper exempli�es how a dynamic CGE model can be used to assess
the outcomes of a comprehensive tax reform package by simulating the repercussions of
the German corporate tax reform of 2008. We �nd that the 2008 tax reform leads to a
slight increase in the corporate and non-corporate �rms marginal e¤ective tax rate by 4.2
and 0.8 percent while the cost of capital of the respective �rms rise by 2.8 and 0.6 percent.
This is the case since the positive e¤ect of the drastic 10 percentage points reduction in
the corporate tax rate is counterbalanced by the introduction of a �nal withholding tax
on capital gains of 25 percent and the interest stripping rule which limits the deductibility
of debt interest. Non-corporate �rms are negatively a¤ected by the introduction of the
so-called tax on the rich. Thus, from the shareholder�s point of view investments in the
corporate sector become less pro�table compared to the ones in the non-corporate sector
thus explaining the slump in corporate traded-o¤ against a rise in non-corporate activity
as shown in the simulation analysis. In total, the increased activity in the non-corporate
sector can not, however, compensate for the loss in corporate output such that overall
GDP falls by almost two percent in the long-run. In addition we �nd, that the German
corporate tax reform of 2008 has a negative impact on household�s welfare.
To check the robustness of our results, we also conduct an additional simulation of a
reform alternative and several sensitivity analyses. We learn from the reform alternative,
which mirrors the 2008 tax reform but abstracts from the taxation of capital gains, that
the negative impact of the 2008 tax reform on corporate �rms is mainly to be attributed
to the taxation of capital gains. The sensitivity analyses show, that under the current
constellation of tax rates, corporate behaviour is more sensitive to an alteration of the
corporate tax rate than to a change in the capital gains tax rate, i.e. that the marginal
deadweight loss of a one percent increase in the corporate tax exceeds the one of the capital
gains tax. Furthermore, we �nd that a marginal change in the debt interest deductibility
provision has hardly any e¤ect on corporate �rm behaviour.
31
To summarise, the paper demonstrates how a dynamic CGE model can be used when
evaluating the economy wide repercussions of a comprehensive tax reform. It shows the
various transmission mechanisms through which taxes a¤ect economic behaviour as well
as short- and long-term e¤ects, underlying the importance of CGE models for quantifying
the �rst order e¤ects and economy-wide repercussions of a tax reform, which are all
essential for policy advising.
Appendix
A - Portfolio Choice Problem & Capital Market Equilibrium
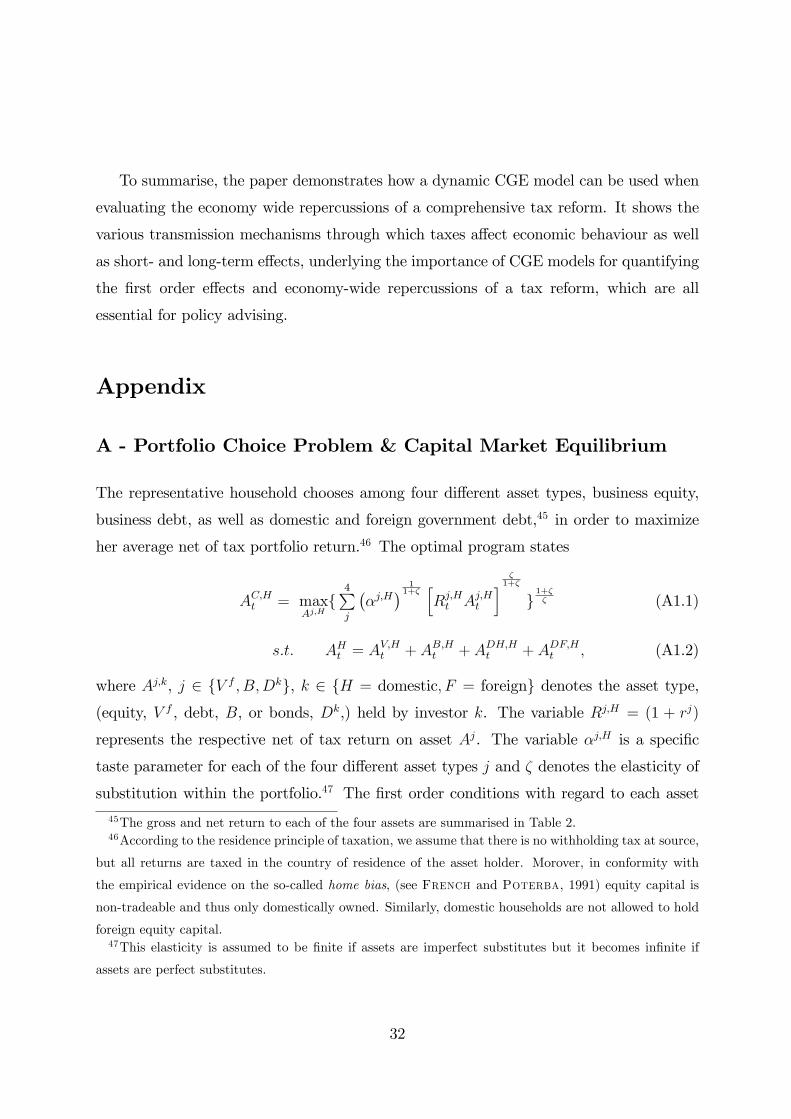
The representative household chooses among four di¤erent asset types, business equity,
business debt, as well as domestic and foreign government debt,45 in order to maximize
her average net of tax portfolio return.46 The optimal program states
AC;Ht = maxAj;H
f4Pj
��j;H
� 11+�hRj;Ht Aj;Ht
i �1+�
g1+�� (A1.1)
s:t: AHt = AV;Ht + AB;Ht + ADH;Ht + ADF;Ht ; (A1.2)
where Aj;k, j 2 fV f ; B;Dkg, k 2 fH = domestic; F = foreigng denotes the asset type,(equity, V f , debt, B, or bonds, Dk,) held by investor k. The variable Rj;H = (1 + rj)
represents the respective net of tax return on asset Aj. The variable �j;H is a speci�c
taste parameter for each of the four di¤erent asset types j and � denotes the elasticity of
substitution within the portfolio.47 The �rst order conditions with regard to each asset
45The gross and net return to each of the four assets are summarised in Table 2.46According to the residence principle of taxation, we assume that there is no withholding tax at source,
but all returns are taxed in the country of residence of the asset holder. Morover, in conformity with
the empirical evidence on the so-called home bias, (see French and Poterba, 1991) equity capital is
non-tradeable and thus only domestically owned. Similarly, domestic households are not allowed to hold
foreign equity capital.47This elasticity is assumed to be �nite if assets are imperfect substitutes but it becomes in�nite if
assets are perfect substitutes.
32
type Aj;H is given by
�aj;H
� 11+� (Rj;H)
�1+� (Aj;H)�
11+�
�P4j
��j;H
� 11+��Rj;HAj;H
� �1+�
� 1�
� � = 0: (A1.3)
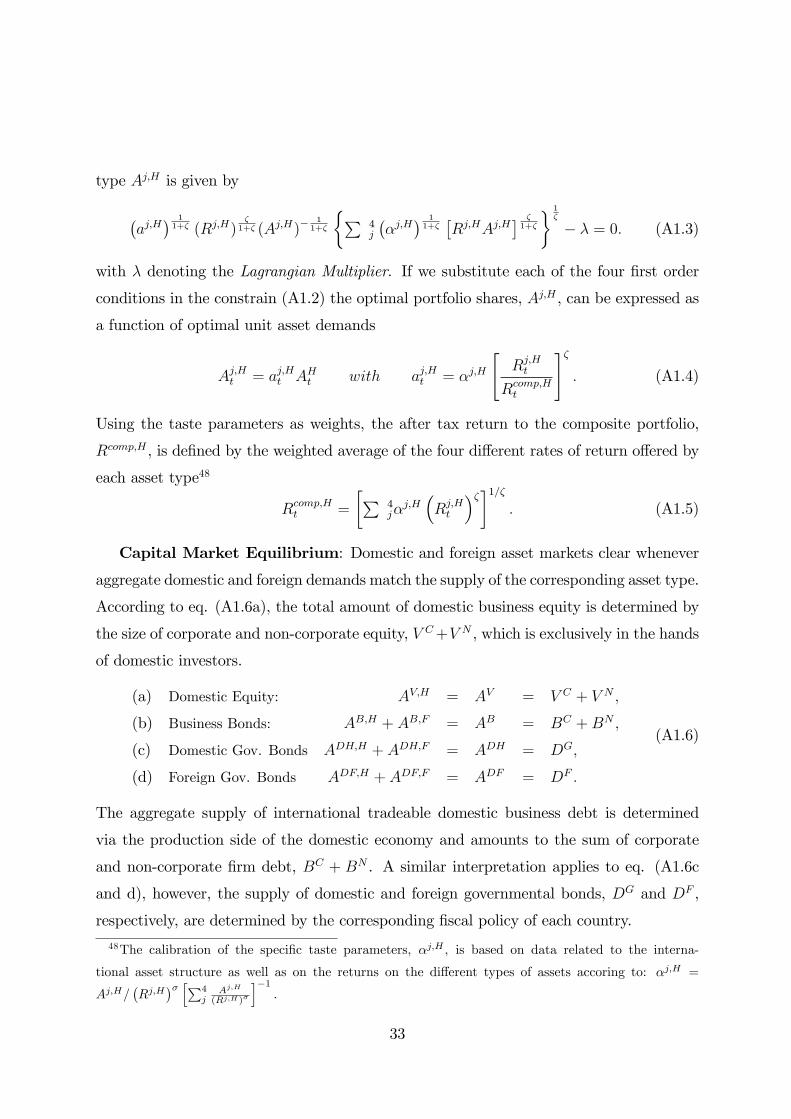
with � denoting the Lagrangian Multiplier. If we substitute each of the four �rst order
conditions in the constrain (A1.2) the optimal portfolio shares, Aj;H , can be expressed as
a function of optimal unit asset demands
Aj;Ht = aj;Ht AHt with aj;Ht = �j;H
"Rj;Ht
Rcomp;Ht
#�: (A1.4)
Using the taste parameters as weights, the after tax return to the composite portfolio,
Rcomp;H , is de�ned by the weighted average of the four di¤erent rates of return o¤ered by
each asset type48
Rcomp;Ht =
�P4j�
j;H�Rj;Ht
���1=�: (A1.5)
Capital Market Equilibrium: Domestic and foreign asset markets clear whenever
aggregate domestic and foreign demands match the supply of the corresponding asset type.
According to eq. (A1.6a), the total amount of domestic business equity is determined by
the size of corporate and non-corporate equity, V C+V N , which is exclusively in the hands
of domestic investors.
(a) Domestic Equity: AV;H = AV = V C + V N ;
(b) Business Bonds: AB;H + AB;F = AB = BC +BN ;
(c) Domestic Gov. Bonds ADH;H + ADH;F = ADH = DG;
(d) Foreign Gov. Bonds ADF;H + ADF;F = ADF = DF :
(A1.6)
The aggregate supply of international tradeable domestic business debt is determined
via the production side of the domestic economy and amounts to the sum of corporate
and non-corporate �rm debt, BC + BN . A similar interpretation applies to eq. (A1.6c
and d), however, the supply of domestic and foreign governmental bonds, DG and DF ,
respectively, are determined by the corresponding �scal policy of each country.
48The calibration of the speci�c taste parameters, �j;H , is based on data related to the interna-
tional asset structure as well as on the returns on the di¤erent types of assets accoring to: �j;H =
Aj;H=�Rj;H
�� hP4j
Aj;H
(Rj;H)�
i�1:
33
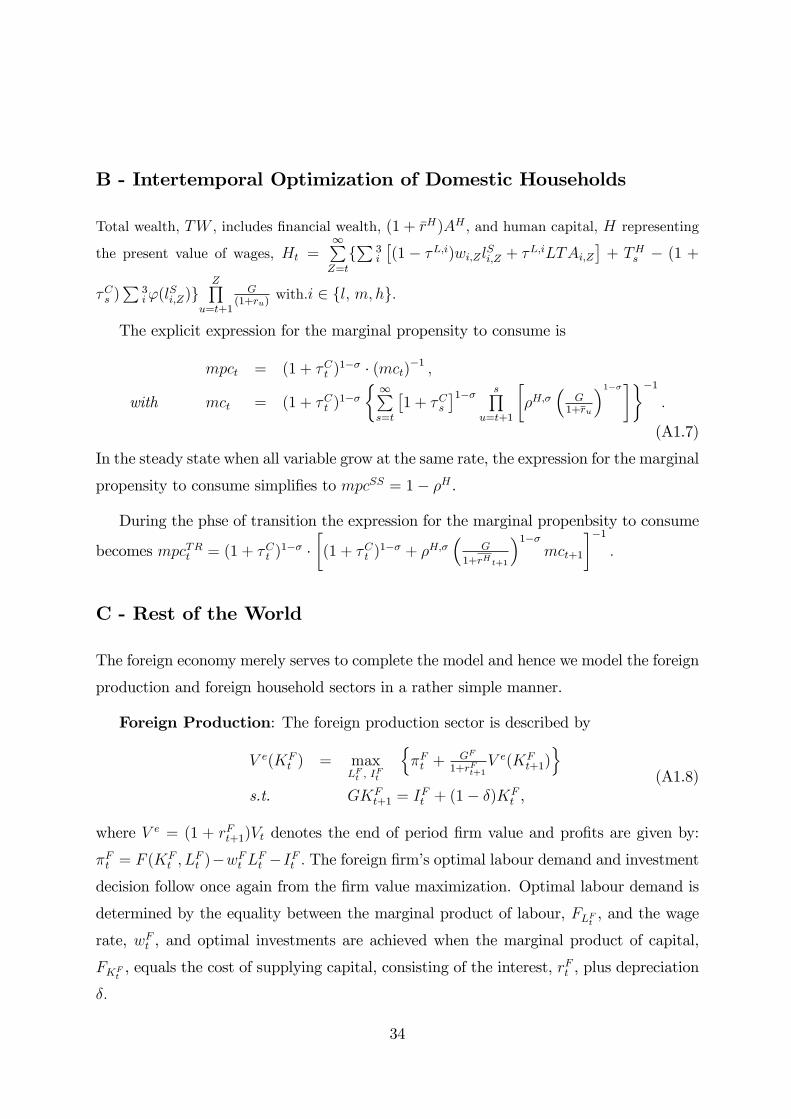
B - Intertemporal Optimization of Domestic Households
Total wealth, TW , includes �nancial wealth, (1 + �rH)AH , and human capital, H representing
the present value of wages, Ht =1PZ=t
fP
3i
�(1� �L;i)wi;Z lSi;Z + �L;iLTAi;Z
�+ THs � (1 +
�Cs )P
3i'(l
Si;Z)g
ZQu=t+1
G(1+ru)
with.i 2 fl; m; hg.
The explicit expression for the marginal propensity to consume is
mpct = (1 + �Ct )1�� � (mct)�1 ;
with mct = (1 + �Ct )1��
� 1Ps=t
�1 + �Cs
�1�� sQu=t+1
��H;�
�G
1+ru
�1�����1:
(A1.7)
In the steady state when all variable grow at the same rate, the expression for the marginal
propensity to consume simpli�es to mpcSS = 1� �H .
During the phse of transition the expression for the marginal propenbsity to consume
becomes mpcTRt = (1 + �Ct )1�� �
�(1 + �Ct )
1�� + �H;��
G
1+rHt+1
�1��mct+1
��1:
C - Rest of the World
The foreign economy merely serves to complete the model and hence we model the foreign
production and foreign household sectors in a rather simple manner.
Foreign Production: The foreign production sector is described by
V e(KFt ) = max
LFt ; IFt
n�Ft +
GF
1+rFt+1V e(KF
t+1)o
s.t. GKFt+1 = I
Ft + (1� �)KF
t ,(A1.8)
where V e = (1 + rFt+1)Vt denotes the end of period �rm value and pro�ts are given by:
�Ft = F (KFt ; L
Ft )�wFt LFt �IFt : The foreign �rm�s optimal labour demand and investment
decision follow once again from the �rm value maximization. Optimal labour demand is
determined by the equality between the marginal product of labour, FLFt , and the wage
rate, wFt , and optimal investments are achieved when the marginal product of capital,
FKFt, equals the cost of supplying capital, consisting of the interest, rFt , plus depreciation
�:
34
Foreign Households: Similar to the domestic households, foreign households have
to solve an optimal portfolio choice problem as well when they maximize their life-time.
The foreign portfolio holding consists also of four di¤erent asset types including foreign
equity, domestic business debt and domestic and foreign government bonds
AF = AV;F + AB;F + ADH;F + ADF;F : (A1.9)
Since we abstain from any capital gains taxes in the foreign economy, the foreign average
portfolio return is the weighted average of the gross returns earned on each asset held by
the foreign investor. According to the long-run stationary solution of the Ramsey model
this average portfolio return in foreign, �rF , has to equal the foreign household�s long-run
rate of time preference, �F :
�rF =iBHAB;F + iHADH;F + iFADF;F + rFAV;F
AF= �F (A1.10)
The foreign household earns interest income on �nancial wealth, (1+ �rF )AF , earns labour
income, wFLF , and has expenses for consumption, CF , and a lump-sum tax, T F .49 Thus,
the wealth of the representative foreign agent accumulates according to
GAFt+1 = (1 + �rFt )A
Ft + w
Ft L
Ft � CFt � T Ft ; with T Ft = (i
F � g)DF : (A1.11)
The optimal program which determines the maximal lifetime utility for the foreign house-
holds states
U(AFt ) = max�u(CFt ) + �
FU(AFt+1)
s.t. eq.(A1.11), (A1.12)
and the solution to it yields the optimal intertemporal pattern for consumption, i.e. the
Euler Equationu0(CFt )
u0(CFt+1)=�F (1 + �rFt )
GF. (A1.13)
References[1] Armington P. A (1969): �Theory of Demand for Products Distinguished by Place of Pro-
duction�, IMF Sta¤ Papers 27, 488-526.
49The lump-sum tax levied on foreign households is just su¢ cient to pay the debt interest emerging
form the foreign government bonds, (iF � g)DF .
35
[2] Arrow K. J. and G. Debreu (1954): �The Existence of an Equilibrium for a CompetitiveEconomy,�Econometrica, 22, 265-90.
[3] Auerbach, A.J. (1979): �Wealth Maximization and the Cost of Capital�, Quarterly Journalof Economics, 93/3, 433-446.
[4] Auerbach A.J. and Laurence J.K. (1987): Dynamic Fiscal Policy, Cambridge.
[5] Bandholz, H., Flaig, G., and Mayr, J. (2005): �Wachstum und Konjunktur in OECD-Ländern: Eine langfristige Perspektive�, ifo Schnelldienst, 58/4, 28-36.
[6] Bradford, D.F. (1981): �The Incidence and Allocation E¤ects of a Tax on Corporate Dis-tributions�, Journal of Public Economics, 15/1, 1-22.
[7] Carone, G. and A. Salomäki (2001): �Reforms in Tax Bene�t Systems in Order to IncreaseEmployment Incentives in the EU�, EC Economic Paper No. 160.
[8] Chirinko, R.S., S.M. Fazzari and A.P. Meyer (1999): �How Responsive is Business Cap-ital Formation to Its User Cost? An Exploration with Micro Data�, Journal of PublicEconomics 74, 53-80.
[9] Chirinko, R.S. (2002): �Corporate Taxation, Capital Formation, and the Substitution Elas-ticity between Labor and Capital,�National Tax Journal, 55/2, 339-355.
[10] Cummins J. G., Hassett, K. A. and Hubbard G. R. (1996): �Tax Reform and Investment:A Cross-Country Comparison,�Journal of Public Economics 62, 237-273.
[11] Destatis, German Statistical O¢ ce (2005): Statistisches Jahrbuch 2005 für die Bundesre-publik Deutschland, Wiesbaden.
[12] DAI, Deutsches Aktieninstitut (2004): DAI-Factbook, Frankfurt am Main.
[13] Dietz, M. and Keuschnigg, C. (2003): Unternehmenssteuerreform II. QuantitativeAuswirkungen auf Wachstum und Verteilung, Schriftenreihe: Finanzwirtschaft und Fi-nanzrecht, Bern: Haupt Verlag.
[14] Dietz M. and Keuschnigg, C. (2004) �Corporate Income Tax Reform in Switzerland,�SwissJournal of Economics, 140, 483-519.
[15] Dietz, M. and Keuschnigg, C. (2007): �A Growth Oriented Dual Income Tax�, InternationalTax and Public Finance, 14/2, 191-221.
[16] Fehr H. (1999): Welfare E¤ects of Dynamic Tax Reforms, Tübingen: Mohr-Siebeck.
[17] Feldstein, M. (2005): �Structural Reform of Social Security�, Journal of Economic Per-spectives, 19/2, 33-55.
[18] Flaig G. (1988): �Einkommen, Zinssatz und In�ation - Ein Beitrag zur Erklärung von Kon-sumwachstumsschwankungen�. in: Bombach G., Gahlen B., Ott A.E. (Eds.), Geldtheorieund Geldpolitik, Tübingen, 291-314.
36
[19] Fossati, A. and Wiegard, W. (2002): Policy Evaluation with General Equilibrium Models,Routledge Applied Economics, London.
[20] French K. R. and Poterba J.M. (1991) �Investor Diversi�cation and International EquityMarkets�, American Economic Review 81, 222-226.
[21] German Central Bank (1995) �Das Produktionspotential in Deutschland und seine Bestim-mungsfaktoren�, Monatsbericht 47/8, 41-57.
[22] German Council of Economic Advisors (2005): Jahresgutachten 2005/06, Wiesbaden.
[23] German Council of Economic Advisors, Max-Planck Institute and ZEW (2006): Reformder Einkommens- und Unternehmensbesteuerung durch die Duale Einkommensteuer, Wies-baden.
[24] German Ministry of Finance (2007a): From the 2000 Tax Reform to the 2008 CorporateTax Reform, http://www.bundes�nanzministerium.de.
[25] German Ministry of Finance (2007b): Unternehmensteuerreformgesetz 2008, Bundesgeset-zblatt Jahrgang 2007 Teil I Nr. 40, http://www.bundes�nanzministerium.de.
[26] Gordon R. H. and Lee Y. (2001) �Do Taxes A¤ect Corporate Debt Policy? Evidence fromUS Corporate Tax Return Data,�Journal of Public Economics 81, 195-224.
[27] Jorgenson, D. W. and K.-Y. Yun (2001): Lifting the Burden: Tax Reform, The Cost ofCapital, and U.S. Economic Growth, Cambridge: MIT Press.
[28] Keuschnigg C. (2004): Eine Steuerreform für mehr Wachstum in der Schweiz, Zürich:Avenir Suisse.
[29] King, M. (1974): �Dividend Behaviour and the Theory of the Firm,� Economica, 41/1,25-34.
[30] King, M. (1977): �Public Policy and the Corporation,�London: Chapman and Hall.
[31] King R.G. and Rebelo S.T. (1990) �Public Policy and Economic Growth: Developing Neo-classical Implications,�Journal of Political Economy 98, 127-150.
[32] Maiterth R. und H. Müller (2007): �Unternehmensteuerreform 2008 - Mogelpackung stattgroßer Wurf�, Quarterly Journal of Economic Research, 2/2007, 49-73.
[33] Modigliani, F. and Miller, M. (1958): �The Cost of Capital, Corporation Finance and theTheory of Investment,�American Economic Review, 48, 261-297.
[34] OECD, Organisation for Economic Co-operation and Development (1991): Taxing Pro�tsin a Global Economy: Domestic and International Issues, Paris.
[35] Ramsey, F.P. (1928), �A Mathematical Theory of Saving,� Economic Journal, 38/152,543-559.
37
[36] Radulescu, D. M. (2007): CGE Models and Capital Income Tax Reforms. The Case of aDual Income Tax for Germany, Heidelberg: Springer.
[37] Roskamp, K. A. (1977): �Labor Productivity and the Elasticity of Factor Substitution inWest German Industries�, The Review of Economics and Statistics 59, 366-371.
[38] Scarf, H.E., (1967): �On the computation of equilibrium prices�in Fellner, W.J. (ed.), TenEconomic Studies in the tradition of Irving Fischer, Wiley, New York.
[39] Shoven, J. B. and Whalley, J., (1972) �A General Equilibrium Calculation of the E¤ectsof Di¤erential Taxation of Income from Capital in the U.S.,�Journal of Public Economics,1/3-4, 281-321.
[40] Shoven, J.B. and Whalley, J., (1973) �General Equilibrium with Taxes: A ComputationalProcedure and an Existence Proof,�The Review of Economic Studies, 40/4, 475-89.
[41] Sinn, H.-W. (1991): �Taxation and the Cost of Capital: The �Old�View, the �New�View,and Another View�, in D. Bradford, ed., Tax Policy and the Economy 5, NBER, 25-54.
[42] Sørensen P. B. (2001) OECDTAX: A Model of Tax Policy in the OECD Economy, TechnicalWorking Paper, University of Copenhagen.
[43] Stimmelmayr, M. (2007): Fundamental Capital Income Tax Reforms: Discussion and Sim-ulation using ifoMOD, Tübingen: Mohr Siebeck.
[44] Summers L.H. (1981): �Tax Policy, the Rate of Return and Savings�National Bureau ofEconomic Research No. 995.
[45] Tobin J. A (1969): �General Equilibrium Approach to Monetary Theory�, Journal ofMoney, Credit and Banking ; 1; 15-29.
[46] Valkonen T. (1999): The Finnish Corporate and Capital Income Tax Reform: A GeneralEquilibrium Approach, Helsinki: ETLA.
[47] Walras, Léon (1877, printed 1954): Elements of Pure Economics, Harvard University Press.
[48] Whited T. N. (1994): �Problems with identifying adjustment costs from regressions ofinvestment on q,�Economic Letters 46, 339-344.
38


![AIM CGE reneables 4 5 Scenarios edited TM · stabilize 4.5 W/m2 of radiative forcing is assessed by using AIM/CGE[Global], a variant of AIM/CGE model. The AIM/CGE[Global] is a global](https://img.pdfslide.us/doc/110x75/5f027bce7e708231d4047d12/aim-cge-reneables-4-5-scenarios-edited-tm-stabilize-45-wm2-of-radiative-forcing.jpg)