Embed Size (px)
Citation preview
The Impact of Test Suite Granularityon the Cost-Effectiveness of Regression Testing
Gregg Rothermely, Sebastian Elbaumz, Alexey Malishevskyy, Praveen Kallakuriz, Brian Daviay
yDepartment of Computer ScienceOregon State University
Corvallis, Oregonfgrother,malishal,[email protected]
zDepartment of Computer Science andEngineering
University of Nebraska - LincolnLincoln, Nebraska
felbaum,[email protected]
ABSTRACTRegression testing is an expensive testing process used tovalidate software following modi�cations. The cost-e�ective-ness of regression testing techniques varies with characteris-tics of test suites. One such characteristic, test suite granu-larity, involves the way in which test inputs are grouped intotest cases within a test suite. Various cost-bene�ts tradeo�shave been attributed to choices of test suite granularity, butalmost no research has formally examined these tradeo�s.To address this lack, we conducted several controlled exper-iments, examining the e�ects of test suite granularity on thecosts and bene�ts of several regression testing methodologiesacross six releases of two non-trivial software systems. Ourresults expose essential tradeo�s to consider when designingtest suites for use in regression testing evolving systems.
1. INTRODUCTIONAs software evolves, test engineers regression test it to val-
idate new features and detect whether new faults have beenintroduced into previously tested code. Regression testingis expensive, and many approaches have been suggested forlowering its cost. One approach re-uses all previously devel-oped test cases, executing them on the modi�ed program.When only a small portion of a system is modi�ed, however,this retest-all approach can waste resources running unnec-essary tests. Thus, regression test selection techniques [5,17, 25] can be used instead to select a subset of an existingtest suite. Test re-execution can also be aided by test caseprioritization techniques [6, 29, 30], which order test cases sothat those that are better at achieving testing objectives arerun earlier in the regression testing cycle. Finally, test suitereduction techniques [4, 10, 20] can reduce testing costs byeliminating redundant test cases from test suites.The cost-e�ectiveness of regression testing techniques can
vary with characteristics of test suites [6, 26, 27]. One such
Permission to make digital or hard copies of all or part of this work forpersonal or classroom use is granted without fee provided that copies arenot made or distributed for profit or commercial advantage and that copiesbear this notice and the full citation on the first page. To copy otherwise, torepublish, to post on servers or to redistribute to lists, requires prior specificpermission and/or a fee.Copyright 2001 ACM X-XXXXX-XX-X/XX/XX ... $5.00.
characteristic is test suite granularity, which re ects the waytest inputs are grouped into test cases within a test suite.For example, a test suite for a word processor might containjust a few test cases that start up the system, open a doc-ument, issue hundreds of editing commands, and close thedocument, or it might contain hundreds of test cases thateach issue only a few commands. A test suite for a compilermight contain several test cases that each compile a source�le containing hundreds of language constructs, or hundredsof test cases that each compile a source �le containing just afew constructs. A test suite for a class library might containa few test drivers that each invoke dozens of methods, ordozens of drivers that each invoke a few methods.Faced with such choices in test suite design, test engineers
may wonder which direction to take. Textbooks and populartesting literature o�er advice. For example, Beizer [2, p.51] writes: \It's better to use several simple, obvious teststhan to do the job with fewer, but grander, tests." Otheradvice is framed in terms of test case size { an importantfactor in test suite granularity. Kaner et al. [13, p. 125],suggest that large tests can save time, provided they arenot overly complicated, in which case simpler tests may bemore e�cient. Kit [15, p. 107] suggests that when testingvalid inputs for which failures should be infrequent, largetest cases are preferable. Bach [1] states that small test casescause fewer di�culties with cascading errors, but large testcases are better at exposing system level failures involvinginteractions between software components.Despite such suggestions, in our search of the research lit-
erature we �nd little formal examination of the cost-bene�tstradeo�s associated with choices of test suite granularity. Amore thorough investigation of these tradeo�s, and the im-plications of these tradeo�s on testing across the softwarelifecycle, could help test engineers design test suites thatsupport more cost-e�ective regression testing.We therefore designed and conducted a family of con-
trolled experiments, in which we observed the applicationof test suites of various granularities across six releases oftwo non-trivial software systems. We measured the impactof test suite granularity on the costs and savings of severalregression-testing methodologies: retest-all, regression testselection, test case prioritization, and test suite reduction.Our results expose essential tradeo�s to consider when de-signing test cases for use in regression testing evolving soft-ware systems.
1
2. OVERVIEW AND RELATED WORKFollowing Binder [3], we de�ne a test case to consist of
a pretest state of the system under test (including its envi-ronment), a sequence of test inputs, and the expected testresults. We de�ne a test suite to be a set of test cases.A de�nition of test suite granularity is harder to come
by, but the testing problem we are addressing is a practicalone, so we begin by drawing on examples. Test engineersdesigning test cases for a system identify various testing re-
quirements for that system, such as speci�cation items, codeelements, or method sequences. Next, they must constructtest cases that exercise these requirements. An engineertesting a word processor might specify sequences of edit-ing commands, an engineer testing a compiler might createsample target-language programs, and an engineer testinga class library might develop drivers that invoke methods.The practical questions these engineers face include: howmany editing commands to include per sequence, how manyconstructs to include in each target-language program, andhow many methods to invoke per driver.The answers to these questions involve many cost-bene�ts
tradeo�s. For example, if the cost of performing setup ac-tivities for individual test cases dominates the cost of exe-cuting those tests, a test suite containing a few large testcases can be less expensive than a suite containing manysmall test cases. Large test cases might also be better thansmall ones at exposing failures caused by interactions amongsystem functions. Small test cases, on the other hand, canbe easier to use in debugging than large test cases, becausethey reduce occurrences of cascading errors [1] and simplifyfault localization [11]. Further, grouping test inputs intolarge test cases may prevent test inputs that appear laterin the test cases from exercising the requirements they areintended to exercise, by causing later inputs to be appliedfrom system states other than those intended.In part, the foregoing examples involve test case size, a
term used informally in [1, 2, 13, 15] to denote notions suchas the number of commands applied to, or the amount ofinput processed by, the program under test, for a given testcase. However, there is more than just test case size in-volved: when engineers increase or decrease the number ofrequirements covered by each test case, this directly deter-mines the number of individual test cases that need to becreated to cover all the requirements. It is the interactionof test case size and number of test cases that creates mostof the cost-bene�ts tradeo�s just discussed.The phenomenon we wish to study in this paper, then, in-
volves ways in which, in the course of designing a test suiteto cover requirements, test inputs are grouped into test caseswithin that suite. Thus, we use the term test suite granular-ity to describe a partition on a set of test inputs into a testsuite containing test cases of a given size. Section 3.1.1.2provides a more precise measure of test suite granularity.Other de�nitions of test case, test case size, and test suite
granularity are possible. Test engineers might choose to viewthe individual inputs applied during a single invocation of aword processor, or the individual method invocations madefrom within a class driver, as individual test cases, eachwith its own size. Also, in practice test suites may containtest cases of varying size. However, our de�nitions facilitatethe controlled study of the cost-bene�ts tradeo�s outlinedabove. Moreover, our de�nitions are suitable for use withthe programs we use as subjects in our experiments.
2.1 Regression Testing and MethodologiesWe wish to study the e�ects of test suite granularity on
the costs and e�ectiveness of testing activities across thesoftware lifecycle, i.e., in relation to regression testing.Let P be a program, P 0 be a modi�ed version of P , and
T be a test suite developed for P . Regression testing seeksto test P 0. To facilitate such testing, test engineers mayre-use T to the extent possible, but new test cases may alsobe required to test new functionality. Both reuse of T andcreation of new test cases are important; however, it is testreuse that concerns us here, as it is test reuse that motivatesmost suggestions about costs/bene�ts of test case size.In particular, we consider four methodologies related to
regression testing and test reuse: retest-all, regression testselection, test suite reduction, and test case prioritization.
2.1.1 Retest-allWhen P is modi�ed, creating P 0, test engineers may sim-
ply reuse all non-obsolete1 test cases in T to test P 0; thisis known as the retest-all technique [16]. The retest-alltechnique represents typical current practice [21], and thus,serves as our control technique.
2.1.2 Regression Test SelectionThe retest all technique can be expensive: rerunning all
test cases may require an unacceptable amount of time orhuman e�ort. Regression test selection (RTS) techniques [5,17, 25] use information about P , P 0, and T to select a subsetof T with which to test P 0. (For a survey of RTS techniques,see [24].) Empirical studies of some RTS techniques [5, 8,26, 28] have shown that they can be cost-e�ective.One cost-bene�ts tradeo� among RTS techniques involves
safety and e�ciency. Safe RTS techniques guarantee that,under certain conditions, test cases not selected could nothave exposed faults in P 0 [24]. Achieving safety, however,may require inclusion of a larger number of test cases thancan be run in available testing time. Non-safe RTS tech-niques sacri�ce safety for e�ciency, selecting test cases that,in some sense, are more useful than those excluded.
2.1.3 Test Suite ReductionAs P evolves, new test cases may be added to T to val-
idate new functionality. Over time, T grows, and its testcases become redundant in terms of code or functionalityexercised. Test suite reduction techniques2 [4, 10, 20] ad-dress this problem by using information about P and T topermanently remove redundant test cases from T , so thatsubsequent reuse of T can be more e�cient. Test suite re-duction thus di�ers from regression test selection in that thelatter does not permanently remove test cases from T , butsimply \screens" those test cases for use on a speci�c versionP 0 of P , retaining unused test cases for use on later releases.By reducing test-suite size, test-suite reduction techniques
reduce the costs of executing, validating, and managing testsuites over future releases of the software. A potential draw-back of test-suite reduction, however, is that removal of
1Test cases in T that no longer apply to P 0 are obsolete, andmust be reformulated or discarded [16].2Test suite reduction has also been referred to, in the litera-ture, as test suite minimization; however, the intractabilityof the test suite minimization problem forces techniques toemploy heuristics that may not yield minimum test suites;hence, we term these techniques \reduction" techniques.
2
test cases from a test suite may damage that test suite'sfault-detecting capabilities. Some studies [27] have shownthat test suite reduction can signi�cantly reduce the fault-detection e�ectiveness of test suites. Other studies [31] haveshown that test-suite reduction can produce substantial sav-ings at little cost to fault-detection e�ectiveness.
2.1.4 Test Case PrioritizationTest case prioritization techniques [6, 29, 30] schedule test
cases so that those with the highest priority, according tosome criterion, are executed earlier in the regression testingprocess than lower priority test cases. For example, testersmight wish to schedule test cases in an order that achievescode coverage at the fastest rate possible, exercises featuresin order of expected frequency of use, or increases the likeli-hood that those test cases will detect faults early in testing.Empirical results [6, 29, 30] suggest that several simple
prioritization techniques can signi�cantly improve one test-ing performance goal: namely, the rate at which test suitesdetect faults. An improved rate of fault detection duringregression testing provides earlier feedback on the systemunder test and lets software engineers begin locating andcorrecting faults earlier than might otherwise be possible.
2.2 Related WorkMany papers have examined the costs and bene�ts of re-
gression test selection, test case prioritization, and test casereduction [5, 6, 8, 14, 27, 31]. Several textbooks and articleson testing [1, 2, 6, 11, 13, 15, 27] have discussed tradeo�sinvolving test suite granularity. None of these documents,however, has formally examined these tradeo�s, or done soin relation to regression testing.In [26, 28], test suite granularity is speci�cally considered
as a factor in two studies of regression test selection, andtest suites constructed from smaller test cases are shown tofacilitate selection. These studies, however, measured onlynumbers of test cases selected, and considered only safe RTStechniques. In contrast, this paper presents the results of acontrolled experiment designed speci�cally to examine theimpact of test suite granularity on the costs and savings asso-ciated with several regression testing methodologies, acrossseveral metrics of importance.
3. THE EXPERIMENTInformally, the research question we address is, \how does
test suite granularity a�ect the costs and bene�ts of regres-sion testing methodologies across software release cycles?"More formally, we wish to evaluate the following hypotheses(expressed as null hypotheses) for three methodologies |regression test selection, test suite reduction, and test caseprioritization | at a 0.05 level of signi�cance:
H1 (test suite granularity): Test suite granularity doesnot have a signi�cant impact on the costs and bene�tsof regression testing techniques.
H2 (technique): Regression testing techniques do not per-form signi�cantly di�erently in terms of the selectedcosts and bene�ts measures.3
H3 (interaction): Test suite granularity e�ects across re-gression testing techniques do not signi�cantly di�er.
3This hypothesis has been tested in previous studies, and isincluded primarily for completeness and replication.
We also wished to evaluate these hypotheses relative tothe retest-all technique. To simplify this, we treated thattechnique as a control technique and assessed it in the con-text of each of the other three methodologies.To test our hypotheses we designed several controlled ex-
periments. The following sections present our measures, ma-terials, design, threats to validity, and results.
3.1 Measures
3.1.1 Independent VariablesOur experiments manipulated two independent variables:
regression testing technique and test suite granularity.
3.1.1.1 Regression testing techniques.For each regression testing methodology considered we
studied two or three techniques. In selecting techniques wehad two goals: (1) to include techniques that could serveas practical experimental controls, and (2) to include tech-niques that could easily be implemented by practitioners.
Regression test selection. We chose three RTS tech-niques, retest-all, modi�ed entity, and modi�ed non-core en-tity. As described in Section 2.1, the retest-all technique[16] executes every test case in T on P 0, and is our controltechnique, representing typical current practice. The mod-i�ed entity technique [5] is a safe RTS technique: it selectstest cases that exercise functions, in P , that (1) have beendeleted or changed in producing P 0, or (2) use variables orstructures that have been deleted or changed in producingP 0. The modi�ed non-core entity technique works like themodi�ed-entity technique, but ignores \core" functions, de-�ned as functions exercised by more than k% of the test casesin the test suite (we set k to 80%). This technique tradessafety for savings in re-testing e�ort (selecting all test casesthrough core functions may lead to selecting all of T ).
Test suite reduction. We selected two test suite re-duction techniques, no reduction and GHS reduction. Theno reduction technique (equivalent to retest-all) representscurrent typical practice and acts as our control. The GHSreduction technique is a heuristic presented by Gupta, Har-rold, and So�a [10] that attempts to produce suites that areminimal for a given coverage criterion; we used a functioncoverage criterion.
Test case prioritization. We selected three test caseprioritization techniques, random prioritization, additionalfunction coverage prioritization, and optimal prioritization.Random prioritization (equivalent to retest-all in our exper-iments, because we randomly ordered the test cases in ourtest suites before using them) places test cases in T in ran-dom order and is our control. Additional function coverageprioritization [29] iteratively selects a test case that yieldsthe greatest function coverage, then adjusts the coverage in-formation on subsequent test cases to indicate their coverageof functions not yet covered, and then repeats this process,until all functions covered by at least one test case have beencovered. When all functions have been covered, this processis repeated on the remaining test cases. Optimal prioritiza-tion uses information on which test cases in T reveal faults inP 0 to �nd an (approximate) optimal ordering for T ; thoughnot a practical technique (in practice we don't know whichtest cases reveal which faults beforehand), this techniqueprovides an upper bound on prioritization bene�ts.
3
3.1.1.2 Test suite granularity.Our objective was to quantify the impact of varying test
suite granularities on the costs and bene�ts of regressiontesting techniques. To do this, we needed to obtain testsuites of varying granularities, in a manner that controls forother factors that might a�ect our dependent measures. Weconsidered two approaches for doing this.The �rst approach is to obtain or construct test suites for
a program, partition them into subsets according to size,and compare the results of executing these di�erent subsets.However, this approach would not let us establish a causalrelationship between test suite granularity and measures ofcosts or bene�ts, because it does not control for other factorsthat might in uence those measures.To see this, suppose T can be partitioned into subsets T1
containing test cases of size s, and T2 containing test cases ofsize ks. Suppose we compare costs or bene�ts of T1 and T2and �nd that they di�er. In this case, we cannot determinewhether this di�erence was caused by test suite granularity,or by di�erences in the number or type of inputs appliedin T1 and T2. (For example, it might be the case that allmodi�ed functions are exercised only by inputs in T1.)The second approach we considered is to construct test
suites of varying granularities by sampling a single pool or\universe" of test grains. A test grain is a smallest inputthat could be used as a test case (applied from a start stateand producing a checkable output) for a target program. Asampling procedure can randomly select test grains to createtest cases of di�erent sizes: a test case of size s consists ofs test grains. Applying this sampling procedure repeatedlyto a universe of n test grains, without replacement, untilnone remain (partitioning the universe into n=s test cases ofsize s, and possibly one smaller test case), yields a test suiteof granularity level s. Repeating this procedure for variousvalues of s gives us test suites of di�erent granularity levelsthat can be compared controlling for di�erences in types andnumbers of inputs.We chose the second approach, and employed four gran-
ularity levels: 1, 4, 16 and 64, which we refer to as G1, G4,G16, and G64, respectively.
3.1.2 Dependent VariablesTo investigate our hypotheses we need to measure the
costs and bene�ts of regression testing techniques. To dothis we constructed three models. Our �rst two models as-sess costs and bene�ts of regression test selection and testcase reduction, and our third model assesses the bene�tsof test case prioritization. We restrict our attention to thecosts and bene�ts measured by these models; other costsand bene�ts are mentioned in Section 3.4.
3.1.2.1 Savings in test execution time.Regression test selection and test suite reduction achieve
savings by reducing the number of test cases that need to beexecuted on P 0, thereby reducing the e�ort required to retestP 0. The use of larger test suite granularities is also expectedto produce savings in test execution and validation time. Inthis experiment, to evaluate these savings, we measure thetime required to execute and validate4 the test cases in testsuites, selected test suites, and reduced test suites, acrosstest suites of di�erent granularities.
4Validation involved using the Unix \di�" utility to compareall old and new outputs and external �les.
3.1.2.2 Costs in fault-detection effectiveness.One potential cost of regression test selection and test
suite reduction is the cost of missing faults that would havebeen exposed by excluded test cases. This cost could alsovary with test suite granularity. Costs in fault-detectione�ectiveness can be measured by studying programs thatcontain known faults. When dealing with single faults, onecommon measure [8, 12] estimates whether a test case t de-tects fault f in P 0 by applying t to two versions of P 0, onethat contains f and one that does not. If the outputs of Pand P 0 di�er on t, we conclude that t reveals f .In our experiments, however, we wish to study programs
containing multiple faults. When P 0 contains multiple faultsit is not enough to note which test cases cause P 0 to fail, wemust also determine which test cases could contribute torevealing which faults. One way to do this [14] is to instru-ment P 0 such that when t is run on P 0 we can determine,for each fault f in P 0, whether: (1) t reaches f , (2) t causesa change in data state following execution of f , and (3) theoutput of P 0 on t di�ers from the output of P on t.One drawback of this approach is that it can underesti-
mate the faults that could be found in practice with t. Forexample, suppose P 0 contains faults f1 and f2, which caneach be detected by t if present alone. Suppose, however,that when f1 and f2 are both present in P 0, f1 preventst from reaching f2. This approach would suggest that tcannot detect f2. In a debugging process, however, an en-gineer might detect and correct f1, and then on re-runningt on the (partially) corrected P 0, be able to detect f2. Asecond drawback of this approach is that testing for datastate changes can be infeasible in programs that manipulateenormous data spaces, such as those used in this study.For these reasons, we chose a second approach. We acti-
vated each fault f in P 0 individually, executed each test caset (at each granularity level) on P 0, and determined whethert detects f singly by noting whether it causes P and P 0 toproduce di�erent outputs. We then assumed that detectionof f when present singly implies detection of f when presentin combination with other faults.This approach avoids the drawbacks of the �rst approach:
it accommodates incremental fault-correction and doesn'trequire detection of data state changes. However, the ap-proach may err in cases where multiple faults would maskeach other's e�ects such that no failures would occur ont. We investigated the possible magnitude of this error byalso executing our test cases on our multi-fault versions, andmeasuring the extent to which test cases that caused single-fault versions to fail did not cause multi-fault versions tofail.5 The data showed that for one of these programs (emp-server, described momentarily), across all versions and gran-ularities, masking occurred on only 16 of 13,195 test cases(.12%), and for the other program (bash), across all versionsand granularities, masking occurred on only 240 of 7,760test cases (3.09%).
3.1.2.3 Savings in rate of fault detection.The test case prioritization techniques we consider have
a goal of increasing a test suite's rate of fault detection.
5This check does not eliminate the possibility that somesubset of the faults in a multi-fault version might mask oneanother, and be undetected by test case t in that versioneven though detected singly by t; however, it was not com-putationally feasible to check for this possibility.
4
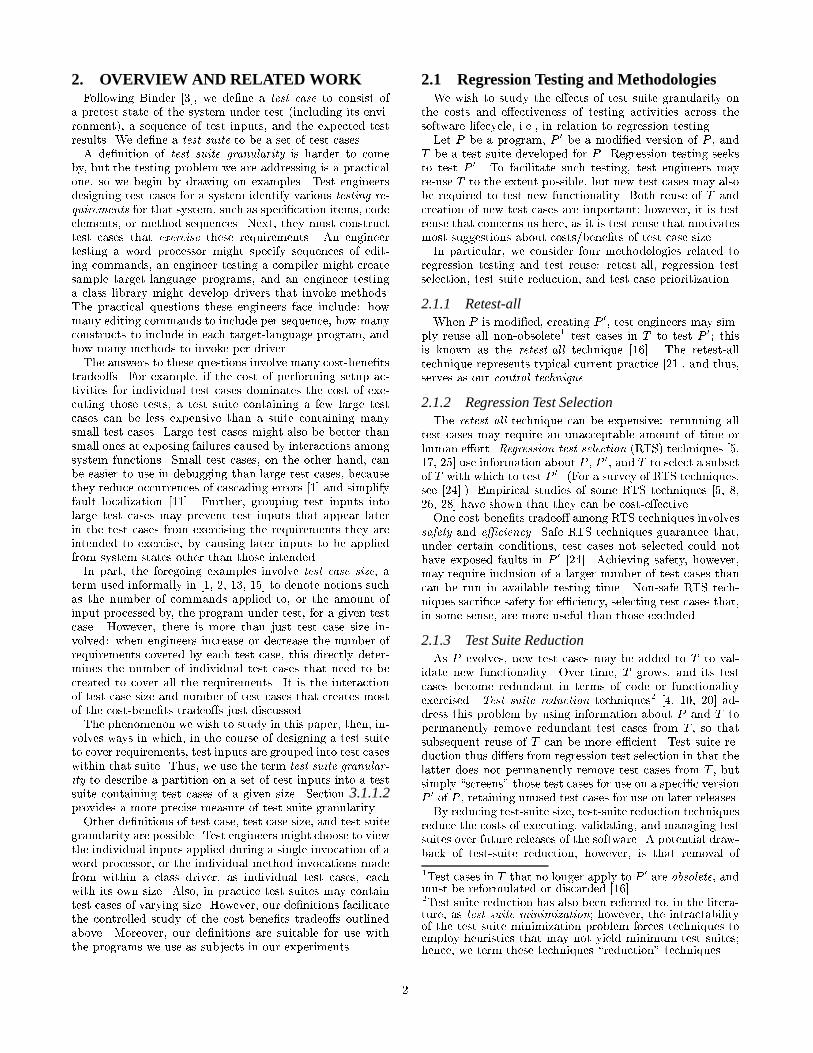
Changed LinesProgram Version Functions Functions of Code
emp-server 4.2.0 1,159 | 67,719emp-server 4.2.1 1,159 51 67,719emp-server 4.2.3 1,171 286 68,626emp-server 4.2.4 1,172 9 69,796emp-server 4.2.5 1,173 100 68,739emp-server 4.2.6 1,173 31 68,782bash 2.0 1,499 | 48,292bash 2.01 1,541 303 49,555bash 2.01.1 1,542 39 49,666bash 2.02 1,683 519 58,090bash 2.02.1 1,683 12 58,103bash 2.03 1,712 196 59,010
Table 1: Experiment Subjects.
To measure rate of fault detection, in [29] we introduced ametric, APFD, which measures the weighted average of thepercentage of faults detected over the life of a test suite.APFD values range from 0 to 100; higher numbers implyfaster (better) fault detection rates. More formally, let Tbe a test suite containing n test cases, and let F be a setof m faults revealed by T . Let TFi be the �rst test case inordering T 0 of T which reveals fault i. The APFD for testsuite T 0 is given by the equation:
APFD = 1�TF1 + TF2 + :::+ TFm
nm+
1
2n
Examples and empirical results illustrating the use of thismetric are provided in [29].
3.2 Experiment Materials
3.2.1 ProgramsFor these experiments we obtained several releases of two
non-trivial C programs: emp-server and bash. Table 1 pro-vides data on these programs, we describe that data below.
3.2.1.1 Emp-server program characteristics.Emp-server is the server component of the open-source
client-server internet game Empire. Emp-server is essen-tially a transaction manager: its main routine consists of ini-tialization code followed by an event loop in which executionwaits for receipt of a user command. Emp-server is invokedand left running on a host system; a user communicates withthe server by executing a client that transmits the user'sinputs as commands to emp-server. When emp-server re-ceives a command, its event loop invokes routines that pro-cess the command, then waits to receive the next command.As emp-server processes commands, it may return data tothe client program for display on the user's terminal, or writedata to a local database (a directory of ASCII and binary�les) that keeps track of game state. The event loop andprogram terminate when a user issues a \quit" command.We obtained six versions of emp-server. Table 1 shows
the numbers of functions and lines of executable code in eachversion, and for each version after the �rst, the number offunctions changed for that version (modi�ed or added to theversion, or deleted from the preceding version).
3.2.1.2 Bash program characteristics.Bash [23], short for \Bourne Again SHell", is a popular
open-source application that provides a command line in-terface to multiple Unix services. Bash was developed as
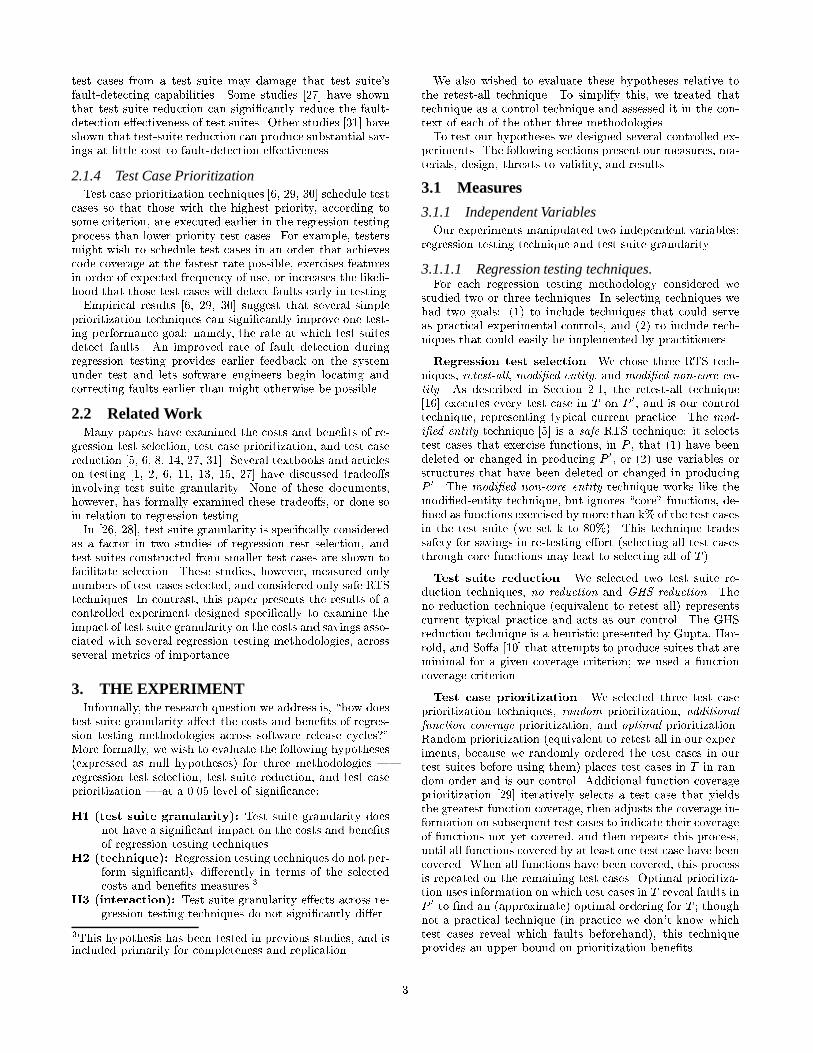
emp-server bash
G1 1985 1168G4 497 292G16 125 73G64 32 19
Table 2: Test Cases per Granularity Level.
part of the GNU Project, adopting several features from theKorn and C shells, but also incorporating new functionalitysuch as improved command line editing, unlimited size com-mand history, job control, indexed arrays of unlimited size,and more advanced integer arithmetic.Bash is still evolving; on average two new releases have
emerged per year over the last �ve years. For this experi-ment we used six versions of bash released from 1996 to 1999(see Table 1). Each release corrects faults, but also providesnew functionality as evident by the increasing code size.
3.2.2 Test Cases and Test AutomationTo examine our research question we required test cases
for our subject programs. Moreover, these test cases had tobe structured in a way that facilitates the controlled inves-tigation of the e�ects of test suite granularity, following themethodology outlined in Section 3.1.1.2. The approachesused to create and automate these test cases, which di�eredsomewhat between our subject programs, were as follows.
3.2.2.1 Emp-server test cases and test automation.No test cases were available for emp-server. To construct
test cases we used the Empire information �les, which de-scribe the 196 commands recognized by emp-server, andthe parameters and environmental e�ects associated witheach. We treated these �les as informal speci�cations forsystem functions and used them, together with the categorypartition method [22], to construct a suite of test cases foremp-server that exercise each parameter, environmental ef-fect, and erroneous condition described in the �les.We deliberately created the smallest test cases possible,
each using the minimum number of commands necessary tocover its target requirement. Each test case consists of asequence of between one and six lines of characters (average1.2 lines per test case), and constitutes a sequence of in-puts to the client, which the client passes to emp-server.Because the complexity of commands, parameters, and ef-fects varies widely across the various Empire commands, thisprocess yielded between one and 38 test cases for each com-mand, and ultimately produced 1985 test cases. These testcases constituted our test grains, as well as our test casesat granularity level G1. We then used the sampling pro-cedure described in Section 3.1.1.2to create test suites ofgranularity levels G4, G16, and G64, as shown in Table 2.To execute and validate test cases automatically, we cre-
ated test scripts. Given test suite T , for each test case t inT these scripts: (1) initialize the Empire database to a startstate; (2) invoke emp-server; (3) invoke a client and issuethe sequence of inputs that constitutes the test case to theclient, saving all output returned to the client for use in val-idation; (4) terminate the client; (5) shut down emp-server;(6) save the contents of the database for use in validation;and (7) compare saved client output and database contentswith those archived for the previous version. By design,this process lets us apply (in step 3) all of the test inputscontained in a test case, at all granularity levels.
5
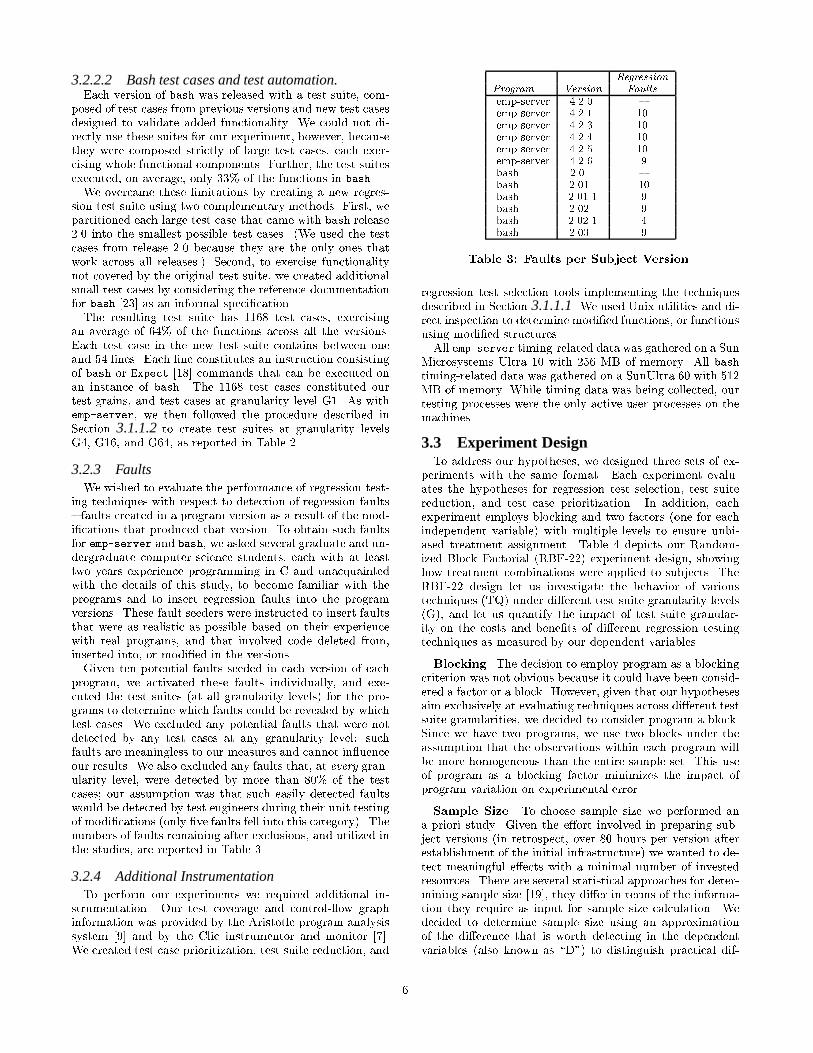
3.2.2.2 Bash test cases and test automation.Each version of bash was released with a test suite, com-
posed of test cases from previous versions and new test casesdesigned to validate added functionality. We could not di-rectly use these suites for our experiment, however, becausethey were composed strictly of large test cases, each exer-cising whole functional components. Further, the test suitesexecuted, on average, only 33% of the functions in bash.We overcame these limitations by creating a new regres-
sion test suite using two complementary methods. First, wepartitioned each large test case that came with bash release2.0 into the smallest possible test cases. (We used the testcases from release 2.0 because they are the only ones thatwork across all releases.) Second, to exercise functionalitynot covered by the original test suite, we created additionalsmall test cases by considering the reference documentationfor bash [23] as an informal speci�cation.The resulting test suite has 1168 test cases, exercising
an average of 64% of the functions across all the versions.Each test case in the new test suite contains between oneand 54 lines. Each line constitutes an instruction consistingof bash or Expect [18] commands that can be executed onan instance of bash. The 1168 test cases constituted ourtest grains, and test cases at granularity level G1. As withemp-server, we then followed the procedure described inSection 3.1.1.2to create test suites at granularity levelsG4, G16, and G64, as reported in Table 2.
3.2.3 FaultsWe wished to evaluate the performance of regression test-
ing techniques with respect to detection of regression faults{ faults created in a program version as a result of the mod-i�cations that produced that version. To obtain such faultsfor emp-server and bash, we asked several graduate and un-dergraduate computer science students, each with at leasttwo years experience programming in C and unacquaintedwith the details of this study, to become familiar with theprograms and to insert regression faults into the programversions. These fault seeders were instructed to insert faultsthat were as realistic as possible based on their experiencewith real programs, and that involved code deleted from,inserted into, or modi�ed in the versions.Given ten potential faults seeded in each version of each
program, we activated these faults individually, and exe-cuted the test suites (at all granularity levels) for the pro-grams to determine which faults could be revealed by whichtest cases. We excluded any potential faults that were notdetected by any test cases at any granularity level: suchfaults are meaningless to our measures and cannot in uenceour results. We also excluded any faults that, at every gran-ularity level, were detected by more than 80% of the testcases; our assumption was that such easily detected faultswould be detected by test engineers during their unit testingof modi�cations (only �ve faults fell into this category). Thenumbers of faults remaining after exclusions, and utilized inthe studies, are reported in Table 3.
3.2.4 Additional InstrumentationTo perform our experiments we required additional in-
strumentation. Our test coverage and control- ow graphinformation was provided by the Aristotle program analysissystem [9] and by the Clic instrumentor and monitor [7].We created test case prioritization, test suite reduction, and
RegressionProgram Version Faults
emp-server 4.2.0 {emp-server 4.2.1 10emp-server 4.2.3 10emp-server 4.2.4 10emp-server 4.2.5 10emp-server 4.2.6 9bash 2.0 {bash 2.01 10bash 2.01.1 9bash 2.02 9bash 2.02.1 4bash 2.03 9
Table 3: Faults per Subject Version.
regression test selection tools implementing the techniquesdescribed in Section 3.1.1.1. We used Unix utilities and di-rect inspection to determine modi�ed functions, or functionsusing modi�ed structures.All emp-server timing-related data was gathered on a Sun
Microsystems Ultra 10 with 256 MB of memory. All bashtiming-related data was gathered on a SunUltra 60 with 512MB of memory. While timing data was being collected, ourtesting processes were the only active user processes on themachines.
3.3 Experiment DesignTo address our hypotheses, we designed three sets of ex-
periments with the same format. Each experiment evalu-ates the hypotheses for regression test selection, test suitereduction, and test case prioritization. In addition, eachexperiment employs blocking and two factors (one for eachindependent variable) with multiple levels to ensure unbi-ased treatment assignment. Table 4 depicts our Random-ized Block Factorial (RBF-22) experiment design, showinghow treatment combinations were applied to subjects. TheRBF-22 design let us investigate the behavior of varioustechniques (TQ) under di�erent test suite granularity levels(G), and let us quantify the impact of test suite granular-ity on the costs and bene�ts of di�erent regression testingtechniques as measured by our dependent variables.
Blocking. The decision to employ program as a blockingcriterion was not obvious because it could have been consid-ered a factor or a block. However, given that our hypothesesaim exclusively at evaluating techniques across di�erent testsuite granularities, we decided to consider program a block.Since we have two programs, we use two blocks under theassumption that the observations within each program willbe more homogeneous than the entire sample set. This useof program as a blocking factor minimizes the impact ofprogram variation on experimental error.
Sample Size. To choose sample size we performed ana-priori study. Given the e�ort involved in preparing sub-ject versions (in retrospect, over 80 hours per version afterestablishment of the initial infrastructure) we wanted to de-tect meaningful e�ects with a minimal number of investedresources. There are several statistical approaches for deter-mining sample size [19], they di�er in terms of the informa-tion they require as input for sample size calculation. Wedecided to determine sample size using an approximationof the di�erence that is worth detecting in the dependentvariables (also known as \D") to distinguish practical dif-
6
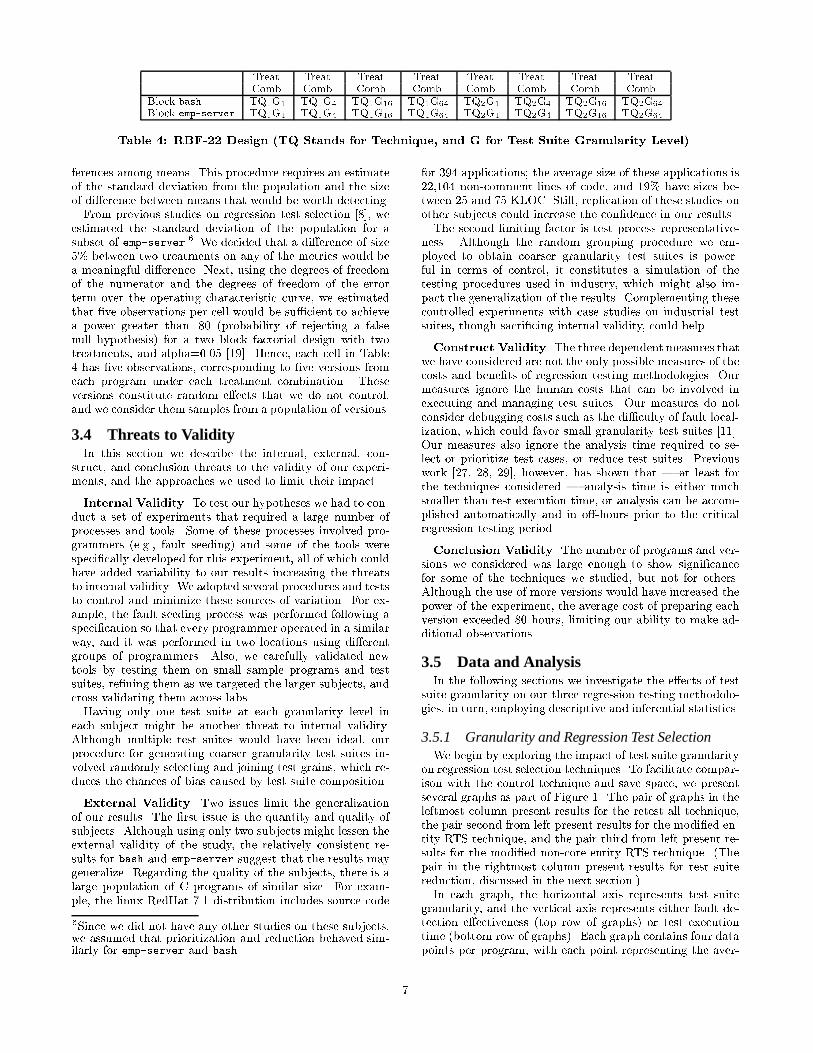
Treat. Treat. Treat. Treat. Treat. Treat. Treat. Treat.Comb. Comb. Comb. Comb. Comb. Comb. Comb. Comb.
Block bash TQ1G1 TQ1G4 TQ1G16 TQ1G64 TQ2G1 TQ2G4 TQ2G16 TQ2G64
Block emp-server TQ1G1 TQ1G4 TQ1G16 TQ1G64 TQ2G1 TQ2G4 TQ2G16 TQ2G64
Table 4: RBF-22 Design (TQ Stands for Technique, and G for Test Suite Granularity Level).
ferences among means. This procedure requires an estimateof the standard deviation from the population and the sizeof di�erence between means that would be worth detecting.From previous studies on regression test selection [8], we
estimated the standard deviation of the population for asubset of emp-server.6 We decided that a di�erence of size5% between two treatments on any of the metrics would bea meaningful di�erence. Next, using the degrees of freedomof the numerator and the degrees of freedom of the errorterm over the operating characteristic curve, we estimatedthat �ve observations per cell would be su�cient to achievea power greater than .80 (probability of rejecting a falsenull hypothesis) for a two block factorial design with twotreatments, and alpha=0.05 [19]. Hence, each cell in Table4 has �ve observations, corresponding to �ve versions fromeach program under each treatment combination. Theseversions constitute random e�ects that we do not control,and we consider them samples from a population of versions.
3.4 Threats to ValidityIn this section we describe the internal, external, con-
struct, and conclusion threats to the validity of our experi-ments, and the approaches we used to limit their impact.
Internal Validity. To test our hypotheses we had to con-duct a set of experiments that required a large number ofprocesses and tools. Some of these processes involved pro-grammers (e.g., fault seeding) and some of the tools werespeci�cally developed for this experiment, all of which couldhave added variability to our results increasing the threatsto internal validity. We adopted several procedures and teststo control and minimize these sources of variation. For ex-ample, the fault seeding process was performed following aspeci�cation so that every programmer operated in a similarway, and it was performed in two locations using di�erentgroups of programmers. Also, we carefully validated newtools by testing them on small sample programs and testsuites, re�ning them as we targeted the larger subjects, andcross validating them across labs.Having only one test suite at each granularity level in
each subject might be another threat to internal validity.Although multiple test suites would have been ideal, ourprocedure for generating coarser granularity test suites in-volved randomly selecting and joining test grains, which re-duces the chances of bias caused by test suite composition.
External Validity. Two issues limit the generalizationof our results. The �rst issue is the quantity and quality ofsubjects. Although using only two subjects might lessen theexternal validity of the study, the relatively consistent re-sults for bash and emp-server suggest that the results maygeneralize. Regarding the quality of the subjects, there is alarge population of C programs of similar size. For exam-ple, the linux RedHat 7.1 distribution includes source code
6Since we did not have any other studies on these subjects,we assumed that prioritization and reduction behaved sim-ilarly for emp-server and bash.
for 394 applications; the average size of these applications is22,104 non-comment lines of code, and 19% have sizes be-tween 25 and 75 KLOC. Still, replication of these studies onother subjects could increase the con�dence in our results.The second limiting factor is test process representative-
ness. Although the random grouping procedure we em-ployed to obtain coarser granularity test suites is power-ful in terms of control, it constitutes a simulation of thetesting procedures used in industry, which might also im-pact the generalization of the results. Complementing thesecontrolled experiments with case studies on industrial testsuites, though sacri�cing internal validity, could help.
Construct Validity. The three dependentmeasures thatwe have considered are not the only possible measures of thecosts and bene�ts of regression testing methodologies. Ourmeasures ignore the human costs that can be involved inexecuting and managing test suites. Our measures do notconsider debugging costs such as the di�culty of fault local-ization, which could favor small granularity test suites [11].Our measures also ignore the analysis time required to se-lect or prioritize test cases, or reduce test suites. Previouswork [27, 28, 29], however, has shown that | at least forthe techniques considered | analysis time is either muchsmaller than test execution time, or analysis can be accom-plished automatically and in o�-hours prior to the criticalregression testing period.
Conclusion Validity. The number of programs and ver-sions we considered was large enough to show signi�cancefor some of the techniques we studied, but not for others.Although the use of more versions would have increased thepower of the experiment, the average cost of preparing eachversion exceeded 80 hours, limiting our ability to make ad-ditional observations.
3.5 Data and AnalysisIn the following sections we investigate the e�ects of test
suite granularity on our three regression testing methodolo-gies, in turn, employing descriptive and inferential statistics.
3.5.1 Granularity and Regression Test SelectionWe begin by exploring the impact of test suite granularity
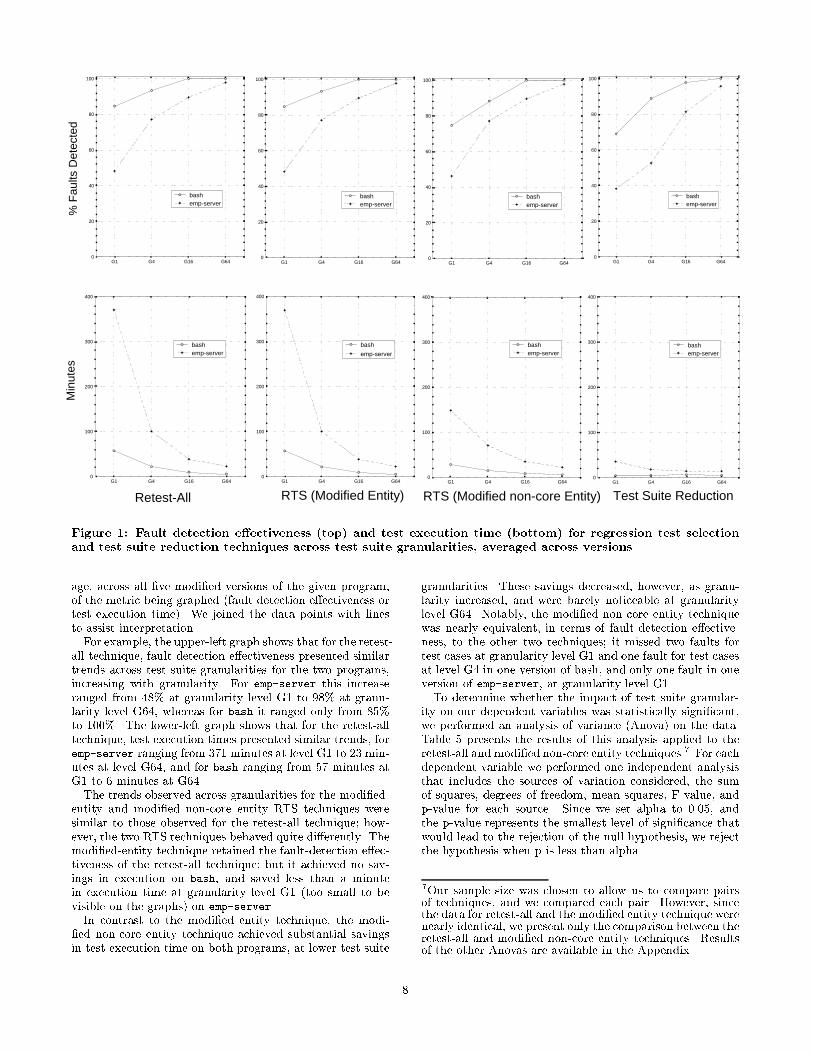
on regression test selection techniques. To facilitate compar-ison with the control technique and save space, we presentseveral graphs as part of Figure 1. The pair of graphs in theleftmost column present results for the retest-all technique,the pair second from left present results for the modi�ed en-tity RTS technique, and the pair third from left present re-sults for the modi�ed non-core entity RTS technique. (Thepair in the rightmost column present results for test suitereduction, discussed in the next section.)In each graph, the horizontal axis represents test suite
granularity, and the vertical axis represents either fault de-tection e�ectiveness (top row of graphs) or test executiontime (bottom row of graphs). Each graph contains four datapoints per program, with each point representing the aver-
7
0
20
40
60
80
100
G1 G4 G16 G64
bash emp-server
0
20
40
60
80
100
G1 G4 G16 G64
bash emp-server
0
20
40
60
80
100
G1 G4 G16 G64
bash emp-server
0
20
40
60
80
100
G1 G4 G16 G64
bash emp-server
0
100
200
300
400
G1 G4 G16 G64
bash emp-server
0
100
200
300
400
G1 G4 G16 G64
bash emp-server
0
100
200
300
400
G1 G4 G16 G64
bash
emp-server
0
100
200
300
400
G1 G4 G16 G64
bash emp-server
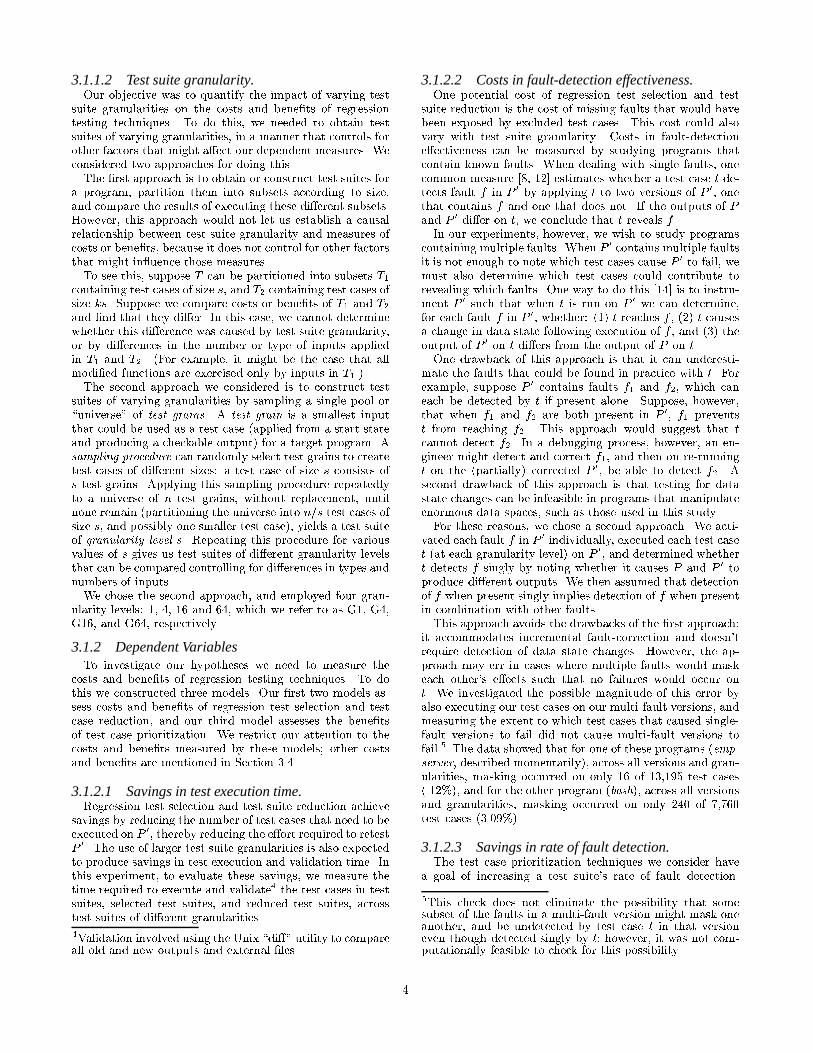
Test Suite ReductionRetest-All RTS (Modified Entity) RTS (Modified non-core Entity)
Min
utes
% F
aults
Det
ecte
d
Figure 1: Fault detection e�ectiveness (top) and test execution time (bottom) for regression test selectionand test suite reduction techniques across test suite granularities, averaged across versions.
age, across all �ve modi�ed versions of the given program,of the metric being graphed (fault detection e�ectiveness ortest execution time). We joined the data points with linesto assist interpretation.For example, the upper-left graph shows that for the retest-
all technique, fault detection e�ectiveness presented similartrends across test suite granularities for the two programs,increasing with granularity. For emp-server this increaseranged from 48% at granularity level G1 to 98% at granu-larity level G64, whereas for bash it ranged only from 85%to 100%. The lower-left graph shows that for the retest-alltechnique, test execution times presented similar trends, foremp-server ranging from 371 minutes at level G1 to 23 min-utes at level G64, and for bash ranging from 57 minutes atG1 to 6 minutes at G64.The trends observed across granularities for the modi�ed-
entity and modi�ed non-core entity RTS techniques weresimilar to those observed for the retest-all technique; how-ever, the two RTS techniques behaved quite di�erently. Themodi�ed-entity technique retained the fault-detection e�ec-tiveness of the retest-all technique; but it achieved no sav-ings in execution on bash, and saved less than a minutein execution time at granularity level G1 (too small to bevisible on the graphs) on emp-server.In contrast to the modi�ed entity technique, the modi-
�ed non-core entity technique achieved substantial savingsin test execution time on both programs, at lower test suite
granularities. These savings decreased, however, as granu-larity increased, and were barely noticeable at granularitylevel G64. Notably, the modi�ed non-core entity techniquewas nearly equivalent, in terms of fault-detection e�ective-ness, to the other two techniques; it missed two faults fortest cases at granularity level G1 and one fault for test casesat level G4 in one version of bash, and only one fault in oneversion of emp-server, at granularity level G1.To determine whether the impact of test suite granular-
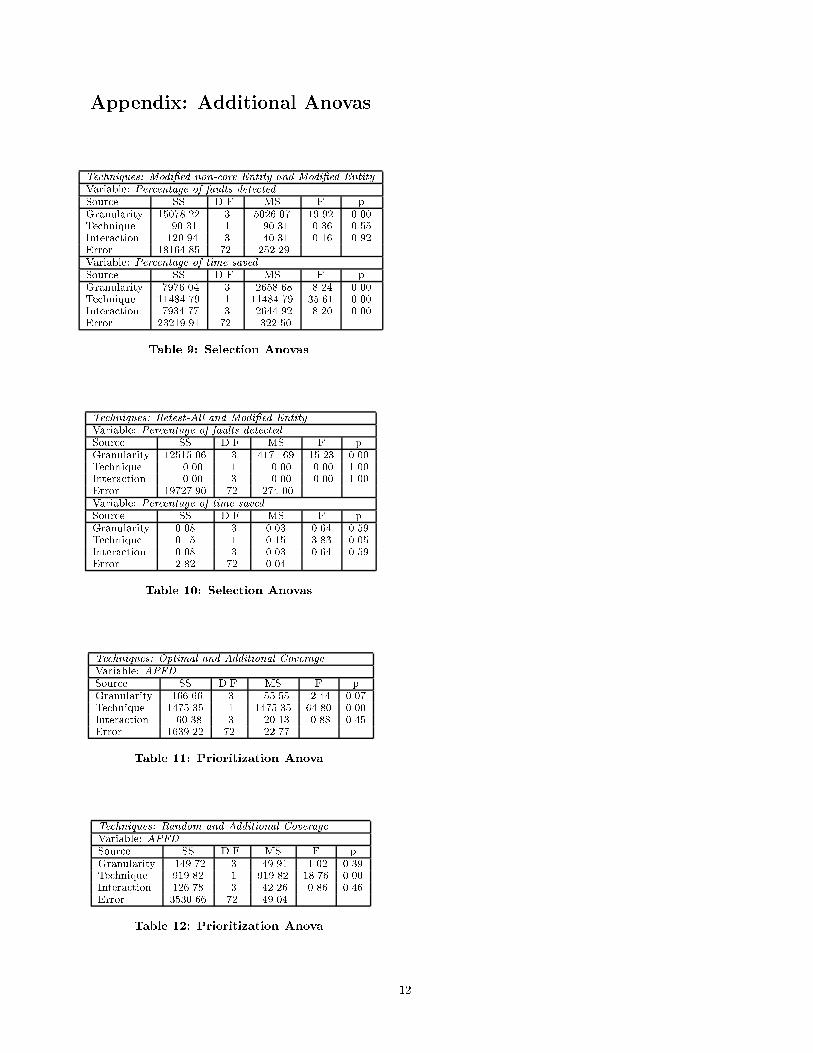
ity on our dependent variables was statistically signi�cant,we performed an analysis of variance (Anova) on the data.Table 5 presents the results of this analysis applied to theretest-all and modi�ed non-core entity techniques.7 For eachdependent variable we performed one independent analysisthat includes the sources of variation considered, the sumof squares, degrees of freedom, mean squares, F value, andp-value for each source. Since we set alpha to 0.05, andthe p-value represents the smallest level of signi�cance thatwould lead to the rejection of the null hypothesis, we rejectthe hypothesis when p is less than alpha.
7Our sample size was chosen to allow us to compare pairsof techniques, and we compared each pair. However, sincethe data for retest-all and the modi�ed entity technique werenearly identical, we present only the comparison between theretest-all and modi�ed non-core entity techniques. Resultsof the other Anovas are available in the Appendix.
8

Techniques: Modi�ed non-core Entity and Retest-all
Variable: Percentage of faults detected.
Source SS D.F. MS F pGranularity 15078.22 3 5026.07 19.92 0.00Technique 90.31 1 90.31 0.36 0.55Interaction 120.94 3 40.31 0.16 0.92Error 18164.85 72 252.29Variable: Percentage of time saved.
Source SS D.F. MS F pGranularity 7955.33 3 2651.78 8.22 0.00Technique 11567.93 1 11567.93 35.87 0.00Interaction 7955.33 3 2651.78 8.22 0.00Error 23217.09 72 322.46
Table 5: Selection Anovas.
The results indicate that test suite granularity signi�-cantly impacted fault-detection e�ectiveness. They also showthat test suite granularity and technique can signi�cantlyimpact savings in execution time. There is also a signi�-cant interaction between technique and test suite granularitywhen evaluating savings, which was expected given that theretest-all technique produced no savings while the modi�ednon-core entity technique saved up to 94% of test suite exe-cution time (at granularity level G1 on emp-server). These�ndings agree with our previous observations and conjec-tures. However, one place we expected signi�cance and didnot �nd it was in the interaction between technique and testsuite granularity on fault detection e�ectiveness.
3.5.2 Granularity and Test Suite ReductionTest suite reduction results were similar to those produced
by regression test selection when exposed to the spectrumof test suite granularities. In the top graph in the right-most column in Figure 1 we again observe similar patterns.In both bash and emp-server, fault-detection e�ectivenessincreased as test suite granularity increased, in a mannersimilar to that observed for the retest-all technique. Foremp-server the increase ranged from 38% at granularitylevel G1 to 96% at granularity level G64, whereas for bashthe increase ranged from 89% to 100%. In the bottom graphin the rightmost column, we also see that savings in testsuite execution time decreased as test suite granularity in-creased. For example, test suite reduction for bash reducedexecution time by 93% at granularity level G1, but by only10% at granularity level G64. It is apparent that as testsuite granularity increased, the e�ectiveness of the reducedtest suite increased, but the opportunities to save throughreduction also decreased.We performed an Anova to further evaluate our conjec-
tures and test our hypotheses. Table 6, which follows thesame structure as the table for regression test selection,presents the results for each dependent measure. The resultsindicate that granularity signi�cantly a�ected both depen-dent measures. In addition, and di�ering from the �ndingsfor RTS techniques, the use of reduction signi�cantly de-creased the number of faults detected.
3.5.3 Granularity and Test Case PrioritizationOur third experiment considered test case prioritization.
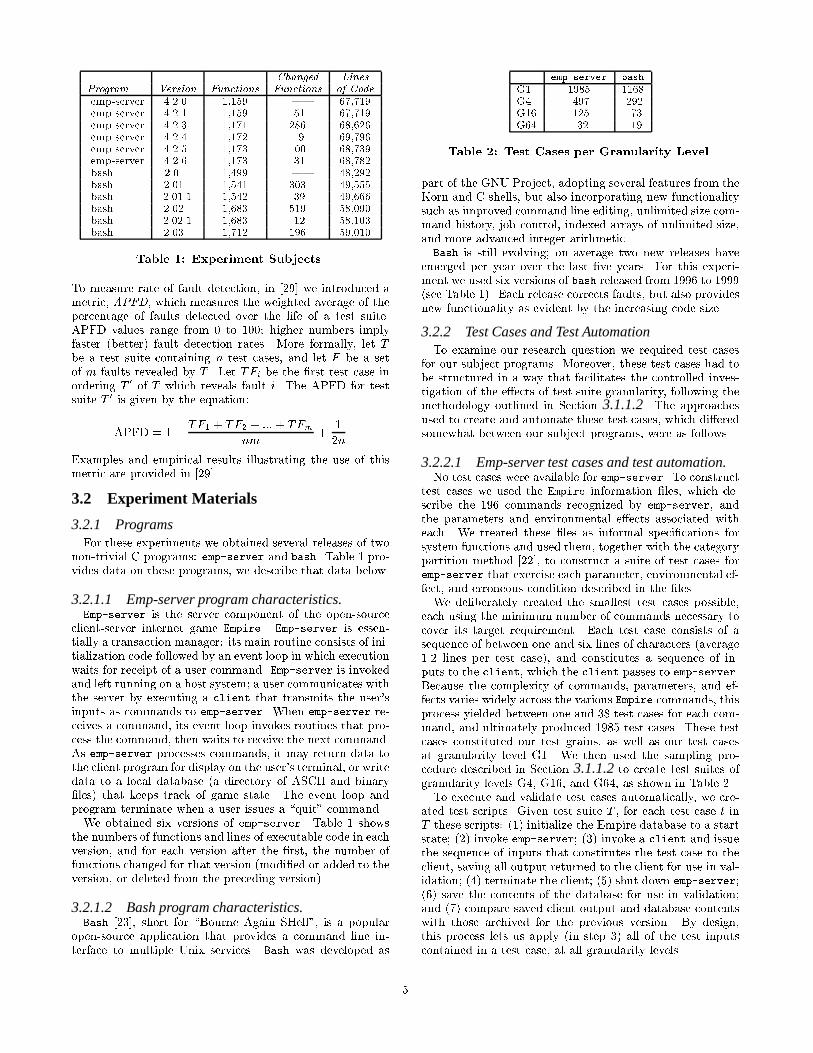
Within this methodology we analyze three techniques: ran-dom prioritization (through retest-all) as a control, and op-timal and additional function coverage prioritization.Figure 2 displays three graphs, one per technique, with
our measure of rate of fault detection, APFD, in the y-axis.
Techniques: Reduction and Retest-all
Variable: Percentage of faults detected.
Source SS D.F. MS F pGranularity 17413.01 3 5804.34 20.30 0.00Technique 1402.81 1 1402.81 4.91 0.03Interaction 605.23 3 201.74 0.71 0.55Error 20589.91 72 285.97Variable: Percentage of time saved.
Source SS D.F. MS F pGranularity 13468.92 3 4489.64 79.49 0.00Technique 74246.06 1 74246.06 1314.52 0.00Interaction 13468.92 3 4489.64 79.49 0.00Error 4066.67 72 56.48
Table 6: Reduction Anovas.
Random (Retest-All)
AP
FD
70
80
90
100
G1 G4 G16 G64
Optimal
G1 G4 G16 G64
Additional Coverage
G1 G4 G16 G64
Bash Empire
Figure 2: APFD for test case prioritization.
Results for both programs were similar under the optimaltechnique: there was a consistent decrease in APFD as testsuite granularity increased. This was what we expected,since having more test cases provides more opportunitiesfor prioritization; still, the di�erences were small. The ran-dom and additional functional coverage techniques, however,presented great variation in results that cannot be explainedbased solely on the increase in granularity.The Anova presented in Table 7 con�rms these observa-
tions relative to optimal and random techniques. (Anovasfor all pairs of techniques are given in the Appendix; we omitthe other two here because they are similar to the one in Ta-ble 7.) The techniques are signi�cantly di�erent. However,we could not reject the hypotheses about test suite granular-ity, or about interaction between techniques and granularity,and their lack of in uence on variations in APFD.
4. DISCUSSIONOur results strongly support our hypothesis that test suite
granularity signi�cantly impacts the cost-e�ectiveness of re-gression testing methodologies (at least, for regression testselection and test suite reduction methodologies). In otherwords: granularity matters. We also rejected our secondnull hypothesis, providing further evidence about the perfor-mance of certain regression testing methodologies and tech-niques. Last, we detected that in most instances, techniquee�ectiveness varies depending on test suite granularity.More important from a practitioner's perspective, how-
ever, are implications for tradeo�s and factors involved whendesigning test suites and choosing granularities. The follow-
9

Techniques: Optimal and Random
Variable: APFD.Source SS D.F. MS F pGranularity 33.19 3 11.06 0.42 0.74Technique 4725.04 1 4725.04 179.10 0.00Interaction 117.55 3 39.18 1.49 0.23Error 1899.48 72 26.38
Table 7: Prioritization Anova.
ing paragraphs address some of these implications, and helpclarify the practical impact of the results (taking into con-sideration the threats to validity discussed in Section 3.4).
Reducing the test suite versus reducing overhead.Coarser granularity can greatly increase the e�ciency of atest suite. For example, increasing granularity from G1 toG4 on the emp-server test suite saved an average of 270minutes (73% time reduction). Finer granularity, however, isclearly more supportive of regression test selection and testsuite reduction, since the e�ectiveness of these techniquesdiminishes as granularity increases. This tendency was evi-dent for both programs (see Figure 1). For example, whenthe modi�ed non-core entity RTS technique was applied tothe G1 suite of emp-server, the suite's average executiontime was reduced from 371 to 149 minutes (60% time re-duction). When the same technique was applied to the G64suite for emp-server, the average savings were less than 2%.Hence, �ner granularity provides greater exibility throughlarger numbers of small test cases that can be successfullymanipulated by RTS and test suite reduction techniques toreduce the number of test cases to be executed.Even when RTS and test suite reduction methodologies
can save signi�cant execution time, however, increasing testsuite granularity by joining small test cases might be prefer-able to employing such methodologies. When test suite re-duction was applied to the G1 test suite for bash, three outof �ve versions required less retesting time than their cor-responding versions under G64 test suites. On the otherhand, the savings obtained by applying test suite reductionto the emp-server G1 test suites were less than the savingsgenerated by using level G64 suites, independent of version.These di�erences can be attributed to the amount of over-head in test suite execution required for each program. Inour experiments, the savings generated by increases in gran-ularity resulted primarily from reduction in the overheadassociated with test setup and cleanup. (In other cases,another factor in overhead might be the cost of human in-tervention.) Test suites with larger granularity had fewertest cases, which reduced the overall overhead of the suite;this e�ect was more profound for emp-server, whose testcases carried more overhead than the bash test cases.Note, however, the other side of the tradeo�: test suites
with low overhead are not likely to yield time savings throughincreases in granularity. For such suites, potential savingsthrough RTS or reduction may become the dominant factorin choosing granularity.
Diminishing returns of granularity increases. Evenwhen �ner granularity turns out to be better from an RTSor test suite reduction perspective, smaller test cases mightnot be as e�ective at detecting faults as larger ones. Largertest cases usually cover more code and, in our experiments,were more likely to execute faulty functions and to exposefaults. Table 8 lists the total number of faults missed at each
Undetected Faults Avg. Faults Detected per Test
emp-server bash emp-server bashG1 27 7 1.09 2.02G4 12 3 1.16 2.08G16 3 0 1.45 2.80G64 0 0 2.89 4.52
Table 8: Fault Detection E�ectiveness.
granularity for each program, and the average number offaults detected per test for retest-all. Clearly, fault detectione�ectiveness increases with granularity.However, although increases in granularity provide greater
fault detection e�ectiveness, there seems to be a point of di-minishing returns at which granularity increments don't pro-vide additional power. Furthermore, the e�ectiveness gainsseem to become smaller in spite of our exponential granu-larity increments. In our experiments, bash test suites G16and G64 detected the same numbers of faults, and only twoversions of emp-server presented di�erences in fault detec-tion between G16 and G64. The same argument applies tosavings in execution time: there is a point of diminishingreturns at which increasing granularity does not result insigni�cant time savings.
Change characteristics and granularity. In our ex-periments we also discovered that fault location and likeli-hood of execution had an impact on the methodologies.First, we found that the number of test cases through
changed functions can greatly impact fault detection e�ec-tiveness. For example, on the bash G1 test suite, missedfaults were located in functions executed by an average of3% of the test cases, while exposed faults were located infunctions executed by an average of 66% of the test cases.This di�erence can be overcome, however, if the test casesexecuting changed functions are e�ective at exposing faults.For example, on the emp-server G1 test suite, fewer than2% of the test cases execute changed functions, but 26% ofthem expose faults.Second, the percentage of changes located in core func-
tionality impacts the e�ectiveness of RTS techniques. Forexample, for the G1 test suite on version 4 of bash, modi-�ed entity selection included all tests cases, while modi�ednon-core entity selection included only 3% of the test cases.
Unresolved issues and opportunities. Several ques-tions remain unanswered and new questions have emergedas a result of these experiments. First, we must be sensitiveto the existence of metrics that capture other meaningfulattributes impacted by test suite granularity. For example,test suites with �ner granularity might facilitate fault local-ization. Our metrics do not re ect all possible impacts.Second, we cannot fully explain the prioritization results
and we realize that there are factors a�ecting variation inrate of fault detection that we are not capturing. Althoughwe corroborated previous studies by providing additionalempirical evidence about the potential of prioritization tech-niques in general, our expectation of greater APFD for �nergranularities was true only for optimal prioritization.Third, the greater fault detection e�ectiveness of coarser
granularity test suites might be attributed (at least in part)to the execution of additional code which causes data statechanges occurring in earlier stages of execution to be visible.It might be that smaller granularity test suites could be moree�ective if they were equipped with the right observers.
10

5. CONCLUSIONWriters of testing textbooks have long shown awareness
that test suite granularity can a�ect the cost-e�ectivenessof testing. These e�ects can begin when testing the initialrelease of a system: success in �nding faults in that release,as well as the amount of testing that can be accomplished,can vary based on test suite granularity. However, successfulsoftware evolves: the costs of testing that software are com-pounded over its lifecycle, and the opportunity to miss faultsthrough inadequate regression testing occurs with each newrelease. It is therefore imperative to study the e�ects of testsuite design across the entire software lifecycle.Several test suite design factors, such as test suite size and
adequacy criteria, have been empirically studied, but fewhave been studied with respect to evolving software. Sev-eral regression testing methodologies have been empiricallystudied, but few with respect to issues in test suite design.This paper brings the empirical study of test suite designand regression testing methodologies together, focusing ona particular design factor: test suite granularity. Our resultshighlight cost-bene�ts tradeo�s associated with granularity,and lay the groundwork for further empirical study.We are continuing this family of experiments. We plan to
obtain and create additional subject infrastructure, to ex-periment with wider samples of faulty versions, regressiontesting techniques, and test suite granularities, and to ex-tend our measures to incorporate other cost-bene�ts factors.We also plan to consider the use of other groupings of testinputs. We then hope to use the data and results obtainedto provide guidelines that will help practitioners design testsuites that can be used more e�ciently and e�ectively acrossthe entire lifecycle of evolving systems.
ACKNOWLEDGEMENTSThis work was supported by the NSF Information Tech-nology Research program under Awards CCR-0080898 andCCR-0080900 to University of Nebraska, Lincoln and Ore-gon State University, and by NSF Awards CCR-9703108and CCR-9707792 to Oregon State University. We thankXuemei Qiu, Satya Kanduri, and Srikanth Karre for helpingprepare the emp-server and bash subjects.
REFERENCES[1] J. Bach. Useful features of a test automation system (part
iii). Testing Techniques Newsletter, Oct. 1996.[2] B. Beizer. Black-Box Testing. John Wiley and Sons, New
York, NY, 1995.[3] R. Binder. Testing Object-Oriented Systems. Addison Wes-
ley, Reading, MA, 2000.[4] T. Chen and M. Lau. Dividing strategies for the optimization
of a test suite. Info. Proc. Let., 60(3):135{141, Mar. 1996.[5] Y. Chen, D. Rosenblum, and K. Vo. TestTube: A system for
selective regression testing. In Proc. 16th Int'l. Conf. Softw.Eng., pages 211{220, May 1994.
[6] S. Elbaum, A. Malishevsky, and G. Rothermel. Prioritizingtest cases for regression testing. In Proc. Int'l. Symp. Softw.Testing and Analysis, pages 102{112, Aug. 2000.
[7] S. Elbaum, J. Munson, and M. Harrison. CLIC: A tool for themeasurement of software system dynamics. In SETL Tech-nical Report - TR-98-04., 04 1998.
[8] T. Graves, M. Harrold, J.-M. Kim, A. Porter, and G. Rother-mel. An empirical study of regression test selection tech-niques. In Proc. 20th Int'l. Conf. Softw. Eng., pages 188{197, Apr. 1998.
[9] M. Harrold and G. Rothermel. Aristotle: A system for re-search on and development of program analysis based tools.Technical Report OSU-CISRC- 3/97-TR17, Ohio State Uni-versity, Mar 1997.
[10] M. J. Harrold, R. Gupta, and M. L. So�a. A methodologyfor controlling the size of a test suite. ACM Trans. Softw.Eng. and Meth., 2(3):270{285, July 1993.
[11] R. Hildebrandt and A. Zeller. Minimizing failure-inducinginput. In Proc. Int'l. Symp. Softw. Testing and Analysis,pages 135{145, Aug. 2000.
[12] M. Hutchins, H. Foster, T. Goradia, and T. Ostrand. Experi-ments on the e�ectiveness of data ow- and control ow-basedtest adequacy criteria. In Proc. Int'l. Conf. on Softw. Eng.,pages 191{200, May 1994.
[13] C. Kaner, J. Falk, and H. Q. Nguyeen. Testing ComputerSoftware. Wiley and Sons, New York, 1999.
[14] J.-M. Kim, A. Porter, and G. Rothermel. An empirical studyof regression test application frequency. In Proc. 22nd Int'l.Conf. Softw. Eng., pages 126{135, June 2000.
[15] E. Kit. Software Testing in the Real World. Addison-Wesley,Reading, MA, 1995.
[16] H. Leung and L. White. Insights into regression testing. InProc. Conf. Softw. Maint., pages 60{69, Oct. 1989.
[17] H. Leung and L. White. A study of integration testing andsoftware regression at the integration level. In Proc. Conf.Softw. Maint., pages 290{300, Nov. 1990.
[18] D. Libes. Exploring Expect: A Tcl-Based Toolkit for Au-tomating Interactive Programs. O'Reilly & Associates, Inc.,Sebastopol, CA, Nov. 1996.
[19] D. C. Montgomery. Design and Analysis of Experiments.John Wiley and Sons, New York, fourth edition, 1997.
[20] J. O�utt, J. Pan, and J. M. Voas. Procedures for reducingthe size of coverage-based test sets. In Proc. Twelfth Int'l.Conf. Testing Computer Softw., pages 111{123, June 1995.
[21] K. Onoma, W.-T. Tsai, M. Poonawala, and H. Suganuma.Regression testing in an industrial environment. Comm.ACM, 41(5):81{86, May 1988.
[22] T. Ostrand and M. Balcer. The category-partition methodfor specifying and generating functional tests. Comm. ACM,31(6), June 1988.
[23] C. Ramey and B. Fox. Bash Reference Manual.O'ReillyO'Reilly & Associates, Inc., Sebastopol, CA,2.2 edition, 1998.
[24] G. Rothermel and M. Harrold. Analyzing regression test se-lection techniques. IEEE Trans. Softw. Eng., 22(8):529{551,Aug. 1996.
[25] G. Rothermel and M. Harrold. A safe, e�cient regressiontest selection technique. ACM Trans. Softw. Eng. Meth.,6(2):173{210, Apr. 1997.
[26] G. Rothermel, M. Harrold, and J. Dedhia. Regression testselection for C++ programs. J. Softw. Testing, Verif., Rel.,10(2), June 2000.
[27] G. Rothermel, M. Harrold, J. Ostrin, and C. Hong. An em-pirical study of the e�ects of minimization on the fault de-tection capabilities of test suites. In Proc. Int'l. Conf. Softw.Maint., pages 34{43, Nov. 1998.
[28] G. Rothermel and M. J. Harrold. Empirical studies of a saferegression test selection technique. IEEE Trans. Softw. Eng.,24(6):401{419, June 1998.
[29] G. Rothermel, R. Untch, C. Chu, and M. Harrold. Test caseprioritization. IEEE Trans. Softw. Eng., Oct. 2001.
[30] W. Wong, J. Horgan, S. London, and H. Agrawal. A study ofe�ective regression testing in practice. In Proc. Eighth Intl.Symp. Softw. Rel. Engr., pages 230{238, Nov. 1997.
[31] W. E. Wong, J. R. Horgan, S. London, and A. P. Mathur. Ef-fect of test set minimization on fault detection e�ectiveness.Softw. Pract. and Exp., 28(4):347{369, Apr. 1998.
11
Appendix: Additional Anovas
Techniques: Modi�ed non-core Entity and Modi�ed Entity
Variable: Percentage of faults detected.
Source SS D.F. MS F pGranularity 15078.22 3 5026.07 19.92 0.00Technique 90.31 1 90.31 0.36 0.55Interaction 120.94 3 40.31 0.16 0.92Error 18164.85 72 252.29Variable: Percentage of time saved.
Source SS D.F. MS F pGranularity 7976.04 3 2658.68 8.24 0.00Technique 11484.79 1 11484.79 35.61 0.00Interaction 7934.77 3 2644.92 8.20 0.00Error 23219.91 72 322.50
Table 9: Selection Anovas.
Techniques: Retest-All and Modi�ed Entity
Variable: Percentage of faults detected.
Source SS D.F. MS F pGranularity 12515.06 3 4171.69 15.23 0.00Technique 0.00 1 0.00 0.00 1.00Interaction 0.00 3 0.00 0.00 1.00Error 19727.90 72 274.00Variable: Percentage of time saved.
Source SS D.F. MS F pGranularity 0.08 3 0.03 0.64 0.59Technique 0.15 1 0.15 3.83 0.05Interaction 0.08 3 0.03 0.64 0.59Error 2.82 72 0.04
Table 10: Selection Anovas.
Techniques: Optimal and Additional Coverage
Variable: APFD.Source SS D.F. MS F pGranularity 166.66 3 55.55 2.44 0.07Technique 1475.35 1 1475.35 64.80 0.00Interaction 60.38 3 20.13 0.88 0.45Error 1639.22 72 22.77
Table 11: Prioritization Anova.
Techniques: Random and Additional Coverage
Variable: APFD.Source SS D.F. MS F pGranularity 149.72 3 49.91 1.02 0.39Technique 919.82 1 919.82 18.76 0.00Interaction 126.78 3 42.26 0.86 0.46Error 3530.66 72 49.04
Table 12: Prioritization Anova.
12