Embed Size (px)
Citation preview

THE IMPACT OF STORE IMAGE ON BRAND LOYALTY AMONG THAI
CUSTOMERS TO USE THE SERVICE OF JAPANESE RESTAURANT IN
BANGKOK DISTRICT
THE IMPACT OF STORE IMAGE ON BRAND LOYALTY AMONG THAI
CUSTOMERS TO USE THE SERVICE OF JAPANESE RESTAURANT IN
BANGKOK DISTRICT
Guanhao Huang
This Independent Study Manuscript Presented to
The Graduate School of Bangkok University
In Partial Fulfillment
Of the Requirements for the Degree
Master of Business Administration
2017

© 2017
Guanhao Huang
All Right Reserved
Guanhao, H. M.B.A.,April 2017,Graduate school, Bangkok University
The Impact of Store Image on Brand Loyalty Among Thai Customers to Use the
Service of Japanese Restaurant in Bangkok District (42 pp.)
Advisor: Asst. Prof. Kasemson Pipatsirisak, D.B.A.
ABSTRACT
The purposes of this study were to investigate the effect of store image to Thai
customer’s attitudinal and behavioral brand loyalty toward Japanese restaurants in
Bangkok. The 218 samples were randomly selected from Thai customers who ever
used the services of Japanese restaurants in Bangkok. The quantitative research was
applied by using questionnaire: The reliability with the value of 0.889 and content
validity conducted by the specialized scholar were implemented. The frequency:
Means, standard deviation, and Multiple Regression Analysis were applied as the
statistical instrument for data analysis and hypothesis testing at 0.05 of significant
level.
The research results were found that the store image in terms of product and
price significantly affected the attitudinal brand loyalty while the store image in term
of product, price, and promotion significantly affected the behavioral brand loyalty.
Keywords: Store image, Brand loyalty, Japanese restaurant.

v
ACKONWLEDGEMENT
There are many people involved in the process of this Independent Study and
motivated the author to make this academic work more achieved.
First, I am grateful to my kind of advisor, Asst. Prof. Dr. Kasemson Pipatsirisak
who has encouraged, guided and gave comments on this study. It will not be possible
for me to work on my own on this Study and I’m really grateful and thankful for all
the valuable discussion I had with my advisor.
Second, I would like to express my unreserved thanks to my dear family and
friends in the course of this study, all of motivations, stood beside me and offer their
knowledge and support.
vi
TABLE OF CONTENTS
Page
ABSTRACT…………………………………………………………………………..iv
ACKNOWLEDGEMENT………………………………………………………….....v
LIST OF TABLES…………………………..……………………..………………..viii
LIST OF FIGURES……………………………………………………………………x
CHAPTER 1: INTRODUCTION…………………………………………………......1
1.1 Background of Study…….…….……...……………………………1
1.2 Purpose of Study….…………….…...……………………………...2
1.3 Contribution of Study……………………………………………....2
CHAPTER 2: LITERATURE REVIEW……………………………………………...4
2.1 Store Image………………………………………………………...4
2.1.1 Product ……..……………….….………..…………………..6
2.1.2 Price………….….……………………………………………6
2.1.3 Saftiness……....….............……..…………………………….7
2.1.4 Promotion………………..…...……………………………....7
2.1.5 Location……………………..…...……………………….…..8
2.2 Brand Loyalty……………………………………………………...9
2.2.1 Attitudinal Brand Loyalty………….…..…………………...10
2.2.2 Behavioral Brand Loyalty………….……..………………...11
2.3 Hypotheses……………..……….……………………………..….11
2.4 Framework of Study……..…………………………………….....11
CHAPTER 3: METHODOLOGY……………….………..………………………....13
3.1 Research Strategy…..………………....…………………………..13
3.2 Sampling Design………..……………....………………………...13
3.2.1 Population…………..………………………………………13
3.2.2 Sample and Samplings Technique……….…………………13
3.3 Research Instrument……………………....………………………15
3.4 Reliability…………………………………………………………19
3.5 Content Validity…………………...……………………………...20
3.6 Statistics for Data Analysis……………………………………….20
vii
TABLE OF CONTENTS (Continued)
Page
CHAPTER 4: RESEARCH FINDINGS AND DATA ANALYSIS…………..…….22
4.1 Symbol used for Data Analysis…….……..……………………...22
4.2 The Analysis of Demographic Data of Sample……..……….…...23
4.3 The analysis of Japanese Restaurants Store Image……..…….….26
4.4 The Analysis of Brand Loyalty……………………………...…...28
4.5 The Analysis of Hypothesis Testing……………………..……....30
CHAPTER 5: DISCUSSION AND RECOMMENDATION………………………..32
5.1 Discussion………………………………………………………...32
5.2 Recommendation of Managerial Implementation………………...32
5.3 Recommendation for Future Research…………………………....33
BIBLIOGRAPHY………………………………………………………………...….34
APPENDIX……………………………………………………………………...…...39
BIODATA………………………………………………………………….……..….42
LICENSE AGEREEMENT………………………………………………………….43
viii
LISTS OF TABLES
Page
Table 1.1: The transactions of Japanese restaurants operating in Bangkok……...……1
Table 3.1: Demographic Variables………………………………………...……...….15
Table 3.2: Criteria of Reliability Interpretation…………………………………...….19
Table 3.3: The Result of Cronbach's Alpha Test with 40 Try-out Questionnaires…..20
Table 3.4: The Result of Cronbach's Alpha Test with 218 Questionnaires……….…20
Table 3.5: Statistic for Data Analysis used for Hypothesis Analyzing Process……...21
Table 4.1: Frequency and Percentage of Demographic Data classified by Gender….23
Table 4.2: Frequency and Percentage of Demographic Data classified by Age……..23
Table 4.3: Frequency and Percentage of Demographic Data classified by
Occupation…….……………..........…….…………...…….…………….24
Table 4.4: Frequency and Percentage of Demographic Data classified by Education
Level……………..…………………………………………………......24
Table 4.5: Frequency and Percentage of Demographic Data classified by Monthly
Income……………………………………………………………………25
Table 4.6: Frequency and Percentage of Demographic Data classified by Frequency of
using Japanese restaurant…………………………………………………25
Table 4.7: Mean (¯X) and Standard deviation (S.D.) of Japanese restaurant store
image in Bangkok District (n=218)…………………...……...…………...26
Table 4.8: Mean (¯X) and Standard deviation (S.D.) of brand loyalty on Japanese
restaurant in Bangkok District (n=357)……………………………..……29
Table 4.9: The effect of store image to attitudinal brand loyalty toward Japanese
restaurant in Bangkok District……………………………………………30
ix
LISTS OF TABLES (Continued)
Page
Table 4.10: The effect of store image to behavioral brand loyalty toward Japanese
restaurant in Bangkok District……………..……..……………..……31
x
LIST OF FIGURES
Page
Figure 2.1: The relationship between store image and brand loyalty……………..…12
1
CHAPTER 1
INTRODUCTION
1.1 Background of Study
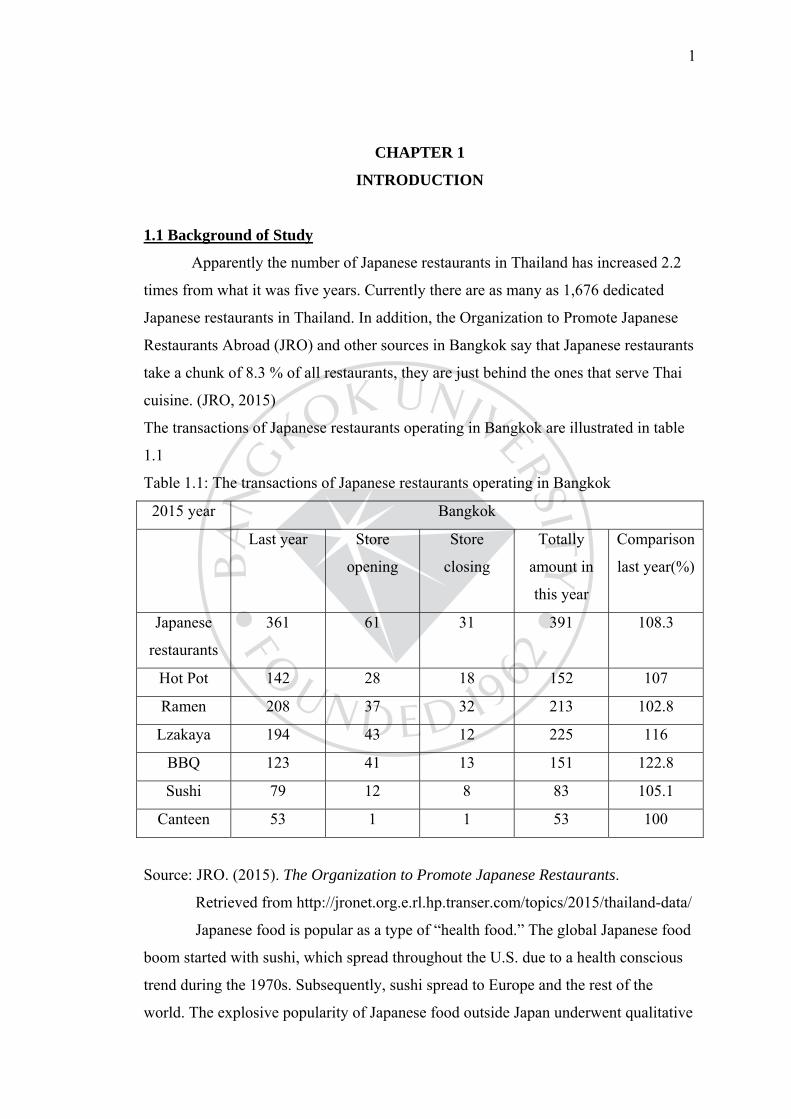
Apparently the number of Japanese restaurants in Thailand has increased 2.2
times from what it was five years. Currently there are as many as 1,676 dedicated
Japanese restaurants in Thailand. In addition, the Organization to Promote Japanese
Restaurants Abroad (JRO) and other sources in Bangkok say that Japanese restaurants
take a chunk of 8.3 % of all restaurants, they are just behind the ones that serve Thai
cuisine. (JRO, 2015)
The transactions of Japanese restaurants operating in Bangkok are illustrated in table
1.1
Table 1.1: The transactions of Japanese restaurants operating in Bangkok
2015 year Bangkok
Last year Store
opening
Store
closing
Totally
amount in
this year
Comparison
last year(%)
Japanese
restaurants
361 61 31 391 108.3
Hot Pot 142 28 18 152 107
Ramen 208 37 32 213 102.8
Lzakaya 194 43 12 225 116
BBQ 123 41 13 151 122.8
Sushi 79 12 8 83 105.1
Canteen 53 1 1 53 100
Source: JRO. (2015). The Organization to Promote Japanese Restaurants.
Retrieved from http://jronet.org.e.rl.hp.transer.com/topics/2015/thailand-data/
Japanese food is popular as a type of “health food.” The global Japanese food
boom started with sushi, which spread throughout the U.S. due to a health conscious
trend during the 1970s. Subsequently, sushi spread to Europe and the rest of the
world. The explosive popularity of Japanese food outside Japan underwent qualitative
2
changes over time, and eventually people began to demand more “realistic” Japanese
food.
In Thailand more and more people would like to go to Japanese restaurants
so the market of the Japanese restaurant will be keep growth therefore it is
questionable to understand why Thai people like to eat Japanese food. Even though
Thailand has a varieties of culture cuisines.
Many researcher revealed that there are many factors affecting consumer decision to
buy products or services. Those would be marketing mixes : store image , brand
loyalty. At the same time, they also studied about why people came to use the same
products or the same service again and again. According to this concern, it is very
interesting to understand why Thai people always come to use the service of Japanese
restaurant again.
The research of study is interested to come by this study in terms of the
relationship between store image and brand loyalty in order to answer the questions
above. The result of this study will be useful for the owners of Japanese restaurants in
Bangkok to develop their store image strategies to maintain and increase the Thai
customers for ever.
1.2 Purposes of Study
The purposes of this study are as follows:
1. To investigate the effect of store image to Thai customer’s attitudinal brand loyalty
toward Japanese restaurants in Bangkok
2. To investigate the effect of store image to Thai customer’s behavioral brand loyalty
toward Japanese restaurants in Bangkok
1.3 Contribution of Study
Expectedly, this research will be useful for the following stakeholders
including:
1. Japanese restaurant owner and management. This study will provide them
the guideline to develop their strategies for creating and maintaining Thai customers
in this competitive period of restaurant industry in Bangkok.
3
2. Academicians and persons who are interested in conducting the further
research about Japanese restaurants and their operations. The results of their study
will enhance the conceptual framework of marketing model that will be helpful to
better understand how the marking mixes should be adapt for creating customer brand
loyalty among Japanese restaurants in Bangkok.
4
CHAPTER 2
LITERTURE REVIEW
The reviews of related contents about dependent and independent variables are
discussed as follows:
2.1 Store Image
Store image is the perceived functions and symbolic association in the mind of
customers Salciuviene (2009). According to them a product functional attribute is
tangible excellence of a brand on performing certain technical functionality in high
standard and symbolical brand attribute refers intangible benefits offered by brand
such as self-image and status.
Many conceptualizations of store image have been advanced in the past Doyle
and Fenwick (1974), James (1976), Kunkel (1968), Marks (1976). The dominant
attitudinal perspective that is taken in the literature treats store image as the result of a
multi-attribute model Marks (1976), James (1976). Image is expressed as a function
of the salient attributes of a particular store that are evaluated and weighted against
each other. Therefore, we prefer to define store image as:
Over the years, different authors have distinguished different store attributes
or characteristics that are part of the overall image towards the store (the so-called
retail mix). For example, Lindquist (1974). In his study on the store image literature,
has combined models from 19 studies and came up with nine different elements:
merchandise, service, clientele, physical facilities, comfort, promotion, store
atmosphere, institutional and post-transaction satisfaction.
Doyle, & Fenwick (1974). distinguished only five elements: product, price,
assortment, styling and location. Bearden (1977). suggested the following
characteristics: price, quality of the merchandise, assortment, atmosphere, location,
parking facilities and friendly personnel. More recently, store image is supposed to be
composed of the different elements of the retail marketing mix as introduced by
Ghosh (1990). These eight elements are: location, merchandise, store atmosphere,
customer service, price, advertising, personal selling and sales incentive programs.
For each retail store a distinct image may exist within consumers’ minds. This is
based on the salient elements of the retail mix. The merchandise of a retailer is its
most important retail mix element, Ghosh (1990). A retailer has to make sure that
5
he/she offers those products to his/her customers that they expect him/her to offer.
Nevertheless, other nonfunctional elements also have to be in line with the
expectations of the customer in order for a customer to become store loyal Ghosh
(1990).
For consumers in mature countries, store image are perceived as genuine
brands, with their attributes of awareness and image always combined with an
attractive price. This is because many stores currently offer a portfolio of distributor
brands with a capacity for customer attraction and a quality comparable to
manufacturer’s brands Olle, & Riu (2009). From a managerial point of view store
brands are, broadly speaking, brands like any other thinking of a particular target,
defining an offer and price, setting themselves up with packaging and communication.
However, they are subject to two important limitations Kapferer (2008). (1) their
image positioning is based on that of the store and (2) they generally use price as the
driving force behind their own marketing mix, even when, exceptionally they are
positioned in a premium segment. This suggests that the store’s autonomy in
influencing its distributor brand equity is limited, to a large extent, by store image and
price, underscoring how important these variables are from the perspective of
managing store brand equity.
Dick (1995) observed that the store image acts as an important indicator of
store brand quality. Store image is reflected in the store’s physical environment
Richardson (1996). perceptions related to its merchandise, and perceived service
quality Baker (1994). Zimmer, & Golden (1988). Consumers use these cues to form
an overall evaluation that will affect their attitude toward the store as a whole, and
potentially towards its store brands. This could explain why store brands outperform
manufacturer branded products in some cases. Examples are Harrods with its
premium brands, Sainsbury and Tesco with relatively cheap, high-quality product
lines, and Aldi with its ‘no-frills’ stores and a clear focus on basic products at a low
price Fitzell (1992). A store’s image does not only serve as a direct indicator of store
brand quality, but also as a risk reliever Mitchell, & Greatorex (1993). Mitchell, & Mc
Goldrick(1996). The relationship between store image and consumer attitude to a
store-branded product can thus be modeled as a mediated relationship. The
relationship is mediated by the risk perception, because the risk perception itself is
6
affected by the quality perception of the store Baron and Kenny (1986), MacKinnon
(1995),Venkatraman (1990).
2.1.1 Product
Anything that offer to market to get some attention, acquisition, or
consumption including physical objects, services, personalities, organizations and
desires Drummond, & Enor (2005). It was also said that product was several things
such as goods, services, or ideas that offering for the satisfaction of consumer,
includes needs and requirements Sharma (2008). According to Satit (2012) on his
study about the relationship between marketing mix and customer decision-making,
he found that product was one of the strongest predictors for high levels of purchase
intention and repeat buying at the final, those perceptions are high product quality and
high customer satisfaction. Another researcher such as Muzondo, & Mutandwa (2011)
found that product has a significant influence towards consumer choice of store for
main grocery shopping.
Moreover, Brown (2007) suggested that in designing the product, the
restaurant business should describe their products and services. The business plan
will first of all help to develop your niche – the thing that makes their products and
services unique, special and the best in the market. In a restaurant business the owners
should recognize about their services, including dining style and service levels, and
clarified how these factors will affect the product quality and their advantage against
their competitors. In addition Walker (2008) also recommended about the menu of
product. He suggested that menu was the most vital part when planning the restaurant.
The restaurant owner or manager should have to take into account the needs and
desires of guests, capability of cooks as well as availability of the ingredients. The
simpler the menu, the less the owners needed capability and consistency. However, a
narrow set of options made the menu even more crucial to plan carefully.
2.1.2 Price
Price referred to amount of money that has to pay by consumer to get
the product or service Sharma (2008), Jain (2013). also explained that price was an
element that affecting the volume of sales and includes determining pricing objectives
7
and policies, price fixation, discount policy, credit policy. According to Sati, &
Sukati(2012), price was one of marketing mix elements which affected customer
buying decision the most, as the result of their research, the business can retain
existing customers by offering and attractive and competitive price, and by giving
special discounts. Ahmetoglu, & Furnham (2010 ) on their research ‘Pricing
Practices: Their Effects on Consumer Behavior and Welfare’ found that price gives a
significance influence on customer’s purchase intention, especially the reference price
which affecting the most while customers are not readily able to comparing with other
brands.
2.1.3 Saftiness
The latest data from the Centers for Disease Control and Prevention
(CDC) indicates that millions of people were suffered from food poisonings or low
quality May (2004). The causes of that situation came from the process of food
production of the owners or manufacturers including the restaurants and food retail
restaurants.
Nowadays, the issue of food safety was very critized among food restaurants
as mentioned about its effects. CDC (2012) mentioned that small businesses might not
have nutritious safety and health professionals on customers, yet they could reduce
sickness risks by obtaining health safety and health information with adopting good
practices to the process of food production
Regarding the concept of product characteristics, Kotler (2012). explained that
product characteristics of any kinds of products that satisfied the consumer’s
expectations, would be accepted by the customers for the next purchase. It could be
implied that the safety food would be also accepted by the customers of food
restaurants in the same way.
2.1.4 Promotion
Scott (2002) explained that promotion was presented the best significantly
core factor in marketing mix and tools of market operation, another finding shows that
promotion including many kinds of incentive tools which were get used to encourage
customer or commercial business company used to improve their merchandises, even
8
once they would like to exploit it to ascend their volumes of sales Kolter, & Armsrong
(2010). since that promotion turned out to be one of factors influencing clients
selection, many researchers and marketing managers would manage to explore it,
even though many precedent researcher almost concerned on how promotion affect
consumer behavior or purchase decision.
Kotler (2012) defined that promotion decision must be integrated and co-
ordinated with the marketing mix particularly product/brand decision, so that it may
effectively support an entire marketing mix strategy. The examples of promotion will
be advertising, sales promotion, such as member card and coupon, including
marketing communication are the elements of the promotion.
Wells (2012) explained that advertising may be defined as the process of
buying sponsor-identified media space or time in order to promote a product or an
idea. Each advertisement is a specific communication that must be effective, not just
for one customer, but for many target buyers. While sale promotion is the most
effective tools of promotion.
It is presently found that sales promotion is very famous among many
businesses to use it, as a tool to encourage customers to buy the products as quickly as
possible.
However, Aaker (1991) summarized that the roles of promotion can be
explained in many aspects including:
1. Promotion can encourage the customer decision to buy products and
services.
2. Promotion can switch the customer decision to buy new products and
services.
3. Promotion can maintain customer relationship with business owner in term
of brand loyalty. That means promotion is positioned itself in customer’s attitudes and
behavior to visit a company again.
2.1.5 Location
According to Erkan (2011) on his research ‘The influence of
Marketing Mix towards customer decision-making to saving on PT Bank Mandiri
Makassar’, location has a significant influence towards customer decision-making at
9
PT. Bank Mandiri Cabang Kartini. Another research found that there is an impact of
location towards customer buying decision. Junio (2013) on ‘the analyze of product,
price, promotion, and distribution towards customer buying decision’.
2.2 Brand loyalty
Brand loyalty is a consumer’s preference to buy a particular brand in a product
category. It occurs when consumers perceive that the brand offers the right product
features, images or level of quality at the right price. This perception may translate
into repeat purchase resulting in loyalty. Brand Loyalty is therefore related to a
customer’s preference and attachment to a brand. It may occur due to a long history of
using a product and trust that has developed as a consequence of the long usage.
One of the most comprehensive and most cited conceptual definitions of brand
loyalty was forwarded by Jacoby (1978). Jacoby defines brand loyalty as “the biased,
behavioral response, expressed over time, by some decision-making unit, with respect
to one or more alternative brands out of a set of such brands, and is a function of
psychological decision-making, evaluative processes.”
Cunningham (1956) identified three definitions of brand loyalty comprising;
customers lost and gained over specific time periods; time sequences of individual
purchases and share of the market. Jacoby., & Olsen (1971) used factor analysis to
conceptualized brand loyalty and found that brand loyalty is related to; percentage of
purchase devoted to the most purchased brand, number of different brand purchased
over the past two years, number of times the favorite brand was purchased out of the
last five purchases, three consecutive purchases out of the last five purchases and the
actual number of consecutive purchases of favorite brand out of the last five
purchases. Based on the summary by Smith brand loyalty as defined by Cunningham
(1956), Day (1969), Enis, & Paul (1971), Olson, & Jacoby (1971) explained that
behavioral loyalty is expressed in the form of ‘repeated purchase’ of the brand Smith
(2003), Aaker (1991) defines brand loyalty as the measure of attachment that a
consumer has towards a brand. Brand loyalty according to him reflects how likely a
consumer will be to switched brands when that brand makes a product change either
in price or product features. Aaker states that the core of a brand’s equity is based on
customer loyalty. Therefore if customers buy with respect to features, price and
10
convenience with little concern to the brand name, there is perhaps little equity
Aaker(1991). Aaker conceptualizes brand loyalty as a pyramid with five tiers. The
bottom represents the non-loyal consumers who are indifferent to the brand and who
perceived any brand as being adequate whereby the brand name has little influence
over buying decisions. The second level is those who are satisfied with the product or
are at least not dissatisfied. The next level are the satisfied buyers with switching
costs, those who do not want to risk changing product and may be termed habitual
buyer. The next level is loyal buyers who consider the brand as a friend. The fifth
level is the committed buyer or those who are extremely loyal to the brand. They
comprise those who are proud users and will recommend the product to others
Aaker(1991).
Evolution of the concept of brand loyalty through time has been
acknowledged by several contemporary researchers Alhabeeb (2007), Khan(2009)
Although the large number of studies on brand loyalty has been done, much of the
research over the past three decades investigates consumer loyalty from two
perspectives: behavioral loyalty and attitudinal loyalty Bandyopadhyay, & Martell,
(2007); Dick, & Basu(1994), Behavioral loyalty refers to the frequency of repeat
purchase. Attitudinal loyalty refers to the psychological commitment that a consumer
formulates in the purchase act, such as intentions to purchase and intentions to
recommend without necessarily taking the actual repeat purchase behavior into
account Jacoby (1971),Jarvis., & Wilcox (1976).
2.2.1 Attitudinal Brand Loyalty
Attitudinal brand loyalty includes a degree of dispositional promise in terms of
some unique importance associated with the brand Arjun Chaudhuri., & Morris B.
Holbrook (2001). Several studies have also used surveys to measure behavioral brand
loyalty by asking the respondents how regularly they purchased certain services or
products, relying on consumer recall rather than tracking actual purchases Reynolds.,
& Arnolds(2000), Pritchardetal (1999). Greater attitudinal loyalty leads to greater
willingness to sacrifice by paying a premium price for a valued brand Arjun
Chaudhuri., & Holbrook(2001).
11
2.2.2 Behavioral Brand Loyalty
Behavioral loyalty are often based on patterns of actual customer purchases
Rundle-Thiele & Mackay (2001), while intent to purchase can be used as an alternate
for actual behavior. Purchase or behavioral loyalty consists of repeated purchases of
the brand however attitudinal loyalty is often understood as a thoroughly favorable
expression of preference for the brand (Morgan,1999)
2.3 Hypotheses
According to the marketing concepts ( such as product, price, location, and
promotion), and previous researches explained by Ahmad and Khan (2017), Fadhillah
(2013) , Satit (2012), Muzondo and Mutandwa (2011), Riu (2009), Kapferer (2008)
,Aaker (2003), and Smith (2003).
The researcher can establish the hypotheses of this study as follows:
Hypothesis 1: Product can significantly affect customers’ attitudinal and
behavioral brand loyalty
Hypothesis 2: Price can significantly affect customers’ attitudinal and
behavioral brand loyalty
Hypothesis 3: Safetiness can significantly affect customers’ attitudinal and
behavioral brand loyalty
Hypothesis 4: Location can significantly affect customers’ attitudinal and
behavioral brand loyalty
Hypothesis 5: Promotion can significantly affect customers’ attitudinal and
behavioral brand loyalty
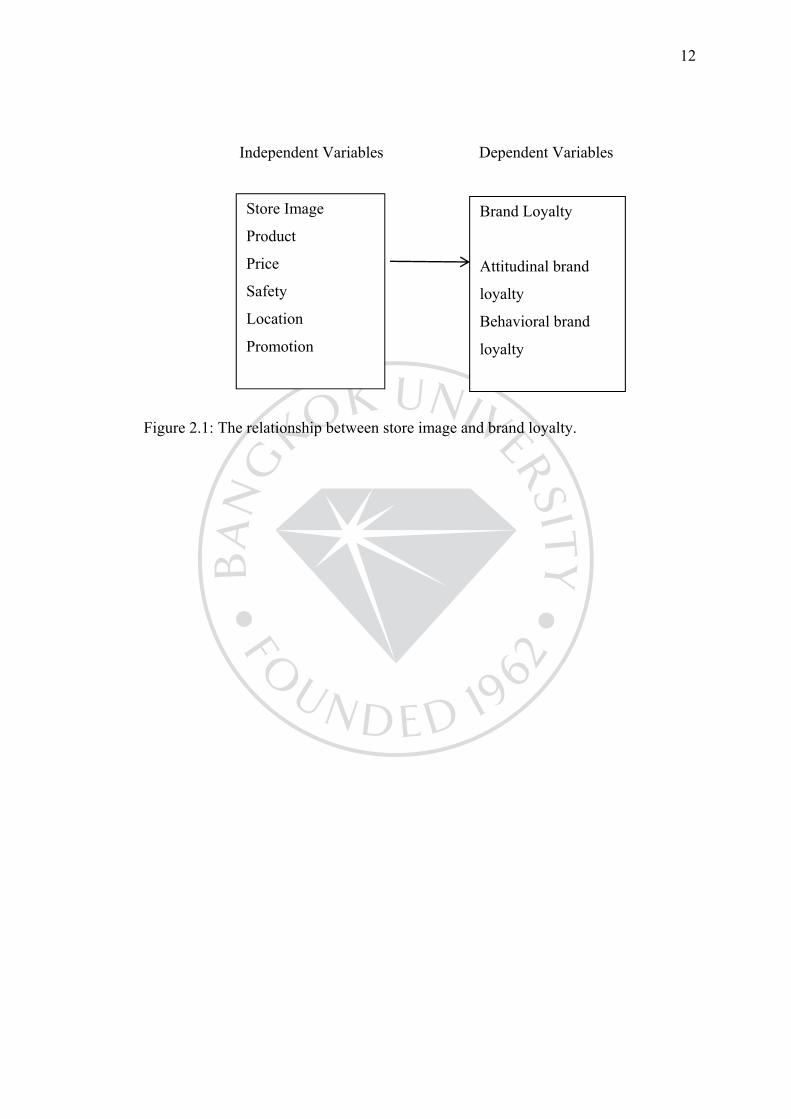
2.4 Framework of Study
As shown in the figure 1, It depicts, the important variables of this
research include Store image as independent variables and attitudinal brand loyalty
and behavioral brand loyalty as dependent variables.
12
Independent Variables Dependent Variables
Figure 2.1: The relationship between store image and brand loyalty.
Store Image
Product
Price
Safety
Location
Promotion
Brand Loyalty
Attitudinal brand
loyalty
Behavioral brand
loyalty
13
CHAPTER 3
RESEARCH METHODOLOGY
3.1 Research Strategy
Quantitative approach is used to quantify the relationship between dependent
and independent variables based on the proposed conceptual model that delineates the
relationships between dependent variable brand image and the independent variable
brand loyalty involvement.
Multiple regression mathematical models used to analyze the causal
relationship between dependent and independent variables. This method is used when
there is more than one variable that cause change in the dependent variable. Variables
coefficients, p-value of the regression output are used to investigate the statistical
significance of the estimated relationships, that is, the degree of confidence that the
true relationship is close to the estimated relationship.
Questionnaires typically contain multiple choice questions, attitude scales,
closed questions and open-ended questions. Questionnaires can be administered in a
number of different ways posted on Internet sites and handed out personally.
Moreover researchers may even decide to administer the questionnaire in person
which has the advantage of including people who have difficulties reading and
writing.
3.2. Sampling Design
3.2.1 Population
The researcher study factors influencing repurchase intention of Japanese
restaurants of Bangkok. The total population is the all the peoples that have been eat
Japanese food in Bangkok.
3.2.2 Sample and sampling techniques
The number of population of Japanese restaurant is unknown so that the
researchers decided to determine the sample size by applying the population
proportion. A sample from this study is customers from Japanese restaurant, which
are located in Bangkok; however the population in this study is infinite population.
Therefore, the author will determine sample size by applying an equation proposed by
14
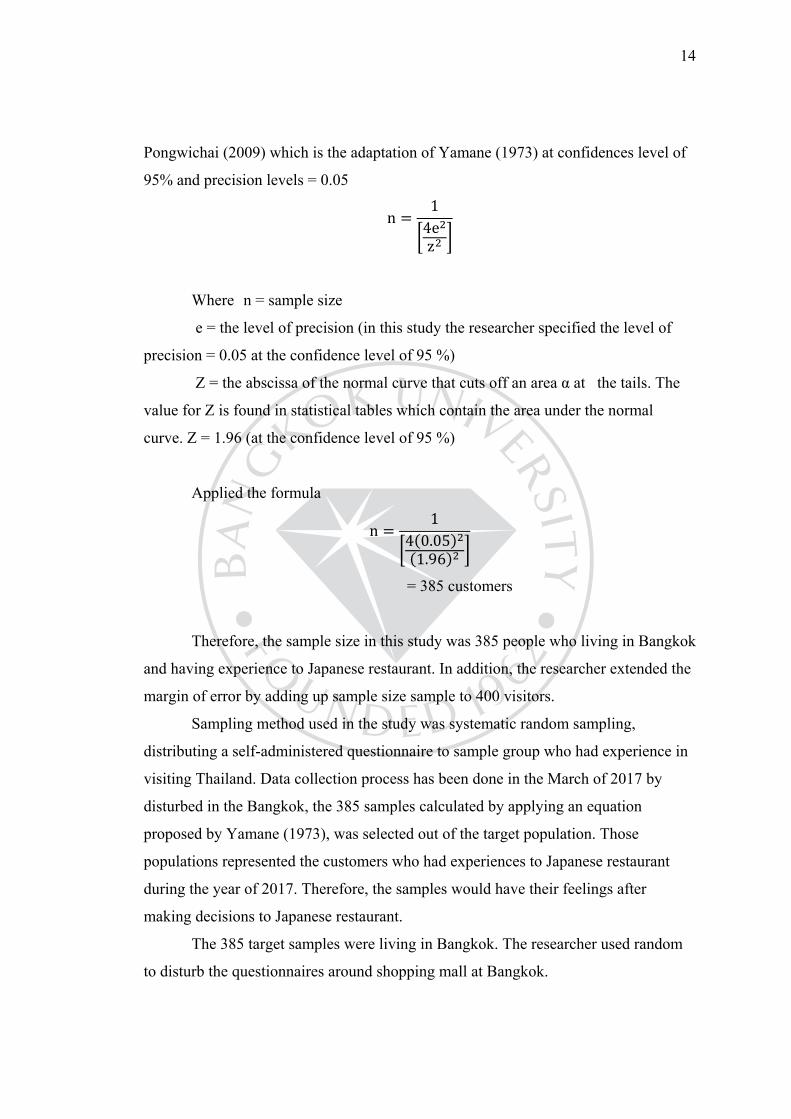
Pongwichai (2009) which is the adaptation of Yamane (1973) at confidences level of
95% and precision levels = 0.05
n14ez
Where n = sample size
e = the level of precision (in this study the researcher specified the level of
precision = 0.05 at the confidence level of 95 %)
Z = the abscissa of the normal curve that cuts off an area α at the tails. The
value for Z is found in statistical tables which contain the area under the normal
curve. Z = 1.96 (at the confidence level of 95 %)
Applied the formula
n1
4 0.051.96
= 385 customers
Therefore, the sample size in this study was 385 people who living in Bangkok
and having experience to Japanese restaurant. In addition, the researcher extended the
margin of error by adding up sample size sample to 400 visitors.
Sampling method used in the study was systematic random sampling,
distributing a self-administered questionnaire to sample group who had experience in
visiting Thailand. Data collection process has been done in the March of 2017 by
disturbed in the Bangkok, the 385 samples calculated by applying an equation
proposed by Yamane (1973), was selected out of the target population. Those
populations represented the customers who had experiences to Japanese restaurant
during the year of 2017. Therefore, the samples would have their feelings after
making decisions to Japanese restaurant.
The 385 target samples were living in Bangkok. The researcher used random
to disturb the questionnaires around shopping mall at Bangkok.
15
3.3 Research Instrument
The researcher used questionnaire as an instrument to collect data in order to
examine and identify the relationship between study Store Image and Brand Loyalty
that help contribute a positive relationship to behavioral and attitudinal customer’
decision. The questionnaire consists of five parts as followed;
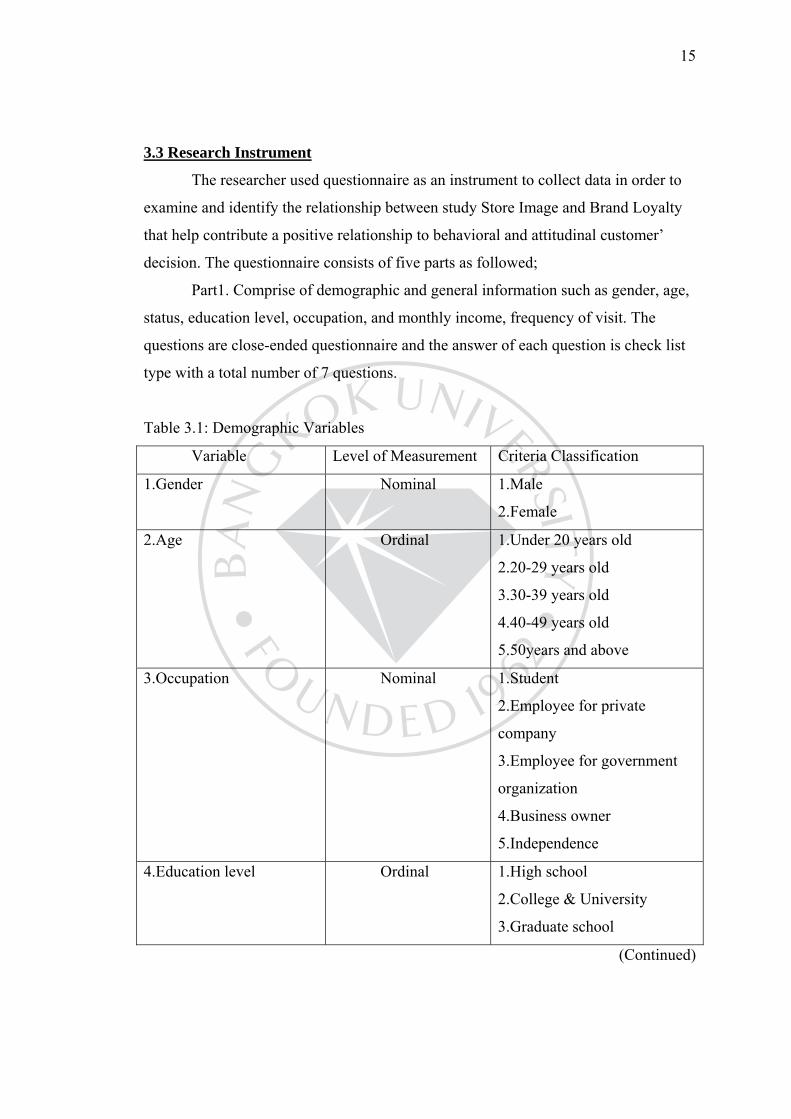
Part1. Comprise of demographic and general information such as gender, age,
status, education level, occupation, and monthly income, frequency of visit. The
questions are close-ended questionnaire and the answer of each question is check list
type with a total number of 7 questions.
Table 3.1: Demographic Variables
Variable Level of Measurement Criteria Classification
1.Gender Nominal 1.Male
2.Female
2.Age Ordinal 1.Under 20 years old
2.20-29 years old
3.30-39 years old
4.40-49 years old
5.50years and above
3.Occupation Nominal 1.Student
2.Employee for private
company
3.Employee for government
organization
4.Business owner
5.Independence
4.Education level Ordinal 1.High school
2.College & University
3.Graduate school
(Continued)
16
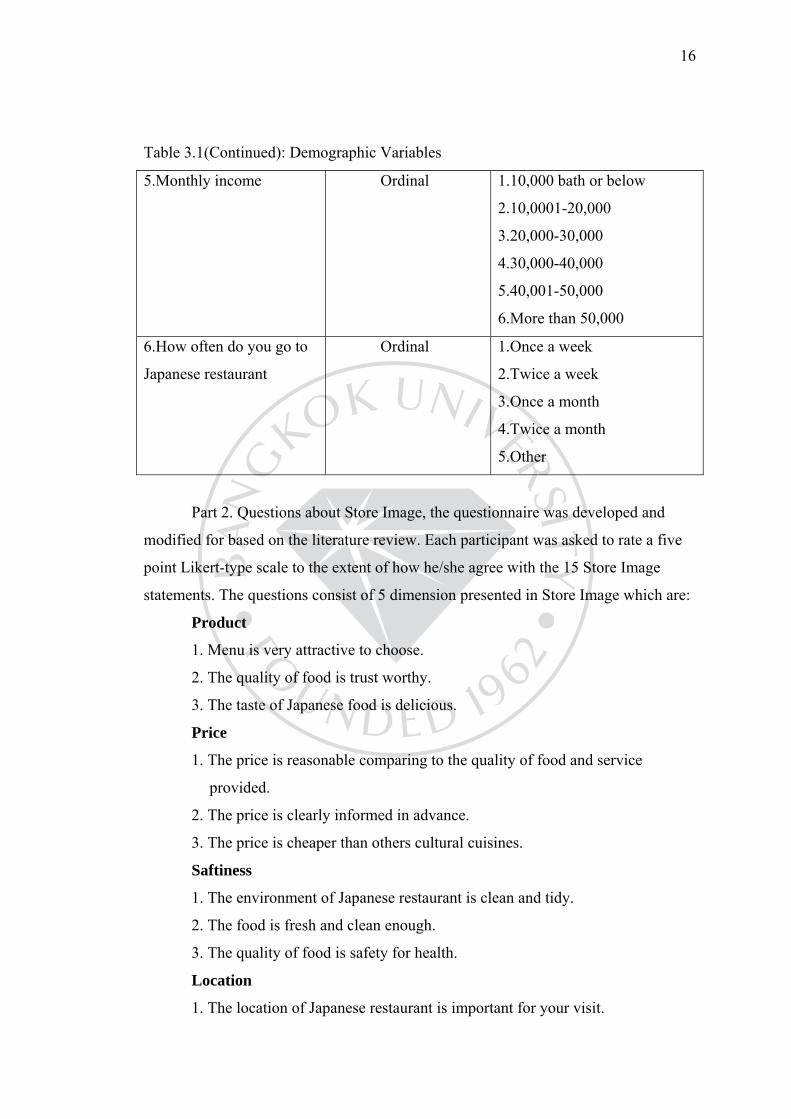
Table 3.1(Continued): Demographic Variables
5.Monthly income Ordinal 1.10,000 bath or below
2.10,0001-20,000
3.20,000-30,000
4.30,000-40,000
5.40,001-50,000
6.More than 50,000
6.How often do you go to
Japanese restaurant
Ordinal 1.Once a week
2.Twice a week
3.Once a month
4.Twice a month
5.Other
Part 2. Questions about Store Image, the questionnaire was developed and
modified for based on the literature review. Each participant was asked to rate a five
point Likert-type scale to the extent of how he/she agree with the 15 Store Image
statements. The questions consist of 5 dimension presented in Store Image which are:
Product
1. Menu is very attractive to choose.
2. The quality of food is trust worthy.
3. The taste of Japanese food is delicious.
Price
1. The price is reasonable comparing to the quality of food and service
provided.
2. The price is clearly informed in advance.
3. The price is cheaper than others cultural cuisines.
Saftiness
1. The environment of Japanese restaurant is clean and tidy.
2. The food is fresh and clean enough.
3. The quality of food is safety for health.
Location
1. The location of Japanese restaurant is important for your visit.
17
2. The location is easy to visit.
3. The location is widespread and convenient.
Promotion
1. The advertising is well-informed.
2. The merit activity of member cards can get benefit.
3. The special coupons are available and motivated for next visit.
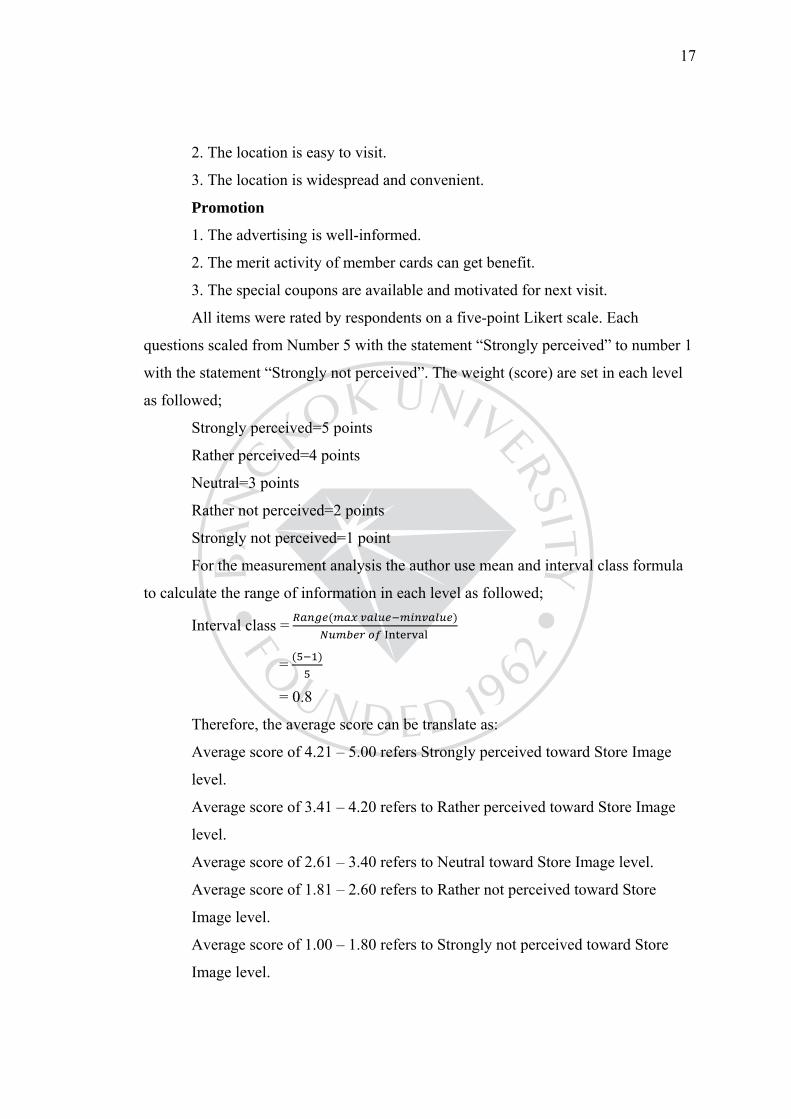
All items were rated by respondents on a five-point Likert scale. Each
questions scaled from Number 5 with the statement “Strongly perceived” to number 1
with the statement “Strongly not perceived”. The weight (score) are set in each level
as followed;
Strongly perceived=5 points
Rather perceived=4 points
Neutral=3 points
Rather not perceived=2 points
Strongly not perceived=1 point
For the measurement analysis the author use mean and interval class formula
to calculate the range of information in each level as followed;
Interval class =
=
= 0.8
Therefore, the average score can be translate as:
Average score of 4.21 – 5.00 refers Strongly perceived toward Store Image
level.
Average score of 3.41 – 4.20 refers to Rather perceived toward Store Image
level.
Average score of 2.61 – 3.40 refers to Neutral toward Store Image level.
Average score of 1.81 – 2.60 refers to Rather not perceived toward Store
Image level.
Average score of 1.00 – 1.80 refers to Strongly not perceived toward Store
Image level.
18
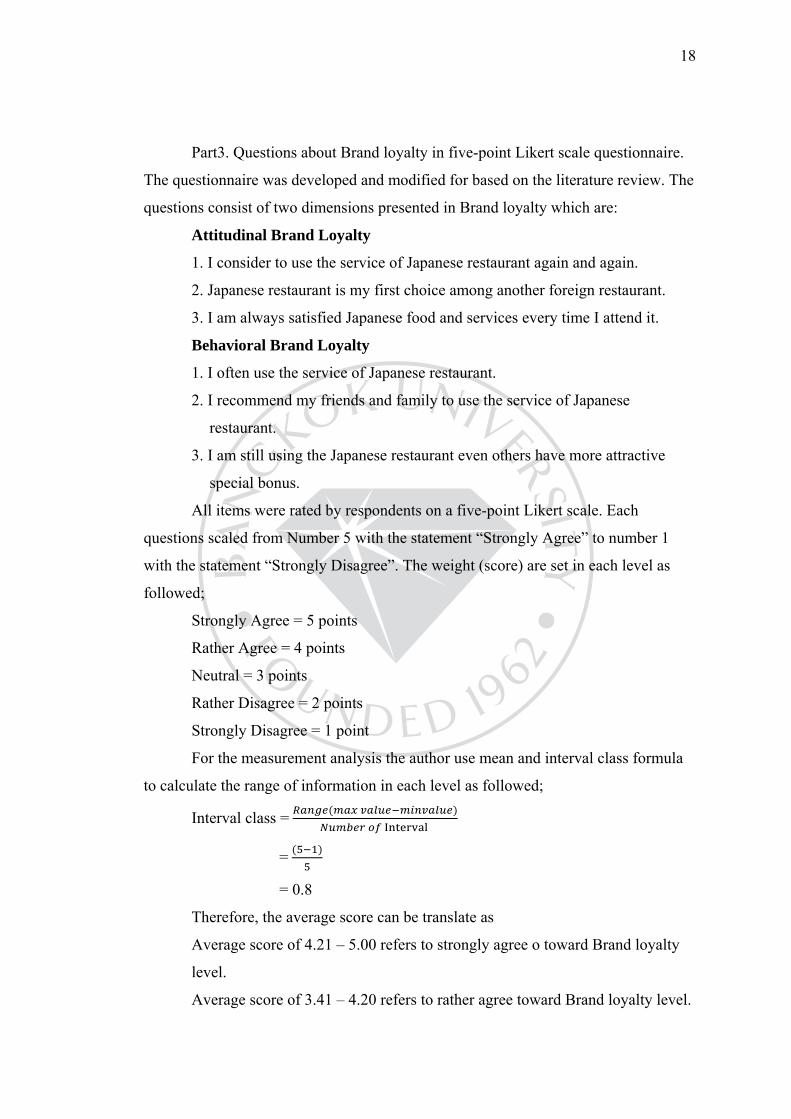
Part3. Questions about Brand loyalty in five-point Likert scale questionnaire.
The questionnaire was developed and modified for based on the literature review. The
questions consist of two dimensions presented in Brand loyalty which are:
Attitudinal Brand Loyalty
1. I consider to use the service of Japanese restaurant again and again.
2. Japanese restaurant is my first choice among another foreign restaurant.
3. I am always satisfied Japanese food and services every time I attend it.
Behavioral Brand Loyalty
1. I often use the service of Japanese restaurant.
2. I recommend my friends and family to use the service of Japanese
restaurant.
3. I am still using the Japanese restaurant even others have more attractive
special bonus.
All items were rated by respondents on a five-point Likert scale. Each
questions scaled from Number 5 with the statement “Strongly Agree” to number 1
with the statement “Strongly Disagree”. The weight (score) are set in each level as
followed;
Strongly Agree = 5 points
Rather Agree = 4 points
Neutral = 3 points
Rather Disagree = 2 points
Strongly Disagree = 1 point
For the measurement analysis the author use mean and interval class formula
to calculate the range of information in each level as followed;
Interval class =
=
= 0.8
Therefore, the average score can be translate as
Average score of 4.21 – 5.00 refers to strongly agree o toward Brand loyalty
level.
Average score of 3.41 – 4.20 refers to rather agree toward Brand loyalty level.
19
Average score of 2.61 – 3.40 refers to moderate toward Brand loyalty level.
Average score of 1.81 – 2.60 refers to rather disagree toward Brand loyalty
level.
Average score of 1.00 – 1.80 refers to strongly disagree toward Brand loyalty
level.
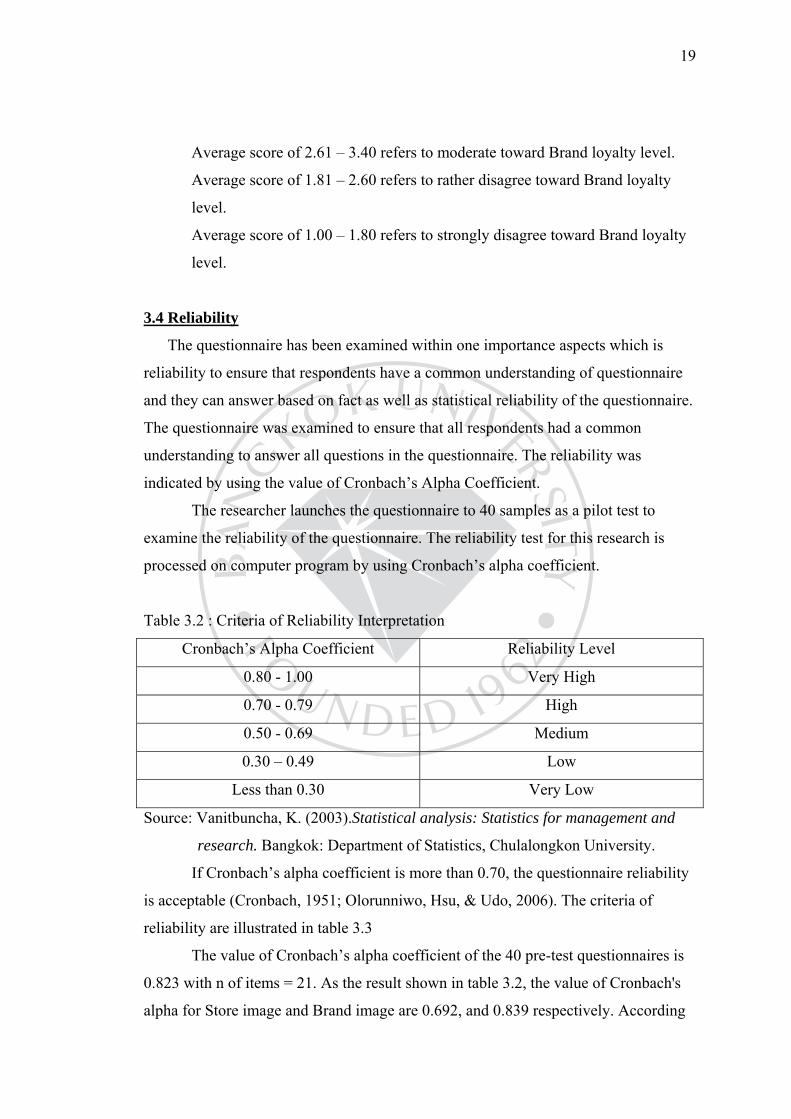
3.4 Reliability
The questionnaire has been examined within one importance aspects which is
reliability to ensure that respondents have a common understanding of questionnaire
and they can answer based on fact as well as statistical reliability of the questionnaire.
The questionnaire was examined to ensure that all respondents had a common
understanding to answer all questions in the questionnaire. The reliability was
indicated by using the value of Cronbach’s Alpha Coefficient.
The researcher launches the questionnaire to 40 samples as a pilot test to
examine the reliability of the questionnaire. The reliability test for this research is
processed on computer program by using Cronbach’s alpha coefficient.
Table 3.2 : Criteria of Reliability Interpretation
Cronbach’s Alpha Coefficient Reliability Level
0.80 - 1.00 Very High
0.70 - 0.79 High
0.50 - 0.69 Medium
0.30 – 0.49 Low
Less than 0.30 Very Low
Source: Vanitbuncha, K. (2003).Statistical analysis: Statistics for management and
research. Bangkok: Department of Statistics, Chulalongkon University.
If Cronbach’s alpha coefficient is more than 0.70, the questionnaire reliability
is acceptable (Cronbach, 1951; Olorunniwo, Hsu, & Udo, 2006). The criteria of
reliability are illustrated in table 3.3
The value of Cronbach’s alpha coefficient of the 40 pre-test questionnaires is
0.823 with n of items = 21. As the result shown in table 3.2, the value of Cronbach's
alpha for Store image and Brand image are 0.692, and 0.839 respectively. According
20
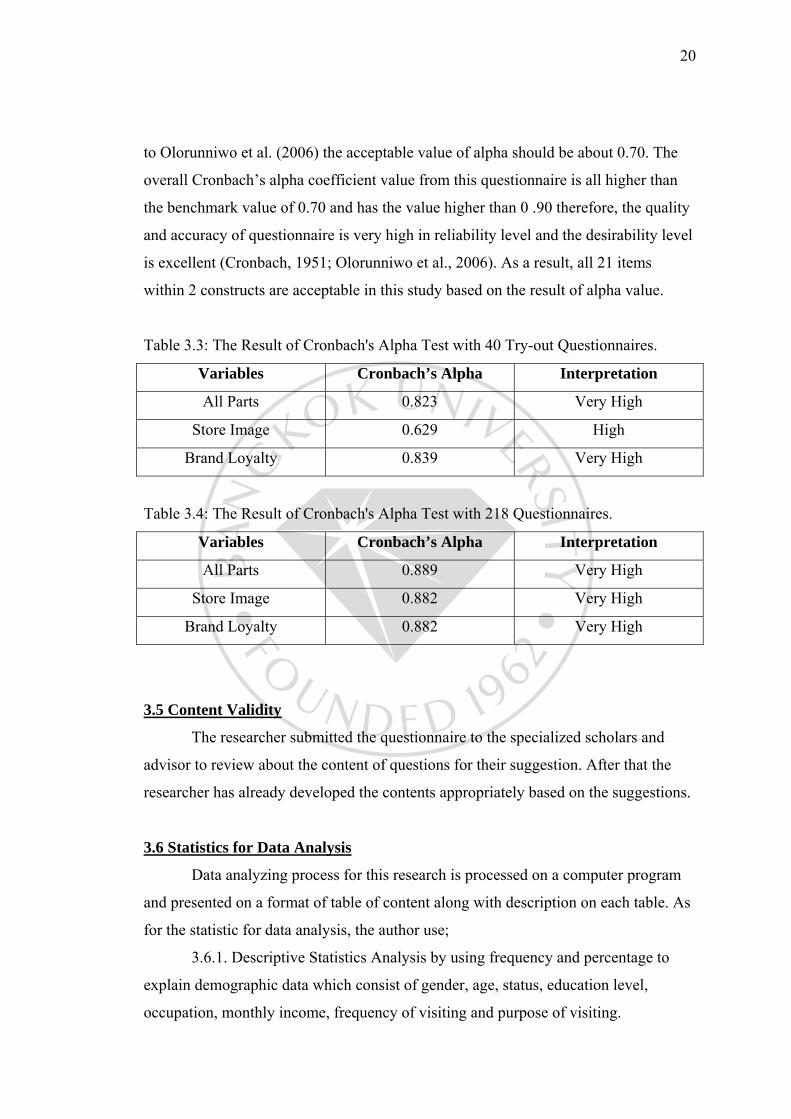
to Olorunniwo et al. (2006) the acceptable value of alpha should be about 0.70. The
overall Cronbach’s alpha coefficient value from this questionnaire is all higher than
the benchmark value of 0.70 and has the value higher than 0 .90 therefore, the quality
and accuracy of questionnaire is very high in reliability level and the desirability level
is excellent (Cronbach, 1951; Olorunniwo et al., 2006). As a result, all 21 items
within 2 constructs are acceptable in this study based on the result of alpha value.
Table 3.3: The Result of Cronbach's Alpha Test with 40 Try-out Questionnaires.
Variables Cronbach’s Alpha Interpretation
All Parts 0.823 Very High
Store Image 0.629 High
Brand Loyalty 0.839 Very High
Table 3.4: The Result of Cronbach's Alpha Test with 218 Questionnaires.
Variables Cronbach’s Alpha Interpretation
All Parts 0.889 Very High
Store Image 0.882 Very High
Brand Loyalty 0.882 Very High
3.5 Content Validity
The researcher submitted the questionnaire to the specialized scholars and
advisor to review about the content of questions for their suggestion. After that the
researcher has already developed the contents appropriately based on the suggestions.
3.6 Statistics for Data Analysis
Data analyzing process for this research is processed on a computer program
and presented on a format of table of content along with description on each table. As
for the statistic for data analysis, the author use;
3.6.1. Descriptive Statistics Analysis by using frequency and percentage to
explain demographic data which consist of gender, age, status, education level,
occupation, monthly income, frequency of visiting and purpose of visiting.
21
3.6.2. The author used mean and standard deviation value to explain the level
of service quality, satisfaction and loyalty from samples group.
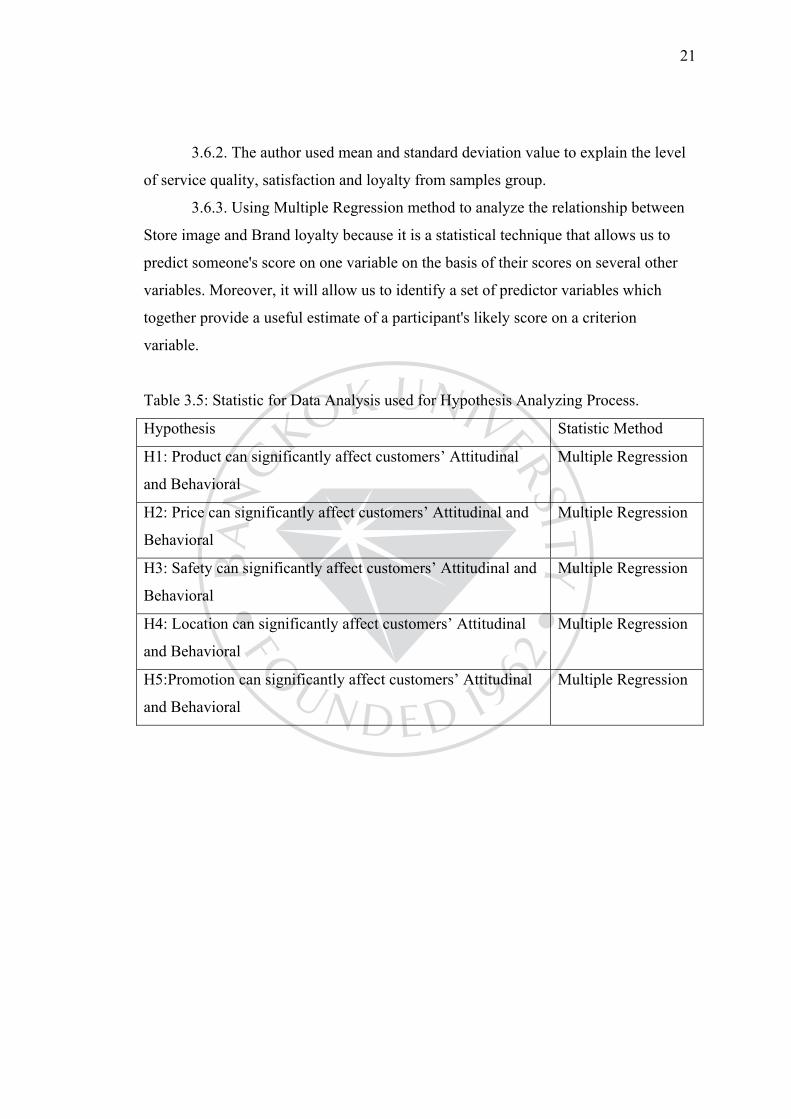
3.6.3. Using Multiple Regression method to analyze the relationship between
Store image and Brand loyalty because it is a statistical technique that allows us to
predict someone's score on one variable on the basis of their scores on several other
variables. Moreover, it will allow us to identify a set of predictor variables which
together provide a useful estimate of a participant's likely score on a criterion
variable.
Table 3.5: Statistic for Data Analysis used for Hypothesis Analyzing Process.
Hypothesis Statistic Method
H1: Product can significantly affect customers’ Attitudinal
and Behavioral
Multiple Regression
H2: Price can significantly affect customers’ Attitudinal and
Behavioral
Multiple Regression
H3: Safety can significantly affect customers’ Attitudinal and
Behavioral
Multiple Regression
H4: Location can significantly affect customers’ Attitudinal
and Behavioral
Multiple Regression
H5:Promotion can significantly affect customers’ Attitudinal
and Behavioral
Multiple Regression
22
CHAPTER 4
RESEARCH FINDINGS AND DATA ANALYSIS
In this chapter, the researcher presents the research wants of the research along
with an analysis of the collected data. All parts of analysis were conducted by using
the statistics tools mentioned before in chapter 3.
The results of this research are presented within 3 parts:
Part 1: The analysis of demographic data of samples includes age, gender,
status, education level, occupation, monthly income, frequency of
visiting and purpose of visiting the date are interpreted by using
frequency and percentage.
Part 2: The analysis of Store image of samples includes product, price, safety,
location, and promotion the date are interpreted by using mean (¯X)
and standard deviation (S.D).
Part 3: The analysis of Brand loyalty of samples includes attitudinal and
behavioral brand loyalty the date are interpreted by using mean (¯X)
and standard deviation (S.D).
Part 4: The analysis of hypothesis testing is interpreted by using Multiple
Regress Analysis.
4.1 Symbol used for Data Analysis
(X) was mean value from samples.
S.D. was standard deviation from samples.
n was number of samples.
* was an indicator of a statistically significant level at 0.05
Adjusted R² was a modification of R-square that adjusts for the number
of terms in a model.
t was a ratio of the departure of an estimated parameter from
its notional value and its standard error.
23
Beta was the estimates resulting from an analysis carried out on
independent variables that have been standardized so that
their variances were 1.
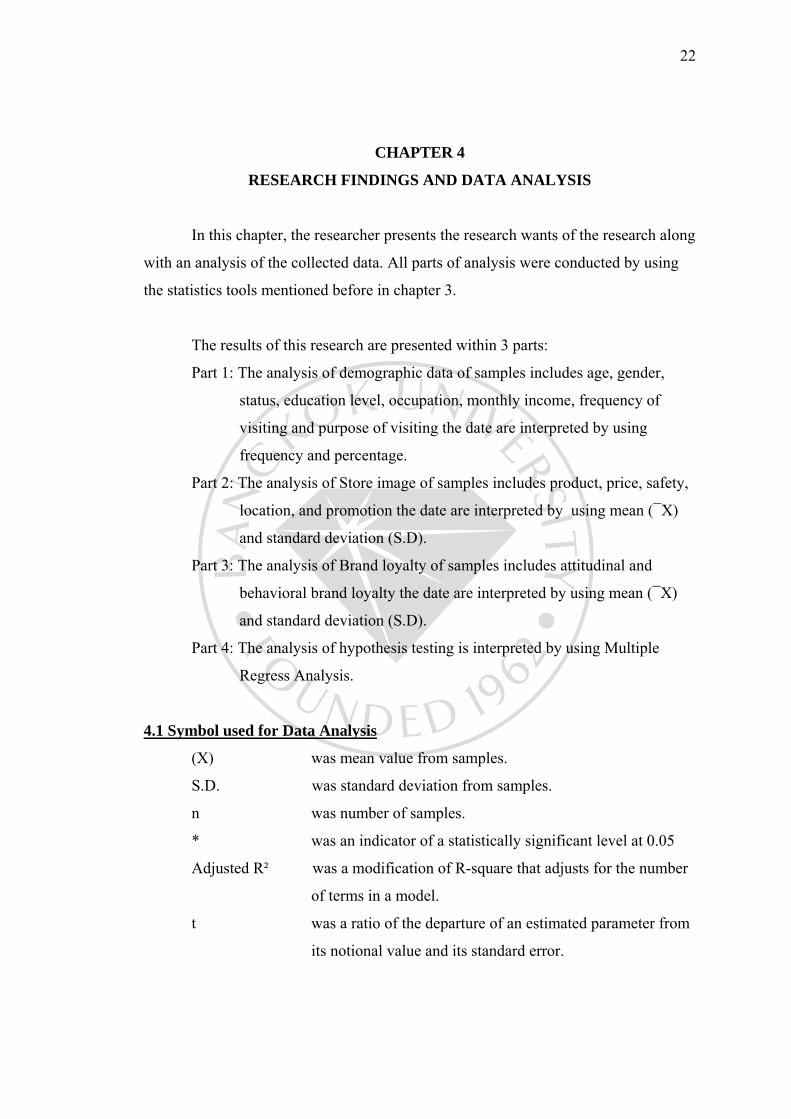
4.2 The Analysis of Demographic Data of Samples
Table 4.1: Frequency and Percentage of Demographic Data classified by Gender.
Gender Frequency Percent
Male 88 40.4
Female 130 59.6
Total 218 100.0
The majority of respondents are female with total number was equal to 130
respondents (59.6%) and male 88 respondents (40.4%).
Table 4.2:Frequency and Percentage of Demographic Data classified by Age.
Age Frequency Percent
Under 20 years old 26 11.9
20-29 years old 152 69.7
30-39 years old 35 16.1
40-49 years old 1 0.5
50 years old 4 1.8
Total 216 100.0
Most respondents age are in the range between 20-29 years old which was
equal to 152 respondents (69.7%) followed by 30-39 years old 35 respondents
(16.1%), under 20 years old 26 respondents (11.9%), 50 years and above
4respondents (1.8 %) and 40-49 years old 1 respondents (0.5%) respectively.
24
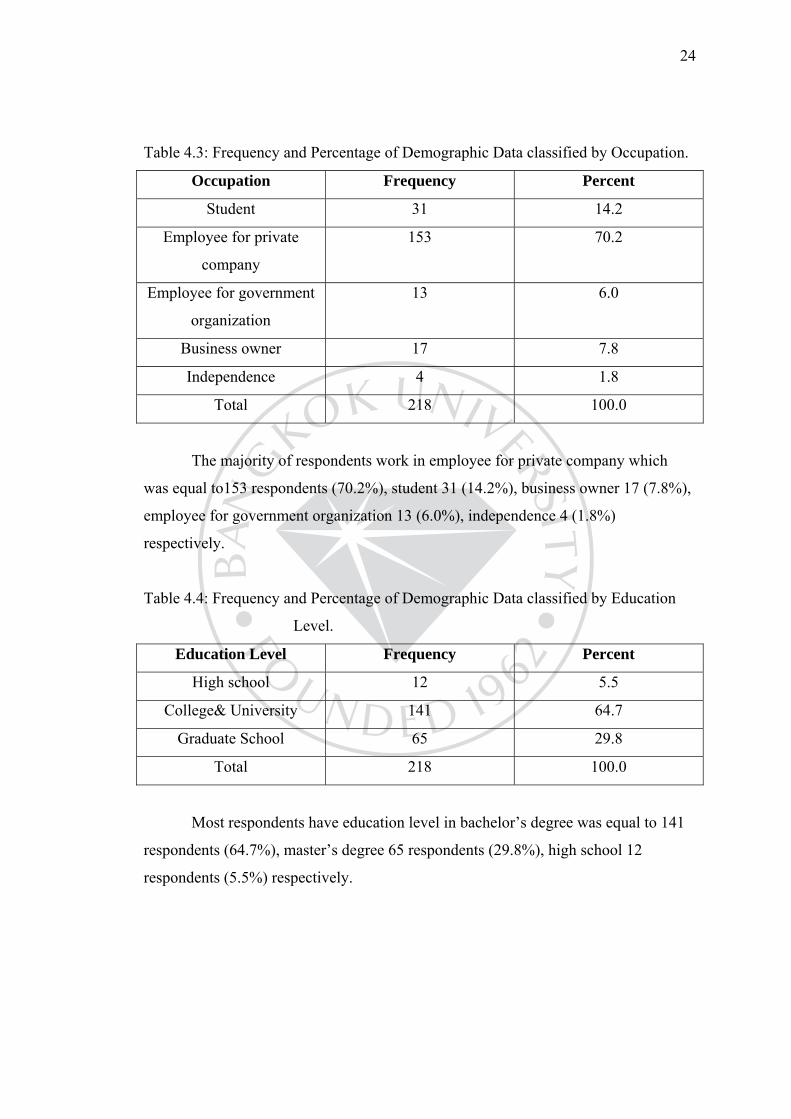
Table 4.3: Frequency and Percentage of Demographic Data classified by Occupation.
Occupation Frequency Percent
Student 31 14.2
Employee for private
company
153 70.2
Employee for government
organization
13 6.0
Business owner 17 7.8
Independence 4 1.8
Total 218 100.0
The majority of respondents work in employee for private company which
was equal to153 respondents (70.2%), student 31 (14.2%), business owner 17 (7.8%),
employee for government organization 13 (6.0%), independence 4 (1.8%)
respectively.
Table 4.4: Frequency and Percentage of Demographic Data classified by Education
Level.
Education Level Frequency Percent
High school 12 5.5
College& University 141 64.7
Graduate School 65 29.8
Total 218 100.0
Most respondents have education level in bachelor’s degree was equal to 141
respondents (64.7%), master’s degree 65 respondents (29.8%), high school 12
respondents (5.5%) respectively.
25
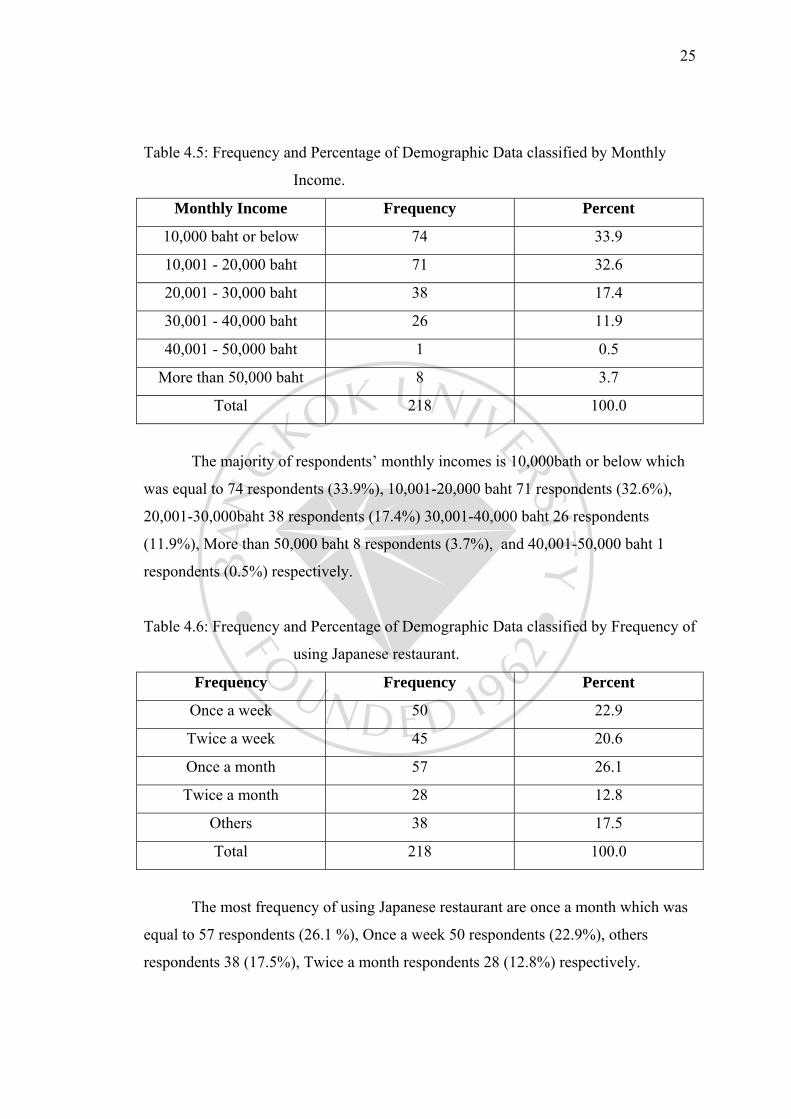
Table 4.5: Frequency and Percentage of Demographic Data classified by Monthly
Income.
Monthly Income Frequency Percent
10,000 baht or below 74 33.9
10,001 - 20,000 baht 71 32.6
20,001 - 30,000 baht 38 17.4
30,001 - 40,000 baht 26 11.9
40,001 - 50,000 baht 1 0.5
More than 50,000 baht 8 3.7
Total 218 100.0
The majority of respondents’ monthly incomes is 10,000bath or below which
was equal to 74 respondents (33.9%), 10,001-20,000 baht 71 respondents (32.6%),
20,001-30,000baht 38 respondents (17.4%) 30,001-40,000 baht 26 respondents
(11.9%), More than 50,000 baht 8 respondents (3.7%), and 40,001-50,000 baht 1
respondents (0.5%) respectively.
Table 4.6: Frequency and Percentage of Demographic Data classified by Frequency of
using Japanese restaurant.
Frequency Frequency Percent
Once a week 50 22.9
Twice a week 45 20.6
Once a month 57 26.1
Twice a month 28 12.8
Others 38 17.5
Total 218 100.0
The most frequency of using Japanese restaurant are once a month which was
equal to 57 respondents (26.1 %), Once a week 50 respondents (22.9%), others
respondents 38 (17.5%), Twice a month respondents 28 (12.8%) respectively.
26
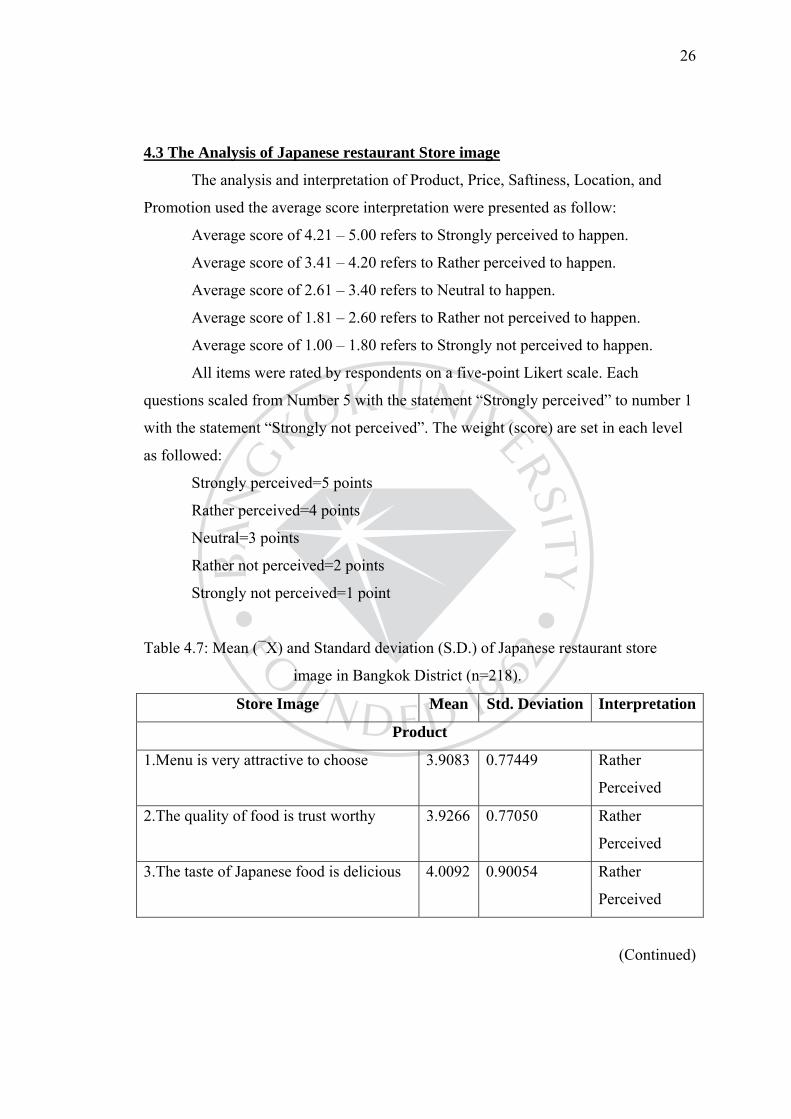
4.3 The Analysis of Japanese restaurant Store image
The analysis and interpretation of Product, Price, Saftiness, Location, and
Promotion used the average score interpretation were presented as follow:
Average score of 4.21 – 5.00 refers to Strongly perceived to happen.
Average score of 3.41 – 4.20 refers to Rather perceived to happen.
Average score of 2.61 – 3.40 refers to Neutral to happen.
Average score of 1.81 – 2.60 refers to Rather not perceived to happen.
Average score of 1.00 – 1.80 refers to Strongly not perceived to happen.
All items were rated by respondents on a five-point Likert scale. Each
questions scaled from Number 5 with the statement “Strongly perceived” to number 1
with the statement “Strongly not perceived”. The weight (score) are set in each level
as followed:
Strongly perceived=5 points
Rather perceived=4 points
Neutral=3 points
Rather not perceived=2 points
Strongly not perceived=1 point
Table 4.7: Mean (¯X) and Standard deviation (S.D.) of Japanese restaurant store
image in Bangkok District (n=218).
Store Image Mean Std. Deviation Interpretation
Product
1.Menu is very attractive to choose 3.9083 0.77449 Rather
Perceived
2.The quality of food is trust worthy 3.9266 0.77050 Rather
Perceived
3.The taste of Japanese food is delicious 4.0092 0.90054 Rather
Perceived
(Continued)
27
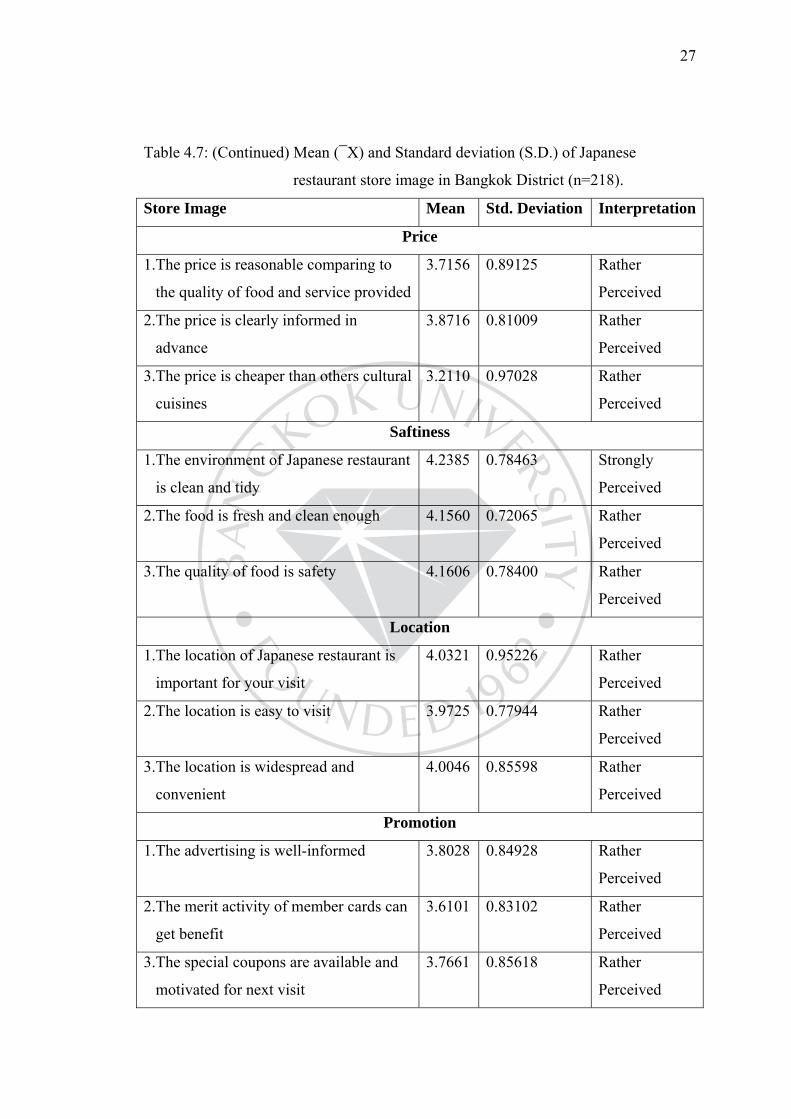
Table 4.7: (Continued) Mean (¯X) and Standard deviation (S.D.) of Japanese
restaurant store image in Bangkok District (n=218).
Store Image Mean Std. Deviation Interpretation
Price
1.The price is reasonable comparing to
the quality of food and service provided
3.7156 0.89125 Rather
Perceived
2.The price is clearly informed in
advance
3.8716 0.81009 Rather
Perceived
3.The price is cheaper than others cultural
cuisines
3.2110 0.97028 Rather
Perceived
Saftiness
1.The environment of Japanese restaurant
is clean and tidy
4.2385 0.78463 Strongly
Perceived
2.The food is fresh and clean enough 4.1560 0.72065 Rather
Perceived
3.The quality of food is safety 4.1606 0.78400 Rather
Perceived
Location
1.The location of Japanese restaurant is
important for your visit
4.0321 0.95226 Rather
Perceived
2.The location is easy to visit 3.9725 0.77944 Rather
Perceived
3.The location is widespread and
convenient
4.0046 0.85598 Rather
Perceived
Promotion
1.The advertising is well-informed 3.8028 0.84928 Rather
Perceived
2.The merit activity of member cards can
get benefit
3.6101 0.83102 Rather
Perceived
3.The special coupons are available and
motivated for next visit
3.7661 0.85618 Rather
Perceived
28
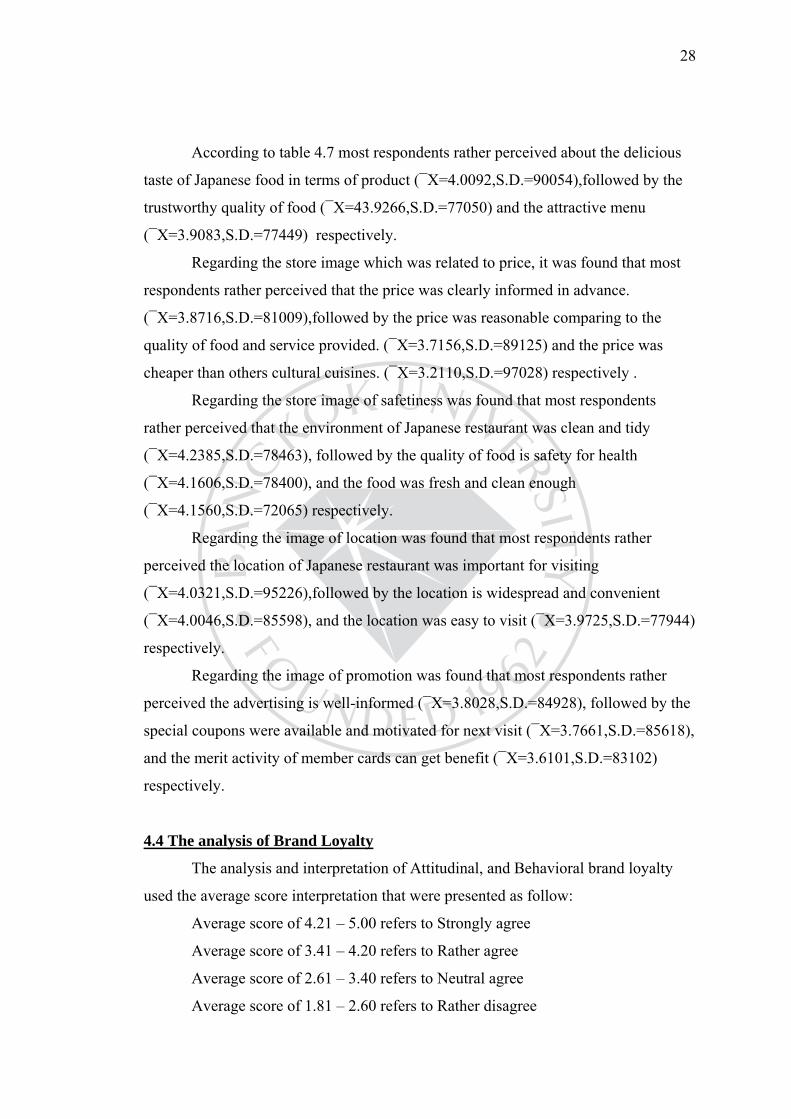
According to table 4.7 most respondents rather perceived about the delicious
taste of Japanese food in terms of product (¯X=4.0092,S.D.=90054),followed by the
trustworthy quality of food (¯X=43.9266,S.D.=77050) and the attractive menu
(¯X=3.9083,S.D.=77449) respectively.
Regarding the store image which was related to price, it was found that most
respondents rather perceived that the price was clearly informed in advance.
(¯X=3.8716,S.D.=81009),followed by the price was reasonable comparing to the
quality of food and service provided. (¯X=3.7156,S.D.=89125) and the price was
cheaper than others cultural cuisines. (¯X=3.2110,S.D.=97028) respectively .
Regarding the store image of safetiness was found that most respondents
rather perceived that the environment of Japanese restaurant was clean and tidy
(¯X=4.2385,S.D.=78463), followed by the quality of food is safety for health
(¯X=4.1606,S.D.=78400), and the food was fresh and clean enough
(¯X=4.1560,S.D.=72065) respectively.
Regarding the image of location was found that most respondents rather
perceived the location of Japanese restaurant was important for visiting
(¯X=4.0321,S.D.=95226),followed by the location is widespread and convenient
(¯X=4.0046,S.D.=85598), and the location was easy to visit (¯X=3.9725,S.D.=77944)
respectively.
Regarding the image of promotion was found that most respondents rather
perceived the advertising is well-informed (¯X=3.8028,S.D.=84928), followed by the
special coupons were available and motivated for next visit (¯X=3.7661,S.D.=85618),
and the merit activity of member cards can get benefit (¯X=3.6101,S.D.=83102)
respectively.
4.4 The analysis of Brand Loyalty
The analysis and interpretation of Attitudinal, and Behavioral brand loyalty
used the average score interpretation that were presented as follow:
Average score of 4.21 – 5.00 refers to Strongly agree
Average score of 3.41 – 4.20 refers to Rather agree
Average score of 2.61 – 3.40 refers to Neutral agree
Average score of 1.81 – 2.60 refers to Rather disagree
29
Average score of 1.00 – 1.80 refers to Strongly disagree
All items were rated by respondents on a five-point Likert scale. Each
questions scaled from Number 5 with the statement “Strongly Agree” to number 1
with the statement “Strongly Disagree”. The weight (score) are set in each level as
followed:
Strongly Agree = 5 points
Rather Agree = 4 points
Neutral = 3 points
Rather Disagree = 2 points
Strongly Disagree = 1 point
Table 4.8: Mean (¯X) and Standard deviation (S.D.) of brand loyalty on Japanese
restaurant in Bangkok District (n=218).
Brand Loyalty Mean Std. Deviation Interpretation
Attitudinal Brand Loyalty
1.Consider to use the service of Japanese
restaurant again and again
3.8716 0.86510 Rather agree
2.Japanese restaurant is the first choice
among another foreign restaurant
3.4220 1.08440 Rather agree
3.Be always satisfied Japanese food and
services every time of attendance
3.6147 0.94463 Rather agree
Behavioral Brand Loyalty
1.Often use the service of Japanese
restaurant
3.5413 0.86437 Rather agree
2.Recommend friends and family to use
the service of Japanese restaurant
3.5688 0.89923 Rather agree
3.Still use the Japanese restaurant even
others have more attractive special bonus
3.5917 1.05748 Rather agree
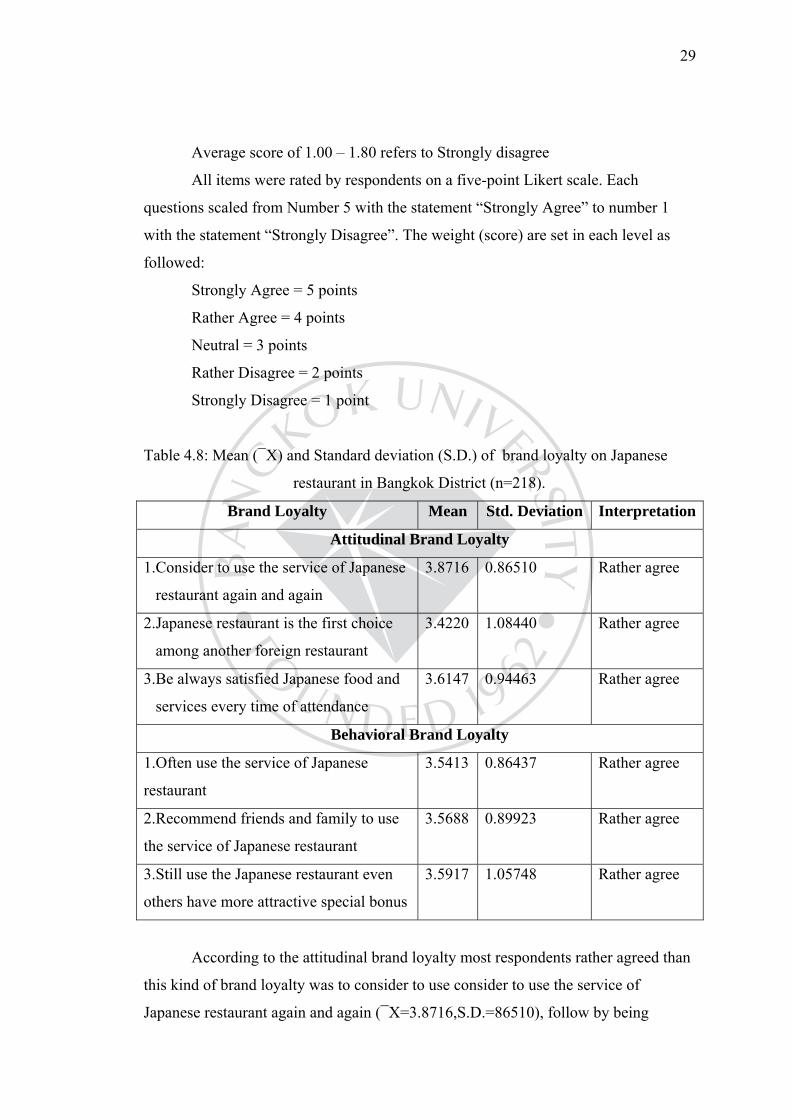
According to the attitudinal brand loyalty most respondents rather agreed than
this kind of brand loyalty was to consider to use consider to use the service of
Japanese restaurant again and again (¯X=3.8716,S.D.=86510), follow by being
30
always satisfied Japanese food and services every time of attendance
(¯X=3.6147,S.D.=94463), and Japanese restaurant is the first choice among another
foreign restaurant (¯X=3.4220,S.D.=1.08440) respectively.
Moreover, Regarding behavior of brand loyalty was found that most
respondents rather agree that brand loyalty was to still use the Japanese restaurant
even others have more attractive special bonus (¯X=3.5917,S.D.=1.05748), follow by
to recommend friends and family to use the service of Japanese restaurant
(¯X=3.5688,S.D.=.89923), and to often use the service of Japanese restaurant
(¯X=3.5413,S.D.=.86437) respectively.
4.5 The analysis of Hypothesis testing
This part was related to the analysis of hypothesis testing to summarize the
effect of store image to both kinds of brand loyalty . The Multiple Regression
Analysis was used for this concern.
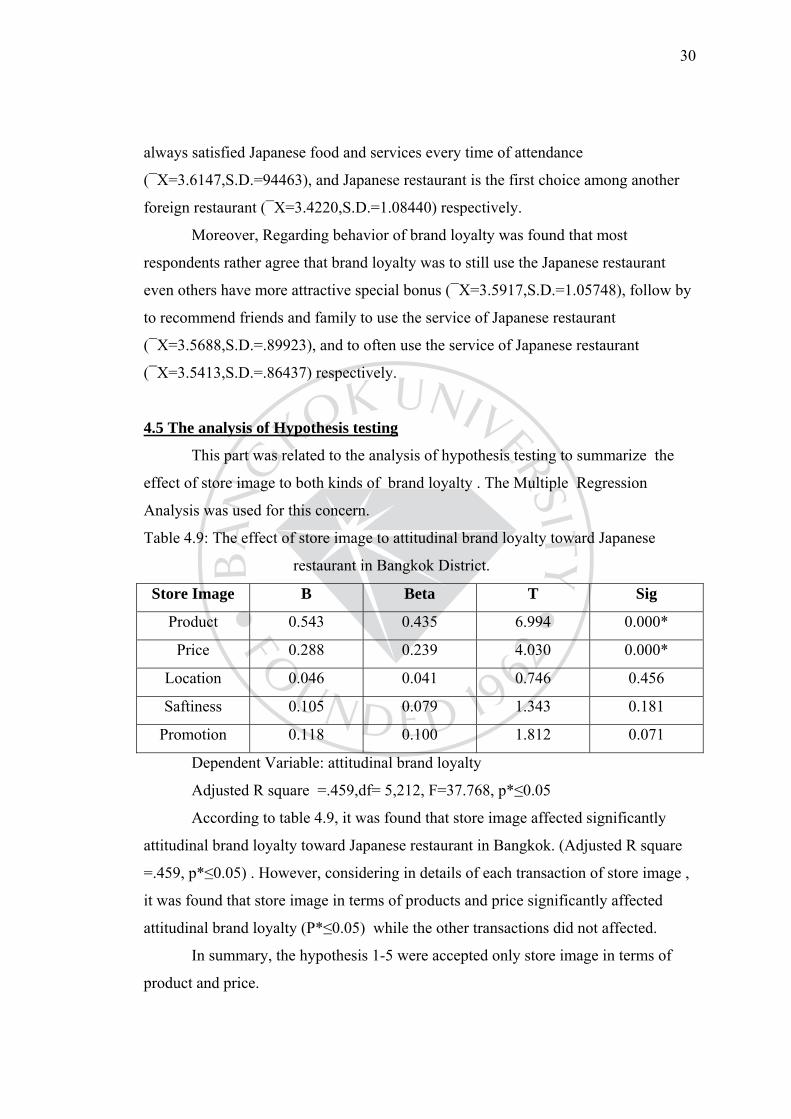
Table 4.9: The effect of store image to attitudinal brand loyalty toward Japanese
restaurant in Bangkok District.
Store Image B Beta T Sig
Product 0.543 0.435 6.994 0.000*
Price 0.288 0.239 4.030 0.000*
Location 0.046 0.041 0.746 0.456
Saftiness 0.105 0.079 1.343 0.181
Promotion 0.118 0.100 1.812 0.071
Dependent Variable: attitudinal brand loyalty
Adjusted R square =.459,df= 5,212, F=37.768, p*≤0.05
According to table 4.9, it was found that store image affected significantly
attitudinal brand loyalty toward Japanese restaurant in Bangkok. (Adjusted R square
=.459, p*≤0.05) . However, considering in details of each transaction of store image ,
it was found that store image in terms of products and price significantly affected
attitudinal brand loyalty (P*≤0.05) while the other transactions did not affected.
In summary, the hypothesis 1-5 were accepted only store image in terms of
product and price.
31
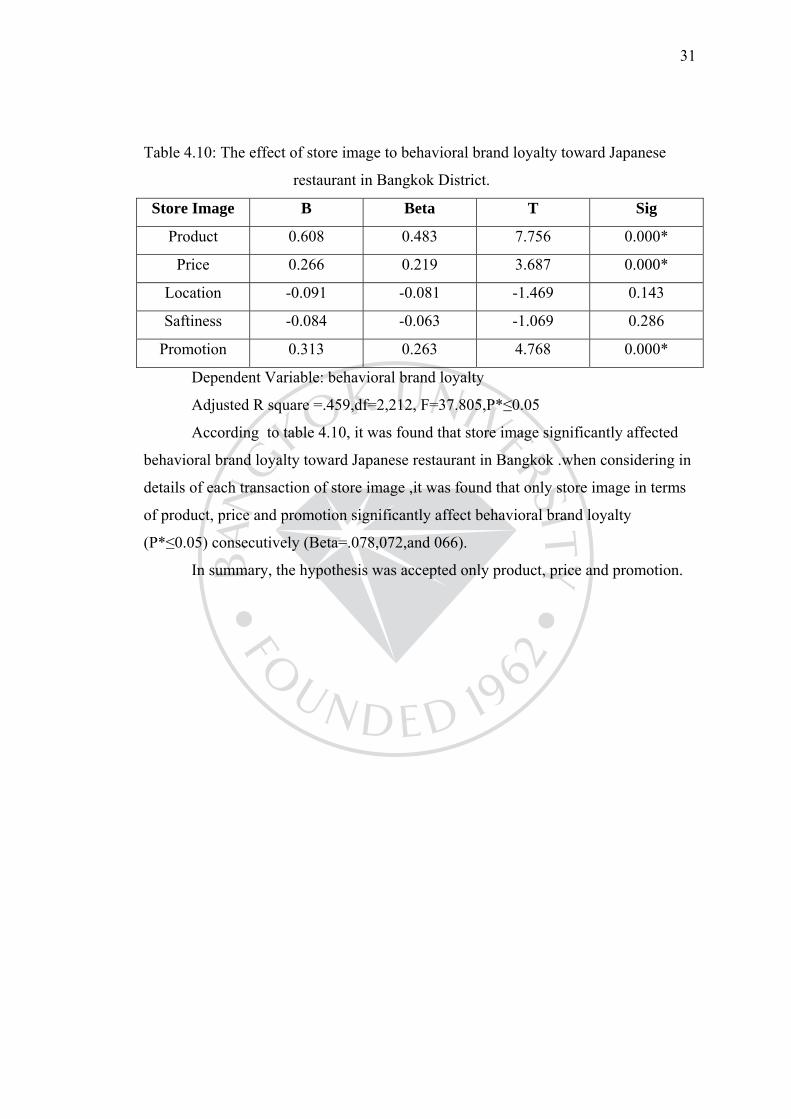
Table 4.10: The effect of store image to behavioral brand loyalty toward Japanese
restaurant in Bangkok District.
Store Image B Beta T Sig
Product 0.608 0.483 7.756 0.000*
Price 0.266 0.219 3.687 0.000*
Location -0.091 -0.081 -1.469 0.143
Saftiness -0.084 -0.063 -1.069 0.286
Promotion 0.313 0.263 4.768 0.000*
Dependent Variable: behavioral brand loyalty
Adjusted R square =.459,df=2,212, F=37.805,P*≤0.05
According to table 4.10, it was found that store image significantly affected
behavioral brand loyalty toward Japanese restaurant in Bangkok .when considering in
details of each transaction of store image ,it was found that only store image in terms
of product, price and promotion significantly affect behavioral brand loyalty
(P*≤0.05) consecutively (Beta=.078,072,and 066).
In summary, the hypothesis was accepted only product, price and promotion.
32
CHAPTER 5
DISCUSSION RECOMMENDATION
This chapter included discussion of findings and recommendation for this
study as follows:
5.1 Discussion
According to the finding, which were related to the customer’s perceptions
toward each element of store image proposed by Ahmad., Baig, & Khan(2017), Riu
(2009), Kapferer (2008). it could be summarized that most customers perceived the
store image included product, price, safetiness, (after adopting food ),location and
promotion.
Even through each element should be concerned with the store image, some
elements could influence the brand loyalty of Japanese restaurant. However often
could not influence. The finding was found that only product and piece could
influence both attitudinal behavioral brand loyalty. This finding were related to the
explanation depicted by Kapferer (2008), Aaker (2003), & Smith (2003). They
explained that customer’s needs and their expectation were fulfilled with the store
contributions in terms of marketing mixes, the customer’s would come back to visit
the store again and in the future.
Moreover, the finding was also found that promotion could influence the
customer’s behavioral brand loyalty. The finding was related to Aaker (2003). Aaker
(2003) explained that promotion was the incentive tool the marketers have using to
attract customers to buy the product as quickly as possible, especially sale promotion.
Therefore, the promotion stayed closely with customer’s behavior.
5.2 Recommendation of Managerial Implementation
According the research findings, the researcher would like to explain as
managerial implementation in this followings as:
5.2.1.To develop the store image in terms of products, the owner of Japanese
restaurant should consider about the delicious taste of Japanese food, they should
33
keep the taste of food that Thai consumers delight and try to find the new delicious
taste of Japanese food continuously.
5.2.2. To develop the store image in terms of price, the owner of Japanese
restaurants should consider about the price should be clearly in advance, even the
price is sometimes changed.
5.2.3. To develop the store image in terms of saftiness, the owner of Japanese
restaurants should consider about cleanness and tidiness. Therefore, when customers
are safety after having the Japanese food, they will trust the restaurants and be willing
to come back again.
5.2.4. To develop the store image in terms of location , the owner of Japanese
restaurants should consider about the good locations of restaurants that is easy to use
the service, for example, the restaurants will be located at the shopping mall.
5.2.5. To develop the store image in terms of promotion, the owner of
Japanese restaurants should consider about the things that are very attracting for Thai
customers in each period of time or festival and the owners have to informed the
customer in advance via the channel that is very easy for customer to access. Such as
on-line channel in this present time.
5.2.6. In order to encourage Thai customers to come back again (brand loyalty
) the owners have to build the store image in term of product, price, and promotion as
mentioned in the research finding. In this concern, the owners can manage this
recommendation by considering what the research mentioned above.
5.3 Recommendation for Future Research
Regarding some elements of store image which did not influence the brand
loyalty. Those of which included saftiness and location. The researcher would
recommend others to further study the reason why they did not have any impact on
brand loyalty. The new finding could be useful for Japanese restaurants to develop the
strategies for maintaining their customers during the period of high competitions with
other types of restaurants in 2017 and next.
34
BIBLIOGRAPHY
Aaker, D. A.,(1991). Managing Brand Equity. New York: The Free Press.
Ahmad, Fareed., Khan, Anasar., Ahmed, Baig., & Mirza,Mahmood. (2017). NED
University Journal of Research, 15 (2), 35-46.
Ahmetoglu, G., Fried, S., Dawes, J., & Furnham, A. (2010). Pricing Practices: Their
Effects on Consumer Behavior and Welfare. Mountain view learning-
teaching brain science to business. Jababeka, Cikarang, Indonesia, Jababeka
Education Park.
Bearden, W.O. (1977). Determinant Attributes of Store Patronage: Downtown Versus
Outlying Shopping Areas. Journal of Retailing, 53, 15-22.
Baron, R.M., & Kenny, D.A. (1986). The Moderator–Mediator Variable Distinction
in Social Psychological Research: Conceptual l, Strategic and Statistical
Considerations. Journal of Personality and Social Psychology: General, 51
(6), 1173–1182.
Baker, J., Grewal, D., & Parasuraman, A. (1994). The Influence of Store Environment
on Quality and Store Image. Journal of the Academy of Marketing Science:
General, 22 (4), 328–339.
Brown, J. R., Chekitan S.Dev. (2007). Global Brand Expansion How to Select a
Market Entry Strategy. New York: Cornell University.
Cuningham, R. M. (1956). Brand Loyalty-What, Where, How much. Boston, Mass:
Harvard Business School Publ.
Doyle, P., & Fenwick, I. (1974). How Store Image Affects Shopping Habits in
Grocery Chains. Journal of Retailing: General, 50(4), 39-52.
35
NIOSH. (2012). Restaurant and Food Services: Advancing Priorities Through
Reserch and Partnerships. Retrieved from
https://www.cdc.gov/niosh/docs/2012-105/pdfs/2012-105.pdf
.Dick, A.S., Jain, A.K., & Richardson, P. (1995). Correlates of Store Brand
Proneness: Some Empirical Observations. Journal of Product and Brand
Management: General, 4 (4), 15–22.
Dick, A. S., & Basu, K. (1994). Journal of the Academe of Marketing Science, (22),
99 – 113.
Drummond, G., & Ensor J. (2005). Introduction to Marketing Concept. London:
Routledge.
Erkan, Akar., & Birol, Topcu. (2011). An Examination of the Factors Influencing
Consumers’ Attitudes Toward Social Media Marketing. Journal of Internet
Commerce, .10(1),35-67.
Fitzell, P. (1992). Private Label Marketing in the 1990s. The Evolution of Price
Labels into Global Brands. New York: Global Book.
Houston, M. J., & Nevin, J. R. (1981). Retail Shopping Area Image: Structure and
Congruence Between Downtown and Shopping Centers. Journal of
Advances in Consumer Research, 8, 677-81.
Jacoby, J., & Chestnu, R. W. (1978). Brand Loyalty: Measurement and Management.
New York: Wiley.
Jacoby, Jacob., Olson., Jerry C., & Haddock, Rafael A. (1971). Price, Brand Name
and Product Composition Characteristics as Determinants of Perceived
Quality. Journal of Applied Psychology: General, 55 (6),570-579.
36
James, D. L., Durand, R. M., & Dreves, R. A. (1976). The Use of a Multi-Attributes
Attitudes Model in a Store Image Study. Journal of Retailing, 52, 23-32.
Jain A. ( 2013). Principles of Marketing. India: New Delhi Rahul Jain-VK
Enterprises.
Juno A., Nabila, H. Z., Sheila, S. A., & Suresh K. (2013). The Analysis of Product,
Price, Place, Promotion, and Service Quality on Customers’ Buying
Decision of Convenience Store. International Journal of Advances in
Management and Economics, 2(6),72-78.
Kapferer, J. N. (2008). The New Strategic Brand Management: Creating and
Sustaining Brand Equity Long Term. London: Kogan Page.
Kumar A., & Sharma, R. (1998). Marketing Management. India, Atlantic.
Kunkel, J. H., & Berry, L. L. (1968), A Behavioral Conception of Retail Image.
Journal of Marketing, 32, 21-7.
Kotler, P., & Kotler, M. (2012). Market Your Way to Growth: 8 Ways to Win.
Washington:Wiley.
Lindquist, J. D. (1974). Meaning of Image: Survey of Empirical and Hypothetical
Evidence. Journal of Retailing, 50, 29-38.
Marks, R. B. (1976). Operationalizing the Concept of Store Image. Journal of
Retailing, 52, 37-46.
Mardhotillah, I. C. (2013). Pengaruh Kualitas Layanan Terhadap Keputusan
Pembelian Konsumen di Baseball Food Court. Indonesia: Universitas
Negeri Surabaya.
MacKinnon, D. P., Warsi, G., & Dwyer, J. H. (1995). A Simulation Study of Mediated
Effect Measures. Multivariate Behavioral Research, 30 (1), 42–62.
37
Sharma K (2008) Entrepreneurship. India: VK Publications.
Satit, R.P., Tat, H.H., Rasli, A., Chin T.A., & Sukati, I. (2012). The Relationship
Between Marketing Mix And Customer Decision-Making Over Travel
Agents: An Empirical Study. International Journal of Academic Research
in Business and Social Sciences. 2(6), 522-529.
Scott, Neslin., & Kannan, Srinivasan. (2002). Measuring the Impact of promotions on
Brand Switching Under Rational Consumer Behavior. Journal of Marketing
Research, 40, 389-405.
May, Aung., Anne, Wilcok., & Maria, Pun. (2004). Consumer attitudes, Knowledge
and Behavior: A Review of Food Safety issues. Journal of Trends in Food
Science & Technology, 15, 56-66
Muzondo, N., & Mutandwa, E. (2011). The Seven PS of Marketing and Choice of
Main Grocery Store in a Hyperinflationary Economy. Jorunal of
Contemporary Marketing Review, 1 (9), 15.
Mitchell, V. W., & Greatorex, M. (1993). Risk Perception and Reduction in the
Purchase of Consumer Services. The Service Industries Journal: General,
13, 179–200.
Mitchell, V.W., & McGoldrick, P.J. (1996). Consumers Risk-Reduction Strategies: a
Review and Synthesis. The International Review of Retail: Distribution and
Consumer Research, 6 (1), 1–33.
Olle, R., & Riu, D. (2009). Elnuevo Brand Management: Co Mo Plantar Marcas
Para Hacer Crecer Negocios.Gestion. Barcelona.
Rao. (2004). Services Marketing. India: Pearson Education India.
38
Richardson, P., Jain, A. K., & Dick, A. S. (1996). The Influence of Store Aesthetics
on the Evaluation of Private Label Brands. Journal of Product and Brand
Management: General, 5 (1), 19–28.
Salciuviene, L., Ghauri, P., Mockaitis, A., & De, Mattos, A. (2009). Brand Image
Perceptions Across Cultures: a Study of Symbolic and Functional
Associations. Journal of Advances in International Marketing, General, 20,
177–191.
Venkatraman, M. P. (1990). Opinion Leadership, Enduring Involvement and
Characteristics of Opinion Leaders: A Moderating or Mediating
Relationship. Journal of Advances in Consumer Research, 17, 60–67.
Willian, D. W. (2011). Advertising & Principles and Practice. Englewood: Prentice
Hall.
Zimmer, M. R., & Golden, L. L. (1988). Impressions of Retail Stores: A Content
Analysis of Consumer Images. Journal of Retailing, 64 (1), 265–293.

39
APPENDIX
40
Questionnaires
Part 1
Instruction: Please check () in front of the answer which is mostly related to your
opinions.
Q 1. Gender:
□ Male □Female
Q 2. Age:
□Under 20 years old □20- 29 □30-39 □40-49
□50 years and above
Q 3. Occupation:
□Student □Employee for Private Company
□Employee for Government Organization □Business Owner
□Independence
Q 4. Education Level
□High school □College & University □Graduate School
Q 5. Salary per month:
□10,000 bath or below □10,001-20,000 □20,001-30,000
□30,001-40,000 □40,001-50,000 □More than 50,000
Q 6. How often do you go to Japanese restaurant?
□Once a week □Twice a week □Once a month
□Twice a month □Others
Part 2
Instruction: Please check () in the block of the answers which is mostly related to
your perception.
Strongly perceive =5 Rather perceive =4 Neutral=3
Rather not perceive=2 Strongly not perceive=1
41
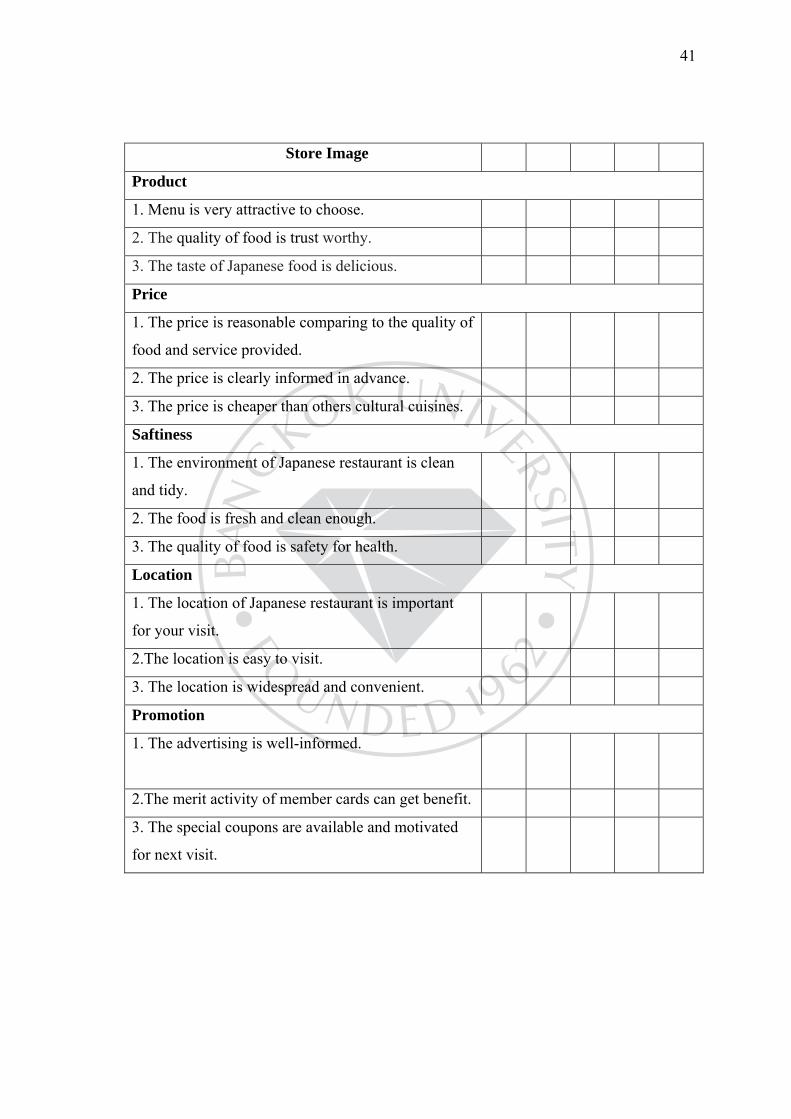
Store Image
Product
1. Menu is very attractive to choose.
2. The quality of food is trust worthy.
3. The taste of Japanese food is delicious.
Price
1. The price is reasonable comparing to the quality of
food and service provided.
2. The price is clearly informed in advance.
3. The price is cheaper than others cultural cuisines.
Saftiness
1. The environment of Japanese restaurant is clean
and tidy.
2. The food is fresh and clean enough.
3. The quality of food is safety for health.
Location
1. The location of Japanese restaurant is important
for your visit.
2.The location is easy to visit.
3. The location is widespread and convenient.
Promotion
1. The advertising is well-informed.
2.The merit activity of member cards can get benefit.
3. The special coupons are available and motivated
for next visit.
42
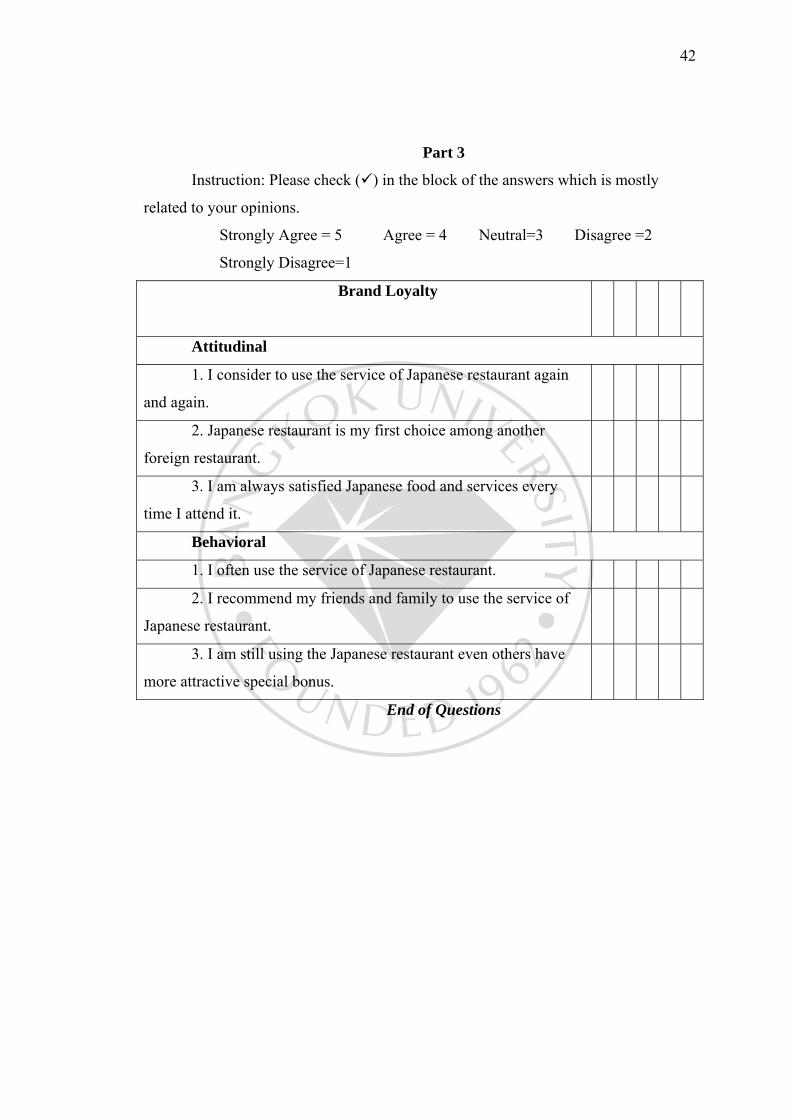
Part 3
Instruction: Please check () in the block of the answers which is mostly
related to your opinions.
Strongly Agree = 5 Agree = 4 Neutral=3 Disagree =2
Strongly Disagree=1
Brand Loyalty
Attitudinal
1. I consider to use the service of Japanese restaurant again
and again.
2. Japanese restaurant is my first choice among another
foreign restaurant.
3. I am always satisfied Japanese food and services every
time I attend it.
Behavioral
1. I often use the service of Japanese restaurant.
2. I recommend my friends and family to use the service of
Japanese restaurant.
3. I am still using the Japanese restaurant even others have
more attractive special bonus.
End of Questions
43
BIODATA
Name-Surname: Guanhao Huang
Educational Background:
Master’s Degree: Master of Business Administration
Bangkok University,Thailand
Bachelor’s Degree: Bachelor of Management
Phranakhon Si Ayutthaya Rajabhat University
Ayutthaya Thailand
Present Address: 1150/19-20 PK Apartment Room 805, Sukhumvit 48,
Phra Khong, Bangkok, Thailand
Telephone Number: 0873538658 (Mobile)
Email: [email protected]


![Brand Image[1]](https://img.pdfslide.us/doc/110x75/577d2f9f1a28ab4e1eb22bd0/brand-image1.jpg)