Embed Size (px)
Citation preview
T H E U. S . C H A M B E R O F CO M M E R C E P R E S E N T S
The Impact of State EmploymentPolicies on Job GrowthA 50-State Review
This report was prepared with research, drafting, editing and analytical support from Jeffrey A. Eisenach, Ph.D.* of Navigant Economics, LLC, as well as attorneys from Seyfarth Shaw LLP, including David S. Baffa, Dana Howells, Richard B. Lapp, Camille A. Olson, Alexander J. Passantino, and Leon R. Sequeira.
* With respect to Dr. Eisenach, the views expressed herein are his own and do not necessarily represent the views of Navigant Economics, LLC.
This report contains a summary of state laws and policies; it does not constitute legal advice and should not be relied upon as such.

Tier I: Good
Tier II: Fair
Tier III: Poor
AlabamaFloridaGeorgiaIdahoKansasMississippiNorth CarolinaNorth Dakota
OklahomaSouth CarolinaSouth DakotaTennesseeTexasUtahVirginia
Alaska ArizonaArkansasColoradoDelawareIndianaIowaKentuckyLouisianaMaryland
MinnesotaMissouriNebraskaNew HampshireNew MexicoOhioRhode IslandVermontWest VirginiaWyoming
CaliforniaConnecticutHawaiiIllinoisMaineMassachusettsMichiganMontana
Nevada New JerseyNew YorkOregonPennsylvaniaWashingtonWisconsin
AppendixA. State-by-State Factors 104B. Econometric Model 106
Contents
III. Evaluating State Employment Policies 22
A. The Employment Regulation Index 241. Key Aspects of State
Employment Policies 242. Generating the Index 31
B. A 50-State Review 32C. State-by-State Summaries 34
IV. Estimated Effects of State Employment Policies on Unemployment and New Business Formation 98
V. Summary and Conclusions 102
Executive Summary 5
I. Introduction 8
II. Prior Research on Employment Policies and Economic Growth 12
A. Employment Relationship and the Costs of Separation 14
B. Minimum Wage and Living Wage Laws 16
C. Unemployment Insurance and Workers’ Compensation 17
D. Wage and Hour Policies 18E. Collective Bargaining Issues 19F. Litigation/Enforcement Climate 21
4
“ Sometimes those rules have gotten out of balance, placing unreasonable burdens on business—burdens that have stifled innovation and have had a chilling effect on growth and jobs.”
— President Barack Obama, The Wall Street Journal, 1/18/11
“ There are hundreds of thousands of new jobs to be created if California regulatory authorities make sensible and bold decisions.”
— California Governor Jerry Brown, 1/3/11
5
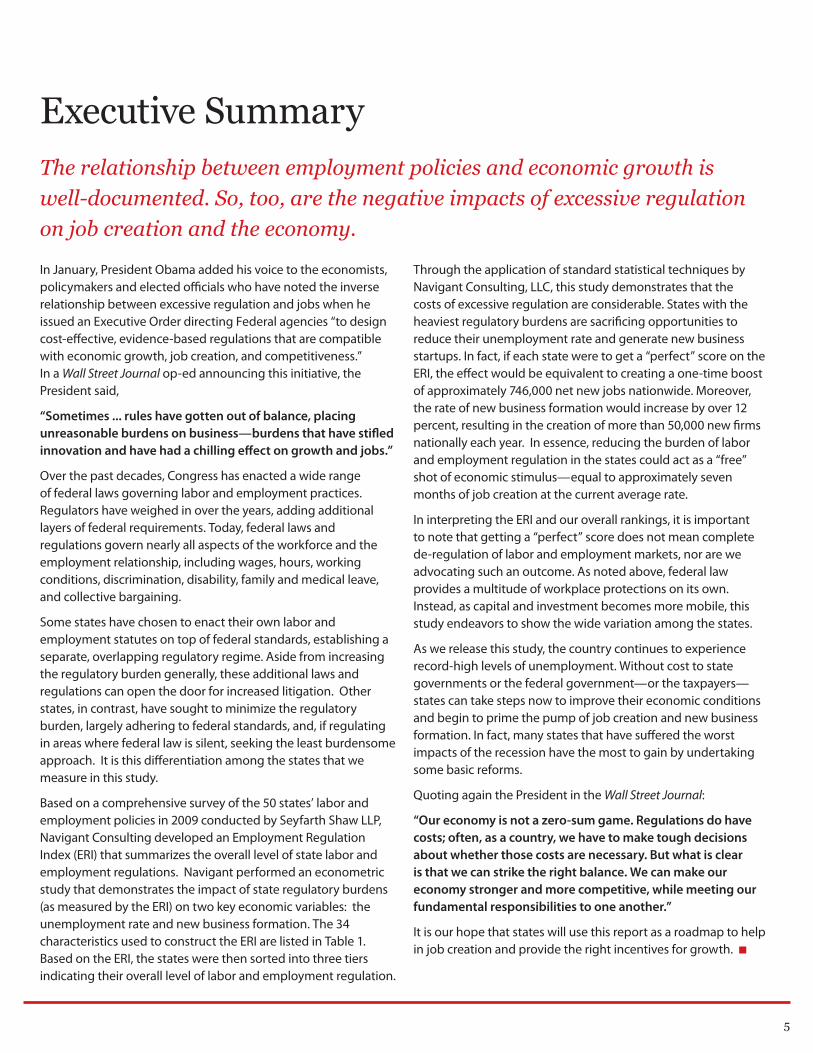
Executive Summary
In January, President Obama added his voice to the economists, policymakers and elected officials who have noted the inverse relationship between excessive regulation and jobs when he issued an Executive Order directing Federal agencies “to design cost-effective, evidence-based regulations that are compatible with economic growth, job creation, and competitiveness.” In a Wall Street Journal op-ed announcing this initiative, the President said,
“Sometimes ... rules have gotten out of balance, placing unreasonable burdens on business—burdens that have stifled innovation and have had a chilling effect on growth and jobs.”
Over the past decades, Congress has enacted a wide range of federal laws governing labor and employment practices. Regulators have weighed in over the years, adding additional layers of federal requirements. Today, federal laws and regulations govern nearly all aspects of the workforce and the employment relationship, including wages, hours, working conditions, discrimination, disability, family and medical leave, and collective bargaining.
Some states have chosen to enact their own labor and employment statutes on top of federal standards, establishing a separate, overlapping regulatory regime. Aside from increasing the regulatory burden generally, these additional laws and regulations can open the door for increased litigation. Other states, in contrast, have sought to minimize the regulatory burden, largely adhering to federal standards, and, if regulating in areas where federal law is silent, seeking the least burdensome approach. It is this differentiation among the states that we measure in this study.
Based on a comprehensive survey of the 50 states’ labor and employment policies in 2009 conducted by Seyfarth Shaw LLP, Navigant Consulting developed an Employment Regulation Index (ERI) that summarizes the overall level of state labor and employment regulations. Navigant performed an econometric study that demonstrates the impact of state regulatory burdens (as measured by the ERI) on two key economic variables: the unemployment rate and new business formation. The 34 characteristics used to construct the ERI are listed in Table 1. Based on the ERI, the states were then sorted into three tiers indicating their overall level of labor and employment regulation.
Through the application of standard statistical techniques by Navigant Consulting, LLC, this study demonstrates that the costs of excessive regulation are considerable. States with the heaviest regulatory burdens are sacrificing opportunities to reduce their unemployment rate and generate new business startups. In fact, if each state were to get a “perfect” score on the ERI, the effect would be equivalent to creating a one-time boost of approximately 746,000 net new jobs nationwide. Moreover, the rate of new business formation would increase by over 12 percent, resulting in the creation of more than 50,000 new firms nationally each year. In essence, reducing the burden of labor and employment regulation in the states could act as a “free” shot of economic stimulus—equal to approximately seven months of job creation at the current average rate.
In interpreting the ERI and our overall rankings, it is important to note that getting a “perfect” score does not mean complete de-regulation of labor and employment markets, nor are we advocating such an outcome. As noted above, federal law provides a multitude of workplace protections on its own. Instead, as capital and investment becomes more mobile, this study endeavors to show the wide variation among the states.
As we release this study, the country continues to experience record-high levels of unemployment. Without cost to state governments or the federal government—or the taxpayers—states can take steps now to improve their economic conditions and begin to prime the pump of job creation and new business formation. In fact, many states that have suffered the worst impacts of the recession have the most to gain by undertaking some basic reforms.
Quoting again the President in the Wall Street Journal:
“Our economy is not a zero-sum game. Regulations do have costs; often, as a country, we have to make tough decisions about whether those costs are necessary. But what is clear is that we can strike the right balance. We can make our economy stronger and more competitive, while meeting our fundamental responsibilities to one another.”
It is our hope that states will use this report as a roadmap to help in job creation and provide the right incentives for growth.
The relationship between employment policies and economic growth is well-documented. So, too, are the negative impacts of excessive regulation on job creation and the economy.
6
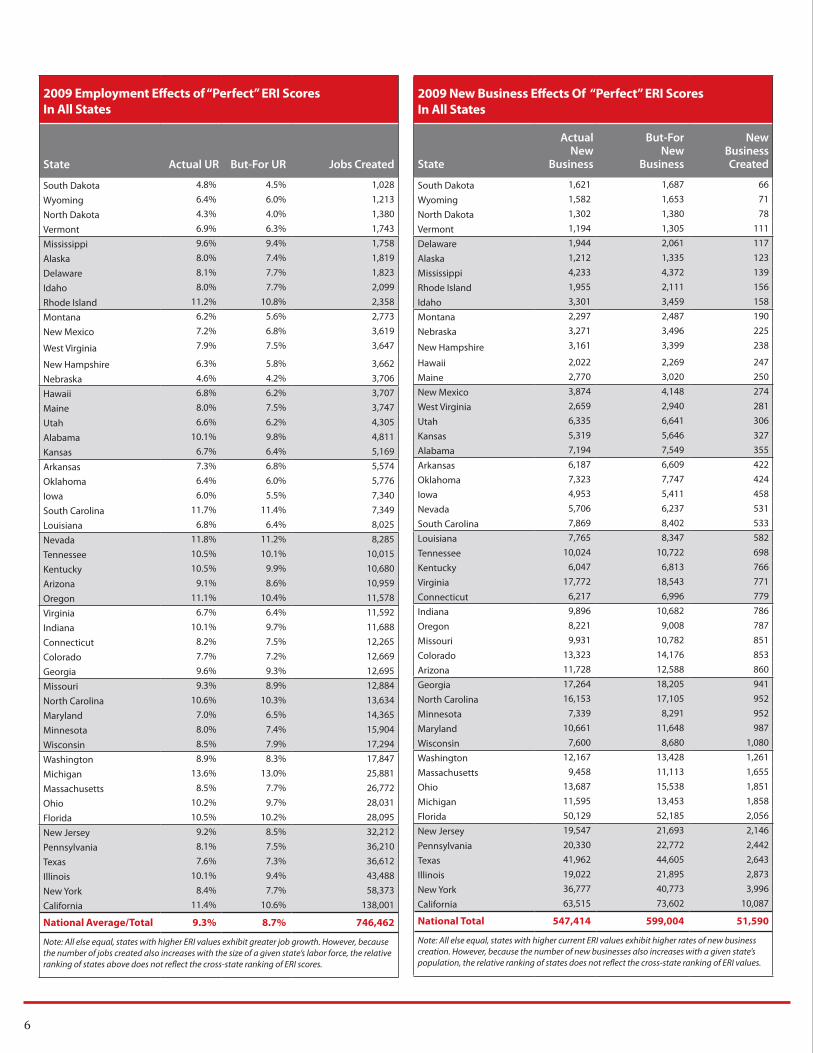
2009 New Business Effects Of “Perfect” ERI Scores In All States
State
Actual New
Business
But-For New
Business
New Business Created
South Dakota 1,621 1,687 66
Wyoming 1,582 1,653 71
North Dakota 1,302 1,380 78
Vermont 1,194 1,305 111
Delaware 1,944 2,061 117
Alaska 1,212 1,335 123
Mississippi 4,233 4,372 139
Rhode Island 1,955 2,111 156
Idaho 3,301 3,459 158
Montana 2,297 2,487 190
Nebraska 3,271 3,496 225
New Hampshire 3,161 3,399 238
Hawaii 2,022 2,269 247
Maine 2,770 3,020 250
New Mexico 3,874 4,148 274
West Virginia 2,659 2,940 281
Utah 6,335 6,641 306
Kansas 5,319 5,646 327
Alabama 7,194 7,549 355
Arkansas 6,187 6,609 422
Oklahoma 7,323 7,747 424
Iowa 4,953 5,411 458
Nevada 5,706 6,237 531
South Carolina 7,869 8,402 533
Louisiana 7,765 8,347 582
Tennessee 10,024 10,722 698
Kentucky 6,047 6,813 766
Virginia 17,772 18,543 771
Connecticut 6,217 6,996 779
Indiana 9,896 10,682 786
Oregon 8,221 9,008 787
Missouri 9,931 10,782 851
Colorado 13,323 14,176 853
Arizona 11,728 12,588 860
Georgia 17,264 18,205 941
North Carolina 16,153 17,105 952
Minnesota 7,339 8,291 952
Maryland 10,661 11,648 987
Wisconsin 7,600 8,680 1,080
Washington 12,167 13,428 1,261
Massachusetts 9,458 11,113 1,655
Ohio 13,687 15,538 1,851
Michigan 11,595 13,453 1,858
Florida 50,129 52,185 2,056
New Jersey 19,547 21,693 2,146
Pennsylvania 20,330 22,772 2,442
Texas 41,962 44,605 2,643
Illinois 19,022 21,895 2,873
New York 36,777 40,773 3,996
California 63,515 73,602 10,087
National Total 547,414 599,004 51,590
Note: All else equal, states with higher current ERI values exhibit higher rates of new business creation. However, because the number of new businesses also increases with a given state’s population, the relative ranking of states does not reflect the cross-state ranking of ERI values.
2009 Employment Effects of “Perfect” ERI Scores In All States
State Actual UR But-For UR Jobs Created
South Dakota 4.8% 4.5% 1,028
Wyoming 6.4% 6.0% 1,213
North Dakota 4.3% 4.0% 1,380
Vermont 6.9% 6.3% 1,743
Mississippi 9.6% 9.4% 1,758
Alaska 8.0% 7.4% 1,819
Delaware 8.1% 7.7% 1,823
Idaho 8.0% 7.7% 2,099
Rhode Island 11.2% 10.8% 2,358
Montana 6.2% 5.6% 2,773
New Mexico 7.2% 6.8% 3,619
West Virginia 7.9% 7.5% 3,647
New Hampshire 6.3% 5.8% 3,662
Nebraska 4.6% 4.2% 3,706
Hawaii 6.8% 6.2% 3,707
Maine 8.0% 7.5% 3,747
Utah 6.6% 6.2% 4,305
Alabama 10.1% 9.8% 4,811
Kansas 6.7% 6.4% 5,169
Arkansas 7.3% 6.8% 5,574
Oklahoma 6.4% 6.0% 5,776
Iowa 6.0% 5.5% 7,340
South Carolina 11.7% 11.4% 7,349
Louisiana 6.8% 6.4% 8,025
Nevada 11.8% 11.2% 8,285
Tennessee 10.5% 10.1% 10,015
Kentucky 10.5% 9.9% 10,680
Arizona 9.1% 8.6% 10,959
Oregon 11.1% 10.4% 11,578
Virginia 6.7% 6.4% 11,592
Indiana 10.1% 9.7% 11,688
Connecticut 8.2% 7.5% 12,265
Colorado 7.7% 7.2% 12,669
Georgia 9.6% 9.3% 12,695
Missouri 9.3% 8.9% 12,884
North Carolina 10.6% 10.3% 13,634
Maryland 7.0% 6.5% 14,365
Minnesota 8.0% 7.4% 15,904
Wisconsin 8.5% 7.9% 17,294
Washington 8.9% 8.3% 17,847
Michigan 13.6% 13.0% 25,881
Massachusetts 8.5% 7.7% 26,772
Ohio 10.2% 9.7% 28,031
Florida 10.5% 10.2% 28,095
New Jersey 9.2% 8.5% 32,212
Pennsylvania 8.1% 7.5% 36,210
Texas 7.6% 7.3% 36,612
Illinois 10.1% 9.4% 43,488
New York 8.4% 7.7% 58,373
California 11.4% 10.6% 138,001
National Average/Total 9.3% 8.7% 746,462
Note: All else equal, states with higher ERI values exhibit greater job growth. However, because the number of jobs created also increases with the size of a given state’s labor force, the relative ranking of states above does not reflect the cross-state ranking of ERI scores.
7
“ [M]y only purpose and passion is to lift Ohio, make it competitive and create jobs.”
— Ohio Governor John Kasich, 1/10/11
“ The No. 1 job for Colorado’s next governor will be job creation and economic recovery.”
— Colorado Governor John Hickenlooper, 9/28/10 Statement made as candidate

Introduction
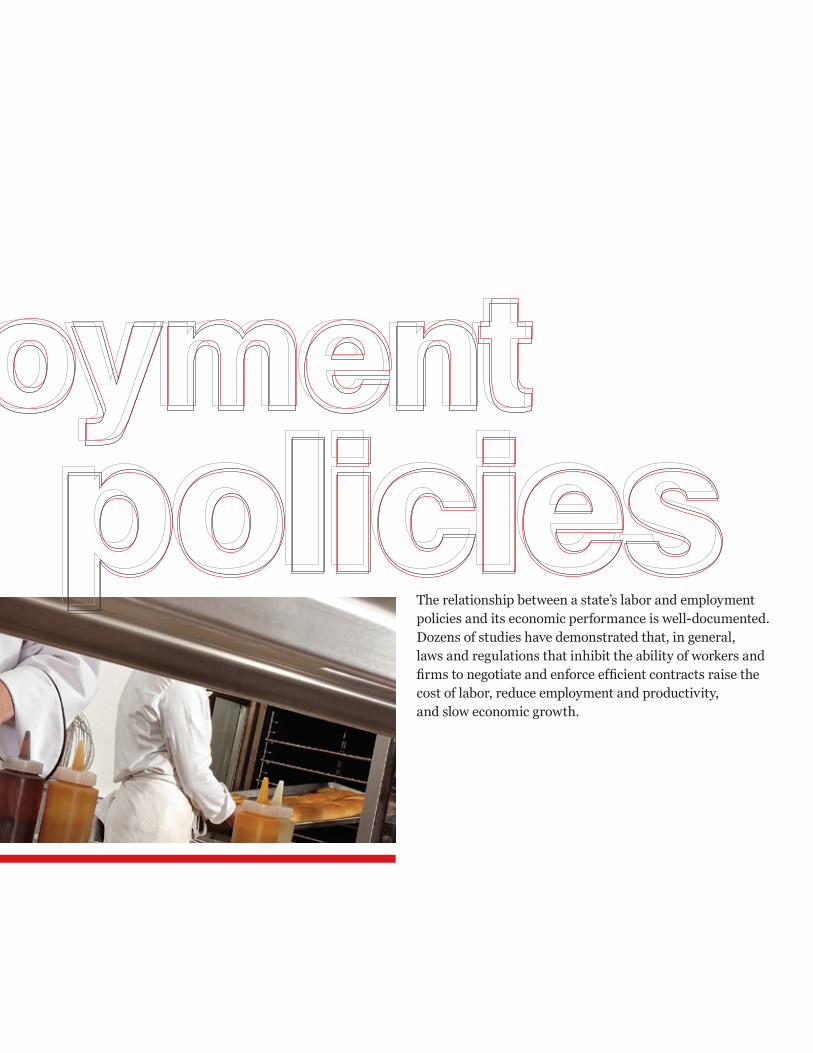
The relationship between a state’s labor and employment policies and its economic performance is well-documented. Dozens of studies have demonstrated that, in general, laws and regulations that inhibit the ability of workers and firms to negotiate and enforce efficient contracts raise the cost of labor, reduce employment and productivity, and slow economic growth.

10
The results reported in this study confirm the findings of previous research, present new empirical evidence on the nature and magnitude of the effects of state labor and employment policies—particularly those that exceed federal standards—on employment and growth, and present a framework for evaluating state labor and employment policies in the aggregate. Our primary goal is to provide state policymakers with an objective view of how policies in their states compare with policies in other states, and, perhaps more importantly, how reform of these policies could accelerate job creation and economic growth.
Based on a comprehensive survey of employment policies in the 50 U.S. states in 2009, we developed an Employment Regulation Index (“ERI”) that measures the impact of state labor and employment regulation on a scale of one to 100 with a score of 100 calibrated to represent the most heavily regulated state.
In interpreting the ERI, and our overall rankings, it is important to recognize that getting a score of “one” on the ERI does not mean complete deregulation of labor and employment markets, or a lack of any enforcement, nor are we advocating for such outcomes. In most cases, the laws and regulations discussed here are layered on top of federal standards in a separate, overlapping regulatory regime, which, in addition to increasing the regulatory burden generally, can also open the door for increased litigation. In other cases, states could benefit simply by streamlining regulations in areas where federal law is silent. However, state-level labor and employment regulation is, in many ways, a matter of local preference. Policymakers and residents in a given state may desire a heavier burden of employment regulation. The purpose of this study is to show which states have signaled a preference for that heavier burden and to illustrate some of the benefits that are being sacrificed as a result.
The ERI is based on rankings of 34 measures of state labor and employment policies covering six different categories: (1) The Employment Relationship and the Costs of Separation; (2) Minimum Wage and Living Wage Laws; (3) Unemployment Insurance and Workers’ Compensation; (4) Wage and Hour Policies; (5) Collective Bargaining Issues; and (6) the Litigation/Enforcement Climate. Both the categories and the individual characteristics were chosen in order to capture differences among states in policies generally understood to affect economic performance. For example, there is a significant body of empirical research on the relationship between the “employment-at-will doctrine” and unemployment, the bulk of which suggests that policies that weaken the employment-at-will doctrine (such as mandatory notification periods prior to separation, or excessive opportunities for litigation associated with “wrongful termination” claims) tend to reduce job creation and increase unemployment. Thus, the ERI includes measures of six specific
TABLE 1: CATEGORIES AND SUBTOPICS
Employment Relationships and the Costs of Separation
•Layoff Notification Requirements Beyond Federal Law•Treatment of Employment-At-Will Doctrine• Whether Employee Handbook is Converted to
Enforceable Contract• Whether Courts will Blue-Pencil (or Sever)
an Employment Contract•Treatment of Covenants Not to Compete•Timing Requirements for Last Paycheck•Treatment of Independent-Contractor Relationships
Minimum Wage and LIving Wage Laws
• Amount of State Minimum Wage Beyond Federal Requirements•Existence of State Prevailing Wage Laws•Existence of Living Wage Laws in Major City in the State
Unemployment Insurance and Workers’ Compensation
•Maximum Regular Unemployment Benefits (No Extensions)•Wage Ceiling Subject to Unemployment Insurance Tax•Waiting Period to Receive Unemployment Benefits•Workers’ Compensation Benefits per $100 of Covered Wages•Waiting Time for Workers’ Compensation Benefits•Workers’ Compensation Premium Rate Index•Whether Workers’ Compensation Self-Insurance is Permitted
Wage and Hour Policies
•Additional State Overtime Requirements•Meal/Rest Requirements and Complexity•Additional State Leave Requirements•Complexity of Payout of Vacation Accruals•State Posting and Notice Requirements•State Record Retention Requirements
Collective Bargaining Issues
•Private-Sector Union Membership Percentage•Right-to-Work State• Availability of Unemployment Benefits
to Locked-Out Employees / Strikers•State Laws that Affect Labor Organizing Efforts
Litigation/Enforcement Climate
•Existence of Employment-Law Related Debarment•Enforcement Posture of State Department of Labor•Structure of State Human/Employment Rights Commission• Number of Federal Employment and Labor Lawsuits
per 10,000 Employees•Strength of Protection for Employers Providing References•Restrictions on Employer Inquiries into Applicant History• Complexity of State-based Employment Discrimination
Laws Beyond Federal Requirements
11
policies associated with the employment-at-will doctrine, including whether a state has passed a Mini-WARN Act in excess of federal standards and whether its laws and jurisprudence respect the employment-at-will doctrine in typical employment situations. The 34 characteristics used to construct the ERI are listed in Table 1 on page 10.
To confirm that the policy characteristics measured by the ERI have an impact on economic performance, we constructed econometric models to estimate the determinants of two important state-level economic variables, the unemployment rate and the rate of new business formation. Applying standard statistical techniques, we found that, when the ERI is inserted as an explanatory variable, our models demonstrate that higher levels of regulation (i.e., higher ERI scores) result in both higher unemployment and lower rates of new business formation, and that the effect is statistically significant at standard confidence levels. Moreover, the magnitude of the estimated effects is substantial. We estimate that, if each state were to achieve a “perfect” score on the ERI, the effect would be equivalent to a one-time boost of approximately 746,000 net new jobs. Moreover, the rate of new business formation would increase by over 12 percent, resulting in the creation of more than 50,000 new businesses each year. Thus, our results not only confirm that the ERI is accurately measuring relevant aspects of state employment policies, but also provide new evidence that the policy characteristics comprising the index have a significant effect on economic performance.
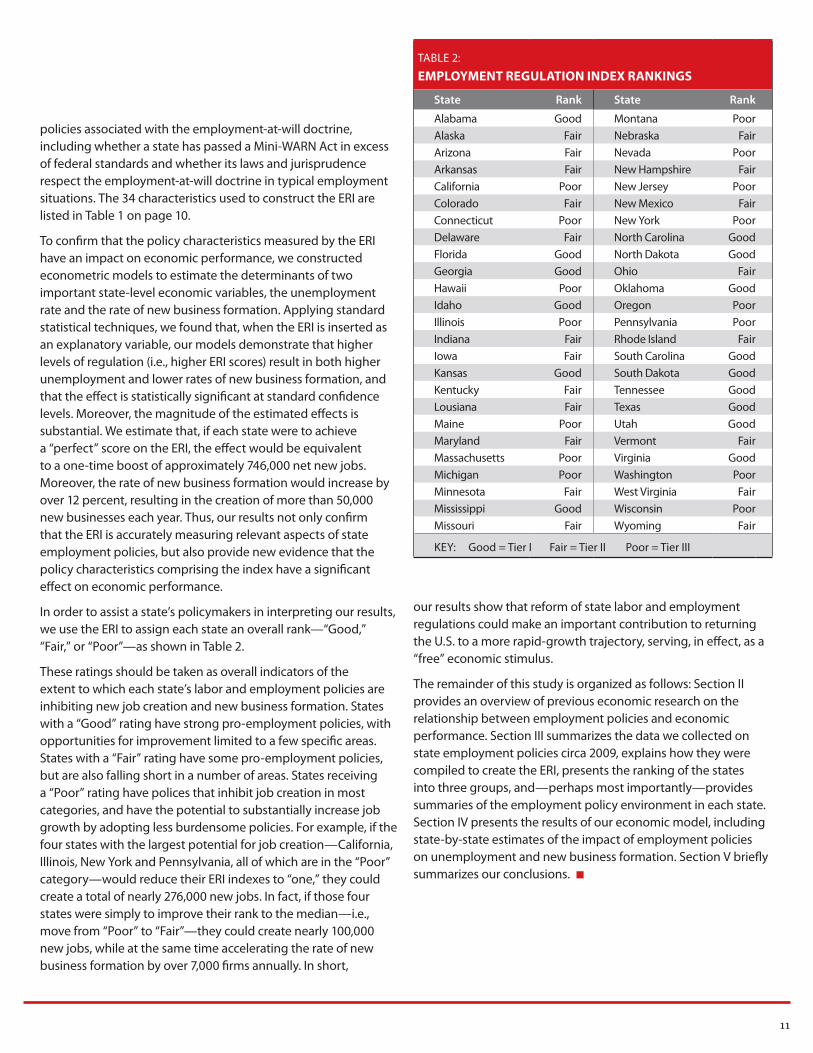
In order to assist a state’s policymakers in interpreting our results, we use the ERI to assign each state an overall rank—“Good,” “Fair,” or “Poor”—as shown in Table 2.
These ratings should be taken as overall indicators of the extent to which each state’s labor and employment policies are inhibiting new job creation and new business formation. States with a “Good” rating have strong pro-employment policies, with opportunities for improvement limited to a few specific areas. States with a “Fair” rating have some pro-employment policies, but are also falling short in a number of areas. States receiving a “Poor” rating have polices that inhibit job creation in most categories, and have the potential to substantially increase job growth by adopting less burdensome policies. For example, if the four states with the largest potential for job creation—California, Illinois, New York and Pennsylvania, all of which are in the “Poor” category—would reduce their ERI indexes to “one,” they could create a total of nearly 276,000 new jobs. In fact, if those four states were simply to improve their rank to the median—i.e., move from “Poor” to “Fair”—they could create nearly 100,000 new jobs, while at the same time accelerating the rate of new business formation by over 7,000 firms annually. In short,
our results show that reform of state labor and employment regulations could make an important contribution to returning the U.S. to a more rapid-growth trajectory, serving, in effect, as a “free” economic stimulus.
The remainder of this study is organized as follows: Section II provides an overview of previous economic research on the relationship between employment policies and economic performance. Section III summarizes the data we collected on state employment policies circa 2009, explains how they were compiled to create the ERI, presents the ranking of the states into three groups, and—perhaps most importantly—provides summaries of the employment policy environment in each state. Section IV presents the results of our economic model, including state-by-state estimates of the impact of employment policies on unemployment and new business formation. Section V briefly summarizes our conclusions.
TABLE 2: EMPLOYMENT REGULATION INDEX RANKINGS
State Rank State Rank
Alabama Good Montana PoorAlaska Fair Nebraska FairArizona Fair Nevada PoorArkansas Fair New Hampshire FairCalifornia Poor New Jersey PoorColorado Fair New Mexico FairConnecticut Poor New York PoorDelaware Fair North Carolina GoodFlorida Good North Dakota GoodGeorgia Good Ohio FairHawaii Poor Oklahoma GoodIdaho Good Oregon PoorIllinois Poor Pennsylvania PoorIndiana Fair Rhode Island FairIowa Fair South Carolina GoodKansas Good South Dakota GoodKentucky Fair Tennessee GoodLousiana Fair Texas GoodMaine Poor Utah GoodMaryland Fair Vermont FairMassachusetts Poor Virginia GoodMichigan Poor Washington PoorMinnesota Fair West Virginia FairMississippi Good Wisconsin PoorMissouri Fair Wyoming Fair
KEY: Good = Tier I Fair = Tier II Poor = Tier III
Prior Research on Employment Policies and Economic Growth
1 A comprehensive review of the economic literature on these topics is beyond the scope of this study, and we recognize there are areas in which the empirical results are not yet conclusive. However, the central conclusion of this section—that more intrusive employment regulation, in general, reduces employment and slows economic growth—is extremely well-documented. See generally, for example, Juan C. Botero, et al, “The Regulation of Labor,” The Quarterly Journal of Economics (November 2004) 1339–1382 at 1339 (“We investigate the regulation of labor markets through employment, collective relations, and social security laws in 85 countries... Heavier regulation of labor is associated with lower labor force participation and higher unemployment, especially of the young.”)
The relationship between employment policies and economic growth is well-documented. Broadly speaking, regulations that unnecessarily limit the flexibility of employees and employers to enter into binding contracts, or that impose additional mandates or costs on the employment relationship, generally raise the costs of labor and reduce job creation and economic growth. Such policies have both direct and indirect impacts. First, by making it more expensive to employ workers, they reduce hiring and raise costs. Second, regulations and mandates reduce the ability of employers, and the economy overall, to respond efficiently to either cyclical or structural changes, thereby reducing long-run economic growth.
There is extensive empirical evidence on the effects of various types of employment policies on jobs and economic growth. Much of that evidence takes the form
of cross-sectional analyses which compare results either across countries or, in the case of the U.S., across states. International differences in employment policies have been found to affect the relative growth rates of national economies. At the national level, differences among the 50 U.S. states have been shown to have a significant effect on job creation and other measures of economic growth. This section reviews the empirical evidence on the economic effects of employment regulation, focusing on the six main categories mentioned previously: (1) The Employment Relationship and the Costs of Separation; (2) State Minimum Wage and Living Wage Laws and their variation from federal standards; (3) Unemployment Insurance and Workers’ Compensation; (4) State Wage and Hour Policies and differences from federal law; (5) Collective Bargaining Issues; and (6) the Litigation and Enforcement Climate.1
14
Employment Relationship and the Costs of SeparationIt is widely recognized that the costs of employment are raised by legal and regulatory policies that increase the cost and difficulty of separations when warranted.
The default standard under English common law, known as the employment-at-will doctrine,2 has historically been that employment contracts are “at will,” and thus employers have broad rights to dismiss employees for reasons such as malfeasance, non-performance and economic necessity. With a few notable exceptions, federal law is largely silent on the employment-at-will doctrine.
2 Montana (1987) is the only state to have adopted a legislatively-directed change to the employment-at-will doctrine. See e.g., Alan B. Krueger, “The Evolution of Unjust-Dismissal Legislation in the United States,” Industrial and Labor Relations Review 44;4 (July 1991) 644–660.
3 See Horst Seibert, “Labor Market Rigidities: At the Root of Unemployment in Europe,” The Journal of Economic Perspectives 11 (Summer 1997) 37–54; see also Stephen Nickell, “Unemployment and Labor Market Rigidities: Europe Versus North America,” The Journal of Economic Perspectives 11 (Summer 1997) 55–74 and Samuel Bentolila and Guiseppe Bertola, “Firing Costs and Labour Demand: How Bad is Eurosclerosis?” Review of Economic Studies 57 (1990) 381–402. For early research on the impact of plant closing legislation in the U.S., see Ronald G. Ehrenberg and George H. Jakubson, “Advance Notice Provisions in Plant Closing Legislation: Do They Matter?” (National Bureau of Economic Research, June 1988).
4 See James N. Dertouzos and Lynn A. Karoly, Labor-Market Responses to Employer Liability (Rand Institute for Civil Justice, 1992) at 63 (“Our analysis provides evidence that wrongful-termination liability creates substantial costs beyond those directly attributable to lawsuits. ... Aggregate employment drops by 2 to 5 percent.”); see also James N. Dertouzos, The End of Employment-at-Will: Legal and Economic Costs (Rand Corporation, Report No. P-7441, May 1988).
There is, however, significant variation at the state level. First, juries (and, to a lesser extent, state court judges) in some states have slowly eroded the employment-at-will doctrine. There is also significant diversity in how states treat issues such as whether employee handbooks constitute enforceable contracts, the enforceability of post-employment non-competition agreements, and the extent to which they permit firms to utilize independent contractors, who can generally be dismissed with little or no notice. Finally, several states have adopted what are known as “mini-WARN” acts, which generally mirror the federal WARN Act but with additional requirements of one sort or another.
There is extensive literature examining the impact of these types of separation costs on employment and employment growth. First, an extensive body of research examined the causes of the high unemployment rates that prevailed in many European countries after the mid-1980s. These persistently high unemployment rates, over 20 percent for years in countries such as Spain, were termed “Eurosclerosis.” While a range of policies were considered as potential culprits, significant attention was devoted to the hypothesis that laws that made it very difficult for employers to lay off or otherwise dismiss employees had made employers reluctant to take on new employees. The overall consensus of this literature is that the erosion of the employment-at-will doctrine in Europe was responsible for a significant proportion of Europe’s high unemployment.3
A second portion of the economics literature addresses the consequences of interstate differences in the applicability of the employment-at-will doctrine, including an important series of papers by Professor David Autor of the Massachusetts Institute of Technology and his coauthors, who have demonstrated that the erosion of the employment-at-will doctrine has had consequences for the labor market. There is strong evidence that states that adopted common-law exceptions to the employment-at-will doctrine have seen slower employment growth and lower employment levels, in line with the results on Eurosclerosis. In an important 1992 paper from the Rand Corporation, for example, Dertouzas and Karoly found that expansive liability for wrongful termination affected employment by as much as 2 to 5 percent.4 More recently, Autor, Donohue and Schwab found a smaller but highly robust effect, concluding that the establishment of an implied contract
15
5 See David H. Autor, John J. Donohue III and Stewart J. Schwab, “The Employment Consequences of Wrongful-Discharge Laws: Large, Small, or Not at All?” American Economic Review 94;2 (May 2004) 440–446 at 445. See also See David H. Autor, John J. Donohue III and Stewart J. Schwab, “The Costs of Wrongful Discharge Laws” (National Bureau of Economic Research Working Paper No. 9425, January 2003.) Autor et al distinguish between three types of exceptions to employment-at-will: (a) a ”public policy” exception wherein employers are prohibited from firing workers for activities in support of public policy, such as jury duty or whistleblowing; (b) a “good faith” exception whereby employers are prohibited from firing workers to avoid scheduled payments such as year-end bonuses and commissions; and, (c) a “implied contract” exception whereby the representations of employers in employee manuals and offer letters are interpreted as promises to fire a worker only for good cause. They find that the implied contract exception is the primary cause of employment reductions.
6 See David H. Autor, “Outsourcing at Will: The Contribution of Unjust Dismissal Doctrine to the Growth of Employment Outsourcing,” Journal of Labor Economics 21;1 (2003) 1–41. See also Jeffrey A. Eisenach, “The Role of Independent Contractors in the U.S. Economy” (Navigant Economics, December 2010) (available at http://papers.ssrn.com/sol3/papers.cfm?abstract_id=1717932).
7 See e.g., David H. Autor, William R. Kerr and Adriana D. Kugler, “Do Employment Protections Reduce Productivity? Evidence from U.S. States” (IZA Discussion Paper 2571, January 2007) at 3 (“[W]hile our analysis provides novel direct evidence that employment protections may reduce firm-level productivity, the results must be viewed as tentative.”)
exception to the employment-at-will doctrine leads to a 0.8 to 1.6 percent reduction in the employment-to-population ratio.5 Separately, Autor also has demonstrated that the erosion of the employment-at-will doctrine has led to the increased use of temporary (or “contingent”) workers in an effort by employers to avoid increased costs;6 and, Autor, Kerr and Kugler have found “tentative” evidence of a negative impact on productivity.7
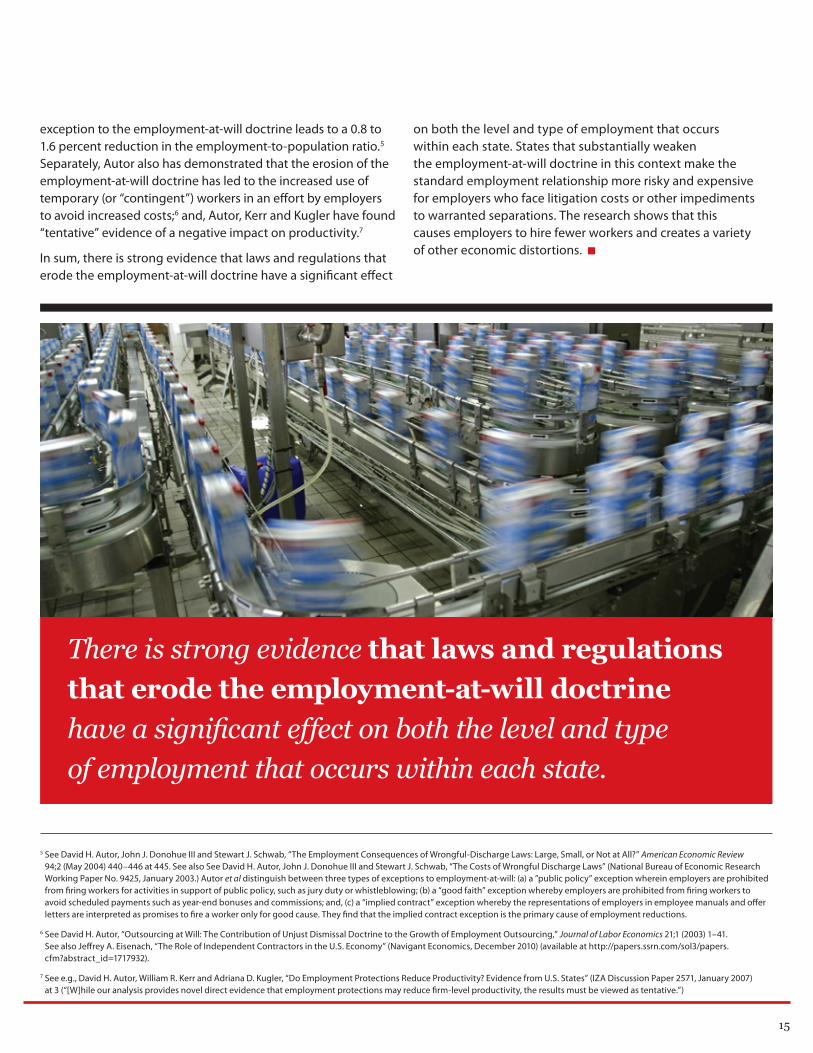
In sum, there is strong evidence that laws and regulations that erode the employment-at-will doctrine have a significant effect
on both the level and type of employment that occurs within each state. States that substantially weaken the employment-at-will doctrine in this context make the standard employment relationship more risky and expensive for employers who face litigation costs or other impediments to warranted separations. The research shows that this causes employers to hire fewer workers and creates a variety of other economic distortions.
There is strong evidence that laws and regulations that erode the employment-at-will doctrine have a significant effect on both the level and type of employment that occurs within each state.
16
8 See Charles Brown, Curtis Gilroy and Andrew Kohen, “The Effect of the Minimum Wage on Employment and Unemployment,” Journal of Economic Literature 20;2 (June 1982) 487–528. See also David Neumark and William Wascher, “Employment Effects of Minimum and Subminimum Wages: Panel Data on State Minimum Wage Laws,” Industrial and Labor Relations Review 46;1 (October 1992) 55–80.
9 See Manfred Keil, Donald Robinson and James Symons, “Univariate Regressions of Employment on Minimum Wages in the Panel of U.S. States” (April 2009) at 23 (“The conclusion of this paper is that there now appears to be a strong negative correlation between minimum wages and youth employment detectable in the current panel of U.S. states.”). Living wage laws, under which cities impose still higher minimum wage requirements, typically on city contractors or firms receiving some form of business assistance, have been shown to have similar effects, that is, while raising wages, they reduce employment. See, e.g., Scott Adams and David Neumark, “Living Wage Effects: New and Improved Evidence,” Economic Development Quarterly 19;1 (February 2005) 80–102, at 81 (“[A]s economic theory would lead us to expect, living wage laws present a trade-off between wages and employment.”)
Minimum Wage Laws and Living Wage LawsThe federal minimum wage was implemented along with standards for overtime as part of the 1938 Fair Labor Standards Act (FLSA). The initial act set a minimum hourly wage of $0.30 per hour. The federal minimum has been modified repeatedly in the ensuing seven decades and is currently set at $7.25 per hour. Certain states, such as California, had state-specific minimum wages that predated the FLSA and many other states have from time to time had their own policy. Since both the federal and state policies are just that, minimum wages, the effective minimum wage is the higher of the federal and state rates in cases where both apply. While most states adhere to the federal standard, a number of states currently have rates above the federal rate, including California, New York, Massachusetts and Washington.
The conventional view of minimum wages has always been that they have two direct effects. First, they raise the wage for employees that, absent the minimum, would have a market wage below the minimum. Second, because they have raised the price of labor, the amount of labor demanded by employers is decreased, resulting in higher unemployment, particularly among younger workers.
The weight of the empirical evidence is consistent with these hypotheses. Early studies, for example, found a strong negative relationship between minimum wages and employment, finding that a 10 percent increase in the minimum wage results in a 1–2 percent decrease in the employment rate of the low-wage population.8 While this consensus was challenged by a series of papers in the 1990s, more recent research based on data from the current decade has reaffirmed the traditional view.9
There are important secondary impacts of the minimum wage as well. One of these effects is a reduction in the amount of training provided by employers to low-income employees. A basic tenet of human capital theory, one of the foundations of labor economics, is that employees often “finance” training they receive from their employers by accepting a lower wage during
the initial period of employment. Because they preclude certain types of low-wage employment, minimum wages close off some on-the-job training opportunities for young, low-skill workers and, as a result, close off some avenues for career advancement for that population.
An important effect of state-level minimum wages is to increase the wage bill for employers in affected states. Unlike certain other policies, such as corporate income taxes, minimum wages increase costs for a relatively select set of employers. In particular, employers of low-skilled, entry-level labor such as restaurants and retail establishments experience significant increases in their labor costs, whereas employers of high-skilled, advanced-career labor experience relatively smaller effects. To the extent small businesses are more likely to rely on lower-paid workers, minimum wages may disproportionately affect new business formation.
17
10 See, e.g., Alan B. Krueger and Bruce B. Meyer, “Labor Supply Effects of Social Insurance,” National Bureau of Economic Research Working Paper 9014 (June 2002) at i (“The empirical work on unemployment insurance (UI) and workers’ compensation (WC) insurance finds that the programs tend to increase the length of time employees spend out of work. Most of the estimates of the elasticities of lost work time that incorporate both the incidence and duration of claims are close to 1.0 for unemployment insurance and between 0.5 and 1.0 for workers’ compensation.”). See also Lawrence H. Summers, “Unemployment,” Concise Encyclopedia of Economics (available at http://www.econlib.org/library/Enc/Unemployment.html).
11 See e.g., Krueger and Meyer (2002) at 18–28; see also Patricia M. Anderson and Bruce D. Meyer, “Unemployment Insurance in the United States: Layoff Incentives and Cross Subsidies,” Journal of Labor Economics 11;1 (1993) S70–S95
12 See Dan A. Black, Jeffrey A. Smith, Mark C. Berger and Brett J. Noel, “Is the Threat of Reemployment Services More Effective than the Services Themselves? Evidence from Random Assignment in the UI System,” The American Economic Review 93;4 (September 2003) 1313–1327, at 1314 (emphasis added).
13 See Krueger and Meyer (2002) at 30–31.
Unemployment Insurance and Workers’ Compensation Unemployment insurance (UI) and workers’ compensation (WC) are insurance programs that compensate workers in cases of: (a) involuntary unemployment due to layoffs (for UI) or (b) injuries or illnesses resulting from work-related activities. While both types of insurance have obvious benefits, they also impose employment-related costs on employers (in particular payroll-related premiums to support both programs) and affect the incentives of employees. There is strong empirical evidence that higher unemployment insurance and workers’ compensation benefit levels results in lower levels of employment.10
While the federal government often steps in to subsidize unemployment insurance in the case of deep economic downturns, such as the current one, UI is a primarily state-administered program, with significant variations across states. State programs vary in the level of benefits paid (summarized in the “replacement rate,” or the proportion of employment income accounted for by UI benefits), the requirements for qualification and continued eligibility (e.g., requirements to participate in job search activity), the levels of premiums paid by employers, and the extent to which premiums are “experience rated,” i.e., are tied to each employer’s previous history of laying off workers who claim unemployment insurance.
The empirical evidence of the impact of unemployment insurance on the duration of unemployment is extensive,11 as is evidence that providing incentives for employees to seek new employment can be effective. For example, one recent study examined a portion of the UI program under which laid-off employees who are determined to be at high risk of extended unemployment spells are required to attend retraining as a condition of receiving continued benefits. The study concluded that the program
is effective in reducing the duration of unemployment and increasing post-reemployment earnings, largely because workers who receive notices of the requirement for reemployment training quickly find new jobs: “The earnings gains result primarily from earlier return to work in the treatment group. Moreover, examination of the exit hazard from UI suggests that much of the impact results from persons in the treatment group leaving UI upon receiving notice of the requirement that they receive reemployment services, rather than during or after the receipt of those services.” 12
Workers’ compensation insurance consists of state-mandated programs under which employers are required to purchase policies from private insurance companies, state-organized insurance pools, state-run insurers or, in some cases, to self-insure. Benefits provided to employees with job-related injuries or illnesses include the coverage of medical and health care costs and the replacement of lost income. Benefits typically equal roughly two thirds of lost wages, but in some cases—when tax benefits are taken into account—may actually exceed an employee’s lost earnings (i.e., the replacement rate exceeds one).13 There are significant cross-state variations in WC programs,
18
including in the waiting periods (i.e., days of lost work) before benefits can be claimed, benefit levels, the ways the insurance programs themselves are organized (e.g., the extent to which premiums are based on prior claims; whether companies are permitted to self-insure), and the resulting levels of premiums.
As noted above, there is strong evidence that higher workers’ compensation benefits result in lower levels of employment, with the evidence suggesting overall that a 10 percent14 increase in benefits increases lost hours of work by between five and 10 percent. These effects result in part from the high replacement rates associated with workers’ compensation, which: (a) create moral hazard15 and (b) reduce the incentives for employees to return quickly to work.16
In addition, of course, high workers’ compensation premiums (as well as high unemployment insurance premiums), which act as a de facto tax on labor, also reduce employment and affect employer decisions on where to locate their workforces.17
14 See n. [10 – Kreuger and Meyer at i] infra
15 See, e.g., Alan B. Krueger, “Incentive Effects of Workers’ Compensation Insurance,” Journal of Public Economics 41 (1990) 73-99, at 95 (“Overall, a 10 percent increase in benefits is associated with about a 7 percent increase in recipiency. ... employees are substantially less likely to enter the workers’ compensation program if a state requires a longer waiting period before benefit payments begin.”). See also Georges Dionne and Peirre St. Michel, “Workers’ Compensation and Moral Hazard,” The Review of Economics and Statistics 73;2 (May 1991) 236–244.
16 See e.g., Bruce D. Meyer, W. Kip Viscusi and David L. Durbin, “Workers’ Compensation and Injury Duration: Evidence from a Natural Experiment,” American Economic Review 85;3 (June 1995) 322–40; see also, Krueger and Meyer (2002) at 37–8.
17 Premium structures—i.e., whether and to what extent premiums are “experience rated”—can also affect employment and layoffs. See, e.g., Robert H. Topel, “On Layoffs and Unemployment Insurance,” American Economic Review 73;4 (September 1983) 541–59 and Alan B. Krueger and John F. Burton, Jr., “The Employers’ Costs of Workers’ Compensation Insurance: Magnitudes, Determinants, and Public Policy,” The Review of Economics and Statistics. 72;2 (May 1990) 228–240.
Wage and Hour Policies“Wage and hour” law is the term given to a broad set of policies that govern the mechanics of how work time is measured and how workers are to be paid as a function of time worked. At the federal level, wage and hour law was initiated by the FLSA which sets out rules for what constitutes compensable time and requirements for overtime pay. The basics of the FLSA are that covered workers must be paid for all work time and that workers must be compensated at a time-and-a-half rate for time worked in excess of forty hours per week. The FLSA was originally designed to cover hourly, non-supervisory workers under the theory that salaried, supervisory workers could negotiate their pay and hours for themselves. The precise distinction between covered and non-covered employees is complicated, however, and there has been substantial litigation of this issue in recent years.
Some states have implemented wage and hour laws that extend the federal FLSA in various dimensions. California is an important example in this regard, as the state has both the most far-ranging extensions of the FLSA and has, over the past decade, been the site of extensive litigation of state-specific wage and hour laws. California’s wage and hour laws expand the FLSA by extending coverage to employees not covered by the Act and by requiring overtime for all hours worked over eight within a day (as opposed to 40 in a week).
19
18 See, e.g., Joshua Mitchell, “Forecasting the Effects of the August 23rd Fair Labor Standards Act Overtime Changes: Evidence from a California Natural Experiment” (May 2005) at 1 (“[O]vertime coverage reduces the probability of working overtime by over eighteen percent.”) (available at http://68.16.181.93/mba/12/12Fifths.nsf/f30121914301305b852570b100175b96/ccc246ff6500930b852570b000600ce4/$FILE/Mitchell.pdf).
19 See Stephen J. Trejo, “The Effects of Overtime Pay Regulation on Worker Compensation,” The American Economic Review 81;4 (September 1991) 719–740 at 739 (“[I]t is probably prudent to favor the conclusion of a sizable but incomplete wage response to overtime pay regulation over the competing conclusion of full adjustment.”); see also Dora L. Costa, Hours of Work and the Fair Labor Standards Act: A Study of Retail and Wholesale Trade,” Industrial and Labor Relations Review 53;4 (July 2000) 648–664; Daniel S. Hamermesh and Stephen J. Trejo, “The Demand for Hours of Labor: Direct Evidence from California,” The Review of Economics and Statistics 82(1) (February 2000), 38–47; and Darrell E. Carr, “Overtime Work: An Expanded View,” Monthly Labor Review (November 1986) 36–39.
20 See Mitchell at 1. See also Jay Bhattacharya, Thomas DeLeire, Thomas MaCurdy, “The California Overtime Experiment: Labor Demand and the Impact of Overtime Regulation on Hours of Work” (October 2000) (available at http://harrisschool.uchicago.edu/about/publications/working-papers/pdf/wp_00_24.pdf).
21 See Jonathan Gruber, “The Incidence of Mandated Maternity Benefits,” The American Economic Review 84;3 (June 1994) 622–641; see also Jeffrey A. Eisenach, “Assessing the Costs of the Family and Medical Leave Act” (Criterion Economics, February 2007) (available at http://papers.ssrn.com/sol3/papers.cfm?abstract_id=1260396).
At a minimum, expansions of federal law, as in California, alter the structure of compensation systems, essentially imposing a tax on workday/workweek flexibility.18 They may also raise labor costs overall. The empirical evidence generally suggests that the effect of overtime regulation is to raise wage rates and reduce employment.19
Additional wage and hour requirements also have a variety of other distorting effects. For example, one recent study found that overtime coverage causes firms to substitute more expensive for less expensive labor, “redistributing income from lower to higher earning workers.”20 State wage and hour laws also impose increased timekeeping and time-monitoring obligations on employers. In California, for example, employers have increasingly begun to monitor their employees’ time on a real-time basis so as to forestall litigation related to state daily overtime or meal-break rules. Still other states have mandated leave requirements more expansive than those in the federal Family and Medical Leave Act (FMLA), which may raise employment costs (and reduce employment) in a variety of ways.21
Collective Bargaining IssuesThe relationship between unionization and economic performance is perhaps the single most-studied question in labor economics. The overwhelming weight of economic research suggests that higher rates of unionization lead to higher labor costs above the market rate. Recently there has been increasing concern about the role public-sector unions in particular play in influencing government policy and impacting labor markets.
Other things being equal, high rates of unionization are, as the empirical results discussed in Section IV and Appendix B demonstrate, also generally associated with higher unemployment rates and slower rates of new business formation. Not surprisingly, then, policies that give unions advantages in organizing workers (e.g., the absence of right-to-work legislation) have been found to lead indirectly to higher unemployment and slower growth.

20
Under the Taft-Hartley Act of 1947,22 unions and employers can agree to operate a “union shop,” in which all employees must, after an initial waiting period, join the union and pay dues or “agency fees” as a condition of employment. Importantly, however, Taft-Hartley also allowed states to pass “right-to-work” laws forbidding union shop agreements. There are currently twenty-two states with right-to-work laws, including large states such as Florida and Texas, located primarily in the South and West.23 The economics literature has considered a wide range of effects of right-to-work laws, including the effect on unionization and union organizing activity. The bulk of the literature shows that right-to-work laws are associated with lower rates of unionization. 24
Economists have suggested several ways in which high levels of unionization might affect economic performance. One hypothesis is simply that high levels of unionization reflect higher levels of bargaining power for unions, leading directly to higher
labor costs.25 Another is that high rates of unionization provide the political clout for unions to lobby for additional laws and regulations.26 Yet another important hypothesis is that employers are more likely to locate in areas where union organizing is less likely (i.e., right-to-work states). On the face of it, there is strong support for the idea that states with right-to-work laws have been more successful at attracting new business, as the employment and population growth rates for Southern and Western (i.e., right-to-work) states has consistently exceeded that of the Northern union shop states. While it is theoretically possible that these differences are due to factors other than unionization (e.g., the development of air conditioning, corporate tax rates, etc.), the bulk of the empirical evidence suggests that a significant portion of the higher relative growth of the South and West has been the lower incidence of union shop states.27
22 61 Stat. 136 (1947).
23 The others are Alabama, Arizona, Arkansas, Georgia, Idaho, Iowa, Kansas, Louisiana, Mississippi, Nebraska, Nevada, North Carolina, North Dakota, Oklahoma, South Carolina, South Dakota, Tennessee, Utah, Virginia and Wyoming.
24 See William J. Moore, “The Determinants and Effects of Right-to-Work Laws: A Review of the Recent Literature,” Journal of Labor Research 19;3 (Summer 1998) 445–469. See also Barry T. Hirsch, “The Determinants of Unionization: An Analysis of Interarea Differences,” Industrial and Labor Relations Review 33;2 (January 1980) 147–161 at 161 (“[T]he results indicated that while RTW laws have little, if any, effect on the extent of collective bargaining coverage across SMSAs, such laws do appear to decrease the level of union membership.”); David T. Ellwood and Glenn Fine, “The Impact of Right-to-Work Laws on Union Organizing,” Journal of Political Economy 95;2 (1987) 250–273 at 271 (“Our results show a strong short-run reduction in union organizing following the passage of an RTW law.”); and Keith Lumsden and Craig Petersen, “The Effect of Right-to-Work Laws on Unionization in the United States,” Journal of Political Economy 83;6 (1975) 1237–48 (finding that RTW laws are associated with lower unionization, but are proxies for “tastes and preferences of the population,” and do not directly affect the extent of unionization).
25 See, e.g., Stephen J. Trejo, “Overtime Pay, Overtime Hours, and Labor Unions,” Journal of Labor Economics 11;2 (1993) 253–278.
26 See e.g., Gilles Saint-Paul, “The Political Economy of Employment Protection,” Journal of Political Economy 110;3 (2002) 672–703.
21
For example, Holmes used a novel approach to separate out the effects of right-to-work statutes from those of other state-specific policies.28 Holmes examined the location of manufacturing employment in areas bisected by state lines where one state had a right-to-work law and the other did not. He found a significant tendency for new and existing manufacturing employment to be located in the state with the right-to-work law. Because it focuses on comparisons between narrow areas where issues such as air conditioning would not be expected to have an impact, this study provides particularly strong evidence on the effectiveness of right-to-work laws in generating employment growth.29
Whatever the reason, high levels of unionization have been shown in numerous studies to be correlated with slower economic growth at the state level, and it is therefore not uncommon to include unionization as an explanatory variable in empirical models of the determinants of state economic performance.30
Litigation and Enforcement ClimateA sixth category of employment policies utilized in this study seeks to capture cross-state variations in the litigation and enforcement environment relating to employment and labor issues. There is a substantial body of economic evidence suggesting that these factors, while sometimes difficult to quantify, distort markets and have a negative impact on economic performance. For example, much of the research on the effects of worker-separation policies (e.g., the employment-at-will doctrine) relates directly to the propensity of employees (or state labor departments) to engage in litigation (and/or enforcement activities) that raises the costs to employers of conducting necessary worker separations.31 Research has also demonstrated that even the most well-intended regulations can have unintended consequences when they lead to fear of litigation and excessive enforcement.32 Finally, as also noted above, excessive state enforcement activities can impose compliance costs on businesses even when they do not lead to actual investigations or citations of employers. When such costs are directly related to levels of employment, they effectively raise the costs of labor and thus reduce both output and jobs. In pointing out these impacts, as highlighted by the economic literature, this paper is not advocating a “no enforcement” policy. Rather, we are simply noting that states whose enforcement agencies impose excessive or unnecessary burdens on employers will likely see differing results in terms of jobs and growth than other states.
27 See Moore at 464 (“RTW laws definitely appear to promote free riding and to lower union organizing efforts and successes, at least in the short-run. Although inconclusive, the accumulating evidence indicates that RTW laws reduce the long-run extent of unionization by 5 to 8 percent. RTW laws are also positively correlated with long-run industrial development. The proponents of RTW laws may have been correct. RTW laws may have modestly reduced the growth of unions and promoted industrial development in the long run.”)
28 See Thomas J. Holmes, “The Effect of State Polices on the Location of Industry: Evidence from State Borders” (Federal Reserve Bank of Minneapolis and University of Minnesota, September 1996).
29 See Holmes at 28 (“There is a lot of uncertainty and debate about whether or not state policies make much difference in the geographic distribution of industrial activity. This results of this paper suggest that state policies do matter.”)
30 See e.g., Robert Crandall, William Lehr and Robert Litan, “The Effects of Broadband Deployment on Output and Employment: A Cross-Sectional Analysis of U.S. Data” (The Brookings Institution, Issues in Economic Policy, July 2007) at 8 (“We test the proposition that growth in employment and output depends on a number of factors. Low business taxes, low levels of unionization, and relatively low wages should attract business investment while a favorable climate and educational opportunities—as well as strong demand for labor—should induce workers to move to a state.”)
31 See, e.g., Dertouzas and Karoly (1992) and section II.A. infra.
32 Daron Acemoglu and Joshua D. Angrist, “Consequences of Employment Protection? The Case of the Americans with Disabilities Act,” Journal of Political Economy 109;5 (2001) 915–957, at 948–949 (“In 1993, the year after the ADA came into effect, there were marked drops in the employment of disabled men aged 21–39, both in absolute terms and relative to the nondisabled. A similar drop is observed in 1992 for disabled women aged 21–39. Extrapolating employment trends, allowing for composition effects, and controlling for changes in disability insurance and SSI participation rates do not seem to account for these declines, leaving the ADA as a likely cause.”).26 See e.g., Gilles Saint-Paul, “The Political Economy of Employment Protection,” Journal of Political Economy 110;3 (2002) 672-703.
Research has also demonstrated that even the most well-intended regulations can have unintended consequences when they lead to fear of litigation and excessive enforcement.

Evaluating State Employment Policies

In order to evaluate state employment policies, we collected 2009 data33 on relevant statutes, regulations, policies and jurisprudence in six overall categories, for all 50 states. We compiled that data into the ERI and, based on each state’s ERI score (with lower scores indicating a more favorable environment for job creation), grouped the states into three groups, “Good,” “Fair” and “Poor.” We also analyzed employment policies in each state individually, focusing on unique policy characteristics—both strengths and weaknesses—and opportunities for reform.
This section begins by explaining the data collection process and the derivation of the ERI. It concludes by presenting the overall state rankings and the state-by-state analyses.
33 All data is for 2009 unless otherwise noted.
24
A. The Employment Regulation IndexIn Section II above, we reviewed the empirical evidence on the effects of six broad categories of employment policies on growth and job creation. For this study, we collected data on 34 key aspects of state employment policies, grouped into the same six broad categories. Based on that data, we constructed a single index, the ERI, designed to capture each state’s overall employment policy climate. In the first section below, we describe the 34 characteristics for which we collected data. In the second section, we explain how we used this data to construct the ERI.
1. Key Aspects of State Employment Policies
a. Employment Relationship and the Costs of Separation
As noted above, there is extensive empirical evidence that the erosion of the employment-at-will doctrine has reduced employment and economic growth. We collected data on seven aspects of employment law relating to the employment contract. Specifically:
1. Existence of Mini-WARN Acts
Federal law, through the Worker Adjustment Retraining and Notification Act (WARN Act) requires certain covered employers to follow specific procedures to notify workers in the event of a layoff or job loss affecting specified numbers of employees. Some states have adopted their own versions (often called “mini-WARN Acts”) of this federal law that often impose additional complex reporting requirements. Indeed, some states even require employers to notify and receive permission from a state agency before instituting a layoff or business closure. We reviewed state layoff notification requirements and grouped states into one of four scoring categories from zero to three based on the complexity of the state law and the extent to which it differed from federal requirements.
2. Treatment of Employment At-Will Doctrine
All states except Montana generally follow the employment-at-will doctrine, meaning in the absence of a written contract, either the employer or the employee may terminate the employment relationship at any time and without cause. States vary, however, in the strength of their recognition of the doctrine. Some have established state laws expressly recognizing that employment relationships are at-will and several other states have either through state law or court rulings enunciated numerous
exceptions to the doctrine for various public policy or statutorily enumerated reasons. We reviewed each state’s statutes and court decisions on the employment-at-will doctrine and grouped each state into one of four categories based on the strength of the state’s recognition of the employment-at-will doctrine. States with a statute expressly recognizing that employment is at-will scored a zero. At the other end of the scale, Montana scored a three as the only state that does not recognize the employment-at-will doctrine.
3. Whether Employee Handbook is Converted to Enforceable Contract
As noted above, virtually all states follow the employment-at-will doctrine to some extent. One important variation in the employment-at-will doctrine among states is whether employee handbooks can be considered an enforceable employment contract, and thus become the basis of litigation. We reviewed state laws and court decisions on this issue and scored each state based on whether state law or state courts convert an employee manual or handbook into a contract enforceable against the employer. States that do not recognize a handbook as a contract scored a zero and states that will consider handbooks to be contracts scored a one.
4. Whether Courts will Blue-pencil or Sever an Employment Contract
Employers frequently utilize employment contracts to specifically define particular positions as well as to place certain expectations and restrictions on the employee who holds the position. Employment contracts can frequently become a source of litigation and each state differs in how they treat the content of these contracts. Employers generally see these contracts as a means of protecting themselves by clearly laying out the terms of the employment relationship. If a state court finds that a contract contains a provision that violates state law, employers typically prefer the court to revise (often called “blue penciling”) or sever the offending provision or provisions, rather than invalidate the entire contract. We reviewed each state’s laws and court decisions to determine whether the state will blue pencil or sever an employment contract. States that blue pencil or sever scored a zero and states that will not rewrite or sever an offending employment contract scored a one.
There is extensive empirical evidence that the erosion of the employment-at-will doctrine has reduced employment and economic growth.
25
5. Treatment of Covenants not to Compete
A covenant not to compete may be a stand-alone contract between an employer and employee or it may be part of a more comprehensive employment contract. As with general employment contracts, employers often utilize non-compete agreements as a means of protecting their business interests, including protecting their customers, their trade secrets, and guarding against direct competition. States vary in their recognition of these agreements and frequently impose geographic, subject matter, scope and time limitations on them. We reviewed state law and court decisions concerning covenants not to compete and grouped each state in one of four categories based on the breadth and strength of recognition a state gives these agreements. States with the highest and broadest level of enforcement scored a zero in the ERI. States that hold these covenants to be generally not enforceable or enforceable in only limited circumstances scored a three.
6. Timing Requirements for Last Paycheck
Federal law does not specify the timing for an employee’s last paycheck upon separation from employment. State laws regarding this issue range from no specific requirement to detailed procedures, including immediate payment. Because employers typically have established specific pay periods and generate payroll checks on pre-determined dates, state laws imposing pay requirements that differ from the usual payday result in additional administrative burdens as well as potential legal consequences for unwitting violations. We reviewed each state’s last paycheck requirements and grouped each state into one of four categories from no state law requirement, to payment at the next payday, to payment before the next scheduled payday, to payment immediately upon separation. Five states have no mandated time period for the last paycheck and scored a zero on the ERI. Seven states require payment immediately upon separation and they scored a three. The rest of the states fall in between, requiring payment at the next regular payday or before.
26
7. Treatment of Independent-Contractor Relationships
The use of independent contractors has come under increasing scrutiny in recent years at both the state and federal level. Independent-contractor status can be a complicated matter under both employment and tax laws, and many states have begun to aggressively audit businesses that utilize independent contractors. In addition, some states have even established their own criteria that must be satisfied in order to be treated as an independent contractor in the state. We reviewed each state’s treatment of the independent-contractor relationship and placed each state into one of four categories based on the strength of acceptance of the independent-contractor relationship. States with the strongest acceptance scored a zero and states that impose significant limitations on the ability of one to function as an independent contractor scored a three.
b. Minimum Wage and “Living Wage” Laws
Minimum wage and living wage laws have been shown to increase unemployment, especially among young people. We collected data on three types of policies which go above and beyond federal law:
1. Amount of State Minimum Wage Beyond Federal Requirements
The federally required minimum hourly wage for most all employers is $7.25. With just a few exceptions, each of the 50 states also has its own separate hourly minimum wage law. The majority of states adopt the federal minimum as their minimum wage, but several states impose a minimum wage that exceeds the federal wage. The federal minimum wage is a “floor” and thus if a state imposes a minimum wage that exceeds the federal standard, the state wage applies in place of the federal wage. We collected each state’s minimum wage and calculated its ERI score for this characteristic based on how far its minimum wage deviates from the federal minimum wage of $7.25.34 Fourteen states have a minimum wage that exceeds the federal minimum.
2. Existence of State “Prevailing Wage” Laws
Federal laws impose a requirement upon certain employers that they pay a prevailing wage to employees engaged in a particular type of work. Prevailing wage requirements apply most often to federal contracts, as well as work that is funded in whole or in part by the federal government. A prevailing wage is the wage that the U.S. Department of Labor has determined prevails among those engaged in a particular type of work in a specific geographic area. Prevailing wages typically represent an above-market wage level that is paid to union labor and can significantly
increase an employer’s costs to perform the work. Many states have imposed their own separate prevailing wage requirements associated with particular types of work. We reviewed whether each state imposes a prevailing wage requirement and states with such a requirement scored a one, while states with no prevailing wage requirement scored a zero.
3. Existence of Living Wage Laws in a Major City in the State
Besides state minimum wages that exceed the federal requirement, employers can also face higher labor costs in major cities that impose so-called “living wage” requirements on particular classes of workers or types of employers. Indeed, some states that impose a minimum wage in excess of the federal requirement also have cities with a living wage requirement that is even higher. We reviewed whether each state had laws concerning living wage requirements or whether major cities in the state required employers to pay a living wage. We then grouped each state into one of four categories reflecting the existence and scope of living wage requirements in the state. Some states have adopted laws prohibiting municipalities from adopting wage requirements that exceed state law and those states scored a zero. States with a broadly applicable living wage requirement or multiple major cities with living wage mandates scored a three.
c. Unemployment Insurance and Workers’ Compensation
Although serving an important purpose, the level and duration of both unemployment benefits and workers’ compensation benefits have been shown to increase unemployment. We collected data on seven metrics relating to unemployment insurance and workers’ compensation.
34 Thus, states with minimum wages of $7.25 scored a zero and the state with the highest state minimum wage scored a one.

27
1. Maximum Regular Unemployment Benefits (absent federal extensions)
The calculation of the amount of unemployment benefits to which a particular worker may be entitled varies widely from state to state based on a variety of factors and formulas. In general, benefits are determined by a calculation based on the amount an employee earned in wages and the length of their employment during a specific time period called the base period. Using data available as of January 1, 2009, we compared the maximum amount of potential individual benefits35 available to a worker in a benefit year, absent any extensions. We scored the states based on the relative total amount of benefits offered, with the state with the lowest benefits scored as zero and the state with the highest benefits scored as one. Note that this metric is not related to a direct impact on employers, but is included because of its effect on overall state unemployment levels as highlighted by the economic literature.
2. Waiting Period to Receive Unemployment Benefits
States adopt one of two time periods for workers to begin receiving unemployment benefits: either no waiting period or seven days after establishing eligibility. In states without a waiting period, employers face increased costs of making temporary adjustments to their workforces, as even short-term separations may result in UI claims (and higher premiums). Thirteen states have no waiting period and scored a one, while the rest of the states require a one-week waiting period and accordingly scored a zero in the ERI.
3. Wage Ceiling Subject to Unemployment Insurance Tax
Federal taxes on employers fund most of the administrative costs associated with the unemployment benefit system, but state payroll taxes (generally called “contributions”) provide the bulk of the funding for unemployment benefits. The amount
of an employer’s payroll tax varies widely from state to state depending on the size of the employer, the amount of wages it pays and the contribution rate assigned to the employer by the state. Federal law requires that for unemployment insurance purposes an employer be taxed on the first $7,000 in wages paid to an employee. More than half of the states, however, have adopted a higher tax ceiling, requiring employers to pay additional taxes on wages paid to employees up to the higher amount. Using data available as of January 1, 2009, we compared the wage ceiling subjected to unemployment insurance taxation in each state. Washington State had the highest taxable wage ceiling of $35,700—more than five times the federal minimum. We scored the states based on the relative amount of the taxable wage ceiling, with states adopting the federal standard scored as zero and the state with the highest ceiling (Washington State) scored as one.
4. Workers’ Compensation Benefits per $100 of Covered Wages
To compare the amount of workers’ compensation benefits provided by each state we used the most recent36 publicly available 2007 data compiled by the National Academy of Social Insurance (NASI), which has published comprehensive national data on workers’ compensation benefits and costs since 1997 after the Social Security Administration discontinued publishing similar data in 1995. The NASI report determined the states provided benefits from a low of $0.42 per $100 of covered wages for Texas, to a high of $3.08 per $100 of covered wages for West Virginia. For purposes of the ERI, states were scored based on the relative amount of benefits per $100 in covered wages, with the lowest state (Texas) scoring zero and the highest state (West Virginia) scoring one. Note that this metric is not related to a direct impact on employers, but is included because of its effect on overall state unemployment levels as highlighted by the economic literature.
5. Waiting Time for Workers’ Compensation Benefits
States adopt one of four time periods for workers to begin receiving workers’ compensation benefits: three days, four days, five days or seven days. Most states are grouped at either end of the spectrum with 22 states imposing a three-day waiting period and 22 states imposing a seven-day waiting period. Five states require a five-day wait and just North Dakota requires four days. In calculating the ERI, we compared each state’s waiting period relative to other states and assigned a score from zero to three based on the state’s waiting period, with longer waiting periods receiving a lower score.
35 Some states provide additional benefits beyond the basic benefit amount for claimants with dependents. We excluded those additional amounts from the ranking.
36 See Workers’ Compensation: Benefits, Coverage, and Costs, 2007, National Academy of Social Insurance, August 2009.
28
6. Workers’ Compensation Premium Rate Index
To compare workers’ compensation premiums among the states we used the most recent37 publicly available 2008 data compiled by the Oregon Department of Consumer & Business Services, which publishes a ranking of workers’ compensation rates across all 50 states. The Oregon Department of Consumer & Business Services has been conducting a biennial examination of all 50 states’ workers’ compensation premium rates using the same methodology since 1986. The Oregon report determined the states ranged from a low workers’ compensation premium index rate of 1.08 for North Dakota to a high of 3.97 for Alaska. For purposes of the ERI, states were scored based on their relative premium index rates, with the lowest state (North Dakota) scoring a zero and the highest state (Alaska) scoring one.
7. Whether Workers’ Compensation Self-insurance is Permitted
Every state except North Dakota and Wyoming permits private-sector employers to self insure their workers’ compensation coverage. We assigned a value of either zero or one to each state based on whether they permitted employers to self insure. Some employers because of their size or their industry may seek to manage costs by utilizing a self-insurance option rather than participating in the state or private insurance market. North Dakota and Wyoming do not provide the flexibility to self insure and accordingly received a score of one while all other states scored a zero on the ERI.
d. Wage and Hour Policies
Wage and hour policies in excess of the federal standard can increase a state’s labor costs both directly and indirectly. We collected data on four aspects of state wage and hour policies:
1. Additional State Overtime Requirements
Federal law generally requires private-sector employers to pay workers one-and-one-half-times their regular rate of pay for all hours worked in excess of 40 in one week. Several states impose additional overtime requirements on employers that differ in significant respects from the federal requirements. These state overtime laws can be complicated, particularly for employers that do business in multiple states and must set up multiple payroll tracking systems to account for the various nuances in state laws. We reviewed the overtime requirements of each of the 50 states and grouped each state into one of four categories based on the relative complexity and additional requirements of the state’s overtime law, as compared to federal law. States that
followed federal law and had no separate overtime requirements or state claim based on a failure to pay according the state overtime requirements scored a zero. States with several additional overtime requirements, including a daily overtime rate, scored a three.
2. Specified Meal/Rest Requirements
States vary widely in the required timing, duration, and frequency of meal and rest periods that employers must provide to employees. Many states further complicate the meal and rest period requirements by applying different standards to minors and adults. We reviewed the meal and rest period requirements for each of the 50 states and grouped each state into one of four categories based on the relative complexity of their meal and rest period requirements. At one end, states that did not impose separate meal and rest period mandates scored a zero and at the other end of the continuum, states with numerous requirements and penalties scored a three.
3. Additional State Leave Requirements
The primary federal law governing employee leave is the Family and Medical Leave Act, which requires covered employers to provide unpaid leave to qualifying employees for a variety of family or medical reasons. In addition to this requirement, most states also require covered employers to provide employees with other types of leave. We reviewed each of the 50 states’ leave requirements and grouped each state into one of four categories based on the relative complexity and number of additional bases for “protected” leave. States with no additional requirements beyond federal law scored a zero and states with numerous additional requirements and/or paid leave requirements scored a three.
4. Complexity of Payout of Vacation Accruals
Federal law does not provide a standard governing the compensation of employees for unused vacation time upon their separation from employment. There is a fair amount of variation among the states regarding the mandates imposed on employers to pay departing employees for unused vacation time. We reviewed each state’s requirements and grouped the states into one of four categories based on the relative burden of the mandate on employers. States imposing no mandates regarding the payout of vacation time scored a zero, while states with extensive mandates on employers scored a three.
5. State Posting and Notice Requirements
Federal law requires employers to display in the workplace a variety of notice posters covering several topics, depending
37 See Oregon Workers’ Compensation Premium Rate Ranking: Calendar Year 2008, Information Management Division of the Oregon Department of Consumer & Business Services, March 2009.
29
upon the employer’s size, the composition of the workforce, and the type of work performed. In addition, each of the 50 states imposes its own notice and posting requirements for a variety of other topics and laws. We reviewed each state’s requirements and grouped each state into one of four categories based on the number or additional notice and/or posting requirements beyond what is required by federal law. States that required only additional posting relating to workers compensation and unemployment scored a zero. At the other end of the spectrum, states with numerous notice and posting requirements on additional topics and laws scored a three.
6. State Record Retention Requirements
The Fair Labor Standards Act requires employers to maintain payroll related records for three years. Several states have adopted additional and lengthier payroll record retention requirements in addition to the federal requirement. These differing standards impose added paperwork burdens and costs on employers. We reviewed state laws concerning the retention of payroll-related records and grouped each state into one of four categories based on the extent to which the state’s requirements differed from federal law. States with no additional requirements beyond the federal standards scored a zero and states that required retention of extensive numbers of documents or retention for an extended period of time scored a three.
e. Collective Bargaining Issues
As discussed above, it is well established that states with higher levels of union membership tend to have higher levels of unemployment and more restrictive employment policies. While it was not a focus of this study, there has been particular concern recently about the impact public-sector unions might also have on these factors. For purposes of this study, we gathered information on four aspects of union influence:
1. Private-Sector Union Membership Percentage
We examined union membership percentages for each state using the most recent (at the time of writing) 2009 publicly available data38 based on the Current Population Survey.39 Each state was grouped into one of four quartiles based on their private-sector union membership percentage in 2009. For purposes of the ERI, states are ranked on their relative levels of unionization, with the least unionized state scoring a zero and the most unionized scoring a one.
2. Right-to-Work State
Federal law does not provide individuals with a right to employment without joining a labor union in workplaces that have collective bargaining. States do have flexibility in this area and have taken different approaches. As a result, in more than half of the states in the U.S., the offer of employment can be conditioned on the individual joining a labor union if that union has a collective bargaining agreement at the worksite. Other states have passed “right-to-work” laws under which an employee can opt out of union membership. We reviewed each state to determine whether it had a state law or constitutional provision supporting the right-to-work principle. Twenty-two states are right-to-work states and scored a zero in the ERI, while the 28 other states scored a one.
3. Availability of Unemployment Benefits to Locked-Out Employees/Strikers
We reviewed each state’s unemployment compensation eligibility requirements to determine whether employees who were on strike or “locked out” from their job as part of a labor dispute were eligible for benefits. States that provided such benefits received a score of one on the ERI and those states that did not provide unemployment benefits in those circumstances scored a zero.
4. State Laws that Affect Labor Organizing Efforts
Many states have adopted a variety of laws that could be said to aid labor organizing efforts. These laws range from explicit recognition and approval of picketing to more expansive “captive audience” laws prohibiting employers from requiring employees to attend meetings to hear the employer’s views on topics such as labor organizing. We reviewed state laws in this area and grouped each state into one of four categories based on the
38 See Barry T. Hirsch and David A. Macpherson, “Union Membership and Coverage Database from the Current Population Survey: Note,” Industrial and Labor Relations Review, Vol. 56, no. 2, January 2003, pp. 349–54; www.unionstats.com (providing annual updates to the data). As an additional point of information, the individual state descriptions in the 50-State Review, beginning at page 32, include data from this source on public sector unionization rates, however, the public sector unionization data is not a factor in the calculation of the Employment Regulation Index.
39 The Current Population Survey is the primary source of information on the labor force characteristics of the U.S. population. The survey has been conducted of households on a monthly basis for more than 50 years by the U.S. Census Bureau for the Bureau of Labor Statistics.

30
extent of laws that affect labor organizing efforts. States with no laws generally considered to offer additional assistance to unions beyond federal law scored a zero while states with numerous or broad state laws in this area scored a three.
f. Litigation and Enforcement Climate
The zealousness of enforcement by state labor regulators and whether the state legal environment is conducive to litigation are important factors in assessing state employment environments. We collected information on five aspects of the litigation and enforcement climate in each state.
1. Existence of Employment-Law Related Debarment
Many states have specific laws providing that companies found to have committed employment law-related violations may be deemed ineligible to receive state contracts for some period of time. These laws can be used by unions as leverage during organizing campaigns or contract negotiations. We reviewed state debarment requirements and grouped states into one of four categories based on the severity of debarment for employment law violations. States with no debarment provision scored a zero and states with extensive bases for debarment and/or long debarment periods scored a three.
2. State Department of Labor Enforcement Activity
In addition to enforcement of employment-related laws by the U.S. Department of Labor, most states have also established state departments of labor to regulate and enforce their own separate labor and employment laws. These duplicative state employment law requirements and enforcement initiatives can substantially complicate an employer’s human resources functions, particularly when operating in multiple states with different standards and procedures. We reviewed the stringency of each state’s overall enforcement regime and placed the state into one of four categories with those states that exercise more extensive interventions in labor markets receiving a higher score on the ERI.
3. Number of Federal Employment and Labor Lawsuits per 10,000 Employees
The amount of employment litigation in a state can be an indication of the perceived attractiveness of that state as a venue for plaintiffs to bring employment claims. A state could be perceived as a favorable venue for a variety of reasons, including excessive jury awards, the existence of plaintiff-friendly state law causes of action, or any number of other factors. We reviewed data from various reporting sources40 about the number of labor and
employment lawsuits filed in federal court in each state in 2009. We then used the size of the state’s labor force41 to calculate the ratio of lawsuits per 10,000 employees. For purposes of the ERI, states are scored according to their relative ratios of lawsuits to employees, with the state with the lowest level of lawsuits scoring zero and the state with the highest level of lawsuits scoring one.
4. Strength of Protection for Employers Providing References
Providing job reference information about a former employee can be a very risky proposition for many employers. The risk of litigation often causes employers to substantially curtail the type or amount of information they will provide about former employees. This artificial restriction on the flow of information (out of a fear of legal liability) introduces inefficiencies into the hiring process and may often prevent the exchange of relevant information about the suitability of an applicant for a particular position, to the detriment of both workers and employers. To address this problem, many states have enacted laws that provide a certain amount of immunity for an employer providing employment reference information. We reviewed the relevant law in each state and grouped the state into one of four categories based on the relative strength of protection offered to employers. States offering the greatest protection scored a zero and those states with no state law offering legal protection for employers providing a reference scored a three.
5. Restrictions on Employer Inquiries into Applicant History
As part of the process of evaluating a job applicant, and to help mitigate the risk of future litigation, an employer may wish to verify the applicant’s job history or work experience with a previous employer. In addition, the employer may want to investigate other matters in the applicant’s background that could have a bearing on whether the applicant would be a suitable candidate for the position, and to determine whether or not a candidate may impact the safety of the workplace. In recent years, employers have begun utilizing a wide variety of data, such as credit history, consumer reports, drug and alcohol testing, and arrest records to more thoroughly screen prospective employees. Some states, in response, have started to limit the permissible scope of an employer’s review of an applicant’s background. We reviewed each state’s treatment of employer inquiries into an applicant’s background and grouped each state into one of four categories based on the relative number of restrictions on employer inquires. The more restrictions on an employer’s ability to investigate the background of a prospective employee, the higher the state’s score.
40 Lawsuits filed between January 1, 2009 and December 31, 2009, from all District Courts via PACER (Public Access to Court Electronic Records) and Westlaw database “Dockets - U.S. District Courts Combined.”
41 Total Private Employment, Not Seasonally Adjusted, Annual Average - 2009, Bureau of Labor Statistics.
31
6. Complexity of State-Based Employment Discrimination Laws Beyond Federal Requirements
Federal law provides numerous protections for workers against employment-based discrimination. Many of those federal laws require employers to maintain extensive records to ensure compliance and there is widespread litigation related to these requirements. Most states also have additional employment discrimination laws that go beyond federal standards. These state laws can be complex and often include additional protected classes and may provide for penalties and damages that exceed what is available under federal law. This can have the result of forum shopping by litigants as well as multiple lawsuits against the same employer filed under differing statutes. We reviewed each state’s employment discrimination laws and grouped each state into one of four categories based on the degree to which the state laws exceed federal law. Only one state, Mississippi, adhered strictly to federal law. At the other end of the scale are several states that have extensive additional requirements and penalties beyond federal standards.
7. Structure of State Human/Employment Rights Commission
As noted above, federal law includes numerous employment discrimination prohibitions. The U.S. Equal Employment Opportunity Commission enforces most of those anti-discrimination provisions. In addition, however, many states have established their own separate anti-discrimination agencies (frequently referred to as a Human Rights Commission) to investigate and, in some cases, prosecute violations of state anti-discrimination law. Just as a state department of labor may duplicate functions of the federal Department of Labor, the addition of a duplicative state agency enforcing the same types of anti-discrimination laws as a federal agency can result in additional bureaucracy for employers trying to comply with different laws in different jurisdictions. We reviewed the structure of state anti-discrimination agencies and grouped each state into one of four categories based on the authority and jurisdiction of the state’s anti-discrimination agency. States without a separate independent commission scored a zero and states with a commission that has wide-ranging jurisdiction and authority scored a three.
42 The effect of normalizing the scoring of each policy characteristic to a zero-one scale is to give each of the 34 policy characteristics an equal weight. While a case could be made for weighting some characteristics more heavily than others, any weighting scheme would introduce an element of arbitrariness into the analysis. More importantly, the highly significant results associated with the ERI in our regression analysis demonstrate that weighting is not necessary to construct a sufficiently accurate measure of employment policy to provide the basis for the broad ratings we present.
43 As shown in Appendix B, the ERI ranged from a maximum of 100 to a minimum of 21.23, with a mean of 58.56.
2. Generating the Index
In order to rate states on their overall employment policy climates, we combined the factors listed above into the ERI, which rates each state’s overall policies on a scale of one to 100, where 100 represents the most regulated, and hence least-employment-friendly, state.
The index is constructed by assigning a score, from zero to one, to each of the characteristics identified above, and summing the scores across characteristics. Characteristics which can be fully captured by a “yes-no” rating, such as whether or not the state has a right-to-work law, are assigned either a zero (for the presence of a right-to-work law) or a one (if there is no right-to-work law). Characteristics which require qualitative evaluation (e.g., the extent to which state policies are accepting of independent-contractor relationships) are classified into quartiles and assigned a score of zero, one, two or three. Those scores were then normalized to the zero–one scale by assigning each a corresponding value of 0, 0.33, 0.67, or 1.0. Continuous variables (e.g., the dollar amount by which a state’s minimum wage differs from the federal minimum wage) are normalized and precisely scored (rather than being assigned a quartile score) on a zero to one scale relative to the highest and lowest observed values for the factor, with the lowest value being assigned a zero and the highest value a one. The rankings are always increasing relative to the predicted negative effects of a policy on employment (e.g., higher minimum wages receive a higher score than lower ones, etc.).42 Since there are 34 characteristics, the highest theoretically possible raw score is 34 (least employment friendly), and the lowest is zero (most employment friendly). For purposes of presentation, we normalized the raw scores to a maximum score of 100 (i.e., we set the highest rating equal to 100) to produce the ERI.43
To test the accuracy of the ERI in measuring the employment policy environment, we constructed a cross-state regression analysis model of variations in two measures of economic performance, the state unemployment rate and the rate of new business formation. As explained more fully in Section IV, and in Appendix B, the model is a robust predictor of both unemployment rates and new business formation, and yields statistically significant estimates of key coefficients. Most importantly, when the ERI index is inserted as an explanatory variable in the model, it is found to have the hypothesized effect. That is, states with higher scores on the ERI tend to have systematically higher unemployment rates and lower rates of new business formation than states with lower scores.

32
A 50-StateReview
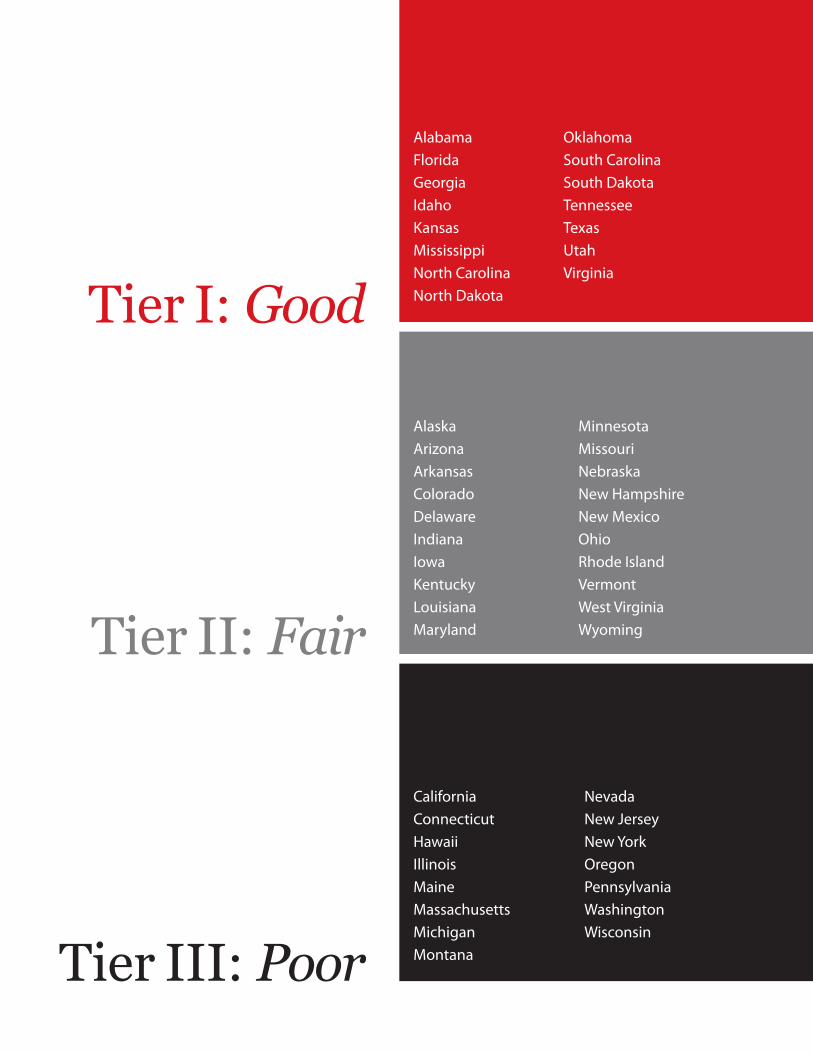
A 50-StateReview
Tier I: Good
Tier II: Fair
Tier III: Poor
AlabamaFloridaGeorgiaIdahoKansasMississippiNorth CarolinaNorth Dakota
OklahomaSouth CarolinaSouth DakotaTennesseeTexasUtahVirginia
Alaska ArizonaArkansasColoradoDelawareIndianaIowaKentuckyLouisianaMaryland
MinnesotaMissouriNebraskaNew HampshireNew MexicoOhioRhode IslandVermontWest VirginiaWyoming
CaliforniaConnecticutHawaiiIllinoisMaineMassachusettsMichiganMontana
Nevada New JerseyNew YorkOregonPennsylvaniaWashingtonWisconsin

34 Alabama | Tier I: Good
Alabama ranks in Tier I with a labor and employment-law climate that is generally favorable for new job creation. With a population of approximately 4.7 million, its leading industries include paper, chemicals, rubber, plastics, textiles, steel and automobile manufacturing. Mining resources include coal, limestone and iron ore. Agriculture is also important to the state, including the production of poultry, soybeans, peanuts and livestock. Alabama’s unemployment rate in late 2010 was 9 percent, somewhat less than the nationwide average.
Factors contributing to the state’s “good” ranking:
• State wage-hour requirements generally mirror federal law
• Employers given latitude for pre-employment background checks
• Follows federal law with regard to employment discrimination
• Right-to-work state• State WARN-type law requires only notice to
government officials; no advance notice or compensation requirements in addition to federal standards
• Strong adherence to the employment-at-will doctrine• Covenants not to compete generally enforceable• Low threshold of wages subject to unemployment
insurance taxes
Alabama’s labor and employment regulations largely mirror federal requirements. There are no separate state minimum wage or state overtime rules. The state’s meal period and rest break requirements apply just to minors. The Alabama Labor Department will handle private-sector employee claims for unpaid wages.
The state imposes no restrictions on applicant screening or background checks by employers. Alabama has not imposed additional comprehensive state anti-discrimination laws beyond federal requirements. The state has, however, imposed restrictions on age discrimination in employment.
Alabama is a right-to-work state, disallowing employers from requiring union membership or the payment of dues or fees to a labor organization as a condition of employment. Alabama also disallows the payment of unemployment benefits to strikers during an ongoing labor dispute. Alabama has private-sector union membership of slightly more than six percent, below the national average and a public-sector unionization rate of 28.9 percent.
While advance notice of layoffs or closings must be given to unemployment officials, Alabama has no advance notice or compensation requirements for employees that go beyond those required by federal standards.
Alabama courts have recognized that promises in handbooks or manuals and verbal promises of employment for a lifetime or a definite term can overcome a general presumption of at-will employment, but signed at-will agreements and properly-worded disclaimers in handbooks and manuals can preserve at-will employment status.
Alabama recognizes very limited statutory restrictions on discharge of employees and there is no generalized “against public policy” basis for wrongful discharge. Employers in the state are, however, prohibited from discharging employees who have certain kinds of garnishments, including crime victim restitution.
Covenants not to compete with durational and geographic limits are enforceable and the courts will generally reform covenants that are overbroad and enforce them.
Alabama subjects a relatively low threshold of wages ($8,000) to unemployment insurance taxes, slightly above the $7,000 federal minimum.
Alabama Tier I: Good
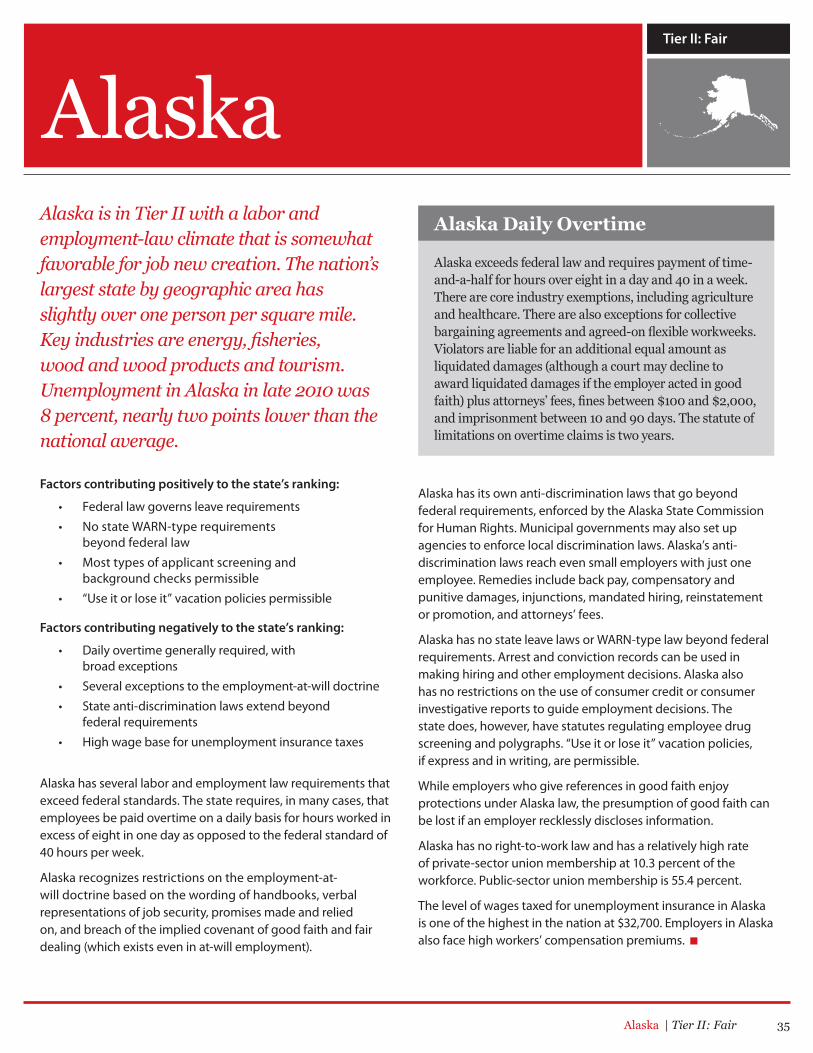
Alaska | Tier II: Fair 35
Alaska is in Tier II with a labor and employment-law climate that is somewhat favorable for job new creation. The nation’s largest state by geographic area has slightly over one person per square mile. Key industries are energy, fisheries, wood and wood products and tourism. Unemployment in Alaska in late 2010 was 8 percent, nearly two points lower than the national average.
Factors contributing positively to the state’s ranking:
• Federal law governs leave requirements• No state WARN-type requirements
beyond federal law• Most types of applicant screening and
background checks permissible• “Use it or lose it” vacation policies permissible
Factors contributing negatively to the state’s ranking:
• Daily overtime generally required, with broad exceptions
• Several exceptions to the employment-at-will doctrine• State anti-discrimination laws extend beyond
federal requirements• High wage base for unemployment insurance taxes
Alaska has several labor and employment law requirements that exceed federal standards. The state requires, in many cases, that employees be paid overtime on a daily basis for hours worked in excess of eight in one day as opposed to the federal standard of 40 hours per week.
Alaska recognizes restrictions on the employment-at-will doctrine based on the wording of handbooks, verbal representations of job security, promises made and relied on, and breach of the implied covenant of good faith and fair dealing (which exists even in at-will employment).
Alaska has its own anti-discrimination laws that go beyond federal requirements, enforced by the Alaska State Commission for Human Rights. Municipal governments may also set up agencies to enforce local discrimination laws. Alaska’s anti-discrimination laws reach even small employers with just one employee. Remedies include back pay, compensatory and punitive damages, injunctions, mandated hiring, reinstatement or promotion, and attorneys’ fees.
Alaska has no state leave laws or WARN-type law beyond federal requirements. Arrest and conviction records can be used in making hiring and other employment decisions. Alaska also has no restrictions on the use of consumer credit or consumer investigative reports to guide employment decisions. The state does, however, have statutes regulating employee drug screening and polygraphs. “Use it or lose it” vacation policies, if express and in writing, are permissible.
While employers who give references in good faith enjoy protections under Alaska law, the presumption of good faith can be lost if an employer recklessly discloses information.
Alaska has no right-to-work law and has a relatively high rate of private-sector union membership at 10.3 percent of the workforce. Public-sector union membership is 55.4 percent.
The level of wages taxed for unemployment insurance in Alaska is one of the highest in the nation at $32,700. Employers in Alaska also face high workers’ compensation premiums.
Alaska Alaska Daily Overtime
Alaska exceeds federal law and requires payment of time-and-a-half for hours over eight in a day and 40 in a week. There are core industry exemptions, including agriculture and healthcare. There are also exceptions for collective bargaining agreements and agreed-on flexible workweeks. Violators are liable for an additional equal amount as liquidated damages (although a court may decline to award liquidated damages if the employer acted in good faith) plus attorneys’ fees, fines between $100 and $2,000, and imprisonment between 10 and 90 days. The statute of limitations on overtime claims is two years.
Tier II: Fair
36 Arizona | Tier II: Fair
Arizona ranks in Tier II with a labor and employment-law climate that is somewhat favorable for new job creation. Over the past decade, the state has seen substantial growth, especially in the Phoenix area. The recent economic downturn has slowed growth in the state, but the unemployment rate of 9.4 percent in late 2010 was slightly lower than the nationwide rate.
Factors contributing positively to the state’s ranking:
• State employment laws that largely mirror federal requirements
• State law prohibiting political subdivisions from enacting a minimum wage in excess of the federal minimum wage
• Employers given wide latitude to screen applicants
Factors contributing negatively to the state’s ranking:
• Additional state requirements to verify employment eligibility
• Applicability of some discrimination prohibitions exceeds federal requirements
• Additional state recordkeeping requirements in excess of federal standards
Arizona’s labor and employment statutes largely track federal law, although there are some exceptions. For example, Arizona is one of a handful of states that impose additional requirements to verify the work eligibility of applicant by requiring employers to use the federal E-verify process. These employment verification requirements and penalties for violations, as well as separate requirements to ensure residents are legally present in the state, have attracted a great deal of public attention and are the subject of ongoing litigation.
Arizona has prohibitions against employment discrimination that largely track federal law with a few exceptions. State discrimination prohibitions apply to employers with 15 or more employees who are employed for 20 or more calendar weeks in a year, except for the prohibition against sexual harassment, which
exceeds federal requirements and applies when an employer has as few as one employee. Arizona does not have a separate commission that investigates and prosecutes employment discrimination, rather these laws are administered and enforced by the Civil Rights Division within the state Attorney General’s Office.
The state also requires employers to maintain payroll records for four years, which is one year longer than required by the Fair Labor Standards Act.
Arizona has a relatively low unionization rate at just 3.6 percent of the private workforce. The public-sector unionization rate is 19.7 percent. Arizona is a right-to-work state and by statute prohibits denying an opportunity to obtain or retain employment because of nonmembership in a labor organization.
The Arizona minimum wage is the same as the federal minimum and state law prohibits political subdivisions in the state from enacting any minimum wage that is higher than the federal requirement. Employers in Arizona enjoy fairly wide latitude in investigating an applicant’s or employee’s background, including use of arrest and conviction records.
ArizonaTier II: Fair
State E-verify Requirement
Since 2008, all employers in Arizona are required, after hiring an employee, to utilize the federal E-verify program to ensure the employee is authorized to work in the U.S. Participation in E-verify is also required of any employer that receives an economic incentive from any state government entity. The Attorney General posts a list on its website every three months of all employers in the state that are participating in the E-verify program. Employers found to employ an unauthorized worker are required to immediately terminate the worker and file quarterly reports with the state on all new hires for the next three years. The employer is also subject to suspension of business licenses unless he or she signs an affidavit indicating the unauthorized worker has been terminated and he or she will not knowingly employ an unauthorized worker in the future.

Arkansas | Tier II: Fair 37
Arkansas ranks in Tier II with a labor and employment-law climate that is somewhat favorable for new job creation. Many of the state’s labor and employment laws track federal requirements. The state’s economy is heavily reliant on food production and agriculture, as well as forestry and wood production. In terms of population, it ranks a bit below the midpoint of all 50 states with 2.8 million people. The state’s unemployment rate of 7.9 percent in late 2010 was nearly two points less than the nationwide rate.
Factors contributing positively to the state’s ranking:
• State employment laws that largely follow federal requirements
• No state WARN-type requirements beyond federal law
• Right-to-work state• Workers’ compensation premiums among
the lowest in the nation
Factors contributing negatively to the state’s ranking:
• Relatively high number of labor and employment lawsuits
• Restrictions on employers providing employment reference
• Limitations on enforceability of covenants not to compete
Arkansas has a relatively high amount of labor and employment litigation. The state ranks in the top third of all states based on the number of lawsuits per 10,000 employees.
The state has an unusual mandate that requires an employer to obtain a former employee’s written consent in order to provide an employment reference. Arkansas also has strict limitations
on the enforceability of contracts prohibiting a person from competing against their former employer. Such restrictions must be limited in applicability to customers with whom the employee had material contacts within a reasonable period of time, typically the last twelve months of employment.
Arkansas labor and employment laws otherwise generally follow federal law. The state does not have additional overtime requirements beyond federal law, though it does provide for separate state-based penalties for violations.
Arkansas provides a constitutional right-to-work and has a very low union membership rate of just 2.8 percent of the private-sector workforce—only four states have a smaller union percentage. The rate of public-sector unionization is 10.6 percent. The state also has some of the lowest workers’ compensation premium rates in the nation.
ArkansasTier II: Fair
Employment Discrimination Liability
The Arkansas Civil Rights Act of 1993 does not provide for a separate state agency or commission to enforce employment anti-discrimination laws. Rather, individuals alleging employment discrimination can bring a civil action in state court, which is authorized to issue an order prohibiting any discriminatory practices and provide affirmative relief, including back pay and interest. The court also has discretion to award reasonable attorneys’ fees and litigation costs.
A unique feature of state law limits compensatory and punitive damages based on the size of the defendant employer. An employer with fewer than 15 employees for at least 20 weeks of the year is subject to compensatory and punitive liability up to $15,000. Liability for employers with up to 100 employees is capped at $50,000. An employer with up to 200 employees is liable up to $100,000. An employer with up to 500 employees has a liability limit of $200,000. And employers with more than 500 employees have a compensatory and punitive damages limit of $300,000.
38 California | Tier III: Poor
California has a large and diverse economy with a significant agricultural basis. Yet California ranks in Tier III, with a difficult environment for new job creation. The state is known for its persistent budget woes and debt, high taxes, and complex employment laws and regulations. The unemployment rate in California was 12.4 percent in late 2010, well above the national average.
Factors contributing to the state’s “poor” ranking:
• Hostility towards non-competition agreements• Complex wage and hour laws with
elaborate overtime provisions that surpass federal requirements
• State WARN-type requirements that differ from federal law
• Anti-discrimination laws exceeding federal requirements and remedies
• Privacy-based laws that impact applicant and employee screening
• Does not permit “use it or lose it” vacation• Additional state-based leave requirements
that exceed federal law
California has some of the most complex labor and employment laws in the nation. Many of the requirements imposed on employers differ significantly from federal law. California is unique in its hostility to noncompetition agreements. Even narrowly tailored restraints are not only unenforceable in California, but can also be considered unfair business practices.
The state has a higher minimum wage than the federal requirement and complex wage and hour laws that do not follow federal standards. Overtime is owed for hours over eight in a day or 40 hours in a work week, and for the first eight hours on the seventh consecutive day. Double time is owed for hours in excess of 12 in a workday and hours over eight on the seventh day.
California has tougher white-collar exemption rules as compared to federal law, more detailed payroll record-keeping and paystub requirements, stricter rules against deductions from paychecks and unique meal period and rest break rules. A case regarding whether or not California employers must “ensure” meal periods are taken on time has been pending before the California Supreme Court for over two years. California also has an indemnification provision in its Labor Code that has created a cottage industry of class actions for employees seeking payment for unreimbursed or inadequately reimbursed job-related expenses such as mileage and cell phone charges.
The California law requiring advance notice for lay-offs and plant closings is broader in scope than federal requirements. The state requirements apply to companies too small to trigger coverage under federal law, and also apply to business decisions too small in magnitude to be covered under federal law.
California’s tough restrictions on screening applicants and employees are in part due to its unique discrimination laws, which differ from federal counterpart laws in many respects, including more inclusive definitions, more categories of protected individuals, and steeper remedies with unlimited punitive damages. California law also requires independent-contractor reporting at regular intervals and mandates certain employment training.
CaliforniaTier III: Poor
California | Tier III: Poor 39
Los AngelesThe City of Los Angeles is the heart of the nation’s second largest metropolitan statistical area (Los Angeles–Long Beach–Santa Ana), a mega-metropolis stretching from Northern L.A. County through Orange and San Diego Counties to the Mexican border, from the Pacific coast to the Inland Empire cities of Riverside and San Bernardino. The city is known for its high housing costs, smog (although air quality is improving), traffic, and high taxes, including a combined state and city sales tax of 9.75 percent on the dollar and separate taxes on every conceivable type of business from professional services to rentals. Unemployment in the metropolitan area is high, like the statewide rate, at 12.5 percent in late 2010. Los Angeles has a difficult employment environment, but is still home to a number of employers and remains the center of the entertainment industry. The Port of Los Angeles is a major shipping facility, featuring 27 cargo terminals, including dry and liquid bulk, container, and automobiles. Combined, these terminals handle almost 190 million metric revenue tons of cargo annually.
Los Angeles County has additional non-discrimination prohibitions, and the city has a so-called living wage ordinance for covered county contractors and subcontractors that mandates an hourly wage of $10.30, nearly 30 percent more than the state minimum wage of $8.00, plus a $1.25 additional cash component if health benefits are not provided. The living wage increases with (but does not necessarily fall with) the Consumer Price Index. The L.A. County Council recently passed an ordinance requiring purchasers of large grocery stores to retain the prior owners’ workforce for 90 days following the change in ownership. The ordinance, however, was challenged in court and found to be pre-empted by both state law and the National Labor Relations Act.
California
California exceeds federal requirements in terms of non-discrimination prohibitions with numerous additional classes covered. The state also has unusually strict requirements on drug testing of employees and an unusual restriction on employer anti-nepotism policies.
California has a right of privacy in its constitution that applies to the private sector, enforceable by private lawsuits. It has many privacy-based labor code provisions, including a ban on using arrests not resulting in convictions (and certain types of convictions) in hiring
and employment decisions. The state also has tough restrictions on employer use of consumer credit and background reports in making hiring decisions, among other limitations.
California also has a relatively high private-sector union membership rate of 9.5 percent and a public-sector unionization rate of 56.6 percent. In addition several laws favor union organizing activities, such as a high bar for employers to meet when attempting to control mass picketing. California law also protects leafleting in shopping malls.

40 Colorado | Tier II: Fair
Colorado ranks in Tier II with an environment somewhat favorable for new job creation. Originally dependent on mining and livestock, Colorado today also has a strong service industry and manufacturing sector. Leading industries include food products, printing, and publishing, and Denver is home to a number of high technology companies. Tourism, notably skiing, is also a major component of the state’s economy. In late 2010, Colorado’s population was just over five million, representing nearly a 17 percent growth rate over the last decade. The state’s unemployment rate in late 2010 was 8.6 percent, more than a full point below the national rate.
Factors contributing positively to the state’s ranking:
• Low ratio of labor and employment lawsuits per capita
• Low workers’ compensation insurance premiums
• No state WARN-type requirements beyond federal law
Factors contributing negatively to the state’s ranking:
• Presumption of employee status and aggressive fine structure for misclassifications
• State discrimination laws go beyond federal requirements
• Covenants-not-to-compete generally disfavored• Daily overtime requirement• Restrictions on pre-hiring background checks
Colorado aggressively enforces independent-contractor classifications and penalties for misclassifying workers exceed those in many other states. Effective June 2009, the state increased penalties and created a complaint process for workers who believe they have been misclassified as independent contractors. Colorado also has a number of labor and employment requirements that exceed federal standards. The state has fairly wide-ranging anti-discrimination laws that prohibit various types of employment related discrimination not covered by federal law or, for that matter, most other states.
By statute, Colorado disfavors non-competition and non-solicitation agreements, only permitting such agreements that meet certain enumerated statutory exceptions. Those exceptions include agreements made in connection with the purchase and sale of a business; agreements designed to protect an employer’s trade secrets; agreements used to recover training expenses for an employee who has been with the company less than two years; and agreements pertaining to certain executive and management personnel and their professional staff.
Colorado is also among a handful of states that require that work-related travel is fully compensable for non-exempt employees, even if the travel is outside of normal working hours and is unproductive time. Colorado also is one of a few states that imposes an immediate final paycheck requirement for employees who are involuntarily terminated. The state also restricts the scope of an employer’s background check into job applicants.
Private-sector union membership in the state is low, at 4.5 percent, despite the fact that Colorado is not a right-to-work state, expressly permits by statute picketing activities, and allows employees to vote for a “closed shop” that would require an employer under a collective bargaining agreement to only hire union members. The public-sector unionization rate is 21.8 percent.
ColoradoTier II: Fair
Colorado | Tier II: Fair 41
DenverThe “mile high” city is the distribution point supporting Colorado’s extensive agricultural and industrial infrastructure, as well as home to numerous federal agencies. Leading manufacturers in the area include aeronautical, telecommunications, and high technology companies. The city’s population in 2009 was over 610,000 people.
To encourage growth and development of its communities, Denver has established the Denver Office of Economic Development (OED), which formulates programs to encourage retail development and investment in Denver’s downtown, commercial corridors and neighborhood business districts by seeking retail tenants to occupy available sites or space, or by finding property for interested developers, retailer operators and tenants. The OED provides a business assistance center, loan programs, and information about public improvements and other links to help retail operations get a footing in the community.
Denver imposes a prevailing wage requirement for all employees of contractors or subcontractors at any tier who perform construction, alteration, improvements, repairs, maintenance or demolition of any public building or work in the amount of $2,000 or more. The city also has its own employment law and investigatory and adjudicatory framework. In 1948, Denver established by ordinance the Agency for Human Rights and Community Relations (HRCR). The HRCR is the “umbrella agency” for several city offices, including the Denver Office on Aging and the Denver Office on Disability Rights. The HRCR serves as a resource for discrimination concerns or complaints, and most often attempts to reach resolution through mediation or by referring complaints to the appropriate state agency, typically the Colorado Civil Rights Division. The agency does have the power, however, to conduct full investigations and hold public hearings, and seek judicial enforcement of its orders.
Colorado
Colorado Minimum Wage Order No. 25
Promulgated by the Colorado Division of Labor, Colorado’s Wage Order No. 25 exceeds federal standards and applies specifically to retail and service, commercial support service, food and beverage, and health & medical industries. It establishes a minimum wage, minimum wages for tipped employees, overtime requirements including daily overtime after 12 hours, rules regarding uniforms, meal periods of 30 minutes after five hours of consecutive work, and mandatory compensated 10-minute rest periods for every four hours of work. Employees have a two-year statute of limitations to bring claims under Wage Order 25.
42 Connecticut | Tier III: Poor
Connecticut is home to a number of insurance providers and a variety of manufacturing companies that produce jet engines, helicopters, hardware and tools, cutlery, clocks, silverware, and submarines. Yet Connecticut ranks in Tier III, with a difficult environment for new job creation. With a population of just over 3.5 million, the unemployment rate in late 2010 was 9 percent.
Factors contributing to the state’s “poor” ranking:
• Restrictions on the at-will employment doctrine• Detailed wage and hour laws that differ from
federal standards• Multiple state leave protections beyond
federal requirements• Significant restrictions on independent-
contractor relationships• State WARN-type requirements exceed federal law• Restrictions on employer inquiries to applicant history
Connecticut’s labor and employment laws contain numerous additional mandates beyond federal law. The state recognizes limitations on the ability to terminate at-will employment based on violation of public policy and breach of the implied covenant of good faith and fair dealing.
Connecticut has detailed wage and hour laws that exceed what is required by federal law. The state has a minimum wage of $8.25, a full dollar more than the federal minimum, and imposes higher thresholds for overtime exemptions than are found in federal law. There are requirements for meal periods for adults that include associated penalties. For overnight travel, unproductive time spent traveling as a passenger is considered compensable “hours worked” even when outside normal working hours.
Connecticut has strict final pay rules that require wages due to a terminated employee be paid by the next business day. Violations can result in a penalty of twice the amount due, plus a schedule
of fines and jail time depending on the amounts owed. Final commissions are due 30 days after termination unless the contract provides for a longer time.
Connecticut’s leave laws exceed federal requirements and provide protected leave for numerous additional classes. Connecticut is one of the few states with a requirement that employers pay employees for jury duty with full time employees entitled to be paid for the first five days.
Connecticut’s WARN-type law exceeds federal requirements and provides that upon a relocation or closing, employers must notify each insured employee of any cancellation or discontinuation of health or group life insurance. Employers who relocate or close must continue to pay for an employee’s group health insurance for 120 days or until the employee becomes eligible for other group coverage, whichever is lesser. Failure to provide timely notice of cancellation or discontinuation of insurance coverage may result in fines up to $1,000 for each violation. The employer is also liable for the benefits—in effect becoming self-insured.
The state also restricts an employer’s ability to utilize conviction and arrest records in employment decisions.
Connecticut is not a right-to-work state and the private-sector unionization rate is 8.5 percent, more than a point higher than the nationwide average. The public-sector unionization rate is 64.4 percent.
ConnecticutTier III: Poor
Connecticut Crackdown on Misclassified Independent Contractors
On July 1, 2008, Connecticut established a joint enforcement commission on employee misclassification (the Labor Commissioner, the Commissioner of Revenue Services, the chair of the Workers’ Compensation Commission, the Attorney General and the Chief State’s Attorney) to coordinate the civil prosecution of violations of state and federal laws as a result of employee misclassification.
Effective October 1, 2010, a new law provides that each day of misclassification constitutes a separate offense, thereby subjecting employers that are found to have misclassified contractors to a penalty of $300 per day per contractor.
Delaware | Tier II: Fair 43
Delaware ranks in Tier II with an environment somewhat favorable for new job creation. While Delaware has just under 900,000 residents, Wilmington is part of the nation’s sixth largest metropolitan area of Philadelphia–Camden–Wilmington. Delaware is known for its business-friendly corporations laws, which encourage corporations with principal places of business elsewhere to incorporate in Delaware. In late 2010, the unemployment rate was 8.4 percent.
Factors contributing positively to the state’s ranking:
• Follows federal standards with regard to overtime law
• State anti-discrimination laws mirror federal standards, including damages caps
• No state WARN-type requirements beyond federal law
• Protected leave laws mirror federal standards
Factors contributing negatively to the state’s ranking:
• Heightened scrutiny of independent-contractor relationships
• Some restrictions on screening employees• Additional wage and hour requirements
over and above federal law
Delaware’s labor and employment laws generally mirror federal requirements with regard to overtime and anti-discrimination statutes. In court actions for discrimination under Delaware’s state law, a full range of remedies is available, including punitive damages. However, compensatory and punitive damage awards are capped at federal Title VII limits.
Delaware has no state WARN-type requirements in excess of federal standards. Similarly, Delaware follows federal laws regarding protected leave and has no separate state leave requirements.
Delaware generally follows the at-will employment doctrine, but does recognize public policy exceptions enumerated within the state statute. Employee handbooks are not typically considered to be contracts unless there is an explicit statement in the handbook supporting a fixed term.
There are some areas in which Delaware law varies from federal standards. For example, the state has greater scrutiny of independent-contractor relationships. And although Delaware permits fairly robust pre-employment screening with no state restrictions on the use of credit reports or consumer investigative reports, it does prohibit employer inquiries into expunged convictions of applicants. Special provisions also apply to employers who operate health care and child care businesses.
Delaware is a not right-to-work state, but has a private-sector unionization rate of 5.8 percent, significantly below the nationwide rate of 7.2 percent. The public-sector unionization rate is 38.9 percent.
DelawareTier II: Fair
Delaware’s Written Notice of Exempt or Independent Contractor Status
For the construction services industry, Delaware penalizes misclassification of employees as independent contractors with $1,000 to $5,000 fines per violation and each individual is considered a separate violation. The Delaware Department of Labor has developed a written notice for employees, which recites the presumption of employee status and the penalties for misclassification. Employers and employees must fill in the blanks and sign the notice.
“Having read and understood the foregoing, [employee name] is classified as a (check the box)
independent contractor or
as an exempt person for all purposes with respect to the individual’s works on [project name].”
Trade and date of hire are also stated on the form. Failure to provide the form is considered evidence of misclassification.

44 Florida | Tier I: Good
Florida ranks in Tier I with an environment that is generally favorable for new job creation. With four large metropolitan areas spread across an otherwise largely rural state, Florida’s economy encompasses a number of varied industries, including tourism, agriculture, mining, and aerospace, to name a few. Florida is the fourth-most- populous state in the U.S., behind only California, Texas, and New York. Florida is one of a handful of states with no personal income tax. It has, however, been particularly hard hit by the economic downturn with declines in tourism and the housing market. As a result, the state had an unemployment rate of 12 percent in late 2010.
Factors contributing to the state’s “good” ranking:
• Strong recognition of the at-will employment doctrine• Minimum wage set by federal law• No state prevailing wage provisions• No state WARN-type requirements beyond federal law• Strong right-to-work guarantees• General acceptance of independent-
contractor relationship • State law protective of employer references
Florida does not have many labor and employment laws in excess of federal requirements. The minimum wage, prevailing wage, and employee layoff notification requirements all are governed by the federal standard.
Florida is a strong at-will employment state. The only exception recognized under state law is for workers’ compensation retaliation. Florida courts have specifically considered whether employee handbooks create binding employment contracts and have repeatedly have held that they do not.
Florida is a strong right-to-work state, with only two percent of private-sector workers belonging to a union, although 23.3 percent of public-sector workers are unionized. Florida law provides for misdemeanor criminal penalties for violations of the right-to-work provisions of state law. It also provides a private right of action for damages suffered by an employee as a result of those actions.
FloridaTier I: Good
The Right-to-Work Law in Florida
The source of the right-to-work law in Florida is the state constitution. Article I, Section 6 of the Florida Constitution provides that the right of persons to work shall not be denied or abridged on account of membership or non-membership in any labor organization or labor organization.

Florida | Tier I: Good 45
MiamiMiami is the central city of the largest metropolitan statistical area (Miami–Fort Lauderdale–Pompano Beach) in the Southeast, and the seventh-largest in the country. Numerous major companies are headquartered in or around Miami, and it serves as the Latin American headquarters for hundreds more. Perhaps indicating some tension between this large metropolitan area and the remainder of the state, Miami (and/or Miami-Dade County) have implemented a number of additional employment-related requirements.
For example, the Board of County Commissioners has implemented a “living wage” ordinance. Under that ordinance, contracts awarded stipulate that all covered employees providing service pursuant to the service contract shall be paid a living wage of no less than a specified dollar amount per hour with health benefits, or a separate specified dollar amount without health benefits. In late 2010, the living wage was $10.16 per hour with at least $1.25 per hour in benefits, or $11.41 without benefits, which is more than 50 percent above the federal minimum wage.
In early 2010, Board of County Commissioners enacted a “wage theft” ordinance for the stated purpose of making it easier for employees to recover wages due from employers by filing complaints with the county. The ordinance generally requires employers to pay employees for work within 14 days of the work being performed and applies to amounts of as little as $60. An employer found to be in violation of the ordinance will be required to pay the restitution to the employee, which would include back wages owed as well as possible treble damages and costs to the county.
In addition, the Miami-Dade Board of County Commissioners adopted the provisions of the federal Family and Medical Leave Act, “to provide employees in the County with an efficient alternative means of enforcing their rights to family medical leave through the Commission on Human Rights.” The Commission on Human Rights is authorized to take complaints against employers with five or more employees in Miami-Dade County, and to investigate allegations of discrimination under federal, state and local laws.
Florida
Florida law is also more accepting of independent-contractor relationships than many other states. In addition, state law provides immunity for former employers who provide references, unless clear and convincing evidence demonstrates that the information provided by the former employer was false or violated the individual’s civil rights.
Perhaps the most surprising element of Florida’s generally favorable labor and employment-law climate is its litigation problem. The state has an extraordinary number of labor and employment related lawsuits, with 5.69 such lawsuits filed per 10,000 employees. Only Alabama has a higher ratio.
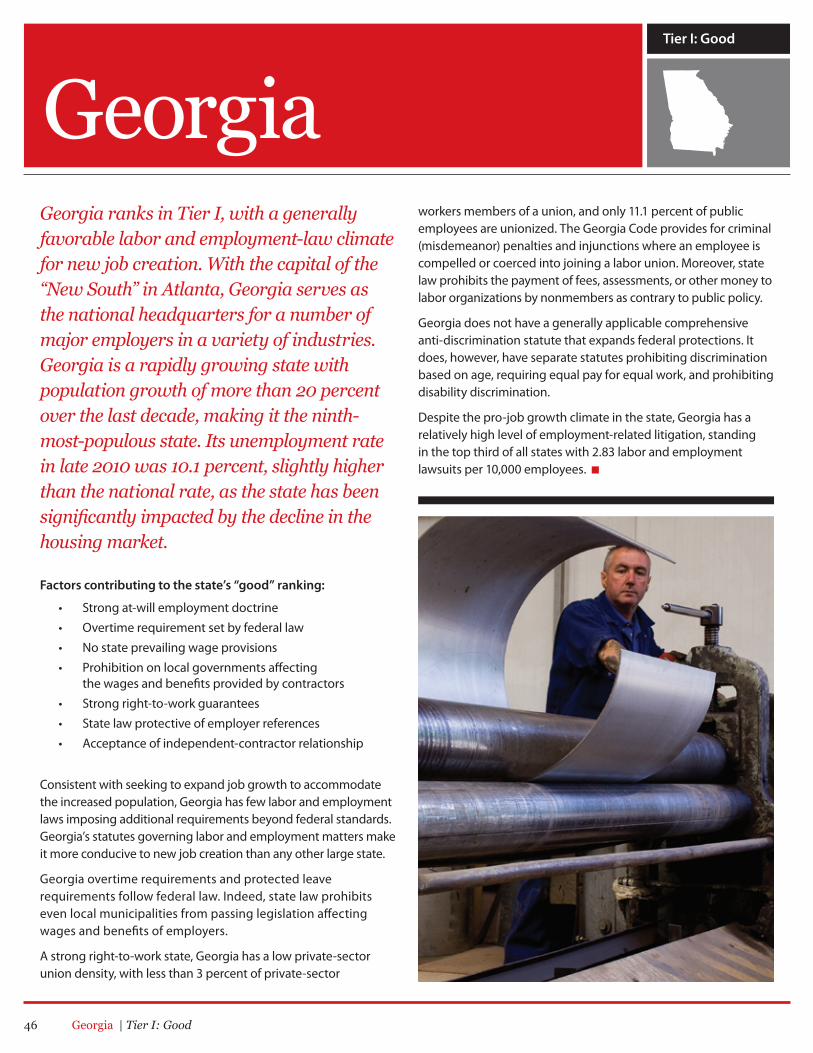
46 Georgia | Tier I: Good
Georgia ranks in Tier I, with a generally favorable labor and employment-law climate for new job creation. With the capital of the “New South” in Atlanta, Georgia serves as the national headquarters for a number of major employers in a variety of industries. Georgia is a rapidly growing state with population growth of more than 20 percent over the last decade, making it the ninth-most-populous state. Its unemployment rate in late 2010 was 10.1 percent, slightly higher than the national rate, as the state has been significantly impacted by the decline in the housing market.
Factors contributing to the state’s “good” ranking:
• Strong at-will employment doctrine• Overtime requirement set by federal law• No state prevailing wage provisions• Prohibition on local governments affecting
the wages and benefits provided by contractors • Strong right-to-work guarantees• State law protective of employer references• Acceptance of independent-contractor relationship
Consistent with seeking to expand job growth to accommodate the increased population, Georgia has few labor and employment laws imposing additional requirements beyond federal standards. Georgia’s statutes governing labor and employment matters make it more conducive to new job creation than any other large state.
Georgia overtime requirements and protected leave requirements follow federal law. Indeed, state law prohibits even local municipalities from passing legislation affecting wages and benefits of employers.
A strong right-to-work state, Georgia has a low private-sector union density, with less than 3 percent of private-sector
workers members of a union, and only 11.1 percent of public employees are unionized. The Georgia Code provides for criminal (misdemeanor) penalties and injunctions where an employee is compelled or coerced into joining a labor union. Moreover, state law prohibits the payment of fees, assessments, or other money to labor organizations by nonmembers as contrary to public policy.
Georgia does not have a generally applicable comprehensive anti-discrimination statute that expands federal protections. It does, however, have separate statutes prohibiting discrimination based on age, requiring equal pay for equal work, and prohibiting disability discrimination.
Despite the pro-job growth climate in the state, Georgia has a relatively high level of employment-related litigation, standing in the top third of all states with 2.83 labor and employment lawsuits per 10,000 employees.
Georgia Tier I: Good
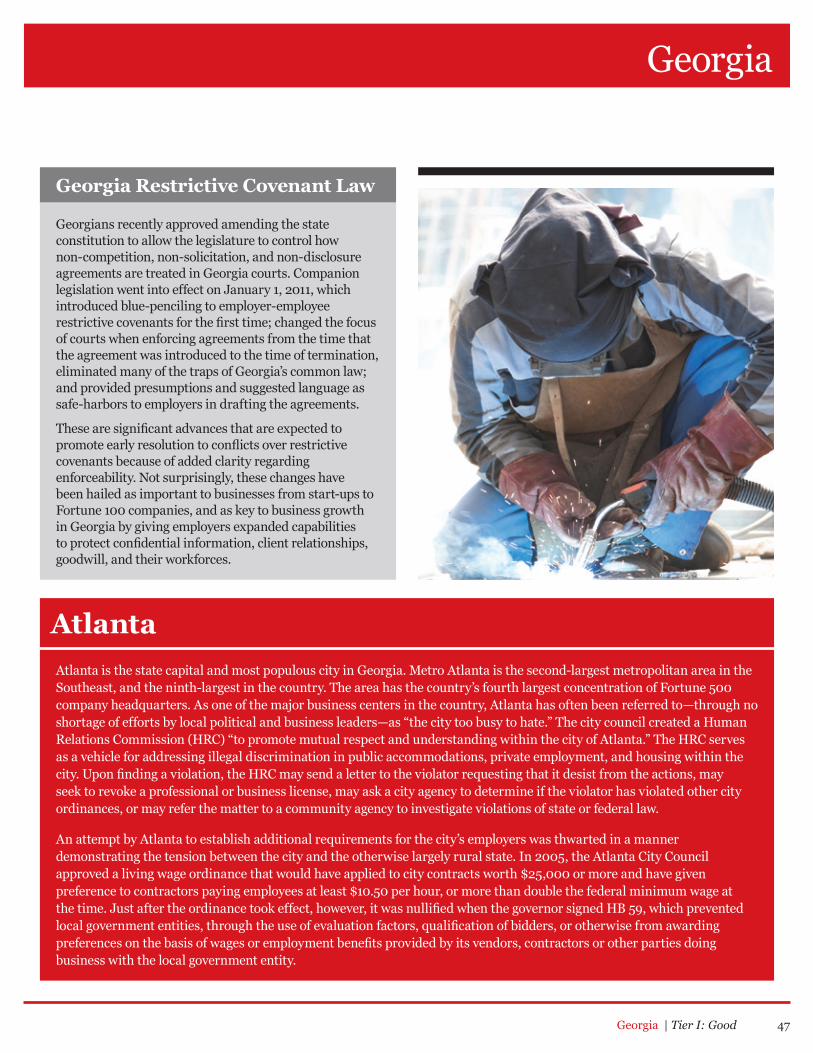
Georgia | Tier I: Good 47
AtlantaAtlanta is the state capital and most populous city in Georgia. Metro Atlanta is the second-largest metropolitan area in the Southeast, and the ninth-largest in the country. The area has the country’s fourth largest concentration of Fortune 500 company headquarters. As one of the major business centers in the country, Atlanta has often been referred to—through no shortage of efforts by local political and business leaders—as “the city too busy to hate.” The city council created a Human Relations Commission (HRC) “to promote mutual respect and understanding within the city of Atlanta.” The HRC serves as a vehicle for addressing illegal discrimination in public accommodations, private employment, and housing within the city. Upon finding a violation, the HRC may send a letter to the violator requesting that it desist from the actions, may seek to revoke a professional or business license, may ask a city agency to determine if the violator has violated other city ordinances, or may refer the matter to a community agency to investigate violations of state or federal law.
An attempt by Atlanta to establish additional requirements for the city’s employers was thwarted in a manner demonstrating the tension between the city and the otherwise largely rural state. In 2005, the Atlanta City Council approved a living wage ordinance that would have applied to city contracts worth $25,000 or more and have given preference to contractors paying employees at least $10.50 per hour, or more than double the federal minimum wage at the time. Just after the ordinance took effect, however, it was nullified when the governor signed HB 59, which prevented local government entities, through the use of evaluation factors, qualification of bidders, or otherwise from awarding preferences on the basis of wages or employment benefits provided by its vendors, contractors or other parties doing business with the local government entity.
Georgia
Georgia Restrictive Covenant Law
Georgians recently approved amending the state constitution to allow the legislature to control how non-competition, non-solicitation, and non-disclosure agreements are treated in Georgia courts. Companion legislation went into effect on January 1, 2011, which introduced blue-penciling to employer-employee restrictive covenants for the first time; changed the focus of courts when enforcing agreements from the time that the agreement was introduced to the time of termination, eliminated many of the traps of Georgia’s common law; and provided presumptions and suggested language as safe-harbors to employers in drafting the agreements.
These are significant advances that are expected to promote early resolution to conflicts over restrictive covenants because of added clarity regarding enforceability. Not surprisingly, these changes have been hailed as important to businesses from start-ups to Fortune 100 companies, and as key to business growth in Georgia by giving employers expanded capabilities to protect confidential information, client relationships, goodwill, and their workforces.
48 Hawaii | Tier III: Poor
Hawaii ranks in Tier III with a difficult environment for new job growth, although the state’s unemployment rate was a low 6.4 percent in late 2010. The state’s economy is heavily reliant on tourism and related service businesses. Agriculture and commercial fishing are also important to the state.
Factors contributing to the state’s “poor” ranking:
• State WARN-type requirements that exceed federal law• Extensive state leave requirements beyond federal law• Detailed state wage and hour laws that exceed
federal requirements • State anti-discrimination laws above and beyond
federal requirements
Labor and employment laws in Hawaii contain a number of additional requirements beyond federal law. Under Hawaii’s WARN-type law, employers who had 50 or more employees at any time in the previous year are required to give employees and the State Department of Labor 60 days’ notice of a business closing, partial closing or relocation of operations. Employers are also required to provide a dislocated worker allowance to each former worker who qualifies for unemployment compensation benefits. The “allowance” is calculated to be the difference between the worker’s average weekly wage and his/her unemployment benefit.
Hawaii has additional leave requirements over and above federal laws. Two years before the federal FMLA was passed, the state enacted its own family leave law to allow up to four weeks of unpaid leave per year for employees meeting certain criteria. The law covers only private-sector employers who have 100 or more workers, and to be eligible an employee must have been working for six months, and must provide certification from an appropriate authority. Employees must be returned to their former position or equivalent position with the same pay, benefits, and other conditions of employment.
Hawaii requires employers to pay wages at least twice each calendar month and within seven days after the end of each pay period. Discharged employees must be paid in full on the day of discharge or no later than the next work day. In order to be exempt from state overtime laws, an employee must be paid $2,000 per month guaranteed compensation exclusive of bonus or commission.
Hawaii has state anti-discrimination laws that extend beyond federal requirements. Under state law, there are numerous protected classes, and the laws cover discrimination based on arrest and court records, although employers can make employment decisions based on convictions within the past 10 years.
Hawaii provides minimum health benefits under its Prepaid Healthcare Act. This law requires private-sector employers to provide a minimum medical plan approved by the Director of the State Department of Labor. To be eligible, an employee must work 20 or more hours per week for four consecutive weeks and earn a monthly wage of at least 86.67 times the current Hawaii minimum wage per month ($7.25 x 86.67 = $628).
In 2010, Hawaii dramatically increased the amount of wages on which employers must pay unemployment insurance tax, and now has one of the highest ceilings in the nation.
Hawaii Tier III: Poor
Hawaii Union Environment
Hawaii’s Labor Relations Board (HLRB) is charged with resolving private and public-sector labor-management disputes and ensuring the fair administration of collective bargaining laws under the Hawaii Employee Relations Act (HERA). In the private sector, the HLRB has jurisdiction primarily over agricultural employees and employees not subject to the jurisdiction of the National Labor Relations Board. Hawaii is not a right-to-work state. Workers who object to union representation may have to pay an amount equivalent to union dues to a nonprofit if the contract so requires. HERA has card-check recognition. Hawaii has prohibitions on hiring strikebreakers and third party recruiting during strikes/lockouts. Approximately 14.7 percent of private-sector workers and 50.2 percent of public-sector workers are unionized.

Idaho | Tier I: Good 49
Idaho ranks in Tier I with a generally favorable climate for new job creation. Major industries in the state include tourism, agriculture, health care, food processing, and mining. Idaho is home to several Fortune 500 headquarters and boasts a number of the fastest growing companies in the country. The state is growing rapidly with a nearly 20 percent population increase in the past decade. Nevertheless, the economic downturn has not left Idaho unscathed, and the state’s unemployment rate of 9.4 percent was only slightly lower than the national average in late 2010.
Factors contributing to the state’s “good” ranking:
• Minimum wage requirement set by federal law• No state prevailing wage provisions• No state WARN-type requirements
beyond federal law• Overtime requirements follow federal standards• Strong right-to-work guarantees• State law protective of employer references• Acceptance of independent-contractor relationship• Low number of labor and employment lawsuits
Idaho labor and employment laws generally follow federal standards. The state has no overtime requirements beyond federal law, and there are also no additional state-imposed leave requirements.
Idaho is generally receptive to the at-will employment doctrine, but does recognize public policy exceptions and the covenant of good faith and fair dealing.
A strong right-to-work state, Idaho has a low rate of private-sector union membership with just 3.2 percent of the private workforce being union members. In the public-sector,
21.7 percent of workers are unionized. Idaho law provides for criminal misdemeanor penalties and injunctions where an employee is compelled or coerced into joining a labor union.
Recently, Idaho’s Human Rights Commission and Department of Labor merged into a consolidated agency. The state has been focused on a number of issues, including addressing unemployment benefits fraud.
Idaho is among the least litigious states in terms of employment-related litigation. Only four states have a lower rate than Idaho’s 1.14 labor and employment lawsuits per 10,000 employees.
IdahoTier I: Good
Idaho Right-to-Work Law
The state has a strong statement of the right-to-work doctrine codified in a state statute:
“It is hereby declared to be the public policy of the state of Idaho, in order to maximize individual freedom of choice in the pursuit of employment and to encourage an employment climate conducive to economic growth that the right-to-work shall not be subject to undue restraint or coercion. The right-to-work shall not be infringed or restricted in any way based on membership in, affiliation with, or financial support of a labor organization or on refusal to join, affiliate with, or financially or otherwise support a labor organization.”
“It shall be the duty of the prosecuting attorneys of each county and of the attorney general of this state, to investigate complaints of violation or threatened violations of this chapter and to prosecute all persons violating any of its provisions, and to take all means at their command to ensure its effective enforcement.”
50 Illinois | Tier III: Poor
Illinois ranks in Tier III with a difficult environment for new job creation. One of the largest states with a population in excess of 12 million people, Illinois is the national headquarters for several major employers. The state has a significant manufacturing base in food products, industrial machinery, transportation and computer equipment. Agriculture is also important and Illinois is one of the leading producers of corn and soybeans. Despite these advantages, in late 2010, the state’s unemployment rate was 9.6 percent, nearly the same as the national average.
Factors contributing to the state’s “poor” ranking:
• Wide-ranging state employment discrimination laws beyond federal requirements
• Significant restrictions on employer inquiries into applicant or employee history
• Not a right-to-work state• State WARN-type requirements that differ significantly
from federal law • Very high ratio of labor and employment lawsuits
per 10,000 employees • Presumption against independent-contractor status
in construction industry • Recent changes in state law making it easier to bring
class action lawsuits relating to wage payments
IIllinois statutes governing labor and employment matters differ substantially from federal law and are significantly more onerous than most other states. Illinois has a wide-ranging Human Rights Act that goes beyond federal standards prohibiting employment- related discrimination. The state also has some of the most restrictive prohibitions of any state on the types of information an employer can consider when making hiring
decisions, including information on an applicant’s criminal background and workers’ compensation claim history.
Illinois is not a right-to-work state and as a result, employees must join a union or pay union dues as a condition of employment at worksites where a collective bargaining agreement exists. Illinois has one of the nation’s highest rates of private-sector union membership at nearly 11 percent of the workforce. Just over 50 percent of public-sector workers are unionized.
The large union presence is a major influence on the development of state labor and employment policy. State law provides a host of protections and benefits for union members. The state provides unemployment benefits to striking workers, and there are state laws permitting picketing in public rights-of-way and a requirement for an employer’s hiring advertisements to specify whether there is an existing strike or lockout. Illinois also has an unusual law providing an attorney-client-type privilege for information obtained by union agents.
Labor and employment litigation in the state is extremely high with Illinois tied with Florida for the highest ratio of labor and employment lawsuits per 10,000 employees of any state in the nation in 2009. Illinois also has workers’ compensation premiums among the highest in the nation.
In 2008, the Employee Classification Act went into effect creating a presumption of “employment” in the construction industry and substantially reducing an employer’s ability to utilize independent contractors. The state requires employers to maintain payroll records for up to 10 years, more than three times the federal standard. Illinois also requires employers to post more than half a dozen notices at worksites in addition to the notices required by federal law.
IllinoisTier III: Poor

Illinois | Tier III: Poor 51
ChicagoAs the largest city in the state and the third largest metropolitan area in the U.S., Chicago has a significant influence on the political and legal climate in the state. The city is home to just under three million people and is tied with metropolitan Philadelphia as having the second largest percentage of union workers of any other city besides New York.
Unions are very active in the city and there are nearly 300 active local unions covering more than 11 percent of private-sector employees. UNITE HERE Local 1 has been engaged in a strike against the Congress Hotel since 2003, in what is reported to be one of the longest running strikes in the nation. The city’s ordinances relating to labor and employment matters reflect the significant union presence and impose a variety of additional requirements on employers beyond the already extensive state law requirements. The city has separate employment discrimination ordinances. Chicago also has its own Human Relations Commission to enforce employment ordinances in addition to a state Human Rights Commission, which enforces state law.
Chicago has a living wage requirement applicable to a variety of occupations that mandates a base wage that in 2010 was more than 50 percent above the federal minimum wage. In addition, the city received a great deal of attention when it attempted to impose the nation’s first of a kind “big box” minimum wage requirement. In 1996, the city council passed by an overwhelming margin a labor-backed measure that would have required retail establishments in excess of 90,000 square feet to within three years pay wages of $10 an hour and benefits worth an additional $3 per hour along with automatic cost of living increases each year. But after major national retailers said the requirement was forcing them to rethink expansion plans for the city, particularly in underserved neighborhoods, the mayor vetoed the ordinance. The issue continues to threaten employers, however, as several city alderman in 2010 endorsed a living wage requirement in excess of $11 an hour for any business with at least 50 employees that received $250,000 in direct or indirect financial assistance from the city. To date, that proposal has not been enacted.
Illinois
State Requirements for Layoff Notification
Illinois has one of the most extensive and onerous plant closing and layoff notice requirements of any state. The state’s mini-WARN Act provisions include some exceptions, but generally require 60 days advanced written notice for a layoff of 25 full-time employees at a single site, who comprise at least 33 percent of full time employees at that site, or 250 total full-time employees. In addition, the notice requirements apply to any plant closing that affects 50 or more full-time employees in any 30-day period. The statute also provides the State Department of Labor with authority to examine an employer’s records to determine whether a violation has occurred and provides for penalties of up to $500 per day and up to 60 days of backpay and benefits for affected workers.
2010 Amendments to the Illinois Human Rights Act
Illinois has one of the most comprehensive statutory schemes providing a variety of discrimination protections to workers in addition to those provided by federal law. Following legislative changes that became effective January 1, 2011, workers are now able to bring state-based class action suits for unpaid wages and seek additional damages.
In addition, as a result of another legislative change effective January 1, 2011, employers are no longer permitted to utilize the credit history of an employee or applicant when making personnel decisions.
52 Indiana | Tier II: Fair
Indiana ranks in Tier II with a labor and employment-law climate that is somewhat favorable for new job creation. The state enjoys a robust manufacturing base across several industries. There is a significant employer presence in automobile, truck and recreational vehicle manufacturing, as well as in steel production and pharmaceuticals. The state also has an active agricultural and mining sector. The state’s unemployment rate in late 2010 was 9.8 percent, the same as the national average.
Factors contributing positively to the state’s ranking:
• State employment laws that largely track federal requirements
• Only narrow exceptions to the employment-at-will doctrine
• Strong protections for employers providing employment references
• No state WARN-type requirements beyond federal law• Relatively low wage ceiling subject to
unemployment tax• Punitive damages not generally available in
employment discrimination cases
Factors contributing negatively to the state’s ranking:
• Not a right-to-work state• High amount of labor and employment-
related litigation
Most of Indiana’s labor and employment laws track federal requirements. The state follows the at-will employment doctrine and provides only narrow public policy exceptions for exercising a statutorily conferred right, or refusing to commit an illegal act for which the employee could be personally liable.
Employers in Indiana generally enjoy immunity for information provided in employment references unless it can be shown
by a preponderance of evidence that the employer knowingly provided false information.
The state’s wage and hour laws generally follow federal standards. There is not a separate state minimum wage in excess of the federal minimum. There is also no special state overtime or premium pay requirement. Indiana does not have additional state-based record retention requirements, or any special layoff notification requirements beyond the federal WARN Act.
Indiana is one of only eight states that impose unemployment tax on just the first $7,000 of an employee’s wages, the federally prescribed minimum.
Indiana is not a right-to-work state and has a private-sector union membership rate of 7.6 percent, slightly above the national average. Nearly 27 percent of public-sector workers are unionized.
Despite Indiana’s somewhat favorable employment climate, the state does have a relatively high number of labor and employment lawsuits. Indiana’s ratio of lawsuits per 10,000 employees is in the highest 20 percent of all 50 states.
IndianaTier II: Fair
Indiana Civil Rights Law
The state has a broad civil rights anti-discrimination law in addition to the federal requirements. The state law is enforced by the state Civil Rights Commission. If the Commission finds a person has engaged in an unlawful discriminatory practice, it will serve an order requiring the person to cease and desist and take further affirmative actions, including compensating the complaining party for actual damages incurred as a result of the discriminatory treatment. State law, however, provides just for recovery of wages, salary or commission as a result of employment discrimination. Punitive damages are not generally available in employment discrimination-related cases.
Upon a finding by the Commission of probable cause of a violation, either the complainant or respondent may elect to have the claim heard in a court of law. Both the respondent and claimant, however, must agree to have the claim decided in court. Pursuant to state law, the claim must be decided by a judge and without a jury.
Iowa | Tier II: Fair 53
Iowa ranks in Tier II with a labor and employment-law climate that is somewhat favorable for new job creation. The state is largely rural with a substantial agricultural basis to its economy. There is also a manufacturing presence, particularly in the eastern part of the state, that includes food processing, machinery and appliances. In late 2010, the state had one of the lower unemployment rates in the country at 6.6 percent, more than two points below the national average.
Factors contributing positively to the state’s ranking:
• Relatively low number of labor and employment lawsuits
• Wage and hour laws largely consistent with federal law
• Right-to-work state• Low workers’ compensation premiums
Factors contributing negatively to the state’s ranking:
• Restrictions on using employee history in employment decisions
• Potential liability in providing references• Heightened scrutiny of employers’ use of
independent contractors• State WARN-type requirements that are
more expansive than federal law• Relatively high wage ceiling subject to
unemployment tax
Many of Iowa’s labor and employment laws are consistent with federal requirements, but there are notable differences. Employers are subject to liability in providing employment references if they act unreasonably, which can include providing work-related information about a person that is not related to the inquiry being made.
IowaTier II: Fair
Misclassification Task Force
Iowa is one of a number of states that have begun a concerted effort to scrutinize employers that use independent contractors. In 2008, the Governor created a multi-agency Misclassification Task Force consisting of representatives from Iowa Workforce Development, the Department of Revenue, and the Department of Economic Development. The Task Force recommended, among other things, the creation of a specially staffed unit to investigate employers suspected of misclassifying their workers. This special unit is housed within Iowa Workforce Development, which collects unemployment taxes from employers.
In addition, there are significant restrictions on an employer’s ability to make employment decisions based on criminal history information. Iowa generally regards the use of criminal history information in employment decisions as a test and accordingly requires the employer to have empirical data demonstrating that such criminal history information is job-related if its use adversely impacts employees in a protected class.
In July 2010, a new layoff notification law went into effect that applies to many more employers than does the federal requirement. Iowa employers with as few as 25 full-time employees must provide 30 days advance written notice to those affected by a permanent or temporary shutdown of one or more facilities that will result in employment loss for 25 or more employees.
Iowa has a high ceiling on the amount of employee wages subject to unemployment insurance tax, at more than three times the federally required minimum of $7,000. The state, however, has some of the lowest workers’ compensation premiums, scoring in the lowest quartile of all states.
Iowa is a right-to-work state that makes it unlawful to deny employment to someone based on membership or affiliation with, or a refusal to join or affiliate with, a labor organization. The state prohibits payment of union dues or assessments as a condition of employment. A violation of the law is considered a criminal misdemeanor. The state does, however, have a sizeable private-sector union presence at 6.9 percent. Just over 31 percent of public-sector workers are unionized.

54 Kansas | Tier I: Good
Kansas ranks in Tier I with a labor and employment-law climate largely favorable for new job creation. The state’s economy is based in large part on agriculture, including cattle and wheat production. Kansas also has a significant manufacturing presence and is one of the nation’s primary producers of airplanes, with several companies located in and around Wichita. The state’s economy is also boosted by mining and petroleum production. The unemployment rate in Kansas was 6.8 percent in late 2010, nearly two points lower than the national average.
Factors contributing to the state’s “good” ranking:
• State employment laws that largely track federal requirements
• Relatively few restrictions on employer inquiries into applicant’s history
• Strong protection for employers providing employment reference
• Right-to-work state• Low workers’ compensation premiums
Most all of Kansas’ labor and employment laws track federal requirements. Kansas is an at-will-employment state and provides a limited exception to the doctrine only for retaliatory discharge. Kansas does have a different weekly overtime standard, but it requires time-and-a-half pay after 46 hours, rather than the federal requirement of 40 hours.
Kansas has few restrictions on an employer’s inquiries into an applicant’s history. If an employer uses criminal records in employment decisions, however, the criminal record must bear upon the employee’s trustworthiness or the safety of other employees or customers.
Kansas provides immunity for an employer providing basic job reference information and additional information provided in response to a written request from a prospective
employer. Although Kansas has a generally favorable business environment overall, there is a relatively high ratio of labor and employment litigation in the state, particularly as compared to other states in Tier I.
Kansas provides a constitutional right-to-work and no one can be denied employment because of membership or nonmembership in a labor organization. The state provides that a person subject to a violation of that right can recover damages and mandates that a court also award reasonable attorney fees. The state prohibits picketing and also prohibits employees and other persons from conspiring to quit their employment or inducing others to do so for the purpose of hindering, delaying, interfering with, or suspending the operation of businesses in several covered industries.
Kansas has a relatively low unionization rate at just four percent of the private workforce, with a public-sector unionization rate of 16 percent. The state also has some of the lowest workers’ compensation premiums in the nation.
Kansas Tier I: Good
Restrictions on a Business Limiting or Ceasing Operations
Kansas has an unusual state law that requires certain employers to notify the State Secretary of Labor when they seek to change their business operations. Employers involved in the manufacture of food products, clothing, or fuel, including those involved in the transportation of those goods from the place where produced, as well as public utilities and common carriers, must apply to the Secretary of Labor and request permission to limit or cease their operations and state the reasons for the change.
The Secretary shall grant authority to the employer to limit or cease operations if the application is found to be meritorious and filed in good faith. Willfully violating the Act or an order of the Secretary is punishable by a fine of up to $1,000 and/or a year in jail.
Kentucky | Tier II: Fair 55
Kentucky ranks in Tier II with a labor and employment-law climate somewhat favorable for new job creation. The state is known for its horse farms and bourbon, but also has a significant industrial base that includes the manufacturing of cars, trucks, and electrical appliances, as well as petroleum and coal production. In late 2010, the state had an unemployment rate of 10.2 percent.
Factors contributing positively to the state’s ranking:
• Strong acceptance of the employment-at-will doctrine• No state WARN-type requirements beyond federal law• Relatively low amount of labor and
employment litigation• Few restrictions on employer pre-hire inquiries
into applicant’s history
Factors contributing negatively to the state’s ranking:
• Additional overtime requirements beyond federal standards
• High workers’ compensation premiums• Not a right-to-work state
Most of Kentucky’s labor and employment laws track federal requirements. The state does, however have some unique overtime requirements and proscriptive meal and break requirements. The state does not have additional layoff notification requirements beyond what is required by the WARN Act, nor does it have a minimum wage that differs from the federal minimum.
Kentucky has strong recognition of the at-will employment doctrine and recognizes exceptions only for fundamental and well-defined public policies that are supported by the state constitution or statutes. The state also has a relatively low amount of labor and employment litigation.
Kentucky state law generally protects employers providing references for former employees. An employer would typically face liability only if acting in reckless disregard of whether the information provided is truthful. The state also places few restrictions on employer inquiries of a job applicant’s history.
Kentucky has some of the highest workers’ compensations premiums in nation. Only Maine, Vermont, Ohio and Alaska have higher premiums.
Kentucky is not a right-to-work state and has a private-sector unionization rate of 6.8 percent. Just over 18 percent of public-sector workers are unionized. The state does not provide unemployment benefits to workers on strike, but state law specifies that a lockout shall not be deemed as strike and no worker shall be denied benefits by reason of a lockout. Kentucky law also expressly permits peaceful picketing.
KentuckyTier II: Fair
Kentucky’s Overtime Law
Kentucky follows federal law and requires time-and-a-half pay for all hours in excess of 40 in a week. The state, however, exempts workers in several industries, including restaurants, hotels, retail stores, as well as seamen, and certain auto, truck and farm implement salesmen, from the state overtime requirements.
In addition, the state has an unusual requirement that requires overtime be paid to any employee who works seven days in a workweek and also works in excess of 40 hours. The requirement would appear to apply even to otherwise exempt employees unless their duties are principally limited to supervising other employees.
Assistants to lawyers, doctors and other professionals licensed by the state, and employees of telephone exchanges having fewer than 500 subscribers are exempt from the seventh day overtime requirement.

56 Louisianna | Tier II: Fair
Louisiana ranks in Tier II with a labor and employment-law environment that is somewhat favorable for new job creation. Louisiana is home to a number of industries, including natural gas, salt, petroleum and sulfur production, agriculture, chemical processing, seafood, and tourism. Still recovering from the effects of Hurricane Katrina in August 2005, the state has experienced virtually no population growth in the past decade. The 25th-most-populous state had an unemployment rate of 8.1 percent in late 2010.
Factors contributing positively to the state’s ranking:
• Strong adherance to the employment-at-will doctrine• Minimum wage requirement mirrors
federal law• No state prevailing wage provisions• State law prohibiting the establishment of
local minimum wages• No state WARN-type requirements beyond
federal law• Overtime requirements follow federal law• Strong right-to-work guarantees• Protection for former employers who
provide references
Factors contributing negatively to the state’s ranking:
• Very high ratio of labor and employment- related lawsuits
• High workers’ compensation premium rates• Significant posting requirements beyond
federal requirements
Louisiana’s labor and employment laws largely track federal requirements. The state strongly recognizes the at-will employment doctrine with exceptions only for a violation of
a specific statutory or constitutional right. Louisiana does not recognize a public policy exception, nor the implied covenant of good faith and fair dealing as an exception to the at-will doctrine.
Louisiana overtime and minimum wage requirements mirror federal law. Louisiana law specifically prohibits, pursuant to the police powers reserved to the state in its constitution, local governmental subdivisions from establishing a minimum wage for private employers.
Louisiana is a strong right-to-work state, with criminal misdemeanor penalties for violations. The state has a low private-sector union membership of just 3.7 percent and a public-sector unionization rate of 9.3 percent, one of the lowest in the country.
Among the factors contributing negatively to the employment climate are one of the highest rates of labor and employment lawsuits—with 3.93 lawsuits per 10,000 employees. The state also has some of the highest workers’ compensation premium rates in the nation.
Louisiana Tier II: Fair
Louisiana’s Required Posters
Louisiana law contains significant posting requirements beyond federal law:
• Notice to Workers (Unemployment Benefits)
• Notice of Compliance to Employees (Workers’ Compensation)
• Minor Labor Law
• Sickle Cell Anemia
• Out-of-State Motor Vehicles
• Discrimination in Employment (Genetic Testing)
• National Guard
• Timely Payment of Wages
• No Smoking
• Age Discrimination
• Earned Income Credit
• Workers’ Compensation Fraud (recommended)
Maine | Tier III: Poor 57
Maine ranks in Tier III with a difficult climate for new job creation. Significant industries in the state include tourism, shipbuilding, fishing, paper, lumber, bio-technology and agriculture. Maine is the world’s largest producer of blueberries. The nation’s 40th-most-populous state had an unemployment rate of 7.3 percent in late 2010.
Factors contributing to the state’s “poor” ranking:
• Significant additional leave requirements beyond federal law
• Higher minimum wage than required by federal law• High workers’ compensation premiums and benefits• Not a right-to-work state• Significant additional posting and notice requirements
beyond federal law
Maine’s labor and employment-related laws often go well beyond the requirements of federal law. State law contains a number of provisions for various types of leave beyond federal
requirements. Among other provisions, it expands the scope of family and medical leave to employers with as few as 15 employees at one site. Maine establishes meal and rest period requirements, and a number of additional posting and notice requirements. The state also has a separate minimum wage in excess of the federal minimum wage.
Maine’s WARN-type notification requirements largely track the federal law. Significantly, however, Maine requires employers to provide employees with severance pay for relocations and separations.
The Maine Human Rights Act prevents discrimination in employment for a number of protected classes beyond federal law. The Act is enforced through private litigation as well as the Maine Human Rights Commission.
Maine is not a right to work state but only 5.1 percent of private-sector employees in Maine are members of a union, below the nationwide average. Nearly 49 percent of public-sector workers are unionized.
Maine is, however, protective of the at-will employment doctrine. The state provides significant protection for employer references, with a presumption of good faith unless there is clear and convincing evidence that the information was provided was false or provided with malicious intent. In addition, Maine has a relatively low ratio of labor and employment litigation per 10,000 employees.
MaineTier III: Poor

58 Maryland | Tier II: Fair
Maryland ranks in Tier II with a labor and employment-law climate somewhat favorable for new job creation. Perhaps known best for its fishing and seafood production, the state’s economy is also supported by manufacturing, biotechnology and a major shipping port in Baltimore. The state had an unemployment rate of 7.4 percent in late 2010.
Factors contributing positively to the state’s ranking:
• Many state employment laws follow federal requirements
• Relatively strong protections for employers providing references
• Low workers’ compensation premiums• Low wage ceiling subject to unemployment
insurance taxes
Factors contributing negatively to the state’s ranking:
• Several restrictions on employer pre-hire inquiries into applicant’s history
• Additional “living wage” requirements
• Not a right-to-work state
With some exceptions, many of Maryland’s labor and employment laws follow federal requirements. The state generally protects employers providing references by presuming an employer acts in good faith unless the information provided was intentionally false or provided with actual malice.
Workers’ compensation premium rates are among the 10 lowest in the nation. The state also has a relatively low ceiling on employee wages subject to unemployment insurance taxes.
On the other hand, Maryland places numerous conditions and restrictions on an employer’s ability to inquire into the history of an applicant. Maryland law specifies that consumer reports can be considered in employment decisions, but if the position pays less than $20,000 per year there are a number of factors that cannot be considered, including bankruptcies more than 10 years ago, judgments, tax liens, accounts in collection, and
criminal records older than seven years. In addition, an employer that seeks an investigative consumer report must disclose in writing to the applicant that the report will contain information about applicant’s character, mode of living, general reputation, and personal characteristics.
Maryland is not a right-to-work state and has a private-sector unionization rate of 7.3 percent. The public-sector unionization rate is 29.1 percent. The state has enacted several union-friendly laws over the years. These laws include limits on the liability of union officers; criminal penalties for corporate officers who fail to make dues payments; limitations on the use of strikebreakers; and prohibiting injunctive relief before first using alternative dispute resolution.
Maryland Tier II: Fair
“Living Wage” Requirement
Maryland does not have a separate state minimum wage different from federal law, but it does have a “living wage” requirement for contractors and subcontractors on most state service and maintenance contracts.
There are two different living wages depending on the geographic location of the work to be performed. Tier I wages apply to counties surrounding Baltimore and Washington, D.C., and Tier II wages apply to the balance of the state. The wages adjust each year based on the Consumer Price Index.
Covered employers working on projects in Tier I areas must pay at least $12.28 per hour, while work in Tier II areas pays at least $9.23 per hour. If the employer provides health insurance coverage for its employees, then the applicable living wage can be reduced by all or part of the cost of the healthcare coverage.
In July 2010, the Baltimore City Council considered imposing a separate living wage ordinance that would have required large retailers in the city to pay at least $10.59 per hour, but the proposal died on a tie vote.

60 Massachusetts | Tier III: Poor
Massachusetts ranks in Tier III with a difficult labor and employment-law climate for new job creation. The state has a long history in the commercial fishing, shipping and manufacturing industries. More recently, the economy has been driven by the electronics, communications, pharmaceutical and healthcare industries. Agriculture is also important with significant cranberry, dairy and poultry products. The tourism industry is also strong because of the Commonwealth’s numerous beaches and historic landmarks. In late 2010, Massachusetts’ unemployment rate was 8.2 percent.
Factors contributing to the state’s “poor” ranking:
• Extensive restrictions on pre-hire background checks• Wide-ranging state employment discrimination laws
beyond federal requirements• Extensive wage-hour regulation beyond
federal requirements• Presumption against independent-contractor
status and aggressive enforcement• Three-hour reporting pay requirement • Prevailing and living wage laws • Notice payment law that can require severance
for change in control
Massachusetts imposes a number of additional restrictions and requirements on employers beyond federal requirements. The state imposes significant restrictions on the ability of employers to conduct background checks or to inquire about an applicant’s past criminal history, including specific limitations on the ability to inquire into misdemeanor convictions for drunkenness, simple assault, and other enumerated restrictions. In late 2010, the Massachusetts Commission Against Discrimination issued guidelines requiring employers to post explicit disclaimers on employment applications advising applicants of their rights.
Pursuant to the state’s “blue Laws,” employers cannot operate on Sundays unless they meet one of 55 exemptions. Retailers, while exempt from Blue Laws, are required to pay non-exempt employees at time-and-a-half the regular rate for work on Sundays, as well as certain federal holidays. In addition, retailers may only operate on Christmas Day and Thanksgiving by permit.
Massachusetts also requires employees to receive pay for three hours if the employee is scheduled to work for three or more hours but turned away for lack of work. In addition, employees who are terminated involuntarily must be provided with their final paycheck on their last working day, or the employer may be subjected to treble damages plus other monetary and even criminal fines.
Massachusetts is not a right-to-work state, meaning that employers and unions may enter into agreements that require union membership as a condition of employment. Massachusetts also has significant pro-labor legislation on its books, including limitations on union officer liability, specific authorization of peaceful picketing and persuasion, prohibitions on the use of “strikebreakers” and limitations on the use of armed guards during strike activity, requirements that hiring advertisements make clear whether there is ongoing strike or lockout activity, and other limitations. Private-sector union membership in the state is higher than the nationwide average at 8.8 percent. Just over 62 percent of public-sector workers are unionized.
Massachusetts maintains a plant-closing notice and payment law that imposes significant obligations beyond those imposed by federal law. Notice and payment requirements are imposed even for “change of location” situations for employers with as few as 12 employees. In addition, plant closings or partial
MassachusettsTier III: Poor
Massachusetts | Tier III: Poor 61
BostonWith a population of approximately 645,000, Boston is by far the largest city in Massachusetts, but as of 2009 was only the 20th largest city in the United States. Incorporated as a city in 1822, Boston is rich in history and retains many of its original buildings as historic landmarks. The city’s banking, financial services, healthcare, insurance and real estate sectors drive the economy, and Boston has a significant influence on the political and legal climate in the state.
Boston generally does not impose employment law obligations on employers beyond those imposed by the Commonwealth of Massachusetts and federal law. Unlike many cities, there is no employment discrimination ordinance or other city adjudicatory function relating to employment law matters. The city does, however, impose a “Jobs and Living Wage Ordinance” for employees of vendors who contract with the city. The ordinance requires that employees be paid an hourly wage that is “sufficient for a family of four to live at or above the federal poverty level.” In late 2010 through June 30, 2011, the applicable wage is $13.02 per hour, and according to the city covers more than 21,000 employees of city vendors.
Massachusetts
Treble Damages Even for Inadvertent Wage Hour Violations
Massachusetts has one of the most aggressive legislative efforts in the country related to wage and hour issues. Titled “An Act Further Regulating Employee Compensation,” the law imposes mandatory treble damages for violations of Massachusetts wage-hour laws, even for inadvertent violations, such as a mistaken underpayment or delay in payment. The bill became law in April of 2008, when Governor Patrick returned the bill to lawmakers suggesting that the strict liability standard be loosened, and his refusal to act on the bill allowed it to become law without his signature. This “strict liability” standard is believed to fuel wage-hour lawsuits in the Commonwealth and imposes significant risks for employers.
closings trigger additional reemployment assistance benefits that are billed to the employer. State law also provides for lump sum severance pay, in the amount of two weeks of compensation for every year of service, after a transfer of control in certain circumstances, although a federal appeals court has found this provision to be preempted by the federal Employee Retirement Income Security Act.

62 Michigan | Tier III: Poor
Michigan ranks in Tier III with a difficult environment for new job creation. The state has long been a center of manufacturing, but has faced a tough economic times for several years, even before the recent financial crisis affected the rest of the country. In addition to the production of motor vehicles and parts, Michigan is a leading producer of prepared cereals, machine tools, airplane parts, appliances and furniture. Michigan is also rich in natural resources, such as iron and copper, has a substantial agricultural presence and supports thousands of jobs in the wood-product, tourism, and recreation industries. With a population of nearly 10 million people, Michigan had an unemployment rate of 12.4 percent in late 2010, which was among the highest state unemployment rates in the country.
Factors contributing to the state’s “poor” ranking:
• Wide-ranging state employment discrimination laws that exceed federal requirements
• Not a right-to-work state• Uncapped damages available in employment
discrimination claims• State-wide task force to pursue independent-
contractor misclassifications• State WARN-type requirements that exceed federal law
Michigan imposes a number of additional requirements on employers beyond those required by federal law. In addition to federal anti-discrimination laws, Michigan has robust enforcement of its extensive and wide-ranging state anti-discrimination laws, including the Elliot-Larsen Civil Rights Act and the Persons with Disabilities Civil Rights Act.
MichiganTier III: Poor
Elliot-Larsen Civil Rights Act
Michigan statutes governing labor and employment matters are more wide-sweeping than in other states. Michigan’s Elliot-Larsen Civil Rights Act, in particular, uniquely provides explicit, broad protection against certain personal characteristics not found elsewhere. For example, employees in Michigan are protected against discrimination on the basis of height and weight— the only state in the U.S. to offer such protections. In addition, employees in Michigan have protection against age discrimination on the basis of youth, meaning that employees under age 40 may sue for age discrimination. Although punitive damages are not available under the Act, damages are otherwise uncapped, and there is an immediate right to sue with no requirement to first file a charge of discrimination with the state agency.
Michigan is not a right-to-work state, and as a result, employees can be forced to join a union or pay union dues as a condition of employment at worksites where a collective bargaining agreement exists. Michigan has one of the highest rates of private-sector union membership in the United States, at nearly 13 percent of the private-sector workforce. The public-sector unionization rate is 48.9 percent.
Uncapped damages are available to plaintiffs under state employment discrimination law and the state has a relative high ratio of labor and employment lawsuits per 10,000 employees.
Michigan imposes substantial notice and posting requirements on employers beyond what is required by federal law. The state has also developed a state-wide task force to address independent-contractor misclassifications. In addition, Michigan has a WARN-type notification requirement that exceeds federal law and is triggered by reductions of only 25 employees.

Minnesota | Tier II: Fair 63
Minnesota ranks in Tier II with a labor and employment-law environment somewhat favorable for new job creation. The state’s broad-based economy ranges from agriculture and mining to manufacturing, medical services and publishing. Duluth is a center of foreign trade with the largest inland harbor in the U.S. The state’s unemployment rate of 7.1 in late 2010 was significantly less than the nationwide average.
Factors contributing positively to the state’s ranking:
• Many state employment laws mirror federal requirements
• Relatively low number of labor and employment lawsuits
• Overtime requirements follow federal standards
Factors contributing negatively to the state’s ranking:
• Very high wage ceiling subject to unemployment insurance taxes
• Numerous additional state leave requirements beyond federal law
• Not a right-to-work state • Employee handbook can be converted to
binding contract• Broad anti-discrimination requirements beyond
federal standards
Many Minnesota labor and employment laws mirror federal requirements. The state has not established special daily overtime requirements, and Minnesota requires an employee be paid time-and-a-half pay after working 48 hours in a week. The state has a relatively low ratio of labor and employment lawsuits per 10,000 employees.
However, Minnesota requires employers to pay unemployment insurance tax on employee wages at a level that is nearly four
MinnesotaTier II: Fair
Minnesota Laws on Union Issues
Minnesota has several union-friendly provisions in state law, including providing unemployment benefits to locked out workers; a prohibition against employers knowingly utilizing a professional strikebreaker to replace employees involved in a strike or lockout; limitations on advertising for replacement workers during a strike or lockout; and requiring a leave of absence for employees elected to full-time union positions.
The state requires that any employee elected to a full time position in a labor organization be given a leave of absence by his employer for the duration of the time the employee holds such office, without losing seniority or entitlement to any rights acquired as a result of employment. Minnesota also requires employment agencies to state in any advertisement, proposal, or contract for employment, if there is a strike or lock-out at the place of proposed employment.
Minnesota is not a right-to-work state and has a relatively high unionization rate of 8.5 percent of the private workforce. Fifty-seven percent of public-sector workers belong to a union.
times higher than the federal standard, and higher than all but seven other states. The state also mandates nearly a dozen different reasons for an employee to be granted leave, including several beyond what is required by federal law.
Minnesota recognizes limited public policy exceptions to the at-will employment doctrine, but its courts have converted employee handbooks into binding employment contracts.
Minnesota also has a wide-ranging Human Rights Act that exceeds the requirements of federal law. The Act provides a variety of remedies, including compensatory damages up to three times the amount of actual damages and damages for mental anguish or suffering. In addition, an aggrieved party can recover reasonable attorneys’ fees and punitive damages in an amount up to $25,000, among other remedies.
64 Mississippi | Tier I: Good
Mississippi ranks in Tier I with a labor and employment law climate largely favorable for new job creation. Mississippi’s population is nearly three million, with the largest population in the state capital of Jackson. In late 2010, unemployment in the state was 9.9 percent, essentially equal to the national average.
Factors contributing to the state’s “good” ranking:
• Leave requirements set by federal law• Wage-hour requirements follow federal law• No state WARN-type requirements beyond federal law• Employment discrimination protections follow
federal law• Employers given latitude to screen applicants• Right-to-work state
Mississippi’s labor and employment laws largely track federal requirements. The state has no additional protected leave requirements that differ from federal law. Similarly, wage and hour laws such as overtime and minimum wage do not differ from federal standards. Mississippi also has no state WARN-type law.
Mississippi is one of only a few states that exclusively follow federal anti-discrimination standards for private-sector employers.
Mississippi allows employers substantial latitude to screen applicants, but it does regulate drug testing. The drug testing regulations are promulgated by the Mississippi Department of Health and require, for example, confirmation testing, sample preservation for re-testing, and review of test results by a medical review officer or “MRO.”
Mississippi is a right-to-work state, and the state Constitution declares that it is a public policy of the state that the right-to-work shall not be denied or abridged on account of membership or non-membership in a labor organization. Mississippi has a relatively low level of union membership at 4.4 percent of private-sector employment, well below the national average. Just 7.4 percent of public-sector workers are unionized, one of the lowest rates in the nation.
Mississippi largely follows the at-will employment doctrine, with a fairly narrow exception for termination in violation of public policy. Employee handbooks can be considered contractual unless there are appropriate restrictions in the language.
Mississippi’s unemployment insurance taxes are among the lowest in the nation. Mississippi requires employers to display just two workplace posters beyond federal requirements, one for unemployment insurance and one for workers’ compensation insurance.
MississippiTier I: Good
Missouri | Tier II: Fair 65
Missouri ranks in Tier II with a labor and employment-law climate somewhat favorable for new job creation. Located in the center of the country with large cities on its western and eastern borders, the state is a transportation and manufacturing hub. Automobile production and the aerospace and defense industries are important to the state’s economy. Missouri also benefits from significant tourism and agriculture. In late 2010, the state’s unemployment rate was 9.4 percent.
Factors contributing positively to the state’s ranking:
• Most employment laws follow federal standards• State statute that prohibits municipalities from
enacting minimum wage requirements that differ from the state minimum
• Relatively strong protection for employer references
Factors contributing negatively to the state’s ranking:
• Immediate pay requirement for discharged employees• No right-to-work protections• Relatively high rate of labor and employment litigation
Most of Missouri’s labor and employment laws track federal requirements. There are no additional state-imposed daily or weekly overtime or premium pay requirements beyond federal law. The state also prohibits municipalities from requiring a minimum wage that exceeds the state minimum wage, which is the same as the federal minimum wage. The state has no additional notification requirements beyond federal WARN Act standards. Missouri also has no additional record retention requirements beyond federal law.
Missouri law does specify that a terminated employee’s wages become due and payable on the day of discharge. If payment is not received within seven days, the employee’s wages shall continue to accrue until paid for a maximum of 60 days.
Missouri generally follows the employment-at-will doctrine, but recognizes exceptions for well-established public policy reasons, including for whistleblowers. State courts, however, are reluctant to allow circumvention of the at-will doctrine by terminated employees claiming employee handbooks are enforceable contracts.
Missouri is not a right-to-work state and its private-sector union membership rate of 8 percent is slightly higher than the national average. Just over 18 percent of public-sector workers are unionized. The state also has a relatively high ratio of labor and employment lawsuits per 10,000 employees.
MissouriTier II: Fair
Employment References and Letters of Dismissal
Missouri employers that provide references for former or current employees are provided immunity from civil liability if they follow the requirements specified in statute, unless the response was made with knowledge that it was false or with reckless disregard for whether such response was true or false.
Among other conditions specified in the statutory provision, the employer may respond in writing to a written request concerning an employee and disclose the nature and character of the employee’s service, as well as state for what cause the employee was discharged or voluntarily quit. The employer must also provide a copy of the response letter to the former employee at his last known address. An employer who violates these provisions is liable for compensatory, but not punitive damages.
In addition, Missouri has an unusual provision that specifies an employee who voluntarily quits or is discharged by a business with more than seven employees, is entitled to a letter, upon request, describing the nature and character of service and stating for what cause, if any, such employee was discharged or voluntarily quit.
Employers that violate this provision by not issuing the requested letter are subject to punitive damages.
66 Montana | Tier III: Poor
Montana ranks in Tier III with a labor and employment law climate that is difficult for new job creation. The fourth largest state in terms of area, Montana has the 44th-largest population. The state’s economy is largely dependent on agriculture, lumber, mineral extraction, and tourism. The unemployment rate in Montana was 7.2 percent in late 2010.
Factors contributing to the state’s “poor” ranking:
• Tough restrictions on independent contractors in certain industries
• Weak protections for employer references• Not a right-to-work state• High workers’ compensation premiums and benefits• Weak adherence to the employment-at-will doctrine
Montana is unique in its hostility to the traditional employment-at-will doctrine through its Montana Wrongful Discharge in Employment Act.
Although the statute contains language stating that employment in the state is “at-will,” the statute defines “good cause” for termination as “reasonable job-related grounds for dismissal based on a failure to satisfactorily perform job duties, disruption of the employer’s operation, or other legitimate business reason.” This provision is perhaps the most significant restriction on at-will employment in the country.
The state’s Wrongful Discharge in Employment Act does not apply to employees who are subject to a collective bargaining agreement and Montana is not a right-to-work state. Nevertheless, only 6.5 percent of private-sector employees in the state are members of a union. However, 41.4 percent of public-sector workers are unionized.
Montana also has among the highest workers’ compensation premium rates and benefits in the nation.
However, Montana follows federal standards with regard to overtime and minimum wage requirements. The state is also among the nation’s leaders in the fewest number of labor and employment lawsuits filed per 10,000 employees.
MontanaTier III: Poor
Montana Independent Contractor Law
Montana is one of several states that have increased scrutiny of independent-contractor relationships in recent years. Under Montana law, a person may not perform work as an independent contractor without (1) obtaining an independent-contractor exemption certificate from the state, unless the individual is not required to obtain such certificate pursuant to state law; or (2) electing to be bound personally and individually by the provisions of a workers’ compensation insurance plan.
Similarly, an employer may not exert control to a degree that causes the independent contractor to violate the provisions of state law. A person or employer who violates the law is subject to a fine up to $1,000 for each violation.
Nebraska | Tier II: Fair 67
Nebraska ranks in Tier II with a labor and employment-law climate that is somewhat favorable for new job creation. In addition to a major agricultural sector, Nebraska also serves as the national headquarters for a number of employers in a variety of industries. Freight transportation, manufacturing, telecommunications, and financial services all have a strong Nebraska presence. The 38th-most-populous state, Nebraska has one of the lowest unemployment rates in the country at just 4.6 percent.
Factors contributing positively to the state’s ranking:
• Relatively few employment-related lawsuits• Strong recognition of the at-will employment doctrine• Minimum wage set by federal law• No state prevailing wage provisions• No state WARN-type requirements beyond federal law • Overtime requirements track federal law• Strong right-to-work guarantees• Acceptance of independent-contractor relationship
Factors contributing negatively to the state’s ranking:
• No state statute protecting former employers who provide references
• Relatively high workers’ compensation benefits
Nebraska is a strong at-will-employment state that does not recognize public policy exceptions to the doctrine. Nebraska tracks the federal standard with regard to overtime and there are no prevailing wage or employment-related debarment provisions.
A strong right-to-work state, Nebraska has a low private-sector union density, with 4.2 percent of private-sector workers members of a union. A little over 28 percent of public-sector workers are unionized. Nebraska law provides for criminal (misdemeanor) penalties against any entity that enters into a union shop contract.
Nebraska has one of the lowest ratios of employment and labor-related lawsuits, with 1.17 lawsuits filed per 10,000 employees. Only five states have lower rates. The state is also very accepting of independent-contractor relationships.
Among the factors contributing negatively to Nebraska’s ranking are the fact that Nebraska’s courts will not blue-pencil employment contracts and that employers in Nebraska have little protection when providing employment references. In addition, Nebraska requires a number of employment-related postings above what is required by federal law.
Nebraska Tier II: Fair
Nebraska Right-to-Work
Nebraska has been a right-to-work state since 1946, when the guarantee was added to the state’s constitution through a referendum in the general election.
The provision specifies that no person shall be denied employment because of membership in or affiliation with, or resignation or expulsion from a labor organization or because of refusal to join or affiliate with a labor organization; nor shall any individual or corporation or association of any kind enter into any contract, written or oral, to exclude persons from employment because of membership in or non-membership in a labor organization.
68 Nevada | Tier III: Poor
Nevada ranks in Tier III with a difficult labor and employment-law environment for new job creation. The state is the center of the gaming industry and is heavily reliant on tourism. Other significant industries include mining and agriculture, which is largely confined to cattle and sheep grazing. Nevada experienced substantial population growth over the past decade, particularly around Las Vegas, but by late 2010, it had the highest unemployment rate in the nation at 14.3 percent.
Factors contributing to the state’s “poor” ranking:
• Overtime requirements beyond federal law• State minimum wage that exceeds federal law• Exceptions to the employment-at-will doctrine• Employee handbooks convertible to contract• State anti-discrimination laws go above and
beyond federal laws • Restrictions on applicant screening and
obtaining references
Nevada’s labor and employment laws contain numerous provisions that exceed federal law and impose additional restrictions on employers. Overtime, minimum wage and discrimination statutes all exceed federal standards.
Nevada recognizes public policy and bad faith exceptions to the traditional at-will employment doctrine. State courts have also permitted employee handbooks to become binding contracts on employers.
Nevada goes beyond federal law and places numerous restrictions on an employer’s use of consumer and credit reports to screen applicants. The state also prohibits the use of arrest records in employment decisions, and while job-related convictions may be considered, special language that a conviction is not necessarily disqualifying must appear on job application materials inquiring about convictions.
Employers who provide employment references in Nevada are protected by a qualified privilege for truthful references. The employer’s defense can be lost for many reasons, however, including for reckless disclosure and giving information that the employer had no reasonable basis for believing to be accurate.
Nevada is a right-to-work state, but has a very high rate of union membership at 12.7 percent of the private-sector workforce. Nearly 40 percent of public-sector workers are unionized.
Nevada Tier III: Poor
Nevada Overtime and Minimum Wage
Nevada requires that employees be paid time and a half for hours worked over eight in a day and forty in a week. There are exceptions, including for agriculture and for employers with gross sales of less than $250,000. Comissioned employees earning more than 1.5 times the minimum wage are also are exempt from the daily overtime requirement.
Nevada also has an unusual separate state minimum wage requirement that in 2010 was a full dollar-per-hour higher than the federal minimum if the employer did not provide the employee with health insurance benefits. Employees that received health insurance benefits from their employer were subject to the federal minimum wage of $7.25 per hour.
New Hampshire | Tier II: Fair 69
Equal Pay Law
Like a number of other states, New Hampshire imposes an affirmative equal pay obligation for “equal work” as between men and women, but contains a number of exceptions. The state prohibits an employer from engaging in discrimination in the payment of wages “as between the sexes” for equal work or work on the same operations.
The statute makes clear, however, that a variation in rates of pay based upon a marked difference in seniority, experience, training, skill, ability, or difference in duties and services performed, either regularly or occasionally, or difference in the shift or time of the day worked, or difference in availability for other operation, or other reasonable differentiation may be applied to justify a difference in pay.
New Hampshire ranks in Tier II with a labor and employment-law climate that is somewhat favorable for new job creation. The state has long relied on manufacturing to fuel its economy. New Hampshire’s leading industrial products are electrical machinery, textiles, pulp and paper products, and stone and clay products. The major agricultural products include dairy, poultry, and fruit. New Hampshire’s economy also benefits from tourism due to its scenic and recreational resources. In late 2010, New Hampshire had one of the nation’s lowest unemployment rates at 5.4 percent.
Factors contributing positively to the state’s ranking:
• Few restrictions on employer inquiries into applicant history
• Low ratio of labor and employment lawsuits per capita
• Relatively low wage ceiling for unemployment insurance taxes
Factors contributing negatively to the state’s ranking:
• Relatively wide-ranging state employment discrimination laws beyond federal requirements
• Reporting pay requirement and strict final paycheck rules within 72 hours of termination
• State WARN-type notification requirements trigger for temporary or permanent layoffs of 25 or more employees, exceeding federal law
New Hampshire gives employers comparatively broad discretion to screen applicants, including the use of credit or consumer investigative reports and arrest and conviction records. It has a low ratio of employment lawsuits per capita, at approximately .8 lawsuits per 10,000 employees. New Hampshire employers also benefit from a relatively low wage ceiling subject
to unemployment insurance tax, at about $3,000 more than the federal minimum.
New Hampshire’s employment law statutory scheme is more wide-ranging than many states, however, and exceeds federal requirements. For example, state law includes an explicit prohibition of unequal pay based on gender. The New Hampshire Commission for Human Rights may impose remedies including backpay, compensatory damages and attorneys’ fees, as well as impose administrative fines for repeated findings of discrimination.
New Hampshire requires two hours of pay for employees who report to work but are sent home. The state requires that employees whose employment is terminated involuntarily be provided their final paycheck within 72 hours.
The state has a WARN-type law with standards similar to federal law; however, the triggering threshold is lower and applies to all employers with 75 or more employees. Employers must provide advance notice to employees regarding workforce reductions for as few as 25 employees depending on the size of the facility. The employer must provide 60 days’ notice or pay to employees in lieu of advance notice.
New Hampshire is not a right-to-work state, but has a relatively low union membership at just 4.5 percent of the private-sector workforce. Forty-three percent of public-sector workers are unionized.
New Hampshire Tier II: Fair
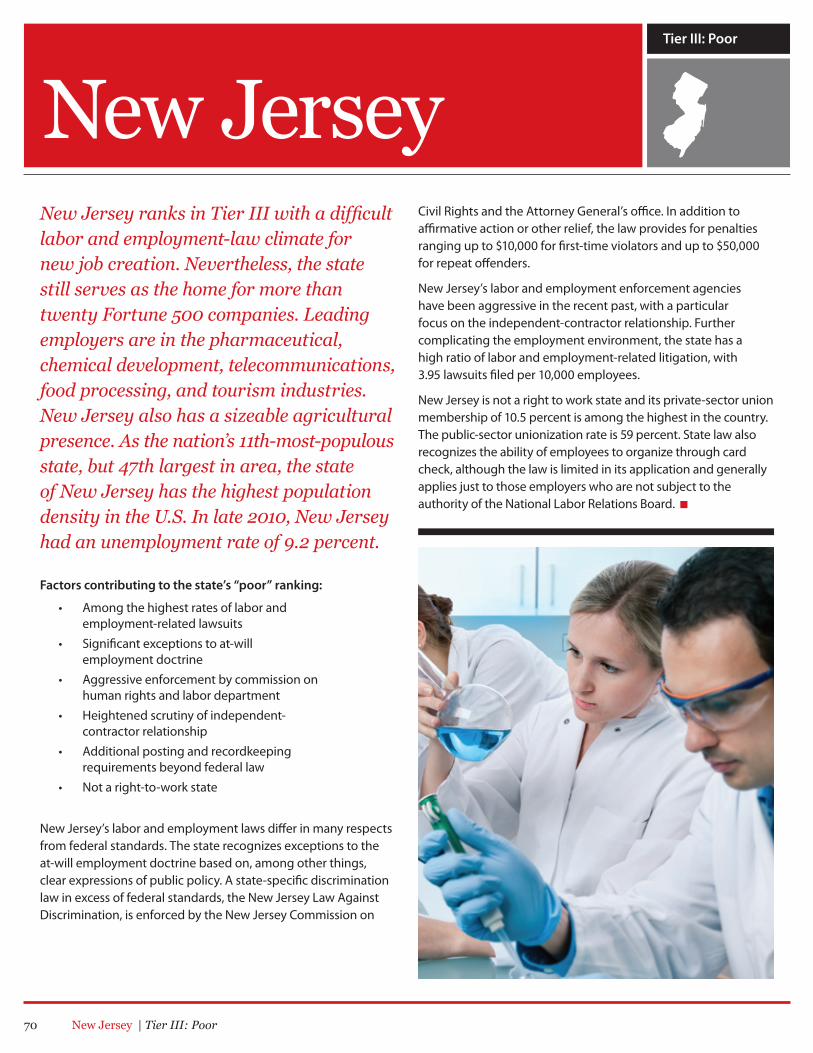
70 New Jersey | Tier III: Poor
New Jersey ranks in Tier III with a difficult labor and employment-law climate for new job creation. Nevertheless, the state still serves as the home for more than twenty Fortune 500 companies. Leading employers are in the pharmaceutical, chemical development, telecommunications, food processing, and tourism industries. New Jersey also has a sizeable agricultural presence. As the nation’s 11th-most-populous state, but 47th largest in area, the state of New Jersey has the highest population density in the U.S. In late 2010, New Jersey had an unemployment rate of 9.2 percent.
Factors contributing to the state’s “poor” ranking:
• Among the highest rates of labor and employment-related lawsuits
• Significant exceptions to at-will employment doctrine
• Aggressive enforcement by commission on human rights and labor department
• Heightened scrutiny of independent- contractor relationship
• Additional posting and recordkeeping requirements beyond federal law
• Not a right-to-work state
New Jersey’s labor and employment laws differ in many respects from federal standards. The state recognizes exceptions to the at-will employment doctrine based on, among other things, clear expressions of public policy. A state-specific discrimination law in excess of federal standards, the New Jersey Law Against Discrimination, is enforced by the New Jersey Commission on
New JerseyTier III: Poor
Civil Rights and the Attorney General’s office. In addition to affirmative action or other relief, the law provides for penalties ranging up to $10,000 for first-time violators and up to $50,000 for repeat offenders.
New Jersey’s labor and employment enforcement agencies have been aggressive in the recent past, with a particular focus on the independent-contractor relationship. Further complicating the employment environment, the state has a high ratio of labor and employment-related litigation, with 3.95 lawsuits filed per 10,000 employees.
New Jersey is not a right to work state and its private-sector union membership of 10.5 percent is among the highest in the country. The public-sector unionization rate is 59 percent. State law also recognizes the ability of employees to organize through card check, although the law is limited in its application and generally applies just to those employers who are not subject to the authority of the National Labor Relations Board.
New Mexico | Tier II: Fair 71
New Mexico is in Tier II with a labor and employment-law environment that is somewhat favorable for new job creation. The state is a leader in energy research and development in nuclear, solar, and geothermal technologies. New Mexico’s population has increased more than 10 percent over the last decade, and now totals just over two-million people. In late 2010, the state’s unemployment rate was 8.5 percent.
Factors contributing positively to the state’s ranking:
• Overtime set by federal law• No state WARN-type requirements beyond federal law• Covenants not to compete are enforceable
Factors contributing negatively to the state’s ranking:
• Exceptions to the employment-at-will doctrine not limited to statutory reasons; for-cause standard will be implied by courts
• State minimum wage exceeds federal law• Some restrictions on employer’s ability to conduct
background screening of applicants• Detailed discrimination laws above and beyond
federal standards
New Mexico’s overtime requirements follow the federal standard and the state does not have a WARN-type statute, but instead follows federal law. Covenants not to compete are generally enforceable.
However, New Mexico imposes substantial restrictions on the employment at-will doctrine. The state recognizes a public policy exception to an employer’s ability to terminate at-will employment. The public policy rationale, however, need not be based on statute. New Mexico courts will also imply a for-cause termination standard based on verbal promises of job security, as well as based on language in employee handbooks. New Mexico has a minimum wage which exceeds federal law.
New Mexico has no state statute restricting an employer’s use of credit or consumer investigative reports for employment decisions, but does impose some privacy protections on screening.
New Mexico has detailed anti-discrimination laws that exceed federal standards, enforced by the New Mexico Human Rights Bureau. New Mexico has only one protected leave law in addition to federal requirements,
New Mexico has no right-to-work law, but has a low rate of private-sector union membership of 3.1 percent. The public-sector unionization rate is 18.8 percent. New Mexico subjects a relatively high threshold amount of wages to unemployment insurance taxes.
New MexicoTier II: Fair
New Mexico’s “Ban the Box” Law
New Mexico became the second state in the nation after Minnesota to “ban the box” during its 2010 legislative session. The “box” refers to a “check the box” question on public-sector job applications asking if the person has ever been convicted of a crime. Applicants with convictions will now be considered on equal status with other job applicants, and only during the final interview process will a criminal background check be completed if it is relevant or required for the position. Criminal records that may not be used, distributed or disseminated in connection with an application for any public employment or licensing include records of arrests not followed by a valid conviction and misdemeanors not involving moral turpitude.

72 New York | Tier III: Poor
New York ranks in Tier III with a difficult environment for new job creation, despite the fact that more than 10 percent of the Fortune 500 companies call New York home. New York City is the center of the financial services industry, and its economy also includes a major manufacturing component as well as tourism and agriculture. New York’s unemployment rate in late 2010 was 8.3 percent.
Factors contributing to the state’s “poor” ranking:
• Very high ratio of labor and employment- related lawsuits
• Differing state minimum wage requirements by industry
• Extensive prevailing wage and overtime requirements for public contractors
• Significant additional state WARN-type notification requirements beyond federal law
• Targeted enforcement of independent- contractor relationship
• Aggressive division of human rights and labor department
• Not a right-to-work state
New York’s labor and employment laws impose a number of additional requirements on employers beyond federal law. The state’s generally applicable minimum wage is $7.25 per hour, but the state has issued various minimum wage orders that provide more specific wage guidance for a number of particular industries such as hotels and restaurants.
The state also has a wide-ranging prevailing wage requirement applicable to employees on public works projects. The prevailing wage is determined on a county-by-county basis. In addition, no laborer, worker, or mechanic employed by a contractor or subcontractor engaged in the performance of any public works project may work more than eight hours in
any day or more than five days in any week, except in cases of extraordinary emergency. Both the contractor and the contracting agency must apply to the state’s Bureau of Public Works to exceed the hours or days standards.
New York generally recognizes the overtime exemptions under the FLSA, but those exemptions have been modified to make them more difficult to meet.
New York is not a right to work state and it has one of the highest unionization rates in the nation at nearly twice the national average. Fourteen percent of all private-sector employees in New York belong to a union. More than 70 percent of public-sector workers are unionized, one of the highest rates in the nation.
New YorkTier III: Poor
Wage Theft Prevention Act
On December 13, 2010, the governor signed the Wage Theft Prevention Act, which takes effect on April 12, 2011. The Act requires employers to provide employees with annual information about pay rates, the basis of the pay rate, how the employee is to be paid (e.g., hourly), and allowances. The employer must provide the document in English, as well as the employee’s primary language. Violations can result in payments to employees of $50 per week up to $2,500.
The Act also requires pay statements that specify applicable dates, rate and basis of pay, and other data. For non-exempt employees, the statements must include regular and overtime rates of pay and the number of regular and overtime hours worked. Violations can be penalized at $100 per week up to $2,500.
New York | Tier III: Poor 73
New York CityNew York City is the center of the financial world and the most populous city in the United States with more than eight million people. The city is a national and international leader in the finance, insurance, media, and fashion industries. Biotechnology, advertising, and manufacturing also have significant influence on the city’s economy. More than a quarter of the wage and salary workers (both private and public sector) in New York City are members of a union.
Given this strong union presence in the city, it is not surprising that it has adopted numerous labor-and- employment-related standards in excess of federal law. More significantly, employers in New York City must navigate the city’s standards against the backdrop of a state regulatory environment that it ranks in Tier III of our survey.
For example, the New York City Human Rights Law protects a broader class of employees than does federal law or the New York State Human Rights Law. In addition, through the Local Civil Rights Restoration Act, the City Human Rights Law is specifically entitled to the most liberal reading possible and no adverse action is required to establish retaliation.
In addition, New York City has adopted a living wage ordinance applicable to city service contractors that provides homecare services, day care services, and head start services. Moreover, contractors that provide building services, food services, or temporary services must pay employees that are engaged in performing the city service contract no less than the living wage or the prevailing wage, whichever is greater.
Finally, there continue to be proposals to further expand the regulatory limitations on employment within New York City. Recent proposals include the expansion of the living wage ordinance and a requirement that employers provide paid sick leave.
New York
New York’s Joint Enforcement Strike Force on Employee Misclassification
In September 2007, the Governor created an interagency strike force to address the issue of employers who classify employees as independent contractors. The Joint Enforcement Strike Force includes staff from: the Department of Labor, the Attorney General’s Office, the Department of Taxation and Finance, the Workers’ Compensation Board and the New York City Comptroller’s office.
74 North Carolina | Tier I: Good
North Carolina is a Tier I state with a labor and employment-law climate generally favorable for new job creation. The state’s economy has historically been based on agriculture, wood products, textiles and furniture manufacturing. In recent years, the economy has become increasingly based on banking and financial services. North Carolina has a population of just over 9 million people and has seen significant growth during the past decade. North Carolina’s highly-educated Raleigh–Durham area, commonly referred to simply as “The Triangle,” is anchored by the cities of Raleigh, Durham, and Chapel Hill. In late 2010, the unemployment rate was 9.7 percent.
Factors contributing to the state’s “good” ranking:
• State overtime and minimum wage set by federal law
• Acceptance of independent-contractor status• Relatively few restrictions on an employer’s
ability to screen job applicants• Right-to-work state• No state WARN-type requirements beyond federal law
North Carolina’s labor and employment laws largely track federal requirements. North Carolina wage and hour laws include protections for minimum wage and overtime payments as well as requiring payment of promised wages not normally covered by law, including travel expenses, holiday pay, and expense reimbursements. The state’s minimum wage and overtime provisions otherwise generally parallel the federal requirements. North Carolina tends to recognize and respect independent-contractor arrangements.
North Carolina gives employers broad discretion to screen applicants including the use of credit or consumer investigative reports and arrest and conviction records.
North Carolina does provide additional grounds for protected leave beyond federal requirements.
North Carolina has the lowest rate of private-sector union membership in the nation at just 1.5 percent. Its right-to-work law declares that the right to live includes the right-to-work, which shall not be denied or abridged on account of membership or non-membership in a union. Any agreement between an employer and labor organization requiring union membership is illegal. The payment of dues, fees or other charges to a labor organization as a condition of employment or continuance of employment is illegal. Any person denied employment or continuation of employment in violation of the law is entitled to recover damages sustained by denial or deprivation of employment. The state’s public-sector unionization rate is also very low, at 9.5 percent.
North Carolina has no state WARN-type requirements over and above federal standards. The state does recognize exceptions to the employment-at-will doctrine based on broad public policy rationales that are not enumerated in statute. In addition, under North Carolina law, the wording in employee handbooks can limit the at-will doctrine.
North Carolina Tier I: Good
North Carolina’s Drug Testing Law
The Controlled Substance Examination Regulation Act establishes procedures to be followed by employers or employer representatives who perform employment-related drug testing. The provisions of the law apply to any person, firm or corporation, including government agencies, doing business in the state which perform (or have performed on their behalf) controlled substance examinations. Specific exemptions exist for examinations required by U.S. Department of Transportation, Nuclear Regulatory Commission and the armed forces.
The state requires specific procedures, including reasonable privacy, a chain of custody, confirmation testing in the event of a positive test, and retention of samples for retesting. Penalties for violations are available of up to $250 per person tested, not to exceed $1,000 for a single investigation.
North Dakota | Tier I: Good 75
North Dakota is in Tier I with a labor and employment-law climate that is largely favorable for new job creation. The state has just under 650,000 residents with population centers in Fargo, Bismark and Grand Forks. Major industries are agriculture, food processing, truck accessories, machinery, mining, and tourism, fishing and hunting. In late 2010, unemployment was 3.8 percent, the lowest of any state in the nation.
Factors contributing to the state’s “good” ranking:
• Minimum wage and overtime generally track federal requirements
• Right-to-work state• Minimal restrictions on pre-employment screening• Voluntary verification process for
independent contractors• Remedies under state discrimination laws are capped
North Dakota’s labor and employment laws generally follow federal standards, but there are a few significant differences. There is no separate state minimum wage, although special minimum wages may be set on public works projects. State overtime requirements track federal standards. North Dakota law provides for meal periods at specific intervals during the work day and employees in retail have special “day of rest” requirements.
North Dakota has a right-to-work law, which provides that all contracts negotiated in violation of its terms are null and void. The state has a low rate of private-sector union membership at 4.3 percent, and a public-sector unionization rate of 17.4 percent.
North Dakota does not impose additional restrictions beyond federal law regarding an employer’s ability to use a broad array of pre-employment inquires. Employers may use credit and
consumer reports, arrest and conviction records, and drug and alcohol tests when making employment decisions. There are also no state restrictions on termination of employees for felony, misdemeanor or other criminal convictions.
North Dakota has its own anti-discrimination laws that have broader applicability than federal standards. The state anti-discrimination laws apply to employers, wherever situated, who employ one or more employees in the state. Remedies available include equitable relief and attorneys’ fees. Back pay, which is reduced by interim earnings, is capped at two years.
The state’s advance notice of lay-off law requires that notice of a mass separation event, which is defined as 25 or more workers laid off at roughly the same time, must be filed 48 hours ahead of time with the nearest public employment service office and include the reason for separation.
North Dakota also has a relatively high level of wages subject to unemployment insurance taxes at $23,700.
North DakotaTier I: Good
North Dakota’s Verification of Independent-Contractor Status
The North Dakota Department of Labor will, on request, verify the independent-contractor status of existing or future work relationships. While verification is not mandatory for parties wishing to work as or to hire independent contractors, it is available on a voluntary basis to workers and firms who would like to receive a formal verification from the state as to the status of their work relationship.
When information supports a finding under the “common law” test that the applicant will be working or is working as an independent contractor, the Commissioner issues a determination verifying the status and issues the independent contractor an identification number that will be invalid if the applicant’s job changes.

76 Ohio | Tier II: Fair
Ohio is in Tier II with a labor and employment-law climate that is somewhat favorable for new job creation. With a population of approximately 11.5 million, Ohio is a large state with three major cities, Cincinnati, Columbus and Cleveland. The state is one of the leading manufacturing and industrial states in the nation. Major products include automobiles and parts, steel, rubber, jet engines, and appliances. The state also produces a variety of agricultural products. In late 2010, Ohio’s unemployment rate of 9.8 percent was the same as the national average.
Factors contributing positively to the state’s ranking:
• State wage and hour laws generally follow federal standards
• “Use it or lose it” vacation policies permissible if policy is clear
• Employers given latitude to conduct applicant screening
Factors contributing negatively to the state’s ranking:
• State protected leave laws beyond federal requirements
• State WARN-type requirements in addition to federal law• Unusual laws protecting unions• State discrimination law coverage exceeds
federal standards
Ohio’s wage and hour laws generally follow federal standards, although there are some exceptions. The state provides protected leave beyond federal requirements for several different protected classes, and also has its own WARN-type law exceeding federal standards for advance notice of layoffs.
Ohio allows fairly robust applicant screening, with no separate state laws restricting use of credit or consumer reports or drug tests, but there are restrictions on other types of inquiries.
“Use it or lose it” vacation policies are permissible in Ohio so long as an employer has a clear and explicit written policy.
Private-sector union membership in Ohio is a relatively high 8.9 percent. The public-sector unionization rate is 43.1 percent. Ohio law includes several provisions considered helpful to unions. For example, Ohio’s code provides that successor clauses in collective bargaining agreements are binding upon any successor employer who succeeds to the contracting employer’s business until the expiration date stated in the agreement, except that no successor clause is binding for more than three years from the effective date of the collective bargaining agreement. The provision does not apply to employers covered by the National Labor Relations Act.
The coverage of Ohio’s anti-discrimination laws is more expansive than federal requirements and includes employers with as few as four employees in the state. The law largely covers discrimination based on the same factors as federal law.
Ohio’s attorney general has recently emphasized misclassified independent contractors as an area for increased enforcement.
Ohio has somewhat limited application of the at-will employment doctrine. While the state does not recognize an implied covenant of good faith and fair dealing as a limitation on an employer’s ability to terminate employees at will, state courts have recognized implied promises in handbooks and oral representations of job security as limitations on an employer’s rights to discharge.
OhioTier II: Fair
Ohio’s Law on Union or Employer Association Membership
Promises not to join a union or an employers’ association are equally invalid in Ohio. The state law provides that every agreement where either party promises not to join, become, or remain a member of any labor organization or of any organization of employers, or to withdraw from the employment relationship in the event that either party joins, becomes, or remains a member of any labor organization or of any organization of employers, is contrary to the public policy of the State of Ohio and void.

Oklahoma | Tier I: Good 77
Oklahoma ranks in Tier I with a labor and employment-law climate that is generally favorable for new job creation. Oklahoma has a strong presence in the energy industry, with manufacturing, aerospace, food processing, and agriculture also playing major roles in the state’s economy. It is the nation’s 28th-most-populous state, and in late 2010 had an unemployment rate of 6.9 percent.
Factors contributing to the state’s “good” ranking:
• Acceptance of independent-contractor relationships• Minimum wage set by federal law• No state WARN-type requirements in excess
of federal law• Overtime set by federal law• Strong right-to-work guarantees• Protection for employers providing employee references
Oklahoma’s labor and employment laws generally track federal requirements, including minimum wage, overtime, and protected leave.
Oklahoma is a strong right-to-work state with a very low rate of private-sector union membership. Just 2.7 percent of Oklahoma’s private-sector workers are members of a union. Just over 13 percent of public-sector workers are unionized. Oklahoma law provides for criminal misdemeanor penalties if an employee is required as a condition of employment or continued employment to join a labor union.
The Oklahoma Anti-Discrimination Act generally tracks the rights and remedies of federal laws prohibiting discrimination in employment, and complaints are investigated by the Oklahoma Human Rights Commission. Recent court decisions, however, appear to have expanded the application of the law beyond the statutory scope pursuant to the state’s “public policy” exception to the at-will employment doctrine. That exception can be found in Oklahoma’s constitution, statutes, and judicial decisions.
Notwithstanding the generally employment-friendly regulatory climate in the state, Oklahoma does have a relatively high rate of labor and employment lawsuits, with 3.59 filed per 10,000 employees.
Oklahoma Tier I: Good
Oklahoma Reference Immunity Law
Oklahoma law specifically provides that an employer may disclose information about a current or former employee’s job performance to a prospective employer upon request of either the prospective employer with consent of the current or former employee, or upon request of the current or former employee.
An employer providing the reference is presumed to be acting in good faith unless lack of good faith is shown by a preponderance of the evidence. The current or former employer shall be immune from civil liability for the disclosure or any consequences of such disclosure unless the presumption of good faith is rebutted by a showing that the information disclosed was false and the employer providing the information had knowledge of its falsity or acted with malice or reckless disregard for the truth.
78 Oregon | Tier III: Poor
Oregon is in Tier III with a difficult labor and employment-law climate for new job creation. Oregon’s population is close to four million, with a growth rate of nearly 12 percent over the last decade. With abundant hydroelectric power available at a relatively low-cost, Oregon has developed steadily as a manufacturing state. Leading manufactured items are lumber and plywood, machinery, aluminum, chemicals, paper, food packing, and electronic equipment. Agriculture also continues to be an important part of the state’s economy with a variety of berries and seed crops. Oregon’s unemployment rate in late 2010 was 10.6 percent.
Factors contributing to the state’s “poor” ranking:
• Many state-imposed categories of protected leave beyond federal law
• Some of the toughest restrictions in the nation on employee screening
• Limitations to the employment-at-will doctrine• Wage and hour laws that exceed federal requirements• Discrimination laws exceed federal standards
Oregon has its own family and medical leave law and provides protected leave for a variety of additional reasons beyond federal requirements.
Oregon also has an unusual anti-nepotism requirement. It is a specific unlawful employment practice for an employer to refuse to hire or employ, discharge, or discriminate against an individual solely because a member of the individual’s immediate family works or has worked for the employer.
The state also has some of the nation’s most restrictive screening laws. Effective March 29, 2010, Oregon prohibits the use of credit history information for making employment decisions unless the
information is both substantially job-related and the employer’s reasons for the use of such information are disclosed to the applicant or employee in writing.
Oregon has wage and hour requirements which exceed federal laws, and its anti-discrimination statutes also exceed federal requirements. Oregon is unusual in that it protects against age discrimination beginning at age 18, rather than the more typical age 40. In another significant departure from federal law, Oregon’s anti-discrimination provisions apply to all employers regardless of size, except that the disability provision applies to employers with six or more employees.
Oregon is not a right-to-work state and has a private-sector union membership rate of 8.9 percent. Nearly 52 percent of public-sector workers are unionized.
Oregon Tier III: Poor
Oregon’s “Societal Obligation” Exception to the Employment- At-Will Doctrine
The employment-at-will doctrine means that employment may be terminated by either the employer or the employee at any time for any reason except a reason that violates public policy. Public policy has been defined by states in different ways. Oregon’s courts have recognized “societal obligations” as a source of public policy that have stretched as far as finding actionable a manager’s refusal to sign a statement which he felt potentially defamed the character of a former employee. The court held that refusal to sign a potentially defamatory statement was a societal obligation, pointing to two references in the Oregon constitution (abuse of free speech and damage to reputation) finding: “These two sections indicate that a member of society has an obligation not to defame others.”

80 Pennsylvania | Tier III: Poor
Pennsylvania is in Tier III with a difficult labor and employment-law climate for new job creation. The state’s economy was built on oil, coal and steel and there is still an important manufacturing component consisting of metal products, transportation equipment, and chemicals. Agriculture and tourism are also important to the state’s economy. In late 2010, the state’s unemployment rate was 8.6 percent.
Factors contributing to the state’s “poor” ranking:
• State wage and hour laws exceed federal standards • State leave laws that differ from federal standards• State WARN-type law and severance mandates for
control-share acquisitions.• Significant limitations on the employment-at-will doctrine• State and local anti-discrimination laws more expansive
than federal laws
Pennsylvania’s labor and employment laws contain numerous requirements beyond federal law. The state has established more restrictive qualifications than federal requirements for white collar and sales professionals to be exempt from overtime. Pennsylvania also has very detailed child labor requirements that are different from federal law, and the state prohibits employment-related discrimination and harassment for a broad range of reasons exceeding what is required by federal law.
Pennsylvania law provides protected leave for a variety of reasons beyond what is required by federal law, although some exceptions exist for small retailers and manufacturers.
Pennsylvania recognizes several exceptions to the traditional at-will employment doctrine. The state’s courts have ruled that statements in employee handbooks can create contractual obligations for employers. The state has also recognized numerous “public policy” exceptions to an employer’s ability to dismiss employees based on legislation, administrative rules, regulations or decisions, and judicial decisions.
Pennsylvania is not a right-to-work state and is highly unionized in both public and private sectors. The state’s private-sector union membership rate is 9.4 percent, while the public-sector rate is 49.9 percent.
Pennsylvania Tier III: Poor
Pennsylvania’s Control Share Acquisition Severance Pay Law
Pennsylvania has a law requiring payment of severance to employees with at least two years of service, employed in good standing 90 days before a “control share acquisition.” Severance owed is calculated according to a formula of “weekly compensation” (average weekly pay based on a normal schedule over last three months) times completed years of service, up to 26 times the weekly compensation of the employee. The severance owed must be paid within one regular pay period after the last day of work if it is known at the time that the layoff will last at least six months (or in the event of an involuntary separation). In all other cases, pay must follow within 30 days after the eligible employee first becomes entitled to compensation under the law.

Pennsylvania | Tier III: Poor 81
Pennsylvania
PhiladelphiaPhiladelphia is the leading city of the sixth largest metropolitan area (Philadelphia-Camden-Wilmington). Philadelphia is tied with metropolitan Chicago for second largest percentage of union workers with only New York being higher. Philadelphia’s harbor, one of the largest freshwater ports in the world, is a major shipping center with rail links to the Midwest and Canada. Higher education is an economic priority in this metropolitan area, which boasts 101 degree-granting institutions on 144 campuses.
Philadelphia imposes its own 60-day layoff notification requirements on employers. If an employer has already closed in violation of the ordinance, each affected worker is owed an amount equal to his or her average daily wage times the number of working days short of 60 days that advance notice was not provided. The ordinance covers companies employing 50 individuals in the past 12 months. Relocating operations outside of a reasonable commuting distance from Philadelphia also triggers a duty to notify. Written notification is owed to employees, unions, and the City Director of Commerce. The amount of local tax revenue lost as a result of the business closing or relocation is required to be included in the notice. Courts also may issue orders enjoining business closures or relocations.
The city has its own employment discrimination ordinances that protect a number of categories beyond what is provided by federal law. The city ordinances are enforced by its Commission on Human Relations. Philadelphia has a living wage requirement and under the “Philadelphia 21st Century Minimum Wage Standard,” city agencies, contractors with covered contracts and recipients of city economic assistance must pay at least 150 percent of the federal minimum wage to employees. The city also imposes an unusual requirement on employers who provide health insurance benefits. The ordinance specifies that to the extent the employer provides health benefits to any of its employees, the employer shall provide each full-time, non-temporary, non-seasonal covered employee with health benefits at least as valuable as the least valuable health benefits that are provided to any other full-time employees of the employer.
Philadelphia’s current mayor and unions representing police, firefighters and other city workers have recently been involved in a contentious dispute over the mayor’s efforts to cut back contract benefits, contending that too much of the city’s budget is spent on pension and health benefits and not enough on providing services to residents. One of the principal elements of contention is a controversial perk that allows city workers to announce retirement four years before actual retirement and collect pension benefits while still working, which are placed in an interest bearing account and paid out as a lump sum when actual retirement occurs—four years of salary plus four years of pension.
82 Rhode Island | Tier II: Fair
Rhode Island is in Tier II with a labor and employment-law climate that is somewhat favorable for new job creation. The state’s population of just over one million is dense at about 1,000 persons per square mile. Providence, the capital and largest city, anchors the nation’s 37th-largest metropolitan statistical area, Providence-New Bedford-Fall River. The state’s economy includes the production of jewelry, machinery, metals, and textiles. Unemployment in the state in late 2010 was a high 11.6 percent.
Factors contributing positively to the state’s ranking:
• Strong recognition of the employment-at-will doctrine• Covenants not to compete are enforceable
Factors contributing negatively to the state’s ranking:
• State wage and hour laws impose additional obligations beyond federal standards
• State anti-discrimination laws in excess of federal standards
• State protected leave laws more expansive than federal standards
• Limitations on pre-hire inquiries
Rhode Island’s labor and employment laws include a number of additional requirements beyond federal standards. For example, anti-discrimination laws have broader applicability than federal standards with several additional protected classes. The laws are enforced by the Rhode Island Commission for Human Rights and govern employers with as few as four employees. Courts may award punitive damages and attorneys’ fees for violations. The state also provides protected leave for a variety of reasons beyond federal requirements.
Employer screening of job applicants is limited in several respects by state law. However, Rhode Island adheres strongly to the employment at-will doctrine, with a few limitations. A 1993 decision by the State Supreme Court declared that “we now unequivocally state that in Rhode Island there is no cause of action for wrongful discharge.”
Rhode Island courts will enforce employment contracts such as covenants not to compete. However, the state has enacted special protections for temporary employees that requires temps be given a written notice that includes a job description with classification requirements, estimated longevity of the assignment, information concerning any job hazards, anticipated pay rate, benefits and work schedules. A copy of the notice must be kept on file for one year by the employment agency and be available to the employee.
Rhode Island has no right-to-work law and a relatively high rate of private-sector union membership at 8.8 percent of the workforce. Nearly 64 percent of public-sector workers are unionized, one of the highest rates in the nation.
Rhode IslandTier II: Fair
Rhode Island’s Wage and Hour Laws
Rhode Island has a variation of traditional “Blue laws” that requires retail and certain other businesses to be licensed in order to operate on Sundays. If licensed, employees working on Sundays and specified holidays must receive time and a half pay and be guaranteed at least a minimum of four hours of work. Sunday and holiday work is strictly voluntary for employees and refusal is not a ground for discrimination, dismissal, or discharge or any other penalty to the employee.
Rhode Island has a state minimum wage in excess of the federal minimum, as well as additional overtime requirements.

South Carolina | Tier I: Good 83
South Carolina is in Tier I with a labor and employment-law climate largely favorable for new job creation. The state’s population exceeds 4.5 million and has grown by nearly 14 percent over the last decade. At one time a primarily agricultural state, South Carolina has a growing manufacturing sector and produces wood, pulp, steel products, chemicals, machinery, and apparel. In late 2010, unemployment in the state was 10.6 percent.
Factors contributing to the state’s “good” ranking:
• Minimum wage and overtime requirements set by federal law
• Prohibition on establishing higher prevailing wages• Strong enforceability of employment at-will
doctrine and covenants not to compete • State right-to-work law• No state WARN-type requirements beyond federal law• Few restrictions on employee screening• Employment discrimination laws generally track
federal standards
South Carolina’s labor and employment laws largely track federal requirements. There are no separate minimum wage or overtime requirements beyond the federal standards. South Carolina has a prohibition on setting higher prevailing wages.
The state provides strong recognition of the employment at-will doctrine, recognizing a very narrow public policy exception. State courts have, however, found that employee handbooks can create implied “for cause” dismissal standards.
South Carolina will enforce contracts entered into by parties including covenants not to compete and explicitly drafted “use it or lose it” vacation policies. Independent-contractor arrangements are generally accepted.
South Carolina has a right-to-work law and one of the nation’s lowest rates of private-sector union membership at 2.8 percent of the workforce. The public-sector unionization rate is 13.1 percent. The state recently repealed its separate WARN-type law, opting instead to be covered exclusively by the federal requirement.
South Carolina has no state restrictions on employers using credit or consumer investigative reports for employment decisions. Job-related arrest and conviction records can also be used in making hiring and other employment decisions. The state considers that an employee or applicant who is currently engaging in illegal drug use is not “a qualified individual with a disability” when the employer acts on the basis of the drug use.
South Carolina’s anti-discrimination laws largely follow federal standards, with a few exceptions. The state laws are enforced by the South Carolina Commission for Human Affairs and apply to employers with 15 or more employees.
South CarolinaTier I: Good
South Carolina’s Terms of Employment Notice
Employers in South Carolina (excepting domestic employees in private homes and employers with fewer than five employees), must notify each employee in writing at the time of hire of the normal hours and wages agreed upon, the time and place of payment, and any deductions which will be made from wages, including for insurance programs. The state provides a sample notice for employers to use. Alternatively, the information can be posted conspicuously at or near the place of work. Any changes in the terms aside from wage increases must be made in writing at least seven calendar days before they become effective. Itemized statements showing gross pay and deductions made from wages must be furnished each pay period. Employers must keep records of names and addresses for employees, wages paid and deductions made, for three years.
84 South Dakota | Tier I: Good
South Dakota is in Tier I with a labor and employment-law environment that is largely favorable for new job creation. The state has a population of just over 800,000 and the largest city is Sioux Falls, with approximately 160,000 people. Agriculture remains important to the state’s economy, but durable goods manufacturing and services are the economy’s biggest drivers. The state has no personal or corporate income tax. In late 2010, South Dakota had a very low unemployment rate of just 4.5 percent.
Factors contributing to the state’s “good” ranking:
• Leave requirements follow federal law• No state WARN-type requirements beyond federal law• Minimum wage set by federal law • Overtime requirements set by federal law• Few restrictions on employer inquiries into
employee history • Strong recognition of the employment-at-will doctrine • Right-to-work law
South Dakota’s labor and employment laws generally follow federal requirements. The state has no separate state leave laws for private-sector employees. There is also no state WARN-type law beyond federal requirements.
Wage and hour provisions generally track federal requirements and there are no special overtime or minimum wage requirements. A day’s labor for employees is defined as “as is usual in the business in which they serve not exceeding ten hours in the day unless the employer and employee expressly agree to the contrary.” In the absence of any agreement or custom as to the rate or value of wages, the term of service, or the time of payment, an employee is presumed to be hired by the month at a monthly rate of reasonable wages, to be paid when the service is performed.
South Dakota imposes few restrictions on employers inquiring into an applicant or employee’s history. The state permits arrest and conviction records to be used in making hiring and other employment decisions unless there is a disparate impact. South Dakota also has no state restriction on use of credit or consumer investigative reports for employment decisions.
South Dakota follows an at-will employment doctrine and recognizes exceptions only for narrow public policy-based reasons.
South Dakota has a low rate of private-sector union membership at just 3 percent of its workforce. Nearly 18 percent of public-sector workers are unionized. The state has a right-to-work law, which provides that the right of any person to work may not be denied or abridged on account of membership or non-membership in any labor union or labor organization.
In general, the state’s anti-discrimination laws track federal law, but they do have broader applicability. Employers with one or more employees are covered. The anti-discrimination laws are enforced by the South Dakota Commission on Human Rights, which can obtain court orders for enforcement of its orders. Remedies include back pay, compensatory damages and a $10,000 penalty, injunctive relief, mandated hiring, reinstatement or promotion, plus attorneys’ fees.
South Dakota Tier I: Good
Tennessee | Tier I: Good 85
Tennessee ranks in Tier I, with a labor and employment-law climate that is generally favorable for new job creation. Tennessee is the 17th-most-populous state and its population has increased over 10 percent in the last decade. The state’s major industries include agriculture, manufacturing, and tourism, and it also has a strong presence in health care. Tennessee has no state income tax applicable to salaries and wages. In late 2010, the state’s unemployment rate was 9.4 percent.
Factors contributing to the state’s “good” ranking:
• Relatively strong at-will employment doctrine• Minimum wage set by federal law• Overtime requirements set by federal law• Strong right-to-work guarantees• State law protective of employer references• Acceptance of independent-contractor relationship • No additional recordkeeping requirements
beyond federal law
Tennessee’s labor and employment laws generally follow federal requirements. The state has no overtime or recordkeeping requirements in excess of those required by federal law. The state also does not impose minimum wage obligations beyond federal law, but does have a prevailing wage requirement for performance of work on state construction projects.
Tennessee has few restrictions on employer inquiries into an applicant or employee’s history. State law establishes a presumption of good faith for employers providing a reference. That presumption is lost if the employer providing the reference recklessly provides false or defamatory information.
A strong right-to-work state, Tennessee has a low private-sector union membership, with fewer than three percent of private-
sector workers being members of a union. Tennessee law provides for criminal misdemeanor penalties where an employee is compelled or coerced into joining a labor union. State law prohibits the payment of dues, fees, or other charges to labor organizations as a condition of employment or continuance of employment. The public-sector unionization rate is 17.6 percent.
Notwithstanding the largely business-friendly climate in the state, Tennessee is among the top ten states for labor and employment-related lawsuits, with 3.71 such lawsuits filed per 10,000 employees.
Tennessee Tier I: Good
Tennessee Human Rights Act
The Tennessee Human Rights Act largely tracks federal law and protects individuals from discrimination on the basis of race, creed, color, religion, sex, age or national origin in connection with employment. A key difference, however, is that the THRA applies to employers who operate a business within the state of Tennessee and who employ eight or more employees.
The law can be enforced through a private lawsuit and is also enforced by the Tennessee Human Rights Commission.

86 Texas | Tier I: Good
Texas ranks in Tier I with a generally favorable labor and employment-law climate for new job creation. The state is the second largest by population and consistent with its size, the economy is highly diversified. Houston and the Dallas-Fort Worth areas are the state’s major population and industrial centers. Texas is the nation’s largest producer of oil and natural gas, has more farmland than any other state and leads the nation in cattle and cotton production. Other major industries include information technology, manufacturing, petroleum products and chemicals. The state’s unemployment rate in late 2010 was 8.2 percent.
Factors contributing to the state’s “good” ranking:
• Strong right-to-work protections• State law prohibiting political subdivisions
from enacting higher minimum wage • Overtime requirements set by federal law• Strong support for at-will employment doctrine• No state WARN-type requirements beyond federal law
Texas labor and employment laws contain virtually no variation from federal standards. The state does not have a separate state minimum wage and adopts the federal minimum wage by reference. Texas law provides that the state’s minimum wage will supersede any minimum wage established by a political subdivision for private employment, except with regard to public contracts. The state does not impose overtime requirements that differ from federal law and does not dictate the specific timing and duration of meal and break periods.
Texas generally follows the at-will employment doctrine and recognizes only very limited public policy exceptions, such as a refusal to perform an illegal act. Texas courts have not been willing to find that general company manuals or handbooks
TexasTier I: Good
Limits on Damages in Employment Discrimination Cases
Texas imposes limits on compensatory and punitive damages in employment discrimination cases.
The liability of an employer with fewer than 101 employees is limited to $50,000. An employer with more than 100 and fewer than 201 is liable up to $100,000. An employer with more than 200 and fewer than 501 employees is liable up to $200,000. An employer with more than 500 employees is liable up to $300,000.
Texas courts may also award attorneys’ fees to the prevailing party in an employment discrimination case.
Texas | Tier I: Good 87
HoustonThe city of Houston is the largest city by population in Texas and the fourth largest city in the nation. Houston is often considered the energy capital of the world with many petroleum, natural gas and energy services companies being based there. The city is home to more than 20 Fortune 500 companies, has one of the world’s busiest ports and is a center of biomedical and aeronautical research. In late 2010, the Houston metropolitan area (Houston–Sugar Land–Baytown) had an unemployment rate of 8.2 percent, the same as the statewide average.
Private-sector union membership in Houston is 3.6 percent, which is slightly higher than the statewide rate. There are more than 200 unions in Houston and the surrounding area with the United Food and Commercial Workers, the Teamsters and the SEIU having the largest membership. The SEIU has been particularly active in recent years in organizing janitors and nurses.
The city has a non-discrimination policy that requires all contracts entered into by the city involving the expenditure of $10,000 or more of city funds to incorporate an equal employment opportunity clause. The city’s equal opportunity clause specifies that a contractor, subcontractor, vendor, supplier, or lessee will not discriminate against any employee or applicant for employment because of race, religion, color, sex, national origin, or age. The city’s prohibitions are slightly narrower than the state’s employment discrimination prohibitions, which include disability and retaliation.
Focus on Independent Contractors
In 2008, Houston enacted an ordinance requiring city contractors to maintain a list of all persons performing work under a city contract that classifies each person as an employee or independent contractor, including a description of the person’s duties and benefits provided. In addition, a contractor must maintain a written contract or agreement describing the relationship with each independent contractor performing work under a city contract. Upon request by the city, the contractor must produce copies of these documents and an IRS Form 1099 for the independent contractor. The city can also require the contractor to submit to the IRS an SS-8 “Determination of Worker Status for Purposes of Federal Employment Tax and Income Tax Withholding” for each independent contractor working on a city contract.
If a contractor does not have the required documentation for the independent contractor that is outlined in the ordinance, the person will be considered an employee of the contractor. A violation of the ordinance is a misdemeanor criminal offense and is also grounds for debarment.
modify the employment at-will relationship unless there is express, clear and specific language indicating that is what the employer and the employee intended.
Texas does not impose additional notification requirements beyond the federal WARN Act.
In 2003, the state transferred the powers and duties of the Texas Human Rights Commission to the Texas Workforce Commission’s Civil Rights Division and that agency now enforces the state’s Human Rights Act. Texas also has a unique element of anti-discrimination law. In addition to the more typical categories of discrimination protection, Texas prohibits discrimination against an employee based on participation in an emergency evacuation.
Texas is a right-to-work state and has a low unionization rate of just 3.1 percent. Just nine states have a lower private-sector union membership percentage. The public-sector unionization rate is 16.9 percent. Texas state law specifies that no person may be denied employment based on membership or nonmembership in a labor union. State law also prohibits a person from engaging in any form of picketing activity that constitutes any character of obstacle to the free ingress to and egress from an entrance to any premises.
Texas
88 Utah | Tier I: Good
Utah is a Tier I state with a labor and employment-law environment that is favorable for new job creation. The beehive state has a population approaching three million and a substantial population growth rate of nearly 25 percent over the last decade. Utah’s diverse economy ranges from mining, agriculture and timber to defense and aerospace. In late 2010 the state’s unemployment rate was 7.5 percent.
Factors contributing to the state’s “good” ranking:
• Exceptions to at-will employment are narrow• Right-to-work state• Wage and hour requirements largely mirror
federal standards• Few state restrictions on employer inquiries
into applicant and employee history
Many of Utah’s labor and employment laws are consistent with federal requirements. The state recognizes only a narrow restriction on the at-will employment doctrine for a substantial and important public policy reason. State courts have, however, ruled that employee handbooks can be considered enforceable contracts against employers.
Utah has a right-to-work law and each day of violation is considered a separate misdemeanor offense. The law provides injunctive relief, damages and attorneys’ fees. The state has a low rate of private-sector union membership at just 4.3 percent. More than 17 percent of public-sector workers are unionized.
Utah has very few special wage and hour requirements beyond federal law, but does require that terminated employees be provided their final paycheck within 24 hours. Utah is one of the handful of states that prohibit cities and counties from establishing a higher “living wage” than the federal minimum wage.
Employers in Utah have wide latitude to conduct background checks on applicants and employees. There are no state restrictions on an employer’s use of credit or consumer
reports, arrest or conviction records or drug screenings in employment decisions.
Utah does not have many leave-related protections beyond federal requirements, although it does provide protected time off to accompany a minor to court. Likewise, Utah has no WARN-type state laws and follows the federal standard in this area.
Utah does, however, subject a relatively high level of earned wages to unemployment taxes. The amount was recently increased to $27,800.
Utah has a unique provision that helps older workers: employers and employees may agree to a rate of pay or work schedule designed to protect the employee from loss of Social Security payments or benefits.
UtahTier I: Good
Vermont | Tier II: Fair 89
Vermont ranks in Tier II with a somewhat favorable labor and employment-law climate for new job creation. The state is largely rural and has a limited amount of industrial production. Tourism, agriculture and insurance are major sectors of the economy, and there several specialty food producers in the state. The Burlington area boasts several high technology firms. The state’s unemployment rate was 5.7 percent in late 2010.
Factors contributing positively to the state’s ranking:
• Many labor and employment laws follow federal standards
• Low number of labor and employment lawsuits per 10,000 employees
• Relatively low wage ceiling applicable to unemployment insurance tax
Factors contributing negatively to the state’s ranking:• State minimum wage in excess of federal minimum wage• High workers’ compensation premium rates• Relatively low adherence to at-will doctrine• Numerous restrictions on employer background
checks for applicants
Many of Vermont’s labor and employment laws follow federal standards, but there are some significant differences and additional requirements. Vermont’s minimum wage is nearly one dollar more per hour than the federal minimum wage.
Vermont has no additional overtime requirement beyond federal law and the state requires that employees be paid at time-and-a-half the regular rate for all hours in excess of 40 in a week. Vermont, however, exempts several industries from the state overtime requirement, including certain hospital employees, hotel, motel and restaurant employees, retail employees, and certain employees in the transportation industry.
State law requires employers to provide meal and break time to employees over the course of the workday, but does not specify the timing or duration of those breaks. The state also has a relatively low amount of labor and employment litigation. Vermont’s employers benefit from a relatively low wage ceiling subject to unemployment insurance tax. Vermont taxes employee wages at just $1,000 more than the federal minimum.
Vermont has some of the highest workers’ compensation rates in the nation, with only Montana, Ohio and Alaska ranking higher. The state has relatively low adherence to the at-will employment doctrine and provides very broad public policy exceptions, including beyond those legislatively defined. Vermont courts have also ruled that employee handbooks can be converted to enforceable contracts.
Anti-discrimination law in Vermont is broader than federal law. The Attorney General enforces the employment discrimination provisions, rather than the state Human Rights Commission. The state also places numerous restrictions on an employer’s inquiries into an applicant’s or employee’s background when making employment decisions.
Vermont is not a right-to-work state, but does have a relatively low unionization rate of 5.3 percent of the private-sector workforce. Nearly 46 percent of the state’s public-sector workers are unionized.
Vermont Tier II: Fair

90 Virginia | Tier I: Good
Virginia ranks in Tier I with a labor and employment-law climate that is largely favorable for new job creation. Virginia has a broad-based economy that includes agriculture, fishing, and manufacturing. The Hampton Roads area has a high concentration of shipping-related businesses, and Northern Virginia is one of the nation’s centers of high technology. Virginia’s unemployment rate of 6.8 percent in late 2010 was one of the 10-lowest in the country.
Factors contributing to the state’s “good” ranking:
• Labor and employment laws that generally follow federal requirements
• Overtime requirements set by federal law• No state WARN-type requirements
in addition to federal law • Low workers’ compensation premiums• Strong adherence to at-will employment doctrine• Relatively low number of labor and employment lawsuits• Right-to-work state• Relatively strong protections for employers
providing references
Virginia’s employment laws largely mirror the requirements of federal law. The state has not established a separate state minimum wage, overtime requirements or WARN-type notices.
Virginia has very low workers’ compensation premiums, the fourth lowest in the nation. The employment-at-will doctrine is very strong in Virginia and employee handbooks or other documents must contain specific language to be considered an enforceable employment contract. Virginia enjoys a relatively low rate of labor and employment litigation per 10,000 employees.
Virginia is a right-to-work state and has a low unionization rate of just 2.6 percent of the private workforce, the third lowest in the country. The public-sector unionization rate is 10.8 percent. State law prohibits interfering or attempting to interfere with another in the exercise of his right-to-work by the use of force, threats of violence or intimidation, or by the use of insulting or threatening language, to induce or attempt to induce him to quit his employment or refrain from seeking employment. But Virginia also grants state courts jurisdiction to enjoin interference with lawful picketing when necessary to prevent disorder, restrain coercion, protect life or property, or promote the general welfare.
Virginia provides relatively strong protection for employers providing references. Employers can lose immunity if they provide information with a reckless disregard for the truth.
Virginia Tier I: Good


92 Washington | Tier III: Poor
Washington ranks in Tier III with a difficult labor and employment-law climate for new job creation. The state has a diverse economy that is based on fishing, agriculture and food production, as well as lumber, information technology, aircraft production and shipbuilding. The state’s unemployment rate was 9.2 percent in late 2010.
Factors contributing to the state’s ranking:
• Numerous labor and employment mandates that exceed federal standards
• Daily overtime rate on public construction contracts• Very high wage ceiling for income subject to
unemployment insurance tax• Very high workers’ compensation benefits• State minimum wage in excess of federal minimum wage• Relatively high number of restrictions on employer
inquiries into applicant and employee history• No right-to-work protections
Many of Washington’s labor and employment laws differ from federal requirements and impose additional burdens on employers. In addition, the direct costs associated with being an employer are much higher in Washington than in most other states.
Although the state does not have overtime requirements that differ from federal law for most employers, there are special requirements for some state contractors. Washington state law specifies that all work done by contract or subtract for any building or improvements on roads, bridges, streets, alleys or buildings for the state, any county or municipality, employers must pay employees at one-and-a-half times their regular rate of pay for any time worked in excess of eight hours per day.
Washington subjects a higher amount of an employee’s wages to unemployment insurance tax than any other state in the nation. Although the federal government requires states to impose an unemployment insurance tax on employers for the first $7,000 of an employee’s wages, Washington taxes employers on an employee’s wages up to $35,700.
Washington provides some of the highest workers’ compensation benefit levels in the nation. With benefits valued at $1.56 per $100 of covered wages, the state’s benefits are exceeded by only Montana and West Virginia.
Washington imposes several restrictions on an employer’s ability to inquire into the history of applicants and employees, including limits on the use of arrest and conviction records, workers’ compensation claims and credit reports.
Washington is not a right to work state and at 12.6 percent, has one of the nation’s highest rates of unionization in the private sector. Only Hawaii, New York and Nevada have a higher percentage of private-sector union members. The public-sector unionization rate is 56.8 percent.
The state also has an extensive anti-discrimination statute that exceeds federal standards. The state law is enforced by the Washington Human Rights Commission.
WashingtonTier III: Poor

Washington | Tier III: Poor 93
SeattleSeattle is the largest city in the Pacific Northwest with a population of just over 600,000. The metropolitan area around the city, including Tacoma and Bellevue has a population of nearly three and a half million. Metropolitan Seattle is known for its coffee, computers and information technology. Aircraft manufacturing, forest products, biotechnology, as well as transportation and shipping connected to the port of Seattle are also major industries. In late 2010, the Seattle metropolitan area had an unemployment rate of 8.8 percent.
There are nearly 100 unions in Seattle with a major presence by the United Food & Commercial Workers, the SEIU and painters and machinists affiliated with the AFL-CIO. Union membership among manufacturing firms is 27.5 percent in metropolitan Seattle. Overall private-sector union membership in the Seattle area is 12.7 percent, which is virtually the same as the statewide rate.
Seattle has long been known as one of the more socially liberal cities in the country and it prohibits employment discrimination on a number of grounds beyond the state’s already broad prohibitions. The Seattle Office for Civil Rights enforces the city’s prohibitions against employment discrimination based on race, color, sex, marital status, sexual orientation, gender identity, political ideology, age, creed, religion, ancestry, national origin, honorably discharged veteran or military status, or the presence of any sensory, mental or physical handicap.
The Seattle Office for Civil Rights began working on a legislative proposal in 2010 that would also prohibit employment discrimination in the city based on arrest and conviction records. The Seattle City Council is expected to consider the measure in early 2011.
Washington
Washington Minimum Wage
Washington has the highest minimum wage in the nation. In 2010 it was $8.55 per hour for both agricultural and non-agricultural employment. The state also does not provide a tip credit to employers to offset part of the wage. As a result of a ballot initiative approved in 1998, the state recalculates the minimum wage each fall based on the change in the Consumer Price Index (CPI) for Urban Earners and Clerical Workers over the previous 12 months.
In 2009, the CPI decreased due to the recession, but the 2010 minimum wage was not lowered and instead remained at its prior 2009 level. For 2011, the Washington Department of Labor & Industries increased the wage to $8.67 (effective January 1, 2011) to reflect a 1.4 percent increase in the CPI in 2010. This was a controversial decision that conflicted with the legal opinion of the Attorney General who concluded the state was required to maintain the current minimum wage rate until the CPI regained its lost value and exceed its previous 2008 level that produced the $8.55 minimum wage.
A coalition of business groups filed suit in November 2010 seeking to block the wage increase as being inconsistent with state law, but in December, a state judge refused to enjoin the increase and it went into effect on January 1, 2011.

94 West Virginia | Tier II: Fair
West Virginia ranks in Tier II with a labor and employment-law environment somewhat favorable for new job creation. Natural resources, including coal, oil, natural gas and hardwood, are dominant in the state’s economy, but West Virginia is also a leader in steel, glass, aluminum and chemical manufacturing. Tourism has also become a significant source of revenue, as West Virginia has set aside more than one million acres in 37 state parks, nine state forests and two national forests. The state has a population of 1.8 million people and in late 2010 had an unemployment rate of 9.3 percent.
Factors contributing positively to the state’s ranking:
• Many labor and employment laws track federal requirements
• Low workers’ compensation benefits premiums• No state WARN-type requirements in addition to
federal law
Factors contributing negatively to the state’s ranking:
• One-year limitations period for filing claims of employment discrimination
• No right-to-work protections• High workers’ compensation benefits• High ratio of labor and employment lawsuits
Many of West Virginia’s labor and employment laws track federal requirements, but there are significant additional state requirements. In the case of involuntary separations, West Virginia requires employers to issue final paychecks within 72 hours. The statute imposes a penalty of one day’s pay for each day that
the final paycheck is late, up to 30 days, with the potential of liquidated damages of up to three times the amount due.
Under the West Virginia Human Rights Act, complaints of discrimination can be filed within 365 days, which is one of the longer limitations periods in the United States for such claims, including under federal law.
West Virginia is not a right-to-work state and has a high unionization rate of 10.3 percent of the private sector. The public-sector unionization rate is 26.1 percent. The state also provides unemployment benefits for striking employees involved in a labor dispute, and does not permit employers to require employees to cross picket lines.
While West Virginia has relatively low workers’ compensation benefit premiums, it offers benefit levels that are among the highest in the nation. The state also has a high ratio of labor and employment lawsuits, at approximately 2.56 lawsuits filed per 10,000 employees.
West VirginiaTier II: Fair
Release Requirements
Despite not otherwise heavily regulating employment relationships, West Virginia, particularly the West Virginia Human Rights Commission, maintains explicit requirements for waiver and release agreements used in the context of employment separations. In addition to affirmatively requiring release agreements to be in plain English in a manner calculated to be understood by the average person with a similar educational and work background as the recipient, West Virginia requires that release agreements explicitly refer to claims or rights under the West Virginia Human Rights Act. It also requires that West Virginia employees be notified of the toll-free West Virginia state bar number in order to find an attorney in the event they are not represented by legal counsel during an employment separation.
Wisconsin | Tier III: Poor 95
Wisconsin ranks in Tier III with a labor and employment-law climate that is difficult for new job creation. Wisconsin has both rural and urban areas and is home to about a dozen Fortune 500 companies. The state’s economy is rooted in manufacturing, agriculture, health care, and tourism. In late 2010, Wisconsin’s unemployment rate was 7.6 percent.
Factors contributing to the state’s “poor” ranking:
• State WARN-type law requirements that exceed federal law
• Employment-related debarment provisions• Significant additional posting and notice requirements• Significant restrictions related to independent-
contractor relationships• State discrimination laws in excess of
federal requirements• Aggressive enforcement by state employment-
related agencies
Wisconsin has numerous labor and employment laws that exceed federal requirements. For example, while the state’s mini-WARN law largely tracks the federal requirements, its reach is much broader, applying to employers with as few as 50 employees rather than 100 employees under federal law.
The state’s Fair Employment Law exceeds the protections provided by federal law and prohibits discrimination based on a number of additional factors.
Wisconsin is not a right-to-work state and 8.3 percent of private-sector employees in the state are members of a union, slightly above the national average. More than 46 percent of public-sector workers are unionized. Wisconsin law contains provisions that appear to be designed to facilitate union organizing. Wisconsin Act 290, which was signed into law in May 2010, places significant limitations on the ability of employers to hold “captive audience” meetings to communicate with employees about labor unions.
Wisconsin has an unusual state law, the Records Open to Employees Act, that provides a past or present employee the ability to view and copy their personnel records at least two times each calendar year.
Wisconsin state law does give significant protection for an employer providing references on former employees. The state law establishes a presumption of good faith unless there is clear and convincing evidence that the information provided was false, provided with malicious intent, or in violation of a civil right. Wisconsin is also among the states with the fewest employment-related lawsuits filed per 10,000 employees.
WisconsinTier III: Poor
Wisconsin Independent-Contractor Laws Change January 1, 2010
Under Wisconsin Act 292, the Wisconsin Department of Workforce Development must, among other things, receive and investigate complaints alleging the misclassification of employees, conduct investigations on its own initiative, and inform other state or local agencies about employee misclassification. The law also requires an employer to provide proof of maintaining proper employee records, including wage and hour information. Failure to provide the requested information can result in an order requiring the employer to stop work at specified locations. Wisconsin also has a unique strict definition of independent-contractor status under its unemployment compensation and workers’ compensation laws.
96 Wyoming | Tier II: Fair
Wyoming ranks in Tier II with a labor and employment-law environment somewhat favorable for new job creation. The state is sparsely populated with just 545,000 people. Major industries in the state include mining, tourism, energy and agriculture. There are no corporate or personal income taxes. In late 2010, Wyoming’s unemployment rate was 6.6 percent, significantly below the national average.
Factors contributing positively to the state’s ranking:
• Overtime requirements follow federal law• Minimum wage based on federal law• No additional state limitations on inquiries
into an applicant’s or employee’s background• Leave laws follow federal requirements• No state WARN-type requirements beyond federal law• Strong right-to-work protections
Factors contributing negatively to the state’s ranking:
• Some restrictions on at-will termination• Relatively high wage ceiling subject to
unemployment taxes• Vacation pay-out required unless otherwise agreed
Wyoming labor and employment laws largely follow federal requirements. There are no additional state overtime requirements beyond federal law. There is also no higher state minimum wage, although certain state contracts have prevailing wage requirements and preferences for local employment.
Employers have substantial freedom with respect to screening applicants. The state imposes no restrictions on employers utilizing arrest or conviction records in employment decisions. Employers may also use credit and consumer investigative reports, as well as drug and alcohol testing.
Wyoming is a right-to-work state with a private-sector union membership rate of 5.2 percent. More than 14 percent of public-sector workers are unionized.
The state mandates no additional protected leave beyond federal requirements. Wyoming has no WARN-type notification requirements beyond federal law.
Wyoming recognizes both a public policy exception and a breach of the implied covenant of good faith and fair dealing exception to the traditional employment-at-will doctrine.
Wyoming subjects a fairly high amount of wages ($21,500) to unemployment insurance taxes, and the earnings threshold subject to unemployment taxes was recently increased. Payment of accrued, unused vacation is required absent an agreement to the contrary.
Wyoming Tier II: Fair
Wyoming’s Right-to-Work Law
Wyoming has enacted a statue protecting the right to work. The state law specifies that no person is required to become or remain, or to abstain or refrain from becoming, a member of any labor organization as a condition of employment or continuation of employment.
No person is required to pay or refrain from paying any dues, fees, or other charges of any kind to any labor organization as a condition of employment or continuation of employment.
No person is required to have any connection with, or be recommended or approved by, or be cleared through, any labor organization as a condition of employment or continuation of employment.

Estimated Effects of State Employment Policies on Unemployment and New Business Formation

As noted earlier, we constructed econometric models of cross-state differences in unemployment rates and new business formation. Our models utilize control variables (e.g., education levels and real GDP per capita) to control for non-policy factors that might affect economic performance, allowing us to isolate the effects of labor and employment policies, as represented by the ERI. A more complete description of the models is provided in Appendix B.
Estimated Effects of State Employment Policies on Unemployment and New Business Formation
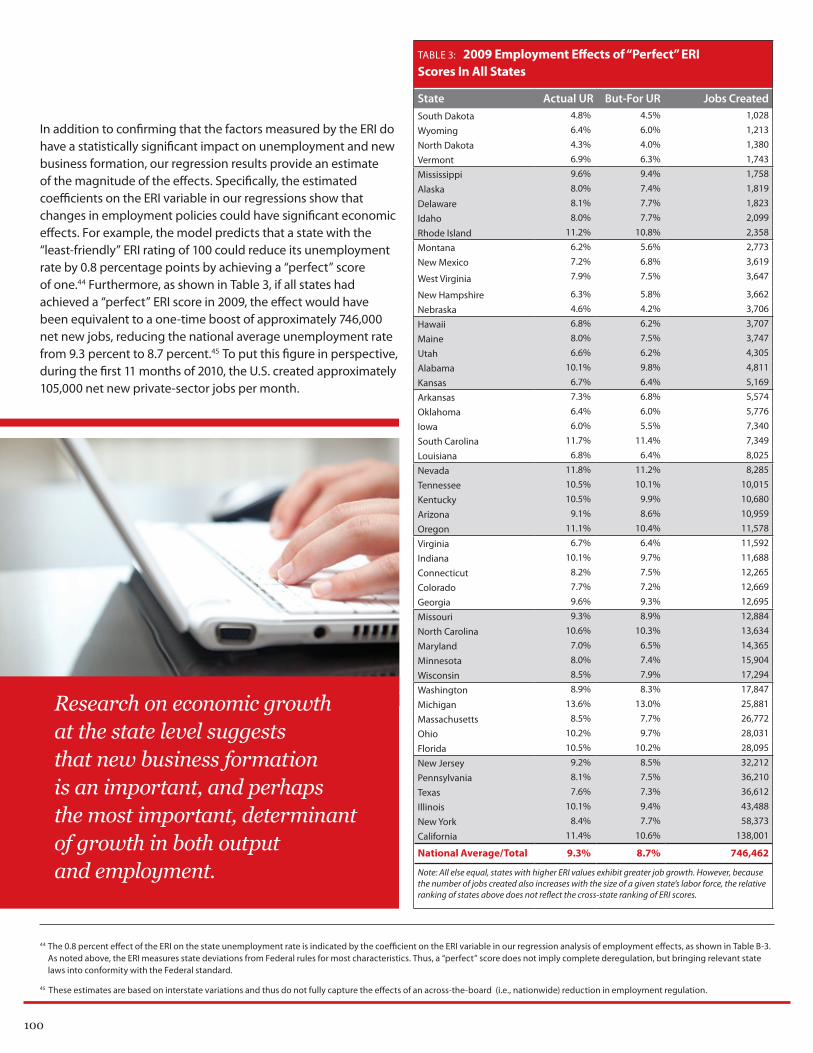
100
In addition to confirming that the factors measured by the ERI do have a statistically significant impact on unemployment and new business formation, our regression results provide an estimate of the magnitude of the effects. Specifically, the estimated coefficients on the ERI variable in our regressions show that changes in employment policies could have significant economic effects. For example, the model predicts that a state with the “least-friendly” ERI rating of 100 could reduce its unemployment rate by 0.8 percentage points by achieving a “perfect” score of one.44 Furthermore, as shown in Table 3, if all states had achieved a “perfect” ERI score in 2009, the effect would have been equivalent to a one-time boost of approximately 746,000 net new jobs, reducing the national average unemployment rate from 9.3 percent to 8.7 percent.45 To put this figure in perspective, during the first 11 months of 2010, the U.S. created approximately 105,000 net new private-sector jobs per month.
TABLE 3: 2009 Employment Effects of “Perfect” ERI Scores In All States
State Actual UR But-For UR Jobs CreatedSouth Dakota 4.8% 4.5% 1,028
Wyoming 6.4% 6.0% 1,213
North Dakota 4.3% 4.0% 1,380
Vermont 6.9% 6.3% 1,743
Mississippi 9.6% 9.4% 1,758
Alaska 8.0% 7.4% 1,819
Delaware 8.1% 7.7% 1,823
Idaho 8.0% 7.7% 2,099
Rhode Island 11.2% 10.8% 2,358
Montana 6.2% 5.6% 2,773
New Mexico 7.2% 6.8% 3,619
West Virginia 7.9% 7.5% 3,647
New Hampshire 6.3% 5.8% 3,662
Nebraska 4.6% 4.2% 3,706
Hawaii 6.8% 6.2% 3,707
Maine 8.0% 7.5% 3,747
Utah 6.6% 6.2% 4,305
Alabama 10.1% 9.8% 4,811
Kansas 6.7% 6.4% 5,169
Arkansas 7.3% 6.8% 5,574
Oklahoma 6.4% 6.0% 5,776
Iowa 6.0% 5.5% 7,340
South Carolina 11.7% 11.4% 7,349
Louisiana 6.8% 6.4% 8,025
Nevada 11.8% 11.2% 8,285
Tennessee 10.5% 10.1% 10,015
Kentucky 10.5% 9.9% 10,680
Arizona 9.1% 8.6% 10,959
Oregon 11.1% 10.4% 11,578
Virginia 6.7% 6.4% 11,592
Indiana 10.1% 9.7% 11,688
Connecticut 8.2% 7.5% 12,265
Colorado 7.7% 7.2% 12,669
Georgia 9.6% 9.3% 12,695
Missouri 9.3% 8.9% 12,884
North Carolina 10.6% 10.3% 13,634
Maryland 7.0% 6.5% 14,365
Minnesota 8.0% 7.4% 15,904
Wisconsin 8.5% 7.9% 17,294
Washington 8.9% 8.3% 17,847
Michigan 13.6% 13.0% 25,881
Massachusetts 8.5% 7.7% 26,772
Ohio 10.2% 9.7% 28,031
Florida 10.5% 10.2% 28,095
New Jersey 9.2% 8.5% 32,212
Pennsylvania 8.1% 7.5% 36,210
Texas 7.6% 7.3% 36,612
Illinois 10.1% 9.4% 43,488
New York 8.4% 7.7% 58,373
California 11.4% 10.6% 138,001
National Average/Total 9.3% 8.7% 746,462
Note: All else equal, states with higher ERI values exhibit greater job growth. However, because the number of jobs created also increases with the size of a given state’s labor force, the relative ranking of states above does not reflect the cross-state ranking of ERI scores.
44 The 0.8 percent effect of the ERI on the state unemployment rate is indicated by the coefficient on the ERI variable in our regression analysis of employment effects, as shown in Table B-3. As noted above, the ERI measures state deviations from Federal rules for most characteristics. Thus, a “perfect” score does not imply complete deregulation, but bringing relevant state laws into conformity with the Federal standard.
45 These estimates are based on interstate variations and thus do not fully capture the effects of an across-the-board (i.e., nationwide) reduction in employment regulation.
Research on economic growth at the state level suggests that new business formation is an important, and perhaps the most important, determinant of growth in both output and employment.
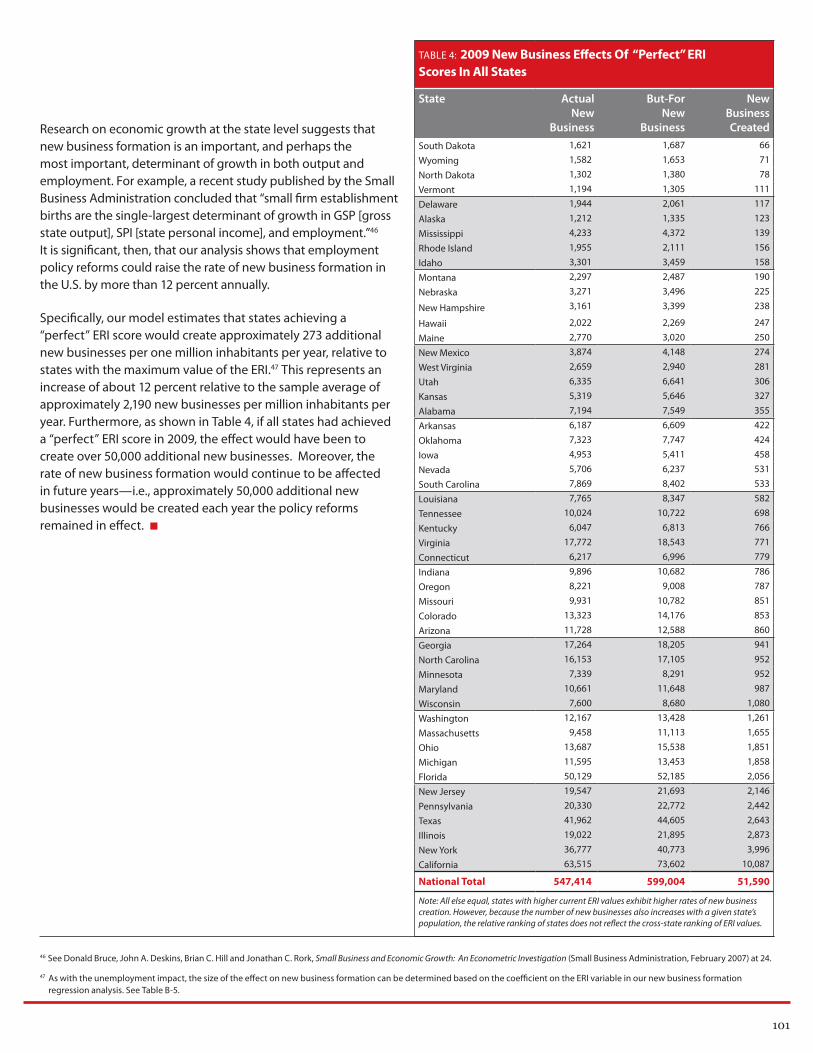
101
Research on economic growth at the state level suggests that new business formation is an important, and perhaps the most important, determinant of growth in both output and employment. For example, a recent study published by the Small Business Administration concluded that “small firm establishment births are the single-largest determinant of growth in GSP [gross state output], SPI [state personal income], and employment.”46 It is significant, then, that our analysis shows that employment policy reforms could raise the rate of new business formation in the U.S. by more than 12 percent annually.
Specifically, our model estimates that states achieving a “perfect” ERI score would create approximately 273 additional new businesses per one million inhabitants per year, relative to states with the maximum value of the ERI.47 This represents an increase of about 12 percent relative to the sample average of approximately 2,190 new businesses per million inhabitants per year. Furthermore, as shown in Table 4, if all states had achieved a “perfect” ERI score in 2009, the effect would have been to create over 50,000 additional new businesses. Moreover, the rate of new business formation would continue to be affected in future years—i.e., approximately 50,000 additional new businesses would be created each year the policy reforms remained in effect.
TABLE 4: 2009 New Business Effects Of “Perfect” ERI Scores In All States
State Actual New
Business
But-For New
Business
New Business Created
South Dakota 1,621 1,687 66
Wyoming 1,582 1,653 71
North Dakota 1,302 1,380 78
Vermont 1,194 1,305 111
Delaware 1,944 2,061 117
Alaska 1,212 1,335 123
Mississippi 4,233 4,372 139
Rhode Island 1,955 2,111 156
Idaho 3,301 3,459 158
Montana 2,297 2,487 190
Nebraska 3,271 3,496 225
New Hampshire 3,161 3,399 238
Hawaii 2,022 2,269 247
Maine 2,770 3,020 250
New Mexico 3,874 4,148 274
West Virginia 2,659 2,940 281
Utah 6,335 6,641 306
Kansas 5,319 5,646 327
Alabama 7,194 7,549 355
Arkansas 6,187 6,609 422
Oklahoma 7,323 7,747 424
Iowa 4,953 5,411 458
Nevada 5,706 6,237 531
South Carolina 7,869 8,402 533
Louisiana 7,765 8,347 582
Tennessee 10,024 10,722 698
Kentucky 6,047 6,813 766
Virginia 17,772 18,543 771
Connecticut 6,217 6,996 779
Indiana 9,896 10,682 786
Oregon 8,221 9,008 787
Missouri 9,931 10,782 851
Colorado 13,323 14,176 853
Arizona 11,728 12,588 860
Georgia 17,264 18,205 941
North Carolina 16,153 17,105 952
Minnesota 7,339 8,291 952
Maryland 10,661 11,648 987
Wisconsin 7,600 8,680 1,080
Washington 12,167 13,428 1,261
Massachusetts 9,458 11,113 1,655
Ohio 13,687 15,538 1,851
Michigan 11,595 13,453 1,858
Florida 50,129 52,185 2,056
New Jersey 19,547 21,693 2,146
Pennsylvania 20,330 22,772 2,442
Texas 41,962 44,605 2,643
Illinois 19,022 21,895 2,873
New York 36,777 40,773 3,996
California 63,515 73,602 10,087
National Total 547,414 599,004 51,590
Note: All else equal, states with higher current ERI values exhibit higher rates of new business creation. However, because the number of new businesses also increases with a given state’s population, the relative ranking of states does not reflect the cross-state ranking of ERI values.
46 See Donald Bruce, John A. Deskins, Brian C. Hill and Jonathan C. Rork, Small Business and Economic Growth: An Econometric Investigation (Small Business Administration, February 2007) at 24.
47 As with the unemployment impact, the size of the effect on new business formation can be determined based on the coefficient on the ERI variable in our new business formation regression analysis. See Table B-5.
Summary & Conclusions

Over the past two years, the United States has suffered a major economic downturn. While the recession is technically over, millions of Americans are still out of work and the rate of new job creation has remained at historically low levels compared with past periods of economic recovery. Any policies that can reverse this trend should be on the table for discussion.
This study offers states a road map for an essentially “free” shot of economic stimulus. We have examined a number of different laws and regulations that can make it more difficult for employers to create jobs and hire new workers. Our Employment Regulation Index demonstrates that by creating a less burdensome labor and employment climate, states could boost job growth and encourage the
formation of new businesses. In fact, if all states were to improve their climates to the level discussed in this report, the nation as a whole could generate the equivalent of more than seven months of private-sector job creation (at the current rate), and increase the rate of new business formation by more than 12 percent. Notably, many states that have suffered the worst impacts of the recession have the most to gain by reforms.
That said, the laws and regulations outlined in this study are largely a matter of state preference. It is our hope that state lawmakers will use this study to help guide policy choices as they determine whether their regulatory regimes hinder job creation, or provide the right incentives for growth.
Summary & Conclusions

104
Appendix A:
Layo
ff No
tifica
tion
Requ
irem
ents
Bey
ond
Fede
ral L
awTr
eatm
ent o
f Em
ploy
men
t-At-W
ill
Doct
rine
Whe
ther
Empl
oyee
Ha
ndbo
ok is
Con
verte
d
to En
forc
eabl
e Con
tract
Whe
ther
Cou
rts w
ill
Blue
-Pen
cil (o
r Sev
er) a
n
Empl
oym
ent C
ontra
ctTr
eatm
ent o
f Cov
enan
ts
Not t
o Co
mpe
teTi
min
g Re
quire
men
ts
for L
ast P
aych
eck
Trea
tmen
t of
Inde
pend
ent-C
ontra
ctor
Rela
tions
hips
Amou
nt o
f Sta
te
Min
imum
Wag
e Bey
ond
Fede
ral R
egul
atio
nsEx
isten
ce o
f Sta
te
Prev
ailin
g W
age
Exist
ence
of L
ivin
g W
age L
aws i
n M
ajor
Ci
ty in
Stat
eM
axim
um R
egul
ar
Unem
ploy
men
t Be
nefit
s (No
Ext
ensio
ns)
Wai
ting
Perio
d to
Re
ceiv
e Une
mpl
oym
ent
Bene
fits
Wag
e Cei
ling
Subj
ect
to U
nem
ploy
men
t In
sura
nce T
axW
orke
rs’ C
ompe
nsat
ion
Bene
fits p
er $1
00 o
f Co
vere
d W
ages
Wai
ting
Tim
e for
W
orke
rs’ C
ompe
nsat
ion
Bene
ifts
Wor
kers
’ Com
pens
atio
n
Prem
ium
Rat
e Ind
exW
heth
er W
orke
rs’
Com
pens
atio
n Se
lf-In
sura
nce i
s Per
mitt
ed
Employment Relationship andthe Costs of Separation
Minimum and Living Wage Laws
Unemployment Insurance and Workers’ Compensation Wage and Hour Policies Litigation/Enforcement Climate Collective Bargaining Issues
State Tier
Alabama IAlaska IIArizona IIArkansas IICalifornia IIIColorado IIConnecticut IIIDelaware IIFlorida IGeorgia IHawaii IIIIdaho IIllinois IIIIndiana IIIowa IIKanasas IKentucky IILousiana IIMaine IIIMaryland IIMassachusetts IIIMichigan IIIMinnesota IIMississippi IMissouri IIMontana IIINebraska IINevada IIINew Hampshire IINew Jersey IIINew Mexico IINew York IIINorth Carolina INorth Dakota IOhio IIOklahoma IOregon IIIPennsylvania IIIRhode Island IISouth Carolina ISouth Dakota ITennessee ITexas IUtah IVermont IIVirginia IWashington IIIWest Virginia IIWisconsin IIIWyoming I

105
Layo
ff No
tifica
tion
Requ
irem
ents
Bey
ond
Fede
ral L
awTr
eatm
ent o
f Em
ploy
men
t-At-W
ill
Doct
rine
Whe
ther
Empl
oyee
Ha
ndbo
ok is
Con
verte
d
to En
forc
eabl
e Con
tract
Whe
ther
Cou
rts w
ill
Blue
-Pen
cil (o
r Sev
er) a
n
Empl
oym
ent C
ontra
ctTr
eatm
ent o
f Cov
enan
ts
Not t
o Co
mpe
teTi
min
g Re
quire
men
ts
for L
ast P
aych
eck
Trea
tmen
t of
Inde
pend
ent-C
ontra
ctor
Rela
tions
hips
Amou
nt o
f Sta
te
Min
imum
Wag
e Bey
ond
Fede
ral R
egul
atio
nsEx
isten
ce o
f Sta
te
Prev
ailin
g W
age
Exist
ence
of L
ivin
g W
age L
aws i
n M
ajor
Ci
ty in
Stat
eM
axim
um R
egul
ar
Unem
ploy
men
t Be
nefit
s (No
Ext
ensio
ns)
Wai
ting
Perio
d to
Re
ceiv
e Une
mpl
oym
ent
Bene
fits
Wag
e Cei
ling
Subj
ect
to U
nem
ploy
men
t In
sura
nce T
axW
orke
rs’ C
ompe
nsat
ion
Bene
fits p
er $1
00 o
f Co
vere
d W
ages
Wai
ting
Tim
e for
W
orke
rs’ C
ompe
nsat
ion
Bene
ifts
Wor
kers
’ Com
pens
atio
n
Prem
ium
Rat
e Ind
exW
heth
er W
orke
rs’
Com
pens
atio
n Se
lf-In
sura
nce i
s Per
mitt
ed
Addi
tiona
l St
ate
Ove
rtim
e Re
quire
men
tsM
eal/R
est
Requ
irem
ents
and
Co
mpl
exity
Addi
tiona
l Sta
te L
eave
Requ
irem
ents
Com
plex
ity o
f Pay
out
of V
acat
ion
Accu
rals
Stat
e Po
stin
g an
d N
otic
e Re
quire
men
tsSt
ate
Reco
rd R
eten
tion
Requ
irem
ents
Exist
ence
of
Empl
oym
ent-L
aw
Rela
ted
Deb
arm
ent
Enfo
rcem
ent P
ostu
re
of S
tate
Dep
artm
ent
of L
abor
Stru
ctur
e of
Sta
te
Hum
an/E
mpl
oym
ent
Righ
ts C
omm
issio
nNu
mbe
r of F
eder
al
Labo
r and
Empl
oym
ent
Law
suits
Stre
ngth
of P
rote
ctio
n
for E
mpl
oyer
s Pr
ovid
ing
Refe
renc
esRe
stric
tions
on
Empl
oyer
Inqu
iries
into
Appl
icant
Hist
ory
Com
plex
ity o
f Sta
te
Disc
rimin
atio
n La
w
Beyo
nd Fe
dera
lPr
ivat
e-Se
ctor
Un
ion
Mem
bers
hip
Perc
enta
ge
Righ
t-to-
Wor
k Sta
teUI
Ben
efits
to
Lock
ed-O
ut
Empl
oyee
s/St
riker
sSt
ate
Law
s tha
t Affe
ct
Labo
r Org
anizi
ng
Effor
ts
Employment Relationship andthe Costs of Separation
Minimum and Living Wage Laws
Unemployment Insurance and Workers’ Compensation Wage and Hour Policies Litigation/Enforcement Climate Collective Bargaining Issues
State Tier
Alabama IAlaska IIArizona IIArkansas IICalifornia IIIColorado IIConnecticut IIIDelaware IIFlorida IGeorgia IHawaii IIIIdaho IIllinois IIIIndiana IIIowa IIKanasas IKentucky IILousiana IIMaine IIIMaryland IIMassachusetts IIIMichigan IIIMinnesota IIMississippi IMissouri IIMontana IIINebraska IINevada IIINew Hampshire IINew Jersey IIINew Mexico IINew York IIINorth Carolina INorth Dakota IOhio IIOklahoma IOregon IIIPennsylvania IIIRhode Island IISouth Carolina ISouth Dakota ITennessee ITexas IUtah IVermont IIVirginia IWashington IIIWest Virginia IIWisconsin IIIWyoming I
State By State Factors
= Good
= Fair
= Average
= Poor
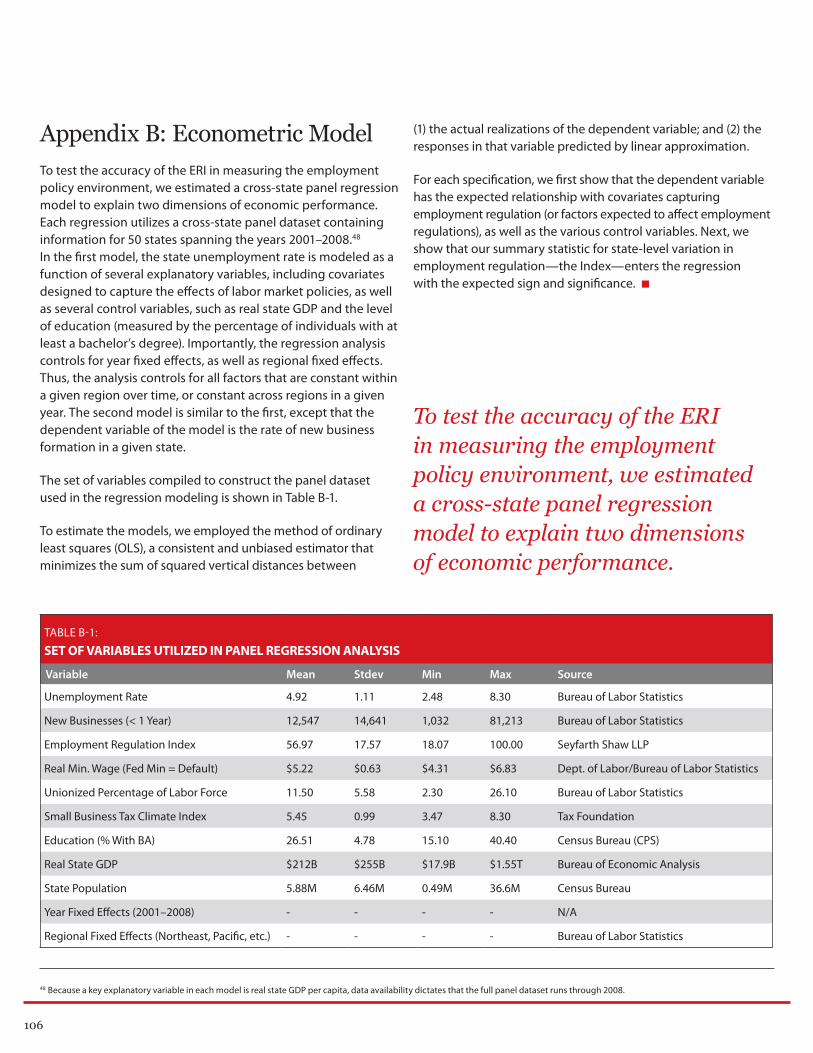
106
Appendix B: Econometric ModelTo test the accuracy of the ERI in measuring the employment policy environment, we estimated a cross-state panel regression model to explain two dimensions of economic performance. Each regression utilizes a cross-state panel dataset containing information for 50 states spanning the years 2001–2008.48 In the first model, the state unemployment rate is modeled as a function of several explanatory variables, including covariates designed to capture the effects of labor market policies, as well as several control variables, such as real state GDP and the level of education (measured by the percentage of individuals with at least a bachelor’s degree). Importantly, the regression analysis controls for year fixed effects, as well as regional fixed effects. Thus, the analysis controls for all factors that are constant within a given region over time, or constant across regions in a given year. The second model is similar to the first, except that the dependent variable of the model is the rate of new business formation in a given state.
The set of variables compiled to construct the panel dataset used in the regression modeling is shown in Table B-1.
To estimate the models, we employed the method of ordinary least squares (OLS), a consistent and unbiased estimator that minimizes the sum of squared vertical distances between
(1) the actual realizations of the dependent variable; and (2) the responses in that variable predicted by linear approximation.
For each specification, we first show that the dependent variable has the expected relationship with covariates capturing employment regulation (or factors expected to affect employment regulations), as well as the various control variables. Next, we show that our summary statistic for state-level variation in employment regulation—the Index—enters the regression with the expected sign and significance.
TABLE B-1: SET OF VARIABLES UTILIZED IN PANEL REGRESSION ANALYSIS
Variable Mean Stdev Min Max Source
Unemployment Rate 4.92 1.11 2.48 8.30 Bureau of Labor Statistics
New Businesses (< 1 Year) 12,547 14,641 1,032 81,213 Bureau of Labor Statistics
Employment Regulation Index 56.97 17.57 18.07 100.00 Seyfarth Shaw LLP
Real Min. Wage (Fed Min = Default) $5.22 $0.63 $4.31 $6.83 Dept. of Labor/Bureau of Labor Statistics
Unionized Percentage of Labor Force 11.50 5.58 2.30 26.10 Bureau of Labor Statistics
Small Business Tax Climate Index 5.45 0.99 3.47 8.30 Tax Foundation
Education (% With BA) 26.51 4.78 15.10 40.40 Census Bureau (CPS)
Real State GDP $212B $255B $17.9B $1.55T Bureau of Economic Analysis
State Population 5.88M 6.46M 0.49M 36.6M Census Bureau
Year Fixed Effects (2001–2008) - - - - N/A
Regional Fixed Effects (Northeast, Pacific, etc.) - - - - Bureau of Labor Statistics
48 Because a key explanatory variable in each model is real state GDP per capita, data availability dictates that the full panel dataset runs through 2008.
To test the accuracy of the ERI in measuring the employment policy environment, we estimated a cross-state panel regression model to explain two dimensions of economic performance.
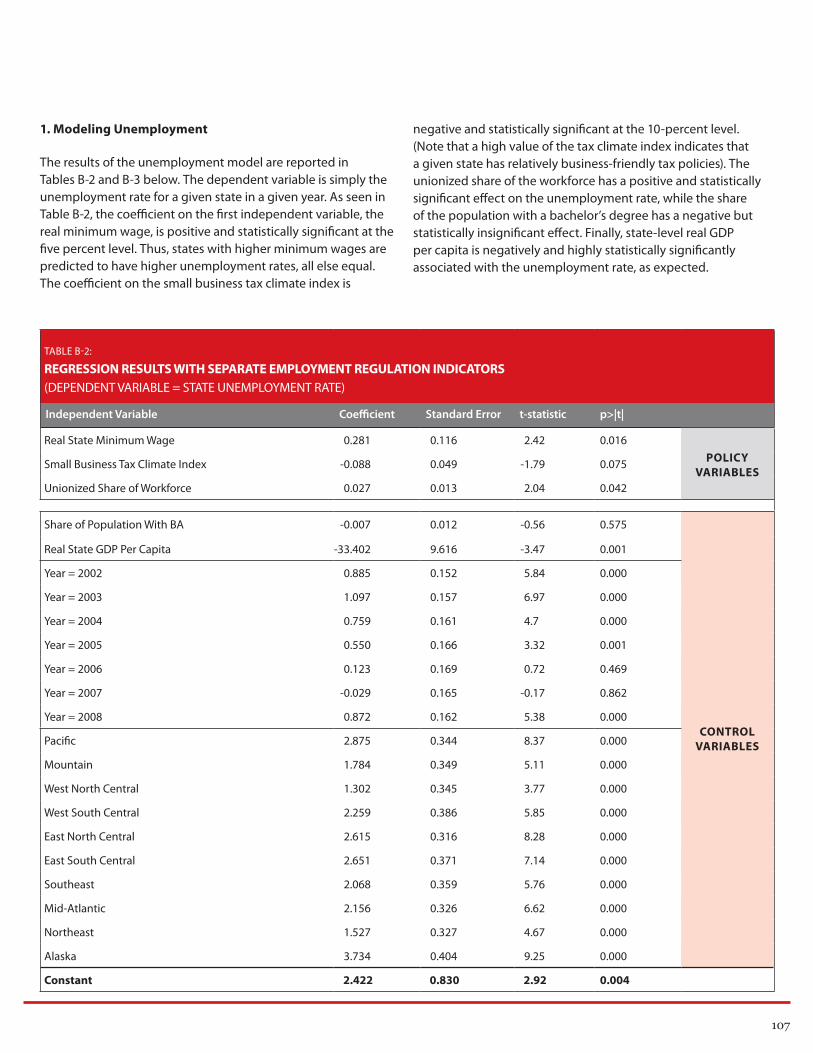
107
1. Modeling Unemployment
The results of the unemployment model are reported in Tables B-2 and B-3 below. The dependent variable is simply the unemployment rate for a given state in a given year. As seen in Table B-2, the coefficient on the first independent variable, the real minimum wage, is positive and statistically significant at the five percent level. Thus, states with higher minimum wages are predicted to have higher unemployment rates, all else equal. The coefficient on the small business tax climate index is
negative and statistically significant at the 10-percent level. (Note that a high value of the tax climate index indicates that a given state has relatively business-friendly tax policies). The unionized share of the workforce has a positive and statistically significant effect on the unemployment rate, while the share of the population with a bachelor’s degree has a negative but statistically insignificant effect. Finally, state-level real GDP per capita is negatively and highly statistically significantly associated with the unemployment rate, as expected.
TABLE B-2: REGRESSION RESULTS WITH SEPARATE EMPLOYMENT REGULATION INDICATORS (DEPENDENT VARIABLE = STATE UNEMPLOYMENT RATE)
Independent Variable Coefficient Standard Error t-statistic p>|t|
Real State Minimum Wage 0.281 0.116 2.42 0.016
Small Business Tax Climate Index -0.088 0.049 -1.79 0.075
Unionized Share of Workforce 0.027 0.013 2.04 0.042
Share of Population With BA -0.007 0.012 -0.56 0.575
Real State GDP Per Capita -33.402 9.616 -3.47 0.001
Year = 2002 0.885 0.152 5.84 0.000
Year = 2003 1.097 0.157 6.97 0.000
Year = 2004 0.759 0.161 4.7 0.000
Year = 2005 0.550 0.166 3.32 0.001
Year = 2006 0.123 0.169 0.72 0.469
Year = 2007 -0.029 0.165 -0.17 0.862
Year = 2008 0.872 0.162 5.38 0.000
Pacific 2.875 0.344 8.37 0.000
Mountain 1.784 0.349 5.11 0.000
West North Central 1.302 0.345 3.77 0.000
West South Central 2.259 0.386 5.85 0.000
East North Central 2.615 0.316 8.28 0.000
East South Central 2.651 0.371 7.14 0.000
Southeast 2.068 0.359 5.76 0.000
Mid-Atlantic 2.156 0.326 6.62 0.000
Northeast 1.527 0.327 4.67 0.000
Alaska 3.734 0.404 9.25 0.000
Constant 2.422 0.830 2.92 0.004
POLICY VARIABLES
CONTROL VARIABLES
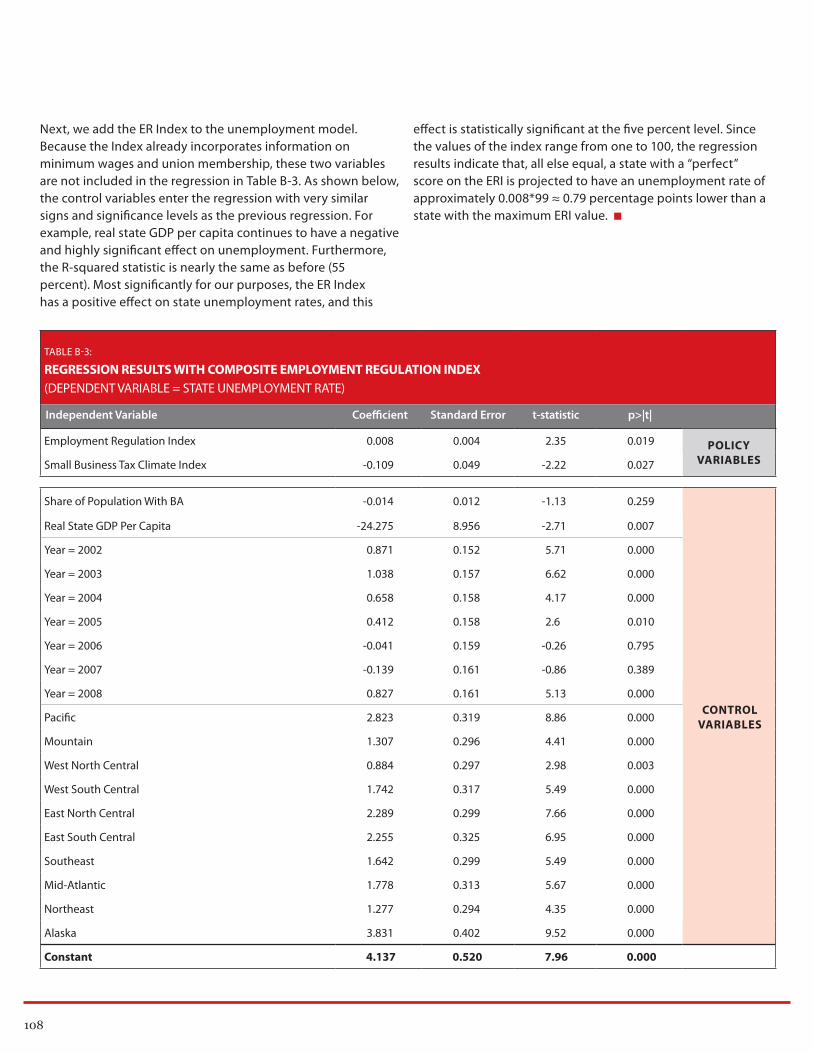
108
Next, we add the ER Index to the unemployment model. Because the Index already incorporates information on minimum wages and union membership, these two variables are not included in the regression in Table B-3. As shown below, the control variables enter the regression with very similar signs and significance levels as the previous regression. For example, real state GDP per capita continues to have a negative and highly significant effect on unemployment. Furthermore, the R-squared statistic is nearly the same as before (55 percent). Most significantly for our purposes, the ER Index has a positive effect on state unemployment rates, and this
effect is statistically significant at the five percent level. Since the values of the index range from one to 100, the regression results indicate that, all else equal, a state with a “perfect” score on the ERI is projected to have an unemployment rate of approximately 0.008*99 ≈ 0.79 percentage points lower than a state with the maximum ERI value.
TABLE B-3: REGRESSION RESULTS WITH COMPOSITE EMPLOYMENT REGULATION INDEX (DEPENDENT VARIABLE = STATE UNEMPLOYMENT RATE)
Independent Variable Coefficient Standard Error t-statistic p>|t|
Employment Regulation Index 0.008 0.004 2.35 0.019
Small Business Tax Climate Index -0.109 0.049 -2.22 0.027
Share of Population With BA -0.014 0.012 -1.13 0.259
Real State GDP Per Capita -24.275 8.956 -2.71 0.007
Year = 2002 0.871 0.152 5.71 0.000
Year = 2003 1.038 0.157 6.62 0.000
Year = 2004 0.658 0.158 4.17 0.000
Year = 2005 0.412 0.158 2.6 0.010
Year = 2006 -0.041 0.159 -0.26 0.795
Year = 2007 -0.139 0.161 -0.86 0.389
Year = 2008 0.827 0.161 5.13 0.000
Pacific 2.823 0.319 8.86 0.000
Mountain 1.307 0.296 4.41 0.000
West North Central 0.884 0.297 2.98 0.003
West South Central 1.742 0.317 5.49 0.000
East North Central 2.289 0.299 7.66 0.000
East South Central 2.255 0.325 6.95 0.000
Southeast 1.642 0.299 5.49 0.000
Mid-Atlantic 1.778 0.313 5.67 0.000
Northeast 1.277 0.294 4.35 0.000
Alaska 3.831 0.402 9.52 0.000
Constant 4.137 0.520 7.96 0.000
POLICY VARIABLES
CONTROL VARIABLES

109
2. Modeling New Business Creation
The econometric estimates of the new business creation model are reported in Tables B-4 and B-5 below. The dependent variable in the model is the number of new private establishments (less than one year old), per one-million inhabitants, for a given state in a given year. As seen in Table B-4, the coefficient on the small business tax climate index is positive and statistically significant at the one percent level,
indicating that, as expected, a more hospitable tax environment is associated with a higher rate of business formation. Furthermore, the real minimum wage and the unionized share of the workforce, while not individually significant, are negative and jointly statistically significant at the 10-percent level.49 The share of the population with a bachelor’s degree has a positive and significant effect on new business formation. Finally, state-level real GDP per capita has a positive and statistically significant effect, as expected.
TABLE B-4: REGRESSION RESULTS WITH SEPARATE EMPLOYMENT REGULATION INDICATORS (DEPENDENT VARIABLE = NEW BUSINESSES PER ONE-MILLION INHABITANTS)
Independent Variable Coefficient Standard Error t-statistic p>|t|
Real State Minimum Wage -71.47 47.92 -1.49 0.137
Small Business Tax Climate Index 138.97 20.33 6.84 0.000
Unionized Share of Workforce -7.51 5.54 -1.35 0.177
Share of Population With BA 10.79 4.99 2.16 0.031
Real State GDP Per Capita 9016.58 3967.26 2.27 0.024
Year = 2002 -131.66 62.55 -2.11 0.036
Year = 2003 -63.09 64.97 -0.97 0.332
Year = 2004 -82.14 66.61 -1.23 0.218
Year = 2005 -35.85 68.38 -0.52 0.600
Year = 2006 37.94 69.76 0.54 0.587
Year = 2007 19.12 68.16 0.28 0.779
Year = 2008 -72.22 66.78 -1.08 0.280
Pacific 311.16 141.78 2.19 0.029
Mountain 709.59 143.93 4.93 0.000
West North Central -41.75 142.44 -0.29 0.770
West South Central -14.98 159.20 -0.09 0.925
East North Central -352.93 130.27 -2.71 0.007
East South Central -209.91 153.18 -1.37 0.171
Southeast 227.18 148.12 1.53 0.126
Mid-Atlantic 234.68 134.42 1.75 0.082
Northeast 243.35 134.87 1.8 0.072
Alaska -313.39 166.64 -1.88 0.061
Constant 2.422 0.830 2.92 0.004
POLICY VARIABLES
CONTROL VARIABLES
49 F(2,377) = 2.32; Prob > F = 0.0995.

110 110
In Table B-5, we add the ER Index to the business formation model. Because the Index already incorporates information on minimum wages and union membership, these two variables are not included in this regression. As shown below, the control variables enter the regression with very similar signs and significance levels as the previous regression, and the R-squared statistic is nearly the same as before (approximately 64 percent). Most significantly for our purposes, the ER Index has a negative effect on new business formation, and this effect is statistically significant at the ten percent level.
Since the values of the Index range from one to 100, and since the dependent variable is the number of new businesses per one million inhabitants, the regression results indicate that, all else equal, a state with a “perfect” score on the ERI is projected to have approximately 2.757*99 ≈ 273 additional new businesses per one-million inhabitants per year, relative to a state with the maximum value of the ER Index. This represents an increase of over 12 percent relative to the sample average of 2,190 new businesses per million inhabitants per year.
TABLE B-5: REGRESSION RESULTS WITH COMPOSITE EMPLOYMENT REGULATION INDEX (DEPENDENT VARIABLE = NEW BUSINESSES PER ONE-MILLION INHABITANTS)
Independent Variable Coefficient Standard Error t-statistic p>|t|
Employment Regulation Index -2.757 1.482 -1.86 0.064
Small Business Tax Climate Index 142.636 20.049 7.11 0.000
Share of Population With BA 12.743 4.965 2.57 0.011
Real State GDP Per Capita 6949.405 3672.599 1.89 0.059
Year = 2002 -128.082 62.520 -2.05 0.041
Year = 2003 -49.393 64.307 -0.77 0.443
Year = 2004 -57.895 64.795 -0.89 0.372
Year = 2005 -2.349 64.949 -0.04 0.971
Year = 2006 77.965 65.078 1.2 0.232
Year = 2007 45.265 65.982 0.69 0.493
Year = 2008 -62.893 66.157 -0.95 0.342
Pacific 336.142 130.651 2.57 0.010
Mountain 833.125 121.571 6.85 0.000
West North Central 61.171 121.872 0.5 0.616
West South Central 115.914 130.004 0.89 0.373
East North Central -266.944 122.563 -2.18 0.030
East South Central -115.036 133.079 -0.86 0.388
Southeast 331.602 122.709 2.7 0.007
Mid-Atlantic 336.918 128.512 2.62 0.009
Northeast 313.519 120.368 2.6 0.010
Alaska -337.612 164.965 -2.05 0.041
Constant 4.137 0.520 7.96 0.000
POLICY VARIABLES
CONTROL VARIABLES

This page intentionally left blank.

This page intentionally left blank.