Embed Size (px)
Citation preview

THE IMPACT OF SOCIAL MEDIA ON BODY IMAGE
AND EATING BEHAVIORS
By
ELIZABETH ANNE KAMPF
Thesis
Submitted to the Faculty of the
Graduate School of Vanderbilt University
in partial fulfillment of the requirements
for the degree of
MASTER OF ARTS
in
Psychology
May, 2013
Nashville, Tennessee
Approved:
Dr. David Schlundt
Dr. Steven Hollon

ii
TABLE OF CONTENTS
Page
LIST OF TABLES ............................................................................................................. iv
LIST OF FIGURES .............................................................................................................v
Chapter
I. INTRODUCTION ............................................................................................................1
Statement of the Problem .........................................................................................8
II. METHOD ........................................................................................................................9
Sample ......................................................................................................................9 Data Collection ........................................................................................................9 Collection Apparatus .............................................................................................11 Randomization .......................................................................................................12 Measures ................................................................................................................12
Pre-Exposure ...............................................................................................13 Exposure ......................................................................................................14 Post-Exposure ..............................................................................................14
Exposure ................................................................................................................15 Data Analysis Plan .................................................................................................17
III. RESULTS ....................................................................................................................21
Pre-Exposure Descriptive Analysis .......................................................................21 Group Comparison .................................................................................................28 Post-Exposure Descriptive Analysis ......................................................................31
IV. DISCUSSION ..............................................................................................................37
Implications ............................................................................................................37 Limitations .............................................................................................................41 Future Directions ...................................................................................................42 Conclusions ............................................................................................................43
APPENDIX ........................................................................................................................44
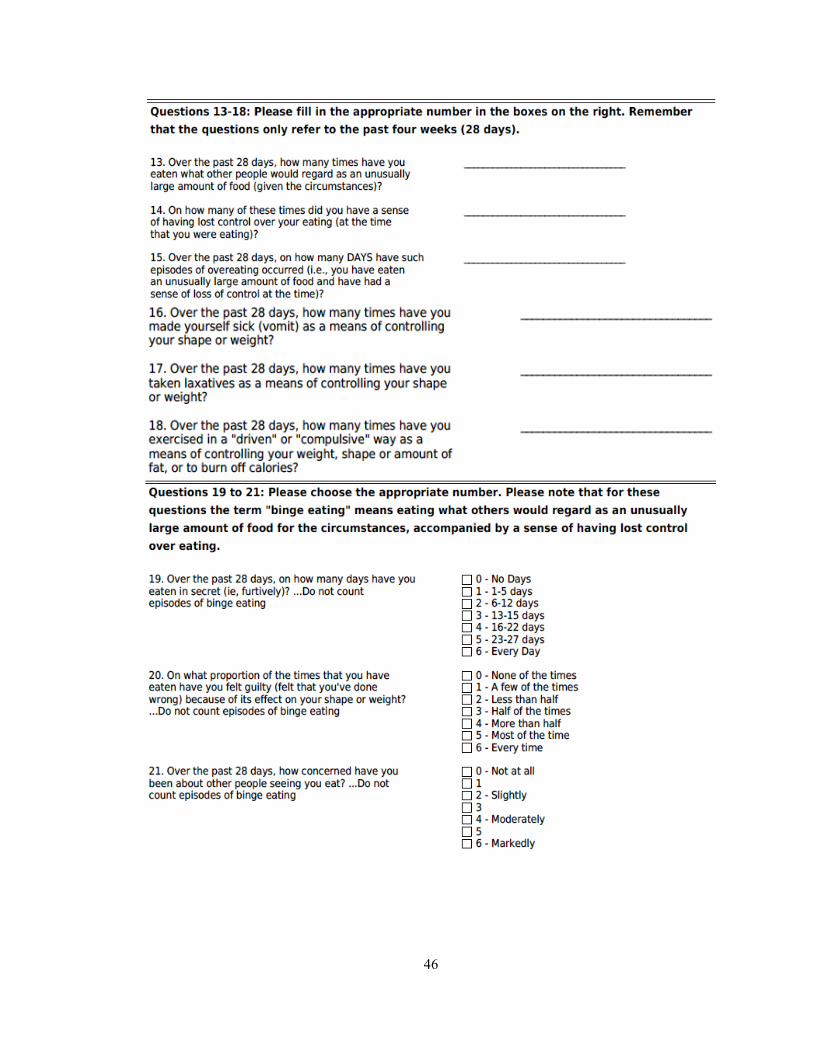
Eating Disorder Examination Questionnaire 4.0 ...................................................44 Pre-Exposure Measure ...........................................................................................49

iii
Post-Exposure Measure .........................................................................................51 Mock Facebook Page Examples ............................................................................53
REFERENCES ..................................................................................................................57
iv
LIST OF TABLES
Table Page
1. EDE-Q Subscales ...........................................................................................................14
2. Condition Levels ............................................................................................................16
3. Exposure Language Examples .......................................................................................16
4. Comparison to Luce et al. 2008 Sample of Clinically Significant Percentages ............17
5. Condition by High-Low category Crosstabulation ........................................................19
6. Facebook Usage Time ....................................................................................................21

v
LIST OF FIGURES
Figure Page
1. Structural Example of Condition Exposure ...................................................................10
2. Histogram of Summed Risk Scores ...............................................................................18
3. Behaviors on Facebook ..................................................................................................23
4. Percentages of Participants who Judge Others on Facebook .........................................24
5. How Often Participants Think About Others Judging ...................................................25 6. Endorsed Frequency of Comparison ..............................................................................26 7. Object of Comparison ....................................................................................................27
8. Estimated Marginal Means with Covariate Inclusion for Comparison .........................29
9. Estimated Marginal Means for Change .........................................................................31 10. Frequency who have seen Pro-Ana or Pro-Mia Information on Facebook .................32 11. Weight Dissatisfaction in Facebook Pictures ..............................................................34 12. Feeling Inadequate Based on Appearance Comparison to Friends .............................35 13. Belief that Facebook can Impact Body Image and Eating Behavior ...........................36

1
CHAPTER I
INTRODUCTION
For decades, society has played the “blame game” with mainstream media.
Images of the thin ideal have been implicated as sources of body dissatisfaction in
females and males but not without reason. Meta analyses have shown the relationship
between media and poor body image, internalization of the thin ideal, and eating
behaviors and beliefs (Grabe et al., 2008). The financial interests of businesses selling a
variety of products have resulted in a “cult of thinness” that we are exposed to multiple
times a day (Tiggerman and McGill, 2004). More specifically, studies have shown that
the effect of images is mediated by the amount of social comparison reported (Tiggerman
and McGill, 2004). Groesz et al. (2002) completed a meta-analysis of 25 studies finding
that body image was significantly more negative after viewing images of thin women,
than after viewing images of average size models, plus size models, or inanimate objects.
Appearance-based social comparison also has been shown to mediate the effect of
appearance-related teasing on body image and eating disturbance (Thompson et al.,
1998). In addition, individuals with eating disorders have been found to have attentional
biases to negative shape and weight words, typically weight-sensitive body parts (i.e.
stomach, thighs), and to images of thin women rather than average or plus sized (Smith
and Reiger, 2010; Vitousek and Hollon, 1990; Faunce, 2002; Lee and Shafran, 2004).

2
Consequently, preferential information processing reinforces individuals concerns about
shape and weight.
Although mass media clearly plays a role in the development of body image and
eating disturbance, less studied are the implications of real world peer comparison
through friend groups or social networks. It has been shown that individuals sharing
similar viewpoints on weight related factors tend to form cliques of friends (Gilbert and
Meyer, 2003). More importantly, the attitude of friends has been shown to significantly
predict changes in one’s personal beliefs and lifestyle.
Christakis and Fowler (2007) utilized a pool of 12,067 individuals assessed
longitudinally between 1971-2003 to quantitatively analyze the nature and extent of
person-to-person spread of obesity. A participant’s chance of becoming obese increased
by 57% if he or she had a friend who became obese over the course of the study.
Geographic location was insignificant while interpersonal social ties dramatically
increased rates of obesity.
Paxton et al. (1999) looked at friendship circles to determine the impact of the
friendship dynamics on body image, dietary restraint, extreme weight loss behaviors, and
binge eating in adolescent girls. Friendship attitudes were found to contribute
significantly to the prediction of individual body image concern, eating behavior, and use
of extreme weight loss behaviors. To look at the consequences of real world social
comparison through live interactions with the “ attractive thin ideal”, Krones et al. (2005)
had participants interact with a thin or average sized confederate. Measures post
interaction showed that exposure to the thin confederates resulted in an increase in body

3
dissatisfaction. Overall, current literature has shown that these peer-based comparisons
increase negative body image and the pressure women feel to be thin.
Expanding on these findings, an eating disorder-specific model of interpersonal
psychotherapy (IPT-ED) was proposed by Rieger et al. (2010). Because of the social
relevance and prescription in some cultures of the core features of eating disorders,
Rieger et al. stipulated that interpersonal factors play a significant role in the
development and maintenance of eating disordered behaviors.
The idea of an interpersonal formulation of eating disorders is supported by the
wide-range of evidence showing interpersonal issues in the lives of individuals diagnosed
with eating disorders (Wilfley, Stein, & Welch 2003). For example, a 2010 study showed
that individuals with eating disorders exhibit a submissive, nonassertive interpersonal
style that caused insecure attachments for this population (Hartmann et al., 2010). In
another example, this clinical population endorses significantly higher levels of social
anxiety than a nonclinical comparison group (Hinrichsen et al., 2013). Other studies of
note include Grisset and Norvell, (1992); Hopwood et al., (2007); and Lampard et al.,
(2011). Specifically, the IPT-ED theory postulates that in response to negative or
unsuccessful social interactions, individuals attempt to repair their self-esteem or cope
with the negative social evaluation through disordered eating behaviors. Rieger et al.
(2010) argued that negative social evaluation triggers disturbances of the self, which is
then dealt with through eating disordered symptoms.
There are two disturbances of self that are particularly relevant to eating
disorders. The first is negative self evaluation- or negative beliefs about one’s worth,
which can be either general or specific (Tesser, 2003). The second is poor self-regulation

4
or the lack of ability to efficiently regulate one’s mood and/or behavior (Baumeister and
Vohs, 2003). The theoretical model of IPT-ED assumes that eating disordered behaviors
function as means to cope with and overcome these disturbances. Reiger et al. relays;
“For instance, the individual might attempt to enhance self-esteem through dieting and other methods of weight control (Cooper et al., 2004), or to escape from aversive states of self awareness through binge eating (Heatherton & Baumeister, 1991), or to avoid these states entirely through self-starvation (Schmidt & Treasure, 2006).”
For eating disordered individuals, poor self-evaluation is often fed by an interpersonal
feature- negative social evaluation. Negative social evaluation can be defined as the
“…actual or perceived negative feedback regarding one’s value to another individual or
group” (Reiger et al., 2010). Because negative social evaluation is of a repetitive nature,
the relationship between that feedback and eating disordered symptoms very quickly
become reciprocal, therefore the evaluation also functions at a maintenance factor for the
maladaptive cognitions and behaviors.
There are many sources of information an individual can interpret regarding their
social value. These sources can be direct, such as bullying or critical comments, or
indirect through social comparison. Individuals may choose to or subconsciously
interpret their social standing by comparing themselves to others (Wood & Wilson,
2003). Longitudinal evidence has also examined the tendency of eating disordered
individuals to seek out negative social feedback and the effect of this feedback on eating
disorder cognitions and behaviors (Joiner, 1997). This study concluded that attention to
and searching for negative feedback increased body dissatisfaction, which then increased
bulimic symptoms.

5
One outlet through which these exchanges and social comparisons take place is
Facebook. As social media sites continue to increase in popularity, research must look at
the implications of this interactive space on various pathologies. Specifically in relation
to eating disorders, Facebook provides a space where users can post pictures of
themselves; compare their appearance to other peoples’ pictures; make comments related
to weight, food, and shape; and join groups or support causes related to disordered eating.
Most importantly and unfortunately, the site puts negative feedback at the fingertips of
the user. As previously noted, comparisons to images and thin confederates can lead to
increases in body dissatisfaction- images which are prevalent on a social networking site
with over 1 billion users (Smith, 2012).
Beyond appearance related stimuli, social comparisons to features such as career
success can negatively impact eating disorder cognitions and behaviors. Li et al. (2010)
found that female undergraduates who read profiles describing successful peers endorsed
high levels of body dissatisfaction as well as more restrictive eating attitudes then
undergraduates who were presented with profiles of unsuccessful peers (Smith et al.,
2013). Text on Facebook profiles shares real time updates of engagements, pregnancies,
promotions, college acceptances, and so on- all of which may provide material for
negative social comparisons.
Research is just beginning to explore the relationship between Facebook, body
image, and eating disorder symptoms. Because Facebook provides a platform for social
comparisons and negative feedback seeking, it is an especially important area to examine
with relation to eating disordered individuals who are already prone to interpersonal
dysfunction and low self-esteem. To our knowledge, only one publication has come out

6
at this time regarding this subject. Smith et al. (2013) investigated the effects of online
social evaluation and comparisons on body dissatisfaction and bulimic symptoms in an
undergraduate female sample. The investigators hypothesized that a behavior they coined
“maladaptive Facebook usage” would lead to increased body dissatisfaction over time
and in turn increases in bulimic symptoms. Maladaptive Facebook usage was defined as
“…the tendency to seek negative social evaluations and/or engage in social comparisons
via Facebook” (Smith et al., 2013).
Smith et al. created a 7-item questionnaire that measured participants’
maladaptive Facebook usage. Participants endorsed their level of agreement with
statements such as “I sometimes write negative things about myself in my status updates
to see if others will respond with negative comments about me,” and “Reading the status
updates of others tends to make me feel down on myself.” Other measures utilized
included the Eating Disorder Inventory (EDI; Garner et al., 1983), the Eating Disorder
Examination Questionnaire-4 (EDE-Q 4; Fairburn and Cooper, 1993), and the Depressive
Interpersonal Relationship Inventory- Reassurance Seeking Subscale (DIRI-RS; Joiner et
al., 1992). All measures except the DIRI-RS were assessed at both Time 1 (T1) and Time
2 (T2) of the study. The DIRI-RS measure was used as a covariate taken at Time 1. T1
and T2 were separated on average by 24 days over which individuals used Facebook on
their own time.
Smith et al. presented several conclusions supporting a negative impact of
maladaptive Facebook use on body dissatisfaction and bulimic symptomology.
Maladaptive Facebook usage was found to significantly predict increases in bulimic
symptoms even when controlling for variables such as the DIRI-RS covariate, age, and

7
race (p< 0.01). Maladaptive Facebook usage measured at T1 significantly predicted
increases in body dissatisfaction (EDI body dissatisfaction subscale, p = 0.003; EDE-Q 4
shape concern subscale, p = 0.01). Finally, body dissatisfaction was found to fully
mediate the relationship between maladaptive Facebook usage and increases in over-
eating episodes, and partially mediate the relationship between maladaptive Facebook
usage and increases in bulimic symptoms. Findings were consistent with the hypotheses
originally proposed.
Although Smith et al. (2013) have shed an initial light on this complex
relationships, it is clear there is the need for both replication and expansion of these
results. Importantly, a control for Facebook use between T1 and T2 was not presented
therefore investigators cannot be sure of how often, with what purpose, and what exactly
participants did on Facebook between T1 and T2. Moreover, a more general description
of what individuals are comparing to on Facebook pages may provide recommendations
for future areas of research as well as implications for treatment providers.
In an age where social media shapes a large part of society’s interaction, one
cannot ignore the possible negative implications of increased impersonal access between
peers that allows for indirect social evaluation and comparison. Beyond decreasing face-
to-face socializing, social media sites allow for the instantaneous introduction,
investigation, and comparison to a peer. Unlike typical media sources where consumers
may observe but not interact with celebrities, social networking sites like MySpace and
Twitter encourage a deeper connection between users. Identification with another as well
as comparison is much more likely to take place in this context creating more opportunity
for peer influence and social comparison whether positive or negative. This study
8
proposes to examine the relationship between Facebook and eating disordered
symptomology in college-aged females.
Statement of the Problem
The continuous infiltration of social media into our daily lives highlights the need
to investigate its impacts on mental health. Because of the prevalence of social media use
that includes the posting of photos and comments on these images, it is especially
important to identify potential side effects of this behavior on body image and eating
behaviors. The aims of this study were: 1) How are college-aged females generally using
Facebook? 2) Is there an association with body image and eating behavior? 3) Are
individuals that endorse higher levels of eating disordered cognitions or behaviors
utilizing Facebook differently than their normal peers? 4) Does even a brief exposure to
Facebook pages with weight-related comments and explicit body type images of
unknown peers impacts personal weight concerns and future behaviors?
It was hypothesized that individuals who were part of a defined high-risk group
would be more likely to both compare themselves negatively to the Facebook pages and
to endorse more interest in changing diet and exercise behaviors after the exposure.
Furthermore, conditions of body types that were underweight, overweight, or
athletic/muscular were expected to have more of an impact on comparison and post-
exposure change than the condition of normal/average body type. Finally, a discussion of
prevention and treatment implications will be presented.

9
CHAPTER II
METHOD
Sample
Participants were female students at Vanderbilt University in Nashville, TN.
Exclusion criteria included that the participant must be able to speak English, currently
had a personal Facebook page, and was between the ages of 18-22. Students signed up
for participation through a web-based research sign-up program entitled Sona Systems.
This system allows students to volunteer for various research projects to receive pay or
class credit. The current study was posted under the title “Facebook Use 1” for a value of
1.5 class credits. Because the study aimed to collect an unbiased sample of undergraduate
females and possessed an element of deceit, the description visible to student participants
on SONA was simply “Study aims to assess the use and impact of Facebook on various
psychological measures”.
Data was collected from 149 participants with one withdrawal, resulting in a
sample size of N=148.
Data Collection
Data was collected starting in March 2012 and was completed in early December
2012. The study began with the collection of baseline data on Facebook use, eating

10
behaviors, and body image. Previous eating disorder diagnoses were noted through an
optional question included in the baseline measure.
Four conditions were created to expose participants to specific body types
in the form of photos on a Facebook page. The four body types represented were
underweight, overweight, normal/average weight, and athletic/muscular. With over 1
billion users, it can be assumed that all of these body types are represented within the
Facebook user population (Smith, 2012). Subjects were randomly assigned to one of the
four conditions. Each of the four examples in the condition was represented by two views
of the mock individual’s Facebook page. One view was the home profile page of the
individual and the other was a view of a photo in one of their albums. An example of this
structure for a participant assigned to condition 1 is provided in the following figure.
Figure 1. Structural Example of Condition Exposure
Participant Condition 1
Mock Example 1
Pro5ile Page
Album Page
Mock Example 2
Pro5ile Page
Album Page
Mock Example 3
Pro5ile Page
Album Page
Mock Example 4
Pro5ile Page
Album Page

11
In addition to the presentation of specific body types in the mock Facebook
images, the exposure also included text related to body satisfaction. Within each
condition, participants viewed each of the four language types. All participants regardless
of their condition assignment saw examples of each of the four language types
representative of levels of body satisfaction. The four language types included positive
body talk, negative body talk, neutral or unrelated to body talk, and competitive body
talk. Examples of the language types are included in the measures section.
Participants were given specific instructions both verbally and in written form to
pay attention to both the images and the text on the Facebook pages. They were told the
pages were non-interactive ahead of time. As participants looked at the pages, they were
asked to fill out a written questionnaire that required focused attention on the images and
text to complete. These questions were not for analysis but rather to ensure the
participant’s attention on the relevant manipulated items.
Following exposure, participants completed a survey related to the Facebook
pages they viewed. Upon completion of this final measure, subjects were debriefed by the
experimenter and informed of the true purpose of the study.
Collection Apparatus
Data was collected through two computers in a Vanderbilt University lab.
REDCap, a web-based application that allows users to build projects composed of
surveys and manage databases, was used to administer the majority of the study. The only
portion of the study that was conducted outside of REDCap was the unmeasured
12
questionnaire used to focus participants’ attention on the mock Facebook pages.
Participants were provided with a paper version of this questionnaire and a pencil.
The surveys based in REDCap were formatted by the experimenter except for the
Eating Disorders Examination Questionnaire (EDE-Q) 6.0, which was taken from a
library of measures open to users on REDCap (Fairburn and Beglin, 1994). Images of the
measures as they appeared in REDCap are included within the appendix.
Randomization
Randomized assignment to the four conditions was created through a web-based
block randomization program (Urbaniak and Plous, 2011). The input was 50 sets of 4
unique numbers per set ranging from values 1 to 4. Study personnel referred to the
output, matching the participant numerical ID (values 1 through 150) to a condition
number and would correctly mark this selection within REDCap when they began a
participant’s data collection. Branching logic programed in the REDCap project ensured
participants saw the assigned condition.
Measures
The study included three phases of measurement; pre-exposure, exposure, and
post-exposure. Descriptions of the measurements used in each phase follow and complete
copies can be found in the appendix. Of note, the “Maladaptive Facebook Usage”

13
questionnaire created by Smith et al. 2013 was not published during the data collection
portion of this study and therefore was not included as a measure.
a. Pre-exposure
Pre-exposure measurement was composed of two parts, the EDE-Q 6.0 and a
survey regarding lifetime Facebook use. The survey regarding lifetime Facebook use was
created by the experimenter because of the relative lack of measures looking at Facebook
specifically with regards to body comparison. There were 15 items included in this
measure. Questions assessed Facebook behaviors such as how often a participant logged
in during the day, what technology they used to access Facebook, what they were doing
once on Facebook, and how Facebook affected their mood.
The EDE-Q is a self-report version of the Eating Disorder Examination (EDE),
which is experimenter-administered. Community norms have been established in both
adult and adolescent populations and the EDE-Q has been compared to and found to
perform well in most areas with relation to other commonly used measures (Mond et al.,
2006; Carter, Stewart, and Fairburn, 2011; Peterson and Mitchell, 2005). The questions
asked in the survey relate to the past four weeks (28 days) of behavior and cognition
related to eating disorder symptomology. Specifically the measure examines four
subscales, eating concern, weight concern, shape concern, and restraint. Examples of
questions addressing each subscale as well as subscale descriptions are included in the
below table. The EDE-Q as portrayed in REDCap is available in the appendix.

14
Table 1. EDE-Q Subscales
Subscale Description Items Example Item
Eating Concern
Preoccupation with food, eating, or calories, fear of losing control with eating, eating in secret, guilt about eating, social anxiety about eating
#7 9
19-21
7. Has thinking about food, eating or calories made it
very difficult to concentrate on things you are interested
in (for example working, following a conversation, or
reading)?
Weight Concern
Importance of weight, dissatisfaction with weight, desire to lose weight, reaction to prescribed weighing,
preoccupation with shape or weight
#8 12 22 24 25
12. Have you had a strong desire to lose weight?
Shape Concern
Desire for flat stomach, importance of shape, fear of weight gain,
preoccupation with shape or weight, discomfort seeing body, feelings of
fatness, avoidance of body exposure, importance of shape
#6 8
10 11 23
26-28
23. Has your shape influenced how you think about (judge) yourself as a
person?
Restraint Restraint over eating, avoidance of
eating and food, dietary rules, desire for empty stomach
#1-5
1. Have you been deliberately trying to limit the amount of food you eat to influence your shape or weight (whether or not you
have succeeded)?
b. Exposure
During the exposure, participants completed a written questionnaire that was not
scored. The purpose of this questionnaire was to orient the participants’ attention to both
the images and text on each mock Facebook page. Questions were answered for each of
the four examples viewed and responses were open-ended. The three questions were;
a. Slide 1: What color top is this person wearing?
b. Slide 2: What emotion do you think this individual is experiencing?
c. Overall: How would you describe the body type of this person in a few words?
c. Post-exposure
The post-exposure measure was composed of two parts and experimenter-created
consisting of 20 total items. The first portion of the survey related directly to the pages

15
the participants had just viewed during the exposure portion of the study. This part of the
measure asked questions such as whether or not a participant would change eating or
exercise behavior after viewing these pages and whether they compared themselves to the
individuals presented. The second portion related more generally to the participant’s life
and asked questions that could not be asked during the pre-exposure measure to avoid
creating bias or presupposing participants’ responses. Examples questions from this
portion include; “Are you dissatisfied with your weight in your Facebook pictures?” and
“Have you ever seen ‘Pro Mia’ or ‘Pro Ana’ information on Facebook?”
Exposure
Participants were exposed to mock Facebook pages crated by the experimenter.
Pages were created using the following programs;
• FireBug to inspect the HTML code of real Facebook pages in order to match font
color, size, and formatting
• Photoshop and InDesign to manipulate screen shot of actual Facebook pages-
images, text, and names on each page were changed.
Photographs for the pages were collected from volunteers outside of the Nashville and
Vanderbilt communities or from the non-profit Creative Commons search engine.
Photographs were selected to portray one of the four specific body types presented. The
four body types included athletic/muscular, average/normal, overweight, and
underweight. Both images and language was specifically manipulated on the pages. Four
examples of each body type were nested in the condition and each example portrayed one

16
of four different language types. The four language types were body praise, athletic
focus, negative body, and none. “None” was defined as no comments related to body
image, weight, or eating behaviors. Examples of the mock Facebook pages and images
for the various body types can be found in the appendix.
Table 2. Condition Levels
IMAGES L A N G U A G E
Table 3. Exposure Language Examples
LANGUAGE EXAMPLES
Language Type
Example
None “So good to see you last night! hope to see you at the concert!”
Body Praise “Loved the outfit you wore last night! Showed off those gorgeous collarbones!”
Athletic Focus “Competition ain’t got nothing on those abs girl!’
Negative Body “Ughhh we need to go on a diet! I hate this picture of us!
Level 1 Level 2 Level 3 Level 4
Level 1 Normal None
Overweight None
Athletic None
Underweight None
Level 2 Normal Body praise
Overweight Body praise
Athletic Body praise
Underweight Body praise
Level 3 Normal Athletic focus
Overweight Athletic focus
Athletic Athletic focus
Underweight Athletic focus
Level 4 Normal Negative body
Overweight Negative body
Athletic Negative body
Underweight Negative body

17
Data Analysis Plan
The statistical package SPSS version 21.0.0 was used for all data analysis. Data
was exported through REDCap to the statistical software. Prior to running statistical tests,
various variables were computed from the scores including EDE-Q subscale scores and
subset score for both surveys utilized at pre and post exposure.
Because this study set out not only to test the impacts of a brief exposure but also
to describe general characteristics of Facebook use in college-aged women as related to
comparison and body image, many of the questions can be addressed through descriptive
statistics and frequencies. Percentages were assessed to depict sample qualities such as
how often young women are accessing Facebook, if they like the way they look in their
Facebook photos, and what they do the majority of the time when on Facebook.
The sample was analyzed to determine clinical significance in eating disordered
behavior based on the EDE-Q. A score of four or above as a cutoff point for clinical
significance on any of the four EDE-Q subscales and the global scales was utilized based
on previous research standards (Luce et al.). Using this designation, the count values and
frequencies commands in SPSS were used to determine how many cases within the
current samples were considered clinically significant for each of the subscales.
Table 4. Comparison to Luce et al. 2008 Sample of Clinically Significant Percentages
Subscale Luce et al. (N=723) Current Data (N=148) Restraint 7.9% 7.4% Eating Concern 2.2% .7% Shape Concern 14.8% 14.9% Weight Concern 10.2% 10.8% Global 5.6% 2.7%

18
The current data set presented slightly lower percentages of clinical significance except
for the shape and weight concern subscales. These differences may be explained by
sample size, but were not considered to impact the overall goals of this study.
Once investigators had an overview of the clinical significance within the
sample, several methods were considered to form two groups with relatively similar cell
sizes to best serve the two-way ANOVA procedure. Because the cell sizes using the 4-
point cutoff would not support the ANOVA procedure, we decided to use an operational
cutoff of 1 standard deviation above the mean for each EDE-Q subscale. Investigators
created a summed variable based on the 0,1 coding for non-significant or significant
respectively on each subscale. The histogram of this variable is shown below.
Figure 2. Histogram of Summed Risk Scores

19
To be considered a member of the “High-Risk” category, an individual had to score at
least 1 standard deviation about the mean on any of the subscales. This resulted in a total
of 102 low-risk participants and 46 high-risk participants as well as the following cell
sizes for each group nested within each condition. This format for group division
produced acceptable cell sizes to move forward with analysis.
Table 5. Condition by HighLowCategory Crosstabulation HighLowCategory Total
.00 1.00
condition
1 athletic/muscular 21 13 34 2 normal 28 11 39 3 underweight 29 8 37 4 overweight 24 14 38
Total 102 46 148
Once these two groups were determined, two-way between groups analysis of
variances (ANOVAs) were utilized to test for main effects of both independent variables
as well as an interaction effect. Two-way ANOVAs assume the population from which
the samples were obtained must be normally or approximately normally distributed,
samples must be independent, variances of the populations must be equal- homogeneity
of variance, and the groups must have a relatively similar sample size.
The two independent variables under consideration were condition assignment
and high or low risk category based on the EDE-Q resulting in a two by four design. An
interaction effect assesses whether the effect of one independent variable on the
dependent variable depends on the level of the second independent variable. The

20
dependent variable in this study is the post-exposure subset score relative to the question
under consideration.

21
CHAPTER III
RESULTS
Pre-Exposure – Descriptive Analysis
Frequencies and descriptive statistics were utilized to create a general overview of
Facebook behaviors and cognitions related to use. Frequency tables are presented with
valid percentages, which are percentages taken from all the available responses rather
than including missing values. Descriptive statistics are also presented where relevant.
a. Facebook Access
One of the important subjects evaluated in the pre-exposure measure was how
often and through what means young women are accessing Facebook. Results highlighted
the frequency with which this population interacts with social media, specifically
Facebook. The majority of participants logged in to Facebook at least once every day of
the week, and over 1/3 reported always being logged in.
Table 6. Facebook Usage Time
Average Number of Days /7 Checked Facebook
Times Per Day
Mean 6.79 8-10 times per day Mode 7 (130/148 participants) Always Logged In (54/148
participants) Minimum 3 0-2 times per day Maximum 7 Always Logged In
22
With such high usage levels, it is also important to note how this population
accesses Facebook. 55.4% of respondents replied “Anything I can”, 33.8% use their
computers, and 10.8% use their cell phones.
b. Facebook Behaviors
Facebook is often advertised as a way to connect with old friends, to publicize
events, update others on your life, or raise awareness about a cause. When asked to
choose a response that best described why they used Facebook, 64.9% of respondents
replied, “To keep up with peoples’ lives”. The choices of “for work or special interests”
and “to meet people” received zero responses. When asked about what they were doing
when on Facebook, only 1 participant responded that they were publicizing an event
while 80.3% replied “Stalking photos/people”. The term “stalking” is used colloquially
among Facebook users to describe the behavior of covertly obtaining information about
another individual through Facebook. Figure 3 presents a visual representation of the
behaviors participants endorsed on Facebook. Notably, results point to behavior oriented
to comparison in looking at others pages.

23
Figure 3. Behaviors on Facebook
Although Facebook “stalking” has been considered beneficial in some situations, such as
companies investigating the background of a potential employee, it is clear that college-
aged females are not employing Facebook for business, scholarly, or networking needs.
c. Judgment and Comparison
If college-aged females are looking at their peers photos, statuses, and comments
for the majority of the time when they are on Facebook, how often are they comparing
themselves to these pages or making judgments about others? More importantly, does
that behavior influence their mood state?

24
i. Do you make judgments (positive or negative) about others based on their Facebook pages? A startling 98.7% of the sample is making judgments at least some of the time about
others based on their Facebook page. Figure 4 presents the breakdown of this percentage.
Figure 4. Percentages of Participants who Judge Others on Facebook
ii. Do you think about people judging you based on your Facebook?
In addition to judging others based on Facebook, college-aged females are also spending
time wondering whether others are judging them based on their Facebook page. 57.4% of
participants thought about this frequently. This study did not address whether this thought
process caused anxiety, depression, or other emotional reactions within young women

25
however in speaking with the investigators many participants relayed some form of
cautionary behavior related to Facebook. For example, some said that they always made
sure they liked a photo of themselves on Facebook before they allowed it to be tagged or
were very careful with what they posted in a status or comment because of how others
would perceive it.
Figure 5. How Often Participants Think About Others Judging
iii. Do you compare yourself to others on Facebook?
87.8% of the sample replied that they compared themselves to others on Facebook at
least some of the time. Of that percentage, about 33% compare themselves “Frequently”
or “Always.” This result will be elaborated on in the discussion section as it is a key point

26
to highlight for future research interests. Figure 6 presents the frequencies related to this
result.
Figure 6. Endorsed Frequency of Comparison
iv. What are you most likely to compare? (N=147)
Responses to this item indicated that 46.3% of comparisons young women are making on
Facebook are based in attractiveness. This supports the study premise that Facebook
functions as a venue for these comparisons to be made and that the potential exists in this
social media form to negatively impact body image. Figure 7 is a visual representation of
what the sample compared to.

27
Figure 7. Object of Comparison
v. Usually does Facebook improve or worsen your mood?
39.2% of the sample stated that using Facebook typically worsened their mood, 4.7% said
it improved their mood, 6.8% said it depended on the situation, and 49.3% said it had no
effect. Further investigation is needed in to this question, as participants may not
recognize the impact Facebook has on their mood both short-term and long-term. What
we can say is that even just in response to a singular question, close to 40% of college
females say that Facebook has a negative impact on their mood.

28
Group Comparison
Two different two-way between groups ANOVAs were performed to
analyze the potential differences between the high and low-risks groups across each
condition. The two dependent variables were a post exposure score measuring
comparison and a second post exposure score measuring anticipated change. These scores
were created by summing scores from relative items on the post-exposure measure.
Two by Four ANOVA-Post Exposure Comparison
The post-exposure comparison score assessed how often participants compared
themselves to the images presented on the mock Facebook pages, the positive or negative
nature of their comparisons, how they felt about their body after viewing and potentially
comparing to the pages.
A two-way between groups ANOVA was conducted to explore the impact of
high-low risk category and condition on levels of the post-exposure comparison variable.
The interaction effect between condition and risk group was not statistically significant,
F (3,137) = .827, p = .481. There was also no significant main effect for either condition,
F (3,137) = .596, p = .619, or risk category F (1,137) = 3.172, p = .077.
Because the significance level for risk category (p = .077) was close to the .05
cutoff used for determining significance of a main effect, a covariate was added to the
ANOVA. The addition of a covariate is also considered especially beneficial in studies
with small sample sizes or only small to medium effect sizes (Stevens, 1996). A variable
was created that accounted for a participant’s tendency to compare or make judgments in

29
general on Facebook as measured by the pre-exposure survey. Although it would be
expected that this covariate correlates significantly with the dependent comparison
measure, the covariate was not significant (p = .117) and its inclusion resulted in an even
less significant main effect for risk category (p = .150).
Figure 8. Estimated Marginal Means with Covariate Inclusion for Comparison
Two by Four ANOVA-Post Exposure Change
The post-exposure change score assessed if participants were likely to change
their diet and exercise regime after viewing the pages and how many changes they would
make. For example, if a participant said that yes they would change their diet, they then
were asked to select each item they would change from choices such as “Restrict intake”,
30
“Count calories”, or “Choose more healthy options”. Each item selected counted towards
their overall change subscale score.
A two-way between groups ANOVA was conducted to explore the impact of
high-low risk category and condition on levels of the post-exposure change variable.
Once again, the interaction effect between condition and risk group was not statistically
significant,
F (3,140) = .467, p = .705. In contract to the post-exposure comparison variable, a main
effect was found for both condition and risk group. The resulting values for the main
effect of condition were F (3,140) = 4.458, p = .005, which is a medium effect size using
Cohen’s criterion (1988) comparison value of .06 (partial eta squared = .087). The
resulting values for the main effect of risk category were F (1,140) = 7.288, p = .008,
which is close to a medium effect size (partial eta squared = .049). These results will be
expounded upon in the discussion section of this paper.

31
Figure 9. Estimated Marginal Means for Change
Post-Exposure - Descriptive Analysis
Descriptive analyses from the post-exposure measure focused on specific
behaviors on and beliefs about Facebook related to body image and eating disorders.
These questions were reserved for the post-exposure measure so as to avoid potential
preemption of the exposure stimuli.
a. Eating Disorder Information on Facebook
i. Have you seen information about eating disorder awareness on Facebook? (N=145)
A reported 80.7% of participants had not seen information about eating disorder
awareness on Facebook while only 19.3% had. These numbers relay a relative lack of
32
awareness information available on Facebook. This will be elaborated on in the
discussion, but with the frequency of which young women are on Facebook we may be
underutilizing an efficient way to pass along awareness and support information.
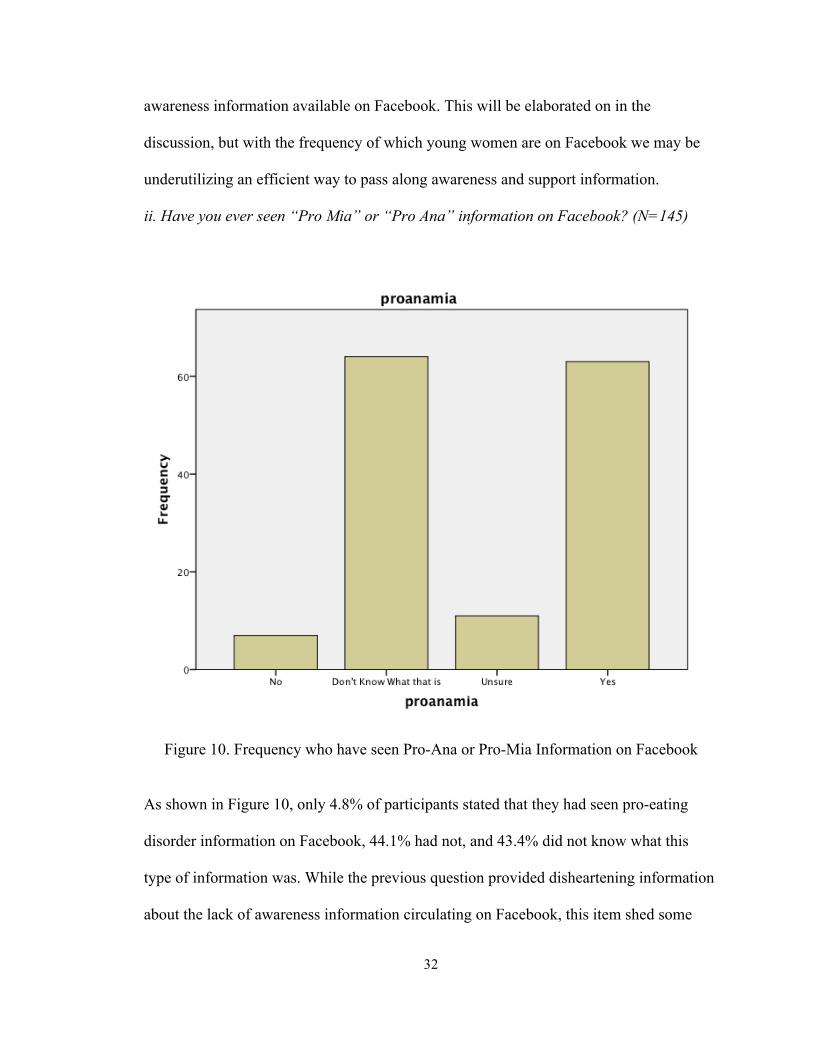
ii. Have you ever seen “Pro Mia” or “Pro Ana” information on Facebook? (N=145)
Figure 10. Frequency who have seen Pro-Ana or Pro-Mia Information on Facebook
As shown in Figure 10, only 4.8% of participants stated that they had seen pro-eating
disorder information on Facebook, 44.1% had not, and 43.4% did not know what this
type of information was. While the previous question provided disheartening information
about the lack of awareness information circulating on Facebook, this item shed some

33
positive light on the eating disorder information present on Facebook. “Pro Mia” and
“Pro Ana” refer to individuals or groups that accept bulimia nervosa or anorexia nervosa
as lifestyles rather than an illness. The online presence of these groups has continued to
grow and more recently expanded to social media. The web forums provide an outlet
where users post tips, weight updates, thinspiration (thinspo), fitspiration (fitspo) and
general support for eating disordered behavior (Borzekowski et al., 2010). Users also
compete in categories such as weight loss, calorie consumption, and body measurements.
The environment is non-judgmental and ranges in term of severity, with some sites
posting information for those who decide they want to pursue treatment and others that
denounce medical treatment for what they believe should be respected as a desirable
lifestyle choice.
b. Interactions with Friends (N=145)
i. Are you friends with someone on Facebook who you know or suspect to have an eating disorder?
The National Institute of Mental Health has stated that one in five women struggle
with an eating disorder or disordered eating. It is not surprising that over 80% of
participants replied that they were friends with someone on Facebook who they knew or
believed to have an eating disorder (82.8% yes, 17.2% no). However what is important to
take from this finding is the prevalence of opportunities for an individual to “stalk” a
friend on Facebook that struggles with disordered eating. Whether or not this struggle is
apparent in their photos or page commentary cannot be determined from the assessments
under discussion but we can at least conclude that the opportunity is there.
ii. Have you or your friends ever talked about individual weights or shapes on Facebook?

34
iii. Have you or your friends ever talked about dieting on Facebook through wall posts or picture comments? For a public forum, that depending on individual privacy restriction is open to just about
anyone with an email address, the percentages of participants who speak with friends on
Facebook about weight and dieting were high. 41.2% of participants have talked about
individual weights or shapes on Facebook through wall posts or picture comments and
28.3% have talked about dieting on Facebook through wall posts or picture comments.
c. Dissatisfaction/Inadequacy (N=145)
i. Are you dissatisfied with your weight in Facebook pictures?
Figure 11. Weight Dissatisfaction in Facebook Pictures

35
ii. Do you ever feel inadequate in appearance to your friends on Facebook when looking at their pictures?
Figure 12. Feeling Inadequate Based on Appearance Comparison to Friends
33.8% of participants are somewhat dissatisfied with their weight in Facebook photos and
4.8% are very dissatisfied. In addition, 26.2% feel in adequate in appearance in
comparison to their friends on Facebook frequently or always. Both of these questions
highlighted the high levels of body dissatisfaction found in relation to Facebook both
based in comparisons and self-evaluation. Although these results could simply show a
high level of body dissatisfaction in general and not unique to social media, in the context

36
of the fact that individuals are making comparisons on Facebook and have limitless
opportunities to do so, they become more worrisome.
d. Belief in Impact
i. Do you believe Facebook can impact a female’s body image and self-esteem?
Over 75% of the sample endorsed the belief that Facebook impacts a female’s body
image and self-esteem frequently or always. In debriefing participants regarding the true
nature of this study, experimenters had many conversations about personal experiences or
knowledge friends who were impacted negatively by comments or photos on Facebook.
Participants were enthusiastic to share their frustrations regarding the issue.
Figure 13. Belief that Facebook can Impact Body Image and Eating Behavior

37
CHAPTER IV
DISCUSSION
Implications
Many of the results presented simply help to give a descriptive overview of
typical Facebook behavior in relation to social comparison and body image. These results
provide a framework for future research directions and a better understanding of how
Facebook is being utilized within a population that presents with significantly greater
numbers of eating pathology (Hudson et al., 2007).
Some of the specific results from the descriptive analysis warrant further
discussion with regards to the aims of this study. In examining social-media based social
comparisons, we found that 87.8% of participants were comparing themselves to others
on Facebook and that 46.3% of these comparisons were based on attractiveness as well as
another 15.6% based on accomplishment and success. Under the premise of the current
study, this is worrisome behavior in a population already at high-risk for eating
disordered behavior. Young females are not only comparing themselves to those they see
in person and in the media, but now have thousands of profiles at their disposal to
compare themselves to. One in seven individuals globally use Facebook, meaning that
when young women play the “comparison game”, there will always be someone skinnier,
prettier, more successful, farther in life, and so on (Smith, 2012). As relayed in the
introduction of this paper, even comparison to success levels contributes to increased
body dissatisfaction and restrictive eating attitudes (Smith et al., 2013).

38
Results regarding friendships and communication on Facebook about eating and
shape-related subject matter further highlight the potential negative impact of social
media on body image and eating behavior. 41.2% of participants had spoken on
Facebook with friends about weight or shape and 28.3% had discussed dieting. This talk
was not conducted through private messaging but was publicly conducted through wall
posts or photo comments. Because there is not currently data to compare these findings
to, we cannot establish the significance of these results. What can be concluded is that
college-aged females are using Facebook to communicate about these topics. The written
communication paired with the ability to upload photos on Facebook potentially has more
of an impact on body image than text communication alone. Moreover, these are not
private conversations between two individuals. They are accessible to most anyone
within the individuals’ friend group. Meaning that, a comment about going on a juice
detox that was made to one friend suddenly appears on the newsfeeds of 500 others.
Further research is needed to determine the frequency and nature of this communication
along with its impact-power related to other forms of communication.
Complicating the results regarding communication, 82.8% of the sample is friends
with someone on Facebook who they know or suspect to have an eating disorder. While
this statistic may not be problematic for healthy young women, for individuals who have
struggled with body image, eating, or even those in recovery, Facebook may become just
another magazine with stick-thin models or stories of weight loss. The difference is, these
individuals are friends rather than unknown models or famous actresses. Facebook
features such as “Timeline” provide a “history” of an individual’s image- including shape
and size. While some family members may appreciate this feature to see how much little

39
Jenny has grown, as an example an individual who struggles with eating disordered
behavior may hate the fact that she has gained weight from being sent to treatment and it
shows in her Facebook photos. In another hypothetical scenario, an individual may
subconsciously witness the continued progression of weight loss of a friend, potentially
triggering her own insecurities.
Another important consideration related to friends on Facebook is people from
treatment staying in touch, posting pictures, making group, and even venting about
treatment protocol. While at times this can provide support and empathy, a necessary
future direction will be to assess the potential negativity of these interactions.
Specifically, individuals may be triggered by each other’s relapse, noted weight
differences, or perceived state of recovery. This study did not assess this topic but it will
be an important direction for future investigation.
The group comparisons conducted in this study represent a very surface level look
into an area of research demanding further attention. In contrast to original hypotheses,
high-low risk group membership did not have a significant impact on the post-exposure
comparison measure even with the inclusion of a covariate measuring pre-exposure
tendencies. This may be explained by the brief exposure time, the non-interactive nature
of the mock Facebook pages, and the wider criteria utilized to form a sufficient high-risk
group. The hypothesis regarding post-exposure change was confirmed, individuals in the
high-risk category, or those who endorsed more eating disordered beliefs and behaviors,
endorsed a significantly higher interest in changes to their diet and exercise after viewing
the pages as well as a higher number of items they would change. This supports and
contributes to the findings of Smith et al. 2013, although bulimic symptoms were not
40
directly measured, our results show that comparison to Facebook pages leads to action-
oriented cognitions and behaviors in this population. For some individuals, these action
items may be positive and healthy, such as an interest in getting more exercise or trying a
new recipe posted on someone’s Facebook page, but for those at high-risk for eating
disordered behavior these changes may involve an increase in symptoms or behavior that
maintains the eating disorder such as dieting.
It is important to note that this study does not propose to denounce Facebook or
social media as inherently negative. The attempt is to explore and highlight the potential
risks and consequences for individuals with eating disorder or those in a high-risk
category. Clearly, banning the use of social media among this at risk population is both
unfounded and irrational. However, there are implications on individual, prevention, and
treatment levels from the conclusions of this study. On an individual level, this study
shows the potentially negative impact of Facebook use. Individuals can be more aware
moving forward to consciously attempt to stop themselves from making comparisons to
others, to try to utilize Facebook for more productive means, and to be aware that what
they post may be influencing the life of someone else in a negative way. As a whole, we
can influence the information posted on Facebook to a positive end by avoiding “fat
talk”, bullying, and critical commentary. Even on an individual level, both this awareness
and behavior moving forward may aid in prevention.
Treatment centers and professionals should be cognizant of these behaviors and
the impact of social media on body dissatisfaction and eating disordered variables.
Treatment centers may want to prohibit the use of Facebook in a residential setting and
ask residents to be aware of what they share in this public forum. Providers can also

41
encourage and discuss positive use of Facebook and the avoidance of maladaptive
behaviors. Finally, just as treatment professionals encourage those attempting recovery to
get rid of old clothes that may no longer fit, the scale in the bathroom, or the relationships
that are detrimental to recovery efforts- it may be useful to delete old photos on Facebook
representing certain periods of health and weight status.
Limitations
There are a few limitations to note present in this study. As previously stated,
because this a very new area of research novel measures were utilized. With continued
work in this subject area, it is hoped that these measures will be validated and others
created. Along with this, the relative lack of information on this topic required a very
broad descriptive study to provide a basis for future work. It is our hope that this will
open the door to a limitless set of questions regarding this relationship.
A second limitation of note was the exposure time and stimuli used. Participants
viewed a total of 8 pages each and because they only needed to answer simple questions
regarding the page, exposure times ranged depending on how fast questions were
interpreted and answered. Furthermore, the pages were non-interactive which is not very
representative of real Facebook usage where individuals can click through hundreds of
images and links. The controlled nature of exposure stimuli allowed us to ensure the
presentation of body-related text and images and although in some ways it was beneficial
to provide stimuli rather than measure individuals based on their personal Facebook use,
it will be necessary to develop a more realistic way of assessing comparison.

42
Finally, the study did not assess the differences between Facebook-based
comparisons and comparisons made outside of this context. This will be an important
future direction of study.
Future Directions
As mentioned in the limitations section of this study, it will be important moving
forward to examine the comparisons and negative social evaluation made on Facebook to
those from other contexts. The impacts of comparisons made through social-media may
be more impactful and powerful than those from non-social media sources such as
magazines or movies. Because of the assumed more intimate connection an individual
has with a “friend” on Facebook versus a model in a magazine, these social evaluations
and comparisons may have more value to the individual making them. It will be
interesting to see if the comparisons through Facebook are unique in relation to those
outside of social media.
A second area of interest is the further investigation of Facebook behaviors in
those who purposefully seek negative social evaluation and feedback. Because of the
convenience and large number of sources Facebook provides for feedback and
comparison, its use may be an especially risky activity for those prone to seeking that
negative appraisal. Furthermore, it will be necessary to look at how and to what end these
individuals interpret the negative feedback. For example, is this group using Facebook to
search out negative feedback to motivate starvation habits or searching out individuals
skinnier than themselves to inspire weight loss. There are many possibilities here for
future research directions.

43
Finally, this study looked at the comparison between a high-risk and low-risk
group but not the differences between a clinical and nonclinical population. Because our
criteria was widened to provide a sufficient sample size in the high-risk category,
comparisons between clinical and normal samples may show greater significance in their
differences.
Conclusions
In conclusion, this study provides preliminary examination of the relationship
between Facebook and body image as well as a general picture of Facebook use among a
population at risk for eating pathology. The conclusions add to the literature that social
media can negatively influence mental health and points to the need for future attention to
eating disorder related variables specifically because of the large number of opportunities
for social comparison and evaluation on Facebook. Results suggest implications on
multiple levels to target potentially negative use of Facebook and create an awareness of
the consequences of these behaviors.

44
APPENDIX
EATING QUESTIONNAIRE

45
46

47

48

49
Pre-Exposure Measure

50

51
Post-Exposure Measure

52

53
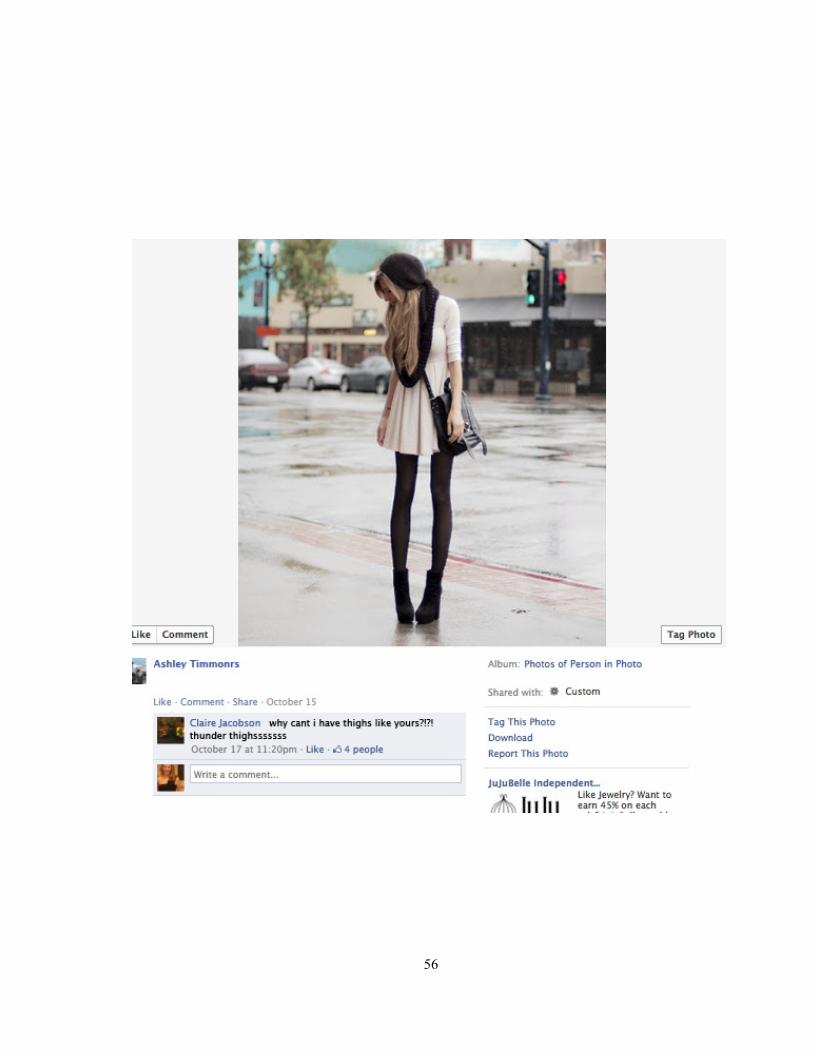
Mock Facebook Page Examples
Example 1 portrays images from athletic/muscular condition paired with competitive language.

54

55
Example 2 portrays images from the underweight condition with negative language.
56
57
REFERENCES
Baumeister, R. F. and Vohs, K. D. (2003). Self-regulation and the executive function of the self. In M. R. Leary & J.P. Tangney (Eds.), Handbook of self and identity (pp. 197−217). New York: Guilford Press.
Beglin, S. and Fairburn, C. G. (2008). Eating Disorder Examination Questionnaire 6.0.
Appendix in Fairburn, C.G. Cognitive Behavior Therapy and Eating Disorders. New York: Guilford Press.
Borzekowski, D. L. G., Schenk, S., Wilson, J. L., and Peebles, R. (2010). e-ana and e-
mia: A content analysis of pro-eating disorder web sites. American Journal of Public Health, 100(8), 1526-34.
Carter, J. C., Stewart, D. A., and Fairburn, C. G. (2001). Eating disorder examination
questionnaire: Norms for young adolescent girls. Behaviour Research and Therapy, 39(5), 625-632.
Christakis, N. A., and Fowler, J. H. (2007). The spread of obesity in a large social
network over 32 years. The New England Journal of Medicine, 357 (4), 370-9. Cohen, J. (1988). Statistical power analysis for the behavioral sciences (2nd ed.).
Hillsdale, NJ: Erlbaum. Cooper, M. J. and Fairburn, C. G. (1992). Selective processing of eating, weight and
shape related words in patients with eating disorders and dieters. Br J Clin Psychol; 31 : 363–365.
Faunce, G. J. (2002). Eating disorders and attentional bias: A Review. Eat Disord;
10:125–139. Fairburn, C.G. and Beglin,S.J. (1994). Assessment of eating disorders: interview or self-
report questionnaire? International Journal of Eating Disorders 16, 363–370. Fairburn, C.G. and Cooper, Z. (1993) .The eating disorder examination. In: Fairburn,
C.G. and Wilson, G.T. (Eds.), Binge Eating: Nature, Assessment and Treatment, 12th ed. New York: Guilford Press.
Forest, A.L., and Wood, J.V. (2012). When social networking is not working: individuals
with low self-esteem recognize but do not reap the benefits of self-disclosure on Facebook. Psychological Science 23, 295–302.
Grabe, S., Ward, L. M., and Hyde, J. S. (2008). The role of the media in body image
concerns among women: A meta-analysis of experimental and correlational studies. Psychological Bulletin, 134(3), 460-476.
58
Garner, D.M., Olmsted, M.P., and Polivy,J.,1983. Development and validation of a
multidimensional eating disorder inventory. International Journal of Eating Disorders, 2,15–34.
Gilbert, N., & Meyer, C. (2004). Similarity in young women's eating attitudes: Self-
selected versus artificially constructed groups. International Journal of Eating Disorders, 36 (2), 213-219.
Grisset, N.I. and Norvell, N.K. (1992). Perceived social support, social skills, and quality
of relationships in bulimic women. Journal of Consulting and Clinical Psychology 60,293–299.
Groesz, L.M., Levine, M.P., and Murnen, S.K. (2002). The effect of experimental
presentation of thin media images on body satisfaction: A meta-analytic review. International Journal of Eating Disorders, 31, 1–16.
Harris, P.A., Taylor, R., Thielke, R., Payne, J., Gonzalez, N., and Conde, J. G. (2009).
Research electronic data capture (REDCap) - A metadata-driven methodology and workflow process for providing translational research informatics support, J Biomed Inform. Apr;42(2):377-81
Hartmann, A., Zeeck, A. and Barrett, M. S. (2010). Interpersonal problems in eating
disorders. International. Journal of Eating Disorders, 43: 619–627. Hinrichsen, H., Wright, F., Waller, G., and Meyer,C. (2003). Social anxiety and coping
strategies in the eating disorders, Eating Behaviors, 4 (2): 117-126. Hopwood, C.J., Clarke,A.N., and Perez,M. (2007). Patho plasticity of bulimic features
and interpersonal problems. International Journal of Eating Disorders. 40, 652–658.
Hudson, J. I. , Hiripi, E., Pope, H. G. and Kessler, R. C. (2007). The prevalence and
correlates of eating disorders in the National Comorbidity Survey Replication. Biological Psychiatry. 61: 348-58.
Joiner Jr.,T.E. (1997). Self-verification and bulimic symptoms: do bulimic women play a
role in perpetuating their own dissatisfaction and symptoms? International Journal of Eating Disorders. 26,145–151.
Joiner, T., Alfano, M., and Metalsky, G. (1992).When depression breeds contempt:
reassurance seeking, self-esteem, and rejection of depressed college students by their roommates. Journal of Abnormal Psychology, 101,165–173.

59
Krones, P.G., Stice, E., Batres, C., and Orjada, K. (2005). In vivo social comparison to a thin-ideal peer promotes body dissatisfaction: a randomized experiment. International Journal of Eating Disorders, 38, 134–142.
Lampard, A.M., Byrne, S.M., and McLean, N. (2011). Does self-esteem mediate the
relationship between interpersonal problems and symptoms of disordered eating? European Eating Disorders Review, 19, 454–458.
Li, N.P., Smith, A.R., Griskevicius, V., Cason, M.J., and Bryan, A. (2010). Intrasexual competition and eating restriction in heterosexual and homosexual individuals. Evolution
and Human Behaviour, 31,365–372. Lee, M. and Shafran, R. (2004). Information processing biases in eating disorders.
Clinical Psychology Review, 24:215–238. Luce, K. H., and Crowther, J. H. (1999). The reliability of the Eating Disorder
Examination—Self-report questionnaire version (EDE-Q). International Journal of Eating Disorders, 25(3), 349-351.
Luce, K. H., Crowther, J. H., and Pole, M. (2008). Eating disorder examination
questionnaire (EDE-Q): Norms for undergraduate women. International Journal of Eating Disorders, 41(3), 273-276.
Mond, J.M., Hay, P.J., Rodgers, B. and Owen, C. (2006). Eating Disorder Examination
Questionnaire (EDE-Q): Norms for young adult women. Behaviour Research and Therapy, 44(1), 53-62.
National Association of Anorexia Nervosa and Associated Disorders. (2012). Eating
Disorder Statistics. Available from: /http://www.anad.org/get-information/about-eating-disorders/eating-disorders-statistics/S.
Paxton, S. J., Schutz, H. K., Wertheim, E. H., and Muir, S. L. (1999). Friendship clique
and peer influences on body image concerns, dietary restraint, extreme weight-loss behaviors, and binge eating in adolescent girls. The Journal of Abnormal Psychology, 108(2), 255-266.
Peterson, C.B. and Mitchell, J.E. (2005). Self report measures. In J. E. Mitchell & C. B.
Peterson (eds.), Assessment of eating disorders (pp. 120-128). New York: Guilford Press
Rieger, E., Van Buren, D. J., Bishop, M., Tanofsky-Kraff, M., Welch, R., and Wilfley, D.
E. (2010). An eating disorder-specific model of interpersonal psychotherapy (IPT-ED): Causal pathways and treatment implications. Clinical Psychology Review, 30(4), 400-410.

60
Sharpe, H., Musiat, P., Knapton, O., and Schmidt, U. (2011). Pro-eating disorder websites: Facts, fictions and fixes. Journal of Public Mental Health, 10(1), 34-44.
Smith, E., and Rieger, E. (2010). An investigation of the effect of body dissatisfaction on
selective attention toward negative shape and weight-related information. International Journal of Eating Disorders, 43(4), 358-364.
Smith, A. (2012). Facebook reaches one billion users. CNNMoney. Available from
/http://money.cnn.com/2012/10/04/technology/facebook-billion-users/index.html?hpt=hp_t3S.
Smith, A. R., Hames, J. L., and Joiner, T. E. (2013). Status update: Maladaptive
Facebook usage predicts increases in body dissatisfaction and bulimic symptoms. Journal of Affective Disorders.
Stevens, J. P. (2009). Applied multivariate statistics for the social sciences (5th ed.). New
York, NY, US: Routledge/Taylor & Francis Group, New York, NY. Tanofsky-Kraff, M., Wilfley, D.E., and Spurrell, E. (2000). Impact of interpersonal and ego related stress on restrained eaters. International Journal of Eating Disorders 27, 411–
418. Tesser, A. (2003). Self-evaluation. In M. R. Leary, & J. P. Tangney (Eds.), Handbook of
self and identity (pp. 275−290). New York: Guilford Press. Tiggemann, M., & McGill, B. (2004). The role of social comparison in the effect of
magazine advertisements on women’s mood and body dissatisfaction. Journal of Social and Clinical Psychology, 23, 23–44.
Thompson, J. K., Coovert, M., Richards, K. J., Johnson, S., and Cattarin, J. (1995).
Development of body image, eating disturbance, and general psychological functioning in female adolescents: Covariance structural modeling and longitudinal investigation. International Journal of Eating Disorders, 18, 221-236.
Thompson, J. K., Coovert, M. D., and Stormer, S. M. (1999). Body image, social
comparison, and eating disturbance: A covariance structure modeling investigation. International Journal of Eating Disorders, 26(1), 43-51.
Urbaniak, G. C., and Plous, S. (2011). Research Randomizer (Version 3.0) [Computer
software]. Retrieved on March 20, 2012, from http://www.randomizer.org/ Vitousek, K.B., Hollon, S.D. (1990).The investigation of schematic content and
processing in eating disorders. Cognitive Ther Res.14: 191–214.

61
Wilfley, D. E., Stein, R., and Welch, R. (2003). Interpersonal psychotherapy. In J. Treasure, U. Schmidt & E. van Furth (Eds.), Handbook of eating disorders (pp. 253−270)., 2nd ed. Chichester: John Wiley.
Wood, J. V., and Wilson, A. E. (2003). How important is social comparison? In M. R.
Leary & J.P. Tangney (Eds.), Handbook of self and identity (pp. 344−366). New York: Guilford Press