Embed Size (px)
Citation preview

Brigham Young University Brigham Young University
BYU ScholarsArchive BYU ScholarsArchive
Theses and Dissertations
2016-07-01
The Impact of Shortening a Long Survey on Response Rate and The Impact of Shortening a Long Survey on Response Rate and
Response Quality Response Quality
Daniel Stephen Allen Brigham Young University
Follow this and additional works at: https://scholarsarchive.byu.edu/etd
BYU ScholarsArchive Citation BYU ScholarsArchive Citation Allen, Daniel Stephen, "The Impact of Shortening a Long Survey on Response Rate and Response Quality" (2016). Theses and Dissertations. 5968. https://scholarsarchive.byu.edu/etd/5968
This Dissertation is brought to you for free and open access by BYU ScholarsArchive. It has been accepted for inclusion in Theses and Dissertations by an authorized administrator of BYU ScholarsArchive. For more information, please contact [email protected], [email protected].

The Impact of Shortening a Long Survey on Response
Rate and Response Quality
Daniel Stephen Allen
A dissertation submitted to the faculty of Brigham Young University
in partial fulfillment of the requirements for the degree of
Doctor of Philosophy
Richard R Sudweeks, Chair Lane Fischer Ross Larsen
Joseph A. Olsen Danny R. Olsen
Educational Inquiry, Measurement, and Evaluation
Brigham Young University
July 2016
Copyright © 2016 Daniel Stephen Allen
All Rights Reserved

ABSTRACT
The Impact of Shortening a Long Survey on Response Rate and Response Quality
Daniel Stephen Allen
Educational Inquiry, Measurement, and Evaluation, BYU Doctor of Philosophy
Many factors influence the response rate of a survey or questionnaire. The BYU alumni questionnaire was initially a lengthy survey with over 200 questions. After a short version of the questionnaire was created and administered, response rates appear to have increased substantially. Male respondents appear particularly more inclined to respond to the shortened version compared to the long version. The questionnaire is examined through various statistical analyses and compared between the short and long versions. Results are presented in the context of existing research on response rates and response quality. Keywords: survey, questionnaire, short-form, response rate

iii
TABLE OF CONTENTS
ABSTRACT .................................................................................................................................... ii
TABLE OF CONTENTS ............................................................................................................... iii
LIST OF TABLES .......................................................................................................................... v
LIST OF FIGURES ....................................................................................................................... vi
Chapter 1: Introduction ................................................................................................................... 1
Purpose of the Study ................................................................................................................... 5
Research Questions ..................................................................................................................... 5
Chapter 2: Literature Review .......................................................................................................... 6
Literature Search Methods .......................................................................................................... 6
Why Shorten an IM? ................................................................................................................... 6
Response Rate ............................................................................................................................. 7
Salience ....................................................................................................................................... 8
Length.......................................................................................................................................... 9
Survey Mode and Demographics .............................................................................................. 14
Data Quality .............................................................................................................................. 15
Objections to Shortening IMs ................................................................................................... 15
Methods of Shortening IMs ...................................................................................................... 19
Chapter 3: Method ........................................................................................................................ 23
Participants ................................................................................................................................ 23
Instrument.................................................................................................................................. 24
Design........................................................................................................................................ 27
Analysis ..................................................................................................................................... 28
Chapter 4: Results ......................................................................................................................... 29
Research Question 1 .................................................................................................................. 29
Research Question 2 .................................................................................................................. 30
Research Question 3 .................................................................................................................. 34
Chapter 5: Discussion ................................................................................................................... 38
Research Question 1 .................................................................................................................. 38

iv
Research Question 2 .................................................................................................................. 41
Research Question 3 .................................................................................................................. 41
Recommendations and Conclusion ........................................................................................... 43
Recommendations for further use .......................................................................................... 43
Recommendations for further research .................................................................................. 45
Conclusion ............................................................................................................................. 46
References ..................................................................................................................................... 47

v
LIST OF TABLES
Table 1. Response Rate per Year for Male and Female Respondents ......................................... 30
Table 2. Response Rates and Completion Percent by Gender for the Paper Version of the AQ from 2009 - 2011 .............................................................................................. 31
Table 3. Response Rates and Completion Percent by Gender for the Shorter Web Version of the AQ from 2013 - 2015 ................................................................................. 31
Table 4. Cronbach’s Alpha Reliability Coefficient and the Number of Questions per Construct. .................................................................................................................. 32
Table 5. Differences in Cronbach’s Alpha Between the Short Form and Long Forms ............... 33
Table 6. Average Variance per Respondent by Construct and Year ........................................... 35
vi
LIST OF FIGURES
Figure 1. Theoretical model of interaction between questionnaire length and response rate presented by Eslick and Howell (2001). .................................................................... 10
Figure 2. Example of a construct report used to determine how best to shorten the AQ. ............ 26
Figure 3. Example of an information function used to determine the appropriate length for a short version of a construct....................................................................................... 27
Figure 4. Average variance for construct 24 across years. .......................................................... 36
Figure 5. BYU report comparing mean values between the long and short forms of the AQ. ................................................................................................................................... 39

1
Chapter 1: Introduction
The process of writing good survey or test items is long and intensive. Often teachers
and test makers find that they could use more high-quality test items. On the other hand, when a
test or survey gets too long, researchers often find that they have a harder time getting
participants to respond (Stanton, Sinar, Balzer, & Smith, 2002). In addition to low response
rates, another problem that arises when using lengthy surveys is that the quality of the data is
often not as good compared to shorter surveys (Galesic & Bosnjak, 2009; Herzog & Bachman,
1981; Maloney, Grawitch, & Barber, 2011; Stanton, et al., 2002; Stanton, Sinar, Balzer, Julian, et
al., 2002). This difference in data quality impacts both the reliability and the validity of the
survey results. Lower reliability or validity can invalidate scores or ratings produced by exams
or surveys and ultimately undermine the purpose for which research is being conducted.
Additionally, researchers find that the opportunity cost of using a particularly long instrument is
there is no time for additional questions or supplemental instruments (Beebe et al., 2010;
Maloney et al., 2011). The creation of shorter versions of lengthy scales is motivated by all these
factors.
The advantages of shorter versions include higher response rates, better data quality, and,
in some cases, the opportunity to measure additional attributes without overtaxing participants.
However, researchers should take care when shortening existing instruments. The reliability and
validity of the long version needs to be preserved or the short version will not be useful (See
Boyle, 1991; Maloney et al., 2011; Smith, McCarthy, & Anderson, 2000; Stanton, et al., 2002 for
discussion of the strengths and weaknesses of different approaches). Among other things, Smith
et al. (2000) emphasize that removing items from a test can result in a narrowing of the construct
being assessed. Clearly one must take care when shortening an existing instrument of

2
measurement (hereafter I use the abbreviation IM to refer generally to any exam, survey,
assessment, or similar instrument) because shortening can lead to less fidelity in measurement or
even a shifting of the construct altogether.
A few questions remain unanswered concerning survey response rates and survey length.
Beebe et al. (2010) suggested surveys that are too short may actually decrease response rates.
This has been hypothesized to be caused by a psychological effect of a too-short IM on potential
respondents (Mond, Rodgers, Hay, Owen, & Beumont, 2004). Perhaps when IMs are too short,
potential respondents feel the IM must be less important compared to a longer IM.
There is also some evidence that longer IMs can lead to greater amounts of missing data
on individual questions, decreased variability in answers to grid-based questions, shorter
responses to open-ended questions, and shorter response times (Galesic & Bosnjak, 2009;
Herzog & Bachman, 1981). These are threats to validity that further motivate the creation of
shorter versions of IMs. Maloney et al. (2011) also point out that in applied settings, longer IMs
come with an opportunity cost of potentially not measuring other important variables. Also, in
applied fields, such as with medical health-related quality of life (QoL) IMs, respondent time is a
greater consideration than it might be in research-only settings as participants in these situations
are often in some discomfort. IMs originally developed in a research setting often could be
better utilized after they are shortened for use in an applied setting. Of course, in all cases it is
important to ensure that the shortening of an IM doesn’t undermine the reliability or validity of
the IM.
An existing set of data from the Brigham Young University Alumni questionnaire (AQ)
provides an opportunity to examine the effects of shortening at the higher range of survey length.

3
Additionally, it provides an opportunity to compare response rates across survey mode by gender
and other demographic groupings.
Since 2001, Brigham Young University has distributed the Alumni Questionnaire Survey
(AQ) each fall to alumni who are three years post-graduation. This survey is designed to
measure (a) how graduates from BYU are doing on selected outcomes derived from the
institution’s objectives and aims (spiritually strengthening, intellectually enlarging, character
building, and promoting lifelong learning and service); (b) the perceived impact of BYU
experiences on student achievement of the four AIMS; (c) activities and experiences alumni are
engaged in subsequent to graduation; and (d) alumni attitudes towards their BYU educational
experience in general and at the department level.
Beginning in 2009, there were several concerns about the state of the AQ. The first was
the ongoing need to maintain a reasonable response rate. Response rates in its first four years
averaged around 40%. In 2005 the rate began to decline until 2008 when it dipped considerably
to 27%.
In order to address this concern, a plan was developed to reverse the trend. The first thing
was to start to move the survey to the web. This was done in small steps over several years. The
first step took place in 2009, as an online version of the survey was provided as a third wave
reminder to all non-respondents in 2009. This practice was used in 2010 and 2011 as well. After
finding that the web response rates were just as high as or higher than the paper version, it was
determined in 2012 to drop the paper version all together and use only the web version for all
waves. A second thing that reversed the drop in response rates was to add an incentive of an iPad
drawing for all of those who completed the survey. This alone added about a 10% increase in
responses. Finally, as presented in this report, a third thing was to reduce the number of items in

4
each construct in order to reduce the overall time it took to take the survey. A combination of
these three things helped bring the response rate back to pre-2004 levels.
A second problem that was recognized in the AQ, which is highly correlated with
reduced response rates (Beebe et al., 2010), was the sheer size of the paper survey (14 pages; 268
items) and the length of time it took to complete. An analysis of the 2011 online version of the
survey showed that it took a respondent on average anywhere from 39 minutes (Form A) to 60
minutes (Form B) to complete the survey. The average time to take the paper version of the AQ
was estimated to be longer.
There are several reasons why the BYU administration wanted to create a shorter form of
the AQ. First, it was hoped that shortening the AQ from its current size of over 250 questions
would lead to higher response rates. Second, the university was interested in modernizing the
AQ by making it available in a web-based format. As the full-size AQ would be unwieldy in
comparison to other web-based surveys, developing a much shorter form of the AQ was seen as
an important first step towards putting the AQ online. Additionally, putting the AQ online
would save on costs to distribute or customize the AQ. For instance, BYU was interested in
extending greater flexibility for individual colleges and departments to ask specific outcome
questions of their own graduates. Putting the AQ online allows this flexibility without the
prohibitive cost that would result from printing potentially hundreds of versions of the paper
form of the AQ. The reduced size of the AQ would make these college and departmental
additions more practical.

5
Purpose of the Study
The purpose of this study is to assess the effects of shortening a lengthy, follow-up
alumni questionnaire on the response rate and psychometric properties of the different constructs
assessed by the instrument.
Research Questions
1. How will the shortening and online administration of the AQ impact the response
rate?
2. How will the reliability of the AQ differ between the long paper and short web
versions?
3. How will response quality differ between the long paper and short web versions of
the AQ?

6
Chapter 2: Literature Review
Literature Search Methods
I searched the following six EBSCO databases: ERIC, PsycBOOKS, PsycCRITIQUES,
PsycEXTRA, Psychology and Behavioral Sciences Collection, PsycINFO. Searches were made
using the terms item AND reduction, item AND removal, test AND reduction, test AND
shortening, survey AND reduction, survey AND shortening, and short-form. A total of 48
relevant articles were collected—including 9 articles directly discussing the effects and/or
methodology of shortening a test or survey and 39 articles that utilized some method to shorten
and subsequently validate a short form of an existing instrument.
Only articles related to the theory and methodology of shortening instruments, or the
shortening of existing surveys, tests, or questionnaires were included in this review. Articles that
discussed the development of new surveys, tests, or questionnaires were excluded.
Why Shorten an IM?
There are several reasons why a shorter version of an IM might be desirable. First, in
most studies reported in the literature, shorter IMs have higher rates of response. Increasing the
response rate is often a concern in survey research because low response rates might not provide
an adequate sample of the population being studied. Second, shorter versions of IMs typically
have better response quality. Longer IMs have higher unit nonresponse and less variability in
answers to questions in the later portions of the IM (Galesic & Bosnjak, 2009; Herzog &
Bachman, 1981). Additionally, some research dealing with online surveys suggests that the time
participants take to respond to individual questions becomes shorter and shorter as the survey
goes on. All of these situations present threats to the validity of the results of an IM which might
be mitigated through the use of a shorter version.

7
Response Rate
A high response rate is generally desirable in survey research because lower response
rates increase concerns of whether the population was adequately sampled (Dirmaier, Harfst,
Koch, & Schulz, 2007). Additionally, nonresponse bias typically becomes a greater concern
when a survey has low response rates. Nonresponse bias refers to a situation where those who
did not respond to a survey may differ in relevant ways from those who did respond to the
survey. Recent research may indicate that the relationship between response rate and
nonresponse bias (and, indeed, overall survey quality) is not always as strong as has been
traditionally supposed (Groves, 2006; Langer, 2003). For example, sometimes surveys with
lower response rates have shown less bias than more expensive surveys with higher response
rates (Langer, 2003). This suggests that it may not always be advisable to spend money and
resources to achieve higher response rates because the increase in data accuracy may not always
be worth the extra resources. Therefore, while response rates are often a good, quick indicator of
survey quality, they do not tell the whole story of survey quality. Careful researchers should
seek to increase response rates economically, recognizing that high response rates are not
necessarily a guarantee that an IM will be free of bias. In cases where bias due to nonresponse is
of particular concern, a direct study of that bias is preferred over simply pouring resources into
increasing response rates.
There is evidence suggesting that response rates are declining over time generally (Beebe
et al., 2010; Curtin, Presser, & Singer, 2005). Some research indicates that the rate of decline in
response rate may not be equal across different survey media or for urban versus rural groups of
respondents (Steeh, Kirgis, Cannon, & DeWitt, 2001). Beebe et al. (2010) suggest that one
potential reason for this decrease in response rate is that as life becomes busier for potential

8
respondents, the perceived opportunity cost (Groves, Singer, & Corning, 2000) of responding to
a survey becomes greater. In any case, a general decline in response rate serves as an additional
motivation for a researcher to shorten an IM or to use other means to ensure an adequate
response rate despite these recent trends.
There are many different factors which might influence response rates in a survey and, as
pointed out by Groves et al. (2000), different survey respondents may vary in the degree to
which different factors influence their likelihood to respond. For example, some survey
respondents might be more likely to respond to a survey when it is sponsored by an organization
or group to which they belong. This is referred to as the effect of topic salience. In general,
topic salience, survey length, and survey mode interact with participant demographics to produce
various response rates.
Salience
In general, people are more likely to respond when the topic of a survey is interesting,
relevant, or salient in some other way (Edwards et al., 2009; Marcus, Bosnjak, Linder,
Pilischenko, & Schütz, 2007). In many cases, researchers are not entirely in control of the
content and/or salience of the surveys they employ. Nor would a researcher necessarily want to
promote a survey only to people for whom the topic is salient. Rather, researchers will attempt
to compensate for the low response rates due to low topic salience by using monetary or non-
monetary incentives.
In some cases, a survey is likely to be somewhat salient to the entire target population.
For example, when a company, school, or other institution sends out a survey to employees,
students, or people otherwise affiliated with the institution, the survey is likely to be salient in
some way to the participants. In these cases, incentives could have a stronger effect on response

9
rates than if the topic were less salient (Marcus et al., 2007). On the other hand, incentives may
be more necessary in situations where the topic is less salient.
Some early research on web-based survey response rates indicates that while topic
salience increases response rates, very salient topics may actually decrease response rates (Cook,
Heath, & Thompson, 2000). This finding, while interesting, has not been replicated to date. It is
possible there are other underlying factors which would account for the difference in response
rates (Marcus et al., 2007).
Length
Yammarino et al. (1991) examined the literature on increasing response rates in mailed
surveys. They found that response rates were reduced by 7.8% when using a survey greater than
four pages. However, it is unclear what the difference in response rate would be at a different
cutoff. For example, perhaps the response rates would be even higher for a two-page survey
compared to surveys with 3 or more pages.
Eslick and Howell (2001) hypothesized a curvilinear relationship between survey length
and response rate. According to their theory, surveys that are either too long (zone C) or too
short (zone A) will produce lower response rates and that there is an optimal range of survey
length (zone B) where response rates are highest (see Figure 1)

10
Figure 1. Theoretical model of interaction between questionnaire length and response rate presented by Eslick and Howell (2001).
In an extensive and systematic review of data from randomized controlled trials (RCT)
dealing with survey length and response rates to electronic and postal surveys, Edwards and
colleagues (2009) found that the odds ratio of responding to a shorter version compared to a
longer version of a questionnaire was 1.64 (95% CI = 1.43-1.87) for postal surveys and 1.73
(95% CI = 1.40-2.13) for electronic surveys. Data that were not from RCT were not included.
The outcome measure was simply whether the participant returned the survey. No differentiation
was made between completed or partially completed surveys. Although increases in response
rates gained through shortening are likely to vary depending on survey topics, target samples,
and the presence of other incentives and survey features (Harvey, 1987), these results strongly
support the shortening of a survey as a good general way to increase response rates. The data
used for the postal survey analysis spanned 56 separate trials conducted by various researchers

11
from 1940 to 2007. However, it should be noted that only two trials were included in the
electronic survey analysis, indicating that more research is needed on response rate increases due
to shortening electronic surveys.
Given the evidence of declining response rates over time discussed above, it may not
make sense to include such a broad sweep of studies across 67 years as Edwards et al. (2009)
have done because they may overestimate total response rates. However, as there is no reason to
suspect any interaction between survey length effects and overall declining response rates, the
data are most likely a good general estimate of response rates gained from shorter surveys. It
may be of interest for future research to see whether there has been any change over time to the
rates at which the shortening of surveys affects response rates. Indeed, it may be of some
interest to future research to consider whether the definition of “short” survey is changing over
time and how that change might impact the use of traditional IMs and data gathering.
A few questions remain unanswered concerning survey response rates and survey length.
Beebe et al. (2010) suggested that surveys which are too short may actually decrease response
rates. This has been hypothesized to be caused by a psychological effect of a too-short IM on
potential respondents (Mond et al., 2004). Perhaps when IMs are too short, potential respondents
feel the IM must be less important compared to a longer IM. Jepson, Asch, Hershey, and Ubel
(2005) surveyed physicians with a variety of surveys of different lengths. They found
significantly diminishing response rates when using surveys greater than 1000 words. It is not
clear to what extent this approximate threshold would extend to other populations—not least
because most survey researchers measure instrument length by the number of items rather than
the number of words.
12
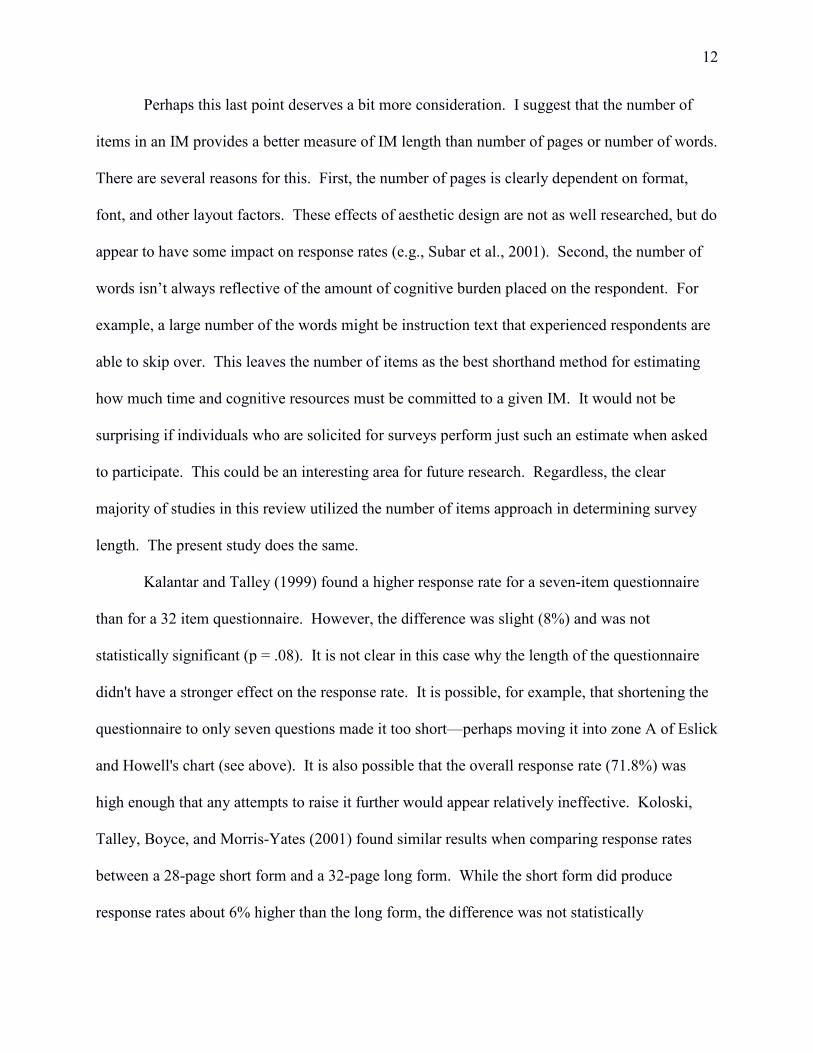
Perhaps this last point deserves a bit more consideration. I suggest that the number of
items in an IM provides a better measure of IM length than number of pages or number of words.
There are several reasons for this. First, the number of pages is clearly dependent on format,
font, and other layout factors. These effects of aesthetic design are not as well researched, but do
appear to have some impact on response rates (e.g., Subar et al., 2001). Second, the number of
words isn’t always reflective of the amount of cognitive burden placed on the respondent. For
example, a large number of the words might be instruction text that experienced respondents are
able to skip over. This leaves the number of items as the best shorthand method for estimating
how much time and cognitive resources must be committed to a given IM. It would not be
surprising if individuals who are solicited for surveys perform just such an estimate when asked
to participate. This could be an interesting area for future research. Regardless, the clear
majority of studies in this review utilized the number of items approach in determining survey
length. The present study does the same.
Kalantar and Talley (1999) found a higher response rate for a seven-item questionnaire
than for a 32 item questionnaire. However, the difference was slight (8%) and was not
statistically significant (p = .08). It is not clear in this case why the length of the questionnaire
didn't have a stronger effect on the response rate. It is possible, for example, that shortening the
questionnaire to only seven questions made it too short—perhaps moving it into zone A of Eslick
and Howell's chart (see above). It is also possible that the overall response rate (71.8%) was
high enough that any attempts to raise it further would appear relatively ineffective. Koloski,
Talley, Boyce, and Morris-Yates (2001) found similar results when comparing response rates
between a 28-page short form and a 32-page long form. While the short form did produce
response rates about 6% higher than the long form, the difference was not statistically

13
significant. In this case, the short version isn't much shorter than the long version, so it might
make sense that the difference in response rate would not be dramatic. It is possible that both the
“short” and long versions would fall into zone C of Eslick and Howell's chart. Another
possibility is that, like Kalantar and Talley's (1999) study, the overall response rate (74%) may
have produced a ceiling effect so that any attempts to increase response rates would appear
ineffective. However, it is not clear whether a drastically shorter version of the 32-page long
form would have produced even higher response rates.
There is some confusion in the literature about whether shorter surveys always increase
response rates. For example, Champion and Sear (1969) reported higher response rates to what
they called their longer survey. However, the longer survey in this case consisted of the same
number of questions as the shorter survey, but distributed across a greater number of pages.
Asch, Jedrziewski, and Christakis (1997) found a similar effect to Champion and Sear (1969)
where when the number of questions are held constant, the survey with more pages got a higher
response rate. It may be more appropriate to call this an effect of survey aesthetic design rather
than survey length. Subar et al. (2001), found no difference in response rates between a 36-page
and a 16-page version of a food frequency questionnaire (FFQ). However, it should be noted
that the 36-page version was “designed to be cognitively easier for respondents” by
incorporating Dillman’s (1978) total design method. As such, the results do not necessarily
indicate that the short version had no effect on response rates. Rather, it seems more appropriate
to state that the results indicate that the shortening effect and the effect due to implementation of
the total design method were approximately equal in this case. Or, of particular relevance to the
present study, it is possible that the 16-page version simply did not cut the questionnaire below
the upper threshold of optimal survey length (i.e., both 16-page and 36-page versions are in
14
section C of Eslick and Howell’s (2001) chart). Finally, Mond et al. (2004) present one example
of a 14-page survey receiving higher response rates than an 8-page survey. With all the different
factors that play a role in participant response rates, it is often difficult to pinpoint the extent to
which a specific factor increases response rate. However, the majority of research supports the
practice of shortening surveys in order to increase response rates.
The BYU AQ provides the opportunity to examine the effect of a drastically shorter
version (102 items compared to 203 items—a reduction of nearly 50%) on a response rate
(approximately 40%, but as low as 27%) that has room to grow. Will the short version show a
much higher response rate, or will the short version still be too long to impact response rates
significantly?
Survey Mode and Demographics
The results of research on the effect of survey mode (online vs. paper) are mixed.
Research suggests that web-based surveys produce lower response rates than paper surveys (De
Leeuw & Heer, 2002; Handwerk, Carson, & Blackwell, 2000; Kwak & Radler, 2002; Matz,
1999; McMahon et al., 2003; Underwood, Kim, & Matier, 2000). However, there are cases
where online surveys produced the same or higher (Antons, Dilla, & Fultz, 1997) response rates
compared to paper versions. Similarly, there is some evidence that men are more likely to
respond to online surveys than women (Kwak & Radler, 2002; Sax, Gilmartin, & Bryant, 2003).
One study found that men were more likely to opt for an online version of a survey when offered
the choice between an online and paper version of the same survey (Carini, Hayek, Kuh,
Kennedy, & Ouimet, 2001). However, other research has found no gender differences in
response rates for online surveys (Chatman, 2007) or that women are more likely to respond to
surveys than men regardless of survey mode (Sax et al., 2003; Wiseman, 2009).

15
In the case of the AQ, it will be of interest to determine whether response rates are higher
or lower for the online versions compared to the paper versions. Additionally, it will be of
interest to determine whether men are more likely to respond to the online version of the AQ
compared to women.
Data Quality
There is also some evidence that longer IMs can lead to greater amounts of missing data
on individual questions, decreased variability in answers to grid-based questions, shorter
responses to open-ended questions, and shorter response times (Galesic & Bosnjak, 2009;
Herzog & Bachman, 1981). These are threats to validity that further motivate the creation of
shorter versions of IMs. Maloney et al. (2011) also point out that longer IMs come with an
opportunity cost of not measuring other important variables. This is particularly true in applied
situations, such as employee surveys or medical screenings where the relationship between the
administrator of the IM and the respondents is quite different compared to much academic
research. Also, in applied fields, such as with medical health-related quality of life (QoL) IMs,
respondent time is a greater consideration than it might be in research-only settings as
participants in these situations are often in some discomfort and may need results and diagnosis
quickly. IMs originally developed in an academic research setting often could be better utilized
after they are shortened for use in an applied setting. Of course, in all cases it is important to
ensure that the shortening of an IM doesn’t undermine the reliability or validity of the IM.
Objections to Shortening IMs
Smith, McCarthy, and Anderson (2000) raise a series of objections to the development of
short forms. While the authors are not against the development of short forms altogether, they
express concerns about the methods often used in short-form development. They argue that

16
developers of short forms must establish reliability and validity independently of the original
version.
Another objection raised by Smith et al. (2000) is that developers of short forms are too
often developing shortened versions of existing IMs that aren’t fully validated themselves.
However, taken in the context of the first objection raised above, in cases where the developer of
the short form establishes validity independently of any parent IM, then the validity of the parent
IM might be considered somewhat irrelevant. However, this example presents perhaps an
unusual case that isn’t likely to occur often in practice. Therefore, it remains good general
advice not to develop a short form of an insufficiently validated IM.
Smith et al. (2000) also discuss subscales in the context of shortening an IM. Too often,
they argue, developers of short forms ignore subscales altogether and only focus on overall
scores. This is problematic in cases where subscale interpretation is still desired. For subscales,
as for entire IMs, removing items can result in a shortening of the breadth of the construct being
represented. This becomes particularly problematic in situations where items are removed
entirely based on a single index (such as item-total correlation) without any content
consideration. Therefore, developers of short forms ought to perform content-domain checks to
ensure that domains are preserved in the shortened form. Smith et al. (2000) also point out that
even in cases where it is determined that domains should be narrowed for a short form, it is far
better that this be done intentionally rather than accidentally. Researchers should also document
the extent to which domains are narrowed so that prospective users of the short form will
understand the relative strengths and weaknesses associated with the new short form.
In the case of the BYU AQ, some content reviews were conducted for individual
subscales to ensure that items were not removed based only on item-total correlation. However,

17
one limitation of these content reviews is that they were conducted primarily by testing experts
and survey administrators rather than subject matter experts (SMEs) specific to each subject area.
Another concern is that developers of short forms will take data from an existing sample
of the original form, use that data to estimate the correlation of a proposed short form, and then
never test that short form with a new independent sample. The problem with using a single
sample to estimate the correlation of the short form to its parent form is that it will systematically
overestimate the correlation because all of the items in the short form are also in the original IM
and will therefore be counted twice. Smith et al. (2000) propose that the best way to avoid this
mistake is for short form developers to administer both short and long versions to the exact same
group of participants. Note, however, that administering both forms to the exact same
participants could become extremely prohibitive in cases where existing instruments are already
quite large. In the case of the BYU AQ, this would require examinees to sit through nearly 400
items. At that point a careful researcher isn’t only concerned about saving time or money, but
about introducing new error into the data through participant fatigue.
Smith et al. (2000) also suggest that developers of short forms explicitly show the
time/resource savings relative to the loss in reliability/validity. They believe this will aid
prospective users of the short form in deciding whether the short form will really suit their needs.
Maloney et al. (2011) also discuss several reasons someone might object to the
shortening of an IM. First, reducing the number of items from an IM almost invariably reduces
the internal consistency reliability. Traditionally, developers of IMs in psychological and
educational measurement fields have favored IMs with large numbers of items. Second, there is
some concern that altering an IM can impact validity. Each of these concerns is discussed
below.
18
More items will almost always increase internal consistency reliability. This can be true
even in cases where items are not strongly related to the construct being measured. However, an
IM loaded with weak items is likely unnecessarily taxing on participants and will not necessarily
guarantee the absence of unwanted multidimensionality or other measurement error (Cortina,
1993).
Internal consistency reliability is typically measured by Cronbach’s alpha (Cronbach,
1951). It is worth pointing out that, on particularly long IMs, reducing the number of items often
does not impact reliability a great deal. One reason some researchers might be reluctant to
reduce the number of items in an IM is because, based on Classical Test Theory, they assume
that items are of equal value in providing information about the construct being measured.
Therefore, they might, through the use of the Spearman-Brown prophecy formula (see Allen &
Yen, 1979), show that reducing an IM by x number of items would result in the loss of xy
amount of reliability, where y is a constant value. However, the Spearman-Brown assumes that
all items are contributing equally. If items are removed systematically on the basis of weak
corrected item-total correlations, the Spearman-Brown will overestimate the loss of reliability.
Using Cronbach’s alpha as the primary measure of the adequacy of an IM might result in a glut
of weaker items simply to inflate the coefficient (Maloney et al., 2011).
However, it is also true that users of shortened versions of an IM should not relax their
reliability standards (Smith et al., 2000). If a given level or value of reliability would be
inadequate on a long version, then it will also be inadequate on a short version. Clearly, if the
cost of shortening an IM is that reliability gets too small, the cost is not justified. Giving away
too much reliability to create a short form would be like creating an extremely fast, but very

19
unreliable bathroom scale that could tell you your weight instantly within 100 pounds of your
actual weight.
The second concern discussed by Maloney et al. (2011) is that removing items from an
existing IM can alter the construct validity of the IM. This point has been argued by Smith and
Stanton (1998) and also by Boyle (1991). Maloney et al. (2011) disagree with this point on the
basis that “well-conceptualized measures should adequately represent all unidimensional
constructs that they are intended to assess” and “unidimensional constructs do not have items
that represent unique construct-relevant content.” However, one could argue that it is often
difficult to know when a construct is unidimensional at the conceptual level. Hastily trimming
an IM without first exploring possibilities of multiple dimensions or factors could lead to the
accidental exclusion of those constructs. In cases where there is little existing data or literature
for a scale or a given construct, reviewing the items for face validity and accuracy can
supplement and strengthen the process of shortening an IM. As mentioned above, content
reviews can help prevent unintentional narrowing or removal of constructs and are therefore
good general practice for short form developers.
Methods of Shortening IMs
There are relatively few articles directly discussing or arguing for any specific
methodology to shorten the length of an IM (Maloney et al., 2011; Muhlan, Bullinger, Power, &
Schmidt, 2008). In part, this may be because different purposes for and theoretical
underpinnings of different IMs can lead to different optimal methods and/or reasons for
shortening the IM. For example, an IM built using factor analysis might be best reduced by the
same method. An IM built for the purpose of quickly learning about a patient’s quality of life
(QoL) might have greater need of being short even at the expense of some internal consistency

20
reliability. In each case it is important to make decisions to shorten an IM based on the purposes
for and theory by which the IM was originally created. In some cases, it may even be preferable
to create a new IM rather than attempt to shorten an existing IM if the theory from which the IM
was created would not match with the purpose of the shortened version of the IM (e.g. Streiner
& Miller, 1986).
In reading the literature, I have found three main approaches to shortening IMs. Broadly,
shortening methods are rooted in Classical Test Theory (CTT), Factor Analysis (FA), or Item
Response Theory (IRT). CTT methods typically involve the use of Cronbach’s alpha coefficient
(Cronbach, 1951), a measure of internal consistency which, as discussed above, may not always
be the best indicator of whether an IM is satisfactory. Factor analytic methods involve extracting
the latent factor structure of a set of manifest variables and may or may not always make sense
with a given IM (e.g. Streiner & Miller, 1986). Similarly, methods based on IRT assume a level
of model-data fit and, when unidimensional IRT models are used, unidimensionality. The upshot
of using IRT model misfit statistics to eliminate items from an IM is that you will be removing
items based on whether they fit the particular IRT model used. Therefore, IRT methods of item
reduction would best be employed when the original IM was built using IRT or there is some
other a priori theoretical reason to expect the IM data to fit an IRT model.
Several authors (Maloney et al. 2011; Slaney & Maraun, 2008) have advocated a
framework for data-based test analysis in which a formal structure of the IM is first specified,
then tested with an appropriate mathematical model, and finally evaluated for reliability and
validity. Using this framework as a guideline, researchers can evaluate existing IMs in order to
appropriately shorten them or to realign them for a specified purpose. Maloney et al. (2011)
showed an example of shortening an IM with the data-based framework and resulted in no loss to

21
fidelity (precision, reliability) or bandwidth (complexity, multiple attributes). However, the
data-based framework is most appropriate in situations where there is extant literature and data
describing the scales and individual items in question.
A CTT approach to shortening an IM involves looking at internal consistency of the
items. Typically, items with the lowest item-total or corrected item-total correlations are
removed first. Chou et al. (2006) used a CTT-based approach to reducing the Berg Balance
Scale (BBS; Berg, Wood-Dauphinée, Williams, & Gayton, 1989) by rank-ordering the items by
corrected item-total correlation, rank-ordering the items by effect size, and then adding the two
rank orders together to create an overall item index. The BBS is often used by medical
practitioners to screen stroke victims to assess risk for falling. The effect size in this case is
calculated by taking BBS scores 14 days and then 90 days after onset of stroke, subtracting the
90-day score from the 14-day score from each item, and then dividing by the standard deviation.
By adding the effect size rank order scores, the researchers are able to see which items are most
sensitive to change in a patient’s condition. This approach was first recommended by Hobart
and Thompson (2001) as a way to decrease measurement error and increase or maintain
sensitivity to change in medical questionnaires. By looking at the overall item indices, Chou et
al. (2006) decided which items to retain and which to remove. They found that they were able to
reduce the BBS from 14 to 7 items and still maintain concurrent validity with the original scale
(R = .99). They were also able to maintain the responsiveness to change of the original scale
(effect size .85) to the reduced scale (effect size .78).
Several studies have compared CTT and Rasch IRT approaches. Nijsten, Unaeze, and
Stern (2005) developed a short version of the Impact of Psoriasis Questionnaire (IPSO) using
both CTT and Rasch IRT. While both methods produced acceptable shorter forms which

22
correlated highly with both the original IPSO and each other, the authors recommend using the
IRT approach. Erhart et al. (2010) compared a CTT approach of maximizing Cronbach’s alpha
to a Rasch IRT approach using the Partial Credit Model (PCM) item-fit indices. They
concluded that each approach had strengths and weaknesses and that either approach should be
supplemented by additional analyses.
In some cases, researchers have used data from factor analysis to inform decisions on
which items to remove from a test (e.g. Baardewijk et al., 2010; Cheung et al., 2004). In these
cases, the basic approach is to eliminate items which have the weakest factor loadings on their
relevant subscale. In the case of Baardewijk et al., items were also excluded if they loaded
strongly (>.30) on more than one subscale.

23
Chapter 3: Method
There are a number of questions of interest with regard to the short version of the AQ.
First, how do the response rates differ across the three different forms of the questionnaire that
were administered? A related question of interest is whether there will be any demographic
interaction effects with response rates across the three versions. Will the response rate for males
increase more drastically than it will for females from the long versions to the short version?
Will the response rate among young participants increase more with the electronic short version
than it does for older participants?
Second, how will the reliability estimates differ between the three versions of the AQ?
Will there be a big drop in reliability, or will the reliability stay largely intact?
Third, how will response quality differ between the three versions? Will the shorter
version produce less variability in grid-based questions?
Participants
The data for this study are existing data collected as part of the university's annual survey
of alumni. The participants include undergraduate and graduate alumni who are 3 years post-
graduation. The researcher offered no incentives to participate in the AQ, but the university does
offer participants an entry in a drawing to win an iPad for completing the survey. Because the
data already existed, no recruitment methodology was necessary.
The dataset includes responses for 45,080 alumni. Alumni include both graduate and
undergraduate students. Responses are spread relatively evenly from 2001 to 2015. Responses
were collected from alumni cohorts graduating in the years 1998 to 2012. Slightly more than
half of participants were female (N = 23,618; 53.2%). Additional demographic data were
available for approximately half of the respondents (N = 20,209; 45.5%). Of these, nearly all
24
participants were members of The Church of Jesus Christ of Latter-day Saints (N = 20,099;
99.5%). Participants ranged in age from 26 to 94 years old, though the majority clustered around
the average age of 38 (M = 38.38, SD = 5.80). The majority of participants were Caucasian (N =
18,384; 94.9%), with the remaining participants being Black/African-American (N = 37; 0.2%),
Asian (N = 136; 0.7%, Hispanic (N = 397; 2.0%), or Pacific Islander (N = 233; 1.2%).
Instrument
The Brigham Young University Alumni Questionnaire (AQ). Since 2001, Brigham
Young University has distributed the Alumni Questionnaire Survey (AQ) each fall to alumni
who are 3 years post-graduation. This survey is designed to measure (a) how graduates from
BYU are doing on selected outcomes derived from the institution’s objectives and aims
(spiritually strengthening, intellectually enlarging, character building, and promoting lifelong
learning and service); (b) the perceived impact of BYU experiences on student achievement of
the four AIMS; (c) activities and experiences alumni are engaged in subsequent to graduation;
and (d) alumni attitudes towards their BYU educational experience in general and at the
department level.
The primary stakeholders pertaining to the AQ are the president of the university and
board of trustees. Results are reported using the Partial Credit Rasch model to indicate the levels
of endorsement of alumni on various items and subscales. Additional descriptive statistics are
also reported. Reports are used to identify potential concerns and to confirm and monitor alumni
attitudes and experiences over time.
As mentioned above, in September 2011, BYU began to investigate ways to reduce the
number of items for each of the 24 AIMS constructs without significantly decreasing reliability
or content validity. They took an approach of maximizing reliability statistics while also

25
examining items for face validity. Additionally, items difficulty estimates were calculated and
an attempt was made to retain items across a variety of difficulty levels. The total number of
items was reduced to 102 (originally 203) with an average Rasch reliability of .76 (originally
.82). Rasch reliability is analogous to Cronbach’s alpha, but provides a more conservative
estimate of reliability (Linacre, 1997). Cronbach’s alpha is discussed in chapter 2. An example
report used by BYU to determine how best to shorten a construct is included in Figure 2.
As can be seen in Figure 2, BYU stakeholders were able to compare item difficulties as
well as reliability estimates for different proposed short versions of a given construct. Two
options for a shortened version were provided for each construct, a more conservative cut that
removed fewer items and a more aggressive cut that removed more items. At the same time,
items were categorized according to a content analysis and efforts were made to retain items
from all different content areas.
An additional analysis was done to compare information functions for each of the
constructs and their respective proposed cuts. Information functions are based in Item Response
Theory. Information is analogous to reliability in Classical Test Theory (CTT) except that
information is allowed to vary across different levels of ability rather than being static across the
entire trait. Using information functions, the AQ administration team was able to ensure
reliability was retained across a broad range of the trait being measured for each construct. An
example of an information function is included in Figure 3.

26
Figure 2. Example of a construct report used to determine how best to shorten the AQ.
Construct: Writing SkillsContent Analysis: Item Cuts:
Presentation skill removed in 1st cutWriting skill removed in 2nd cut
not removedDifficulty Item Item Text
0.74 A Consciously control the tone and voice of what you write0.20 B Choose words that clearly and precisely communicate your ideas0.16 C Construct effective sentence patterns to communicate clearly and precisely0.01 D Develop the central idea with relevant evidence and sufficient detail when writing
-0.01 E Focus the ideas you write around a central idea -0.11 F Express your thoughts and feelings clearly and effectively in writing-0.29 G Follow standard grammar and usage conventions-0.30 H Tailor your message and approach to fit the needs of the target audience-0.41 I Present ideas in a logical order, providing transitions to help the reader
Reliability as # of items decreases
Items Rasch Alpha9 0.85 0.888 0.85 0.897 0.84 0.896 0.82 0.905 0.76 0.904 0.55 0.913 0.47 0.89
Reliability Estimates
1st c
ut
2nd
cut
0
0.1
0.2
0.3
0.4
0.5
0.6
0.7
0.8
0.9
1
9 8 7 6 5 4 3
Relia
bilit
y
# of Items
Rasch
Alpha
1st cut
2nd cut

27
Figure 3. Example of an information function used to determine the appropriate length for a short version of a construct.
Design
The sampling domain includes the entire population of alumni in a given year. In years
prior to the development of the shortened electronic version, alumni were randomly assigned to
receive either paper form A or paper form B. One year prior to the development of the electronic
short form, participants who did not respond after the first few reminders to take a paper long
form of the exam were given the option to take an electronic long form of the exam. Once the
electronic short form was developed, it was pilot tested as an alternative option for participants
0
0.5
1
1.5
2
2.5
3
-10 -9 -8 -7 -6 -5 -4 -3 -2 -1 0 1 2 3 4 5 6 7 8 9 10
Prec
isio
n of
Mea
sure
men
t
Propensity to Endorse
Construct: Writing Skills
9 items(all)
7 items
5 items

28
who did not respond to initial requests. The following year, the electronic short form became the
only survey form available to participants.
Analysis
Note that enough response data has been collected by the AQ that traditional hypothesis
testing will be unhelpful because any such tests will be overpowered. Therefore, I will primarily
calculate descriptive statistics in attempt to answer my research questions and explore the data.
My first research question is: How will the shortening and electronic conversion of the
AQ impact the response rate? I will collect these all together and also separately by gender. I
will also calculate the number of items complete and average number of items complete for these
same groups.
My second research question is: How will the reliability of the AQ differ between the
paper long and electronic short versions? I will answer this question by calculating Cronbach’s
alpha reliability estimates for each of the 24 constructs. I will do this separately for forms A and
B of the paper version as well as the short form of the AQ.
My third research question is: How will response quality differ between the versions of
the AQ? This question will be answered by measuring the variability within grid-based
questions on the AQ. Each of the 24 constructs constitutes a separate grid-based question. The
amount of variability within grid-based questions for each individual respondent will be summed
up and then averaged across the relevant forms.

29
Chapter 4: Results
Research Question 1
How will the shortening and online administration of the AQ impact the response rate?
Initially response rates were calculated separately for male and female participants for each year
the AQ was administered (see Table 1). At a high level it appears that response rates started
around 40% in 2001, but dropped sharply in 2005. Rates climbed again in 2009 back to the 40%
range, then climbed further to nearly 50% before appearing to plateau somewhere between 45%
and 48%. Females tended to have much greater response rates from 2001 all the way until 2012
when the lead dropped to 2.21%. In 2013 male respondents jumped to a nearly 50% response
rate and a lead of 2.82% greater than female respondents. Males have continued to have the
higher response rate from 2013 to the most recent administration of the AQ in 2015, though the
gap has narrowed to less than 1% in 2015.
From this high-level view, it appears that shortening the AQ may indeed have increased
response rates, especially among male respondents. To take a closer look, I combined the data
from three years prior to and after the shortening of the AQ (see Tables 2 and 3). Data from the
year 2012 were omitted because changes were made to the original piloted version of the short
form after that year. Data indicate that increases in response rate on the sort version of the AQ
are mostly due to an increase in response rate among male respondents. Female respondents’
response rates increased by less than 1%.

30
Table 1
Response Rate per Year for Male and Female Respondents
Year Female Male Total 2001 44.76% 34.28% 39.61% 2002 45.83% 36.44% 41.29% 2003 43.89% 35.54% 39.88% 2004 42.70% 34.17% 38.50% 2005 29.03% 21.49% 25.29% 2006 37.64% 27.24% 32.41% 2007 36.64% 26.77% 31.64% 2008 27.79% 22.16% 24.92% 2009 44.39% 36.49% 40.29% 2010 42.59% 34.68% 38.49% 2011 48.69% 42.23% 45.37% 2012 40.91% 38.70% 39.77% 2013 46.74% 49.56% 48.20% 2014 45.81% 48.88% 47.38% 2015 45.33% 46.22% 45.78%
The number of partial responses increased by nearly 7% overall while the mean number
of items completed decreased. Interestingly, the average percentage complete dropped by just
over 10% for female respondents and less than 5% for male respondents. There are several
possible reasons for these differences, which will be discussed further later.
Research Question 2
How will the reliability of the AQ differ between the long paper and short web versions?
As shown in Table 4, the majority of the reliability coefficients compare very well between the
long and short versions. Note that in some cases there was a difference between forms A and B
in terms of alpha and/or in terms of the number of questions. In the case of construct 21, the
difference in alpha was likely at least partially due to the difference in the number of questions
between the two forms.

31
Table 2
Response Rates and Completion Percent by Gender for the Paper Version of the AQ from 2009 – 2011 Total Males Females
AQ Responses Percent
Responding Percent
Complete Percent
Responding Percent
Complete Percent
Responding Percent
Complete Complete 25.98 100.00
22.82 100.00
29.37 100.00
Partial 15.31 47.50
14.89 42.38
15.76 52.67 Total Responding 41.29 80.67
37.71 77.41
45.13 83.59
Non-Responding 58.71 .00 62.29 .00 54.87 .00
Table 3 Response Rates and Completion Percent by Gender for the Shorter Web Version of the AQ from 2013 – 2015
Total Males Females
AQ Responses Percent
Responding Percent
Complete Percent
Responding Percent
Complete Percent
Responding Percent
Complete Complete 25.04 100.00
25.90 100.00
24.14 100.00
Partial 22.08 41.80
22.32 41.00
21.83 42.67 Total Responding 47.13 72.73
48.23 72.69
45.96 72.77
Non-Responding 52.87 .00 51.77 .00 54.04 .00

32
Table 4
Cronbach's Alpha Reliability Coefficient and the Number of Questions per Construct
Form A Form B Short Form Construct Alpha k Alpha k Alpha k 1 .94 11
.94 11
.94 8
2 .85 9
.86 10
.83 5 3 .89 6
.87 6
.84 4
4 .93 6
.93 6
.89 3 5 .78 6
.79 6
.76 3
6 .92 7
.90 7
.86 4 7 .91 6
.94 6
.91 5
8 .91 9
.91 9
.86 4 9 .87 6
.90 6
.87 4
10 .95 8
.95 8
.94 4 11 .89 6
.89 6
.85 3
12 .92 8
.92 8
.89 3 13 .89 5
.89 7
.87 4
14 .92 9
.90 9
.86 6 15 .86 6
.87 6
.86 4
16 .92 8
.92 8
.89 4 17 .85 8
.85 8
.76 5
18 .88 6
.88 6
.86 4 19 .85 8
.85 8
.75 5
20 .89 6
.89 6
.88 4 21 .85 6
.92 12
.83 5
22 .81 6
.81 6
.81 4 23 .92 8
.92 8
.84 3
24 .86 7 .85 7 .84 5 Note. Alpha = Cronbach's alpha coefficient. k = number of questions
In cases where alpha is different between form A and form B there are at least three
different ways we can compare the alphas to the short form alpha. First, we can compare the
short form alpha with the larger of the two alphas from the long forms. Second, we can compare
the short form alpha with the smaller of the two alphas from the long forms. Finally, we can take

33
an average alpha for the two long forms and compare it to the short form alpha. For
convenience, the results of these comparisons are shown in Table 5.
Table 5
Differences in Cronbach's Alpha Between the Short Form and Long Forms Construct Number Larger Difference Smaller Difference Average Difference
1 .94 .00 .94 .00 .94 .00 2 .86 .03 .85 .02 .86 .03 3 .89 .05 .87 .03 .88 .04 4 .93 .04 .93 .04 .93 .04 5 .79 .03 .78 .02 .79 .03 6 .92 .06 .90 .04 .91 .05 7 .94 .03 .91 .00 .93 .02 8 .91 .05 .91 .05 .91 .05 9 .90 .03 .87 .00 .89 .02 10 .95 .01 .95 .01 .95 .01 11 .89 .04 .89 .04 .89 .04 12 .92 .03 .92 .03 .92 .03 13 .89 .02 .89 .02 .89 .02 14 .92 .06 .90 .04 .91 .05 15 .87 .01 .86 .00 .87 .01 16 .92 .03 .92 .03 .92 .03 17 .85 .09 .85 .09 .85 .09 18 .88 .02 .88 .02 .88 .02 19 .85 .10 .85 .10 .85 .10 20 .89 .01 .89 .01 .89 .01 21 .92 .09 .85 .02 .89 .06 22 .81 .00 .81 .00 .81 .00 23 .92 .08 .92 .08 .92 .08 24 .86 .02 .85 .01 .86 .02 Note. Larger = The larger value for Cronbach's alpha between forms A and B. Difference = The difference between the specified long form alpha and the short form alpha
A few constructs look either nearly or completely unaffected in terms of alpha. For
example, constructs 1, 10, 15, 20, and 22 have a short form alpha that is always within .01 of the
original long form alpha regardless of which method is used to compare alphas. A few

34
constructs stand out as having larger differences. Constructs 17, 19, 21, and 23 exhibit the
largest differences. As mentioned above, construct 21 is a bit unique in the large difference in
the number of items between forms A and B. In this case, perhaps it makes the most sense to
look at the smaller difference, which is less concerning.
Note that while cutting a larger number of questions from a construct tended to correlate
with a larger loss of alpha (r(22) = .45, p < .03), there are examples of constructs that did not fit
this trend. Cutting three items from construct 1 resulted in virtually no difference in alpha, but
cutting the same number of questions from construct 19 resulted in a large drop. In any case it
appears that some constructs are more sensitive to dropping items than others. Not surprisingly,
constructs with larger numbers of items to begin with are able to drop more items with less
impact to alpha.
Research Question 3
How will response quality differ between the long paper and short web versions of the
AQ? This question is addressed by calculating the variation within grid-based items. In the case
of the AQ, each of the 24 constructs constitutes a separate grid-based item. In order to quantify
the variation in the responses of individual respondents across questions within each construct, a
variance was calculated for each of the 45,080 respondents for each of the 24 constructs. This
amounted to 45,080 multiplied by 24, resulting in 1,081,920 different variances. The variances
were then averaged within constructs across the years the AQ has been delivered from the year
2001 until the year 2015. This resulted in a mean variance value for each of the 24 constructs for
each of the 15 years of administration. These mean variance values can be compared across
years in order to examine whether average variance has increased in the years after the AQ was
shortened. These 360 average variance values are shown in Table 6.

35
Table 6
Average Variance per Respondent by Construct and Year Construct 2001 2002 2003 2004 2005 2006 2007 2008 2009 2010 2011 2012 2013 2014 2015
1 .38 .38 .38 .38 .37 .39 .38 .39 .38 .38 .38 .37 .40 .42 .44 2 .41 .41 .40 .41 .41 .40 .41 .40 .39 .38 .38 .35 .29 .29 .28 3 .25 .25 .24 .25 .26 .25 .26 .25 .25 .24 .24 .24 .26 .25 .25 4 .46 .45 .43 .44 .44 .44 .41 .35 .35 .37 .36 .33 .27 .26 .27 5 .47 .49 .48 .51 .50 .50 .51 .50 .50 .50 .50 .46 .42 .42 .42 6 .23 .23 .22 .23 .23 .23 .23 .23 .22 .23 .23 .22 .21 .21 .21 7 .18 .20 .19 .19 .19 .20 .20 .20 .19 .18 .19 .19 .19 .20 .20 8 .41 .42 .42 .41 .43 .43 .42 .42 .41 .41 .41 .39 .33 .34 .35 9 .31 .32 .32 .32 .32 .32 .31 .31 .31 .30 .31 .28 .24 .23 .24
10 .31 .30 .30 .30 .32 .30 .30 .28 .29 .29 .28 .26 .20 .20 .21 11 .70 .69 .71 .71 .73 .72 .70 .68 .70 .67 .69 .64 .47 .46 .45 12 .69 .71 .70 .66 .71 .70 .72 .69 .68 .68 .68 .66 .51 .54 .52 13 .45 .45 .44 .43 .46 .44 .48 .45 .45 .45 .44 .43 .45 .45 .48 14 .43 .42 .41 .43 .43 .43 .42 .39 .41 .41 .40 .40 .47 .46 .47 15 .32 .33 .31 .32 .32 .32 .33 .31 .31 .31 .31 .30 .25 .25 .24 16 .25 .25 .25 .26 .25 .25 .25 .25 .24 .23 .25 .24 .23 .23 .23 17 .45 .45 .45 .45 .46 .46 .46 .47 .47 .46 .47 .49 .54 .56 .58 18 .33 .32 .34 .34 .31 .33 .35 .34 .33 .33 .33 .33 .34 .35 .36 19 .62 .63 .62 .62 .61 .62 .62 .60 .59 .61 .59 .62 .70 .69 .72 20 .33 .35 .34 .34 .33 .36 .35 .35 .35 .35 .36 .36 .32 .34 .35 21 .53 .52 .54 .51 .52 .52 .54 .50 .49 .50 .50 .48 .43 .45 .42 22 .26 .27 .27 .29 .28 .25 .26 .23 .22 .22 .21 .19 .19 .19 .19 23 .55 .53 .54 .55 .55 .55 .58 .54 .55 .54 .53 .53 .53 .54 .53 24 .97 .93 .95 .95 .97 .93 .95 .99 .94 .96 .97 .97 .68 .69 .68
36
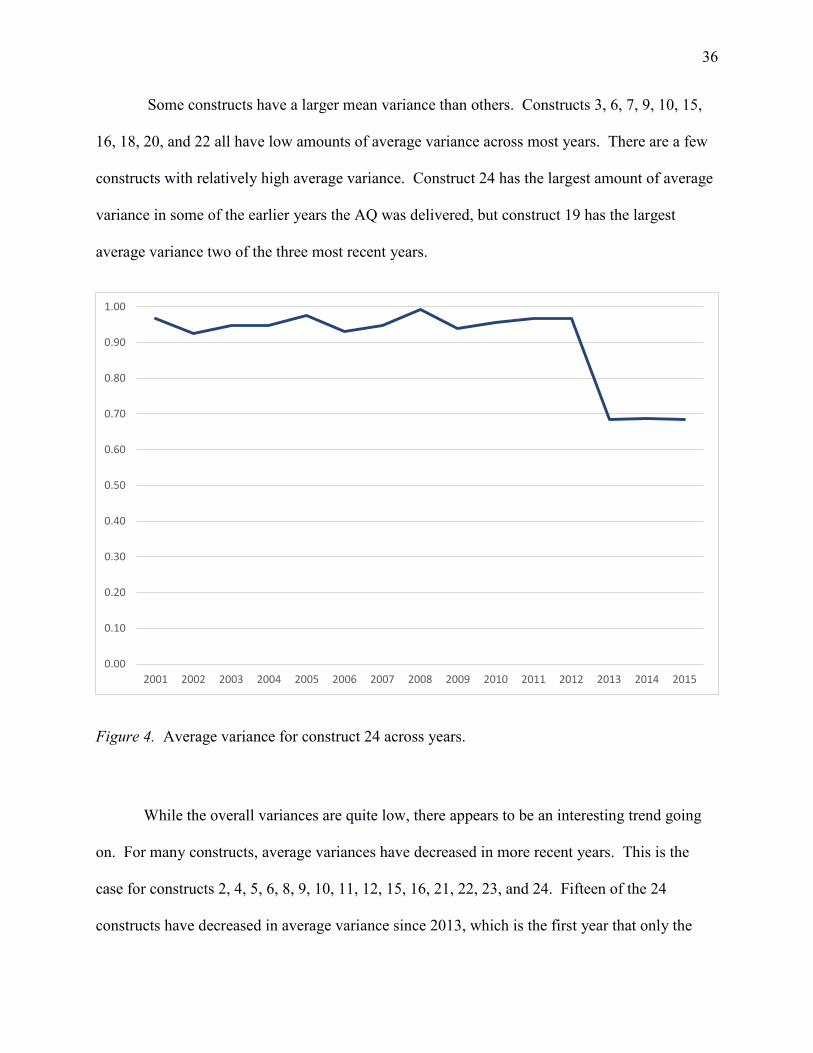
Some constructs have a larger mean variance than others. Constructs 3, 6, 7, 9, 10, 15,
16, 18, 20, and 22 all have low amounts of average variance across most years. There are a few
constructs with relatively high average variance. Construct 24 has the largest amount of average
variance in some of the earlier years the AQ was delivered, but construct 19 has the largest
average variance two of the three most recent years.
Figure 4. Average variance for construct 24 across years.
While the overall variances are quite low, there appears to be an interesting trend going
on. For many constructs, average variances have decreased in more recent years. This is the
case for constructs 2, 4, 5, 6, 8, 9, 10, 11, 12, 15, 16, 21, 22, 23, and 24. Fifteen of the 24
constructs have decreased in average variance since 2013, which is the first year that only the
0.00
0.10
0.20
0.30
0.40
0.50
0.60
0.70
0.80
0.90
1.00
2001 2002 2003 2004 2005 2006 2007 2008 2009 2010 2011 2012 2013 2014 2015

37
short form was delivered. The average decrease of average variance across all constructs from
2001 to 2015 was -12.84%. On the other hand, nine of the constructs have increased in average
variance. Constructs 1, 17, and 19 have all increased by more than 10%. See Figure 4 for an
illustration of the drop in average variance right at the time the AQ was shortened.

38
Chapter 5: Discussion
The results for each research question are presented in Chapter 4. We found a general
increase in response rates, particularly for male respondents. We found cases where Cronbach’s
alpha did not decrease as a result of shortening a construct. We also found cases where
Cronbach’s alpha decreased after shortening a particular construct. Finally, we found that
variance within constructs was relatively low across all constructs and that some constructs
appear to have increased in average variance, while others appear to have decreased.
Mean values for each of the constructs are presented in Figure 5. This information is
from a university report comparing undergraduate means for the long paper form in 2008 with
means from the short web form in 2012. These results provide context for the following
discussion of the individual research questions.
Research Question 1
The increases in the response rate could be due to the shortening of the instrument,
administering it online, or a combination of both. Available data do not allow us to tease apart
the effects of these variables. As stated above, there is plenty of research literature support
showing that shortening an IM will lead to increased response rates (Edwards et al., 2009). At
the same time, the majority of evidence seems to indicate that web-based surveys produce lower
response rates than paper surveys (De Leeuw & Heer, 2002; Handwerk, Carson, & Blackwell,
2000; Kwak & Radler, 2002; Matz, 1999; McMahon et al., 2003; Underwood, Kim, & Matier,
2000).

39
Figure 5. BYU report comparing mean values between the long and short forms of the AQ.
The greater increase in response rate among male respondents is noteworthy. While this
effect is technically confounded by the same variables as the overall increase in response rate,
there is no historical literature support for the shortening of an IM impacting response rates
differentially by gender. Without eliminating the possibility that shortening the AQ impacted
male respondents more than female respondents, considering the literature in support of online
IMs having higher response rates among males (Kwak & Radler, 2002; Sax, Gilmartin, &
Bryant, 2003) it seems reasonable to assert that the increase in male response rate was at least

40
partially due to putting the AQ online. This increase in male response rate appears to be real—
persisting through each year since the AQ was shortened—and will be interesting to monitor
going forward.
It is possible that the higher percent of male participants partially explains the lower
mean values shown in Figure 5. Administrators of the AQ indicate that male respondents
typically have lower means compared to female respondents. This effect is not examined in this
paper, but could be an interesting area for future research.
Assuming that increases in response rates were not due entirely to putting the AQ online,
it may be safe to conclude that shortening the AQ was at least partially responsible for the
increased response rates. If this is the case, the AQ may have moved from zone C into (or at
least closer to) zone B of Eslick and Howell’s (2001) chart. However, several questions remain
regarding the ideal length for the AQ.
It is possible that some number of questions could be added back to the AQ without
impacting the response rate. The exact threshold at which response rates decrease (or, indeed,
whether there is a threshold or whether response rates decline at a constant rate within the range
studied) is not clear from the data.
It is possible that further shortening will increase the response rate even higher. While
perhaps unlikely, it is also possible that further shortening the AQ will decrease response rates.
In other words, it seems likely that shortening the AQ has increased response rates. However,
the optimal length at which response rate is maximized is still unknown. It may be worth
pointing out that while optimal length presents an interesting academic question, in practice there
will always be other concerns that are more important (e.g. the purpose for which the survey is
41
being conducted in the first place). In the absence of validity, response rates become
meaningless.
Research Question 2
We saw some mixed results in terms of alpha between different versions of the AQ. In
some cases alpha decreased quite a bit. In other cases the differences were negligible. It is, of
course, possible that some validity will have been lost even in cases where alpha did not change.
In the cases where alpha decreased, there is an additional concern. Standard errors are
used to construct confidence bands for each of the 24 constructs in the AQ. Since Cronbach’s
alpha is used to estimate standard error, any reduction in alpha could have the undesired effect of
widening the confidence bands for an affected construct. Taking it a step further, lower alphas
can have a stronger impact on standard errors calculated for smaller administrative units of the
university. For example, while an alpha of .75 may be acceptable for the purposes of the
university as a whole, it may not be sufficient when looking only at specific colleges or majors
where the reliability of group means will be lower (Snijders & Bosker, 2012).
However, overall losses in alpha were negligible compared to the number of questions
removed. It is possible that some redundancy was eliminated from some of the constructs
without any significant loss of validity. It would be an interesting point of future research to
examine the validity question more directly.
Research Question 3
Looking at the average variance within responses to each construct, we see more mixed
results. Overall, findings are generally inconsistent with (admittedly sparse) literature which
suggested that shortening an IM might increase the variance of responses within grid-based
questions (Galesic & Bosnjak, 2009; Herzog & Bachman, 1981). Given this inconsistent
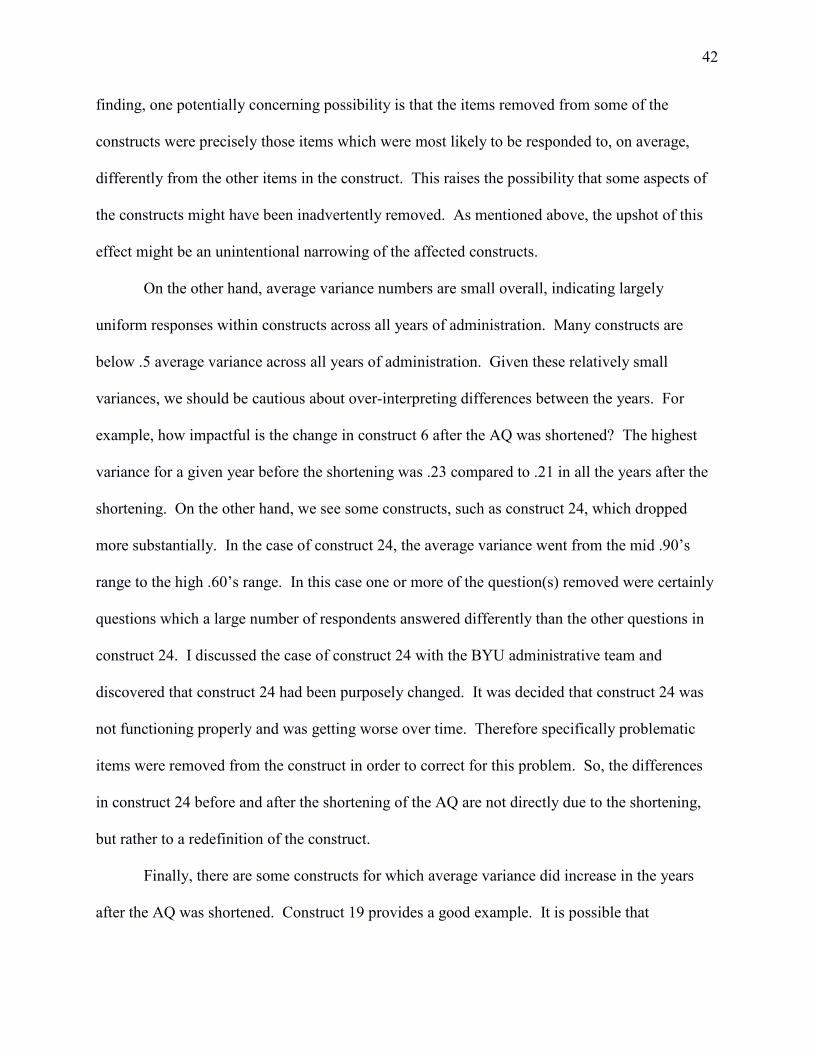
42
finding, one potentially concerning possibility is that the items removed from some of the
constructs were precisely those items which were most likely to be responded to, on average,
differently from the other items in the construct. This raises the possibility that some aspects of
the constructs might have been inadvertently removed. As mentioned above, the upshot of this
effect might be an unintentional narrowing of the affected constructs.
On the other hand, average variance numbers are small overall, indicating largely
uniform responses within constructs across all years of administration. Many constructs are
below .5 average variance across all years of administration. Given these relatively small
variances, we should be cautious about over-interpreting differences between the years. For
example, how impactful is the change in construct 6 after the AQ was shortened? The highest
variance for a given year before the shortening was .23 compared to .21 in all the years after the
shortening. On the other hand, we see some constructs, such as construct 24, which dropped
more substantially. In the case of construct 24, the average variance went from the mid .90’s
range to the high .60’s range. In this case one or more of the question(s) removed were certainly
questions which a large number of respondents answered differently than the other questions in
construct 24. I discussed the case of construct 24 with the BYU administrative team and
discovered that construct 24 had been purposely changed. It was decided that construct 24 was
not functioning properly and was getting worse over time. Therefore specifically problematic
items were removed from the construct in order to correct for this problem. So, the differences
in construct 24 before and after the shortening of the AQ are not directly due to the shortening,
but rather to a redefinition of the construct.
Finally, there are some constructs for which average variance did increase in the years
after the AQ was shortened. Construct 19 provides a good example. It is possible that

43
shortening the AQ does provide an increase in variance to responses within grid-based questions,
but that in many cases the questions being removed were those questions which were most likely
to be answered differently from the majority of questions within the construct. This makes sense
considering the use of Cronbach’s alpha as one factor in deciding which questions to remove.
Recommendations and Conclusion
Recommendations for further use. Overall, AQ response rates have increased as
administrators had hoped. This may help to alleviate concerns about the falling response rate
prior to the implementation of the short version. Additionally, for many constructs, the
shortening appears to have had little impact on any of the statistics measured in this paper.
At the same time, the results raise a few concerns for the future use of the instrument.
The primary concern is the validity of the constructs. Another concern is the reliability of the
constructs. Other concerns may come up in the future if further modifications are made to the
AQ—either adding or subtracting questions. I discuss each of these concerns below.
First, validity is the most important feature of any test, survey, or other measure. The
question of how shortening impacted validity of the AQ has not been answered here. One
straightforward way to solve this problem is to conduct a validity study on the AQ. In particular,
I recommend conducting a validity study on the constructs that had many items removed and/or
lost the most average variance as indicated by the results for research question three. This is
because the manner in which the AQ was shortened using Cronbach’s alpha, coupled with these
results, raises the concern that some construct(s) may have been unintentionally narrowed in
scope.
Additionally, close attention should be given to any changes in aggregate responses on
the constructs in years after the AQ was shortened. It could be that changes in the data are the

44
result of a subtle shift in the meaning of a construct rather than actual changes in the alumni
population over time. Again, I would be particularly concerned in those cases where many items
were removed or a relatively large amount of average variance was lost. If shifts in construct
parameters occur following the shortening of the AQ, it would be appropriate to consider doing a
validity study on at least the affected constructs.
Second, while reliability remains very good for most constructs and acceptable for all
constructs at the campus level, there is the concern that individual construct reliability will be
low for individual departments or administrative units. Recognize that the reliability of group
means is a function of sample size (Snijders & Bosker, 2012) and consider adding questions back
to a construct if reliability will drop too low for the smallest administrative units that require
reporting.
Finally, if at some point there is a need to either shorten the AQ again, or add questions
back to it, the following recommendations should be considered. If shortening the questionnaire
even further, consider alternatives to the approach utilized in the initial shortening. For example,
deliver only a subset of constructs to each participant, remove entire constructs, or merge similar
constructs. If shortening must occur within each of the constructs again, utilize additional
statistics so that Cronbach’s alpha is not the primary indicator and consider doing a validity
study in addition. Note that no construct should contain fewer than three questions at an absolute
minimum.
If adding questions back to the AQ, first consider adding questions back to those
constructs with the lowest reliability and those constructs that lost the most reliability as a result
of the shortening. Regardless, consider adding questions back to constructs 17 and 19 to
increase reliability indices.

45
Recommendations for further research. As mentioned previously, shortening appears
to have increased response rates, though with current data it is impossible to disentangle this
effect from the effect of putting the AQ online. The finding that male response rates increased
more than female response rates could use additional research. Also, some academic questions
remain as far as ideal instrument length. Each of these points is elaborated below.
First, it would of course be interesting to disentangle the differing impacts and interaction
effects of survey length and survey mode in this particular case. This could be done by
delivering the entire original version of the AQ online and comparing to the short version and, at
the same time, delivering a shortened paper version of the instrument to some students. There
are, of course, financial and logistical limitations to such an experiment for most universities.
However, such a design would allow us to answer some questions. Is there something about
both shortening a survey and putting it online that increases response rates, or is one of the two
changes responsible for most of the increase? Is it possible to increase response rates to a paper
survey simply by putting it online? There isn’t any research supporting such a conclusion, but
perhaps respondent preferences for survey mode are shifting to the point that online surveys are
the preferred mode of delivery.
Second, we found that response rates increased more for males than for females.
Additional research could address whether male respondents are increasingly more likely to
respond to online surveys compared to women, or whether shorter surveys are more important to
male respondents for some reason.
Finally, it isn’t clear to what extent response rates might have increased if the AQ were
shortened even more. An even shorter version of the instrument might elicit much higher
response rates, slightly higher response rates, or even the same response rates. At the same time,

46
it isn’t clear how many more questions could be added back to the AQ before response rates
begin to decrease again. Is the response rate a continuous function of the number questions in an
instrument such that the response rate “cost” can be estimated per question? Or are there
thresholds as depicted in Figure 1? Again, this type of research is unlikely to be practical for a
given instrument such as the AQ. However, the answers to these questions could prove
invaluable to anyone developing a new instrument and trying to balance measurement concerns
with desired response rates and opportunity cost (as discussed by Maloney et al., 2011).
Conclusion. Shortening the AQ appears to have increased the response rate. Putting the
instrument online appears to have increased the response rate among male respondents.
However, we note that the effects of shortening and putting the instrument online are
confounded. It is therefore not known precisely which changes resulted in which outcomes.
These results are interpreted in the context of existing research literature to be most likely, but by
no means certain.
Validity concerns remain and are somewhat heightened by the observed reduction to
average variance within constructs. One interpretation of increased monotony in responses is
that the construct was narrowed unintentionally. Separate validity studies are required to
determine to what extent this narrowing may have happened to the AQ.

47
References
Allen, M., & Yen, W. (1979). Introduction to measurement theory. Monterey, CA: Brooks/Cole.
Antons, C. M., Dilla, B. L., & Fultz, M. L. (1997, May). Assessing student attitudes: Computer
vs. pencil. Paper presented at the 37th Annual Forum of the Association for Institutional
Research, Orlando, FL.
Asch, D. A., Jedrziewski, M. K., & Christakis, N. A. (1997). Response rates to mail surveys
published in medical journals. Journal of Clinical Epidemiology, 50, 1129-1136.
Beebe, T. J., Rey, E., Ziegenfuss, J. Y., Jenkins, S., Lackore, K., Talley, N. J., & Locke, R. G.
III. (2010). Shortening a survey and using alternative forms of prenotification: Impact on
response rate and quality. BMC Medical Research Methodology, 10, 1-9. doi:
10.1186/1471-2288-10-50
Berg, K., Wood-Dauphinée, S., Williams, J. I., & Gayton, D. (1989). Measuring balance in the
elderly: Preliminary development of an instrument. Physiotherapy Canada, 41, 304-311.
Boyle, G. J. (1991). Does item homogeneity indicate internal consistency or item redundancy in
psychometric scales? Personality and Individual Differences, 12, 291–294. doi:
10.1016/0191-8869(91)90115-R
Carini, R. M., Hayek, J. C., Kuh, G. D., Kennedy, J. M., & Ouimet, J. A. (2001, June). College
student responses to web and paper surveys: Does mode matter? Paper presented at the
41st Annual Forum of the Association for Institutional Research. Long Beach, CA.
Champion, D. J., & Sear, A. M. (1969). Questionnaire response rate: A methodological analysis.
Social Forces, 47, 335-339.

48
Chatman, S. (2007). Overview of University of California Undergraduate Experience Survey
(UCUES) response rates and bias issues. Berkeley, CA: Center for Studies in Higher
Education.
Cheung, Y. B., Goh, C., Wong, L. C., Ng, G. Y., Lim, W. T., Leong, S. S., . . . Khoo, K. S.
(2004). Quick-FLIC: Validation of a short questionnaire for assessing quality of life of
cancer patients. British Journal of Cancer, 90, 1747-1752.
Chou C. Y., Chien, C. W., Hsueh, I. P., Sheu, C. F., Wang, C. H., & Hsieh, C. L. (2006).
Developing a short form of the Berg Balance Scale for people with stroke. Physical
Therapy, 86(2), 195–204.
Cook, C., Heath, F., & Thompson, R. L. (2000). A meta-analysis of response rates in web- or
internet-based surveys. Educational and Psychological Measurement, 60, 821–836.
Cortina, J. M. (1993). What is coefficient alpha? An examination of theory and applications.
Journal of Applied Psychology, 78, 98–104.
Cronbach, L. J. (1951). Coefficient alpha and the internal structure of tests. Psychometrika, 6,
297–334.
Curtin, R., Presser, S., & Singer, E. (2005). Changes in telephone survey nonresponse over the
past quarter century. Public Opinion Quarterly, 69, 87-98.
De Leeuw, E. & Heer, W. (2002). Trends in household survey nonresponse: A longitudinal and
international comparison. In R. M. Groves, D. A. Dillman, J. L. Eltinge, & R. J. Little
(Eds.), Survey Nonresponse (pp. 41-54). New York, NY: John Wiley and Sons, Inc.
Dillman, D. A. (1978). Mail and telephone surveys: The total design method. New York, NY:
John Wiley and Sons, Inc.

49
Dirmaier, J., Harfst, T., Koch, U., & Schulz, H. (2007). Incentives increased return rates but did
not influence partial nonresponse or treatment outcome in a randomized trial. Journal of
Clinical Epidemiology, 60, 1263-1270.
Edwards, P. J., Roberts, I., Clarke, M., J., DiGuiseppi, C., Wentz, R., Kwan, I., . . . Pratap, S.
(2009). Methods to increase response to postal and electronic questionnaires. Cochrane
Database of Systematic Reviews, 2009, 1-468. doi: 10.1002/14651858.MR000008.pub4
Erhart, M., Hagquist, C., Auquier, P., Rajmil, L., Power, M., Ravens-Sieberer, U., & The
European KIDSCREEN Group (2009). A comparison of Rasch item-fit and Cronbach's
Alpha item reduction analysis for the development of a quality of life scale for children
and adolescents. Child: Care, Health and Development, 36, 473-484. doi:10.1111/j.1365-
2214.2009.00998.x
Eslick, G. D., & Howell, S.C. (2001). Questionnnaires and postal research: More than just high
response rates [Letter to the editor]. Sexually Transmitted Infections, 77, 148.
Galesic, M., & Bosnjak, M. (2009). Effects of questionnaire length on participation and
indicators of response quality in a web survey. Public Opinion Quarterly, 73, 349–360.
Groves, R. M. (2006). Nonresponse rates and nonresponse bias in household surveys. Public
Opinion Quarterly, 70, 646-675.
Groves, R. M., Singer, E., & Corning, A. (2000). Leverage-saliency theory of survey
participation. Public Opinion Quarterly, 64, 299-308.
Handwerk, P. G., Carson, C., & Blackwell, K. M. (2000, May). Online vs. paper-and-pencil
surveying of students: A case study. Paper presented at the 40th Annual Forum of the
Association for Institutional Research, Cincinnati, OH.

50
Harvey, L. (1987). Factors affecting response rates to mailed questionnaires: A comprehensive
literature review. Journal of the Market Research Society, 29, 341-353.
Herzog, A. R., & Bachman, J. G. (1981). Effects of questionnaire length on response quality.
Public Opinion Quarterly, 45, 549–559.
Hobart, J. C., & Thompson, A. J. (2001). The five item Barthel index. Journal of Neurology,
Neurosurgery & Psychiatry, 71, 225-230. doi: 10.1136/jnnp.71.2.225
Jepson, C., Asch, D. A., Hershey, J. C., & Ubel, P. A. (2005). In a mailed physician survey,
questionnaire length had a threshold effect on response rate. Journal of Clinical
Epidemiology, 58, 103-105.
Kalantar, J. S., & Talley, N. J. (1999). The effects of lottery incentive and length of
questionnaire on health survey response rates: A randomized study. Journal of Clinical
Epidemiology, 52, 1117-1122.
Kim, S., & Feldt, L. S. (2008). A comparison of tests for equality of two or more independent
alpha coefficients. Journal of Educational Measurement, 45, 179-193.
Koloski, N. A., Talley, N. J., Boyce, P. M., & Morris-Yates, A. D. (2001). The effects of
questionnaire length and lottery ticket inducement on the response rate in mail surveys.
Psychology and Health, 16, 67-75.
Kwak, N., & Radler, B. (2002). A comparison between mail and web surveys: Response pattern,
respondent profile, and data quality. Journal of Official Statistics, 18, 257-273.
Langer, G. (2003). About response rates: Some unresolved questions. Public Perspective, 14,
16-18.
Linacre, J. M. (1997). KR-20 / Cronbach Alpha or Rasch Person Reliability: Which tells the
"Truth"? Rasch Measurement Transactions, 11, 580-581.

51
Maloney, P., Grawitch, M.J., & Barber, L.K. (2011). Strategic item selection to reduce survey
length: Reduction in validity? Consulting Psychology Journal: Practice and Research,
63, 162-175. doi: 10.1037/a0025604
Marcus, B., Bosnjak, M., Linder, S., Pilischenko, S., & Schütz, A. (2007). Compensating for low
topic interest and long surveys: A field experiment on nonresponse in web surveys.
Social Science Computer Review, 25, 372-383. doi: 10.1177/0894439307297606
Matz, C. M. (1999). Administration of web versus paper surveys: Mode effects and response
rates. Master’s Research Paper, University of North Carolina, Chapel Hill.
McMahon, S.R., Iwamoto, M., Massoudi, S. S., Yusuf, H. R., Stevenson, J. M., David, F., . . .
Pickering, L. K. (2003). Comparison of e-mail, fax, and postal surveys of pediatricians.
Pediatrics, 111, 299-303.
Mond, J. M., Rodgers, B., Hay, P. J., Owen, C., & Beumont, P. J. V. (2004). Mode of delivery,
but not questionnaire length, affected response in an epidemiological study of eating-
disordered behavior. Journal of Clinical Epidemiology, 57, 1167-1171.
Mühlan, H., Bullinger, M., Power, M., & Schmidt, S. (2008). Short forms of subjective quality
of life assessments from cross-cultural studies for use in surveys with different
populations. Clinical Psychology and Psychotherapy, 15, 142-153. doi: 10.1002/cpp.573
Nijsten, T., Unaeze, J., & Stern, R. S. (2006). Refinement and reduction of the Impact of
Psoriasis Questionnaire: Classical Test Theory vs. Rasch analysis. British Journal of
Dermatology, 154, 692-700. Doi: 10.1111/j.1365-2133.2005.07066.x
Sax, L. J., Gilmartin, S. K., & Bryant, A. N. (2003). Assessing response rates and nonresponse
bias in web and paper surveys. Research in Higher Education, 44, 409-431.
52
Slaney, K. L., & Maraun, M. D. (2008). A proposed framework for conducting data-based test
analyses. Psychological Methods, 13, 376–390.
Smith, G. T., McCarthy, D. M., & Anderson, K. G. (2000). On the sins of short form
development. Psychological Assessment, 12, 102–111. doi: 10.1037/1040-3590.12.1.102
Smith, P. C., & Stanton, J. M. (1998). Perspectives on the measurement of job attitudes: The
long view. Human Resources Management Review, 8, 367–386. doi: 10.1016/S1053-
4822(99)00005-4
Snijders, T. A. B., & Bosker, R. J. (2012). Multilevel Analysis. Los Angeles, CA: Sage.Stanton,
J. M., Sinar, E. F., Balzer, W. K., Julian, A. L., Thoresen, P., Aziz, S., . . . Smith, P. C.
(2002). Development of a compact measure of job satisfaction: The abridged job
descriptive index. Educational and Psychological Measurement, 62, 173–191.
Stanton, J. M., Sinar, E. F., Balzer, W. K., & Smith, P. C. (2002). Issues and strategies for
reducing the length of self-report scales. Personnel Psychology, 55, 167-193.
Steeh, C., Kirgis, N., Cannon, B., & DeWitt, J. (2001). Are they really as bad as they seem?
Nonresponse rates at the end of the twentieth century. Journal of Official Statistics, 17,
227-247.
Streiner, D. L., & Miller, H. R. (1986). Can a good short form of the MMPI ever be developed?
Journal of Clinical Psychology, 42, 109-113.
Subar, A. F., Ziegler, R. G., Thompson, F. E., Johnson, C. C., Weissfeld, J. L., Reding, D., . . .
Hayes, R. B. (2001). Is shorter always better? Relative importance of questionnaire
length and cognitive ease on response rates and data quality for two dietary
questionnaires. American Journal of Epidemiology, 153, 404-409.

53
Underwood, D., Kim, H., & Matier, M. (2000, May). To mail or to Web: Comparisons of survey
response rates and respondent characteristics. Paper presented at the 40th Annual Forum
of the Association for Institutional Research, Cincinnati, OH.
van Baardewijk, Y., Andershed, H., Stegge, H., Nilsson, K. W., Scholte, E., & Vermeiren, R.
(2010). Development and tests of short versions of the Youth Psychopathic Traits
Inventory and the Youth Psychopathic Traits Inventory-Child Version. European Journal
of Psychological Assessment, 26, 122-128. doi: 10.1027/1015-5759/a000017
Wiseman, F. (2009). The effects of the initial mode of contact on the response rate and data
quality in an internet-based college satisfaction survey. Methodological Innovations
Online, 4, 12-20.
Yammarino, F. J., Skinner, S. J., & Childers, T. L. (1991). Understanding mail survey response
behavior: A meta-analysis. Public Opinion Quarterly, 55, 613-639.