Embed Size (px)
Citation preview
The Impact of Sanitary and Phytosanitary Measures on Market Entry and Trade Flows
Pramila Crivelli Jasmin Gröschl
Ifo Working Paper No. 136
August 2012
An electronic version of the paper may be downloaded from the Ifo website www.cesifo-group.de.
Ifo Institute – Leibniz Institute for Economic Research at the University of Munich
Ifo Working Paper No. 136
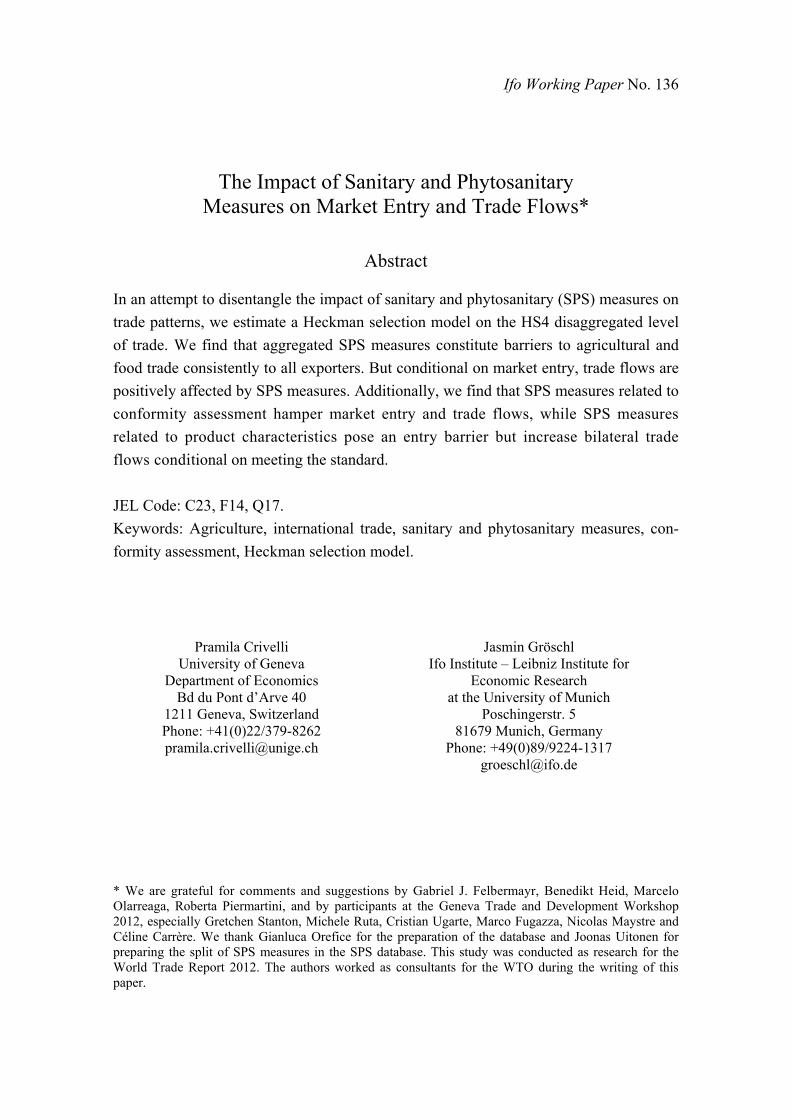
The Impact of Sanitary and Phytosanitary Measures on Market Entry and Trade Flows*
Abstract In an attempt to disentangle the impact of sanitary and phytosanitary (SPS) measures on
trade patterns, we estimate a Heckman selection model on the HS4 disaggregated level
of trade. We find that aggregated SPS measures constitute barriers to agricultural and
food trade consistently to all exporters. But conditional on market entry, trade flows are
positively affected by SPS measures. Additionally, we find that SPS measures related to
conformity assessment hamper market entry and trade flows, while SPS measures
related to product characteristics pose an entry barrier but increase bilateral trade
flows conditional on meeting the standard.
JEL Code: C23, F14, Q17.
Keywords: Agriculture, international trade, sanitary and phytosanitary measures, con-
formity assessment, Heckman selection model.
Pramila Crivelli University of Geneva
Department of Economics Bd du Pont d’Arve 40
1211 Geneva, Switzerland Phone: +41(0)22/379-8262 [email protected]
Jasmin Gröschl Ifo Institute – Leibniz Institute for
Economic Research at the University of Munich
Poschingerstr. 5 81679 Munich, Germany
Phone: +49(0)89/9224-1317 [email protected]
* We are grateful for comments and suggestions by Gabriel J. Felbermayr, Benedikt Heid, Marcelo Olarreaga, Roberta Piermartini, and by participants at the Geneva Trade and Development Workshop 2012, especially Gretchen Stanton, Michele Ruta, Cristian Ugarte, Marco Fugazza, Nicolas Maystre and Céline Carrère. We thank Gianluca Orefice for the preparation of the database and Joonas Uitonen for preparing the split of SPS measures in the SPS database. This study was conducted as research for the World Trade Report 2012. The authors worked as consultants for the WTO during the writing of this paper.
2 CRIVELLI AND GRÖSCHL
In the light of decreasing tariffs, quotas and prohibitions due to multilateral and
bilateral agreements over the last decades, non-tariff measures (NTMs), such
as sanitary and phytosanitary (SPS) measures1, are on the rise. Countries seek
alternatives to protect what was previously carried out by classical trade pol-
icy instruments (Roberts, Josling and Orden, 1999). SPS measures pose meth-
ods partly regulated under the SPS Agreement of the World Trade Organization
(WTO), but their design and use are less restricted and rather flexible. In prin-
ciple, SPS measures are meant to provide countries with a possibility to protect
the health of animals, humans and plants, but major concerns are regularly
expressed that SPS regulations are used as protectionist devices. Due to their
design, SPS measures may also be used as instruments to achieve certain pol-
icy objectives, such as protecting domestic producers, even though WTO mem-
bers2 are required to restrain from applying measures for any protectionist pur-
poses.
Limited knowledge on the particular trade effects of SPS measures exists.
Economic theory does not provide a clear cut prediction on the impact of stan-
dards on trade. Instead, theory suggests that the impact of SPS measures on
agriculture and food trade may be diverse and need not always be negative.
While increased production costs that may arise in order to meet higher SPS
standards reduce trade, information on food safety and product quality may
lead to increased consumer confidence and trust in foreign products, reduced
transaction costs and thus foster trade. Further, trade may also rise due to in-
creased producer efficiency, as quality signals help to promote the competitive-
ness of foreign producers who meet stringent standards. This suggests that the
implied trade effect of standards depends on the relative costs of domestic to
foreign production and the willingness of consumers to pay a higher price for
safer products (WTO, 2012). To achieve a certain health safety objective, pol-
icy makers can choose from a range of different SPS measures. These measures
1This paper focuses on SPS measures, most prevalent in agricultural and food trade.2All of which are also members of the SPS Agreement.

SPS AND TRADE 3
entail diverse effects on trade as some affect fixed costs and thus market entry,
while others affect post-entry activities, hence, variable trade costs. Assessing
the effects of SPS measures on the intensive and extensive margins of trade is
thus an empirical issue.
Recent empirical research on the nexus between NTMs and trade has mostly
been focusing on the forgone trade via the gravity equation. They provide ev-
idence that NTMs hamper trade (Gebrehiwet, Ngqangweni and Kirsten, 2007;
Disdier, Fontagné and Mimouni, 2008; Anders and Caswell, 2009), while har-
monization of regulation fosters trade (De Frahan and Vancauteren, 2006). But,
when looking at various sectors, Fontagné, Mimouni and Pasteels (2005) and
Disdier, Fontagné and Mimouni (2008) find positive and negative NTM effects.
These approaches focus on aggregate NTMs rather than on the trade effect of
diverse regulations that equivalently reduce risk with respect to health safety.
Evidence on product-specific regulations, such as maximum residue levels, sug-
gests that such measures hamper trade (Otsuki, Wilson and Sewadeh, 2001a,b;
Wilson and Otsuki, 2004; Disdier and Marette, 2010; Jayasinghe, Beghin and
Moschini, 2010; Drogué and DeMaria, 2011; Xiong and Beghin, 2011).
Three main issues arise within the literature. First, most of the previous
studies assess the impact of either a global or a specific SPS measure on the
volume of trade at the aggregate or sectoral level. But, they rarely provide evi-
dence regarding potential market entry barriers caused by regulations. To our
knowledge, only three studies identifying the impact of SPS measures on the in-
tensive and extensive margins. Using a Heckman selection model, Disdier and
Marette (2010) find an insignificant effect of maximum residue levels (MRLs)3
on market entry but a negative significant impact on the import volume of crus-
taceans. Jayasinghe, Beghin and Moschini (2010) show that the probability to
trade and the trade volume of US corn seeds are both negatively affected by
MRLs. Xiong and Beghin (2011) analyze the effect of EU aflatoxin standards on
3MRLs are standards imposed by countries on maximum pesticide levels or toxic com-pounds in food or agricultural products. Disdier and Marette (2010) use limits on chloram-phenicol in crustacean imports.

4 CRIVELLI AND GRÖSCHL
trade in groundnuts between the EU15 and nine African countries from 1989
to 2006. They find no significant impact of the MRL set by the EU on trade in
groundnuts. Contrasting results may arise from sector or country specific fac-
tors or from different definitions of SPS measures. While Disdier and Marette
(2010) define SPS measures using country specific MRLs, Jayasinghe, Beghin
and Moschini (2010) use SPS regulations based on EXCERPT (Export Certifica-
tion Project Demonstration), and Xiong and Beghin (2011) use data from the
Food and Agricultural Organization (FAO) on global regulations and from the
European Communities on aflatoxin contaminants. Thus, further research is
needed in order to provide solid evidence on the impact of SPS measures on
both market entry and trade volumes in agricultural and food products.
Second, most studies focus on a specific measure, such as MRLs, and can
thus not compare the impact of various SPS instruments on trade, even though
policy makers may choose from a range of possible measures to achieve equiv-
alent health safety objectives. Heterogeneity across countries in implement-
ing diverse SPS requirements may cause ambiguous trade outcomes. To our
knowledge, the only two studies that deal with the impact of different regu-
latory measures on trade are Schlueter, Wieck and Heckelei (2009) and Fas-
sarella, Pinto de Souza and Burnquist (2011). Both studies look specifically at
the meat sector. Schlueter, Wieck and Heckelei (2009) estimate the impact of
various types of SPS measures on trade in meat products. The authors estimate
a Poisson pseudo maximum likelihood (PPML) gravity model on trade flows of
meat on the HS4 digit level. Aggregated over all regulatory instruments, they
find a positive effect of SPS on trade flows in meat products. Disaggregated re-
sults show diverse effects. In particular, conformity assessment promotes trade
in the meat sector. In a similar manner, Fassarella, Pinto de Souza and Burn-
quist (2011) analyze the effect of SPS and TBT measures on Brazilian exports
of poultry meat between 1996 and 2009. Deploying a PPML model, they find
an insignificant impact of aggregated measures on Brazilian exports of poultry
meat. On the disaggregated level, the authors find that conformity assessment-
SPS AND TRADE 5
related measures decrease the volume of poultry meat exports from Brazil to its
major trade partners, while requirements on quarantine treatment and labeling
increase the amount of poultry trade. As results on SPS measures on the aggre-
gated and on the disaggregated level are only available for the meat sector and
are ambiguous across studies, even contradict each other, the topic needs more
insight and investigation.
Third, previous studies often use notification-based data. Contrasting this,
our paper deploys the more sophisticated specific trade concerns database of
the WTO. The trade concerns database overcomes limitations of notification-
based data4 because government incentives to report a concern increase if a
SPS measure potentially affects their trade. In addition, the database allows us
to consistently differentiate SPS measures and to perform bilateral estimations.
This paper builds on the previous literature but contributes by assessing the
impact of SPS measures on the extensive and the intensive margin of trade, not
only in a specific industry, but aggregated over all agricultural and food sec-
tors. More specifically, we assess the impact of SPS measures on the probabil-
ity to enter a destination market and on the trade volume. To control for zero
trade flows and a potential sample selection bias, we use a Heckman selection
model. The key findings of the study are that concerns over SPS measures pose
a negative impact on the probability to export to a concerned market. Although,
conditional on market entry, the amount of exports to markets with SPS mea-
sures in place tends to be higher. A possible explanation of the positive effect
relates to the fact that information provision to the consumer may be relatively
stronger than the costs of the producer. By enhancing consumer trust in for-
eign products, SPS measures increase trade for foreign exporters that manage
to overcome the fixed cost of entering a market.
We further differentiate the impact of bilateral from multilateral SPS mea-
sures by assessing the impact of a SPS concern on the market entry and trade
volumes of all potential trade partners of a protected market. Our results sug-
4WTO members have usually no incentives to notify their own SPS measures.
6 CRIVELLI AND GRÖSCHL
gest that SPS measures deter market entry uniformly across all trading partners,
whereas SPS measures positively affect bilateral exports, namely of the country
raising the concern. Besides, SPS measures have a negative impact on the trade
volumes of other exporters.
In an attempt to identify the channels that lead to our results, we systemat-
ically assess the relevance of different SPS measures applied for various safety
purposes on trade in agriculture and food. The analysis distinguishes concerns
related to conformity assessment (i.e., certificate requirements, testing, inspec-
tion and approval procedures) and concerns related to the characteristics of
a product (i.e., requirements on quarantine treatment, pesticide residue lev-
els, labeling or packaging). In particular, we show that conformity assessment-
related SPS measures constitute a market entry barrier, as such measures might
be particularly burdensome and costly, while SPS measures related to product
characteristics explain most of the increase in the amount of trade. The lat-
ter suggests that SPS product characteristic measures sufficiently enhance con-
sumer trust such as to foster trade. This contribution is particularly interesting
for policy makers as they often have to choose from a range of measures that
are assumed to equivalently reduce health risks but entail diverse trade costs.
Depending on a policy maker’s choice of SPS measures, the implied impact on
trade varies strongly. In addition, we show that conformity assessment-related
SPS measures constitute a market entry barrier to all potential trade partners,
whereas product characteristic measures positively affect the trade volume of
the country raising a concern at the SPS committee of WTO.
The remainder of the paper is structured as follows. Section I. provides de-
tailed information on the empirical strategy and describes the data. In section
II., we provide benchmark results on the Heckman selection model using the
aggregate SPS measure and a sensitivity analysis of results. Section III. distin-
guishes by type of concern (conformity assessment versus product-related con-
cerns). The last section concludes.

SPS AND TRADE 7
I. Empirical Strategy and Data
A. Empirical Strategy
In an attempt to disentangle the impact of SPS measures on trade in agricul-
tural and food products, we estimate a Heckman selection model (Heckman,
1979) to control for a possible bias in our results from non-random selection
or zero trade flows in the data. Controlling for zero trade flows is important as
SPS measures implemented in the wake of a disease outbreak might provoke
a complete ban in the trade of some products. An alternative way to control
for zeros would be to estimate a Poisson model. In contrast to the Heckman
model, the Poisson method assumes that there is nothing special about zero
trade and would not allow us to tackle the sample selection issue with respect
to reporting. While the Poisson model is able to better control for heterogeneity,
it disregards the existence of another data generating process that produces ex-
cessive zeros in the trade matrix caused by self-selection into no trade.5 Hence,
we prefer the Heckman method. Besides, the Heckman model enables us to
distinguish the effect of SPS measures on the extensive margin (the probability
to trade) and the intensive margin (the amount of trade conditional on market
entry). The latter considers zero trade values by potential censoring. We esti-
mate both, the selection and the outcome equations, simultaneously using the
maximum likelihood technique.6 Both equations include the same indepen-
dent variables, except for the selection variable, in our case common religion as
in Helpman, Melitz and Rubinstein (2008). The selection variable helps to iden-
tify the model as it is assumed to have an impact on the fixed costs of trade, but
to have a negligible effect on variable trade costs. We estimate a probit binary
5Alternatively estimating zero inflated Poisson or a negative binomial model is not easy ei-ther. Due to strong non-linearity, they are difficult to implement (Greene, 2003).
6Wooldridge (2002, p.566) states that the maximum likelihood method produces more effi-cient estimates, preferable standard errors, and likelihood ratio statistics compared to the two-step estimation technique.
8 CRIVELLI AND GRÖSCHL
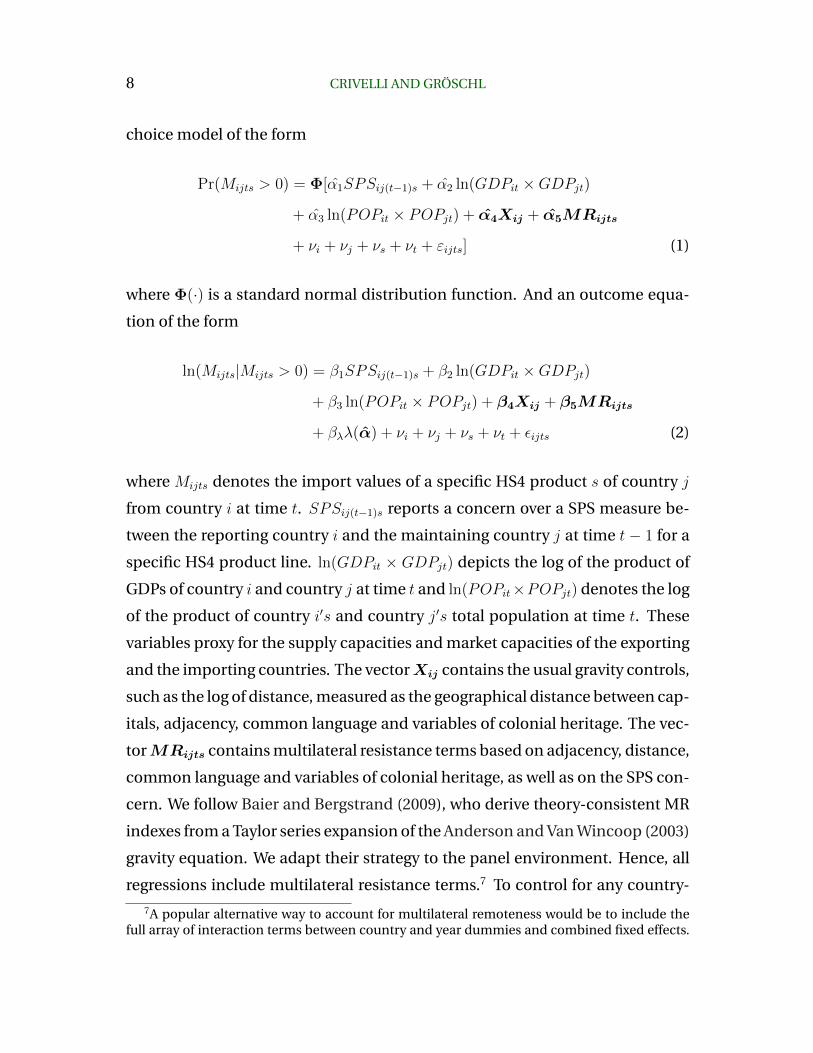
choice model of the form
Pr(Mijts > 0) = Φ[α̂1SPSij(t−1)s + α̂2 ln(GDPit ×GDPjt)
+ α̂3 ln(POPit × POPjt) + α̂4Xij + α̂5MRijts
+ νi + νj + νs + νt + εijts] (1)
where Φ(·) is a standard normal distribution function. And an outcome equa-
tion of the form
ln(Mijts|Mijts > 0) = β1SPSij(t−1)s + β2 ln(GDPit ×GDPjt)
+ β3 ln(POPit × POPjt) + β4Xij + β5MRijts
+ βλλ(α̂) + νi + νj + νs + νt + εijts (2)
where Mijts denotes the import values of a specific HS4 product s of country j
from country i at time t. SPSij(t−1)s reports a concern over a SPS measure be-
tween the reporting country i and the maintaining country j at time t − 1 for a
specific HS4 product line. ln(GDPit × GDPjt) depicts the log of the product of
GDPs of country i and country j at time t and ln(POPit×POPjt) denotes the log
of the product of country i′s and country j′s total population at time t. These
variables proxy for the supply capacities and market capacities of the exporting
and the importing countries. The vectorXij contains the usual gravity controls,
such as the log of distance, measured as the geographical distance between cap-
itals, adjacency, common language and variables of colonial heritage. The vec-
torMRijts contains multilateral resistance terms based on adjacency, distance,
common language and variables of colonial heritage, as well as on the SPS con-
cern. We follow Baier and Bergstrand (2009), who derive theory-consistent MR
indexes from a Taylor series expansion of the Anderson and Van Wincoop (2003)
gravity equation. We adapt their strategy to the panel environment. Hence, all
regressions include multilateral resistance terms.7 To control for any country-
7A popular alternative way to account for multilateral remoteness would be to include thefull array of interaction terms between country and year dummies and combined fixed effects.
SPS AND TRADE 9
specific characteristics, product specifics and time trends, we include full arrays
of importer νi, exporter νj , HS4 product νs, and year dummies νt separately in
the equation. Hence, we control for a wide array of observable and unobserv-
able factors, i.e., geographical variables or global business cycles.8 Error terms
εijts are heteroskedasticity-robust and clustered at the country-pair level. λ(α̂)
denotes the inverse mills ratio which is predicted from equation (1).9
The focus of this paper is on SPS concerns reported by exporters to the WTO.
For SPS measures, we consider two different variables: (i) a dummy variable
equal to one if at least one concern is notified at the 4-digit level of the HS clas-
sification, and (ii) a normalized frequency measure SPSFreqij(t−1)s. The nor-
malized SPS measure is defined as the number of concerns on HS4 products
within a HS2 product category and divided by the total number of HS4 prod-
uct items within the HS2 sector. In a second approach, we dissociate the im-
pact of the measure on the country raising the concern from the impact on all
potential exporters. We thus additionally include a multilateral variable equal
to one if at least one concern regarding a measure maintained by a given im-
porter exists (SPSj(t−1)s), and its associated normalized frequency SPS measure
(SPSFreqj(t−1)s). To circumvent potential reverse causality between imports and
SPS measures, we use the first lag of the variable on SPS concerns.10
However, due to the large number of observations this is computationally not possible in oursample. Within transformation is unfortunately not possible with the Heckman specificationdue to the nonlinearity of the first stage.
8The large number of observations does not allow for the use of combined fixed effects andwithin transformation is not possible using the Heckman model due to the nonlinearity of thefirst stage.
9The inverse mills ratio is the ratio of the probability density function over the cumulativedistribution function of M̂ijts from equation (1).
10Using further instrumentation methods is not straightforward in the Heckman model. Forrobustness reasons, we estimate a probit and a two stage least squares (2SLS) model separately.The two instruments used in the 2SLS model are (i) the sum of SPS concerns of all other partnercountries k 6= i against the importer j in sector s and (ii) the sum of SPS concerns raised bycountry i against the importer j in sectors l different from s but within the same HS2 category.Results in Table 5 Panel A and Panel B confirm our findings. Hence, forward looking actors seemnot to be a problem in our framework.

10 CRIVELLI AND GRÖSCHL
B. Data Sources and Sample
The SPS Information Management System (SPS IMS) of the WTO contains in-
formation on specific SPS concerns reported to the WTO by a raising country
towards a maintaining country for 1995 to 2010, respectively.11 For each sin-
gle concern, we have information on the raising and maintaining country, the
HS4 product code concerned, the year in which the concern was reported to
the WTO, and whether it has been resolved. To measure SPS restrictions, we
generate a simple dummy variable on SPS concerns that is equal to one when a
concern is reported to the WTO and shifts to zero whenever the concern is re-
solved. Alternatively, we also calculate a normalized frequency measure, which
counts the number of SPS measures in place on HS4 product lines within an
HS2 sector and divides them by the number of products within an HS2 sec-
tor. Similar ’normalized’ frequency measures on various levels of disaggrega-
tion have also been used by Fontagné, Mimouni and Pasteels (2005); Disdier,
Fontagné and Mimouni (2008); Fontagné et al. (2012). If HS4 product codes are
not available, but instead the HS2 sector is listed in the concern, we assume that
all HS4 product lines under the HS2 sector are affected. The database reports
the HS2002 classification, which are converted to the HS1992 classification to
be able to merge them to the trade data.
Further, to consider the possible heterogeneity of various SPS measures, we
divide concerns into two categories in accordance to the specific description
of concerns contained in the SPS database, referenced documents, or occa-
sionally national documents, if the database and referenced documents were
too vague about a certain concern. We create two dummy variables indicating
whether a specific concern relates to conformity assessment or product charac-
teristics. Conformity assessment-related measures refer to Annex C of the SPS
Agreement and include concerns about certification requirements, testing, in-
spection and approval procedures. Annex C was understood broadly. Hence,
conformity assessment-related measures also include concerns on delays, un-
11The SPS Information Management System is available under http://spsims.wto.org.
SPS AND TRADE 11
revoked suspensions, or administrative procedure problems. Measures related
to product characteristics refer to concerns regarding the requirements on pro-
cess and production methods, transport, packaging, and labeling that are di-
rectly related to food safety, concerns on the requirements of pesticide residue
levels and quarantine or cold treatments, as well as concerns over strict bans,
regional division, or protected zones. Concerns depicted in the WTO database
may relate to one, or both issues at the same time. Out of the 312 trade con-
cerns raised by one or several countries against a specific importing country, 57
percent are associated with conformity assessment-related measures, while 78
percent relate to concerns over product characteristics.
Data on bilateral trade come from the United Nations Commodity Trade
Statistics Database (Comtrade) and are obtained in the HS1992 classification.
The European Union is considered as a single country, hence, trade data is
summed up over all EU member states. Total population and nominal GDP
in US dollars provide a proxy for market size. Data stem from the World Bank’s
World Development Indicator (WDI) database and enter equations through the
log of the product of the GDPs of the importer and the exporter and the log of
the product of the total population of the importer and the exporter. Bilateral
distance is the geographic distance between capitals.12 Data is extracted from
the CEPII database on distance and geographical variables, as are all other grav-
ity variables contained in the equations, such as adjacency, common language,
and variables on colonial heritage. Data on common religion across countries
is obtained from Elhanan Helpman’s homepage. Helpman, Melitz and Rubin-
stein (2008) define the index of common religion across countries as (% Protes-
tants in country i ×% Protestants in country j) + (% Catholics in country i ×%
Catholics in country j) + (% Muslims in country i×% Muslims in country j).
For robustness checks, we include applied tariff data that are combined from
the WTO’s Integrated Data Base (IDB) and UNCTAD’s Trade Analysis and Infor-
mation System (TRAINS). As tariff data have little time variation and are miss-
12The distance to and from the EU is measured as the distance to and from Brussels.

12 CRIVELLI AND GRÖSCHL
ing to a large part, we only include them in a robustness check.13 IDB tariff data
are preferred over TRAINS if both are available, as IDB contains comprehen-
sive information on applied preferential tariffs and provides data on general
tariff regimes whenever available. To handle missing observations and to keep
as many observations as possible, we adapt an ’interpolation’ rule. If a tariff is
available for a certain HS4 product in a certain year, we assume that the same
tariff was also valid for the HS4 product up to 4 years previous to the tariff re-
ported in the database if these are missing. After the ’interpolation’ rule has
been adapted, we further assume that all remaining missing observations are
zero, to keep the exact similar sample as to when not including tariff data. Fol-
lowing the literature, we use applied tariff data that is weighted by imports.
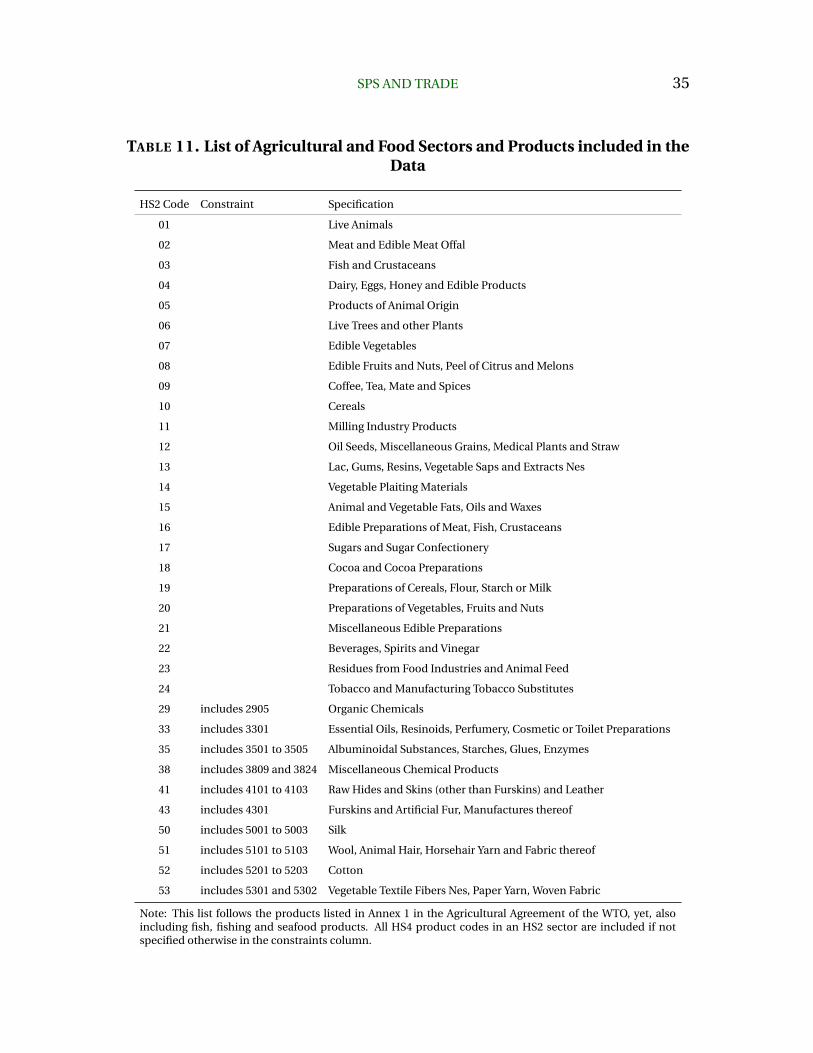
Our sample consists of 164 importer and 150 exporting countries, and 224
HS4 product categories in 34 HS2 sectors (compare Table 11) observed over a
time period of fifteen years, from 1996 to 2010, due to the lag considered in the
SPS measure implemented to circumvent reverse causality.
II. SPS Measures and Trade
A. Benchmark Results
The first two columns of Table 1 present results using the SPS dummy variable,
while columns (3) and (4) use the normalized SPS frequency measure. All re-
gressions include importer, exporter, and HS4 product fixed effects, a full array
of year dummies and multilateral resistance terms. In addition, all columns in-
clude gravity controls. These are the log of the product of GDPs, the log of the
product of populations, the log of distance, adjacency, common language and
colonial heritage. Common religion is the selection variable and thus excluded
in column (2) and (4), respectively. All specifications apply the Heckman selec-
tion procedure using the maximum likelihood approach and thus account for
13Results on the impact of SPS measures on trade do not change qualitatively nor quantita-tively by the inclusion of tariffs.

SPS AND TRADE 13
potential sample selection and zero trade flows.
Overall, gravity variables are in line with the literature. Countries similar in
income trade more with another, while countries similar with respect to pop-
ulation size show a higher probability to trade, but no significant effect on the
amount of trade conditional on market entry. As expected, distance has a neg-
ative impact on trade, and adjacency, common language and common colonial
heritage increase trade, while country pairs in a colonial relation after 1945 ex-
perience a negative impact on the probability and the amount of trade. Com-
mon religion reduces the fixed costs of trade, hence, positively affects the prob-
ability of market entry. This result is in line with the findings of Helpman, Melitz
and Rubinstein (2008). As in Helpman, Melitz and Rubinstein (2008), we as-
sume that common religion does not affect trade flows once the exporting de-
cision has been made.
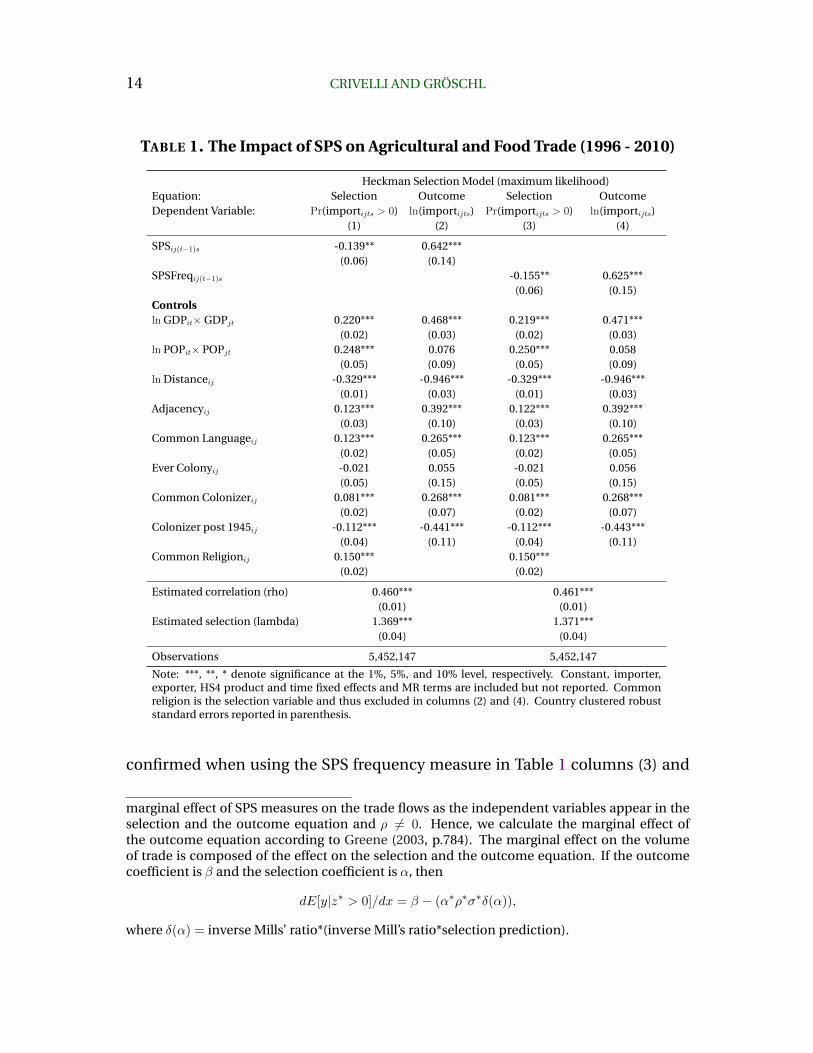
In column (1), we find a significantly lower probability to trade bilaterally in
the presence of SPS concerns. Our results suggest that the probability to enter
an export market is about 4.3 percent lower in the presence of a SPS measure
(compare Table 2 column (1) for marginal effects). This indicates that SPS mea-
sures increase fix costs of trading and thus constitute an effective market entry
barrier in agricultural and food sectors. Interestingly, the outcome equation
in column (2) indicates that SPS measures significantly increase the amount of
trade once a market has been entered. This positive effect can be explained
by the fact that SPS measures provide information on product safety to con-
sumers. If SPS measures enhance consumer trust in the quality of imported
goods proportionally more than they increase variable trade costs due to prod-
uct adaption, producers gain market share. This leads to an increase in trade
volumes for exporters that manage to overcome the fixed cost of entering a mar-
ket. The dummy variable indicates that SPS measures increase the amount of
trade in agriculture and food products by 77 percent on average. The marginal
effect for the outcome equation14 is depicted in Table 2 column (2). Results are
14The estimated coefficient in the Heckman outcome equation does not indicate the
14 CRIVELLI AND GRÖSCHL
TABLE 1. The Impact of SPS on Agricultural and Food Trade (1996 - 2010)
Heckman Selection Model (maximum likelihood)Equation: Selection Outcome Selection OutcomeDependent Variable: Pr(importijts > 0) ln(importijts) Pr(importijts > 0) ln(importijts)
(1) (2) (3) (4)
SPSij(t−1)s -0.139** 0.642***(0.06) (0.14)
SPSFreqij(t−1)s -0.155** 0.625***(0.06) (0.15)
Controlsln GDPit× GDPjt 0.220*** 0.468*** 0.219*** 0.471***
(0.02) (0.03) (0.02) (0.03)ln POPit× POPjt 0.248*** 0.076 0.250*** 0.058
(0.05) (0.09) (0.05) (0.09)ln Distanceij -0.329*** -0.946*** -0.329*** -0.946***
(0.01) (0.03) (0.01) (0.03)Adjacencyij 0.123*** 0.392*** 0.122*** 0.392***
(0.03) (0.10) (0.03) (0.10)Common Languageij 0.123*** 0.265*** 0.123*** 0.265***
(0.02) (0.05) (0.02) (0.05)Ever Colonyij -0.021 0.055 -0.021 0.056
(0.05) (0.15) (0.05) (0.15)Common Colonizerij 0.081*** 0.268*** 0.081*** 0.268***
(0.02) (0.07) (0.02) (0.07)Colonizer post 1945ij -0.112*** -0.441*** -0.112*** -0.443***
(0.04) (0.11) (0.04) (0.11)Common Religionij 0.150*** 0.150***
(0.02) (0.02)
Estimated correlation (rho) 0.460*** 0.461***(0.01) (0.01)
Estimated selection (lambda) 1.369*** 1.371***(0.04) (0.04)
Observations 5,452,147 5,452,147
Note: ***, **, * denote significance at the 1%, 5%, and 10% level, respectively. Constant, importer,exporter, HS4 product and time fixed effects and MR terms are included but not reported. Commonreligion is the selection variable and thus excluded in columns (2) and (4). Country clustered robuststandard errors reported in parenthesis.
confirmed when using the SPS frequency measure in Table 1 columns (3) and
marginal effect of SPS measures on the trade flows as the independent variables appear in theselection and the outcome equation and ρ 6= 0. Hence, we calculate the marginal effect ofthe outcome equation according to Greene (2003, p.784). The marginal effect on the volumeof trade is composed of the effect on the selection and the outcome equation. If the outcomecoefficient is β and the selection coefficient is α, then
dE[y|z∗ > 0]/dx = β − (α∗ρ∗σ∗δ(α)),
where δ(α) = inverse Mills’ ratio*(inverse Mill’s ratio*selection prediction).
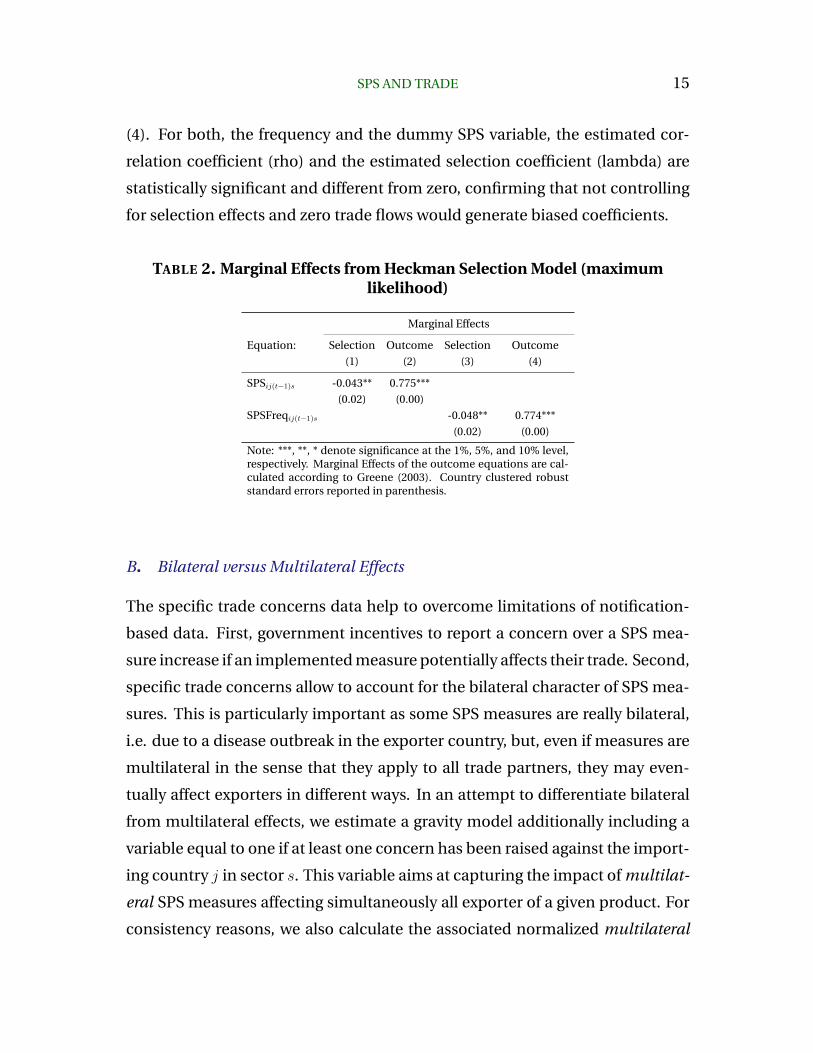
SPS AND TRADE 15
(4). For both, the frequency and the dummy SPS variable, the estimated cor-
relation coefficient (rho) and the estimated selection coefficient (lambda) are
statistically significant and different from zero, confirming that not controlling
for selection effects and zero trade flows would generate biased coefficients.
TABLE 2. Marginal Effects from Heckman Selection Model (maximumlikelihood)
Marginal Effects
Equation: Selection Outcome Selection Outcome
(1) (2) (3) (4)
SPSij(t−1)s -0.043** 0.775***
(0.02) (0.00)
SPSFreqij(t−1)s -0.048** 0.774***
(0.02) (0.00)
Note: ***, **, * denote significance at the 1%, 5%, and 10% level,respectively. Marginal Effects of the outcome equations are cal-culated according to Greene (2003). Country clustered robuststandard errors reported in parenthesis.
B. Bilateral versus Multilateral Effects
The specific trade concerns data help to overcome limitations of notification-
based data. First, government incentives to report a concern over a SPS mea-
sure increase if an implemented measure potentially affects their trade. Second,
specific trade concerns allow to account for the bilateral character of SPS mea-
sures. This is particularly important as some SPS measures are really bilateral,
i.e. due to a disease outbreak in the exporter country, but, even if measures are
multilateral in the sense that they apply to all trade partners, they may even-
tually affect exporters in different ways. In an attempt to differentiate bilateral
from multilateral effects, we estimate a gravity model additionally including a
variable equal to one if at least one concern has been raised against the import-
ing country j in sector s. This variable aims at capturing the impact of multilat-
eral SPS measures affecting simultaneously all exporter of a given product. For
consistency reasons, we also calculate the associated normalized multilateral
16 CRIVELLI AND GRÖSCHL
SPS frequency measure.
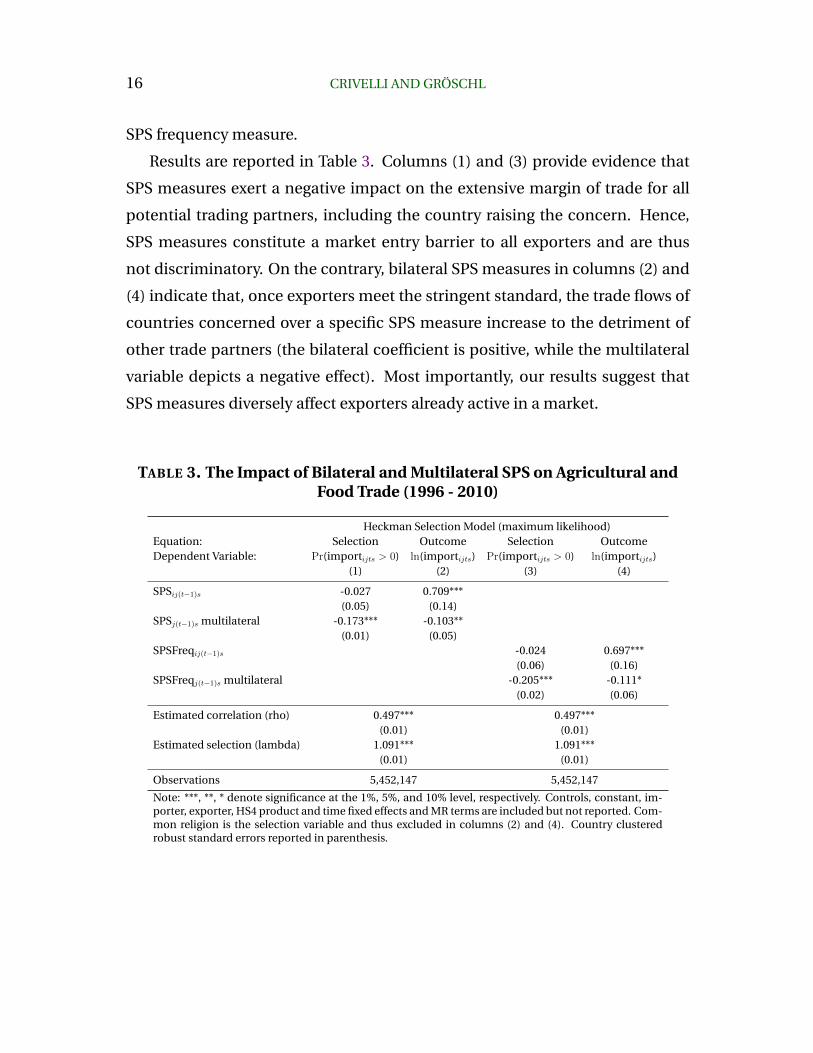
Results are reported in Table 3. Columns (1) and (3) provide evidence that
SPS measures exert a negative impact on the extensive margin of trade for all
potential trading partners, including the country raising the concern. Hence,
SPS measures constitute a market entry barrier to all exporters and are thus
not discriminatory. On the contrary, bilateral SPS measures in columns (2) and
(4) indicate that, once exporters meet the stringent standard, the trade flows of
countries concerned over a specific SPS measure increase to the detriment of
other trade partners (the bilateral coefficient is positive, while the multilateral
variable depicts a negative effect). Most importantly, our results suggest that
SPS measures diversely affect exporters already active in a market.
TABLE 3. The Impact of Bilateral and Multilateral SPS on Agricultural andFood Trade (1996 - 2010)
Heckman Selection Model (maximum likelihood)Equation: Selection Outcome Selection OutcomeDependent Variable: Pr(importijts > 0) ln(importijts) Pr(importijts > 0) ln(importijts)
(1) (2) (3) (4)
SPSij(t−1)s -0.027 0.709***(0.05) (0.14)
SPSj(t−1)s multilateral -0.173*** -0.103**(0.01) (0.05)
SPSFreqij(t−1)s -0.024 0.697***(0.06) (0.16)
SPSFreqj(t−1)s multilateral -0.205*** -0.111*(0.02) (0.06)
Estimated correlation (rho) 0.497*** 0.497***(0.01) (0.01)
Estimated selection (lambda) 1.091*** 1.091***(0.01) (0.01)
Observations 5,452,147 5,452,147
Note: ***, **, * denote significance at the 1%, 5%, and 10% level, respectively. Controls, constant, im-porter, exporter, HS4 product and time fixed effects and MR terms are included but not reported. Com-mon religion is the selection variable and thus excluded in columns (2) and (4). Country clusteredrobust standard errors reported in parenthesis.
SPS AND TRADE 17
C . Sensitivity
In the sensitivity analysis, we address two concerns. First, to avoid a poten-
tial misspecification and to be able to distinguish the impact of SPS interven-
tions on trade in agricultural and food products from that of bilateral tariffs, we
conduct a robustness check that includes bilateral applied tariff protection as
a further control variable. Second, reverse causality might be an issue in our
framework. As further instrumentation methods are not straightforward in the
Heckman model, we estimate a simple two stage least squares (2SLS) model to
give an indication that forward looking actors are not a problem.
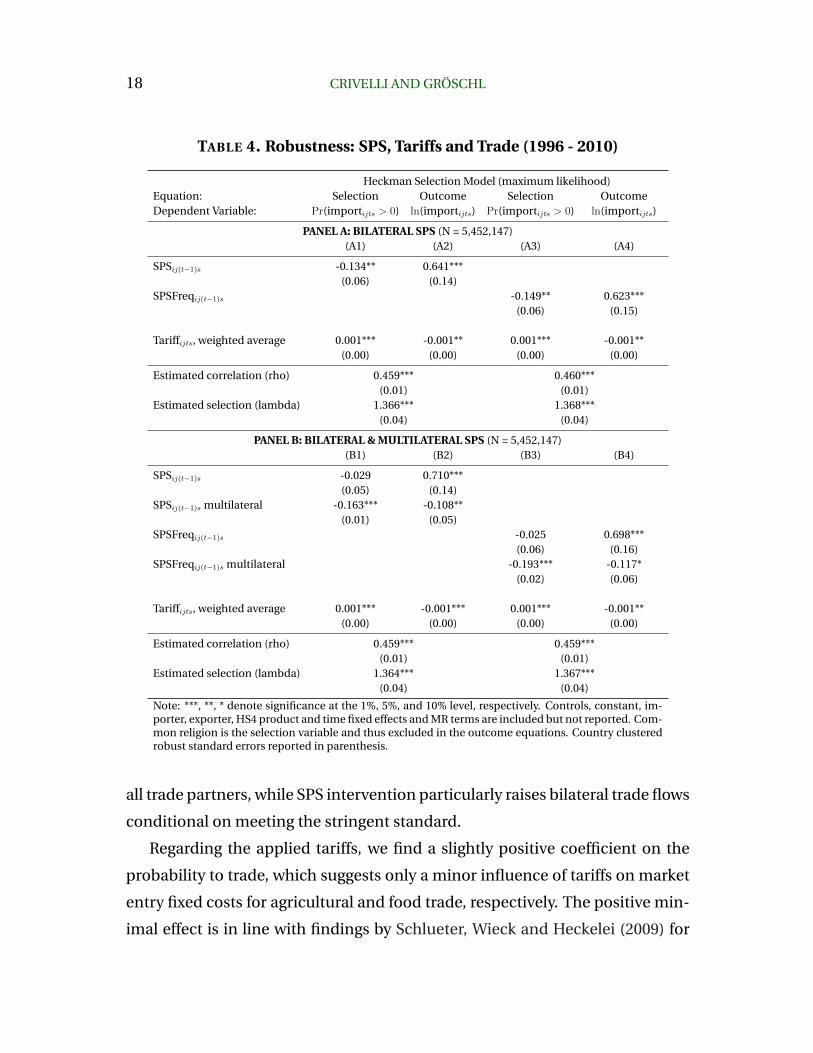
Bilateral Tariffs. Table 4 includes bilateral applied tariff protection as a fur-
ther control variable, to avoid a potential misspecification of the model and to
be able to distinguish the impact of SPS interventions on trade in agricultural
and food products from that of bilateral tariffs.
We include a specific control for bilateral tariffs only in the robustness sec-
tion for several reasons. First, even though data on bilateral tariffs are provided
by IDB and TRAINS, the data pose several limitations with respect to missing
values over time. Second, data do not include all specific duties, tariff quotas
and anti-dumping duties applied by importers. Third, we cannot distinguish
preferential from general tariffs, as data are not always available. In the follow-
ing, we include import weighted bilateral applied tariffs, with missing values
interpolated as discussed in section I.B.. We provide evidence that our previous
results do not suffer from a bias due to the omission of tariff data in the frame-
work. Table 4 provides the results. Coefficients on gravity controls remain qual-
itatively and quantitatively similar compared to Table 1. So do our results on
the effect of SPS measures on the extensive and the intensive margin of trade.
While SPS measures pose a barrier to market entry, producers who meet the
more stringent standard increase their trade flows conditional on market entry
(compare Panel A). Results on bilateral versus multilateral effects are robust as
well (compare Panel B). SPS measures constitute a market entry barrier against
18 CRIVELLI AND GRÖSCHL
TABLE 4. Robustness: SPS, Tariffs and Trade (1996 - 2010)
Heckman Selection Model (maximum likelihood)Equation: Selection Outcome Selection OutcomeDependent Variable: Pr(importijts > 0) ln(importijts) Pr(importijts > 0) ln(importijts)
PANEL A: BILATERAL SPS (N = 5,452,147)(A1) (A2) (A3) (A4)
SPSij(t−1)s -0.134** 0.641***(0.06) (0.14)
SPSFreqij(t−1)s -0.149** 0.623***(0.06) (0.15)
Tariffijts, weighted average 0.001*** -0.001** 0.001*** -0.001**(0.00) (0.00) (0.00) (0.00)
Estimated correlation (rho) 0.459*** 0.460***(0.01) (0.01)
Estimated selection (lambda) 1.366*** 1.368***(0.04) (0.04)
PANEL B: BILATERAL & MULTILATERAL SPS (N = 5,452,147)(B1) (B2) (B3) (B4)
SPSij(t−1)s -0.029 0.710***(0.05) (0.14)
SPSij(t−1)s multilateral -0.163*** -0.108**(0.01) (0.05)
SPSFreqij(t−1)s -0.025 0.698***(0.06) (0.16)
SPSFreqij(t−1)s multilateral -0.193*** -0.117*(0.02) (0.06)
Tariffijts, weighted average 0.001*** -0.001*** 0.001*** -0.001**(0.00) (0.00) (0.00) (0.00)
Estimated correlation (rho) 0.459*** 0.459***(0.01) (0.01)
Estimated selection (lambda) 1.364*** 1.367***(0.04) (0.04)
Note: ***, **, * denote significance at the 1%, 5%, and 10% level, respectively. Controls, constant, im-porter, exporter, HS4 product and time fixed effects and MR terms are included but not reported. Com-mon religion is the selection variable and thus excluded in the outcome equations. Country clusteredrobust standard errors reported in parenthesis.
all trade partners, while SPS intervention particularly raises bilateral trade flows
conditional on meeting the stringent standard.
Regarding the applied tariffs, we find a slightly positive coefficient on the
probability to trade, which suggests only a minor influence of tariffs on market
entry fixed costs for agricultural and food trade, respectively. The positive min-
imal effect is in line with findings by Schlueter, Wieck and Heckelei (2009) for

SPS AND TRADE 19
the meat sector. Further, the outcome equations suggest a minimal negative
impact of tariffs on trade flows. This negative impact of tariffs on the trade vol-
ume stands in line with findings by Disdier, Fontagné and Mimouni (2008) and
Fontagné, Mimouni and Pasteels (2005). Still, our results on the minor impact
of tariffs on agricultural and food trade should be read with caution since we ap-
ply an interpolation rule, as discussed in section I.B., and tariffs vary very little
over time but rather across countries in the time period that we are looking at.
Besides, keep in mind that the focus lies on the identification of the impact of
SPS on the extensive and the intensive margin of trade. Tariffs are only included
as a control variable for robustness reasons. Most importantly, the inclusion of
applied tariffs does not alter our results on the impact of SPS measures.
Reverse Causality. A further concern is that reverse causality might be a prob-
lem in our estimated framework if actors are forward looking. However, the
use of further instrumentation methods is not straightforward in the Heckman
model. To give an indication that forward looking actors are not an issue, we
estimate a simple 2SLS model. As instruments for concerns over SPS measures,
we use (i) the sum of SPS concerns of all other partner countries k 6= i against
the importer j in sector s, and (ii) the sum of SPS concerns raised by exporter i
against importer j in sectors l 6= sbut l, s ∈HS2 sector. The sum of SPS concerns
of all other partner countries k against an importer is uncorrelated to bilateral
trade between i and j, but is strongly correlated with SPS concerns of the ex-
porter against the importer. Following similar reason, concerns over SPS mea-
sures in other HS4 product categories l within the same HS2 sector are unlikely
to affect bilateral trade between the importer and the exporter in a specific HS4
product line s, but the sum of concerns related to other products l is strongly
correlated to SPS concerns over a specific HS4 product s.
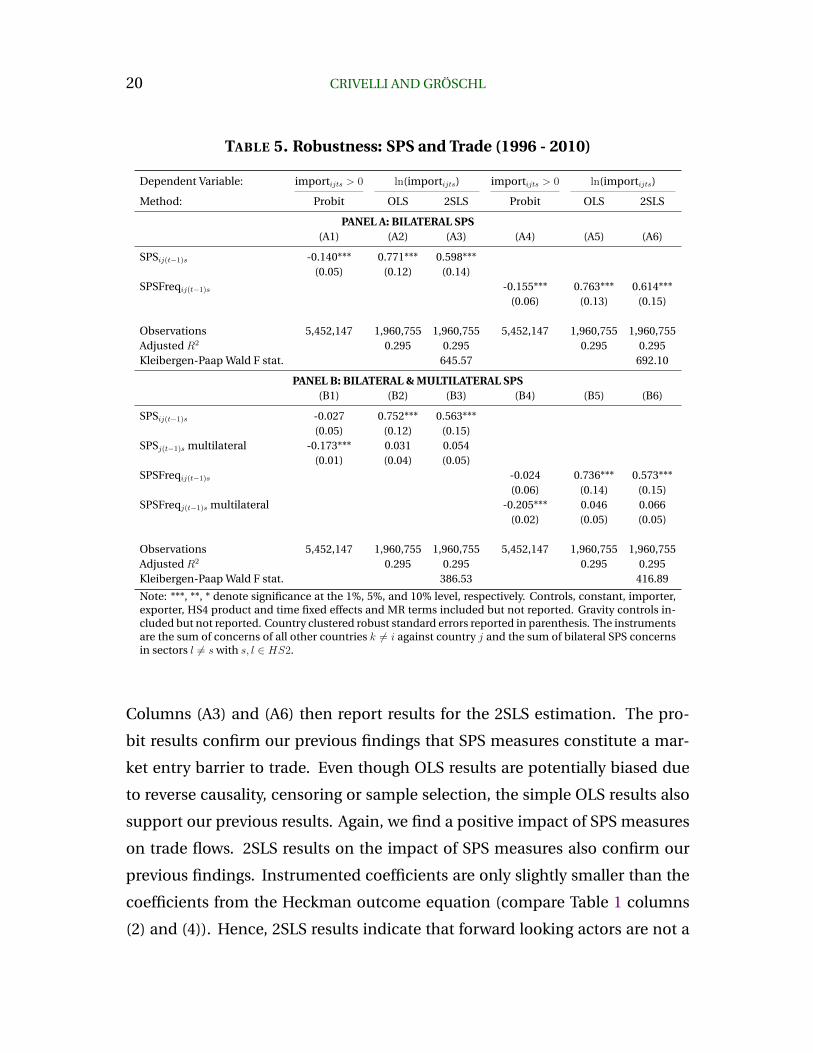
Table 5 Panel A reports the results for the SPS dummy variable and frequency
measure, respectively. For comparison reasons, we first show a probit and an
ordinary least squares (OLS) model in columns (A1) to (A2) and (A4) to (A5).
20 CRIVELLI AND GRÖSCHL
TABLE 5. Robustness: SPS and Trade (1996 - 2010)
Dependent Variable: importijts > 0 ln(importijts) importijts > 0 ln(importijts)
Method: Probit OLS 2SLS Probit OLS 2SLS
PANEL A: BILATERAL SPS(A1) (A2) (A3) (A4) (A5) (A6)
SPSij(t−1)s -0.140*** 0.771*** 0.598***(0.05) (0.12) (0.14)
SPSFreqij(t−1)s -0.155*** 0.763*** 0.614***(0.06) (0.13) (0.15)
Observations 5,452,147 1,960,755 1,960,755 5,452,147 1,960,755 1,960,755Adjusted R2 0.295 0.295 0.295 0.295Kleibergen-Paap Wald F stat. 645.57 692.10
PANEL B: BILATERAL & MULTILATERAL SPS(B1) (B2) (B3) (B4) (B5) (B6)
SPSij(t−1)s -0.027 0.752*** 0.563***(0.05) (0.12) (0.15)
SPSj(t−1)s multilateral -0.173*** 0.031 0.054(0.01) (0.04) (0.05)
SPSFreqij(t−1)s -0.024 0.736*** 0.573***(0.06) (0.14) (0.15)
SPSFreqj(t−1)s multilateral -0.205*** 0.046 0.066(0.02) (0.05) (0.05)
Observations 5,452,147 1,960,755 1,960,755 5,452,147 1,960,755 1,960,755Adjusted R2 0.295 0.295 0.295 0.295Kleibergen-Paap Wald F stat. 386.53 416.89
Note: ***, **, * denote significance at the 1%, 5%, and 10% level, respectively. Controls, constant, importer,exporter, HS4 product and time fixed effects and MR terms included but not reported. Gravity controls in-cluded but not reported. Country clustered robust standard errors reported in parenthesis. The instrumentsare the sum of concerns of all other countries k 6= i against country j and the sum of bilateral SPS concernsin sectors l 6= s with s, l ∈ HS2.
Columns (A3) and (A6) then report results for the 2SLS estimation. The pro-
bit results confirm our previous findings that SPS measures constitute a mar-
ket entry barrier to trade. Even though OLS results are potentially biased due
to reverse causality, censoring or sample selection, the simple OLS results also
support our previous results. Again, we find a positive impact of SPS measures
on trade flows. 2SLS results on the impact of SPS measures also confirm our
previous findings. Instrumented coefficients are only slightly smaller than the
coefficients from the Heckman outcome equation (compare Table 1 columns
(2) and (4)). Hence, 2SLS results indicate that forward looking actors are not a
SPS AND TRADE 21
problem in our setup. Our instruments are not only reasonable but also valid.
The Kleibergen-Paap Wald F test on excluded instruments indicates that our
F-Statistics range well above the 10% Stock and Yogo (2005) critical values, so
that we can firmly reject the weak instrument hypothesis (Kleibergen and Paap,
2006). Since we have two instruments, we can also compute a test of overiden-
tifying restrictions.15 The test fails to reject (p-value of 0.79) and thus indicates
that not all the instruments are coherent.
When we dissociate the impact of bilateral SPS measures from that of mul-
tilateral SPS measures on trade, results remain generally in line. Table 5 Panel
B reports the results. In terms of significance and magnitude, the probit mod-
els in columns (B1) and (B4) exhibit similar coefficients as those reported in
the selection equations of Table 3. The only major change regarding the OLS
and 2SLS models in columns (B2) to (B3) and (B5) to (B6), respectively, con-
cerns the loss of significance of the coefficient associated with the multilateral
SPS variable. Our results suggest that SPS measures exert a positive and sig-
nificant effect on the trade flows of the reporting country, but do not affect the
trade flows of other partner countries. This implies that the trade enhancing
effect of SPS measures is a bilateral matter which could not be handled using
notification-based data. In both 2SLS specifications, using either the dummy
variable or the frequency index, instruments are valid and feasible with respect
to the first stage F-Statistics. The Kleibergen-Paap Wald F Test on the excluded
instruments is way above the 10% Stock and Yogo (2005) critical value.
15Note that our results are robust when we use a just identified model using either of the twoinstruments.
22 CRIVELLI AND GRÖSCHL
III. Implementation
A. Benchmark Results
In the previous section, we point out that SPS measures pose a market entry
barrier due to increased fixed costs. In addition, we find a positive effect on
trade flows conditional on market entry due to the fact that the increase in
market share is proportionally larger than the variable trade costs due to prod-
uct adaption. However, governments may choose from a range of SPS instru-
ments to achieve certain policy goals related to animal, plant or human health.
The ensuing heterogeneity in SPS intervention may cause ambiguous outcomes
on trade, as different SPS instruments entail diverse costs. Measures related
to testing, inspection and approval procedures are particularly costly and bur-
densome for the exporter proportional to the information they provide to the
consumer. Such regulations may thus have a negative impact on market entry
and the amount of trade. Conformity assessment-related measures entail fixed
costs that relate to separate or redundant testing or certification of products
for various export markets and to the time required to comply with administra-
tive requirements and inspection by importer authorities. The latter may cause
time delays that severely impact the profitability of a specific market. Other
SPS measures directly related to product characteristics, such as quarantine re-
quirements, pesticide residue levels, labeling or packaging, may pose a barrier
to market entry, but once products meet higher standards, exporters gain mar-
ket share (possibly even in several export markets) due to an increase in con-
sumer trust through valuable product information. Accordingly, we expect that
conformity assessment-related measures explain the negative effect on market
entry, while concerns related to product characteristics explain the positive im-
pact on trade flows conditional on entering the market.
To systematically compare the implied trade effects of different SPS instru-
ments implemented to achieve a desired level of SPS safety, we distinguish con-
cerns over SPS measure into requirements related to conformity assessment
SPS AND TRADE 23
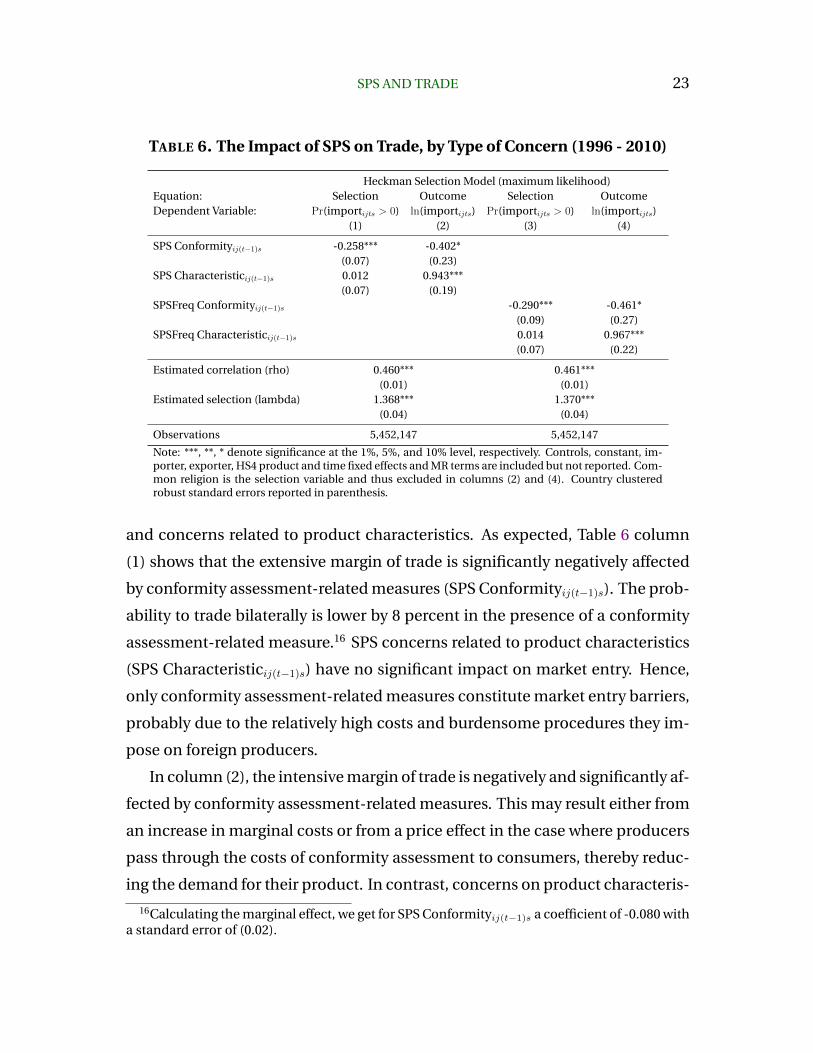
TABLE 6. The Impact of SPS on Trade, by Type of Concern (1996 - 2010)
Heckman Selection Model (maximum likelihood)Equation: Selection Outcome Selection OutcomeDependent Variable: Pr(importijts > 0) ln(importijts) Pr(importijts > 0) ln(importijts)
(1) (2) (3) (4)
SPS Conformityij(t−1)s -0.258*** -0.402*(0.07) (0.23)
SPS Characteristicij(t−1)s 0.012 0.943***(0.07) (0.19)
SPSFreq Conformityij(t−1)s -0.290*** -0.461*(0.09) (0.27)
SPSFreq Characteristicij(t−1)s 0.014 0.967***(0.07) (0.22)
Estimated correlation (rho) 0.460*** 0.461***(0.01) (0.01)
Estimated selection (lambda) 1.368*** 1.370***(0.04) (0.04)
Observations 5,452,147 5,452,147
Note: ***, **, * denote significance at the 1%, 5%, and 10% level, respectively. Controls, constant, im-porter, exporter, HS4 product and time fixed effects and MR terms are included but not reported. Com-mon religion is the selection variable and thus excluded in columns (2) and (4). Country clusteredrobust standard errors reported in parenthesis.
and concerns related to product characteristics. As expected, Table 6 column
(1) shows that the extensive margin of trade is significantly negatively affected
by conformity assessment-related measures (SPS Conformityij(t−1)s). The prob-
ability to trade bilaterally is lower by 8 percent in the presence of a conformity
assessment-related measure.16 SPS concerns related to product characteristics
(SPS Characteristicij(t−1)s) have no significant impact on market entry. Hence,
only conformity assessment-related measures constitute market entry barriers,
probably due to the relatively high costs and burdensome procedures they im-
pose on foreign producers.
In column (2), the intensive margin of trade is negatively and significantly af-
fected by conformity assessment-related measures. This may result either from
an increase in marginal costs or from a price effect in the case where producers
pass through the costs of conformity assessment to consumers, thereby reduc-
ing the demand for their product. In contrast, concerns on product characteris-
16Calculating the marginal effect, we get for SPS Conformityij(t−1)s a coefficient of -0.080 witha standard error of (0.02).
24 CRIVELLI AND GRÖSCHL
tics have a positive and significant impact on trade flows conditional on market
entry. This suggests that SPS measures related to product characteristics pro-
vide information that enhance consumer trust in the quality of imported goods.
The gain in market share is then relatively higher than the loss due to product
adaption costs. This leads to enhanced trade flows for exporters that manage
to overcome the fixed cost of market entry. The dummy measure indicates that
conformity assessment-related factors decrease trade in agriculture and food
products by 15.6 percent on average, while SPS measures related to product
characteristics increase trade flows by 93 percent conditional on market entry.17
Estimates suggest qualitatively similar result when we use the normalized fre-
quency index in Table 6 columns (3) and (4). The coefficient on conformity
assessment is again negative and significant for the extensive and the inten-
sive margin of trade, while the positive and significant impact of SPS concerns
related to product characteristics on trade flows prevails.
B. Bilateral versus Multilateral Effects
In an attempt to dissociate the bilateral from the multilateral character of SPS
measures, we again estimate the gravity model by including additional multi-
lateral SPS variables. Multilateral variables are equal to one for all potential
trading partners if at least one respective concern regarding a conformity as-
sessment or a product characteristics measure has been raised against the im-
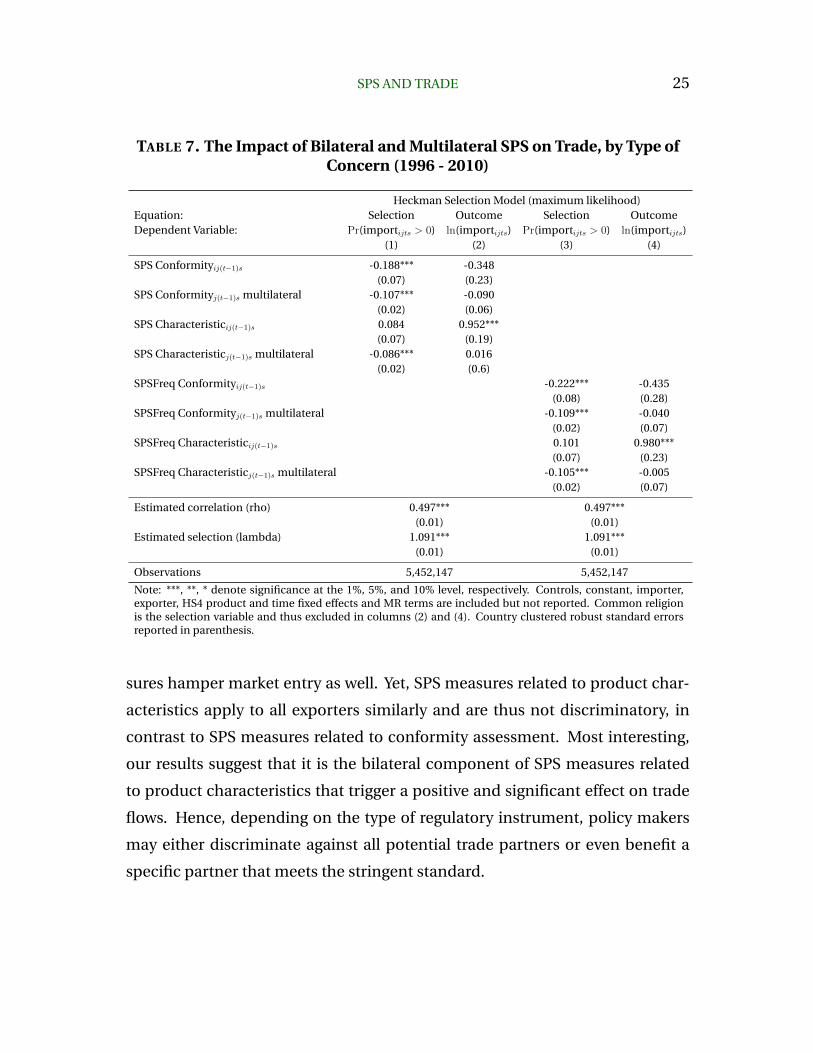
porter j in sector s. Results are reported in Table 7.
In columns (1) and (3), the negative and significant coefficients on the bilat-
eral and multilateral SPS Conformity variables point out that measures related
to conformity assessment reduce the probability of bilateral trade between the
country raising the concern and the one maintaining the measure, but also
impedes market entry for all other exporters. The negative significant coeffi-
cient of the multilateral SPS Characteristic variable indicates that such mea-17Calculating marginal effects of the outcome equation according to Greene (2003), we get a
coefficient of -0.156 with a standard error of (0.00) for SPS Conformityij(t−1)s and a coefficientof 0.931 with a standard error of (0.00) for SPS Characteristicij(t−1)s.
SPS AND TRADE 25
TABLE 7. The Impact of Bilateral and Multilateral SPS on Trade, by Type ofConcern (1996 - 2010)
Heckman Selection Model (maximum likelihood)Equation: Selection Outcome Selection OutcomeDependent Variable: Pr(importijts > 0) ln(importijts) Pr(importijts > 0) ln(importijts)
(1) (2) (3) (4)
SPS Conformityij(t−1)s -0.188*** -0.348(0.07) (0.23)
SPS Conformityj(t−1)s multilateral -0.107*** -0.090(0.02) (0.06)
SPS Characteristicij(t−1)s 0.084 0.952***(0.07) (0.19)
SPS Characteristicj(t−1)s multilateral -0.086*** 0.016(0.02) (0.6)
SPSFreq Conformityij(t−1)s -0.222*** -0.435(0.08) (0.28)
SPSFreq Conformityj(t−1)s multilateral -0.109*** -0.040(0.02) (0.07)
SPSFreq Characteristicij(t−1)s 0.101 0.980***(0.07) (0.23)
SPSFreq Characteristicj(t−1)s multilateral -0.105*** -0.005(0.02) (0.07)
Estimated correlation (rho) 0.497*** 0.497***(0.01) (0.01)
Estimated selection (lambda) 1.091*** 1.091***(0.01) (0.01)
Observations 5,452,147 5,452,147
Note: ***, **, * denote significance at the 1%, 5%, and 10% level, respectively. Controls, constant, importer,exporter, HS4 product and time fixed effects and MR terms are included but not reported. Common religionis the selection variable and thus excluded in columns (2) and (4). Country clustered robust standard errorsreported in parenthesis.
sures hamper market entry as well. Yet, SPS measures related to product char-
acteristics apply to all exporters similarly and are thus not discriminatory, in
contrast to SPS measures related to conformity assessment. Most interesting,
our results suggest that it is the bilateral component of SPS measures related
to product characteristics that trigger a positive and significant effect on trade
flows. Hence, depending on the type of regulatory instrument, policy makers
may either discriminate against all potential trade partners or even benefit a
specific partner that meets the stringent standard.
26 CRIVELLI AND GRÖSCHL
C . Sensitivity
We apply the same battery of robustness checks to the disaggregated SPS regu-
latory instruments than in section II.C .. Results remain generally in line.
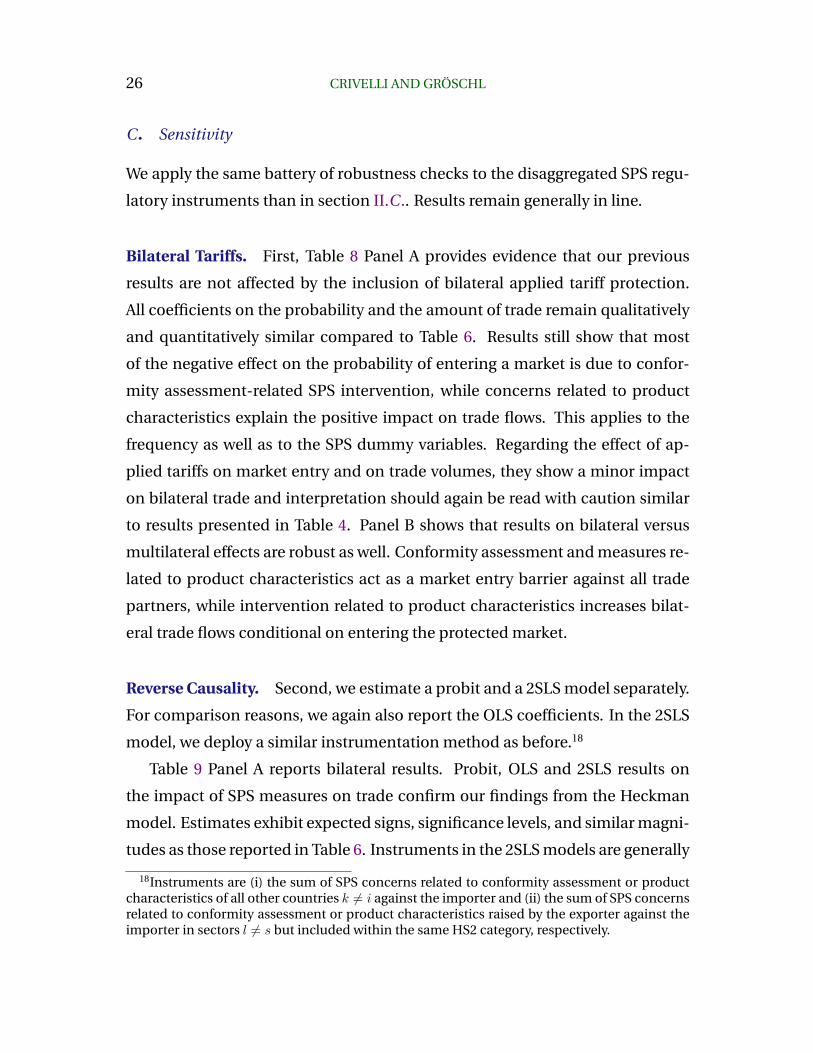
Bilateral Tariffs. First, Table 8 Panel A provides evidence that our previous
results are not affected by the inclusion of bilateral applied tariff protection.
All coefficients on the probability and the amount of trade remain qualitatively
and quantitatively similar compared to Table 6. Results still show that most
of the negative effect on the probability of entering a market is due to confor-
mity assessment-related SPS intervention, while concerns related to product
characteristics explain the positive impact on trade flows. This applies to the
frequency as well as to the SPS dummy variables. Regarding the effect of ap-
plied tariffs on market entry and on trade volumes, they show a minor impact
on bilateral trade and interpretation should again be read with caution similar
to results presented in Table 4. Panel B shows that results on bilateral versus
multilateral effects are robust as well. Conformity assessment and measures re-
lated to product characteristics act as a market entry barrier against all trade
partners, while intervention related to product characteristics increases bilat-
eral trade flows conditional on entering the protected market.
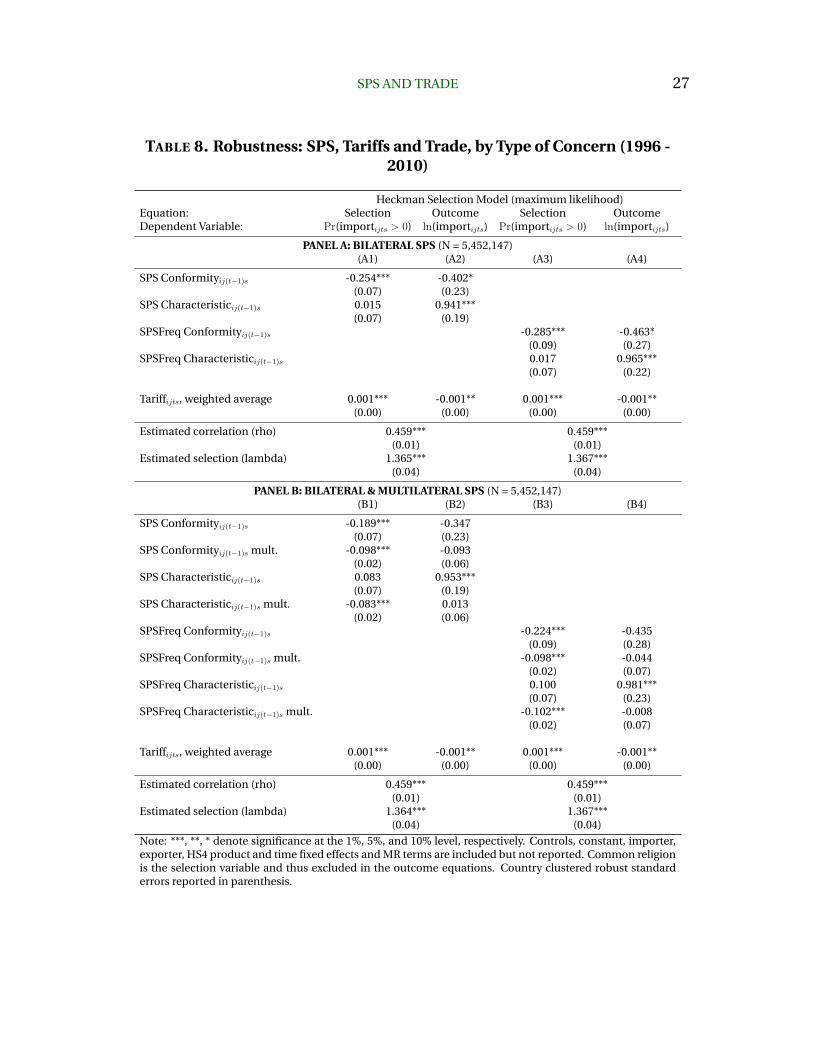
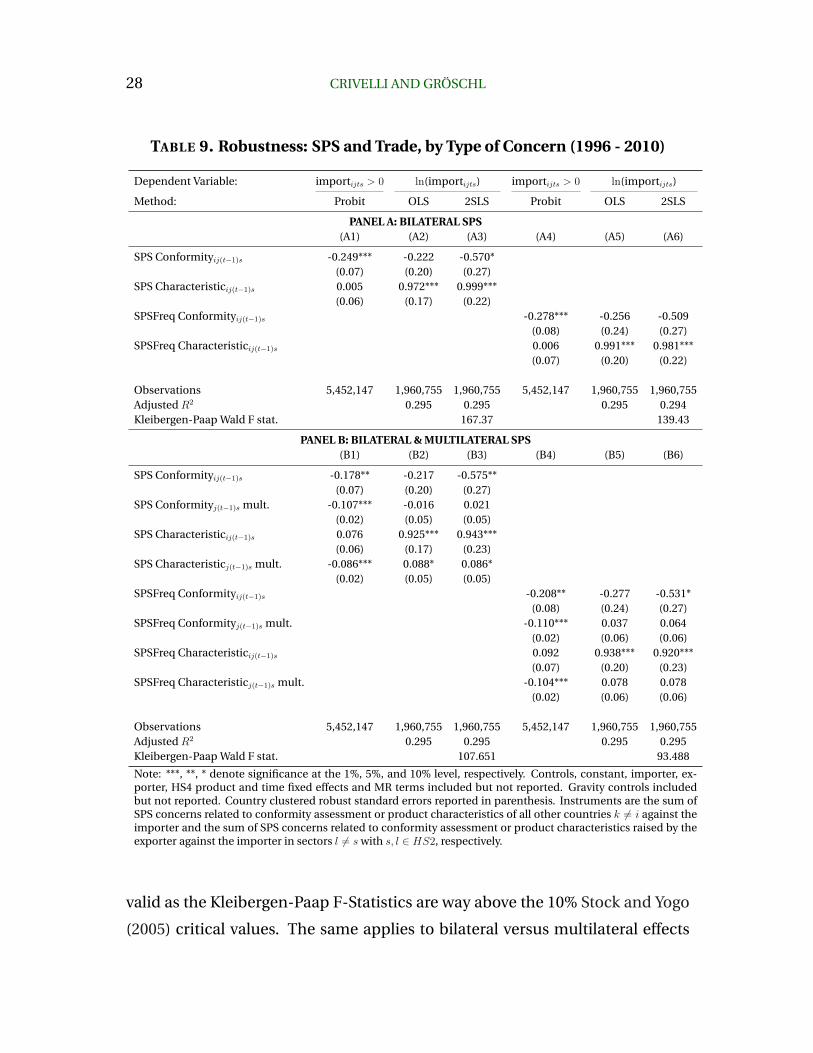
Reverse Causality. Second, we estimate a probit and a 2SLS model separately.
For comparison reasons, we again also report the OLS coefficients. In the 2SLS
model, we deploy a similar instrumentation method as before.18
Table 9 Panel A reports bilateral results. Probit, OLS and 2SLS results on
the impact of SPS measures on trade confirm our findings from the Heckman
model. Estimates exhibit expected signs, significance levels, and similar magni-
tudes as those reported in Table 6. Instruments in the 2SLS models are generally
18Instruments are (i) the sum of SPS concerns related to conformity assessment or productcharacteristics of all other countries k 6= i against the importer and (ii) the sum of SPS concernsrelated to conformity assessment or product characteristics raised by the exporter against theimporter in sectors l 6= s but included within the same HS2 category, respectively.
SPS AND TRADE 27
TABLE 8. Robustness: SPS, Tariffs and Trade, by Type of Concern (1996 -2010)
Heckman Selection Model (maximum likelihood)Equation: Selection Outcome Selection OutcomeDependent Variable: Pr(importijts > 0) ln(importijts) Pr(importijts > 0) ln(importijts)
PANEL A: BILATERAL SPS (N = 5,452,147)(A1) (A2) (A3) (A4)
SPS Conformityij(t−1)s -0.254*** -0.402*(0.07) (0.23)
SPS Characteristicij(t−1)s 0.015 0.941***(0.07) (0.19)
SPSFreq Conformityij(t−1)s -0.285*** -0.463*(0.09) (0.27)
SPSFreq Characteristicij(t−1)s 0.017 0.965***(0.07) (0.22)
Tariffijts, weighted average 0.001*** -0.001** 0.001*** -0.001**(0.00) (0.00) (0.00) (0.00)
Estimated correlation (rho) 0.459*** 0.459***(0.01) (0.01)
Estimated selection (lambda) 1.365*** 1.367***(0.04) (0.04)
PANEL B: BILATERAL & MULTILATERAL SPS (N = 5,452,147)(B1) (B2) (B3) (B4)
SPS Conformityij(t−1)s -0.189*** -0.347(0.07) (0.23)
SPS Conformityij(t−1)s mult. -0.098*** -0.093(0.02) (0.06)
SPS Characteristicij(t−1)s 0.083 0.953***(0.07) (0.19)
SPS Characteristicij(t−1)s mult. -0.083*** 0.013(0.02) (0.06)
SPSFreq Conformityij(t−1)s -0.224*** -0.435(0.09) (0.28)
SPSFreq Conformityij(t−1)s mult. -0.098*** -0.044(0.02) (0.07)
SPSFreq Characteristicij(t−1)s 0.100 0.981***(0.07) (0.23)
SPSFreq Characteristicij(t−1)s mult. -0.102*** -0.008(0.02) (0.07)
Tariffijts, weighted average 0.001*** -0.001** 0.001*** -0.001**(0.00) (0.00) (0.00) (0.00)
Estimated correlation (rho) 0.459*** 0.459***(0.01) (0.01)
Estimated selection (lambda) 1.364*** 1.367***(0.04) (0.04)
Note: ***, **, * denote significance at the 1%, 5%, and 10% level, respectively. Controls, constant, importer,exporter, HS4 product and time fixed effects and MR terms are included but not reported. Common religionis the selection variable and thus excluded in the outcome equations. Country clustered robust standarderrors reported in parenthesis.
28 CRIVELLI AND GRÖSCHL
TABLE 9. Robustness: SPS and Trade, by Type of Concern (1996 - 2010)
Dependent Variable: importijts > 0 ln(importijts) importijts > 0 ln(importijts)
Method: Probit OLS 2SLS Probit OLS 2SLS
PANEL A: BILATERAL SPS(A1) (A2) (A3) (A4) (A5) (A6)
SPS Conformityij(t−1)s -0.249*** -0.222 -0.570*(0.07) (0.20) (0.27)
SPS Characteristicij(t−1)s 0.005 0.972*** 0.999***(0.06) (0.17) (0.22)
SPSFreq Conformityij(t−1)s -0.278*** -0.256 -0.509(0.08) (0.24) (0.27)
SPSFreq Characteristicij(t−1)s 0.006 0.991*** 0.981***(0.07) (0.20) (0.22)
Observations 5,452,147 1,960,755 1,960,755 5,452,147 1,960,755 1,960,755Adjusted R2 0.295 0.295 0.295 0.294Kleibergen-Paap Wald F stat. 167.37 139.43
PANEL B: BILATERAL & MULTILATERAL SPS(B1) (B2) (B3) (B4) (B5) (B6)
SPS Conformityij(t−1)s -0.178** -0.217 -0.575**(0.07) (0.20) (0.27)
SPS Conformityj(t−1)s mult. -0.107*** -0.016 0.021(0.02) (0.05) (0.05)
SPS Characteristicij(t−1)s 0.076 0.925*** 0.943***(0.06) (0.17) (0.23)
SPS Characteristicj(t−1)s mult. -0.086*** 0.088* 0.086*(0.02) (0.05) (0.05)
SPSFreq Conformityij(t−1)s -0.208** -0.277 -0.531*(0.08) (0.24) (0.27)
SPSFreq Conformityj(t−1)s mult. -0.110*** 0.037 0.064(0.02) (0.06) (0.06)
SPSFreq Characteristicij(t−1)s 0.092 0.938*** 0.920***(0.07) (0.20) (0.23)
SPSFreq Characteristicj(t−1)s mult. -0.104*** 0.078 0.078(0.02) (0.06) (0.06)
Observations 5,452,147 1,960,755 1,960,755 5,452,147 1,960,755 1,960,755Adjusted R2 0.295 0.295 0.295 0.295Kleibergen-Paap Wald F stat. 107.651 93.488
Note: ***, **, * denote significance at the 1%, 5%, and 10% level, respectively. Controls, constant, importer, ex-porter, HS4 product and time fixed effects and MR terms included but not reported. Gravity controls includedbut not reported. Country clustered robust standard errors reported in parenthesis. Instruments are the sum ofSPS concerns related to conformity assessment or product characteristics of all other countries k 6= i against theimporter and the sum of SPS concerns related to conformity assessment or product characteristics raised by theexporter against the importer in sectors l 6= s with s, l ∈ HS2, respectively.
valid as the Kleibergen-Paap F-Statistics are way above the 10% Stock and Yogo
(2005) critical values. The same applies to bilateral versus multilateral effects

SPS AND TRADE 29
of SPS measures. Results hold and are reported in Table 9 Panel B. The posi-
tive impact of SPS measures on trade flows can be attributed to SPS measures
related to product characteristics which mainly benefit the country raising the
concern. But, there is evidence that SPS measures related to product character-
istics also promote trade with all partners conditional on entering the market
(compare columns (B2) and (B3)). Further, when using instrumentation meth-
ods, we find that SPS measures related to conformity assessment significantly
reduce the bilateral exports of the country reporting the concern. Instruments
are again valid and the first stage F-Tests on the excluded instruments pass the
most stringent criterion of the Stock and Yogo (2005) critical values.
IV. Concluding Remarks
This paper contributes to the literature by investigating the impact of SPS mea-
sures on the extensive and the intensive margin of agricultural and food trade.
Using the database on specific trade concerns on SPS measures of the WTO, we
deploy a Heckman selection model at the HS4 disaggregated level of trade that
controls for a potential selection bias and zero trade flows using both a dummy
variable and a normalized frequency measure on SPS concerns.
We find that aggregate SPS measures pose a negative effect on the proba-
bility to export to a protected market, but, conditional on market entry, trade
flows to markets with SPS standards in place tend to be higher. This reveals two
important issues: First, SPS measures pose a serious barrier to market entry by
increasing the fixed costs of trading. Second, SPS standards provide informa-
tion on product safety to consumers and thus exert a positive impact on the
trade flows of those exporters that manage to overcome the fixed cost of en-
tering the market. Hence, foreign producers who meet the stringent standard
gain market share. The advantage from gaining market share outweighs the
costs of product adaption to meet the standard and leads to a positive effect
on trade flows. The results are robust to the inclusion of applied bilateral tar-
30 CRIVELLI AND GRÖSCHL
iff data and to instrumentation. In addition, we find robust evidence that SPS
measures pose market entry barriers to all potential exporters and are thus non-
discriminatory. In contrast, conditional on market entry, SPS measures mostly
increase trade flows of those countries that raise a concern over an SPS measure
at the WTO SPS committee to the detriment of other exporters.
Further, we determine the trade outcomes on agricultural and food prod-
ucts of different SPS regulations implemented by policy makers to achieve cer-
tain health safety objectives. We distinguish concerns related to conformity as-
sessment (i.e., certificate requirements, testing, inspection and approval pro-
cedures) and concerns related to product characteristics (i.e., requirements on
quarantine treatment, pesticide residue levels, or labeling and packaging). Re-
sults indicate that conformity assessment-related SPS measures act as a bar-
rier to market entry, while concerns related to product characteristics increase
trade once exporters meet the stringent standard. This suggests that confor-
mity assessment-related measures increase fixed costs due to often burden-
some and separate certification, testing and inspection procedures in different
export markets. In contrast, SPS measures related to product characteristics en-
hance consumer trust by providing safety information on imported products.
This result is particularly interesting for policy makers who often have to
choose from a set of measures that equivalently reduce health risks but entail
diverse trade costs. Even though SPS measures cover a relatively narrow area
of health and safety measures that are often directly related to consumer pro-
tection, policy makers should be aware that policy substitution may be put at
some expense. Hence, depending on the policy maker’s choice between con-
formity assessment versus product characteristics measures, the implied im-
pact on trade varies strongly. In particular, conformity assessment-related SPS
measures increase the fixed costs of trade in agricultural and food products.
SPS AND TRADE 31
References
Anderson, J. E., and E. Van Wincoop. 2003. “Gravity with Gravitas: A Solutionto the Border Puzzle.” American Economic Review, 93(1): 170–192.
Anders, S. M., and J. A. Caswell. 2009. “Standards as Barriers Versus Standardsas Catalysts: Assessing the Impact of HACCP Implementation on US SeafoodImports.” American Journal of Agricultural Economics, 91(2): 310–321.
Baier, S. L., and J. H. Bergstrand. 2009. “Bonus vetus OLS: A Simple Method forApproximating International Trade-Cost Effects Using the Gravity Equation.”Journal of International Economics, 77(1): 77–85.
De Frahan, B. H., and M. Vancauteren. 2006. “Harmonisation of Food Regu-lations and Trade in the Single Market: Evidence from Disaggregated Data.”European Review of Agricultural Economics, 33(3): 337–360.
Disdier, A.-C., and F. van Tongeren. 2010. “Non-Tariff Measures in Agri-FoodTrade: What Do the Data Tell Us? Evidence from a Cluster Analysis on OECDImports.” Applied Economic Perspectives and Policy, 32(3): 436–455.
Disdier, A.-C., and S. Marette. 2010. “The Combination of Gravity and WelfareApproaches for Evaluating Nontariff Measures.” American Journal of Agricul-tural Economics, 92(3): 713–726.
Disdier, A.-C., L.l Fontagné, and M. Mimouni. 2008. “The Impact of Regula-tions on Agricultural Trade: Evidence from the SPS and TBT Agreements.”American Journal of Agricultural Economics, 90(2): 336–350.
Drogué, S., and F. DeMaria. 2011. “Pesticides Residues and Trade: The Apple ofDiscord?” Working Paper EU NTM Impact Project, FP7 NTM-Impact WorkingPaper 10/02.
Fassarella, L. M., M. J. Pinto de Souza, and H. L. Burnquist. 2011. “Impact ofSanitary and Technical Measures on Brazilian Exports.” Mimeo.
Fontagné, L., G. Orefice, R. Piermartini, and N. Rocha. 2012. “Product Stan-dards and Margins of Trade: Firm Level Evidence.” WTO Staff Working Paper.
Fontagné, L., M. Mimouni, and J.-M. Pasteels. 2005. “Estimating The Impact ofEnvironmental SPS and TBT on International Trade.” Integration and TradeJournal, 22(3): 7–37.
Gebrehiwet, Y., S. Ngqangweni, and J. F. Kirsten. 2007. “Quantifying the TradeEffect of Sanitary and Phytosanitary Regulations of OECD Countries on SouthAfrican Food Exports.” Agrekon, 46(1): 1–17.
32 CRIVELLI AND GRÖSCHL
Greene, W. H. 2003. Econometric Analysis. Prentice Hall International, Inc.
Heckman, J. J. 1979. “Sample Selevtion Bias as a Specification Error.” Econo-metrica, 47(1): 153–161.
Helpman, E., M. Melitz, and Y. Rubinstein. 2008. “Estimating Trade Flows:Trading Partners and Trading Volumes.” Quaterly Journal of Economics,123(2): 441–487.
Jayasinghe, S., J. C. Beghin, and G. Moschini. 2010. “Determinants of WorldDemand for US Corn Seeds: The Role of Trade Costs.” American Journal ofAgricultural Economics, 92(4): 999–1010.
Kleibergen, F., and R. Paap. 2006. “Generalized reduced rank tests using thesingular value decomposition.” Journal of Econometrics, 133(1): 97–126.
Otsuki, T., J. S. Wilson, and M. Sewadeh. 2001a. “Saving Two in a Billion: Quan-tifying the Trade Fefect of European Food Safety Standards on African Ex-ports.” Food Policy, 26(5): 495–514.
Otsuki, T., J. S. Wilson, and M. Sewadeh. 2001b. “What Price Precaution? Eu-ropean Harmonization of Aflatoxin Regulations and African Groundnut Ex-ports.” European Review of Agricultural Economics, 28(3): 263–284.
Roberts, D., T. Josling, and D. Orden. 1999. “A Framework for AnalyzinigTechnical Trade Barriers in Agricultural Markets.” Technical Bulletins, UnitedStates Department of Agriculture.
Schlueter, S. W., C. Wieck, and T. Heckelei. 2009. “Regulatory Policies in MeatTrade: Is There Evidence for Least Trade-Distorting Sanitary Regulations?”American Journal of Agricultural Economics, 91(5): 1484–1490.
Stock, J.H., and M. Yogo. 2005. “Testing for Weak Instruments in Linear IV Re-gression.” In Identification And Inference For Econometric Models: Essays InHonor Of Thomas Rothenberg. 80–108. Cambridge University Press.
Wilson, J. S., and T. Otsuki. 2004. “Standards and Technical Regulations andFirms in Developing Countries: New Evidence from a World Bank TechnicalBarriers to Trade Survey.” Mimeo.
Wooldridge, J. M. 2002. Econometric Analysis of Cross Section and Panel Data.The MIT Press.
WTO. 2012. “World Trade Report 2012 – Trade and Public Policies: A Closer Lookat Non-Tariff Measures in the 21st Century.” Geneva: World Trade Organiza-tion.

SPS AND TRADE 33
Xiong, B., and J. Beghin. 2011. “Does European Aflatoxin Regulation HurtGroundnut Exporters from Africa?” European Review of Agricultural Eco-nomics, Published Online November 22.
34 CRIVELLI AND GRÖSCHL
Appendix
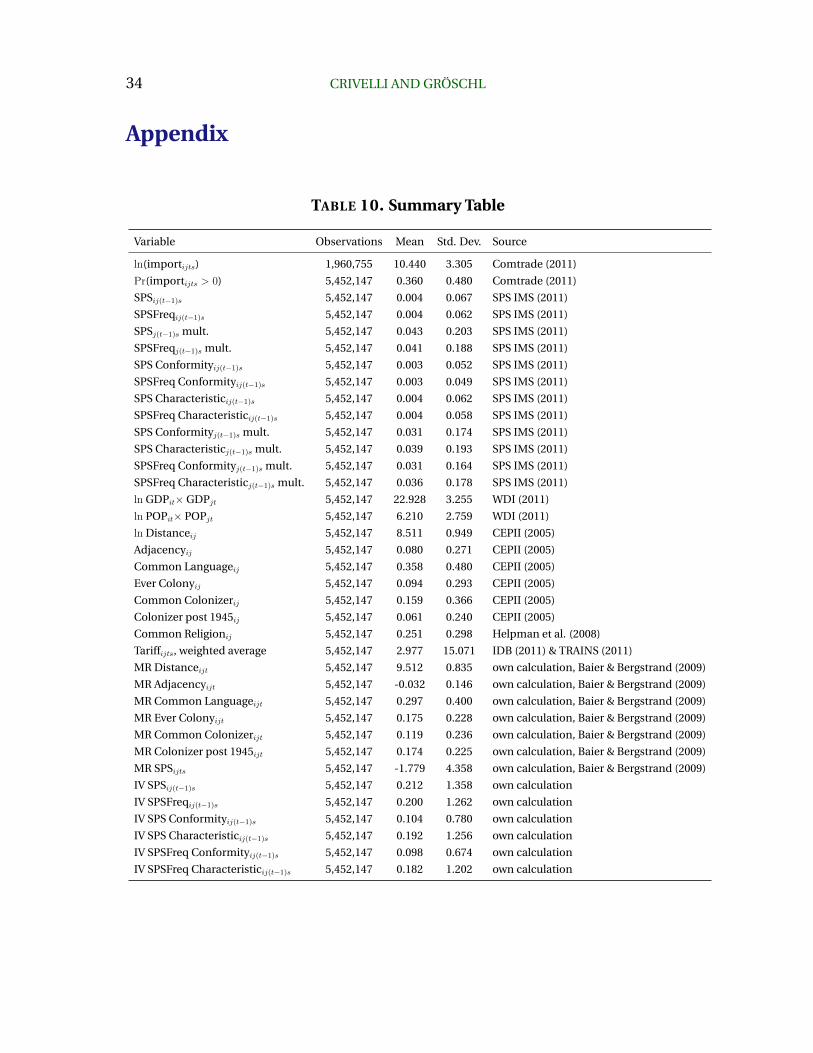
TABLE 10. Summary Table
Variable Observations Mean Std. Dev. Source
ln(importijts) 1,960,755 10.440 3.305 Comtrade (2011)
Pr(importijts > 0) 5,452,147 0.360 0.480 Comtrade (2011)
SPSij(t−1)s 5,452,147 0.004 0.067 SPS IMS (2011)
SPSFreqij(t−1)s 5,452,147 0.004 0.062 SPS IMS (2011)
SPSj(t−1)s mult. 5,452,147 0.043 0.203 SPS IMS (2011)
SPSFreqj(t−1)s mult. 5,452,147 0.041 0.188 SPS IMS (2011)
SPS Conformityij(t−1)s 5,452,147 0.003 0.052 SPS IMS (2011)
SPSFreq Conformityij(t−1)s 5,452,147 0.003 0.049 SPS IMS (2011)
SPS Characteristicij(t−1)s 5,452,147 0.004 0.062 SPS IMS (2011)
SPSFreq Characteristicij(t−1)s 5,452,147 0.004 0.058 SPS IMS (2011)
SPS Conformityj(t−1)s mult. 5,452,147 0.031 0.174 SPS IMS (2011)
SPS Characteristicj(t−1)s mult. 5,452,147 0.039 0.193 SPS IMS (2011)
SPSFreq Conformityj(t−1)s mult. 5,452,147 0.031 0.164 SPS IMS (2011)
SPSFreq Characteristicj(t−1)s mult. 5,452,147 0.036 0.178 SPS IMS (2011)
ln GDPit× GDPjt 5,452,147 22.928 3.255 WDI (2011)
ln POPit× POPjt 5,452,147 6.210 2.759 WDI (2011)
ln Distanceij 5,452,147 8.511 0.949 CEPII (2005)
Adjacencyij 5,452,147 0.080 0.271 CEPII (2005)
Common Languageij 5,452,147 0.358 0.480 CEPII (2005)
Ever Colonyij 5,452,147 0.094 0.293 CEPII (2005)
Common Colonizerij 5,452,147 0.159 0.366 CEPII (2005)
Colonizer post 1945ij 5,452,147 0.061 0.240 CEPII (2005)
Common Religionij 5,452,147 0.251 0.298 Helpman et al. (2008)
Tariffijts, weighted average 5,452,147 2.977 15.071 IDB (2011) & TRAINS (2011)
MR Distanceijt 5,452,147 9.512 0.835 own calculation, Baier & Bergstrand (2009)
MR Adjacencyijt 5,452,147 -0.032 0.146 own calculation, Baier & Bergstrand (2009)
MR Common Languageijt 5,452,147 0.297 0.400 own calculation, Baier & Bergstrand (2009)
MR Ever Colonyijt 5,452,147 0.175 0.228 own calculation, Baier & Bergstrand (2009)
MR Common Colonizerijt 5,452,147 0.119 0.236 own calculation, Baier & Bergstrand (2009)
MR Colonizer post 1945ijt 5,452,147 0.174 0.225 own calculation, Baier & Bergstrand (2009)
MR SPSijts 5,452,147 -1.779 4.358 own calculation, Baier & Bergstrand (2009)
IV SPSij(t−1)s 5,452,147 0.212 1.358 own calculation
IV SPSFreqij(t−1)s 5,452,147 0.200 1.262 own calculation
IV SPS Conformityij(t−1)s 5,452,147 0.104 0.780 own calculation
IV SPS Characteristicij(t−1)s 5,452,147 0.192 1.256 own calculation
IV SPSFreq Conformityij(t−1)s 5,452,147 0.098 0.674 own calculation
IV SPSFreq Characteristicij(t−1)s 5,452,147 0.182 1.202 own calculation
SPS AND TRADE 35
TABLE 11. List of Agricultural and Food Sectors and Products included in theData
HS2 Code Constraint Specification
01 Live Animals
02 Meat and Edible Meat Offal
03 Fish and Crustaceans
04 Dairy, Eggs, Honey and Edible Products
05 Products of Animal Origin
06 Live Trees and other Plants
07 Edible Vegetables
08 Edible Fruits and Nuts, Peel of Citrus and Melons
09 Coffee, Tea, Mate and Spices
10 Cereals
11 Milling Industry Products
12 Oil Seeds, Miscellaneous Grains, Medical Plants and Straw
13 Lac, Gums, Resins, Vegetable Saps and Extracts Nes
14 Vegetable Plaiting Materials
15 Animal and Vegetable Fats, Oils and Waxes
16 Edible Preparations of Meat, Fish, Crustaceans
17 Sugars and Sugar Confectionery
18 Cocoa and Cocoa Preparations
19 Preparations of Cereals, Flour, Starch or Milk
20 Preparations of Vegetables, Fruits and Nuts
21 Miscellaneous Edible Preparations
22 Beverages, Spirits and Vinegar
23 Residues from Food Industries and Animal Feed
24 Tobacco and Manufacturing Tobacco Substitutes
29 includes 2905 Organic Chemicals
33 includes 3301 Essential Oils, Resinoids, Perfumery, Cosmetic or Toilet Preparations
35 includes 3501 to 3505 Albuminoidal Substances, Starches, Glues, Enzymes
38 includes 3809 and 3824 Miscellaneous Chemical Products
41 includes 4101 to 4103 Raw Hides and Skins (other than Furskins) and Leather
43 includes 4301 Furskins and Artificial Fur, Manufactures thereof
50 includes 5001 to 5003 Silk
51 includes 5101 to 5103 Wool, Animal Hair, Horsehair Yarn and Fabric thereof
52 includes 5201 to 5203 Cotton
53 includes 5301 and 5302 Vegetable Textile Fibers Nes, Paper Yarn, Woven Fabric
Note: This list follows the products listed in Annex 1 in the Agricultural Agreement of the WTO, yet, alsoincluding fish, fishing and seafood products. All HS4 product codes in an HS2 sector are included if notspecified otherwise in the constraints column.
Ifo Working Papers
No. 135 Slavtchev, V. and S. Wiederhold, Technological Intensity of Government Demand and
Innovation, August 2012.
No. 134 Felbermayr, G.J., M. Larch and W. Lechthaler, The Shimer-Puzzle of International
Trade: A Quantitative Analysis, August 2012.
No. 133 Beltz, P., S. Link and A. Ostermaier, Incentives for Students: Evidence from Two Natural
Experiments, August 2012.
No. 132 Felbermayr, G.J. and I. Reczkowski, International Student Mobility and High-Skilled
Migration: The Evidence, July 2012.
No. 131 Sinn, H.-W., Die Europäische Fiskalunion – Gedanken zur Entwicklung der Eurozone,
Juli 2012.
No. 130 Felbermayr, G.J., A. Hauptmann and H.-J. Schmerer, International Trade and Collective
Bargaining Outcomes. Evidence from German Employer-Employee Data, March 2012.
No. 129 Triebs, T.P. and S.C. Kumbhakar, Management Practice in Production, March 2012.
No. 128 Arent, S., Expectations and Saving Behavior: An Empirical Analysis, March, 2012.
No. 127 Hornung, E., Railroads and Micro-regional Growth in Prussia, March, 2012.
No. 126 Seiler, C., On the Robustness of the Balance Statistics with respect to Nonresponse,
March 2012.
No. 125 Arent, S., A. Eck, M: Kloss and O. Krohmer, Income Risk, Saving and Taxation: Will
Precautionary Saving Survive?, February 2012.
No. 124 Kluge, J. and R. Lehmann, Marshall or Jacobs? Answers to an Unsuitable Question from
an Interaction Model, February 2012.
No. 123 Strobel, T., ICT Intermediates, Growth and Productivity Spillovers: Evidence from
Comparison of Growth Effects in German and US Manufacturing Sectors, February 2012.
No. 122 Lehwald, S., Has the Euro Changed Business Cycle Synchronization? Evidence from the
Core and the Periphery, January 2012.
No. 121 Piopiunik, M. and M. Schlotter, Identifying the Incidence of “Grading on a Curve”: A
Within-Student Across-Subject Approach, January 2012.
No. 120 Kauppinen, I. and P. Poutvaara, Preferences for Redistribution among Emigrants
from a Welfare State, January 2012.
No. 119 Aichele, R. and G.J. Felbermayr, Estimating the Effects of Kyoto on Bilateral Trade
Flows Using Matching Econometrics, December 2011.
No. 118 Heid, B., J. Langer and M. Larch, Income and Democracy: Evidence from System
GMM Estimates, December 2011.
No. 117 Felbermayr, G.J. and J. Gröschl, Within US Trade and Long Shadow of the American
Secession, December 2011.
No. 116 Felbermayr, G.J. and E. Yalcin, Export Credit Guarantees and Export Performance:
An Empirical Analysis for Germany, December 2011.
No. 115 Heid, B. and M. Larch, Migration, Trade and Unemployment, November 2011.
No. 114 Hornung, E., Immigration and the Diffusion of Technology: The Huguenot Diaspora
in Prussia, November 2011.
No. 113 Riener, G. and S. Wiederhold, Costs of Control in Groups, November 2011.
No. 112 Schlotter, M., Age at Preschool Entrance and Noncognitive Skills before School – An
Instrumental Variable Approach, November 2011.
No. 111 Grimme, C., S. Henzel and E. Wieland, Inflation Uncertainty Revisited: Do Different
Measures Disagree?, October 2011.
No. 110 Friedrich, S., Policy Persistence and Rent Extraction, October 2011.
No. 109 Kipar, S., The Effect of Restrictive Bank Lending on Innovation: Evidence from a
Financial Crisis, August 2011.