Embed Size (px)
Citation preview

1
The Impact of SAFTA on the Sri Lankan Economy
Upalinie Ajitha Tennakoon*
ABSTRACT
The purpose of this paper is to quantify and analyze the relative impact of South Asian Free
Trade Agreement (SAFTA) on economic welfare, trade and inter-sectoral allocation of resources
in Sri Lanka. The Global Trade Analysis Project (GTAP) model is used to analysis the possible
impact of SAFTA on Sri Lanka in a multi country, multi sector applied general equilibrium
framework because the form of regional trade liberalization that Sri Lanka is considering is
global in nature and has economy wide implications. The simulation results suggest that SAFTA
would generate significant benefits for both Sri Lanka and India. In contrast, SAFTA would have
an adverse impact on the other SAAARC member countries (Rest of South Asia) because of the
trade diversion. Competitive suppliers in Sri Lanka would enjoy a greater market share, and
consumers will have access to cheaper goods with more varieties. Trade liberalization also
provides strong incentives to local producers to improve production technology and use research
and development to generate innovations that will enhance their production competitiveness. On
the other hand, the reduction of protection will increase import competitivenss and industries that
were previously protected will become less competitive in the domestic market. Besides the
welfare gains suggested by the simulations, SAFTA may have many non economic benefits,
particularly social and political those are difficult to account for in a quantitative way.
Key words: trade liberalization, free trade agreement, SAFTA, welfare gains, non-economic
benefits.
JEL classification: F13, F15, F 17.
*Address Correspondence to:
Dr. Upalinie Ajitha Tennakoon
Senior Lecturer,Department of Economics
University of Kelaniya
Kelaniya, Sri Lanka.
Email: [email protected]
Phone: 94 - 11-2914488 (Office)
94 - 11-2901729 (Residence)

2
Introduction
Sri Lanka1 (known as Ceylon until 1972) is a small island economy with a total land area of
65,610 square kilometres, and a population of over 19.6 million in the year 2005. The annual
population growth rate was 2.2 percent in 1971, which fell to 1.1 percent in 2005. Over the last
five decades, Sri Lanka’s economy grew by an annual average rate of 4.2 per cent, with erratic
performance from year to year. As can be seen in Table .1, in 2005, Sri Lanka’s per capita GDP
was US$ 1197, as compared with US$190 three decades before, in 19712. The real GDP growth
rate has increased from 0.2 percent in 1971 to 6.0 percent in 2005. However, this growth rate
could not elevate the country to a high growth path due to deep rooted deficiencies in growth
promoting factors such as internal armed conflicts, lasting some 20 years, tsunami disaster, surge
in international oil prices to historical high levels, droughts, floods, and political uncertainty.
Without these problems, Sri Lanka’s economy would have grown much faster.
Sri Lanka has achieved considerable progress in terms of human development in the post-
independence period mainly due to the social development policies adopted by successive
Governments in the fields of health, education, food subsidies and welfare payments. As a result,
the human development indicators are much higher than those of many developing countries
including South Asian countries and they are comparable with indicators of developed countries
(Table. 2). Sri Lanka is also a heavily trade-dependent country. Sri Lanka’s trade integration,
measured by the trade-GDP ratio stood at 73 percent of GDP in 2005.
Sri Lankan economy consists of three major sectors: agriculture, industry and services.
Agriculture remains an important sector in Sri Lanka with a third of the population engaged in
agricultural or related activities. It contributed 17 % to GDP (Table .3) and 18 per cent of the total
exports in 2005 (Table-4). Sri Lanka’s traditional export products include tea, rubber, and
coconut; non-traditional exports include spices, shrimp, fresh fruit, vegetables, floricultural
products, and organic crops. Nevertheless, the industrial sector contributed 27% to GDP and

3
accounted for 25% of employment in 2005. The textiles and clothing sector, the leading net
foreign exchange earner, is the largest industrial sector, accounting for 40% of industrial output.
Food, beverages and tobacco is the second most important industry (22%), followed by the
chemicals, petroleum, and rubber and plastic products (21%). The services sector provided the
major impetus to economic growth. The sector has been benefiting from globalization and
liberalization especially in the areas of port services, telecommunication, construction and
financial services. In 2005, the services sector’s contribution to GDP was 56 per cent and it
accounted for 45 % of employment. (Central Bank of Sri Lanka, 2005).
Despite the continuous civil war, microeconomic difficulties and political instabilities, the
"export-oriented industrialization strategy" introduced in 1977 which aimed at diversifying the
industrial sector, is still in place and international trade continued to operate in a free and liberal
economic environment. Thus, the general trade policy objectives of Sri Lanka include moving
towards a more outward-oriented trade regime, strengthening and increasing overseas market
access for Sri Lankan products, and further integrating Sri Lanka into the world economy. These
objectives have been pursued through unilateral, multilateral, regional, and bilateral trade
negotiations.
The objective of this study is to present a quantitative assessment of trade liberalization exercises
in Sri Lanka in terms of economic welfare, trade, and the intersectoral allocation of resources.
This paper begins with a review of Sri Lanka’s economic reforms and their coverage. Section II
discusses the methodology, offering a brief description of CGE Modelling including the GTAP.
The experimental designs are discussed in Sections III. Apart from unilateral and regional trade
liberalization, as a founding member of the WTO, Sri Lanka remained firmly committed to the
multilateral trading system and has already established a large number of reforms in keeping with
the GATT/WTO principles. However, the paper does not review the outcome of multilateral trade
liberalization. In Section IV, GTAP model simulation results are analyzed. Section V concludes.
4
Section I
Until the late 1970s, Sri Lanka’s economic development centred on an inward-oriented
development strategy based on import substitution industrialization performed mainly by state-
owned firms. Both tariff and non-tariff barriers were widely used to protect domestic economic
activities. Trade restrictive policies were accompanied by other regulatory policies such as
control on foreign exchange, finance and foreign direct investment. These restrictive economic
policies had severe adverse implications on overall economic growth, in particular growth of
exports.
Sri Lanka introduced extensive economic reforms in 1977 becoming the first country in the South
Asian region to do so. The economy was freed from the inward-oriented strategy, and adopted an
outward-oriented export-led development strategy, which was followed by many East Asian
countries at that time. Trade liberalization was the key element of this new policy package and it
entailed reliance on tariffs, replacement of quantitative restrictions including import licensing 4 by
a revised system of tariffs as well as the relaxation of other controls on trade. In order to
encourage both domestic and foreign investment, the Government offered a series of incentives,
while attempting to create an environment conducive to investment. 5
In recent years, however, the focus of Sri Lanka’s trade policy has seemingly shifted towards
regionalism, which Sri Lanka considers a springboard for broader trade liberalization. The
rationale for regional cooperation is based on a number of factors, not all of which are necessarily
economic in nature. The formation of EU, NAFTA, MERCOSUR and ASEAN, and the recent
emergence of other regional trading blocs 6 may have given rise to a revival of interest in
regionalism in Sri Lanka. This also explains the country’s desire to avoid marginalization as
more and more countries become members of various RTAs (Baldwin, 1993). Further, an RTA
facilitates the choice of a selective liberalization policy as mutually agreed by all member
economies, keeping them protected from global competition. Thus, Sri Lanka continued to

5
promote international trade through active participation in several regional trading agreements
such as South Asian Preferential Trading Agreement (SAPTA),7 India-Sri-Lanka Free Trade
Agreement (ILFTA),8 Bangkok Agreement (BA)9, the Bay of Bengal Initiative for Multisectoral
Technical and Economic Cooperation (BIMST-EC) 10 comprising Bangladesh, India, Myanmar,
Sri Lanka and Thailand and Indian Ocean Rim Association for Regional Cooperation (IOR-
ARC).11 The Free Trade Agreement (FTA) between Pakistan and Sri Lanka (PLFTA) became
operational from June 2005.12
SAPTA was the first major step in moving towards a free trade area and higher forms of regional
economic integration among the member states of the South Asian Association for Regional Co-
operation (SAARC). SAARC was established in 1985 by member countries consisting of
Bangladesh, Bhutan, India, Maldives, Nepal, Pakistan and Sri Lanka. The population of SAARC
countries accounts for one fifth of the world population and almost half of the world’s poor. The
original rationale for preferential trading among SAARC countries stems from the conviction that
these countries needed to pursue a policy of rapid industrialization in order to overcome their
economic backwardness. Both industrial and agricultural sectors of the SAARC countries need
vast technological improvements to take advantage of the global market. It is also expected that
regional co-operation in South Asia will become an important means of accelerating trade and
investment in the region.
The agreement on SAPTA was signed in Dhaka in April 1993 by the SAAC members, providing
a legal framework for trade liberalization and strengthening intra-regional economic cooperation.
In 1995, SAPTA had been ratified by all contracting states and in accordance with Article 22 of
the agreement SAPTA became operational on 7th December 1995. SAPTA followed a positive list
approach, including flexible provisions for least developed countries (LDCs). At the Ninth
SAARC Summit held in Male in 1997, the Heads of Governments decided to accelerate the pace
of transition of SAPTA to South Asian Free Trade Agreement (SAFTA) by the year 2001 or

6
failing that, not later than 2005. The fourth round of SAPTA negotiations was completed in 2002
but the process has not been very effective as concessions offered have been less attractive. “In
the past there have been several attempts to establish SAFTA, but the lack of political will and
disputes among members hindered its progress.” (Central Bank of Sri Lanka, 2005, p.79).
However, the renewed effort to accelerate trade liberalization through the signing of the
Agreement on SAFTA during the twelfth SAARC Summit in 2004 is noteworthy. Member States
including Sri Lanka have agreed to begin implementation of it from 1 July 2006, and SAFTA will
become fully operational with the intra-regional tariff of non-negative list items reaching 1-5 per
cent by 2016.
Section II
Methodology
It is widely acknowledged that applied general equilibrium (AGE) or computable general
equilibrium (CGE) modelling has become the tool of choice for analysis of a wide range of trade
policy issues such as tariffs and non-tariff barriers (NTBs) in both developed and developing
countries in a variety of settings. In particular, AGE modeling is useful for analyzing the welfare
effect of trade policy that needs to address second-best issues, where there are significant
interactions between policy measures for one sector and distortions elsewhere in the economy.
Such models have two distinctive features: they incorporate a number of distinct sectors, and the
behavioural equations of the model deal with the response of industries and consumers to changes
in relative prices (Adams et al., 1998). This development is explained by the capability of CGE
models to provide an elaborate and realistic representation of the economy, including the linkages
between all agents, sectors and other economies (Brockmeier, 1996)
AGE analysis also provides a valuable tool for putting things in an economy-wide perspective
(Hertel, 1999). The general equilibrium framework contains all commodities, factor markets
together with decision-making agents who respond to price signals and are internally consistent

7
through capturing the many important feedback effects. Therefore, conceptually, these models
can explicitly capture all the economy-wide interactions and inter-sectoral linkages. Hence, these
models are very useful for analyzing the changes in sectoral output, product prices, factor usage,
and factor prices as well as changes in national welfare measures consequent to changes in trade
regimes. CGE evaluations typically work with theoretical models, and allow for more interaction
among endogenous variables in that they can capture the numerous complex relationships
between variables of policy interest in the model economy.
The usefulness of a partial equilibrium approach is limited in analyzing the effect of trade policy
changes, which are propagated throughout the economy. For example, the changes of tariff policy
affect the consumption, production and relative prices of imports and their domestic equivalents,
and ultimately, allocation of resources within the policy-changing country. Partial equilibrium
approach can not capture these market interactions and quantify in a sensible way the impact of
policy changes on all affected economic agents in the economy under consideration. On the other
hand, economy-wide econometric models pay less attention to economic theory and more
attention to time series data and typically manage to estimate all parameters by focusing on only a
few endogenous variables. Econometric evaluations can be appraised with standard statistical
criteria but they do not capture the complicated interactions in product and factor markets
throughout the economy.
Limitations of the CGE Models
Despite the importance of CGE modeling in policy analysis, a series of questions have been
raised about the empirical validity of these models. The core of the critique is focused on unsound
parameter selection criteria, because the choice of elasticity values critically affects the results of
policy simulations generated by these models. In the calibration method, some parameters are
determined on the basis of a survey of empirical literature, some chosen arbitrarily, and the
remainders are set at values, which force the model to replicate the data of a chosen benchmark

8
year (Shoven and Whalley, 1992). Most often the estimated elasticities for commodity and/or
industry classifications are based on econometric studies, which are not totally consistent with the
countries represented in the model or they may even be “guesstimates” when no published figures
are available. Therefore these models face two trade-offs, between transparency and complexity
because on one hand, to implement large complex models the researchers are forced to choose
parameters using ad hoc methods and, on the other, it is hard to understand what is driving the
results in such complex models (Baldwin and Venables, 1995). Hence, one key issue with these
models is how robust the results are to alternative parameter values, because there is no
meaningful statistical method to test the significance of the calibrated benchmark parameter
values in CGE models.
Another critique related to the calibration procedure of the contemporary CGE modeling focuses
on the over-reliance on non-flexible functional forms (those in the Constant Elasticity of
Substitution (CES) class), and a convenient separability structure on technologies that imposes
influential restrictions on the model’s structure. McKitrick (1998) found that the choice of
functional structure strongly influences the results from a policy simulation at both the industry-
specific and macroeconomic levels.
Despite all these criticisms, however, the CGE models have already made contributions to trade
policy issues in a wide variety of settings and therefore one can argue that these criticisms are
somewhat misguided. The database and numerical results of the CGE models are intended to be
more than merely illustrative and provide the internal consistent framework for policy evaluation
with many implications and feedback effects that are based on solid microeconomic foundations.
The key behavioural parameters in these models are related to econometric work in the literature
and the careful use of a systematic sensitivity analysis approach 13 would clearly indicate how
robust the findings are with respect to the uncertainty in parameter values. An evaluation of the
robustness of model results can certainly help to increase the creditability of model conclusions.

9
As Scollay and Gilbert (2000, p. 177) point out “Distortions in an economic system will generally
have repercussions far beyond the sector in which those distortions occur, and where the
distortions are wide-ranging, general equilibrium is perhaps the only method which is capable of
capturing the relevant feedback and flow-through effects.”
The GTAP Model
In this study, the widely used Global Trade Analysis Project (GTAP), a multi-country, multi-
sector AGE model (Hertel, 1997) 14 has been employed to empirically assess the impact of trade
liberalization reforms in Sri Lanka. Multi-country, economy-wide CGE models are designed to
work out the relative prices of various inputs and outputs mixes of the economies of interest as
well as indicating the global changes in world trade patterns. Thus, the strength of a global AGE
model lies in its ability to help us understand the linkages between sectors, countries and factors
on a global scale. The general equilibrium structure recognizes that all parts of the world
economy hinge together in a network of direct and indirect linkages. This means that any change
in any part of the system will, in principle, have repercussions throughout the entire world. As
McDougall (1995, p. 88) clearly points out “its characteristics are that it is economy-wide, it is
multi-sectoral, and it gives a central role to the price mechanism. These characteristics
differentiate it from partial equilibrium modeling (not economy-wide), macroeconomic modeling
(not multi-sectoral), and input-output modeling (agents don’t respond to price signals).”The
GTAP model was designed for comparative–static analysis 15 of trade policy issues in an
economy-wide framework.
Since the changes in trade policies and production levels in any of the regions and sectors will
have impacts on other regions and sectors, even though my main focus of this study is on results
for Sri Lanka, it is possible to incorporate the policy changes of other countries within a global
CGE modeling framework. It is only through a general equilibrium evaluation that economic
policies can be assessed in terms of their impacts on welfare. It is also easy to make a comparison

10
between different trade policy options through a global CGE model. The GTAP facilitates such
multi-country, economy-wide analysis.
Since this study focuses on global trading relations and detailed sectoral and regional trading
activities of the Sri Lankan economy, many of the simulations we need to consider require a
global perspective. For example, in the case of membership of SAFTA, it is needed to consider
the effects on Sri Lanka of a reduction of domestic import tariffs on other SAFTA members. I
also need to assess the impact of the reduction or elimination of import tariffs on Sri Lanka’s
exports by SAFTA members on the Sri Lankan economy and on its sectoral distribution. Using a
global model like GTAP, we can endogenously capture the effects of policy changes of other
countries explicitly on Sri Lanka. This ensures that changes abroad in combination with Sri
Lanka’s changes are used to generate new terms of trade for Sri Lanka.
The theory behind the GTAP model is similar to that of other standard; multi-regional CGE
models. 16 A main characteristic of this class of numerical models is the input-output structure,
which links industries together in a value-added chain, from primary goods to final goods for
consumption. The GTAP system of equations is based on microeconomic foundations providing a
detailed specification of household and firm optimizing behaviour within individual regions and
trade linkages between regions.
Figure 1 gives a graphical exposition of the GTAP model structure by focusing on the accounting
relationship of all agents in the multi region open economy. 17 There is a regional household
associated with each country or composite region of the GTAP model. Firms (producers), private
households, and governments are represented as economic agents in each region of the model.
The regional household collects all income that is generated in the economy. Regional income
consists of VOA (Value of Output at Agent’s prices) paid by producers for the use of endowment
commodities (factor income), and the sum over all taxes net of subsidies.

11
All taxes (TAXES ) levied in the economy always accrue to the regional household. In each
region, a regional household allocates regional income over the three forms of final demand:
private household expenditure (PRIVEXP), government expenditure (GOVEXP), and savings
(SAVE). Thus the final demand is represented by total utility, which is derived with a simplified
Cobb-Douglas utility function to aggregate total household consumption, total government
spending, and total saving. This approach represents the standard aggregation of GTAP, in which
each component of final demand gets a constant share of total regional income. Thus, an increase
in regional income causes an equipropotional change in private expenditures, government
expenditures and savings. 18
Each region of the GTAP model has a single representative private household. The private
household supplies endowment commodities to producers, and obtains factor income in return. In
GTAP, endowment commodities are non-tradable goods, which include land, unskilled labour,
skilled labour, capital, and natural resources. Within each region, the model distinguishes
between primary factors that are perfectly mobile across productive sectors and those that are
sluggish. In the standard aggregation of the GTAP database, skilled and unskilled labour and
capital are treated as perfectly mobile across industries within each region, whereas natural
resources and land are treated as sluggish factors of production. 19 The responses of the supply of
factors to changes in relative sectoral returns depend on the value of the transformation
elasticities parameters. The household buys bundles of commodities to maximize utility, subject
to its expenditure constraint. 20 The bundles are nested CES combinations of domestic goods and
import bundles, with the import bundles being CES aggregations of imports from each region.
The elasticity of substitution between imported and domestically produced goods in this
composite nest of the utility tree is assumed to be equal across uses.
In GTAP, the government revenues come from household income taxes, producers’ taxes, and
taxes on international transactions (minus subsidies, if they exist). As can be seen from Figure 1,

12
the government spends its income on domestically produced goods-VDGA (value of domestic
government purchases, evaluated at agents’ prices) and imported goods - VIGA (value of
expenditure on imported tradable commodities by the government). The total government
expenditure on each commodity category i.e. domestically produced and imported supplies, is
allocated across commodities by a Cobb-Douglas constant budget share.
In GTAP, savings is derived by assuming a Cobb-Douglas utility function and is treated as a
function of regional total income and price, so that all savers in the model face a common price
for the savings commodity (PSAVE). In particular, savings enter a regional utility function, along
with composite private consumption and aggregate government purchases. This reflects an
implicit assumption of fixed savings rates. Savings are included as GLOBAL Savings in Figure 1.
Thus, the regional income in excess of regional expenditure is saved and used as investments by
producers. In the GTAP model, economic welfare is measured in terms of EV (equivalent
variation), which indicates the reduction/increase in the external transfer, which would be
equivalent in its effects to the tariff increase/decrease. Thus EV takes the old equilibrium incomes
and prices, and computes the change needed to achieve new equilibrium utilities. 21
There are two global sectors in the GTAP model for international consistency of trade and
financial flows. The global transportation sector that provides the services account for the
difference between fob and cif values for a particular commodity shipped along a specific route.
The global banking sector intermediates between global savings and investment. Investment in
each region is financed from a global pool of savings. Each region contributes a fixed proportion
of its income to the savings pool. Thus, regional savings are gathered by the global banking
sector to create composite investment good (GLOBINV), based on a portfolio of net regional
investment (NETINV), and offers this to regional households in order to satisfy their savings
demand (Hertel and Tsigas, 1997). Since the size of the portfolio of global investment adjusts to
accommodate changes in global savings, the global closure in this model is neo-classical. Thus,

13
when global equilibrium is reached, all firms earn zero profits (including the global transport
sector), and all households are on their budget constraint, then global investment must equal
global savings and Walras’ Law will be satisfied.
Both factor and commodity markets are assumed to be perfectly competitive in the GTAP model.
The representative firm in each industry produces goods subject to constant returns to scale
technology, and every sector produces a single output. In this model, firms’ behaviour depends
largely on the assumption of separability in the production structure. It is assumed that primary
factors of production and intermediate inputs are separable, and hence, there is no substitution
between primary factors and intermediate goods. The overall elasticity of substitution among
primary factors determines the ability of the economy to alter its output mix in response to
changes in relative prices, or changes in the endowments of these factors. Thus, primary factors
are assumed to substitute for one another according to the constant elasticity of substitution, while
composite value added and intermediates are used in fixed proportions (Table 5 reports the
elasticities of substitution in the GTAP model). Separability in production also means that the
elasticity of substitution between any individual primary factor, on the one hand, and intermediate
inputs on the other, is equal. The production technology in GTAP is represented by a set of nested
CES and Leontief (fixed) functions. As shown in Figure .2, at the first level of the production
tree, producers use a composite unit of intermediate inputs and primary factors in fixed
proportions according to a Leontief function. At the second level, firms purchase composites of
primary factors and composites of intermediate inputs that are obtained as combinations of
domestic goods and imported bundles of the same commodity category. Domestic and imported
intermediate inputs can be substituted according to a CES form. At the third level, a CES form is
also assumed to capture the degree of substitutability between imports of different origin.
Employing the Armington assumption, 22 the GTAP model assumes that goods from different
sources are imperfect substitutes. Thus the imported commodities are separable from

14
domestically produced goods. Similarly, imported intermediates are also assumed to be separable
from domestically produced intermediates. Accordingly, there are two sets of Armington or
source substitution elasticities in the GTAP database. One of these relates to the substitution
between domestic and imported composites (domestic-import substitution elasticity) - ESUBD.
The other one relates to the substitution among imports from different sources (import-import
substitution elasticity) –ESUBM. In GTAP, these elasticities are defined separately for each of
the representative agents within each region rather than referring to single economy-wide demand
behaviour. For cross-regional behaviour, the model assumes that for each commodity all agents
in all regions display the same substitution elasticity.
In GTAP, international trade is included by the addition of a region, namely, the Rest of the
World (ROW). The ROW is the source of imports into the regional economy, as well as the
destination for its exports. Figure-1 indicates that firms on one side get additional revenues for
selling commodities to the ROW (VXMD). On the other side, the producers spend their revenues
not only on primary factors and domestically produced intermediate inputs, but also on
intermediate imports (VIFA), and an additional consumption tax on imports to the regional
household, denoted as TAXES. Furthermore, both the government and private household have to
pay additional commodity TAXES on imports. Thus, the ROW gets payments for selling its goods
to the private household, the government, and the firms. These revenues will be spent on
commodities exported from the single region to the rest of the world (VXMD), and on import
taxes, (MTAX), and export taxes (XTAX) paid to the regional household. As can be seen from
Figure 7.2, imports are traced to specific agents in the domestic economy, resulting in distinct
import payments to ROW from private households (VIPA), government households (VIGA), and
firms (VIFA).
In the GTAP model, the additional value flows denoted as taxes (TAXES) arise due to various
policy interventions. The TAXES flow from private household, firms and government to the

15
regional household (Figure .1). Due to the policy intervention, the government pays consumption
taxes on commodities it purchases, and commodity taxes on imports. In contrast to that, taxes
paid by the private household cover consumption taxes, commodity taxes on imports and income
tax net of subsidies. In GTAP, producers also pay taxes to the regional household. These value
flows represent taxes on intermediate inputs, consumption tax on imported inputs, and production
taxes net of subsidies.
The GTAP Data Base
The GTAP database is the database for the GTAP model of the world economy, which is publicly
available. 23 The main data source for this model is “The GTAP 4 Data Base” (McDougall et. al.,
1998), which refers to the year 1995 and therefore, all of the analysis in this study was taken from
this base year. The benchmark equilibrium data set serves as a description of the economy in the
initial equilibrium before any policy changes have been made. The database covers the 50 sectors
within each of the 45 regions. The centerpiece of the GTAP database consists of input-output
(I/O) data for each region, which account for inter-sectoral linkages within regions, detailed
bilateral trade, transport, and protection data that link 45 country/regional economic databases.
Thus, the GTAP database is easy to adapt to appropriate sectoral and regional aggregations that
allow one to focus on specific policy questions. The regional databases in the model are derived
from individual country input-output (I/O) tables that provide information about the individual
regional economies in the model. The bilateral trade data was primarily derived from the United
Nations COMTRADE (Commodity Trade) database. The Economic Research Service (ERS) of
the United States Department of Agriculture (USDA) supplied the missing information in the UN
trade data
The Regional and Commodity Aggregation in the Model
Since the full GTAP database contains 45 regions and 50 commodities, it is generally necessary
to aggregate regions and commodities to a higher level for reason of computational efficiency.

16
Therefore, the database is aggregated to 10 regions and 10 commodities, which emphasizes
sectors and countries of interest for this study. Accordingly, the 10 regions of the model
constitute Sri Lanka (LKA), India (IND), Rest of South Asia (RAS), Association of South East
Asian Nations (ASEAN-5), Rest of Asia (ROA), Japan (JPN), and countries in the European
Union (EU), countries in the North American Free Trade Area (NAFTA), Middle East (MIE) and
Rest of the World (ROW). The regional aggregation scheme is presented in Table .6.
The country aggregation is chosen to reflect Sri Lanka’s major trading partners. Thus India and
Japan separated from the rest of the world because of the growing importance of these countries
as sources of imports to Sri Lanka. The database disaggregates data at a country level but not for
all countries. Thus, country level data exist for India and Sri Lanka but not for the rest of the
SAARC countries. These countries (Bangladesh, Bhutan, Maldives, Nepal and Pakistan) have
data as a group under “Rest of South Asia.” Therefore, these countries are included as the Rest of
South Asia (RAS). The East and Southeast Asian countries are aggregated into two groups as
ASEAN-5 (Indonesia, Malaysia, Philippines, Singapore, and Thailand) and Rest of Asia (China,
Hong Kong, Korea and Taiwan) because these two regions are also major sources for Sri Lanka’s
imports. While the member countries of the European Union (United Kingdom, Germany,
Denmark, Sweden, Finland and the Rest of European Union) are aggregated as the EU, the
United States, Canada and Mexico are aggregated as NAFTA. Moreover, all the countries in the
Middle East included as Middle East. The EU, NAFTA and the Middle East countries are major
destinations for Sri Lanka’s exports.
Similarly, the ten commodity categories in this model are intended to represent the commodities
that are of major interest to the Sri Lanka economy. The commodity categories in the model are:
Agriculture, Forestry and Fishing (AGRI); Mining and Quarrying (MINQ); Processed Food
(PROF); Textiles (TEXT); Wearing Apparels (WEAP); Petroleum and Coal Products (PECP);
Machinery and Equipment (MAEQ); Transport Equipment (TREQ); Other Manufactures

17
(OTHM) and Services (SERC). The commodity aggregation chosen and detailed in each of the
above commodity categories are shown in Table .7.
Section III: Experimental Designs
All experiments were conducted with the standard general equilibrium closure 25 of the GTAP
model. According to the standard closure of the model, prices, quantities of all non-endowment
commodities and regional incomes are endogenous variables. Conversely, exogenous variables in
this closure include population, the numeraire price of savings, all technological change variables,
all slack variables except the Walrasian slack variable, all policy variables, and all endowments.
If the value of the walraslack is zero, then global savings equals global investment and the
solution is consistent in a general equilibrium sense. Finally, the global bank’s allocation of
investment across region is flexible (RORDELTA=1). Thus the rate of return to investment is
allowed to equalize across countries, so that savings demand can be met by investment in other
countries, as well as by the country’s own investment. The elasticity of the expected rate of return
to investment with respect to end-of-period capital stocks (RORFLEX) is set at 10 (the default
setting for this parameter), making the supply of new capital goods quite insensitive to the
expected rate of return.
As shown in Table. 8, trade liberalization policy analysis for Sri Lanka proceeds with six
scenarios of alternative trade policy options. The first scenario (Experiment-1) was undertaken in
the context of Sri Lanka’s unilateral trade liberalization. Since the Government of Sri Lanka is
committed to continue trade reforms with the aim of introducing a uniform tariff rate (15 percent)
over the medium term (Government of Sri Lanka, 1995)., this experiment is based on the
assumption that Sri Lanka unilaterally reduces its import tariffs to 15 percent, to maintain a
uniform tariff structure on a global basis. In this case, we assume that the rest of the world does
not reciprocate.

18
The second trade reform scenario (Experiment-2) was conducted under the regional trade
liberalization policy option to examine the impact of South Asian Free Trade Agreement- SAFTA
in different contexts from the perspective of Sri Lanka. As a member of the SAPTA, Sri Lanka is
committed to continue major trade liberalization measures, to establish and promote free trade
arrangements for strengthening inter-regional economic co-operation and the development of
national economies. In this experiment, it was assumed that Sri Lanka and each of the SAARC
member countries in the model (India and the Rest of South Asia comprising Bangladesh,
Bhutan, Maldives, Nepal and Pakistan) remove their tariffs against each other, while maintaining
their tariffs against the rest of the world. The third scenario (Experiment-3) was conducted to
combine the unilateral trade liberalization policy option (15 per cent uniform tariff for the rest of
the world) with the regional trade liberalization policy option (SAFTA with SAARC
countries).The rationale for this scenario is that the Sri Lankan government envisages introducing
a uniform external tariff of 15 per cent while having free trade agreement with SAARC countries
under the SAFTA. In this experiment, we assume that Sri Lanka and each of the SAARC
countries remove their tariffs against each other, but Sri Lanka maintains a 15 per cent uniform
import tariff for the rest of the world.
Sensitivity Analysis
Sensitivity analysis for AGE models is critical for establishing the robustness and obtaining the
acceptance of model results. Although AGE models have become important tools of analysis in
the quantitative evaluation of trade policy, the solutions obtained from these models are
conditional on many assumptions. Among many assumptions, one set of assumptions-the values
of model parameters such as elasticities-are amenable to “sensitivity analysis.” 26 Evaluation of
the robustness of the model results can also help to increase the credibility of the conclusions of
the study.
In the GTAP model, the substitutability among imported commodities from different sources is
determined by the Armington elasticity of substitution parameter called ESUBM. According to
the Armington assumption, each country has some degree of market power over its products and
can influence its terms of trade because that goods from different sources are treated as imperfect

19
substitutes. Hence, to reduce Sri Lanka’s market power, it is necessary to increase the
substitutability among imports from different origins because the terms trade effects largely
depend on the import-import substitution elasticities (McDougall et al., 1998). This kind of
experiment could also be interpreted as a form of conditional systematic sensitivity analysis
(CSSA).27 Under the CSSA; each parameter is separately perturbed from its central value
conditional on all the other parameters remaining at their central values. The robustness of the
model results is then revealed by comparison of the simulation results with the central case.
Thus, three additional experiments are undertaken under the sensitivity analysis to reduced Sri
Lanka’s market power by increasing the values of ESUBM to capture the effect of possibly
different adjustment capacities as a small country. Though this will affect all countries/regions’
market power in the model, it will have most effect on the small countries like Sri Lanka. The
first experiment under the sensitivity analysis (Experiment 4) deals with the unilateral trade
liberalization scenario. (15 percent uniform import tariff). The second experiment (Experiment 5)
related to the regional trade liberalization (SAFTA by itself) and the third one (Experiment 6)
conducted under the unilateral trade liberalization with combination of regional trade
liberalization (SAFTA cum 15 percent uniform import tariff).
To make these experiments manageable, two separate experiments are conducted under the
Experiments 4, 5 and 6 respectively. Thus, under the first experiment, the parameter ESUBM was
perturbed from its central value and then increased its value by 50 per cent in the first three
scenarios-Experiments 4-1, 5-1 and 6-1 respectively. Under the second experiment, the value of
ESUBM was doubled (100 percent increase) for the other three scenarios-Experiments 4-2, 5-2,
and 6-2 respectively. With these six scenarios, it was assumed that all other parameters (except
ESUBM) in the model remain at their central values.
Section IV: Simulation Results
Experiment-1: Reduction of Import Tariffs to 15 percent
The first experiment considered the Sri Lanka’s reduction of import tariffs to 15 percent under the
unilateral trade liberalization. The impact of this scenario on regional welfare and the resulting
percentage changes in sectoral output and trade are reported in Table 9 and 10 respectively.
Accordingly, if Sri Lanka (LKA) reduces its import tariffs to 15 percent unilaterally on a global
basis to maintain a uniform external tariff rate, Sri Lanka experiences a welfare gain around US$

20
201 million (1.53 percent of the GDP). Under this scenario, Sri Lanka’s volume of imports rises
by 3.3 percent while its volume of exports falls slightly by 0.3 percent reflecting the fact that the
pressure to increase imports is stronger than the increase in demand for Sri Lanka’s exports by
unilateral liberalization. However, as a result of the composite export price increase by 1.1
percent, Sri Lanka experiences a small improvement in the terms-of-trade of 1.5 percent and the
real GDP by 0.8 percent. The welfare gains or losses for other regions are quite varied under this
simulation. However, since Sri Lanka is a small country, the impact of Sri Lanka’s unilateral
reduction of import tariffs to 15 percent will not affect other region’s real GDP or terms-of-trade
significantly.
As shown in Table 9, the 15 percent uniform tariff will adversely affect most of the sectoral
output in Sri Lanka because of the increased competition for import competing industries. As
shown in panel (a) of Table 9, the most affected industry is the transport equipment (TREQ)
sector (18 percent), followed by machinery and equipment (MAEQ) sector (16 percent). It is
noteworthy that these sectors expand significantly under the regional liberalization scenarios,
particularly under the SAFTA scenario. The textiles (TEXT) sector (8 percent), processed food
(PROF) sector (8 percent), mining and quarrying (MINQ) sector (8 percent), other manufactures
(OTHM) sector (5 percent), and agriculture (AGRI) sector (1 percent) also report a decrease in
output. However, there is a considerable increase in the wearing apparel (WEAP) sector (21
percent) and marginal increases in both the petroleum and coal products (PECP) sectors (2
percent), and the services (SERC) sector (1 percent).
Similarly, as can be seen from panel (b) of Table 9, export sales also decline considerably in
almost all the sectors except petroleum products (25 percent) and wearing apparel (21 percent).
The largest decline in export sales occurs in machinery and equipment (22 percent) followed by
transport equipment (19 percent), processed food (16 percent) and services (15 percent). As
shown in panel (c) of Table 9, Sri Lanka’s sectoral imports expand mainly in processed food (26

21
percent), wearing apparel (20 percent), and textiles (19 percent) while imports contract mainly in
agriculture (9 percent), services (7 percent) and petroleum products (5 percent) under this policy
reform.
Accordingly, the results suggest that a reduction of import tariffs to 15 percent will increase Sri
Lanka’s welfare and terms-of-trade as well. Although one might expect that the reduction of
import tariffs would increase the domestic output and therefore increase export sales, this policy
reform would adversely affect Sri Lanka’s domestic output in most of the sectors because of
foreign competition. A similar impact can be seen in export sales too.
Experiment-2: South Asian Free Trade Agreement-SAFTA
As shown in Table-10, the welfare effects of the SAFTA scenario will be quite varied across the
members, although removing barriers to trade will significantly expand the volume of trade
within the region. The welfare gains from regional trade liberalization are the sum of trade
creation benefits (generated new trade within the area from free trade); minus the trade diversion
losses (caused by replacing more efficient nonmember suppliers with less efficient preferred
member countries); plus the terms-of-trade gains associated with increased market access. It
appears from Table -10, that the SAFTA will generate significant benefits for both Sri Lanka and
India, but a loss for the countries in the RAS. Sri Lanka’s welfare gain from the SAFTA is around
US$254 million (1.92 percent of the GDP) reflecting the fact that consumers will enjoy a shift of
consumption from domestically produced goods to cheaper imports, and producers from cheaper
imported inputs as well. Sri Lanka’s composite export price increases by 5 percent, and in turn
this leads to the terms of trade improvement by 4 percent. However, there is only a small increase
in Sri Lanka’s volume of exports (0.9 percent), but the volume of imports will increase
considerably by 7.5 percent, and this will lead to only a marginal improvement of the real GDP
by 0.1 percent.

22
In this experiment, India stands to gain most from the improved market access that SAFTA
promises to deliver. As shown in Table 10, the welfare gain for India is around US$ 4445 million
(1.35 percent of the GDP). This will be accompanied by an improvement of the terms-of-trade by
3.6 percent. Thus, the impact of the SAFTA on India’s welfare is larger given its smaller share of
imports from the members of the SAFTA (Schiff, 1996). In contrast, the SAFTA will have an
adverse impact on the RAS, as representatives of the other SAARC member countries because of
trade diversion. The estimated welfare loss for the RAS is around US$1575 million (1.72 percent
of the GDP). This situation is further aggravated by the deterioration in the terms-of-trade by 3.9
percent. Thus, the trade-diverting effects of the formation of a FTA are likely to outweigh trade
creating effects for these countries, so, there may be efficiency loss which may lead to reduced
welfare.
Although the simulation results capture only a comparative static analysis of trade liberalization,
it may suggest that this type of FTAs would promote welfare in some regions, but this could be at
the expense of other regions. For example, as shown in Table 10, Japan, the largest single
importing country of Sri Lanka’s goods would no doubt lose from the SAFTA by around US$799
million because of the loss of not only Sri Lanka’s market for her exports, but also the South
Asian market as well.
Table 11 presents the percentage changes in sectoral output, and trade by region under the
SAFTA liberalization. The percentage changes in industry output in Sri Lanka, as shown in panel
(a) of Table 11, the performance of the transport equipment sector is remarkable, reporting about
85 percent increase, due mainly to the advantages by the cheaper imported intermediate inputs
from the SAARC region. The industry output of other manufacture (5 percent), manufacturing
equipment (4 percent), and agriculture (2 percent) also increase but to a lesser extent. However,
Sri Lanka’s industry output in wearing apparels (11 percent), mining and quarrying (9 percent),

23
textiles (93 percent) and processed food (2 percent) decline as the domestic market is opened up
to more efficient overseas producers.
The removal of import tariffs under the SAFTA will adversely affect India’s domestic output of
apparels (12 percent), mining and quarrying (2 percent), processed food (2 percent) and
agriculture (0.4 percent). Only the transport equipment sector increases by 16 percent under this
policy reform which is an indication of the availability of cheaper imports that are used by the
sector itself as intermediate inputs following trade liberalization. In contrast, the RAS reports the
increase of industry output in wearing apparel (16 percent), machinery and equipment (6 percent),
petroleum product (4 percent), textiles (4 percent) and processed food (2 percent). It also
experiences a significant decrease in industry output in transport equipment by 50 percent
followed by a small reduction in mining and quarrying (3 percent) and agriculture (0.4 percent)
due to increased competition.
As can be seen from panel (b) of Table 11, there is a substantial increase in transport equipment
exports by Sri Lanka of around 801 percent, indicating that Sri Lanka will benefit immensely, by
exporting these items under the SAFTA, although these items are not currently important in its
export basket. The export sales of agriculture (33 percent) other manufactures (16 percent),
textiles (13 percent), processed food (9 percent) and manufacturing equipment (8 percent) also
increase their sales as a result of induced competition, while the services sector (17 percent),
wearing apparel (12 percent) and mining and quarrying (11 percent) decline under this trade
liberalization.
In contrast, there is a substantial increase in India’s export sales in transport equipment (228
percent) followed by machinery and equipment (44 percent). The other manufactures (9 percent)
and textiles (9 percent) also increase considerably while all the other sectors report decreases in
export sales. The sectors that report the highest decreases are wearing apparel (27 percent),
services (15 percent) and processed food (15 percent). However, the RAS reports a substantial
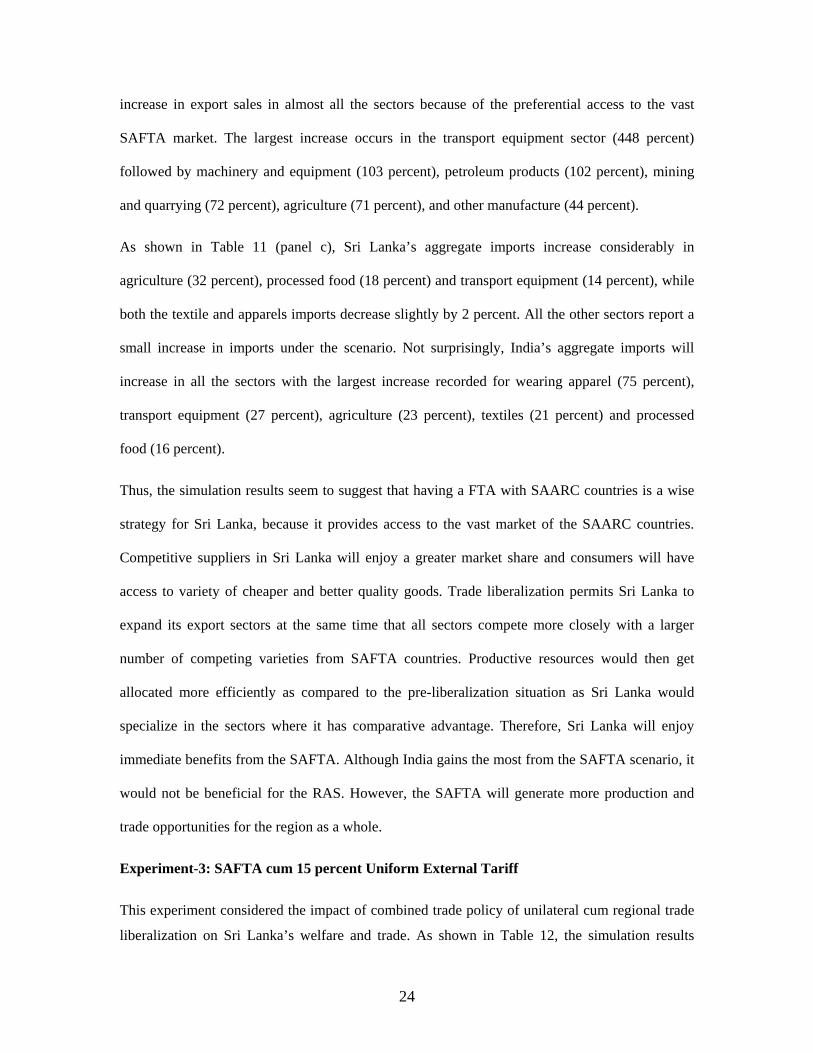
24
increase in export sales in almost all the sectors because of the preferential access to the vast
SAFTA market. The largest increase occurs in the transport equipment sector (448 percent)
followed by machinery and equipment (103 percent), petroleum products (102 percent), mining
and quarrying (72 percent), agriculture (71 percent), and other manufacture (44 percent).
As shown in Table 11 (panel c), Sri Lanka’s aggregate imports increase considerably in
agriculture (32 percent), processed food (18 percent) and transport equipment (14 percent), while
both the textile and apparels imports decrease slightly by 2 percent. All the other sectors report a
small increase in imports under the scenario. Not surprisingly, India’s aggregate imports will
increase in all the sectors with the largest increase recorded for wearing apparel (75 percent),
transport equipment (27 percent), agriculture (23 percent), textiles (21 percent) and processed
food (16 percent).
Thus, the simulation results seem to suggest that having a FTA with SAARC countries is a wise
strategy for Sri Lanka, because it provides access to the vast market of the SAARC countries.
Competitive suppliers in Sri Lanka will enjoy a greater market share and consumers will have
access to variety of cheaper and better quality goods. Trade liberalization permits Sri Lanka to
expand its export sectors at the same time that all sectors compete more closely with a larger
number of competing varieties from SAFTA countries. Productive resources would then get
allocated more efficiently as compared to the pre-liberalization situation as Sri Lanka would
specialize in the sectors where it has comparative advantage. Therefore, Sri Lanka will enjoy
immediate benefits from the SAFTA. Although India gains the most from the SAFTA scenario, it
would not be beneficial for the RAS. However, the SAFTA will generate more production and
trade opportunities for the region as a whole.
Experiment-3: SAFTA cum 15 percent Uniform External Tariff
This experiment considered the impact of combined trade policy of unilateral cum regional trade
liberalization on Sri Lanka’s welfare and trade. As shown in Table 12, the simulation results

25
indicate a considerable increase in welfare for Sri Lanka, around US$442 million (3.35 percent of
the GDP) under this scenario, reflecting that both consumers and producers are able to benefit
from the removal of trade barriers. Indeed, this simulation represents the highest welfare gain for
Sri Lanka among the three trade liberalization experiments presented. Apparently, there are two
trade-creation effects from this scenario. First, trade creation that results from Sri Lanka’s own
trade liberalization, and second, that which results from the regional liberalization under the
SAFTA. Sri Lanka also experiences the highest terms-of-trade improvement of 5.2 percent under
this policy reform, as the economy would be expected to gain from the increased composite
exports price of 5.4 percent, relative to a small increase in the price of imports of 0.3 percent As
might be expected, Sri Lanka’s volume of imports increases significantly by 9.0 percent, but the
volume of exports decreases slightly by 0.3 percent. As a result, there is only a marginal
improvement in the real GDP by 0.98 percent.
Not surprisingly, India, as Sri Lanka’s major import source, would also gain considerably under
this policy reform by around US$4398 million (1.34 percent of the GDP). The reported terms-of-
trade improvement for India is 3.6 percent. However, this policy reform also leads to a
considerable welfare loss for the RAS of approximately US$1592 million (1.74 percent of the
GDP). The RAS also experiences a deterioration of the terms-of-trade by 3.9 percent.
Table 13 highlights the estimated percentage changes in regional output and distribution of sales
under this policy reform. Accordingly, Sri Lanka’s domestic output in the transport equipment
sector rises considerably, by 53 percent and 625 percent respectively, as a result of the easy
access to cheaper raw materials from the world, and preferential access to the SAFTA market.
Both agriculture and petroleum product exports also rise considerably, by 23 percent. However,
there is a notable decrease in domestic output and export sales in mining and quarrying (16
percent and 18 percent respectively) machinery and equipment (12 percent and 13 percent
respectively), and processed food (9 percent and 6 percent respectively). Sri Lanka’s domestic
output in textiles decreases by 11 percent while the exports of textiles increase by 6 percent. The
export sales in services also decrease by 27 percent.
26
As shown in panel (c) of Table 13. Sri Lanka’s aggregate imports increase in almost all sectors
under trade liberalization, with the exception in petroleum products (4 percent) and services (3
percent). The largest increase occurs in the processed food sector (41 percent), followed by
agriculture (20 percent), transport equipment (13 percent), textiles (12 percent), machinery and
equipment (7 percent) and wearing apparel (7 percent).
Thus, the results suggest that if Sri Lanka implements the SAFTA with SAARC countries, while
having a 15 percent uniform external tariff for the rest of the world that will improve Sri Lanka’s
welfare and the terms-of-trade more than any other trade policy reform that we considered. Thus,
Sri Lanka gains from both unilateral and regional trade liberalization simultaneously under this
scenario. Although this policy reform provides incentives to some domestic industries to increase
their output and export sales, there are some industries that will reduce production and export
sales because of the increased competition.
The GTAP model assumes constant returns to scale and perfect competition in all sectors.
Instead, if we allow for increasing returns to scale and imperfect competition in some sectors of
our model, we can raise significantly the estimated welfare gains of trade liberalization. As far as
liberalization stimulates investment and technology provided by the enlargement of the market,
the welfare effects reported in this study are underestimates of potential gains. Moreover, we have
not incorporated the effects of non tariff barriers (NTBs) in our trade liberalization simulations;
instead we assumed that all other distortions remain constant except tariffs. Therefore, the
omission of NTBs surely leads to an underassessment of the impacts of trade reforms on
efficiency and trade.
Experiments 4, 5 & 6: Sensitivity of the Results
As described previously, to quantify the impact of trade policy reforms on Sri Lanka, three
additional experiments were undertaken with an increased elasticity value for the import-import
substitution parameter ( Armington parameter)-ESUBM, to consider Sri Lanka as a small country
27
Accordingly, under these three experiments, first, the size of the ESUBM increased by 50
percent, and then doubled the value (100 percent increase) to reduce Sri Lanka’s market power in
the world market. This would provide an opportunity to examine the sensitivity or robustness of
the model predictions with respect to the change in the underlying parameters.
Table 15 presents the results of these three experiments with the central elasticity value scenarios.
Thus, under the 15 percent uniform external tariff scenario (E-4), if we reduce Sri Lanka’s market
power by increasing the value of ESUBM by 50 percent (E-4.1), it would increase welfare gain
around US$247 million (1.87 percent of the GDP). Similarly, doubling the value (100%) of
ESUBM (E-4.2) would increase Sri Lanka’s welfare by around US$296 million (or 2.24 percent
of the GDP). In the former case, the increase in welfare from the central value is 22 percent, and
in the latter case, it is approximately 47 percent. Although these changes are relatively small, it
would suggest that even as a small country, Sri Lanka would be in a position to gain from the
unilateral trade liberalization. The welfare increases for the country as the elasticities increase.
However, under these two scenarios, we see a slight decline in Sri Lanka’s terms-of-trade as
elasticities increases. Moreover, under these scenarios, the impact on terms-of-trade is not much
different from the central scenario case
Similarly, experiment 5 (E-5) deals with the SAFTA scenario. As shown in Table 15, with the
increase of the value of ESUBM, both the welfare and the terms-of-trade will increase linearly
from the central scenario case. Thus, the welfare gain for Sri Lanka under the 50 percent increase
in ESUBM (E-5.1) is approximately US$340 million (2.58 percent of the GDP), whereas under
the 100 percent increase scenario (E-5.2), it is around US$422 million (3.19 percent of the GDP).
Thus in the former case, Sri Lanka’s welfare will increase by 42 percent from its central value
scenario, and in the latter case it will increase by 76 percent. Thus, welfare increases as
elasticities increase. Thus, the gains are rather linear with both the cases reflecting the robustness
of the model results.
Experiment 6 (E-6)considered the combined policy of SAFTA cum 15% uniform import tariffs
scenario Thus, 50% increase of the value of ESUBM (E-6.1), would increase welfare gain around
US$592 million (from US$443 million at the central scenario) or 4.4 percent of the GDP. Here,
the increase in welfare from the central value is 33 percent. Similarly, doubling the value of
ESUBM (E-6.2) would increase Sri Lanka’s welfare by around US$743 million or 5.6 percent of
the GDP. In this case, the increase in welfare from the central value is 67 percent. Moreover,
under these two scenarios, the increase in terms-of-trade is 5.9 and 8.8 respectively. Thus the
improvements in the terms of trade from the central value are 1.7 and 3.6 percent respectively.

28
Although these welfare and terms-of-trade gains are not almost linearly related to the changes in
the Armington elasticity ESUBM, the result would suggest that unilateral trade liberalization in
combination with regional trade liberalization permits Sri Lanka to expand its export sectors at
the same time that all sectors compete more closely with a larger number of competing varieties
from abroad.
Table 16 highlights Sri Lanka’s sectoral output, exports and imports under the sensitivity analysis
scenarios. Accordingly, Sri Lanka’s industry output falls significantly in all most all the sectors
except for significant increases in transport equipments and wearing apparels. Sri Lanka’s export
sales also decrease considerably under all the experiments as shown in panel (b) of Table 16,
except the transport equipments petroleum products and apparel sectors under E-4, transport
equipments, machinery and equipment, other manufacture and textiles sectors under E-5 and
transport equipments, petroleum products, other manufacture and textiles sectors under E-6. Sri
Lanka’s aggregate imports(panel(c) in Table 16)) increase considerably in all sectors except
agriculture, services, petroleum products, mining and quarrying under E-4, wearing apparels, and
textiles under E-5, and petroleum products and services under E-6.
Non Economic Benefits
Besides the welfare and terms of trade gains suggested by the simulations, regional trade
liberalization under SAFTA may have many non-economic benefits to a small country like Sri
Lanka, particularly social and political benefits; those are difficult to account for in a quantitative
way. For example, SAFTA can help its members to speak with one voice in global negotiations
and develop a common understanding on several global trade-related issues.
It could also reduce the political disputes among members and make the region a more attractive
location for foreign direct investments. This is critical for a developing country like Sri Lanka as
it is typically unable to fully finance its growth in investment with domestic savings. Since
absorptive capacity in Sri Lanka is crucial for obtaining significant benefits from FDI,
liberalization of trade and FDI policies needs to be complemented by appropriate policy measures
with respect to education, R&D, and human capital accumulation if Sri Lanka is to take full
advantage of increased trade and foreign investment.
29
Since the proximity, history and cultural familiarity associated with trade are important
determinants of foreign trade, the expansion of the neighbouring market following trade
liberalization could be more important for Sri Lanka to exploit economies of scale and able to
avoid transport and other costs of trade to more distant markets.
It is widely believed that the outcome of an RTA depends mainly on the membership, the policies
intended to pursue and the effectiveness of the proposed institutional mechanism. Therefore,
member countries of SAFTA should set their own agenda and priorities as a bloc, in order to face
the impact of future trade issues under the global framework without jeopardizing their growth
prospects and interests. Moreover, political willingness and commitments are equally important
for the success of any trade agreement. Lastly, to be consistent with the multilateral process
RTAs should be outward looking and that they are more likely to facilitate liberal multilateral
trade. The outward orientation of any RTA is judged on the basis of its consistency with Article
XXIV of the GATT.
As results suggest, the increase in volume of imports under all the trade liberalization scenarios
will have an adverse impact on the competitiveness of some domestic industries, and hence
export sales. Since Sri Lanka’s industries are still developing, policy makers should ensure that
domestic production is not severely affected from foreign competition, and that exports remain
competitive on the world market. Therefore, governments should adopt selective trade policy
instruments to protect domestic industries and expand production, while yielding the benefits of
trade liberalization in the presence of economies of scale. A policy maker might want to consider
the other socio-economic objectives of trade policy such as the development of labour intensive
and high value added industries. The reduction of the overall dependence on imported inputs
cannot be over-emphasized.
As with any other policy, trade policy must necessarily be pro-people to reduce inequalities and
enhance economic development. The challenge for policy makers in Sri Lanka is thus to design

30
trade policy to improve the welfare of citizens and take advantage of new opportunities that
would be created by trade liberalization, while protecting most vulnerable groups in the economy
from possible adjustment costs and insecurities. Thus, the provision of a basic safety net would be
needed to ensure that individuals and families do not fall below minimum standard of living
which is an important ingredient in ensuring equity and political acceptability of the trade
reforms.
Section V: Conclusions.
The simulation results presented and analyzed here demonstrate the importance of experimental
designs, and the usefulness of the global CGE modeling framework for examining the impacts of
the different types of trade policy reforms for Sri Lanka. Although, the GTAP model cannot
capture the dynamic effects of trade liberalization, it is a useful tool for generating comparative
static results for a variety of trade reform scenarios. It also identifies the industries that will
expand, and those that will contract, and the size of these changes as a result of various trade
liberalization scenarios. The results suggest that Sri Lanka would experience the highest welfare
gain under the combined policy reform of the SAFTA cum 15 percent uniform external tariffs
while the SAFTA on its own gives the second highest welfare gains. SAFTA allows the
participating countries to achieve larger economies of scale in production, attain specialization,
increase competitiveness and diversify their export basket, thus assisting domestic economic
reform. Therefore, harmonizing economic policies among neighbouring countries must receive
higher priority in the policy making process.
Although, simulation results are highly sensitive to the underlying data and assumptions
regarding the reference scenarios, the results clearly provide an assessment of the implications of

31
various trade policy scenarios for Sri Lanka from several different perspectives. However, the
precise impacts of these trade liberalization options ultimately depend on individual country
circumstances and their own development strategies.